Embed Size (px)
Citation preview

Chapter 7Socio-Economic ConditionsFor MDOT to develop the Travel Demand Forecast Model (the model) for the Jackson MPO roadway network, an analysis of the 2014 and 2045 projected land use and socio- economic conditions in the area was used to estimate future traffic volumes and travel behavior. The estimates were presented in the form of projections that describe the extent and location of growth likely to occur within Jackson County. The projections also help to predict potential travel problems which are important when considering priorities for transportation facility improvements.
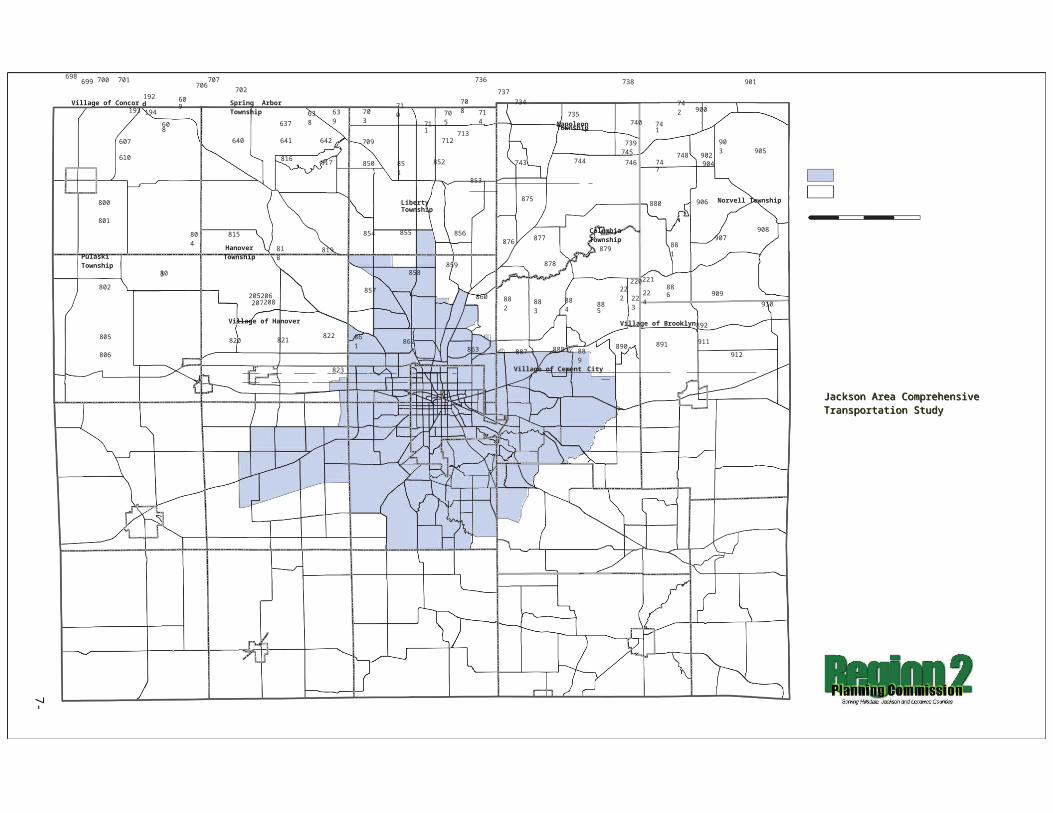
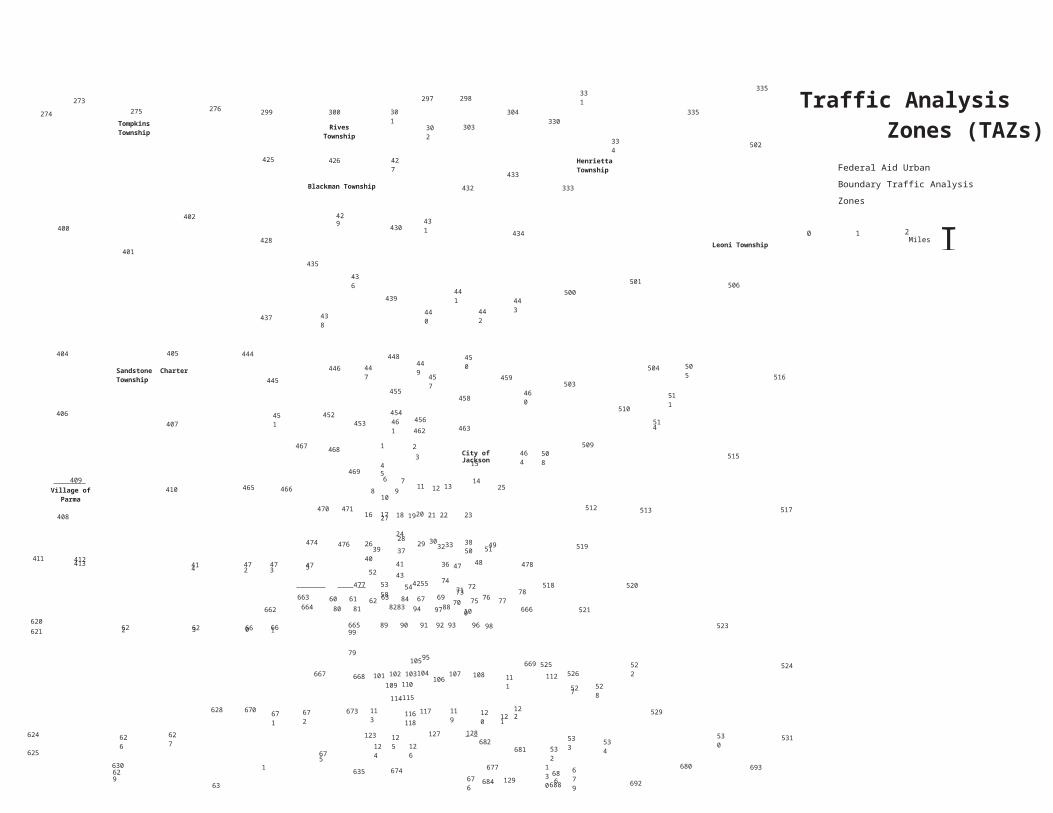
Data on population, number of occupied housing units, and retail/non-retail employment have been projected to the year 2045 and distributed to the 534 Traffic Analysis Zones (TAZs) that comprise the model area. TAZs are groups of the area generally based on the localized road network, and act as a simplification of origin and destination points within the community. TAZs are different in each community, and change in size over time. TAZs are established to obtain a meaningful representation of traffic behavior.
Maps of the TAZ’s for Jackson are on the following pages.
Land use is a major influence on travel patterns. Estimating future travel patterns was done by projecting future population, the number of occupied housing units, and retail/non-retail employment totals for each TAZ. Growth assumptions were based on the TAZ’s potential for increased development, availability of vacant land, current zoning regulations, and recent developments in the area that would encourage additional growth. Socio-economic information, including future year growth factors by TAZ, was provided to each governmental jurisdiction for comment and review.
The population, occupied housing units, and retail/non-retail employment projections were developed by MDOT and the Region 2 Planning Commission staff up to the year 2045. Information from the 2010 Census and the 2014 American Community Survey (ACS) 5-Year Estimate to develop the Regional Econometric Models, Incorporated, or REMI model. Memorandums, spreadsheets, and area-specific TAZ maps of the socio- economic data by analysis year, were provided to members of the JACTS Technical and Policy committees, local planners, city and county officials, township supervisors, and the Enterprise Group for their input in reviewing local trends. The socio-economic projections were applied to each TAZ, reviewed and approved by the JACTS Technical and Policy committees, and included into the model to develop the future year travel patterns.
7-1
17 51
d
250 251
252
253
266 267
Tompkins Township
269
268
270 289
285
290
286
291
287
292
288
Rives Township
293
320
324
325
321
326
322
327
323
328
Traffic Analysis Zones (TAZs)
150 151
152 15V3illage of Springport
255
265
271
276
272294
296297
329
Henrietta Township
332
335
Federal Aid Urban Boundary
Traffic Analysis Zones
Miles
254
375 376
256
Springport Township
273
274
275 299
425
295
300
426
301302
427
298
303
304
433
330
331
334 502
0 2.25 4.5
377 Sandstone Charter Township Blackman Township 432 333402
400401
428435
429
436
430 431
439 441
434
500 501Leoni Township
506507
378 Parma Township
379 380403
404 405
437
444
438
446 447 448
440
449
442 443
450 504 505 516
Village of Parm 406407
445
451454
452 453455461
457458
456462 463
459460 503
509 510511
514a 467 1 2 3 4 464508
381 385 Village4o0f9Parma
468469 5 6 711 1C1it4y
o1f5Jackson515
166Village of Parma 408 410 465 466 470 471 8 93 25
512 513 517 Village of Grass Lake382 383 384 167168
411 412 413 414474
472 473 475
18 21 23 24476 412930 37 4950
478 51947752 7374 518 520175176
178563 564
662 89909193 4775 7778666 177
600 620621 622 623 660 661 665 102103 9899100 79 669525
521523 562
667 668101 106107108 110 111 112 526 522 524 Grass Lake Charter Township601 602 628 670 671 672 673 117 119 120 122 527 528 529 566
624 625626 627
675125
124 126 118128 121681 682 533 534532530 531 565
567
603 635 674 676 129 678 679 680 536 538 539 540 541
Concord Township 606 629630
631677 130685 687 688 692
693694537 732 543 568
605634 636 683
689 691 695730 731
696 733 542 569570
604 191190 632
633 697Summit Township
704
698 699 700 701
706707
702736 737
738 901Village of Concor
192
193 194608
609 Spring Arbor Township637 638 639 703
710
711705
708
713714
734735
Napoleon Township 740 741
742900
607 610 640 641
816
642
817
709
850 851
712
852 743 744
739745
746 747748 902
904
903905
800 801 Liberty Township
853
875 880 906 Norvell Township
Pulaski Township
803
804 815
Hanover Township 818 819
854 855
858
856
859
876 877
878
Columbia Township879
220221
881907
908
802205206207208
857860 882 883 884 885
222223224
886909
910Village of Hanover Village of Brooklyn892
805 806 820 821 822 861862
863 887 888 889890 891 911
912 8 23
Village of Cement City
Jackson Area Comprehensive Jackson Area Comprehensive Transportation StudyTransportation Study
I
123
684
7-2
351
354355
357
360
Waterloo Township
362
352
350
353
356
358 359
363
361
555 556 557
559 561
558560

7-3
273
274 275Tompkins Township
276 299 300
Rives Township
301
297
302
298
303
304330
331
334
335
335
502
Traffic Analysis Zones (TAZs)
425 426
Blackman Township
427
432433
333
Henrietta TownshipFederal Aid Urban Boundary
Traffic Analysis Zones402
400
401428
437
435
438
429
436
430
439
431
440441
442
434
443500
501
0 1Leoni Township
506
2Miles
404
406
405
Sandstone Charter Township
407
444
445
451
446
452
447
453
448
455
454461
449
456462
457
450
458
463
459
460503
510
504
514
511
505516
467 468 1 2 3 4
469 5
City of Jackson15 464 508509
515
409 Village of Parma 410 465 466
6
8 9 107
11 12 13 14
25
470 471408 16 1727 18 1920 21 22 23 24
512 513 517
474 476 2639 40
28 29 30
3233 37 38 49 50 51 519411 412 413
414 472 473 47552
41 43 36 47 4874 478
477 53 544255 58 71 72 73 518 520663 60 61 62 63 84 67 69 70 75 76 77
78
662 664 80 81 8283 94 9788 100 666 521620 621 622 623 660 661 665 89 90 91 92 93 96 98 99 79 523
10595
667 668 101 102 103104 106
107 108 109 110
114115111
669 525112 526
527 528
522 524
628 670 671 672 673 113 116 117 118 119 120 121122 529
624 625 626 627
675
123124
125126
127 128 682681
532533 534
530 531
630629
631
635 674676
677
684
129 678130
686 688
679
692
680
693
535
694
536
537538
539 540541
634636
Summit Township
683
685 687
689690
691 695 696
732
730731
54733
Napoleon Township
633
632 Spring Arbor Township
637 638 639 703710
697
704
711
698
705
699
706
700
707
708
713
701
714
702
734
735
736
"1
640 641 642 709 712 743
9Jackson Area Comprehensive Jackson Area Comprehensive Transportation StudyTransportation Study
815 816 817 850 851 852 853 5
I
0
2
737
7424
73
744 74
7
PopulationThe population projections for the plan were based on previous trends as depicted by the 2010 Census, 2014 ACS figures, and on the REMI forecast data. The population projections were developed for all jurisdictions within the County and then broken down to the TAZ level.
Table 7-1 2014 & 2045 Population Estimates By Local Unit of Government
Local Government 2014 2045 % ChangeBlackman Township 23,646 24,647 4.2%
Columbia Township a 7,410 7,877 6.3%Concord Township a 2,568 2,656 3.4%
Grass Lake Township a 5,650 6,255 10.7%Hanover Township a 3,796 4,007 5.6%Henrietta Township 4,705 5,066 7.7%
City of Jackson 33,316 30,509 -8.4%Leoni Township 13,808 14,225 3.0%
Liberty Township 2,961 3,209 8.4%Napoleon Township 6,776 7,094 4.7%
Norvell Township 2,963 3,019 1.9%Parma Township b 3,271 3,522 7.7%Pulaski Township 2,075 2,143 3.3%
Rives Township 4,683 4,803 2.6%Sandstone Township 3,437 3,664 6.6%
Spring Arbor Township 8,267 8,665 4.8%Springport Township a 2,179 2,134 -2.1%
Summit Township 22,859 24,402 8.2%Tompkins Township 2,671 2,800 4.8%Waterloo Township 2,856 2,953 3.4%
Jackson County 159,917 163,650 2.3%a Township population includes village residentsb Parma Village residents included in the Parma Township Total
The 5-year 2014 ACS data for Jackson County indicated a population of 159,917, a small decrease of 0.2% from the 2010 Census population total of 160,248. However, this is an increase from the 2000 Census population of 158,422. The estimates provided by MDOT and REMI for the plan base year of 2014 agreed with the ACS population estimates for 2014. By the year 2045, the County’s population is projected to be 163,650, an increase of 2.3%.
7
Occupied Housing UnitsOccupied housing unit projections and population projections are used to identify the TAZs where future increases or decreases in the population may potentially occur. Population increases in an area translate into relative increases in housing units. The ratio is defined as the total number of persons residing in occupied housing units within a TAZ divided by the total number of occupied housing units within the TAZ.
Table 7-2 2014 & 2045 Occupied Housing Units By Local Unit of Government
Local Government 2014 2045 % ChangeBlackman Township 7,950 8,788 10.5%
Columbia Township a 2,959 3,343 13.0%Concord Township a 957 1,021 6.7%
Grass Lake Township a 2,180 2,570 17.9%Hanover Township a 1,423 1,548 8.8%Henrietta Township 1,801 2,041 13.3%
City of Jackson 12,833 13,020 1.5%Leoni Township 5,681 6,065 6.8%
Liberty Township 1,159 1,343 15.9%Napoleon Township 2,715 2,897 6.7%
Norvell Township 1,230 1,313 6.8%Parma Township b 1,203 1,310 8.9%Pulaski Township 762 805 5.6%
Rives Township 1,666 1,777 6.7%Sandstone Township 1,259 1,390 10.4%
Spring Arbor Township 2,646 2,891 9.3%Springport Township a 847 887 4.7%
Summit Township 9,069 9,714 7.1%Tompkins Township 1,074 1,257 17.1%Waterloo Township 1,130 1,190 5.3%
Jackson County 60,544 65,170 7.6%a Township population includes village residentsb Parma Village residents included in the Parma Township Total
The U.S. average household size has been steadily declining since 1970 when the persons per household was 3.14, falling to 2.76 in 1980, 2.63 persons in 1990, 2.59 in 2000, and 2.54 in 2014. The rate of decline is expected to continue over the next 30 years, but at a slower rate. In Jackson County, the average household size has reflected the national decline falling from 3.23 in 1970 to 2.62 in 1990, and continuing to decline to 2.55 persons per household in 2000, 2.48 persons per household in 2010, and 2.31 in 2014. The average household size in Jackson County is projected to see a slight increase to approximately 2.39 persons per household by the year 2045. Michigan is expected to see an increase in employment over the next 20 years, returning to pre- 2008 recession employment levels, which will encourage more people to remain or

7
move to Michigan. Jackson County is expected to see an increase in population as a result of the positive economic changes, creating a demand for housing.
The 2014 ACS 5-Year data estimates that there were 60,485 occupied housing units within the study area, which is slightly below the 2010 number of 60,771 occupied housing units. By the year 2045, there will be an estimated 65,170 occupied housing units, which is an increase of 7.8%. The projected growth in occupied housing units was allocated to the TAZs by examining local land use plans and discussions with city, village, and township officials regarding current residential development trends. The trends indicate moderate growth in the urban and outlying townships.
EmploymentBased on proprietary employer-survey vendor data, and Michigan Employment Security Commission data, 2014 employment for Jackson County was approximately 68,996 people, with a breakdown of 58,622 in non-retail (manufacturing, service, government- related) and 10,374 in retail jobs.
Table 7-3 2014 & 2045 Employment Estimates By Local Unit of Government
Local Government Retail Retail %Non-
RetailNon-
Retail % Total Total %2014 2045 Change 2014 2045 Change 2014 2045 Change
Blackman Township 4,401 3,641 -17.3 12,267 12,281 0.1 16,668 15,922 -4.5Columbia Township a 444 481 8.3 1,877 2,005 6.8 2,321 2,486 7.1Concord Township a 52 45 -13.5 693 674 -2.7 745 719 -3.5
Grass Lake Township a 137 125 -8.8 1,533 1,554 1.4 1,670 1,679 0.5Hanover Township a 31 26 -16.1 511 528 3.3 542 554 2.2Henrietta Township 70 61 -12.9 404 403 -0.2 474 464 -2.1
City of Jackson 3,419 3,255 -4.8 24,210 28,332 17.0 27,629 31,587 14.3Leoni Township 685 752 9.8 3,743 4,320 15.4 4,428 5,072 14.5
Liberty Township 43 44 2.3 231 279 20.8 274 323 17.9Napoleon Township 71 67 -5.6 1,362 1,493 9.6 1,433 1,560 8.9
Norvell Township 5 4 -20 134 134 0 139 138 -0.7Parma Township b 30 30 0 417 434 4.1 447 464 3.8Pulaski Township 5 5 0 78 69 -11.6 83 74 -10.8
Rives Township 24 23 -4.2 343 364 6.1 367 387 5.5Sandstone Township 14 14 0 1,606 1,600 -0.4 1,620 1,614 -0.4
Spring Arbor Township 143 125 -12.6 1,743 1,866 7.1 1,886 1,991 5.6Springport Township a 22 18 -18.2 316 289 -8.5 338 307 -9.2
Summit Township 703 642 -8.7 6,764 7,344 8.6 7,467 7,986 7.0Tompkins Township 14 12 -14.3 76 72 -5.3 90 84 -6.7Waterloo Township 61 56 -8.2 314 334 6.4 375 390 4.0
Jackson County 10,374 9,426 -9.1 58,622 64,375 9.8 68,996 73,801 7.0a Township population includes village residentsb Parma Village residents included in the Parma Township

7
In the year 2045, the total labor force for the study area is projected to increase by 7.0% to a total of 73,801 workers with 64,375 workers in non-retail and 9,426 in retail jobs. Retail jobs are expected to decrease over the next 30 years by 9.1%, or 948 jobs. Other non-retail employment sectors are expected to see an increase of 9.8%, or 5,753 additional jobs. The study area employment by type was applied to the 534 TAZs based on assumptions of growth, stabilization, and decline of employment for certain time periods and based on current trends for each employment sector.
Socio-economic forecasting is the mixing of objective and subjective data. Judgment is required in selecting the type of forecast to be implemented, determining the procedures for making the forecast, and developing a process for reviewing population and employment factors. The influx or loss of a new employer or industry can have a considerable impact on an area's development.
Although socio-economic projections can be a helpful tool in planning for future growth and development, projections can be modified as time progresses to reflect actual development impacts. The projections used in the development of the Jackson 2045 LRTP will be re-evaluated periodically to address changes in the population.
Table 7-4 2014 & 2045 Jackson County Totals
Population Occupied EmploymentYear Total In Households Housing Units Retail Non-Retail Total2014 159,917 152,193 60,544 10,374 58,622 68,9962045 163,650 155,703 65,170 9,426 64,375 73,801


![Brezineves srpen 212 web[948]](https://img.pdfslide.net/doc/110x75/57906e5d1a28ab68749409c8/brezineves-srpen-212-web948.jpg)

