Embed Size (px)
Citation preview
MicroStrategy 2003 Annual Report
MicroStrategy: Best in Business Intelligence
Letter to StockholdersDear MicroStrategy Stockholder:
As MicroStrategy began 2003, our financial turnaround was substantially complete, as we had achievedprofitability for each of the four quarters in 2002. 2003 marked a year in which we grew our revenues, improvedoperating earnings, further strengthened our balance sheet, continued to deliver new products, and added manynew customers. Our focus on remaining a “pure play” Business Intelligence (BI) platform provider helped usimprove operational execution and kept our costs under control.
In 2003, our total revenue grew by approximately 19%. Most of the growth was attributable to license andmaintenance revenue growing approximately 23% and 25%, respectively. Our focus on our maintenance businessallowed us to maintain high renewal rates and increase our maintenance revenues from both existing and newcustomers. For the first time, we issued an annual increase in our maintenance rates, and instituted a standardpolicy of pricing new maintenance contracts off of license list price rather than net price. The services programswe launched in 2002 helped us increase services margins and utilization. PEP, our perennial education pass, is apre-paid education offering that was very popular among our customers in 2003. Our continued improvements inoperational efficiency combined with cost containment are reflected in the increase in our operating margins.
Building on the release of MicroStrategy 7i™ in 2002, in 2003 we released several new products to help ourcustomers build more applications, deploy to more users, and replace competing BI tools with our technology.MicroStrategy Report Services™ allows pixel-perfect publishing of enterprise data to all workers throughscorecards, managed metrics reports, production reports, invoices, and statements. In addition, MicroStrategyOffice™ extends BI to workers using Microsoft Office®, enabling access to corporate data through Microsoft’subiquitous personal productivity applications. We believe these two products will help expand the market for ourtechnology by making business intelligence more accessible to a wide range of users.
We continued to expand our industrial-strength business intelligence platform with the release of MicroStrategyWeb Universal™, which delivers UNIX and 64-bit versions of our Microstrategy Web product. In addition,MicroStrategy OLAP Services™ and MicroStrategy Web Professional™, products released in 2002 that advancedthe performance and web-based design capabilities of our platform, sold well in 2003.
We made substantial improvements to our balance sheet throughout the year. We started the year with $15million in cash and cash equivalents and ended the year with $52 million. We started 2003 with $49.7 million ofnotes payable, but repaid them or converted them into equity by year-end. Equally importantly, we increasedstockholders’ equity by $78.9 million during the year and posted positive stockholders’ equity of $44.3 million atthe end of 2003.
We were pleased that our technology was validated by some of the most influential analysts in the industry. Inthe largest independent real-world survey of the online analytical processing (OLAP) and BI market, The OLAPSurvey 3 by analyst Nigel Pendse, MicroStrategy technology was rated amongst the best-in-class in the criticalareas of input data volumes, Web deployment rates, extranet deployments, and product support.
Our customer base continued to grow, adding organizations such as eBay, Geico, and Hudson’s Bay. Wecontinue to attract large customers who have enterprise-scale business intelligence needs. Our technology, asreflected in the study mentioned above, is well-designed for large data volumes, large user populations, web/extranet deployments, and large numbers of diverse BI applications. These increasingly important requirementsare driving customers to migrate to MicroStrategy technology from previous generation BI tools.
I would like to again thank all of you for your continued support of MicroStrategy. I look forward to discussingthis past year and the future with each of you in person at our Annual Meeting.
Michael J. SaylorChairman of the Board and Chief Executive Officer
SECURITIES AND EXCHANGE COMMISSIONWashington, D.C. 20549
FORM 10-KÈ ANNUAL REPORT PURSUANT TO SECTION 13 OR 15(D) OF THE
SECURITIES EXCHANGE ACT OF 1934
For the fiscal year ended December 31, 2003
OR
‘ TRANSITION REPORT PURSUANT TO SECTION 13 OR 15(D) OF THESECURITIES AND EXCHANGE ACT OF 1934
For the transition period from to
Commission File Number 000-24435
MICROSTRATEGY INCORPORATED(Exact name of registrant as specified in its charter)
Delaware 1861 International Drive, McLean, VA 22102 51-0323571(State of incorporation) (Address of Principal Executive Offices) (Zip Code) (I.R.S. Employer
Identification Number)
Registrant’s telephone number, including area code:
(703) 848-8600
Securities registered pursuant to Section 12(b) of the Act:
Not applicable
Securities registered pursuant to Section 12(g) of the Act:
Class A common stock, par value $0.001 per share
Warrants to Purchase Class A Common Stock, par value $0.001 per share(Title of class)
Indicate by check mark whether the registrant: (1) has filed all reports required to be filed by Section 13 or15(d) of the Securities Exchange Act of 1934 during the preceding 12 months (or for such shorter period that theregistrant was required to file such reports), and (2) has been subject to such filing requirements for the past 90days. Yes È No ‘
Indicate by check mark if disclosure of delinquent filers pursuant to Item 405 of Regulation S-K is notcontained herein, and will not be contained, to the best of registrant’s knowledge, in definitive proxy orinformation statements incorporated by reference in Part III of this Form 10-K or any amendment to thisForm 10-K. ‘
Indicate by check mark whether the registrant is an accelerated filer (as defined in Rule 12b-2 of the Act).Yes È No ‘
The aggregate market value of the voting stock held by non-affiliates of the registrant (based on the lastreported sale price of the Registrant’s class A common stock on June 30, 2003 on the Nasdaq National Market)was approximately $381.9 million.
The number of shares of the registrant’s class A common stock and class B common stock outstanding onMarch 1, 2004 was 12,431,663 and 3,603,730, respectively.
MICROSTRATEGY INCORPORATED
TABLE OF CONTENTS
Page
PART I
Item 1. Business . . . . . . . . . . . . . . . . . . . . . . . . . . . . . . . . . . . . . . . . . . . . . . . . . . . . . . . . . . . . . . . . . . . . . 1
Item 2. Properties . . . . . . . . . . . . . . . . . . . . . . . . . . . . . . . . . . . . . . . . . . . . . . . . . . . . . . . . . . . . . . . . . . . . 15
Item 3. Legal Proceedings . . . . . . . . . . . . . . . . . . . . . . . . . . . . . . . . . . . . . . . . . . . . . . . . . . . . . . . . . . . . . 15
Item 4. Submission of Matters to a Vote of Security Holders . . . . . . . . . . . . . . . . . . . . . . . . . . . . . . . . . . 16
PART II
Item 5. Market for Registrant’s Common Stock and Related Stockholder Matters . . . . . . . . . . . . . . . . . . 17
Item 6. Selected Financial Data . . . . . . . . . . . . . . . . . . . . . . . . . . . . . . . . . . . . . . . . . . . . . . . . . . . . . . . . . 18
Item 7. Management’s Discussion and Analysis of Financial Condition and Results of Operations . . . . 20
Item 7a. Quantitative and Qualitative Disclosures about Market Risk . . . . . . . . . . . . . . . . . . . . . . . . . . . . 44
Item 8. Financial Statements and Supplementary Data . . . . . . . . . . . . . . . . . . . . . . . . . . . . . . . . . . . . . . . 44
Item 9. Changes in and Disagreements with Accountants on Accounting and Financial Disclosure . . . . 44
Item 9A. Controls and Procedures . . . . . . . . . . . . . . . . . . . . . . . . . . . . . . . . . . . . . . . . . . . . . . . . . . . . . . . . . 45
PART III
Item 10. Directors and Executive Officers of the Registrant . . . . . . . . . . . . . . . . . . . . . . . . . . . . . . . . . . . . 46
Item 11. Executive Compensation . . . . . . . . . . . . . . . . . . . . . . . . . . . . . . . . . . . . . . . . . . . . . . . . . . . . . . . . 49
Item 12. Security Ownership of Certain Beneficial Owners and Management and Related StockholderMatters . . . . . . . . . . . . . . . . . . . . . . . . . . . . . . . . . . . . . . . . . . . . . . . . . . . . . . . . . . . . . . . . . . . . . . 53
Item 13. Certain Relationships and Related Transactions . . . . . . . . . . . . . . . . . . . . . . . . . . . . . . . . . . . . . . 55
Item 14. Principal Accountant Fees and Services . . . . . . . . . . . . . . . . . . . . . . . . . . . . . . . . . . . . . . . . . . . . 55
PART IV
Item 15. Exhibits, Financial Statement Schedules and Reports on Form 8-K . . . . . . . . . . . . . . . . . . . . . . 57
i
CERTAIN DEFINITIONS
All references in this Annual Report on Form 10-K to “MicroStrategy”, “Company”, “we”, “us” and “our”refer to MicroStrategy Incorporated and its consolidated subsidiaries (unless the context otherwise requires).
FORWARD-LOOKING INFORMATION
This Annual Report on Form 10-K contains forward-looking statements within the meaning of Section 21Eof the Securities Exchange Act of 1934, as amended. For this purpose, any statements contained herein that arenot statements of historical fact, including without limitation, certain statements under “Item 1. Business” and“Item 7. Management’s Discussion and Analysis of Financial Condition and Results of Operations” and locatedelsewhere herein regarding industry prospects and our results of operations or financial position, may be deemedto be forward-looking statements. Without limiting the foregoing, the words “believes,” “anticipates,” “plans,”“expects,” and similar expressions are intended to identify forward-looking statements. The important factorsdiscussed below under the caption “Risk Factors,” among others, could cause actual results to differ materiallyfrom those indicated by forward-looking statements made herein and presented elsewhere by management fromtime to time. Such forward-looking statements represent management’s current expectations and are inherentlyuncertain. Investors are warned that actual results may differ from management’s expectations.
ii
PART I
ITEM 1. BUSINESS
Overview
We are a leading worldwide provider of business intelligence software that enables companies to analyzethe raw data stored across their enterprise to reveal the trends and insights needed to develop solutions to managetheir business effectively. Our software delivers this critical information to workgroups, the enterprise andextranet communities via e-mail, web, fax, wireless and voice communication channels. Businesses can use oursoftware platform to develop user-friendly solutions, proactively refine revenue-generating strategies, enhancecost-efficiency and productivity and improve customer relationships.
Our software platform, MicroStrategy 7i, enables users to query and analyze the most detailed, transaction-level databases, turning data into business intelligence and delivering boardroom quality reports and alerts aboutthe users’ business processes. Our web-based architecture provides reporting, security, performance andstandards that are critical for web deployment. With intranet deployments, our products provide employees withinformation to enable them to make better, more cost-effective business decisions. With extranet deployments,enterprises can use MicroStrategy 7i to build stronger relationships by linking customers and suppliers via theInternet. We also offer a comprehensive set of consulting, education, technical support and technical advisoryservices for our customers and strategic partners.
Industry Background
Business intelligence software offers decision-makers the opportunity to ask and answer questions abouttheir business using data that has been captured but not yet exploited to its fullest extent.
Four key trends have driven demand for business intelligence tools:
• Need for Increased User Access: In the past, dissemination of information has been limited to a fewpower users or analysts. Now a wide range of information customers—from customer servicerepresentatives to the CEO and from customers to suppliers—demand the insight that businessintelligence can provide. The wide acceptance of the Internet as an information source has also fueleddemand for enterprise data to be accessible over the Web.
• Increased Data Scalability: Increasing information intensity, and in particular, the need to captureelectronically and store every business transaction, has made terabyte-size data warehousescommonplace. Terabyte-size data warehouses store one trillion bytes of data or more and are among thelargest databases in the world. Since transaction-level information is now routinely captured,organizations struggle to make productive use of such massive data stores. Organizations need to viewdata within the operational context of the data—making even the most detailed information meaningfuland comprehensive to business users. As a result, users are easily able to discover trends hidden in thesevery large databases, and verify these trends by reviewing the underlying transaction detail.
• Improved Supply Efficiency: Supplier transactions become more efficient with direct access toinventory and other related data. For true vendor-managed inventory and collaborative commercesystems, vendors need to have access to key information about how their products are performingagainst business metrics. For example, vendors should be able to see how their products are selling ineach geographic region so as not to over-ship products that are slow-moving or under-ship products thatare selling quickly. By opening vendor performance information to the vendors themselves, buyers andsellers of goods and services become partners in the quest to optimize sales, margin and inventory.
• Improved Distribution Efficiency: Business partners collaborate more effectively with access to shareddata. By granting access to information such as the manufacturing pipeline and build schedule, partnerscan be more effective at satisfying demands of end customers and setting expectations. Opening invoiceand purchase order information to partners can enable them to reduce the overhead associated with
1
channel management, resulting in cost savings and time efficiencies. For example, notifying channelsales partners of changes in the manufacturing schedule allows them to reset end customer expectationsor to increase selling activity.
The emergence and widespread acceptance of the Internet as a medium of communication and commercehave changed the way businesses interact with each other and their customers by allowing businesses to establishnew revenue streams, create new distribution channels and reduce costs. Simultaneously, the amount of corporateinformation stored in databases continues to grow exponentially, and companies are giving an increasing numberof employees, customers and partners access to their information. Business intelligence tools are one of thegateways to this information. For example, companies are using Internet-based systems to facilitate businessoperations, including sales automation, supply-chain management, marketing, customer service and humanresource management. Consumers are also becoming increasingly sophisticated in their use of the Internet,relying on the Internet not only to make online purchases, but to perform price comparisons, analyzerecommendations from like-minded individuals, educate themselves about relevant products and offerings andenter into transactions that were once conducted face-to-face or via the telephone. The integration of the Internetinto business processes and increased consumer sophistication create opportunities for companies to use businessintelligence applications as part of a more dynamic business model. Factors driving demand for theseapplications include:
Increased Electronic Capture of Transaction, Operational and Customer Information. The rapid growth inthe electronic capture of business information and the increased availability of related profile data on the partiesor products involved in each transaction are providing businesses with a rich data foundation for performingvarious analyses and making decisions. Powerful data analysis and mining tools are required to sift throughmassive amounts of data to uncover information regarding customer interactions, trends, patterns and exceptions,in turn enabling organizations to provide superior service and products to customers.
Need to Create a Personalized, One-to-One Customer and/or Supplier Experience While MaintainingPrivacy. Many companies are initiating strategies that establish personalized relationships with each customerand/or supplier based on individual needs and preferences, and earn their loyalty by providing superior service,security and convenience. In order to successfully acquire, retain and upgrade customers, organizations need tounderstand their profiles, their transaction history, their past responses to marketing campaigns, and theirinteractions with customer service. Retrieving information from widely dispersed and complex data sources andproviding a holistic view of the customer can be challenging. At the same time, while businesses have theopportunity to collect a variety of information that could improve targeting, customers are increasinglyconcerned about the potential for loss or abuse of their privacy.
Need to Integrate Online and Traditional Operations. While there are substantial benefits to conductingbusiness electronically, companies need to ensure that their online operations work in combination with theirtraditional operations. Companies are seeking to ensure that an order placed online can be reliably fulfilledaccording to the expectations of the customer and to develop and maintain consistent interactions with customersacross different channels. Maintaining the integrity of, and enhancing, the customer experience are crucial tofostering customer loyalty and supply chain relationships.
Increased Openness of Business Intelligence Applications to Customers, Suppliers and Partners. Businessintelligence systems are no longer confined to the corporation. Today, companies are extending their businessintelligence insight to suppliers, channel partners and customers via extranets. Business partners can have up-to-the-minute access to sales histories, inventory status and billing information through their web browsers.
Emergence of Wireless Internet and Voice Technologies. Information can be more valuable if there isuntethered, ubiquitous access to the information. The development of wireless standards and improvements intext-to-speech and voice-recognition technologies have created a technology platform for delivering Internet-based information and services to mobile devices. An integrated platform reduces the need for relying onmultiple vendors for these products and services. This development is expected to generate new business
2
opportunities for companies by providing an additional channel for existing services and creating opportunities toprovide new services that can be delivered any place and at any time to anyone that has access to a wirelessdevice.
MicroStrategy Solution: Business Intelligence for the Whole Enterprise
MicroStrategy offers MicroStrategy 7i, an integrated, industrial-strength business intelligence platform thatenables organizations to consolidate business intelligence applications onto a single platform for reporting,analysis and report delivery applications. The platform provides reliable and maintainable solutions with a lowtotal cost of ownership. Whether an organization is seeking a departmental, enterprise or extranet deployment,MicroStrategy 7i offers functionality, power and control for both users and administrators. The MicroStrategy 7ibusiness intelligence platform can be used to identify trends, improve operational efficiencies, reduce costs andincrease profitability. Since businesses integrate information from across the enterprise, solutions built on theMicroStrategy 7i platform give analysts, managers and executives critical insight they need in optimizing theirbusiness operations. Integrated web-based reporting, report delivery and real-time alerting capabilities can enablethe entire enterprise to work smarter, faster and better.
MicroStrategy’s business intelligence platform provides the functionality users need to make betterdecisions, and MicroStrategy’s business intelligence technology increases reporting functionality dramatically.The MicroStrategy 7i platform delivers a high-performance solution that meets users’ demands and is highlyfunctional, simple to use, scalable and easy to administer. With one platform, users are able to perform all of thefive most popular styles of business intelligence, including:
• Ad Hoc Query and Reporting (ROLAP). Perform investigative analysis and ad hoc queries using theonline analytical processing (OLAP) functionality of drill anywhere, page-by, pivot, subtotal, sort, filter,rank and export. This allows analysts and management to have more insight into business results.
• Statistics & Data Mining. Use statistical treatment and data mining algorithms for predictive analysis.The MicroStrategy 7i platform allows users to perform analysis that has typically required multiplesoftware packages.
• Cube Analysis (MOLAP). Perform OLAP analysis on predefined subsets of data. Users experienceincreased speed and interactivity by working on defined subsets of data.
• Report Delivery and Alerting. Disseminate reports and exception alerts on an enterprise-scale throughself-subscription or central administration. Reports can be received via email, file server, portal, printer,text message, PDA, fax, pager and voice.
• Enterprise Reporting. Create and distribute boardroom quality reports to users across the enterpriseand extranets. From the advanced requirements of power users to the “at-a-glance” requirements ofexecutives, MicroStrategy can meet diverse reporting needs, including dashboards, scorecards andoperational reports.
Specific benefits of the MicroStrategy 7i business intelligence platform include:
Industrial-Strength Business Intelligence. The MicroStrategy platform enables industrial-strength businessintelligence with enterprise-caliber IT, high user scalability and high database scalability. MicroStrategy’senterprise-caliber IT translates to centralized administration, operations and operations maintenance in a unifiedinterface and unified backplane. This enterprise-caliber infrastructure allows for data scalability and userscalability with a zero-foot print web product, where business intelligence can expand across and grow with theenterprise.
Five Styles of Business Intelligence. With the five styles of business intelligence on an integratedbackplane, users are no longer bound to departmental reporting or solutions that offer only one style of businessintelligence or combine individual styles of business intelligence. The need for multiple business intelligence orreporting tools is minimized when users have access to all five styles for their enterprise business intelligenceneeds.
3
Support for Large Data Volumes and All Major Relational Database/Hardware Combinations. TheMicroStrategy platform supports systems with very large data volumes and is specifically designed to support allmajor relational database platforms commonly used for business intelligence systems. Important features of oursolution in this area include:
• Structured Query Language (SQL) optimization drivers that improve performance of each majordatabase;
• The ability to support very large user populations;
• Highly reliable up-time, even in high volume applications; and
• The ability to work with and support nine languages for international applications.
Powerful Analytics to Customer- and Transaction-Levels of Detail. We believe that the MicroStrategy 7iplatform incorporates the most sophisticated analysis engine available today, capable of answering highlydetailed business questions. It offers support for information beyond the summary level to include information atthe customer transaction and interaction level. This capability is critical to a wide range of applications, includinghighly targeted direct marketing, e-commerce site personalization, customer and product affinity analysis, calldetail analysis, fraud detection, credit analysis forecasting, trend metrics and campaign management. TheMicroStrategy 7i platform allows the creation of highly sophisticated systems that take maximum advantage ofthe detail available in a company’s databases.
Powerful Personalization Engine. The MicroStrategy 7i platform includes a customer- and transaction-level personalization engine. The underlying architecture is designed to generate personalization parametersbased on data gathered by an organization from a variety of sources, including past customers’ transactions,customer clickstream information, stated user preferences and demographic information. In addition, theMicroStrategy personalization engine is able to determine when and under what circumstances a person isautomatically provided with a set of information that proves useful in fraud detection and homeland securityapplications.
Powerful Narrowcast Server Distribution Engine for Information Delivery. Our technology offers a highperformance personalized narrowcast engine for delivering periodic and alert-based information to users viaInternet, e-mail, wireless devices, printer and fax. The narrowcast engine includes drivers for all major devicetypes used in both domestic and international markets, enabling the delivery of information to users when andwhere it is needed.
Highly Stylized and Consolidated Reporting and Formatting Capabilities. MicroStrategy ReportServices™ technology delivers a wide range of enterprise reports via the Web, including production andoperational reports, managed metrics reports and scorecards. The design capabilities provide the precisionnecessary to deliver reports with boardroom presentation quality, without any programming. By dragging anddropping report components, users can create the high quality reports with complete formatting flexibility.Unlike other popular reporting products, the modern architecture delivers both traditional hierarchical bandedreports and newer, Web-oriented zone-based reports.
The MicroStrategy 7i platform’s advanced technology provides high performance functionality in five keybusiness intelligence areas:
• Speed and power;
• Functionality and ease of use;
• Report delivery and intelligent alerts;
• Packaged functionality and customization; and
• Security and scalability.
4
Strategy
Our business objective is to become the leading provider of business intelligence software and relatedservices to the largest 2,000 enterprises, governments and the largest databases and data providers in the world.The key elements of our strategy to achieve this objective are as follows:
Marketing Strategy. Our business intelligence platform marketing strategy is designed to increase ourfootprint in the business intelligence market by increasing awareness of the MicroStrategy 7i platform. In thebusiness intelligence market, our marketing programs target five principal constituencies:
• Our historical base of corporate technology buyers and departmental technology buyers in Global 2000enterprises;
• Corporate and departmental technology buyers in mid-sized enterprises, with annual revenues between$250 million and $1 billion;
• Government technology buyers and the vendors to the government community;
• Independent software vendors who want to embed analytical tools in their solutions; and
• System integrators who have technology relationships with the largest 2,000 enterprises, governmentsand information intensive businesses.
We continually seek to increase our brand awareness by focusing our messaging on the possibilities forvalue creation with our business intelligence platform, the benefits of using our platform and competitivedifferentiators. The channels we use to communicate with these constituencies are:
• Print ads;
• Online ads;
• Direct e-mail;
• Industry events;
• User conferences;
• Strategic partners;
• Word of mouth and peer references;
• Industry awards;
• Our website; and
• Coverage in print and broadcast media.
Technology Strategy. Our technology strategy is focused on expanding our support for large informationstores, enhancing our analysis and segmentation capabilities, strengthening our personalization technology andenhancing our report delivery and alerting functionality to all commonly used devices. We continue to enhanceour technology for use with a broad range of operating systems and databases to enable our customers to leveragetheir existing technology investments to achieve faster query times with fewer required resources. In addition,MicroStrategy continues to develop its platform for easy integration with a wide spectrum of enterprise resourceplanning (ERP) systems. As part of this strategy, we are developing technology that further differentiates ourproduct offerings by increasing functionality along the following key dimensions:
• Capacity—the volume of information that can be efficiently analyzed and utilized;
• Concurrency—the number of users that can be supported simultaneously;
• Sophistication—the range of analytical methods available to the application designer;
5
• Performance—the response time of the system;
• Database Flexibility—the range of data sources, data warehouses and online transaction processingdatabases which the software is capable of efficiently querying without modification;
• Robustness—the reliability and availability of the software in mission critical environments;
• Deployability—the ease with which applications can be deployed, modified, upgraded and tuned;
• Personalization—the quality and sophistication of a one-to-one user experience;
• Content Flexibility—the range of content, both structured and unstructured, that can be efficientlyutilized; and
• Media Channel and Interface Flexibility—the range of media channels, interface options, and displayfeatures supported.
Sales Strategy. Our sales strategy focuses on direct sales through our dedicated sales force andrelationships with indirect channel partners in order to increase market share in both domestic and internationalmarkets. We also seek to increase sales to our existing base of customers by offering a range of software andservices utilizing our integrated business intelligence platform. Finally, we offer a comprehensive set ofeducational programs that enhance our potential customers’ and channel partners’ understanding of the power ofour platform.
Products
We offer an integrated business intelligence platform, known as MicroStrategy 7i, which is designed toenable businesses to turn information into strategic insight and make more effective business decisions.Revenues from sales of product licenses accounted for approximately $77 million of total revenues during 2003.
MicroStrategy 7i. MicroStrategy 7i integrates a full range of reporting, analysis, report delivery andalerting capabilities into a single platform—providing central management of security, administration,development and deployment.
MicroStrategy 7i is designed to integrate the two leading business intelligence approaches, ad hoc query andreporting (ROLAP) and cube analysis (MOLAP), delivering quick response time against almost any size data set,full access to transaction-level data and a myriad of options for complex analysis. Additionally, MicroStrategy 7iis designed to provide a single interface for reporting, analysis, report delivery and alerting for all businessintelligence applications. MicroStrategy 7i is enabling organizations to consolidate business intelligenceapplications onto a single platform, resulting in reliable and maintainable solutions with a low total cost ofownership.
The following are the components of the MicroStrategy 7i platform:
MicroStrategy Intelligence Server. MicroStrategy Intelligence Server is the foundation for our businessintelligence platform. We believe that MicroStrategy Intelligence Server is the most sophisticated analysis engineavailable in the market, capable of answering highly detailed business questions. Its robust relational analysistechnology enables organizations to conduct large-scale product affinity and product profitability analyses,research customer preferences through sales, contribution and pricing analysis, and compare present andhistorical customer retention data with forecasting and trend metrics. MicroStrategy Intelligence Server generateshighly optimized queries through its very large database drivers, enabling high throughput and fast responsetimes.
MicroStrategy Intelligence Server has been built with the scalability and fault tolerance required forsophisticated analysis of multi-terabyte databases and can be deployed to thousands of users through complete
6
user, object and data security and management. It contains thousands of specific optimizations for all majorrelational databases and includes the load distribution, prioritization and system tuning capabilities demanded bylarge-scale implementations.
MicroStrategy Intelligence Server contains an analytical engine with over 240 different sophisticatedmathematical, financial and statistical functions with the flexibility for further function extensions.MicroStrategy Intelligence Server combines the power of its analytical engine with the scalability of a relationaldatabase to perform complex data analysis with maximum efficiency. All the other products in the MicroStrategy7i platform integrate with the MicroStrategy Intelligence Server and benefit from its broad functionality.
MicroStrategy Intelligence Server is designed to be fault-tolerant to ensure system availability and highperformance. Through an enterprise management console, MicroStrategy Intelligence Server provides asophisticated array of enterprise management tools, such as caching and query prioritization to streamlineperformance and batch job scheduling, which helps to maintain disparate and diverse user communities.Administrators can automate the dynamic adjustments of system and user governing settings, such as userthresholds and database thread priorities, in order to smooth the database workload and ensure the highperformance that large user communities require.
MicroStrategy Intelligence Server is designed as a services oriented architecture (SOA) to easily augmentfunctionality and capabilities throughout the platform. MicroStrategy OLAP Services™ and Report Services™
employ this services-oriented architecture design.
MicroStrategy Report Services. MicroStrategy Report Services is the enterprise reporting engine of theMicroStrategy business intelligence platform that delivers an entire range of enterprise reports, includingproduction and operational reports, managed metrics reports and scorecards. Its design capabilities provide theprecision necessary to deliver these reports with desktop publishing quality and drag-and-drop simplicity. Userscan create reports using intuitive design features without programming or outside help.
MicroStrategy 7i OLAP Services™. MicroStrategy 7i combines the speed and interactivity of multi-dimensional OLAP analysis with the analytical power and depth of relational OLAP. MicroStrategy 7i OLAPServices is an extension of MicroStrategy Intelligence Server that allows MicroStrategy Web and Desktop usersto manipulate Intelligent Cubes™. End users can add or remove report objects, add derived metrics and modifythe filter—all with “speed-of-thought” response time against Intelligent Cubes. MicroStrategy 7i OLAP Servicesenables full multi-dimensional OLAP analysis within Intelligent Cubes, while retaining users’ ability toseamlessly drill through to the full breadth and depth of the data warehouse.
MicroStrategy Web and MicroStrategy Web Universal. MicroStrategy Web is a patented zero-footprintweb interface providing query, reporting and analysis through a platform independent architecture.MicroStrategy Web’s interface provides a familiar look and features drag-and-drop report creation, spreadsheetformatting, advanced printing and exporting and right click menus for drilling, pivoting and sorting. All of this isaccomplished without ActiveX, Java™ Applets or client side installations or downloads, ensuring the highestlevels of security.
MicroStrategy Web provides users with a highly interactive environment and low maintenance interface forreporting and analysis. Using this intuitive HTML-only web solution, users access, analyze and share corporatedata. MicroStrategy Web provides ad hoc querying, industry-leading analysis, quick deployment and rapidcustomizability, making it even easier for users to make informed business decisions.
MicroStrategy Web Universal features the same powerful functionality users are familiar with inMicroStrategy Web with the added benefit of working with all major operating systems, application servers, webservers and browser interfaces.
7
MicroStrategy Narrowcast Server. MicroStrategy Narrowcast Server is a proactive report delivery andalerting server that distributes personalized business information to recipients via e-mail, printers, file servers,portals, wireless devices, fax and phone. MicroStrategy Narrowcast Server delivers targeted information toindividuals on an event-triggered or scheduled basis through the communication device that is most convenient.It provides an engine to implement targeted messaging to acquire and retain customers and a platform fordistributing information to corporate departments, the entire enterprise and other stakeholders includingcustomers and suppliers.
MicroStrategy Narrowcast Server has a web-based interface that can be used with existing web applications.Users can subscribe to information services by providing personal information and preferences, ensuring theyreceive personalized information relevant to them.
In addition to proactively delivering reports from the MicroStrategy 7i platform, MicroStrategy NarrowcastServer’s open information source modules enable it to deliver information from a multitude of informationsources to the business user. The multiple information sources can be combined to provide users with requestedinformation in one personalized e-mail, message or document.
MicroStrategy Office. MicroStrategy Office lets every Microsoft® Office user run, edit and format anyMicroStrategy report directly from within Microsoft applications such as Excel, PowerPoint® and Word.MicroStrategy Office is designed using Microsoft .NET technology and accesses the MicroStrategy businessintelligence platform using XML and Web services. MicroStrategy Office gives business users open andstraightforward access to the full functionality of the MicroStrategy platform—all from familiar Microsoft Officeapplications. MicroStrategy Office serves as a Microsoft add-in, with MicroStrategy functionality expressed as asingle tool bar in Microsoft.
MicroStrategy Desktop. MicroStrategy Desktop is a business intelligence software component thatprovides integrated query and reporting, powerful analytics and decision support workflow on the personalcomputing desktop. MicroStrategy Desktop provides a rich set of features for online analysis of corporate data.Even complex reports are easy to create and can be viewed in various presentation formats, polished intoproduction reports, distributed to other users and extended through a host of ad hoc features including drilling,pivoting and data slicing. The interface itself can be customized to different users’ skill levels and securityprofiles. MicroStrategy Desktop comes in two versions:
• Desktop Analyst. A simplified version that provides interactive slice and dice required by managers;and
• Desktop Designer. A full-featured version that lets users design complex and sophisticated reports.
Applications developed within MicroStrategy Desktop can be easily deployed throughout the MicroStrategyarchitecture bringing integrated query and reporting capabilities, powerful analytics and decision supportworkflow to analysts, quantitative users and end users throughout the enterprise and beyond.
MicroStrategy Architect. MicroStrategy Architect is the MicroStrategy 7i product in which applicationsare modeled through an intuitive graphical user interface. MicroStrategy Architect provides a unifiedenvironment for creating and maintaining various aspects of web reporting and business intelligence applications.MicroStrategy Architect is highly automated and is based on an open, flexible architecture, which can greatlyreduce the cost and time required to implement and maintain systems.
MicroStrategy Administrator. MicroStrategy Administrator enables administrators to efficiently develop,deploy, monitor and maintain small, medium and enterprise-scale systems supporting thousands of users. Projectmigration utilities help administrators develop, test and deploy systems. Performance analysis enablesadministrators to monitor and tune systems for maximum performance and availability. MicroStrategyAdministrator has been designed to ensure easy management of application objects and users across multipledevelopment, testing and production environments. MicroStrategy Administrator eases the burden of maintaining
8

users and security by using textual commands that can be saved as scripts. These commands and scripts can beexecuted from either a graphical interface or from the command line giving system administrators the flexibilityand ease-of-use necessary for efficient systems management. MicroStrategy Administrator tools consist ofObject Manager, Enterprise Manager and Command Manager.
MicroStrategy SDK. MicroStrategy SDK is a comprehensive development environment that enablesintegration of MicroStrategy 7i features and functionality into any application on multiple platforms, includingUNIX-based systems using a Java-based Web API. Through sample code, documentation and reference guides,the MicroStrategy SDK enables an application developer to quickly learn to use the APIs to implement easy-to-use web reporting and powerful business intelligence applications.
All the API interfaces within the MicroStrategy SDK reflect XML architecture. MicroStrategy SDK’s PortalIntegration Kit™ includes pre-built samples for embedding MicroStrategy 7i analysis into a corporate portal. TheWeb Services Development Kit™ provides sample code enabling MicroStrategy 7i functionality to be accessedvia standard Web Services.
MicroStrategy BI Developer Kit. MicroStrategy BI Developer Kit is a package of products that includesMicroStrategy Desktop Designer, MicroStrategy Architect and modular analytic applications. The analyticmodules are starter kits designed to streamline business processes through the use of business intelligence. Eachof the modules ships with a sample data-model and numerous reports and key performance indicators. Theanalytic modules are designed to enable portability and the ability to work against existing data warehouseswithout the need for additional data extraction and loading concerns. The modules are easy to extend and modifyand reflect a decade of business intelligence implementation experience and best practices of the most commonbusiness analysis applications.
MicroStrategy MDX Adapter. MicroStrategy MDX Adapter opens the analytical power and scalability ofthe MicroStrategy 7i Platform to other business intelligence reporting tools. With MicroStrategy MDX Adapter,reporting tools that use the OLE DB for OLAP (ODBO) standard created by Microsoft can connect throughMicroStrategy Intelligence Server and access any major relational database. Companies such as Cognos®,Hyperion Solutions, Business Objects, Alphablox™ and arcplan® provide ODBO compliant front-end reportingtools.
MicroStrategy MDX Adapter helps companies that have reached the data scalability and analyticallimitations of their current business intelligence solution. Unlike MicroStrategy, many business intelligenceapplications depend on replication of pre-calculated data into multidimensional, physical cubes. Theseproprietary cubes can reach data storage limitations quickly. Furthermore, the process to build and load cubesuses valuable time and resources. By eliminating the need for physical cubes, MicroStrategy MDX Adapter givesusers access to terabytes of data in any major relational database without costly modifications to the physicalcubes or expensive data replication.
MicroStrategy MDX Adapter allows organizations to standardize on a reporting and analysis platform,while still enabling users to access the platform from a variety of user interfaces. Companies that have hitscalability, administration, security and analytical limits with their existing analysis tools can continue to provideusers with their interface of choice, while replacing the underlying business intelligence engine with the morerobust and reliable MicroStrategy 7i business intelligence platform. This leverages investments in databases,software and training and removes some of the traditional burdens of cube-based architectures.
MicroStrategy Transactor™. MicroStrategy Transactor is a workflow server that allows users to turninsight gained from their MicroStrategy business intelligence applications into actionable decisions.MicroStrategy Transactor directs and manages the workflow required to take business intelligence informationfrom a web report, email, wireless message or voice alert and complete a closed-loop transaction with all majorback-end information systems.
9
Product Support and Other Services
MicroStrategy Technical Support. MicroStrategy Technical Support provides a diverse set of supportoptions to meet the needs of customers and projects and offers product upgrades when available. Our productexperts help support MicroStrategy implementation from development to deployment to the productionenvironment. Our support offerings include access to our highly skilled support team during standard businesshours, around the clock access to our online support site, and options to secure dedicated technical support at anytime of the day. Revenues from technical support services accounted for approximately 37%, 35% and 26% oftotal revenues during 2003, 2002 and 2001, respectively.
MicroStrategy Consulting. MicroStrategy Consulting offers a broad range of business intelligence anddata warehousing expertise gathered from helping thousands of customers across diverse industries implementdepartmental, enterprise and extranet applications across various types of databases. Our consulting staffidentifies the optimal design and implementation strategy that includes detailed business requirements, userinterface requirements and performance tuning. By leveraging our best practices, strategic visioning, projectplanning and platform expertise, we assist customers’ technical staff in successfully completing projects anddeveloping solutions that business users will adopt. Revenues from consulting services accounted forapproximately 14%, 16% and 28% of total revenues during 2003, 2002 and 2001, respectively.
MicroStrategy Education. MicroStrategy Education offers goal-oriented, comprehensive educationsolutions for customers and partners. Through the use of self-tutorials, custom course development, joint trainingwith customers’ internal staff or standard course offerings, MicroStrategy’s Education Consultants develop anongoing education program that meets our customers’ specific education needs. Our team of educationconsultants delivers quality, cost-effective instruction and skill development for administrators, developers andanalysts. Revenues from education services accounted for approximately 5%, 6% and 6% of total revenuesduring 2003, 2002 and 2001, respectively.
MicroStrategy Technical Advisory Services. MicroStrategy also offers Technical Advisory Services as anadvisory service for enterprise customers seeking to maximize their investment in the MicroStrategy businessintelligence platform. MicroStrategy Technical Advisory Services consists of delivering business intelligenceadvisory and audit services over the course of a year and providing members with a comprehensive program ofadvisory services, knowledge capital and corporate support. MicroStrategy Technical Advisory Services has beendesigned to help provide the optimal opportunity to experience success and the highest return on investment onMicroStrategy’s business intelligence platform. MicroStrategy Technical Advisory Services deliver subjectmatter expertise, project management, strategic consulting and expedited resources to enhance the success ofcustomer deployments. Revenues from MicroStrategy Technical Advisory Services are included within revenuesfrom consulting services above.
We also have two development stage units, Angel.com and Alarm.com, that are engaged in non-corebusiness intelligence activities. The financial results of Angel.com and Alarm.com are not material to ourworldwide financial results.
Customers
MicroStrategy has over 2,500 customers across such diverse industries as retail (7 of the top 10 globally),telecommunications (all of the top 10 globally), financial services (4 of the top 5 global diversified financialservices companies), pharmaceutical companies (all of the top 10 globally), healthcare (5 of the top 10 globally),manufacturing (6 of the top 10 global auto manufacturers), consumer packaged goods (9 of the top 10 globally)and technology. International sales accounted for 34.0%, 36.0% and 33.8% of our total revenues in 2003, 2002and 2001, respectively.
10
Below is a representative list of domestic and international firms that use the MicroStrategy 7i businessintelligence platform:
• Retail: Ace Hardware, Albertson’s, Best Buy, eBay, Hudson’s Bay Company, Liz Claiborne, Lowe’sCompanies, METRO Group, Toys R Us, WH Smith PLC, Yahoo! Inc.
• Financial Services: Bank of Montreal, FleetBoston Financial, Inovant, KeyBank, LaCaixa,Metropolitan Life Insurance Company, Nationwide Insurance, RBC Financial Group, Wachovia, WellsFargo
• Pharmaceutical and Healthcare: AdvancePCS, Aventis Pasteur, Caremark, Cardinal Health, IMSHealth Canada, NDCHealth Corporation, Pharmacia, Premier
• Telecommunications: AT&T, BellSouth, Cable and Wireless, Interoute, Sprint, Telecom Italia,Telefónica, Telephia
• Manufacturing: Honda, Lexmark, Michelin, Pfizer Global Manufacturing, Shaw Industries, WaterfordWedgewood, Western Digital
• Consumer Goods: Amway Corp., Campbell’s Soup, Estée Lauder, Revlon, Unilever Cosmetics
• Government/Public Services: Kent Unified School District, National Institutes of Health, OhioDepartment of Education, State of Tennessee, US Department of Education, US Department of State,US Postal Service.
Customer Case Studies
U.S. Postal Service. The U.S. Postal Service (“USPS”) purchased over $5 million of MicroStrategysoftware licenses, education and software support services in 2003. USPS will deploy the MicroStrategyBusiness Intelligence Platform enterprise-wide for reporting, analysis and information delivery. USPS isinvesting in business intelligence to improve the service provided to its customers as well as the efficiency of itsoperations. The MicroStrategy platform will eventually be used by up to 30,000 employees to enhanceefficiencies in areas that include retail, financial and network operations, transportation logistics and supply-chain management.
Dick’s Sporting Goods. Dick’s Sporting Goods chose MicroStrategy as its enterprise reporting standard in2003. Dick’s Sporting Goods is an authentic sporting goods retailer that offers a broad selection of high-quality,competitively-priced brand name sporting goods equipment, apparel and footwear. After reviewing reportingsolutions from among the many available business intelligence products, Dick’s chose MicroStrategy to replacetheir Cognos installation. Dick’s Sporting Goods employees, including store managers, merchandising analystsand senior management, will use MicroStrategy software to analyze an 800-gigabyte Oracle® data warehouse.End users will be able to perform sales, category and inventory management analyses in order to more effectivelytrack product sales, product mix and inventory levels.
Shaw Industries. Shaw Industries, a subsidiary of Berkshire Hathaway Inc., chose MicroStrategy as itsbusiness intelligence standard in 2003. Approximately 1,000 Shaw employees, including sales, marketing andaccounting personnel, will perform reporting and analyses of sales and marketing information against aTeradata® data warehouse. The MicroStrategy platform will anchor applications that will help Shaw Industriesgain better insight into its sales and marketing operations to enhance efficiency. Shaw Industries will also be ableto more effectively monitor and manage inventory levels in order to improve productivity.
Sales And Marketing
Direct Sales Organization. We market our software and services primarily through our direct sales force.As of December 31, 2003, we had domestic sales offices in a number of cities, including Atlanta, Austin,Carlsbad, Charlotte, Chicago, Cincinnati, Dallas, Denver, Edina, Los Angeles, New York, Phoenix, San
11
Francisco, Seattle, St. Louis, Tampa, Troy and Washington, DC, and international sales offices located inBarcelona, Buenos Aires, Cologne, Frankfurt, London, Lisbon, Madrid, Melbourne, Mexico City, Milan,Montreal, Monterrey, Munich, Paris, Rome, Sao Paolo, Seoul, Tokyo, Toronto and Utrecht. We are representedby distributors in several countries where we do not have sales offices, including Bulgaria, Chile, Colombia, theCzech Republic, Denmark, Finland, India, Ireland, Malaysia, Malta, Norway, Peru, Singapore, Slovenia, SouthAfrica, Sweden, Switzerland, Turkey, Ukraine and Uruguay.
Indirect Sales Channels. We have entered into relationships with nearly 300 reseller, value-added reseller,system integration, original equipment manufacturers (OEM) and technology partners who utilize theMicroStrategy platform for a variety of commercial purposes. Agreements with these partners generally providenon-exclusive rights to market our products and services and allow access to our marketing materials, producttraining and direct sales force for field level assistance. In addition, we offer our sales partners product discounts.Favorable product recommendations to potential customers from the leading system integration, applicationdevelopment and platform partners facilitate the sale of our products. We believe that such indirect saleschannels allow us to leverage sales and service resources as well as marketing and industry-specific expertise toexpand our user base and increase our market coverage. In addition, we have entered into agreements withresellers who resell our software on a stand-alone basis.
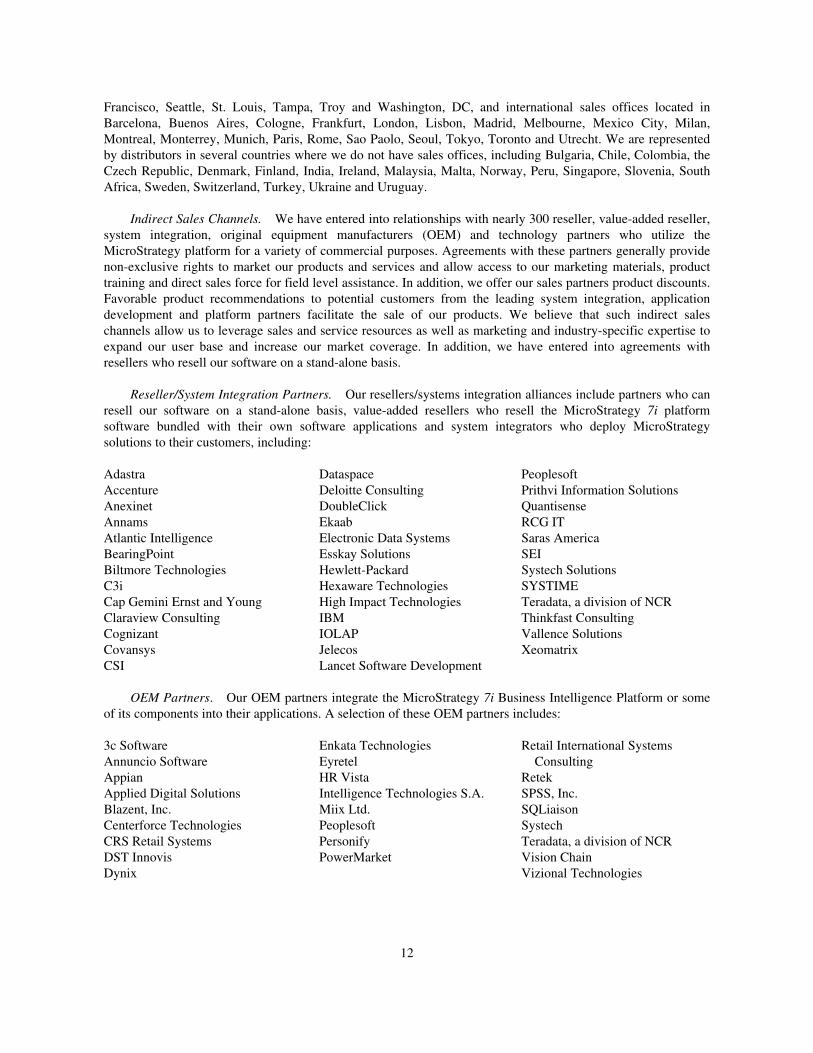
Reseller/System Integration Partners. Our resellers/systems integration alliances include partners who canresell our software on a stand-alone basis, value-added resellers who resell the MicroStrategy 7i platformsoftware bundled with their own software applications and system integrators who deploy MicroStrategysolutions to their customers, including:
Adastra Dataspace PeoplesoftAccenture Deloitte Consulting Prithvi Information SolutionsAnexinet DoubleClick QuantisenseAnnams Ekaab RCG ITAtlantic Intelligence Electronic Data Systems Saras AmericaBearingPoint Esskay Solutions SEIBiltmore Technologies Hewlett-Packard Systech SolutionsC3i Hexaware Technologies SYSTIMECap Gemini Ernst and Young High Impact Technologies Teradata, a division of NCRClaraview Consulting IBM Thinkfast ConsultingCognizant IOLAP Vallence SolutionsCovansys Jelecos XeomatrixCSI Lancet Software Development
OEM Partners. Our OEM partners integrate the MicroStrategy 7i Business Intelligence Platform or someof its components into their applications. A selection of these OEM partners includes:
3c Software Enkata Technologies Retail International SystemsAnnuncio Software Eyretel ConsultingAppian HR Vista RetekApplied Digital Solutions Intelligence Technologies S.A. SPSS, Inc.Blazent, Inc. Miix Ltd. SQLiaisonCenterforce Technologies Peoplesoft SystechCRS Retail Systems Personify Teradata, a division of NCRDST Innovis PowerMarket Vision ChainDynix Vizional Technologies
12
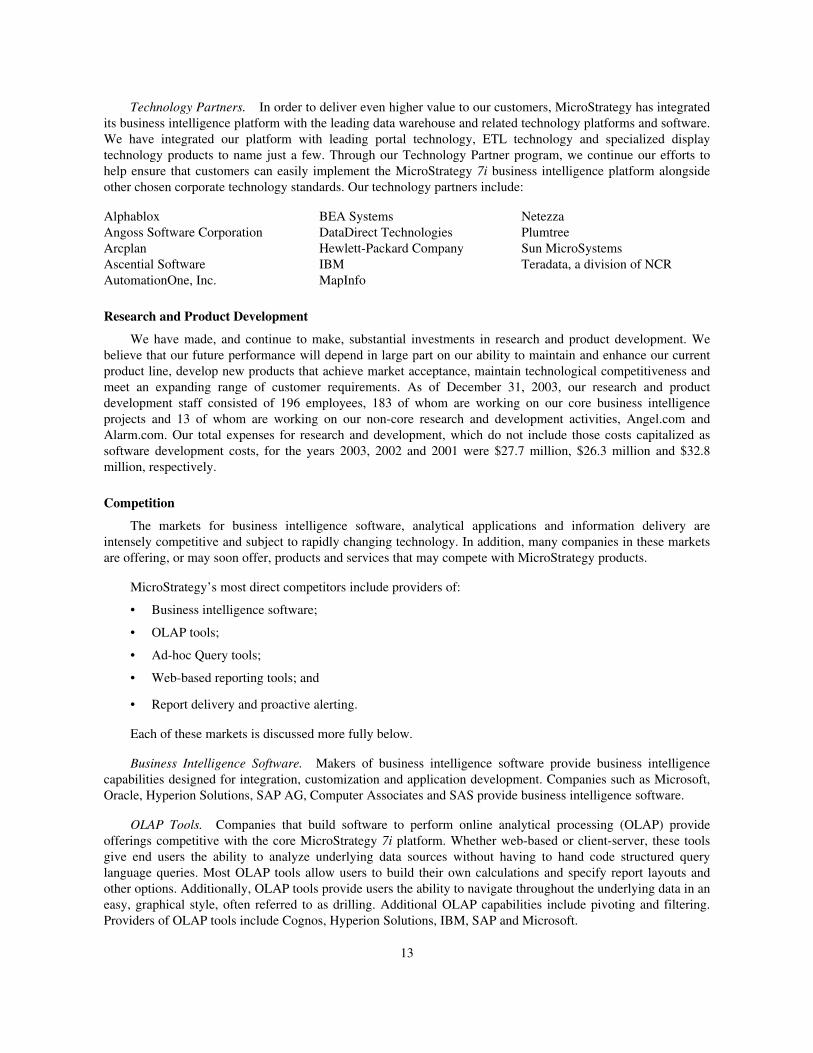
Technology Partners. In order to deliver even higher value to our customers, MicroStrategy has integratedits business intelligence platform with the leading data warehouse and related technology platforms and software.We have integrated our platform with leading portal technology, ETL technology and specialized displaytechnology products to name just a few. Through our Technology Partner program, we continue our efforts tohelp ensure that customers can easily implement the MicroStrategy 7i business intelligence platform alongsideother chosen corporate technology standards. Our technology partners include:
Alphablox BEA Systems NetezzaAngoss Software Corporation DataDirect Technologies PlumtreeArcplan Hewlett-Packard Company Sun MicroSystemsAscential Software IBM Teradata, a division of NCRAutomationOne, Inc. MapInfo
Research and Product Development
We have made, and continue to make, substantial investments in research and product development. Webelieve that our future performance will depend in large part on our ability to maintain and enhance our currentproduct line, develop new products that achieve market acceptance, maintain technological competitiveness andmeet an expanding range of customer requirements. As of December 31, 2003, our research and productdevelopment staff consisted of 196 employees, 183 of whom are working on our core business intelligenceprojects and 13 of whom are working on our non-core research and development activities, Angel.com andAlarm.com. Our total expenses for research and development, which do not include those costs capitalized assoftware development costs, for the years 2003, 2002 and 2001 were $27.7 million, $26.3 million and $32.8million, respectively.
Competition
The markets for business intelligence software, analytical applications and information delivery areintensely competitive and subject to rapidly changing technology. In addition, many companies in these marketsare offering, or may soon offer, products and services that may compete with MicroStrategy products.
MicroStrategy’s most direct competitors include providers of:
• Business intelligence software;
• OLAP tools;
• Ad-hoc Query tools;
• Web-based reporting tools; and
• Report delivery and proactive alerting.
Each of these markets is discussed more fully below.
Business Intelligence Software. Makers of business intelligence software provide business intelligencecapabilities designed for integration, customization and application development. Companies such as Microsoft,Oracle, Hyperion Solutions, SAP AG, Computer Associates and SAS provide business intelligence software.
OLAP Tools. Companies that build software to perform online analytical processing (OLAP) provideofferings competitive with the core MicroStrategy 7i platform. Whether web-based or client-server, these toolsgive end users the ability to analyze underlying data sources without having to hand code structured querylanguage queries. Most OLAP tools allow users to build their own calculations and specify report layouts andother options. Additionally, OLAP tools provide users the ability to navigate throughout the underlying data in aneasy, graphical style, often referred to as drilling. Additional OLAP capabilities include pivoting and filtering.Providers of OLAP tools include Cognos, Hyperion Solutions, IBM, SAP and Microsoft.
13
Ad-hoc Query Tools. Ad-hoc query tools allow large numbers of end users to gain access to pre-definedreports and queries for simple analysis. Often each end user is able to specify some personalized run-time criteriathat customize the result set for that particular person. Some limited drilling is also provided. Some ad-hoc querytools allow users to access databases and create their own database queries using structured query language.Users are then able to export the resulting data into other formats such as Microsoft Excel for their own use.Companies that produce query and reporting tools include Business Objects, Cognos, Oracle, Hyperion Solutionsand Information Builders.
Web-based Reporting Tools. Companies that offer software to deliver pre-built reports for end userviewing and consumption can also compete with MicroStrategy. Extensive formatting capabilities ensure thatusers can easily consume the information contained in the reports. There is limited user interactivity with thesereports generated by reporting tools. Reporting applications built with these tools often lack the sophistication,robustness and scalability of the MicroStrategy platform, but can be attractive for small departments. Vendors inthis category include Actuate, Business Objects, Microsoft and SAS.
Report Delivery and Proactive Alerting. Companies that focus on the proactive delivery of information,via e-mail, website, or other medium can compete with MicroStrategy’s offerings. Typically, these tools serve topush out compiled reports on a scheduled basis to sets of users based on job type. MicroStrategy software hasintegrated this technology into the MicroStrategy 7i platform. Vendors of such technology include Actuate andBusiness Objects.
Many of our competitors have longer operating histories, significantly greater financial, technical,marketing or other resources, and greater name recognition than we do. In addition, many of our competitorshave strong relationships with current and potential customers and extensive knowledge of the businessintelligence industry. As a result, they may be able to respond more quickly to new or emerging technologies andchanges in customer requirements or devote greater resources to the development, promotion and sale of theirproducts than we can. Increased competition may lead to price cuts, reduced gross margins and loss of marketshare. We may not be able to compete successfully against current and future competitors, and the failure to meetthe competitive pressures we face may have a material adverse effect on our business, operating results andfinancial condition.
Current and future competitors may also make strategic acquisitions or establish cooperative relationshipsamong themselves or with others. By doing so, they may increase their ability to meet the needs of our potentialcustomers. Our current or prospective indirect channel partners may establish cooperative relationships with ourcurrent or future competitors. These relationships may limit our ability to sell our products through specificdistribution channels. Accordingly, new competitors or alliances among current and future competitors mayemerge and rapidly gain significant market share. These developments could limit our ability to obtain revenuesfrom new customers and to maintain technical support revenues from our installed customer base.
Employees
As of December 31, 2003, we had a total of 849 employees, of whom 573 were based in the United Statesand 276 were based internationally. Of the total, 283 were engaged in sales and marketing, 196 in productdevelopment, 216 in professional services and 154 in finance, administration and corporate operations. None ofour employees are represented by a labor union. We have not experienced any work stoppages and consider ourrelations with our employees to be good.
We believe that effective recruiting, education and nurturing of human resources are critical to our successand have traditionally made investments in these areas in order to differentiate ourselves from our competition,increase employee loyalty and create a culture conducive to creativity, cooperation and continuous improvement.
All newly hired professionals complete a professional orientation course that ranges from one day to fourweeks long, presented by “MicroStrategy University,” our in-house education function. The curriculum consists
14
of lectures, problem sets and independent and group projects, covering data on our products, competitors andcustomers. Certain lectures also deal with general business practices, ethics and teamwork. Throughout thistraining, students typically must pass a number of oral and written examinations in order to begin theirassignments. Course content for MicroStrategy University is created by experienced members of our professionalstaff, who generally have an annual obligation to create expert content based upon the best practices they havemost recently observed in the field. This expert content is then used to upgrade and revitalize our education,consulting, support, technology and marketing operations.
Available Information
MicroStrategy’s website is located at www.microstrategy.com. MicroStrategy makes available free ofcharge, on or through our website, our annual reports on Form 10-K, quarterly reports on Form 10-Q, currentreports on Form 8-K and all amendments to those reports, as soon as reasonably practicable after electronicallyfiling such reports with the SEC. Information found on our website is not part of this report or any other reportfiled with the SEC.
ITEM 2. PROPERTIES
Our principal offices are located in Northern Virginia in leased facilities pursuant to multiple leases, themajority of which expire between August 2006 and June 2010. These office facilities comprise a total of 260,000square feet, of which 77,000 square feet were vacated in connection with restructuring plans adopted during2001. As of December 31, 2003, of the 77,000 square feet of vacant space, 31,000 square feet have beensubleased. In addition, we also lease sales offices domestically and internationally in a variety of locations,including Atlanta, Austin, Carlsbad, Charlotte, Chicago, Cincinnati, Dallas, Denver, Edina, Los Angeles, NewYork, San Francisco, Seattle, St. Louis, Tampa, Troy, Barcelona, Buenos Aires, Cologne, Frankfurt, London,Lisbon, Madrid, Melbourne, Mexico City, Milan, Monterrey, Montreal, Munich, Paris, Rome, Sao Paolo, Seoul,Tokyo, Toronto and Utrecht. We believe our properties are suitable and adequate for our present and near termneeds, and we do not expect to add additional office space in the foreseeable future.
ITEM 3. LEGAL PROCEEDINGS
Business Objects Litigation
On October 2, 2001, we filed a lawsuit in the Virginia Circuit Court for Fairfax County against two fieldemployees of Business Objects, S.A. This lawsuit alleged that these employees, who previously worked for us,breached their fiduciary and contractual obligations to us by, among other things, misappropriating our tradesecrets and confidential information and soliciting our employees and customers. The complaint soughtinjunctive relief and damages. On October 17, 2001, Business Objects filed suit against us in the United StatesDistrict Court for the Northern District of California, claiming that our software infringes a patent issued toBusiness Objects relating to relational database access (the ‘403 patent). The suit sought injunctive relief andmonetary damages. On August 29, 2003, the Court granted our motion for summary judgment and dismissed thelawsuit, ruling as a matter of law that our products do not infringe the ‘403 patent. Business Objects has filed anappeal.
On October 31, 2001, we filed suit against Business Objects, S.A. and its subsidiary, Business ObjectsAmericas, Inc., in the United States District Court for the Eastern District of Virginia, claiming that BusinessObjects’ software infringes two patents held by us relating to asynchronous control of report generation using aweb browser (the ‘033 patent) and a system and method of adapting automatic output of OLAP reports todisparate user output devices (the ‘050 patent). On March 13, 2002, we voluntarily dismissed without prejudiceour lawsuit pending in the Virginia Circuit Court for Fairfax County against the two field employees of BusinessObjects. The complaint against Business Objects was amended to add claims for violations of the federalComputer Fraud and Abuse Act, misappropriation of trade secrets, tortious interference with contractual relationsand violations of the Virginia Conspiracy Act. As a result of pre-trial rulings, certain of these claims were
15
dismissed. Our claims for tortious interference and misappropriation of trade secrets proceeded to trial onOctober 20, 2003. On October 28, 2003, the Court dismissed the tortious interference claim. The Court has yet toissue a ruling on the merits of the misappropriation of trade secrets claim, for which we are seeking variousequitable remedies against Business Objects. In July 2003, the United States Patent & Trademark Officeconfirmed the validity of all the claims in the ‘033 and ‘050 patents and terminated reexamination proceedingsthat Business Objects had requested as to those patents. We agreed to dismissal of the ‘033 patent claims withoutprejudice. Our ‘050 patent claims are currently scheduled to proceed to trial on June 15, 2004. We are seekingmonetary damages and injunctive relief.
Crystal Decisions Litigation
On December 10, 2003, we filed a complaint for patent infringement against Crystal Decisions, Inc. in theUnited States District Court for the District of Delaware. The lawsuit alleges that Crystal Decisions willfullyinfringes three patents issued to us relating to: (i) asynchronous control of report generation using a web browser(the ‘033 patent); (ii) management of an automatic OLAP report broadcast system (the ‘796 patent); and (iii)providing business intelligence web content with reduced client-side processing (the ‘432 patent). We areseeking monetary damages and injunctive relief. Following the filing of the complaint, Crystal Decisions wasacquired by Business Objects Americas, Inc. Business Objects Americas, Inc. has answered the complaint,denying infringement and seeking a declaration that the patents in suit are invalid and not infringed by BusinessObjects Americas, Inc. The case is in its earliest stages. Trial is scheduled for November 2005.
Other Proceedings
We are also involved in other legal proceedings through the normal course of business. Managementbelieves that any unfavorable outcome related to these other proceedings will not have a material effect on ourfinancial position, results of operations or cash flows.
ITEM 4. SUBMISSION OF MATTERS TO A VOTE OF SECURITY HOLDERS
No matters were submitted to a vote of security holders during the fourth quarter of 2003.
16
PART II
ITEM 5. MARKET FOR REGISTRANT’S COMMON STOCK AND RELATED STOCKHOLDERMATTERS
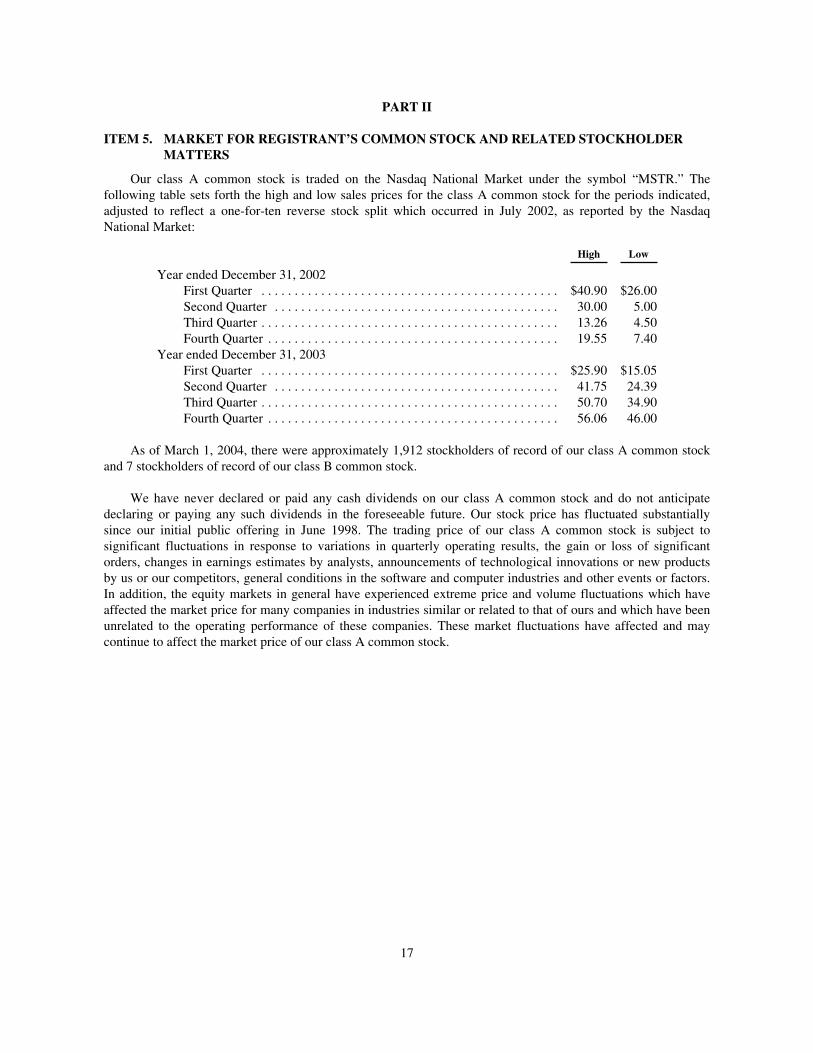
Our class A common stock is traded on the Nasdaq National Market under the symbol “MSTR.” Thefollowing table sets forth the high and low sales prices for the class A common stock for the periods indicated,adjusted to reflect a one-for-ten reverse stock split which occurred in July 2002, as reported by the NasdaqNational Market:
High Low
Year ended December 31, 2002First Quarter . . . . . . . . . . . . . . . . . . . . . . . . . . . . . . . . . . . . . . . . . . . . . $40.90 $26.00Second Quarter . . . . . . . . . . . . . . . . . . . . . . . . . . . . . . . . . . . . . . . . . . . 30.00 5.00Third Quarter . . . . . . . . . . . . . . . . . . . . . . . . . . . . . . . . . . . . . . . . . . . . . 13.26 4.50Fourth Quarter . . . . . . . . . . . . . . . . . . . . . . . . . . . . . . . . . . . . . . . . . . . . 19.55 7.40
Year ended December 31, 2003First Quarter . . . . . . . . . . . . . . . . . . . . . . . . . . . . . . . . . . . . . . . . . . . . . $25.90 $15.05Second Quarter . . . . . . . . . . . . . . . . . . . . . . . . . . . . . . . . . . . . . . . . . . . 41.75 24.39Third Quarter . . . . . . . . . . . . . . . . . . . . . . . . . . . . . . . . . . . . . . . . . . . . . 50.70 34.90Fourth Quarter . . . . . . . . . . . . . . . . . . . . . . . . . . . . . . . . . . . . . . . . . . . . 56.06 46.00
As of March 1, 2004, there were approximately 1,912 stockholders of record of our class A common stockand 7 stockholders of record of our class B common stock.
We have never declared or paid any cash dividends on our class A common stock and do not anticipatedeclaring or paying any such dividends in the foreseeable future. Our stock price has fluctuated substantiallysince our initial public offering in June 1998. The trading price of our class A common stock is subject tosignificant fluctuations in response to variations in quarterly operating results, the gain or loss of significantorders, changes in earnings estimates by analysts, announcements of technological innovations or new productsby us or our competitors, general conditions in the software and computer industries and other events or factors.In addition, the equity markets in general have experienced extreme price and volume fluctuations which haveaffected the market price for many companies in industries similar or related to that of ours and which have beenunrelated to the operating performance of these companies. These market fluctuations have affected and maycontinue to affect the market price of our class A common stock.
17
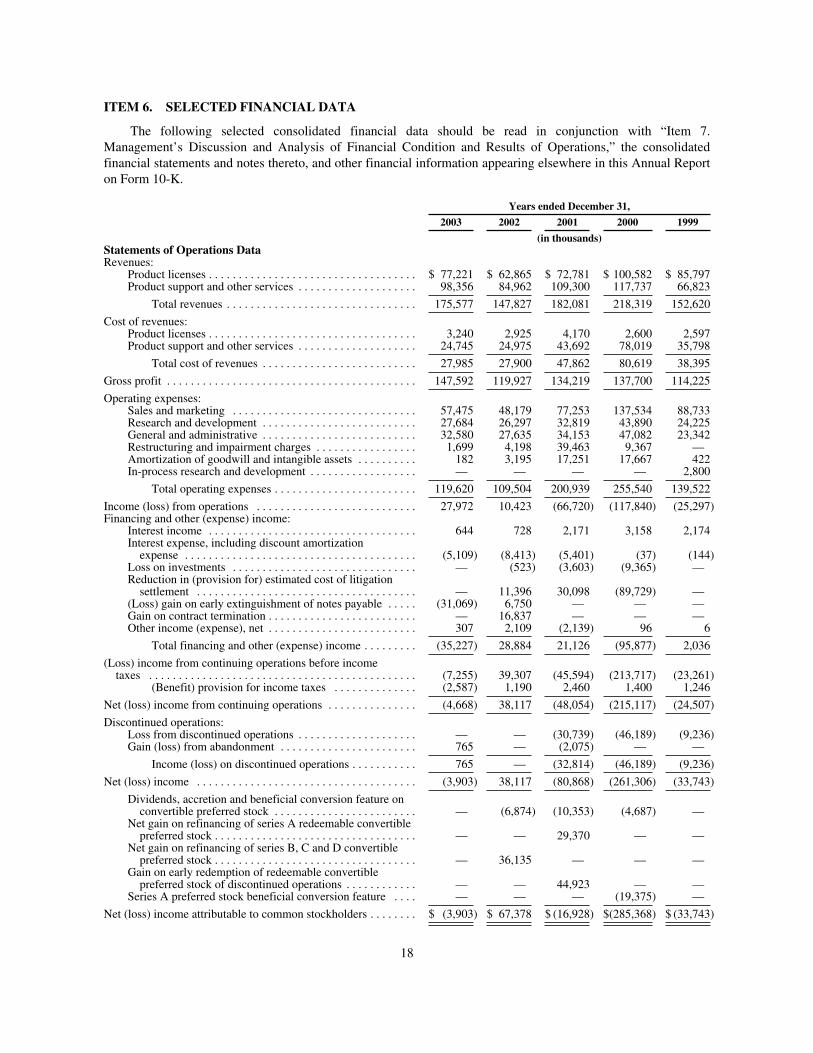
ITEM 6. SELECTED FINANCIAL DATA
The following selected consolidated financial data should be read in conjunction with “Item 7.Management’s Discussion and Analysis of Financial Condition and Results of Operations,” the consolidatedfinancial statements and notes thereto, and other financial information appearing elsewhere in this Annual Reporton Form 10-K.
Years ended December 31,
2003 2002 2001 2000 1999
(in thousands)Statements of Operations DataRevenues:
Product licenses . . . . . . . . . . . . . . . . . . . . . . . . . . . . . . . . . . . $ 77,221 $ 62,865 $ 72,781 $ 100,582 $ 85,797Product support and other services . . . . . . . . . . . . . . . . . . . . 98,356 84,962 109,300 117,737 66,823
Total revenues . . . . . . . . . . . . . . . . . . . . . . . . . . . . . . . . 175,577 147,827 182,081 218,319 152,620
Cost of revenues:Product licenses . . . . . . . . . . . . . . . . . . . . . . . . . . . . . . . . . . . 3,240 2,925 4,170 2,600 2,597Product support and other services . . . . . . . . . . . . . . . . . . . . 24,745 24,975 43,692 78,019 35,798
Total cost of revenues . . . . . . . . . . . . . . . . . . . . . . . . . . 27,985 27,900 47,862 80,619 38,395
Gross profit . . . . . . . . . . . . . . . . . . . . . . . . . . . . . . . . . . . . . . . . . . 147,592 119,927 134,219 137,700 114,225
Operating expenses:Sales and marketing . . . . . . . . . . . . . . . . . . . . . . . . . . . . . . . 57,475 48,179 77,253 137,534 88,733Research and development . . . . . . . . . . . . . . . . . . . . . . . . . . 27,684 26,297 32,819 43,890 24,225General and administrative . . . . . . . . . . . . . . . . . . . . . . . . . . 32,580 27,635 34,153 47,082 23,342Restructuring and impairment charges . . . . . . . . . . . . . . . . . 1,699 4,198 39,463 9,367 —Amortization of goodwill and intangible assets . . . . . . . . . . 182 3,195 17,251 17,667 422In-process research and development . . . . . . . . . . . . . . . . . . — — — — 2,800
Total operating expenses . . . . . . . . . . . . . . . . . . . . . . . . 119,620 109,504 200,939 255,540 139,522
Income (loss) from operations . . . . . . . . . . . . . . . . . . . . . . . . . . . 27,972 10,423 (66,720) (117,840) (25,297)Financing and other (expense) income:
Interest income . . . . . . . . . . . . . . . . . . . . . . . . . . . . . . . . . . . 644 728 2,171 3,158 2,174Interest expense, including discount amortizationexpense . . . . . . . . . . . . . . . . . . . . . . . . . . . . . . . . . . . . . . . (5,109) (8,413) (5,401) (37) (144)
Loss on investments . . . . . . . . . . . . . . . . . . . . . . . . . . . . . . . — (523) (3,603) (9,365) —Reduction in (provision for) estimated cost of litigationsettlement . . . . . . . . . . . . . . . . . . . . . . . . . . . . . . . . . . . . . — 11,396 30,098 (89,729) —
(Loss) gain on early extinguishment of notes payable . . . . . (31,069) 6,750 — — —Gain on contract termination . . . . . . . . . . . . . . . . . . . . . . . . . — 16,837 — — —Other income (expense), net . . . . . . . . . . . . . . . . . . . . . . . . . 307 2,109 (2,139) 96 6
Total financing and other (expense) income . . . . . . . . . (35,227) 28,884 21,126 (95,877) 2,036
(Loss) income from continuing operations before incometaxes . . . . . . . . . . . . . . . . . . . . . . . . . . . . . . . . . . . . . . . . . . . . . (7,255) 39,307 (45,594) (213,717) (23,261)
(Benefit) provision for income taxes . . . . . . . . . . . . . . (2,587) 1,190 2,460 1,400 1,246
Net (loss) income from continuing operations . . . . . . . . . . . . . . . (4,668) 38,117 (48,054) (215,117) (24,507)
Discontinued operations:Loss from discontinued operations . . . . . . . . . . . . . . . . . . . . — — (30,739) (46,189) (9,236)Gain (loss) from abandonment . . . . . . . . . . . . . . . . . . . . . . . 765 — (2,075) — —
Income (loss) on discontinued operations . . . . . . . . . . . 765 — (32,814) (46,189) (9,236)
Net (loss) income . . . . . . . . . . . . . . . . . . . . . . . . . . . . . . . . . . . . . (3,903) 38,117 (80,868) (261,306) (33,743)
Dividends, accretion and beneficial conversion feature onconvertible preferred stock . . . . . . . . . . . . . . . . . . . . . . . . — (6,874) (10,353) (4,687) —
Net gain on refinancing of series A redeemable convertiblepreferred stock . . . . . . . . . . . . . . . . . . . . . . . . . . . . . . . . . . — — 29,370 — —
Net gain on refinancing of series B, C and D convertiblepreferred stock . . . . . . . . . . . . . . . . . . . . . . . . . . . . . . . . . . — 36,135 — — —
Gain on early redemption of redeemable convertiblepreferred stock of discontinued operations . . . . . . . . . . . . — — 44,923 — —
Series A preferred stock beneficial conversion feature . . . . — — — (19,375) —
Net (loss) income attributable to common stockholders . . . . . . . . $ (3,903) $ 67,378 $ (16,928) $(285,368) $ (33,743)
18

Years ended December 31,
2003 2002 2001 2000 1999
(in thousands, except per share data)
Basic (loss) earnings per share(1):Continuing operations . . . . . . . . . . . . . . . . . . . . . . . . . . . . . $ (0.31) $ 3.20 $ (3.35) $(29.98) $ (3.18)Discontinued operations . . . . . . . . . . . . . . . . . . . . . . . . . . . $ 0.05 $ — $ 1.40 $ (5.79) $ (1.20)
Net (loss) income attributable to common stockholders . . $ (0.26) $ 3.20 $ (1.95) $(35.77) $ (4.38)
Weighted average shares outstanding used in computingbasic (loss) earnings per share . . . . . . . . . . . . . . . . . . . . 14,804 11,676 8,659 7,978 7,703
Diluted (loss) earnings per share(1):Continuing operations . . . . . . . . . . . . . . . . . . . . . . . . . . . . . $ (0.31) $ 3.12 $ (3.35) $(29.98) $ (3.18)Discontinued operations . . . . . . . . . . . . . . . . . . . . . . . . . . . $ 0.05 $ — $ 1.40 $ (5.79) $ (1.20)
Net (loss) income attributable to common stockholders . . $ (0.26) $ 3.12 $ (1.95) $(35.77) $ (4.38)
Weighted average shares outstanding used in computingdiluted (loss) earnings per share . . . . . . . . . . . . . . . . . . . 14,804 11,986 8,659 7,978 7,703
As of December 31,
2003 2002 2001 2000 1999
(in thousands)
Balance Sheet DataCash and cash equivalents . . . . . . . . . . . . . . . . . $ 51,882 $ 15,036 $ 38,409 $ 33,203 $ 25,941Restricted cash . . . . . . . . . . . . . . . . . . . . . . . . . . 747 6,173 439 25,884 —Net working capital (deficit)(2) . . . . . . . . . . . . . 27,608 (6,920) (23,179) 44,011 53,109Net assets of discontinued operations . . . . . . . . — — — 42,663 8,218Total assets . . . . . . . . . . . . . . . . . . . . . . . . . . . . . 114,793 79,873 103,632 240,994 203,368Net liabilities of discontinued operations . . . . . . — 1,151 4,479 — 513Long-term liabilities, excluding deferredrevenue and advance payments . . . . . . . . . . . 5,987 51,106 76,444 102,388 —
Series A redeemable convertible preferredstock . . . . . . . . . . . . . . . . . . . . . . . . . . . . . . . . — — 6,385 119,585 —
Series B redeemable convertible preferredstock . . . . . . . . . . . . . . . . . . . . . . . . . . . . . . . . — — 32,343 — —
Series C redeemable convertible preferredstock . . . . . . . . . . . . . . . . . . . . . . . . . . . . . . . . — — 25,937 — —
Series D convertible preferred stock . . . . . . . . . — — 3,985 — —Redeemable convertible preferred stock ofdiscontinued operations . . . . . . . . . . . . . . . . . — — — 40,530 —
Total stockholders’ equity (deficit) . . . . . . . . . . 44,347 (34,509) (138,007) (145,538) 101,816
(1) Share and per share amounts for all periods presented have been adjusted to reflect the one-for-ten reversestock split which occurred in July 2002.
(2) Net working capital (deficit) is equivalent to current assets less current liabilities, including net assets(liabilities) of discontinued operations, deferred revenue and advance payments and contingency fromterminated contract.
19

ITEM 7. MANAGEMENT’S DISCUSSION AND ANALYSIS OF FINANCIAL CONDITION ANDRESULTS OF OPERATIONS
Overview
We are a leading worldwide provider of business intelligence software that enables companies to analyzethe raw data stored across their enterprise to reveal the trends and insights needed to develop solutions to managetheir business effectively. Our software delivers this critical information to workgroups, the enterprise andextranet communities via e-mail, web, fax, wireless and voice communication channels. Businesses can use oursoftware platform to develop user-friendly solutions, proactively optimize revenue-generating strategies, enhancecost-efficiency and productivity and improve customer relationships.
Our software platform, MicroStrategy 7i, enables users to query and analyze the most detailed, transaction-level databases, turning data into business intelligence and delivering reports and alerts about the users’ businessprocesses. Our web-based architecture provides reporting, security, performance and standards that are criticalfor web deployment. With intranet deployments, our products provide employees with information to enablethem to make better, more cost-effective business decisions. With extranet deployments, enterprises can useMicroStrategy 7i to build stronger relationships by linking customers and suppliers via the Internet. We also offera comprehensive set of consulting, education, technical support and technical advisory services for our customersand partners.
Critical Accounting Policies
MicroStrategy’s consolidated financial statements are prepared in conformity with accounting principlesgenerally accepted in the United States of America. For a comprehensive discussion of our accounting policies,see note 2 in the accompanying consolidated financial statements included in Item 15 of this Annual Report onForm 10-K. MicroStrategy does not have any ownership interest in any special purpose entities that are notwholly-owned and consolidated subsidiaries of MicroStrategy. Additionally, MicroStrategy does not have anymaterial related party transactions as defined under Statement of Financial Accounting Standards (“SFAS”) No.57, “Related Party Disclosures.”
The preparation of our consolidated financial statements requires us to make estimates and judgments thataffect the reported amounts of assets, liabilities and equity and disclosure of contingent assets and liabilities atthe date of the financial statements and the reported amounts of revenues and expenses during the reportingperiod. These estimates and judgments, particularly relating to revenue recognition, restructuring and impairmentcharges and litigation and contingencies, have a material impact on our financial statements, and are discussed indetail throughout our analysis of the results of operations as discussed below.
In addition to evaluating estimates relating to the items discussed above, we also consider other estimates,including, but not limited to, those related to allowance for doubtful accounts, software development costs,intangible assets, income taxes and financing operations. We base our estimates on historical experience and onvarious other assumptions that we believe are reasonable under the circumstances, the results of which form thebasis for making judgments about the carrying value of assets, liabilities and equity that are not readily apparentfrom other sources. Actual results and outcomes could differ from these estimates and assumptions. Additionalinformation regarding risk factors that may impact our estimates is included below under “Risk Factors”.
We apply the following critical accounting policies in the preparation of our consolidated financialstatements:
Revenue Recognition. MicroStrategy’s software revenue recognition policies are in accordance with theAmerican Institute of Certified Public Accountant’s Statement of Position (“SOP”) 97-2, “Software RevenueRecognition,” as amended. In the case of software arrangements that require significant production, modification,or customization of software, we follow the guidance in SOP 81-1, “Accounting for Performance ofConstruction-Type and Certain Production-Type Contracts.” We also follow the guidance provided by SEC Staff
20
Accounting Bulletin (“SAB”) No. 101, “Revenue Recognition in Financial Statements,” and SAB No. 104,“Revenue Recognition” which provide guidance on the recognition, presentation and disclosure of revenue in thefinancial statements filed with the SEC.
We recognize revenue from sales of software licenses to end users or resellers upon persuasive evidence ofan arrangement, as provided by agreements or contracts executed by both parties, delivery of the software anddetermination that collection of a fixed or determinable fee is reasonably assured. When the fees for softwareupgrades and enhancements, technical support, consulting and education are bundled with the license fee, theyare unbundled using our objective evidence of the fair value of the elements represented by our customarypricing for each element in separate transactions. If such evidence of fair value exists for all undelivered elementsand there is no such evidence of fair value established for delivered elements, revenue is first allocated to theelements where evidence of fair value has been established and the residual amount is allocated to the deliveredelements. If evidence of fair value for any undelivered element of an arrangement does not exist, all revenuefrom the arrangement is deferred until such time that evidence of fair value exists for undelivered elements oruntil all elements of the arrangement are delivered, subject to certain limited exceptions set forth in SOP 97-2.
When a software license arrangement requires us to provide significant production, customization ormodification of the software, or when the customer considers these services essential to the functionality of thesoftware product, both the product license revenue and consulting services revenue are recognized using thepercentage of completion method. Under percentage of completion accounting, both product license andconsulting services revenue are recognized as work progresses based upon labor hours incurred. Any expectedlosses on contracts in progress are expensed in the period in which the losses become probable and reasonablyestimable. Contracts accounted for under the percentage of completion method were immaterial for the yearsended December 31, 2003 and 2002. For the year ended December 31, 2001, contracts accounted for under thepercentage of completion method represented approximately 7.8% of total revenues.
If an arrangement includes acceptance criteria, revenue is not recognized until we can objectivelydemonstrate that the software or service can meet the acceptance criteria, or the acceptance period lapses,whichever occurs earlier. If a software license arrangement obligates us to deliver specified future products orupgrades, the revenue is recognized when the specified future product or upgrades are delivered, or when theobligation to deliver specified future products expires, whichever occurs earlier. If a software licensearrangement obligates us to deliver unspecified future products, then revenue is recognized on the subscriptionbasis, ratably over the term of the contract.
License revenue derived from sales to resellers or OEM’s who purchase our products for future resale isrecognized upon sufficient evidence that the products have been sold to the ultimate end users provided all otherrevenue recognition criteria have been met.
Technical support revenue, included in product support and other services revenue, is derived fromproviding technical support and software updates and upgrades to customers. Technical support revenue isrecognized ratably over the term of the contract, which in most cases is one year. Revenue from consulting andeducation services is recognized as the services are performed.
Amounts collected prior to satisfying the above revenue recognition criteria are included in deferred revenueand advance payments in the accompanying consolidated balance sheets.
The application of SOP 97-2, as amended, requires judgment, including a determination that collectibility isreasonably assured, the fee is fixed and determinable and whether a software arrangement includes multipleelements, and if so, whether vendor-specific objective evidence of fair value exists for those elements. Judgmentis also required to assess whether future releases of certain software represent new products or upgrades andenhancements to existing products. MicroStrategy’s ability to enter into revenue generating transactions andrecognize revenue in the future is subject to a number of business and economic risks discussed below under“Risk Factors.”
21

Restructuring and Impairment Charges. Restructuring and impairment charges have been recorded inaccordance with Emerging Issues Task Force (“EITF”) Issue No. 94-3, “Liability Recognition for CertainEmployee Termination Benefits and Other Costs to Exit an Activity (including Certain Costs Incurred in aRestructuring)” and SFAS No. 144, “Accounting for the Impairment or Disposal of Long-Lived Assets.” Indetermining the costs associated with real estate lease losses from exiting facilities, management was required tomake judgments and estimates which significantly impacted the recorded amount of restructuring andimpairment charges. The real estate lease losses included estimates of sublease commission costs, sub-tenantconcession costs, sublease rental income and the expected length of time to sublease idle space. Final resultscould substantially differ from current estimates if we are unable to sublet the remaining vacant office space onthe estimated terms.
Litigation and Contingencies. We are subject to the possibility of various loss contingencies arising in theordinary course of business. We consider the likelihood of loss or impairment of an asset or the incurrence of aliability, as well as our ability to reasonably estimate the amount of loss in determining loss contingencies. Anestimated loss contingency is accrued when it is probable that an asset has been impaired or a liability has beenincurred and the amount of loss can be reasonably estimated. We regularly evaluate current information availableto us to determine whether such accruals should be adjusted.
We are involved in lawsuits with Business Objects, S.A. and Business Objects Americas, Inc. relating toclaims involving patent infringement and other intellectual property claims. The outcome of this litigation is notpresently determinable, and as such, we are currently unable to estimate the potential range of gain or loss, if any,relating to these actions. Accordingly, no provision for these matters has been made in the accompanyingconsolidated financial statements. Additional information regarding these matters is included below under “RiskFactors.”
We are also involved in a lawsuit with ePlus Group, Inc. relating to a claim by ePlus involving breach ofcontract. Although the ultimate outcome of this litigation is uncertain, we believe that the litigation will not havea material adverse effect on our financial position or results of operations.
Allowance for Doubtful Accounts. We maintain an allowance for doubtful accounts based on ourassessment of the collectibility of specific customer accounts and the aging of our accounts receivable. If therewere a deterioration in the financial condition of our customers, or actual defaults were higher than our historicalexperience, our estimates of the recoverability of amounts due to us could be overstated, which could have anadverse impact of our revenues and operations.
Software Development Costs. We account for software development costs in accordance with SFAS No.86, “Accounting for the Costs of Computer Software to Be Sold, Leased, or Otherwise Marketed.” SFAS No. 86specifies that software development costs incurred internally should be expensed as incurred until technologicalfeasibility has been established. Once technological feasibility has been established, all software developmentcosts should be capitalized until the product is available for general release to customers. Judgment is required indetermining when the technological feasibility of a product is established. We consider technological feasibilityto be achieved when a product design and working model of the software product have been completed.
Deferred Taxes. We record a valuation allowance to reduce our deferred tax assets to the amount that ismore likely than not to be realized. While we have considered future taxable income and ongoing prudent andfeasible tax planning strategies in assessing the need for a valuation allowance, if we were to subsequentlydetermine that we would be able to realize deferred tax assets in the future in excess of our net recorded amount,an adjustment to deferred tax assets would increase income in the period such determination was made.Similarly, should we determine that we would not be able to realize all or part of net deferred tax assets in thefuture, an adjustment to deferred tax assets would reduce income in the period such determination was made. Indetermining net deferred tax assets and valuation allowances, management is required to make judgments andestimates related to projections of domestic and foreign profitability, the timing and extent of the utilization ofnet operating loss carryforwards, applicable tax rates, transfer pricing methodologies and prudent and feasible taxplanning strategies.
22
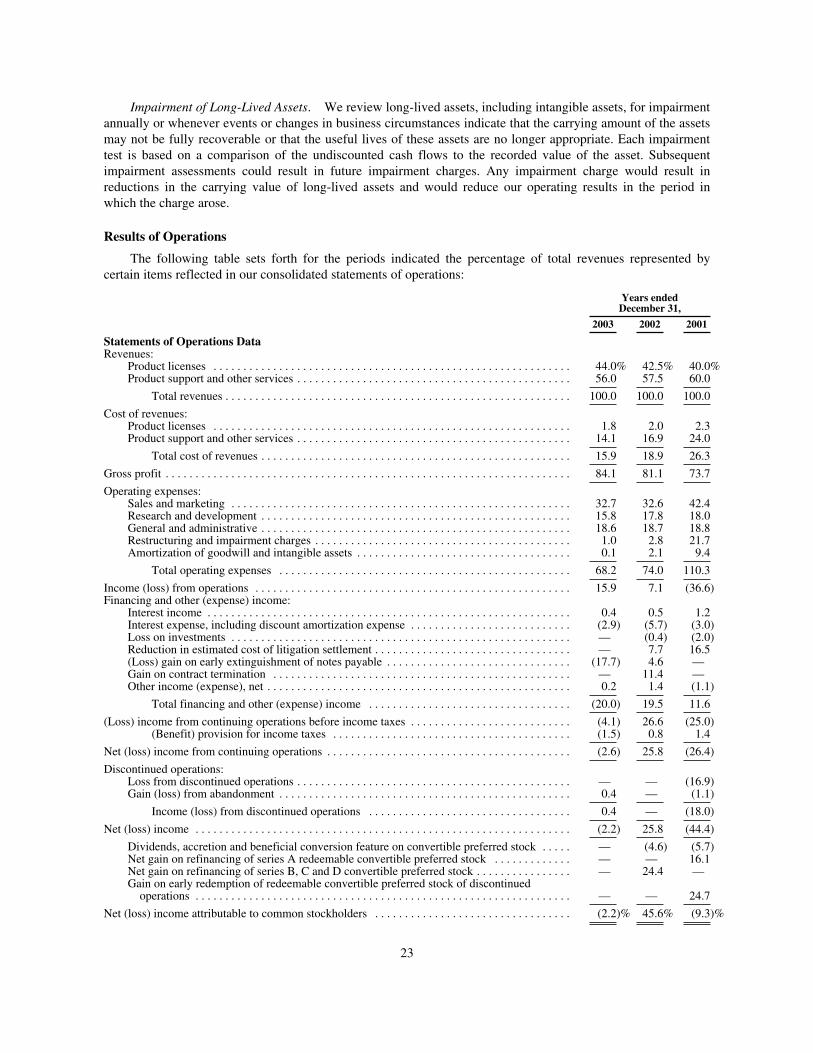
Impairment of Long-Lived Assets. We review long-lived assets, including intangible assets, for impairmentannually or whenever events or changes in business circumstances indicate that the carrying amount of the assetsmay not be fully recoverable or that the useful lives of these assets are no longer appropriate. Each impairmenttest is based on a comparison of the undiscounted cash flows to the recorded value of the asset. Subsequentimpairment assessments could result in future impairment charges. Any impairment charge would result inreductions in the carrying value of long-lived assets and would reduce our operating results in the period inwhich the charge arose.
Results of Operations
The following table sets forth for the periods indicated the percentage of total revenues represented bycertain items reflected in our consolidated statements of operations:
Years endedDecember 31,
2003 2002 2001
Statements of Operations DataRevenues:
Product licenses . . . . . . . . . . . . . . . . . . . . . . . . . . . . . . . . . . . . . . . . . . . . . . . . . . . . . . . . . . . . 44.0% 42.5% 40.0%Product support and other services . . . . . . . . . . . . . . . . . . . . . . . . . . . . . . . . . . . . . . . . . . . . . . 56.0 57.5 60.0
Total revenues . . . . . . . . . . . . . . . . . . . . . . . . . . . . . . . . . . . . . . . . . . . . . . . . . . . . . . . . . . 100.0 100.0 100.0
Cost of revenues:Product licenses . . . . . . . . . . . . . . . . . . . . . . . . . . . . . . . . . . . . . . . . . . . . . . . . . . . . . . . . . . . . 1.8 2.0 2.3Product support and other services . . . . . . . . . . . . . . . . . . . . . . . . . . . . . . . . . . . . . . . . . . . . . . 14.1 16.9 24.0
Total cost of revenues . . . . . . . . . . . . . . . . . . . . . . . . . . . . . . . . . . . . . . . . . . . . . . . . . . . . 15.9 18.9 26.3
Gross profit . . . . . . . . . . . . . . . . . . . . . . . . . . . . . . . . . . . . . . . . . . . . . . . . . . . . . . . . . . . . . . . . . . . . 84.1 81.1 73.7
Operating expenses:Sales and marketing . . . . . . . . . . . . . . . . . . . . . . . . . . . . . . . . . . . . . . . . . . . . . . . . . . . . . . . . . 32.7 32.6 42.4Research and development . . . . . . . . . . . . . . . . . . . . . . . . . . . . . . . . . . . . . . . . . . . . . . . . . . . . 15.8 17.8 18.0General and administrative . . . . . . . . . . . . . . . . . . . . . . . . . . . . . . . . . . . . . . . . . . . . . . . . . . . . 18.6 18.7 18.8Restructuring and impairment charges . . . . . . . . . . . . . . . . . . . . . . . . . . . . . . . . . . . . . . . . . . . 1.0 2.8 21.7Amortization of goodwill and intangible assets . . . . . . . . . . . . . . . . . . . . . . . . . . . . . . . . . . . . 0.1 2.1 9.4
Total operating expenses . . . . . . . . . . . . . . . . . . . . . . . . . . . . . . . . . . . . . . . . . . . . . . . . . 68.2 74.0 110.3
Income (loss) from operations . . . . . . . . . . . . . . . . . . . . . . . . . . . . . . . . . . . . . . . . . . . . . . . . . . . . . 15.9 7.1 (36.6)Financing and other (expense) income:
Interest income . . . . . . . . . . . . . . . . . . . . . . . . . . . . . . . . . . . . . . . . . . . . . . . . . . . . . . . . . . . . . 0.4 0.5 1.2Interest expense, including discount amortization expense . . . . . . . . . . . . . . . . . . . . . . . . . . . (2.9) (5.7) (3.0)Loss on investments . . . . . . . . . . . . . . . . . . . . . . . . . . . . . . . . . . . . . . . . . . . . . . . . . . . . . . . . . — (0.4) (2.0)Reduction in estimated cost of litigation settlement . . . . . . . . . . . . . . . . . . . . . . . . . . . . . . . . . — 7.7 16.5(Loss) gain on early extinguishment of notes payable . . . . . . . . . . . . . . . . . . . . . . . . . . . . . . . (17.7) 4.6 —Gain on contract termination . . . . . . . . . . . . . . . . . . . . . . . . . . . . . . . . . . . . . . . . . . . . . . . . . . — 11.4 —Other income (expense), net . . . . . . . . . . . . . . . . . . . . . . . . . . . . . . . . . . . . . . . . . . . . . . . . . . . 0.2 1.4 (1.1)
Total financing and other (expense) income . . . . . . . . . . . . . . . . . . . . . . . . . . . . . . . . . . (20.0) 19.5 11.6
(Loss) income from continuing operations before income taxes . . . . . . . . . . . . . . . . . . . . . . . . . . . (4.1) 26.6 (25.0)(Benefit) provision for income taxes . . . . . . . . . . . . . . . . . . . . . . . . . . . . . . . . . . . . . . . . (1.5) 0.8 1.4
Net (loss) income from continuing operations . . . . . . . . . . . . . . . . . . . . . . . . . . . . . . . . . . . . . . . . . (2.6) 25.8 (26.4)
Discontinued operations:Loss from discontinued operations . . . . . . . . . . . . . . . . . . . . . . . . . . . . . . . . . . . . . . . . . . . . . . — — (16.9)Gain (loss) from abandonment . . . . . . . . . . . . . . . . . . . . . . . . . . . . . . . . . . . . . . . . . . . . . . . . . 0.4 — (1.1)
Income (loss) from discontinued operations . . . . . . . . . . . . . . . . . . . . . . . . . . . . . . . . . . 0.4 — (18.0)
Net (loss) income . . . . . . . . . . . . . . . . . . . . . . . . . . . . . . . . . . . . . . . . . . . . . . . . . . . . . . . . . . . . . . . (2.2) 25.8 (44.4)
Dividends, accretion and beneficial conversion feature on convertible preferred stock . . . . . — (4.6) (5.7)Net gain on refinancing of series A redeemable convertible preferred stock . . . . . . . . . . . . . — — 16.1Net gain on refinancing of series B, C and D convertible preferred stock . . . . . . . . . . . . . . . . — 24.4 —Gain on early redemption of redeemable convertible preferred stock of discontinuedoperations . . . . . . . . . . . . . . . . . . . . . . . . . . . . . . . . . . . . . . . . . . . . . . . . . . . . . . . . . . . . . . . — — 24.7
Net (loss) income attributable to common stockholders . . . . . . . . . . . . . . . . . . . . . . . . . . . . . . . . . (2.2)% 45.6% (9.3)%
23
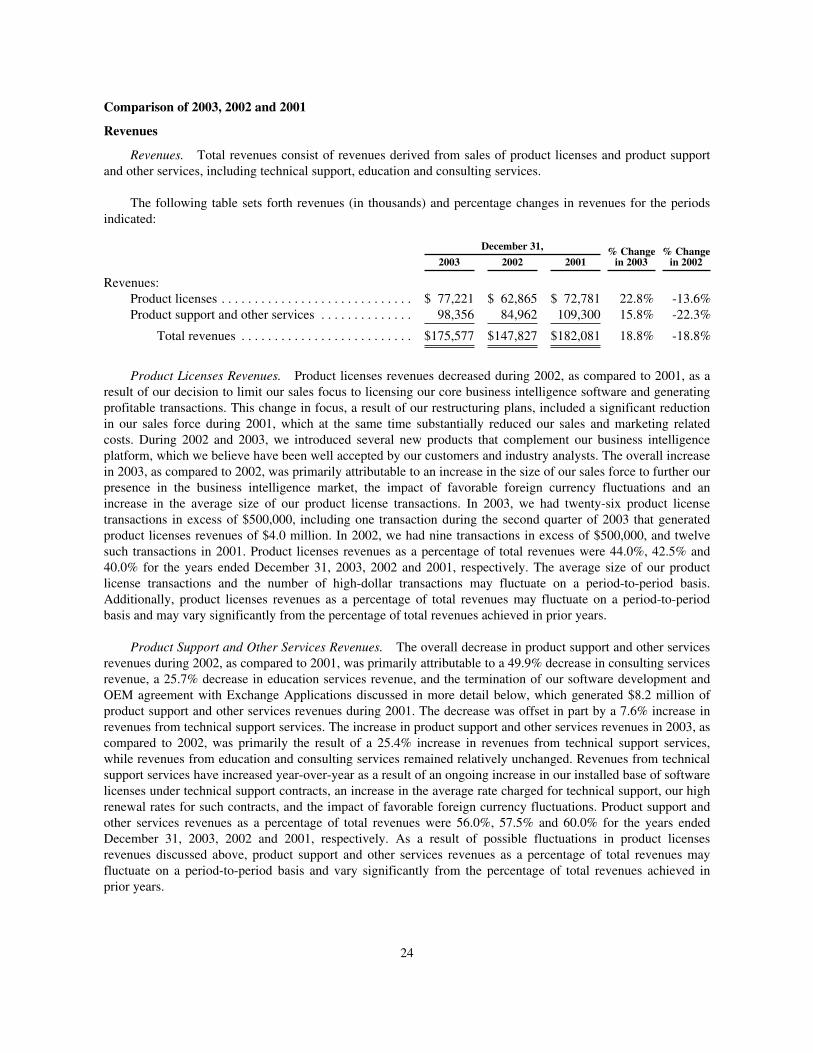
Comparison of 2003, 2002 and 2001
Revenues
Revenues. Total revenues consist of revenues derived from sales of product licenses and product supportand other services, including technical support, education and consulting services.
The following table sets forth revenues (in thousands) and percentage changes in revenues for the periodsindicated:
December 31, % Changein 2003
% Changein 20022003 2002 2001
Revenues:Product licenses . . . . . . . . . . . . . . . . . . . . . . . . . . . . . $ 77,221 $ 62,865 $ 72,781 22.8% -13.6%Product support and other services . . . . . . . . . . . . . . 98,356 84,962 109,300 15.8% -22.3%
Total revenues . . . . . . . . . . . . . . . . . . . . . . . . . . $175,577 $147,827 $182,081 18.8% -18.8%
Product Licenses Revenues. Product licenses revenues decreased during 2002, as compared to 2001, as aresult of our decision to limit our sales focus to licensing our core business intelligence software and generatingprofitable transactions. This change in focus, a result of our restructuring plans, included a significant reductionin our sales force during 2001, which at the same time substantially reduced our sales and marketing relatedcosts. During 2002 and 2003, we introduced several new products that complement our business intelligenceplatform, which we believe have been well accepted by our customers and industry analysts. The overall increasein 2003, as compared to 2002, was primarily attributable to an increase in the size of our sales force to further ourpresence in the business intelligence market, the impact of favorable foreign currency fluctuations and anincrease in the average size of our product license transactions. In 2003, we had twenty-six product licensetransactions in excess of $500,000, including one transaction during the second quarter of 2003 that generatedproduct licenses revenues of $4.0 million. In 2002, we had nine transactions in excess of $500,000, and twelvesuch transactions in 2001. Product licenses revenues as a percentage of total revenues were 44.0%, 42.5% and40.0% for the years ended December 31, 2003, 2002 and 2001, respectively. The average size of our productlicense transactions and the number of high-dollar transactions may fluctuate on a period-to-period basis.Additionally, product licenses revenues as a percentage of total revenues may fluctuate on a period-to-periodbasis and may vary significantly from the percentage of total revenues achieved in prior years.
Product Support and Other Services Revenues. The overall decrease in product support and other servicesrevenues during 2002, as compared to 2001, was primarily attributable to a 49.9% decrease in consulting servicesrevenue, a 25.7% decrease in education services revenue, and the termination of our software development andOEM agreement with Exchange Applications discussed in more detail below, which generated $8.2 million ofproduct support and other services revenues during 2001. The decrease was offset in part by a 7.6% increase inrevenues from technical support services. The increase in product support and other services revenues in 2003, ascompared to 2002, was primarily the result of a 25.4% increase in revenues from technical support services,while revenues from education and consulting services remained relatively unchanged. Revenues from technicalsupport services have increased year-over-year as a result of an ongoing increase in our installed base of softwarelicenses under technical support contracts, an increase in the average rate charged for technical support, our highrenewal rates for such contracts, and the impact of favorable foreign currency fluctuations. Product support andother services revenues as a percentage of total revenues were 56.0%, 57.5% and 60.0% for the years endedDecember 31, 2003, 2002 and 2001, respectively. As a result of possible fluctuations in product licensesrevenues discussed above, product support and other services revenues as a percentage of total revenues mayfluctuate on a period-to-period basis and vary significantly from the percentage of total revenues achieved inprior years.
24
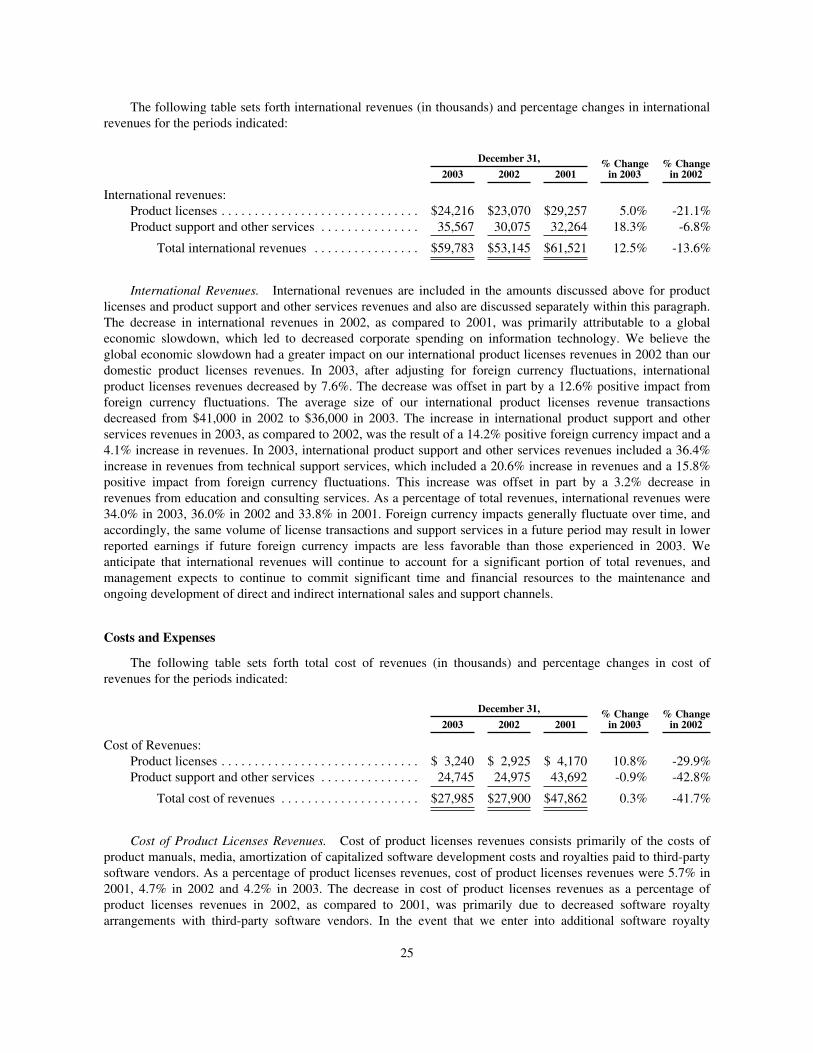
The following table sets forth international revenues (in thousands) and percentage changes in internationalrevenues for the periods indicated:
December 31, % Changein 2003
% Changein 20022003 2002 2001
International revenues:Product licenses . . . . . . . . . . . . . . . . . . . . . . . . . . . . . . $24,216 $23,070 $29,257 5.0% -21.1%Product support and other services . . . . . . . . . . . . . . . 35,567 30,075 32,264 18.3% -6.8%
Total international revenues . . . . . . . . . . . . . . . . $59,783 $53,145 $61,521 12.5% -13.6%
International Revenues. International revenues are included in the amounts discussed above for productlicenses and product support and other services revenues and also are discussed separately within this paragraph.The decrease in international revenues in 2002, as compared to 2001, was primarily attributable to a globaleconomic slowdown, which led to decreased corporate spending on information technology. We believe theglobal economic slowdown had a greater impact on our international product licenses revenues in 2002 than ourdomestic product licenses revenues. In 2003, after adjusting for foreign currency fluctuations, internationalproduct licenses revenues decreased by 7.6%. The decrease was offset in part by a 12.6% positive impact fromforeign currency fluctuations. The average size of our international product licenses revenue transactionsdecreased from $41,000 in 2002 to $36,000 in 2003. The increase in international product support and otherservices revenues in 2003, as compared to 2002, was the result of a 14.2% positive foreign currency impact and a4.1% increase in revenues. In 2003, international product support and other services revenues included a 36.4%increase in revenues from technical support services, which included a 20.6% increase in revenues and a 15.8%positive impact from foreign currency fluctuations. This increase was offset in part by a 3.2% decrease inrevenues from education and consulting services. As a percentage of total revenues, international revenues were34.0% in 2003, 36.0% in 2002 and 33.8% in 2001. Foreign currency impacts generally fluctuate over time, andaccordingly, the same volume of license transactions and support services in a future period may result in lowerreported earnings if future foreign currency impacts are less favorable than those experienced in 2003. Weanticipate that international revenues will continue to account for a significant portion of total revenues, andmanagement expects to continue to commit significant time and financial resources to the maintenance andongoing development of direct and indirect international sales and support channels.
Costs and Expenses
The following table sets forth total cost of revenues (in thousands) and percentage changes in cost ofrevenues for the periods indicated:
December 31, % Changein 2003
% Changein 20022003 2002 2001
Cost of Revenues:Product licenses . . . . . . . . . . . . . . . . . . . . . . . . . . . . . . $ 3,240 $ 2,925 $ 4,170 10.8% -29.9%Product support and other services . . . . . . . . . . . . . . . 24,745 24,975 43,692 -0.9% -42.8%
Total cost of revenues . . . . . . . . . . . . . . . . . . . . . $27,985 $27,900 $47,862 0.3% -41.7%
Cost of Product Licenses Revenues. Cost of product licenses revenues consists primarily of the costs ofproduct manuals, media, amortization of capitalized software development costs and royalties paid to third-partysoftware vendors. As a percentage of product licenses revenues, cost of product licenses revenues were 5.7% in2001, 4.7% in 2002 and 4.2% in 2003. The decrease in cost of product licenses revenues as a percentage ofproduct licenses revenues in 2002, as compared to 2001, was primarily due to decreased software royaltyarrangements with third-party software vendors. In the event that we enter into additional software royalty
25
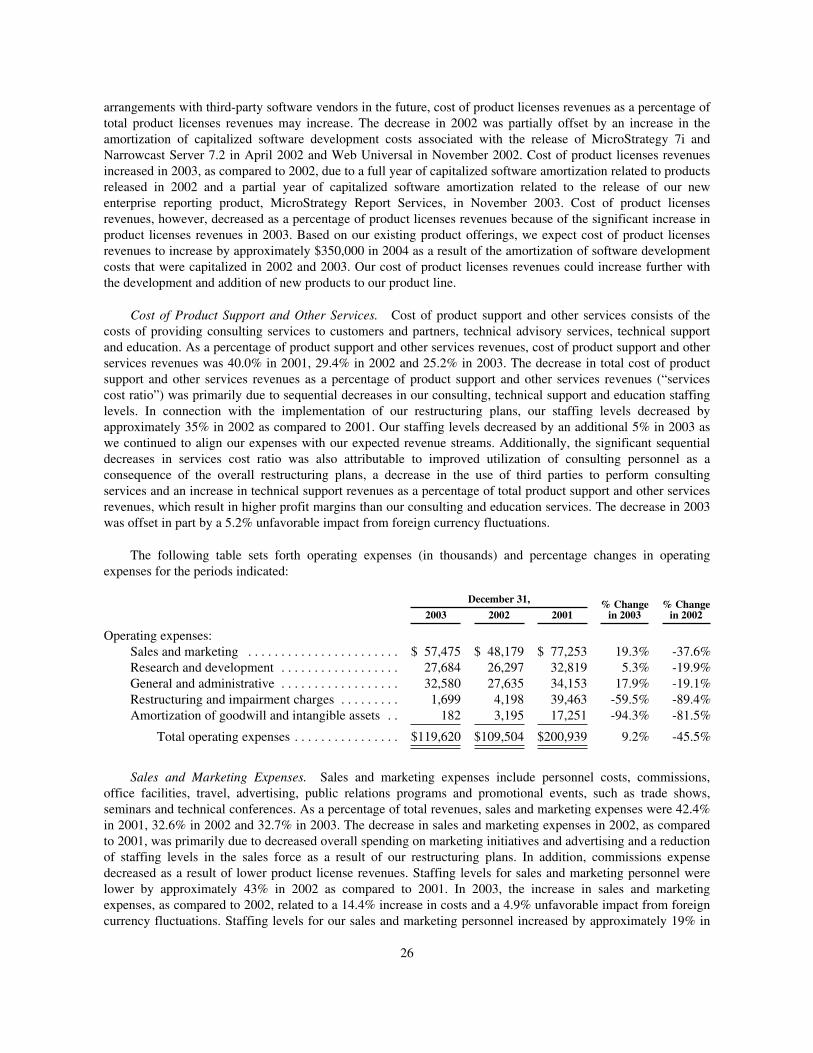
arrangements with third-party software vendors in the future, cost of product licenses revenues as a percentage oftotal product licenses revenues may increase. The decrease in 2002 was partially offset by an increase in theamortization of capitalized software development costs associated with the release of MicroStrategy 7i andNarrowcast Server 7.2 in April 2002 and Web Universal in November 2002. Cost of product licenses revenuesincreased in 2003, as compared to 2002, due to a full year of capitalized software amortization related to productsreleased in 2002 and a partial year of capitalized software amortization related to the release of our newenterprise reporting product, MicroStrategy Report Services, in November 2003. Cost of product licensesrevenues, however, decreased as a percentage of product licenses revenues because of the significant increase inproduct licenses revenues in 2003. Based on our existing product offerings, we expect cost of product licensesrevenues to increase by approximately $350,000 in 2004 as a result of the amortization of software developmentcosts that were capitalized in 2002 and 2003. Our cost of product licenses revenues could increase further withthe development and addition of new products to our product line.
Cost of Product Support and Other Services. Cost of product support and other services consists of thecosts of providing consulting services to customers and partners, technical advisory services, technical supportand education. As a percentage of product support and other services revenues, cost of product support and otherservices revenues was 40.0% in 2001, 29.4% in 2002 and 25.2% in 2003. The decrease in total cost of productsupport and other services revenues as a percentage of product support and other services revenues (“servicescost ratio”) was primarily due to sequential decreases in our consulting, technical support and education staffinglevels. In connection with the implementation of our restructuring plans, our staffing levels decreased byapproximately 35% in 2002 as compared to 2001. Our staffing levels decreased by an additional 5% in 2003 aswe continued to align our expenses with our expected revenue streams. Additionally, the significant sequentialdecreases in services cost ratio was also attributable to improved utilization of consulting personnel as aconsequence of the overall restructuring plans, a decrease in the use of third parties to perform consultingservices and an increase in technical support revenues as a percentage of total product support and other servicesrevenues, which result in higher profit margins than our consulting and education services. The decrease in 2003was offset in part by a 5.2% unfavorable impact from foreign currency fluctuations.
The following table sets forth operating expenses (in thousands) and percentage changes in operatingexpenses for the periods indicated:
December 31, % Changein 2003
% Changein 20022003 2002 2001
Operating expenses:Sales and marketing . . . . . . . . . . . . . . . . . . . . . . . $ 57,475 $ 48,179 $ 77,253 19.3% -37.6%Research and development . . . . . . . . . . . . . . . . . . 27,684 26,297 32,819 5.3% -19.9%General and administrative . . . . . . . . . . . . . . . . . . 32,580 27,635 34,153 17.9% -19.1%Restructuring and impairment charges . . . . . . . . . 1,699 4,198 39,463 -59.5% -89.4%Amortization of goodwill and intangible assets . . 182 3,195 17,251 -94.3% -81.5%
Total operating expenses . . . . . . . . . . . . . . . . $119,620 $109,504 $200,939 9.2% -45.5%
Sales and Marketing Expenses. Sales and marketing expenses include personnel costs, commissions,office facilities, travel, advertising, public relations programs and promotional events, such as trade shows,seminars and technical conferences. As a percentage of total revenues, sales and marketing expenses were 42.4%in 2001, 32.6% in 2002 and 32.7% in 2003. The decrease in sales and marketing expenses in 2002, as comparedto 2001, was primarily due to decreased overall spending on marketing initiatives and advertising and a reductionof staffing levels in the sales force as a result of our restructuring plans. In addition, commissions expensedecreased as a result of lower product license revenues. Staffing levels for sales and marketing personnel werelower by approximately 43% in 2002 as compared to 2001. In 2003, the increase in sales and marketingexpenses, as compared to 2002, related to a 14.4% increase in costs and a 4.9% unfavorable impact from foreigncurrency fluctuations. Staffing levels for our sales and marketing personnel increased by approximately 19% in
26
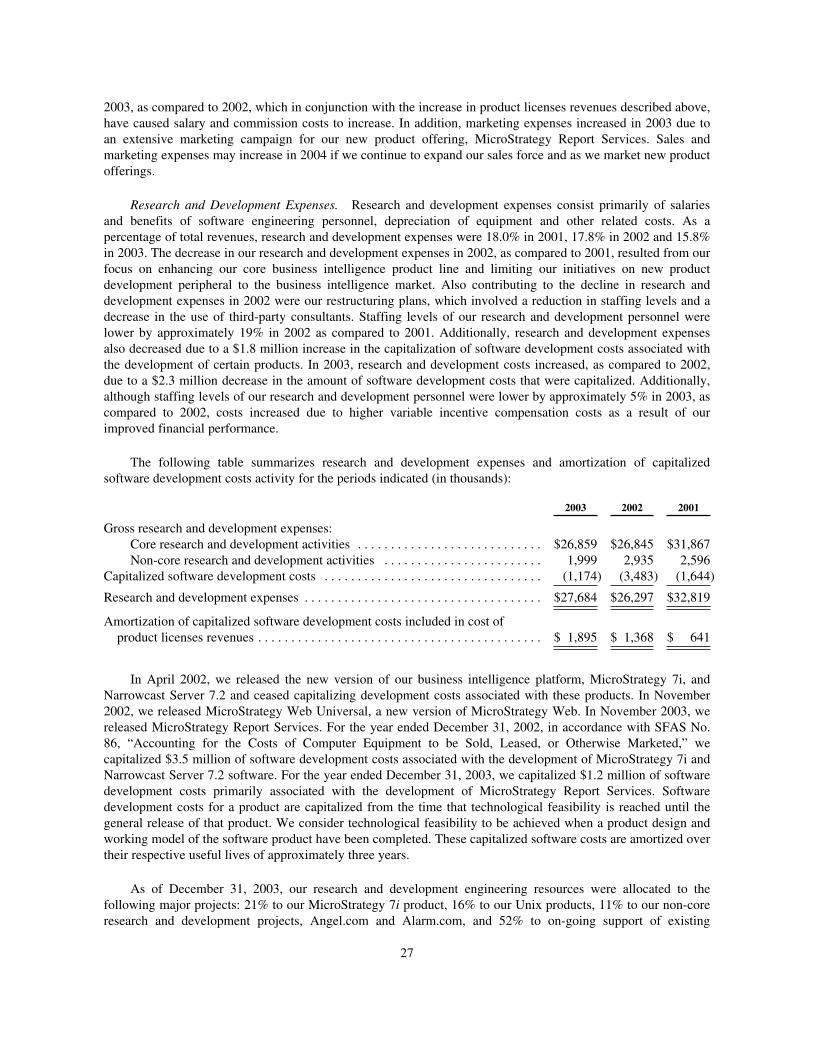
2003, as compared to 2002, which in conjunction with the increase in product licenses revenues described above,have caused salary and commission costs to increase. In addition, marketing expenses increased in 2003 due toan extensive marketing campaign for our new product offering, MicroStrategy Report Services. Sales andmarketing expenses may increase in 2004 if we continue to expand our sales force and as we market new productofferings.
Research and Development Expenses. Research and development expenses consist primarily of salariesand benefits of software engineering personnel, depreciation of equipment and other related costs. As apercentage of total revenues, research and development expenses were 18.0% in 2001, 17.8% in 2002 and 15.8%in 2003. The decrease in our research and development expenses in 2002, as compared to 2001, resulted from ourfocus on enhancing our core business intelligence product line and limiting our initiatives on new productdevelopment peripheral to the business intelligence market. Also contributing to the decline in research anddevelopment expenses in 2002 were our restructuring plans, which involved a reduction in staffing levels and adecrease in the use of third-party consultants. Staffing levels of our research and development personnel werelower by approximately 19% in 2002 as compared to 2001. Additionally, research and development expensesalso decreased due to a $1.8 million increase in the capitalization of software development costs associated withthe development of certain products. In 2003, research and development costs increased, as compared to 2002,due to a $2.3 million decrease in the amount of software development costs that were capitalized. Additionally,although staffing levels of our research and development personnel were lower by approximately 5% in 2003, ascompared to 2002, costs increased due to higher variable incentive compensation costs as a result of ourimproved financial performance.
The following table summarizes research and development expenses and amortization of capitalizedsoftware development costs activity for the periods indicated (in thousands):
2003 2002 2001
Gross research and development expenses:Core research and development activities . . . . . . . . . . . . . . . . . . . . . . . . . . . . $26,859 $26,845 $31,867Non-core research and development activities . . . . . . . . . . . . . . . . . . . . . . . . 1,999 2,935 2,596
Capitalized software development costs . . . . . . . . . . . . . . . . . . . . . . . . . . . . . . . . . (1,174) (3,483) (1,644)
Research and development expenses . . . . . . . . . . . . . . . . . . . . . . . . . . . . . . . . . . . . $27,684 $26,297 $32,819
Amortization of capitalized software development costs included in cost ofproduct licenses revenues . . . . . . . . . . . . . . . . . . . . . . . . . . . . . . . . . . . . . . . . . . . $ 1,895 $ 1,368 $ 641
In April 2002, we released the new version of our business intelligence platform, MicroStrategy 7i, andNarrowcast Server 7.2 and ceased capitalizing development costs associated with these products. In November2002, we released MicroStrategy Web Universal, a new version of MicroStrategy Web. In November 2003, wereleased MicroStrategy Report Services. For the year ended December 31, 2002, in accordance with SFAS No.86, “Accounting for the Costs of Computer Equipment to be Sold, Leased, or Otherwise Marketed,” wecapitalized $3.5 million of software development costs associated with the development of MicroStrategy 7i andNarrowcast Server 7.2 software. For the year ended December 31, 2003, we capitalized $1.2 million of softwaredevelopment costs primarily associated with the development of MicroStrategy Report Services. Softwaredevelopment costs for a product are capitalized from the time that technological feasibility is reached until thegeneral release of that product. We consider technological feasibility to be achieved when a product design andworking model of the software product have been completed. These capitalized software costs are amortized overtheir respective useful lives of approximately three years.
As of December 31, 2003, our research and development engineering resources were allocated to thefollowing major projects: 21% to our MicroStrategy 7i product, 16% to our Unix products, 11% to our non-coreresearch and development projects, Angel.com and Alarm.com, and 52% to on-going support of existing
27

products and other research and development efforts. The allocation of our research and development resourcesis expected to change as project development efforts require, as current projects are completed and as newprojects commence.
General and Administrative Expenses. General and administrative expenses include personnel and othercosts of our finance, human resources, information systems, administrative and executive departments as well asthird-party consulting, legal and other professional fees. The decrease in general and administrative expenses in2002, as compared to 2001, was primarily due to a reduction in staffing levels and office occupancy costs as aresult of the restructuring plans and a reduction in recruiting efforts. Staffing levels of our general andadministrative personnel decreased by 26% in 2002 as compared to 2001. The decrease in 2002 was offset in partby an increase in the use of external legal and professional services related to the Business Objects litigation aswell as certain other matters. We incurred expenses of $3.6 million in 2002 for external legal and consulting feesrelated to the Business Objects litigation. In 2003, general and administrative expenses increased, as compared to2002, due to a 16.2% increase in costs and a 1.7% unfavorable foreign currency effect. The increase in costs wasdue to an increase in external legal and consulting fees, which included $3.4 million of fees associated with theBusiness Objects litigation, a 3% increase in staffing levels of our general and administrative personnel, andhigher variable compensation costs as a result of improved financial performance. As a percentage of totalrevenues, general and administrative expenses were 18.8% in 2001, 18.7% in 2002 and 18.6% in 2003.
Restructuring and Impairment Charges. During 2001, we adopted restructuring plans which included astrategic decision to focus operations on the business intelligence market, the elimination or reduction ofspeculative technology initiatives, a reduction of our workforce and a consolidation of our multiple NorthernVirginia facilities into a single location in McLean, Virginia.
As a result of these restructuring plans, we recorded restructuring and impairment charges of $27.3 millionduring 2001 for severance costs and other benefits for terminated employees, costs associated with exitingfacilities and fees incurred for professional services directly related to the restructuring. Costs associated withexiting facilities included estimated sublease losses, representing the excess of lease costs over sublease income,estimated sublease commissions and concessions and other facility closing costs including rent expense while theoffice space is vacant. On a quarterly basis, we assess the adequacy of our restructuring reserve based uponchanges in current market conditions. Due to a decline in estimated sublease rates and an increase in the expectedlength of time to sublease vacant space, we updated our accrued restructuring costs by recording additionalsublease losses of $2.8 million during 2002. During 2003, we further updated our estimated sublease losses andrecorded an increase in our restructuring reserve of $1.7 million due to a sustained high level of vacancy rates inthe commercial real estate market and difficulties experienced in subleasing idle space.
In connection with a periodic assessment of the carrying value of long-lived assets, we concluded that theproducts derived from our Teracube intangible asset, which had been acquired in connection with the purchase ofintellectual property and other tangible and intangible assets relating to NCR Corporation’s Teracube project,would not generate sufficient cash flow to support its carrying value. Accordingly, we recorded an impairmentcharge of $12.2 million in 2001 to write-down that intangible asset to its fair value. During 2002, we updated ourperiodic assessment of the carrying value of our Teracube intangible asset and determined it would not generatesufficient cash flow to support any carrying value. Accordingly, during 2002, we recorded an additionalimpairment charge of $1.4 million to write-off the remaining Teracube intangible asset.
Amounts related to the estimated sublease losses associated with exiting facilities and terminations ofcomputer and equipment leases will be paid over the respective lease terms through February 2009. As a result ofthe restructuring, we have approximately 77,000 square feet of vacant office space with the following expirationdates: 46,000 square feet expire in August 2006, and 31,000 square feet expire in February 2009. Of the 77,000square feet of vacant office space, 31,000 square feet has been subleased as of December 31, 2003. Theremaining vacant office space continues to be marketed for sublease. The accrued restructuring costs as ofDecember 31, 2003 of $6.1 million primarily represented losses associated with idle real estate. At December 31,2003, we had $9.4 million in gross lease obligations and $1.2 million of estimated commissions, concessions and
28
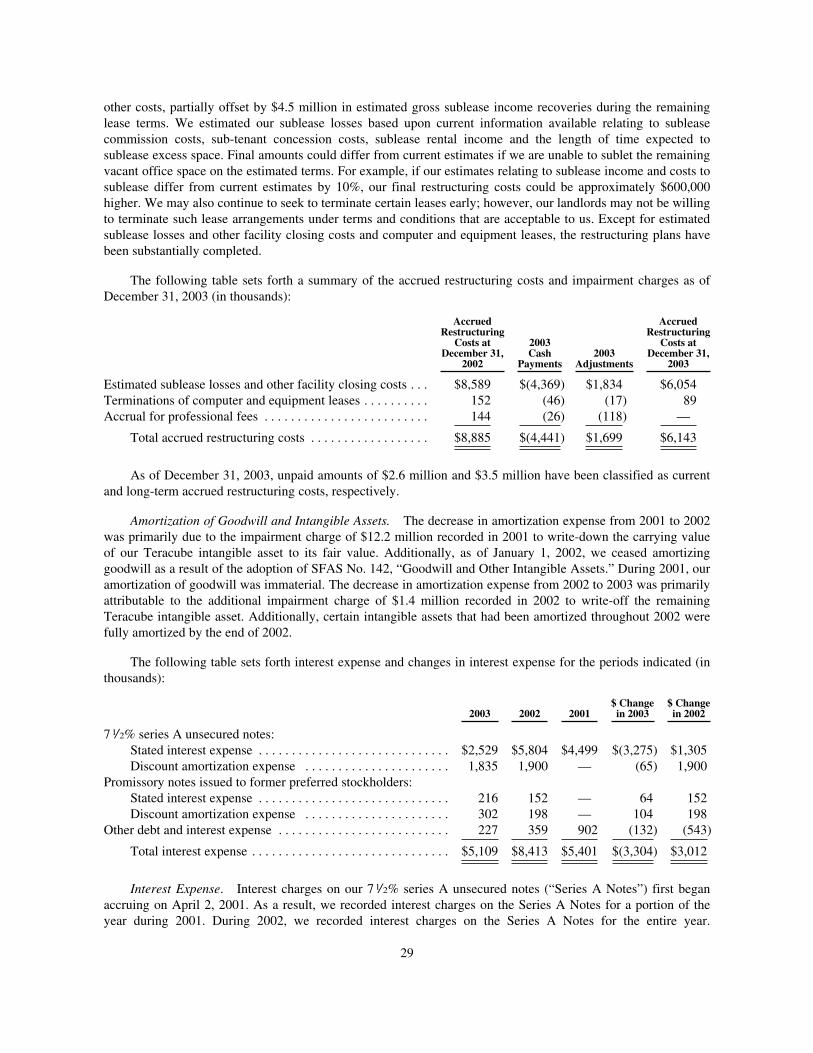
other costs, partially offset by $4.5 million in estimated gross sublease income recoveries during the remaininglease terms. We estimated our sublease losses based upon current information available relating to subleasecommission costs, sub-tenant concession costs, sublease rental income and the length of time expected tosublease excess space. Final amounts could differ from current estimates if we are unable to sublet the remainingvacant office space on the estimated terms. For example, if our estimates relating to sublease income and costs tosublease differ from current estimates by 10%, our final restructuring costs could be approximately $600,000higher. We may also continue to seek to terminate certain leases early; however, our landlords may not be willingto terminate such lease arrangements under terms and conditions that are acceptable to us. Except for estimatedsublease losses and other facility closing costs and computer and equipment leases, the restructuring plans havebeen substantially completed.
The following table sets forth a summary of the accrued restructuring costs and impairment charges as ofDecember 31, 2003 (in thousands):
AccruedRestructuringCosts at
December 31,2002
2003CashPayments
2003Adjustments
AccruedRestructuringCosts at
December 31,2003
Estimated sublease losses and other facility closing costs . . . $8,589 $(4,369) $1,834 $6,054Terminations of computer and equipment leases . . . . . . . . . . 152 (46) (17) 89Accrual for professional fees . . . . . . . . . . . . . . . . . . . . . . . . . 144 (26) (118) —
Total accrued restructuring costs . . . . . . . . . . . . . . . . . . $8,885 $(4,441) $1,699 $6,143
As of December 31, 2003, unpaid amounts of $2.6 million and $3.5 million have been classified as currentand long-term accrued restructuring costs, respectively.
Amortization of Goodwill and Intangible Assets. The decrease in amortization expense from 2001 to 2002was primarily due to the impairment charge of $12.2 million recorded in 2001 to write-down the carrying valueof our Teracube intangible asset to its fair value. Additionally, as of January 1, 2002, we ceased amortizinggoodwill as a result of the adoption of SFAS No. 142, “Goodwill and Other Intangible Assets.” During 2001, ouramortization of goodwill was immaterial. The decrease in amortization expense from 2002 to 2003 was primarilyattributable to the additional impairment charge of $1.4 million recorded in 2002 to write-off the remainingTeracube intangible asset. Additionally, certain intangible assets that had been amortized throughout 2002 werefully amortized by the end of 2002.
The following table sets forth interest expense and changes in interest expense for the periods indicated (inthousands):
2003 2002 2001$ Changein 2003
$ Changein 2002
71⁄2% series A unsecured notes:Stated interest expense . . . . . . . . . . . . . . . . . . . . . . . . . . . . . $2,529 $5,804 $4,499 $(3,275) $1,305Discount amortization expense . . . . . . . . . . . . . . . . . . . . . . 1,835 1,900 — (65) 1,900
Promissory notes issued to former preferred stockholders:Stated interest expense . . . . . . . . . . . . . . . . . . . . . . . . . . . . . 216 152 — 64 152Discount amortization expense . . . . . . . . . . . . . . . . . . . . . . 302 198 — 104 198
Other debt and interest expense . . . . . . . . . . . . . . . . . . . . . . . . . . 227 359 902 (132) (543)
Total interest expense . . . . . . . . . . . . . . . . . . . . . . . . . . . . . . $5,109 $8,413 $5,401 $(3,304) $3,012
Interest Expense. Interest charges on our 71⁄2% series A unsecured notes (“Series A Notes”) first beganaccruing on April 2, 2001. As a result, we recorded interest charges on the Series A Notes for a portion of theyear during 2001. During 2002, we recorded interest charges on the Series A Notes for the entire year.
29
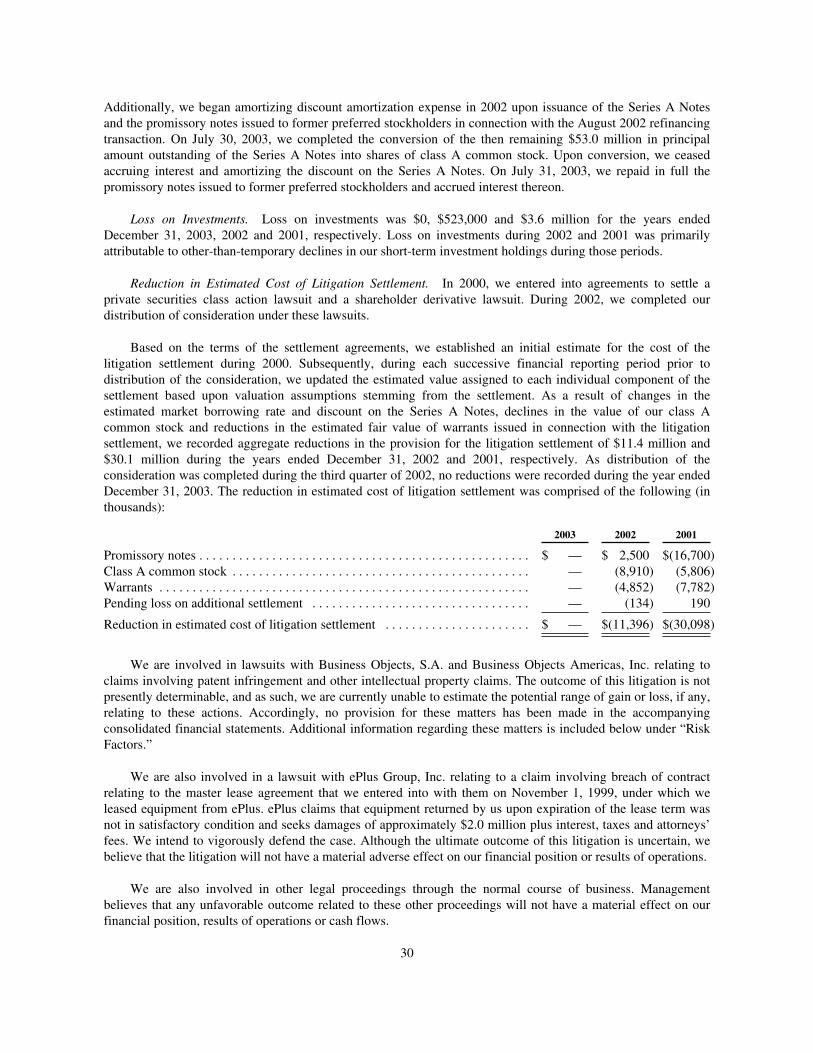
Additionally, we began amortizing discount amortization expense in 2002 upon issuance of the Series A Notesand the promissory notes issued to former preferred stockholders in connection with the August 2002 refinancingtransaction. On July 30, 2003, we completed the conversion of the then remaining $53.0 million in principalamount outstanding of the Series A Notes into shares of class A common stock. Upon conversion, we ceasedaccruing interest and amortizing the discount on the Series A Notes. On July 31, 2003, we repaid in full thepromissory notes issued to former preferred stockholders and accrued interest thereon.
Loss on Investments. Loss on investments was $0, $523,000 and $3.6 million for the years endedDecember 31, 2003, 2002 and 2001, respectively. Loss on investments during 2002 and 2001 was primarilyattributable to other-than-temporary declines in our short-term investment holdings during those periods.
Reduction in Estimated Cost of Litigation Settlement. In 2000, we entered into agreements to settle aprivate securities class action lawsuit and a shareholder derivative lawsuit. During 2002, we completed ourdistribution of consideration under these lawsuits.
Based on the terms of the settlement agreements, we established an initial estimate for the cost of thelitigation settlement during 2000. Subsequently, during each successive financial reporting period prior todistribution of the consideration, we updated the estimated value assigned to each individual component of thesettlement based upon valuation assumptions stemming from the settlement. As a result of changes in theestimated market borrowing rate and discount on the Series A Notes, declines in the value of our class Acommon stock and reductions in the estimated fair value of warrants issued in connection with the litigationsettlement, we recorded aggregate reductions in the provision for the litigation settlement of $11.4 million and$30.1 million during the years ended December 31, 2002 and 2001, respectively. As distribution of theconsideration was completed during the third quarter of 2002, no reductions were recorded during the year endedDecember 31, 2003. The reduction in estimated cost of litigation settlement was comprised of the following (inthousands):
2003 2002 2001
Promissory notes . . . . . . . . . . . . . . . . . . . . . . . . . . . . . . . . . . . . . . . . . . . . . . . . . . $ — $ 2,500 $(16,700)Class A common stock . . . . . . . . . . . . . . . . . . . . . . . . . . . . . . . . . . . . . . . . . . . . . — (8,910) (5,806)Warrants . . . . . . . . . . . . . . . . . . . . . . . . . . . . . . . . . . . . . . . . . . . . . . . . . . . . . . . . — (4,852) (7,782)Pending loss on additional settlement . . . . . . . . . . . . . . . . . . . . . . . . . . . . . . . . . — (134) 190
Reduction in estimated cost of litigation settlement . . . . . . . . . . . . . . . . . . . . . . $ — $(11,396) $(30,098)
We are involved in lawsuits with Business Objects, S.A. and Business Objects Americas, Inc. relating toclaims involving patent infringement and other intellectual property claims. The outcome of this litigation is notpresently determinable, and as such, we are currently unable to estimate the potential range of gain or loss, if any,relating to these actions. Accordingly, no provision for these matters has been made in the accompanyingconsolidated financial statements. Additional information regarding these matters is included below under “RiskFactors.”
We are also involved in a lawsuit with ePlus Group, Inc. relating to a claim involving breach of contractrelating to the master lease agreement that we entered into with them on November 1, 1999, under which weleased equipment from ePlus. ePlus claims that equipment returned by us upon expiration of the lease term wasnot in satisfactory condition and seeks damages of approximately $2.0 million plus interest, taxes and attorneys’fees. We intend to vigorously defend the case. Although the ultimate outcome of this litigation is uncertain, webelieve that the litigation will not have a material adverse effect on our financial position or results of operations.
We are also involved in other legal proceedings through the normal course of business. Managementbelieves that any unfavorable outcome related to these other proceedings will not have a material effect on ourfinancial position, results of operations or cash flows.
30
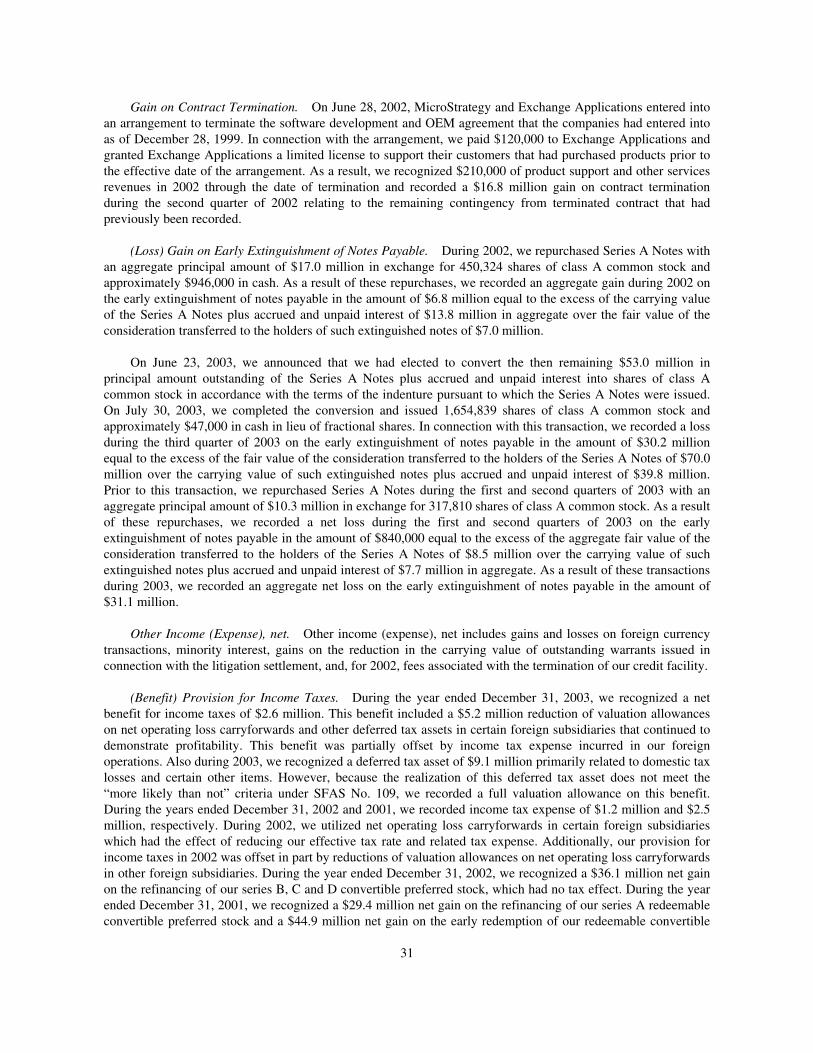
Gain on Contract Termination. On June 28, 2002, MicroStrategy and Exchange Applications entered intoan arrangement to terminate the software development and OEM agreement that the companies had entered intoas of December 28, 1999. In connection with the arrangement, we paid $120,000 to Exchange Applications andgranted Exchange Applications a limited license to support their customers that had purchased products prior tothe effective date of the arrangement. As a result, we recognized $210,000 of product support and other servicesrevenues in 2002 through the date of termination and recorded a $16.8 million gain on contract terminationduring the second quarter of 2002 relating to the remaining contingency from terminated contract that hadpreviously been recorded.
(Loss) Gain on Early Extinguishment of Notes Payable. During 2002, we repurchased Series A Notes withan aggregate principal amount of $17.0 million in exchange for 450,324 shares of class A common stock andapproximately $946,000 in cash. As a result of these repurchases, we recorded an aggregate gain during 2002 onthe early extinguishment of notes payable in the amount of $6.8 million equal to the excess of the carrying valueof the Series A Notes plus accrued and unpaid interest of $13.8 million in aggregate over the fair value of theconsideration transferred to the holders of such extinguished notes of $7.0 million.
On June 23, 2003, we announced that we had elected to convert the then remaining $53.0 million inprincipal amount outstanding of the Series A Notes plus accrued and unpaid interest into shares of class Acommon stock in accordance with the terms of the indenture pursuant to which the Series A Notes were issued.On July 30, 2003, we completed the conversion and issued 1,654,839 shares of class A common stock andapproximately $47,000 in cash in lieu of fractional shares. In connection with this transaction, we recorded a lossduring the third quarter of 2003 on the early extinguishment of notes payable in the amount of $30.2 millionequal to the excess of the fair value of the consideration transferred to the holders of the Series A Notes of $70.0million over the carrying value of such extinguished notes plus accrued and unpaid interest of $39.8 million.Prior to this transaction, we repurchased Series A Notes during the first and second quarters of 2003 with anaggregate principal amount of $10.3 million in exchange for 317,810 shares of class A common stock. As a resultof these repurchases, we recorded a net loss during the first and second quarters of 2003 on the earlyextinguishment of notes payable in the amount of $840,000 equal to the excess of the aggregate fair value of theconsideration transferred to the holders of the Series A Notes of $8.5 million over the carrying value of suchextinguished notes plus accrued and unpaid interest of $7.7 million in aggregate. As a result of these transactionsduring 2003, we recorded an aggregate net loss on the early extinguishment of notes payable in the amount of$31.1 million.
Other Income (Expense), net. Other income (expense), net includes gains and losses on foreign currencytransactions, minority interest, gains on the reduction in the carrying value of outstanding warrants issued inconnection with the litigation settlement, and, for 2002, fees associated with the termination of our credit facility.
(Benefit) Provision for Income Taxes. During the year ended December 31, 2003, we recognized a netbenefit for income taxes of $2.6 million. This benefit included a $5.2 million reduction of valuation allowanceson net operating loss carryforwards and other deferred tax assets in certain foreign subsidiaries that continued todemonstrate profitability. This benefit was partially offset by income tax expense incurred in our foreignoperations. Also during 2003, we recognized a deferred tax asset of $9.1 million primarily related to domestic taxlosses and certain other items. However, because the realization of this deferred tax asset does not meet the“more likely than not” criteria under SFAS No. 109, we recorded a full valuation allowance on this benefit.During the years ended December 31, 2002 and 2001, we recorded income tax expense of $1.2 million and $2.5million, respectively. During 2002, we utilized net operating loss carryforwards in certain foreign subsidiarieswhich had the effect of reducing our effective tax rate and related tax expense. Additionally, our provision forincome taxes in 2002 was offset in part by reductions of valuation allowances on net operating loss carryforwardsin other foreign subsidiaries. During the year ended December 31, 2002, we recognized a $36.1 million net gainon the refinancing of our series B, C and D convertible preferred stock, which had no tax effect. During the yearended December 31, 2001, we recognized a $29.4 million net gain on the refinancing of our series A redeemableconvertible preferred stock and a $44.9 million net gain on the early redemption of our redeemable convertible
31
preferred stock of discontinued operations, which had no tax effect. If we become more profitable in certainforeign jurisdictions where we have limited or no net operating losses to offset taxable income, we would expectto incur increased tax expense in those jurisdictions.
As of December 31, 2003, we had net operating loss carryforwards of approximately $314.1 million andother temporary differences, which resulted in net deferred tax assets of approximately $151.1 million. Also as ofDecember 31, 2003, we had a valuation allowance of $145.6 million on our deferred tax assets. If our operations,and particularly our domestic operations, continue to demonstrate profitability in 2004, after excludingpermanent differences and certain non-recurring items, we may reduce a substantial amount of our valuationallowance. In determining net deferred tax assets and valuation allowances, management is required to makejudgments and estimates related to projections of domestic and foreign profitability, the timing and extent of theutilization of net operating loss carryforwards, applicable tax rates, transfer pricing methodologies and prudentand feasible tax planning strategies.
On February 21, 2004, we received notification from the Internal Revenue Service that our calendar year2000 corporate income tax return had been selected for audit. Management believes that adequate provision hasbeen made for any adjustments that may result from tax examinations. However, the outcome of this tax auditcannot be predicted with certainty. Should any issues addressed in our tax audit be resolved in a manner notconsistent with management’s expectations, we could be required to adjust our provision for income taxes in theperiod such resolution occurs.
Income (Loss) from Discontinued Operations. On December 31, 2001, we discontinued the operations ofour Strategy.com subsidiary and shut down its services. Accordingly, during 2001, we recorded a loss fromabandonment of our discontinued operations of $2.1 million. Subsequent to the abandonment, we continued toassess the valuation of outstanding liabilities during each successive financial reporting period. During 2003,management concluded that the probability of incurring additional obligations or being required to performservices relating to a particular contract was remote. As a result, we reversed the accrued liability related to thiscontract and recorded a gain on discontinued operations in the amount of $765,000 during 2003. Our historicalconsolidated financial statements reflect Strategy.com as a discontinued operation for all periods presented.Included within Strategy.com’s net loss for the year ended December 31, 2001 were restructuring andimpairment charges of $19.4 million. The charge was comprised of a write-down of impaired assets of $17.3million and other restructuring costs associated with severance and exiting facilities.
Dividends, Accretion and Beneficial Conversion Feature on Convertible Preferred Stock. During the yearsended December 31, 2002 and 2001, we recorded aggregate preferred stock dividends of $4.8 million and $8.6million, respectively, on all of our series of preferred stock. Additionally, during the years ended December 31,2002 and 2001, we recorded accretion on preferred stock of $1.3 million and $1.8 million, respectively, toaccrete the carrying value of the series B and C preferred stock to its stated value and to accrete the carryingvalue of the beneficial conversion feature on the series D preferred stock. Furthermore, during 2002, based on thevaluation of the series F preferred stock at the time of issuance, we recorded a beneficial conversion feature inthe amount of $768,000 based on the difference between the fair market value of our class A common stock onthe closing date of the refinancing transaction in August 2002 and the effective conversion price of the series Fpreferred stock. Because the series F preferred stock was convertible immediately upon issuance, we fullyamortized such beneficial conversion feature on the date of issuance. During 2003, we did not have anyoutstanding shares of preferred stock. Accordingly, we did not accrue any preferred stock dividends or recordany accretion on preferred stock during 2003.
Net Gain on Refinancing of Series A Redeemable Convertible Preferred Stock. In connection with therefinancing of our series A redeemable convertible preferred stock in June 2001 for a combination of cash,common stock and series B, C, D and E preferred stock, we recorded a net gain attributable to commonstockholders of $29.4 million during 2001. This net gain represented the excess of the carrying value of the series
32
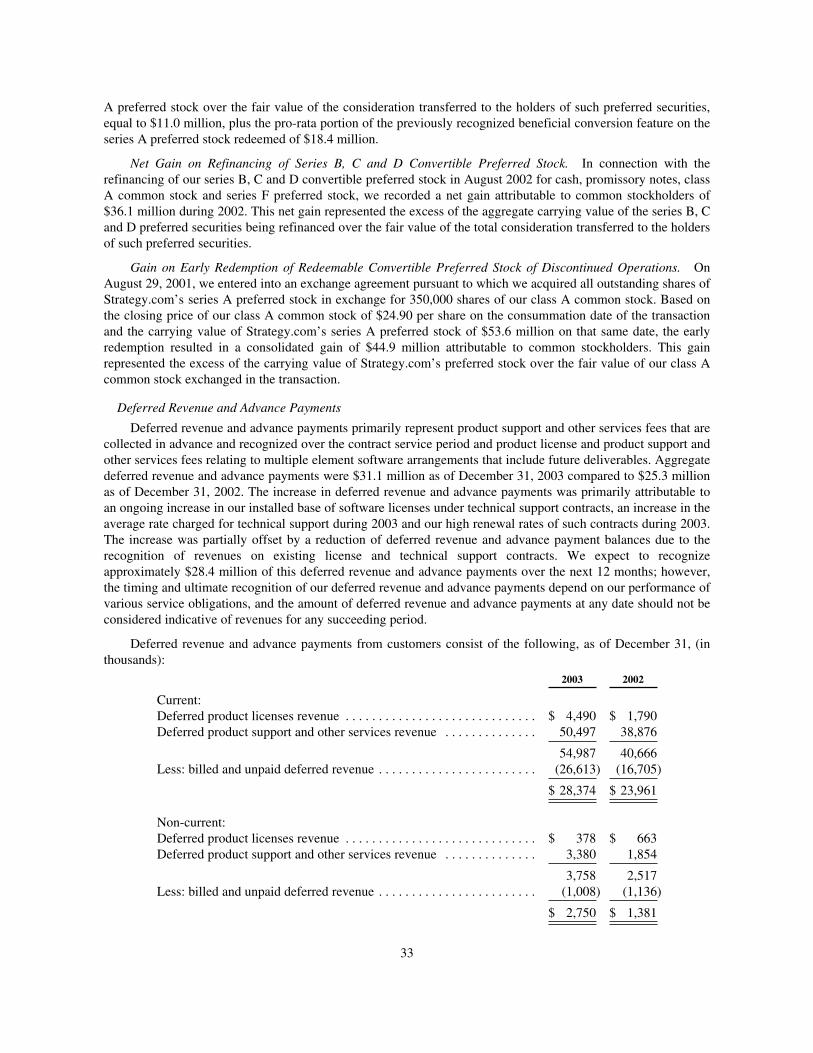
A preferred stock over the fair value of the consideration transferred to the holders of such preferred securities,equal to $11.0 million, plus the pro-rata portion of the previously recognized beneficial conversion feature on theseries A preferred stock redeemed of $18.4 million.
Net Gain on Refinancing of Series B, C and D Convertible Preferred Stock. In connection with therefinancing of our series B, C and D convertible preferred stock in August 2002 for cash, promissory notes, classA common stock and series F preferred stock, we recorded a net gain attributable to common stockholders of$36.1 million during 2002. This net gain represented the excess of the aggregate carrying value of the series B, Cand D preferred securities being refinanced over the fair value of the total consideration transferred to the holdersof such preferred securities.
Gain on Early Redemption of Redeemable Convertible Preferred Stock of Discontinued Operations. OnAugust 29, 2001, we entered into an exchange agreement pursuant to which we acquired all outstanding shares ofStrategy.com’s series A preferred stock in exchange for 350,000 shares of our class A common stock. Based onthe closing price of our class A common stock of $24.90 per share on the consummation date of the transactionand the carrying value of Strategy.com’s series A preferred stock of $53.6 million on that same date, the earlyredemption resulted in a consolidated gain of $44.9 million attributable to common stockholders. This gainrepresented the excess of the carrying value of Strategy.com’s preferred stock over the fair value of our class Acommon stock exchanged in the transaction.
Deferred Revenue and Advance Payments
Deferred revenue and advance payments primarily represent product support and other services fees that arecollected in advance and recognized over the contract service period and product license and product support andother services fees relating to multiple element software arrangements that include future deliverables. Aggregatedeferred revenue and advance payments were $31.1 million as of December 31, 2003 compared to $25.3 millionas of December 31, 2002. The increase in deferred revenue and advance payments was primarily attributable toan ongoing increase in our installed base of software licenses under technical support contracts, an increase in theaverage rate charged for technical support during 2003 and our high renewal rates of such contracts during 2003.The increase was partially offset by a reduction of deferred revenue and advance payment balances due to therecognition of revenues on existing license and technical support contracts. We expect to recognizeapproximately $28.4 million of this deferred revenue and advance payments over the next 12 months; however,the timing and ultimate recognition of our deferred revenue and advance payments depend on our performance ofvarious service obligations, and the amount of deferred revenue and advance payments at any date should not beconsidered indicative of revenues for any succeeding period.
Deferred revenue and advance payments from customers consist of the following, as of December 31, (inthousands):
2003 2002
Current:Deferred product licenses revenue . . . . . . . . . . . . . . . . . . . . . . . . . . . . . $ 4,490 $ 1,790Deferred product support and other services revenue . . . . . . . . . . . . . . 50,497 38,876
54,987 40,666Less: billed and unpaid deferred revenue . . . . . . . . . . . . . . . . . . . . . . . . (26,613) (16,705)
$ 28,374 $ 23,961
Non-current:Deferred product licenses revenue . . . . . . . . . . . . . . . . . . . . . . . . . . . . . $ 378 $ 663Deferred product support and other services revenue . . . . . . . . . . . . . . 3,380 1,854
3,758 2,517Less: billed and unpaid deferred revenue . . . . . . . . . . . . . . . . . . . . . . . . (1,008) (1,136)
$ 2,750 $ 1,381
33
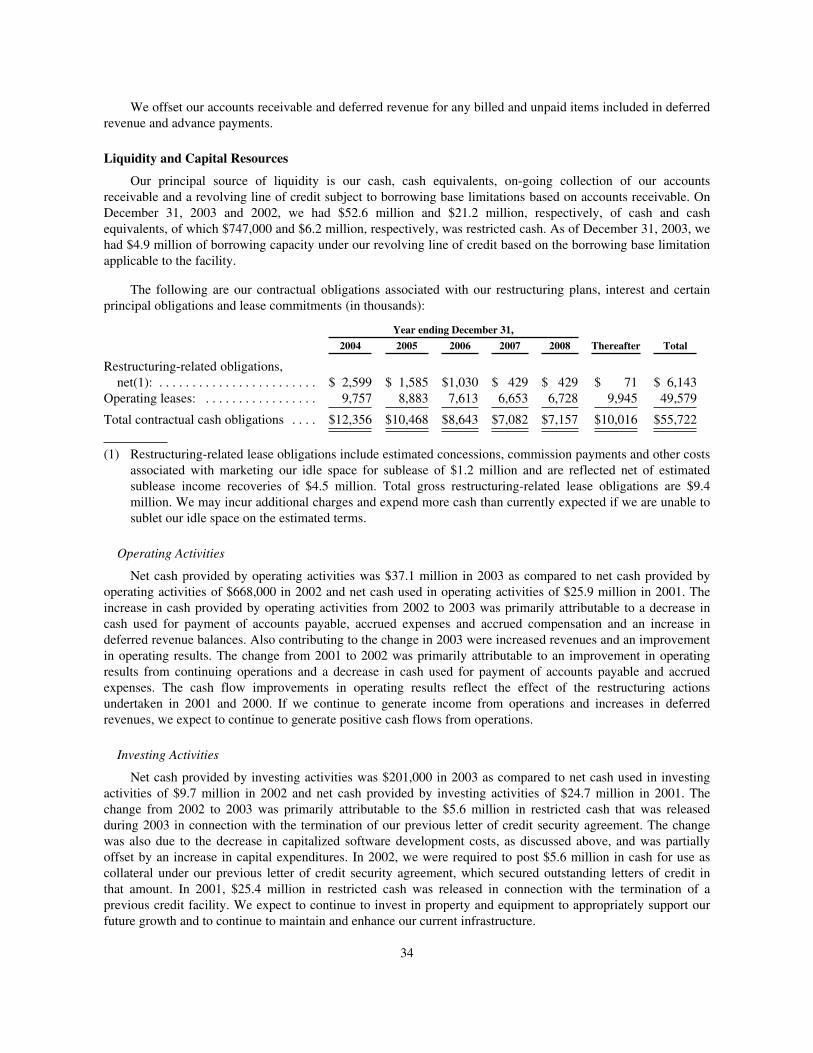
We offset our accounts receivable and deferred revenue for any billed and unpaid items included in deferredrevenue and advance payments.
Liquidity and Capital Resources
Our principal source of liquidity is our cash, cash equivalents, on-going collection of our accountsreceivable and a revolving line of credit subject to borrowing base limitations based on accounts receivable. OnDecember 31, 2003 and 2002, we had $52.6 million and $21.2 million, respectively, of cash and cashequivalents, of which $747,000 and $6.2 million, respectively, was restricted cash. As of December 31, 2003, wehad $4.9 million of borrowing capacity under our revolving line of credit based on the borrowing base limitationapplicable to the facility.
The following are our contractual obligations associated with our restructuring plans, interest and certainprincipal obligations and lease commitments (in thousands):
Year ending December 31,
2004 2005 2006 2007 2008 Thereafter Total
Restructuring-related obligations,net(1): . . . . . . . . . . . . . . . . . . . . . . . . $ 2,599 $ 1,585 $1,030 $ 429 $ 429 $ 71 $ 6,143
Operating leases: . . . . . . . . . . . . . . . . . 9,757 8,883 7,613 6,653 6,728 9,945 49,579
Total contractual cash obligations . . . . $12,356 $10,468 $8,643 $7,082 $7,157 $10,016 $55,722
(1) Restructuring-related lease obligations include estimated concessions, commission payments and other costsassociated with marketing our idle space for sublease of $1.2 million and are reflected net of estimatedsublease income recoveries of $4.5 million. Total gross restructuring-related lease obligations are $9.4million. We may incur additional charges and expend more cash than currently expected if we are unable tosublet our idle space on the estimated terms.
Operating Activities
Net cash provided by operating activities was $37.1 million in 2003 as compared to net cash provided byoperating activities of $668,000 in 2002 and net cash used in operating activities of $25.9 million in 2001. Theincrease in cash provided by operating activities from 2002 to 2003 was primarily attributable to a decrease incash used for payment of accounts payable, accrued expenses and accrued compensation and an increase indeferred revenue balances. Also contributing to the change in 2003 were increased revenues and an improvementin operating results. The change from 2001 to 2002 was primarily attributable to an improvement in operatingresults from continuing operations and a decrease in cash used for payment of accounts payable and accruedexpenses. The cash flow improvements in operating results reflect the effect of the restructuring actionsundertaken in 2001 and 2000. If we continue to generate income from operations and increases in deferredrevenues, we expect to continue to generate positive cash flows from operations.
Investing Activities
Net cash provided by investing activities was $201,000 in 2003 as compared to net cash used in investingactivities of $9.7 million in 2002 and net cash provided by investing activities of $24.7 million in 2001. Thechange from 2002 to 2003 was primarily attributable to the $5.6 million in restricted cash that was releasedduring 2003 in connection with the termination of our previous letter of credit security agreement. The changewas also due to the decrease in capitalized software development costs, as discussed above, and was partiallyoffset by an increase in capital expenditures. In 2002, we were required to post $5.6 million in cash for use ascollateral under our previous letter of credit security agreement, which secured outstanding letters of credit inthat amount. In 2001, $25.4 million in restricted cash was released in connection with the termination of aprevious credit facility. We expect to continue to invest in property and equipment to appropriately support ourfuture growth and to continue to maintain and enhance our current infrastructure.
34
Financing Activities
Net cash used in financing activities was $1.0 million, $11.6 million and $15.7 million in 2003, 2002 and2001, respectively. The change from 2002 to 2003 was primarily due to net cash payments of $10.0 million inconnection with the refinancing of our series B, C and D preferred stock during the 2002 period. The change wasalso attributable to an increase in proceeds from the sale of our class A common stock under our employee stockpurchase plan and the exercise of employee stock options. The change from 2001 to 2002 was primarilyattributable to cash redemptions of our series A and E preferred stock for $12.5 million, net of offering costs, and$6.8 million, respectively, in the 2001 period.
In connection with the refinancing of our series B, C and D preferred stock in August 2002, we issued topreferred stockholders, among other consideration, $5.0 million in promissory notes with a carrying value of $4.5million at the time of issuance. The promissory notes accrued interest at a rate of 7.5% per annum, payable semi-annually, and matured on July 31, 2003. Upon maturity of the promissory notes on July 31, 2003, we paid $5.2million to repay in full the principal and interest due under the promissory notes issued to former preferredstockholders.
During 2002, we repurchased $17.0 million principal amount of our Series A Notes. During the first andsecond quarters of 2003, we repurchased an additional $10.3 million principal amount of these notes. On July 30,2003, we completed the conversion of the remaining $53.0 million in principal amount outstanding of our SeriesA Notes plus accrued and unpaid interest and issued 1,654,839 shares of class A common stock in suchconversion. As a result of this transaction, we have eliminated our remaining principal and interest obligationsrelating to our Series A Notes.
Management believes that existing cash, cash anticipated to be generated internally by operations and theCompany’s credit facility will be sufficient to meet working capital requirements and anticipated capitalexpenditures for at least the next twelve months. Based upon our cash position, we do not currently expect toborrow money to finance our operations. Our liquidity and capital resources and ability to generate revenues aresubject to various business and economic risks discussed below under “Risk Factors.”
Recent Accounting Standards
In November 2002, the Financial Accounting Standards Board (“FASB”) issued FASB Interpretation No. 45(“FIN 45”), “Guarantor’s Accounting and Disclosure Requirements for Guarantees, Including IndirectGuarantees of Indebtedness of Others.” FIN 45 requires a company to recognize the fair value for certainguarantee obligations on the date of issuance of the guarantee. The initial recognition and measurementprovisions of FIN 45 are applicable on a prospective basis for guarantee arrangements issued or modified by usafter December 31, 2002. FIN 45 also requires a company to make certain additional disclosures even when thelikelihood of payment under the guarantee is remote. The adoption of FIN 45 had no impact on our results ofoperations.
Pursuant to FIN 45 and subsequent FASB staff positions, intellectual property infringementindemnifications are subject to the disclosure requirements of FIN 45, but are exempt from its initial recognitionand measurement provisions. We typically include our standard intellectual property indemnification clauses inour software license agreements. Pursuant to these clauses, we agree to defend and hold harmless the indemnifiedparty, typically our customers, business partners and their directors, officers, employees and agents, inconnection with certain intellectual property infringement claims by third parties relating to our products. Theterm of the indemnification clauses varies, typically ranging from five years to perpetuity, and generally appliesat any time after the execution of the software license agreement. In addition, we generally warrant that oursoftware products will perform in all material respects in accordance with our standard published softwarespecifications in effect at the time of delivery of the licensed products to the customer for a specified period oftime following delivery, typically 90 to 180 days. We have not experienced any material intellectual propertyindemnification or warranty claims historically and have no amounts accrued as of December 31, 2003 relatingto such obligations.
35
We are also a party to a variety of other agreements with current and former customers, vendors, landlords,employees, directors and others pursuant to which we may be obligated to make payments to guaranteed parties.For example, such indemnification arrangements may obligate us to make payments to a property owner in theevent of an adverse judgment in a lawsuit or the imposition of additional taxes in connection with real estateleased by us. These obligations may require the other party to make an adverse claim pursuant to proceduresspecified in the specific agreement, and our obligations may be limited in terms of time, and/or amount, orotherwise be qualified. It is not possible to predict the maximum potential amount of future payments under suchagreements due to the limited history of prior indemnification claims and the unique facts and circumstancesinvolved in each particular agreement. To date, we have not incurred material indemnification expense underthese agreements and have not accrued any amounts relating to such provisions in our financial statements.
In November 2002, the EITF reached a consensus on EITF Issue No. 00-21, “Revenue Arrangements withMultiple Deliverables.” EITF Issue No. 00-21 provides guidance on how to account for arrangements thatinvolve the delivery or performance of multiple products, services and/or rights to use assets. EITF Issue No.00-21 is applicable to revenue arrangements entered into or modified after June 30, 2003. The provisions of thisconsensus did not have any effect on our financial position and results of operations.
In January 2003, the FASB issued FIN 46, “Consolidation of Variable Interest Entities, an Interpretation ofARB No. 51.” In December 2003, the FASB revised FIN No. 46 to reflect decisions it made regarding a numberof implementation issues. FIN No. 46, as revised, requires that the primary beneficiary of a variable interestentity consolidate the entity even if the primary beneficiary does not have a majority voting interest. Thisinterpretation applies to certain entities in which equity investors do not have the characteristics of a controllingfinancial interest or do not have sufficient equity at risk for the entity to finance its activities without additionalsubordinated financial support. This interpretation also identifies those situations where a controlling financialinterest may be achieved through arrangements that do not involve voting interests. The interpretation alsoestablishes additional disclosures which are required regarding an enterprise’s involvement with a variableinterest entity when it is not the primary beneficiary. The requirements of this interpretation are required to beapplied for all new variable interest entities created or acquired after January 31, 2003. For variable interestentities created or acquired prior to February 1, 2003, the provisions must be applied for the first interim orannual period ending after December 15, 2003. We do not have any controlling interest, contractual relationshipsor other business relationships with unconsolidated variable interest entities and therefore the adoption of thisstandard did not have any effect on our financial position and results of operations.
In April 2003, the FASB issued SFAS No. 149, “Amendment of Statement 133 on Derivative Instrumentsand Hedging Activities.” SFAS No. 149 amends and clarifies accounting for derivative instruments, includingcertain derivative instruments embedded in other contracts, and for hedging activities under SFAS No. 133. Thestatement requires that contracts with comparable characteristics be accounted for similarly and clarifies when aderivative contains a financing component that warrants special reporting in the statement of cash flows. SFASNo. 149 is effective for contracts entered into or modified after June 30, 2003, except in certain circumstances,and for hedging relationships designated after June 30, 2003. The adoption of this standard did not have amaterial impact on our financial position and results of operations.
In May 2003, the FASB issued SFAS No. 150, “Accounting for Certain Financial Instruments withCharacteristics of Both Liabilities and Equity,” which is effective for all financial instruments created ormodified after May 31, 2003 and otherwise is effective July 1, 2003. SFAS No. 150 establishes standards forclassifying and measuring as liabilities certain financial instruments that embody obligations of the issuer andhave characteristics of both liabilities and equity. The adoption of this standard did not have any effect on ourfinancial position and results of operations.
Risk Factors
You should carefully consider the risks described below before making an investment decision. The risksand uncertainties described below are not the only ones facing MicroStrategy. Additional risks and uncertaintiesnot presently known to us or that we currently deem immaterial may also impair our business operations.
36

If any of the following risks actually occur, our business, financial condition or results of operations couldbe materially adversely affected. In such case, the trading price of our class A common stock could decline andyou may lose all or part of your investment.
We may not be able to achieve profitability in the future
We incurred a net loss of $3.9 million for the year ended December 31, 2003, including a $30.2 millioncharge attributable to the conversion of our Series A Notes into shares of class A common stock on July 30,2003. As of December 31, 2003, our accumulated deficit was $345.9 million. Although we expect to beprofitable in 2004, we may not be able to achieve profitability in this or any other future period.
Our quarterly operating results, revenues and expenses may fluctuate significantly, which could have anadverse effect on the market price of our stock
For a number of reasons, including those described below, our operating results, revenues and expenses mayvary significantly from quarter to quarter. These fluctuations could have an adverse effect on the market price ofour class A common stock.
Fluctuations in Quarterly Operating Results. Our quarterly operating results may fluctuate as a result of:
• the size, timing, volume and execution of significant orders and shipments;
• the mix of products and services of customer orders, which can affect whether we recognize revenueupon the signing and delivery of our software products or whether revenue must be recognized as workprogresses or over the entire contract period;
• the timing of new product announcements;
• changes in our pricing policies or those of our competitors;
• market acceptance of business intelligence software generally and of new and enhanced versions of ourproducts in particular;
• the length of our sales cycles;
• changes in our operating expenses;
• personnel changes;
• our success in adding to our indirect distribution channels;
• utilization of our consulting personnel, which can be affected by delays or deferrals of customerimplementation of our software products and consulting, education and support services;
• changes in foreign currency exchange rates, which had a positive impact on our results for the yearended December 31, 2003; and
• seasonal factors, such as our traditionally lower pace of new sales in the summer.
Limited Ability to Adjust Expenses. We base our operating expense budgets on expected revenue trends.Many of our expenses, such as office and equipment leases and certain personnel costs, are relatively fixed. Wemay be unable to adjust spending quickly enough to offset any unexpected revenue shortfall. Accordingly, anyshortfall in revenue may cause significant variation in operating results in any quarter.
Based on the above factors, we believe that quarter-to-quarter comparisons of our operating results are not agood indication of our future performance. It is possible that in one or more future quarters, our operating resultsmay be below the expectations of public market analysts and investors. In that event, the trading price of ourclass A common stock may fall.
37
We rely on our strategic channel partners and if we are unable to develop or maintain successfulrelationships with them, our business, operating results and financial condition will suffer
In addition to our direct sales force, we rely on strategic channel partners such as value-added resellers,system integrators and original equipment manufacturers to license and support our products in the United Statesand internationally. In particular, for the years ended December 31, 2003, 2002 and 2001, channel partnersaccounted for, directly or indirectly, approximately 24.6%, 27.3% and 35.4% of our total product licensesrevenues, respectively. Our channel partners generally offer customers the products of several differentcompanies, including some products that compete with ours. Although we believe that direct sales will continueto account for a majority of product license revenues, we are seeking to increase the level of indirect salesactivities through our strategic channel partners; however, we may not be successful in our efforts to expandindirect sales in this manner. We may not be able to attract strategic partners who will market our productseffectively and who will be qualified to provide timely and cost-effective customer support and service. Ourability to achieve revenue growth in the future will depend in part on our success in developing and maintainingsuccessful relationships with those strategic partners. If we are unable to develop or maintain our relationshipswith these strategic partners, our business, operating results and financial condition will suffer.
Our recognition of deferred revenue and advance payments is subject to future performance obligationsand may not be representative of revenues for succeeding periods
Our deferred revenue and advance payments were $31.1 million as of December 31, 2003. The timing andultimate recognition of our deferred revenue and advance payments depend on our performance of variousservice obligations. Because of the possibility of customer changes in development schedules, delays inimplementation and development efforts and the need to satisfactorily perform product support services, deferredrevenue and advance payments at any particular date may not be representative of actual revenue for anysucceeding period.
Managing our international operations is complex and our failure to do so successfully or in a cost-effective manner would have a material adverse effect on our business, operating results and financialcondition
International sales accounted for 34.0%, 36.0% and 33.8% of our total revenues for the years endedDecember 31, 2003, 2002 and 2001, respectively. Our international operations require significant managementattention and financial resources.
There are certain risks inherent in our international business activities including:
• changes in foreign currency exchange rates;
• unexpected changes in regulatory requirements;
• tariffs and other trade barriers;
• costs of localizing products for foreign countries;
• lack of acceptance of localized products in foreign countries;
• longer accounts receivable payment cycles;
• difficulties in managing international operations;
• tax issues, including restrictions on repatriating earnings;
• weaker intellectual property protection in other countries;
• economic weakness or currency related crises that may arise in different countries or geographicregions; and
• the burden of complying with a wide variety of foreign laws.
38
These factors may have a material adverse effect on our future international sales and, consequently, on ourbusiness, operating results and financial condition.
We may lose sales, or sales may be delayed, due to the long sales and implementation cycles for ourproducts, which would reduce our revenues
To date, our customers have typically invested substantial time, money and other resources and involvedmany people in the decision to license our software products and purchase our consulting and other services. As aresult, we may wait nine months or more after the first contact with a customer for that customer to place anorder while they seek internal approval for the purchase of our products and/or services. During this long salescycle, events may occur that affect the size or timing of the order or even cause it to be canceled. For example,our competitors may introduce new products, or the customer’s own budget and purchasing priorities maychange.
Even after an order is placed, the time it takes to deploy our products and complete consulting engagementsvaries widely from one customer to the next. Implementing our product can sometimes last several months,depending on the customer’s needs and may begin only with a pilot program. It may be difficult to deploy ourproducts if the customer has complicated deployment requirements, which typically involve integratingdatabases, hardware and software from different vendors. If a customer hires a third party to deploy our products,we cannot be sure that our products will be deployed successfully.
We face intense competition, which may lead to lower prices for our products, reduced gross margins, lossof market share and reduced revenue
The markets for business intelligence software, analytical applications and information delivery areintensely competitive and subject to rapidly changing technology. In addition, many companies in these marketsare offering, or may soon offer, products and services that may compete with MicroStrategy products.
MicroStrategy’s most direct competitors include providers of:
• Business intelligence software;
• OLAP tools;
• Ad-hoc Query tools;
• Web-based reporting tools; and
• Report delivery and proactive alerting.
Each of these markets is discussed more fully below.
Business Intelligence Software. Makers of business intelligence software provide business intelligencecapabilities designed for integration, customization and application development. Companies such as Microsoft,Oracle, Hyperion Solutions, SAP AG, Computer Associates and SAS provide business intelligence software.
OLAP Tools. Companies that build software to perform online analytical processing (OLAP) provideofferings competitive with the core MicroStrategy 7i platform. Whether web-based or client-server, these toolsgive end users the ability to analyze underlying data sources without having to hand code structured querylanguage queries. Most OLAP tools allow users to build their own calculations and specify report layouts andother options. Additionally, OLAP tools provide users the ability to navigate throughout the underlying data in aneasy, graphical style, often referred to as drilling. Additional OLAP capabilities include pivoting and filtering.Providers of OLAP tools include Cognos, Hyperion Solutions, IBM, SAP and Microsoft.
39

Ad-hoc Query Tools. Ad-hoc query tools allow large numbers of end users to gain access to pre-definedreports and queries for simple analysis. Often each end user is able to specify some personalized run-time criteriathat customize the result set for that particular person. Some limited drilling is also provided. Some ad-hoc querytools allow users to access databases and create their own database queries using structured query language.Users are then able to export the resulting data into other formats such as Microsoft Excel for their own use.Companies that produce query and reporting tools include Business Objects, Cognos, Oracle, Hyperion Solutionsand Information Builders.
Web-based Reporting Tools. Companies that offer software to deliver pre-built reports for end userviewing and consumption can also compete with MicroStrategy. Extensive formatting capabilities ensure thatusers can easily consume the information contained in the reports. There is limited user interactivity with thesereports generated by reporting tools. Reporting applications built with these tools often lack the sophistication,robustness and scalability of the MicroStrategy platform, but can be attractive for small departments. Vendors inthis category include Actuate, Business Objects, Microsoft and SAS.
Report Delivery and Proactive Alerting. Companies that focus on the proactive delivery of information,via e-mail, website, or other medium can compete with MicroStrategy’s offerings. Typically, these tools serve topush out compiled reports on a scheduled basis to sets of users based on job type. MicroStrategy software hasintegrated this technology into the MicroStrategy 7i platform. Vendors of such technology include Actuate andBusiness Objects.
Many of our competitors have longer operating histories, significantly greater financial, technical,marketing or other resources, and greater name recognition than we do. In addition, many of our competitorshave strong relationships with current and potential customers and extensive knowledge of the businessintelligence industry. As a result, they may be able to respond more quickly to new or emerging technologies andchanges in customer requirements or devote greater resources to the development, promotion and sale of theirproducts than we can. Increased competition may lead to price cuts, reduced gross margins and loss of marketshare. We may not be able to compete successfully against current and future competitors and the failure to meetthe competitive pressures we face may have a material adverse effect on our business, operating results andfinancial condition.
Current and future competitors may also make strategic acquisitions or establish cooperative relationshipsamong themselves or with others. By doing so, they may increase their ability to meet the needs of our potentialcustomers. Our current or prospective indirect channel partners may establish cooperative relationships with ourcurrent or future competitors. These relationships may limit our ability to sell our products through specificdistribution channels. Accordingly, new competitors or alliances among current and future competitors mayemerge and rapidly gain significant market share. These developments could limit our ability to obtain revenuesfrom new customers and to maintain technical support revenues from our installed customer base.
Our inability to develop and release product enhancements and new products to respond to rapidtechnological change in a timely and cost-effective manner would have a material adverse effect on ourbusiness, operating results and financial condition
The market for our products is characterized by rapid technological change, frequent new productintroductions and enhancements, changing customer demands and evolving industry standards. The introductionof products embodying new technologies can quickly make existing products obsolete and unmarketable. Webelieve that our future success depends largely on three factors:
• our ability to continue to support a number of popular operating systems and databases;
• our ability to maintain and improve our current product line; and
• our ability to rapidly develop new products that achieve market acceptance, maintain technologicalcompetitiveness and meet an expanding range of customer requirements.
40
Business intelligence applications are inherently complex, and it can take a long time to develop and testmajor new products and product enhancements. In addition, customers may delay their purchasing decisionsbecause they anticipate that new or enhanced versions of our products will soon become available. We cannot besure that we will succeed in developing and marketing, on a timely and cost-effective basis, productenhancements or new products that respond to technological change or new customer requirements, nor can webe sure that any new products and product enhancements will achieve market acceptance.
The emergence of new industry standards may adversely affect our ability to market our existing products
The emergence of new industry standards in related fields may adversely affect the demand for our existingproducts. This could happen, for example, if new web standards and technologies emerged that wereincompatible with customer deployments of our products. Although the core database component of our businessintelligence solutions is compatible with nearly all major enterprise server hardware and operating systemcombinations, such as OS/390, AS/400, Unix, Linux and Windows, certain of our application server componentsrun only on the Windows NT, Server 2000 and Server 2003 operating systems. Therefore, our ability to increasesales currently depends in part on the continued acceptance of the Windows NT and Windows Server operatingsystems and in part on our ability to port certain components of our software to non-Windows based operatingsystems.
The nature of our products makes them particularly vulnerable to undetected errors, or bugs, which couldcause problems with how the products perform and which could in turn reduce demand for our products,reduce our revenue and lead to product liability claims against us
Software products as complex as ours may contain errors or defects. Although we test our productsextensively, we have in the past discovered software errors in new products after their introduction. Despitetesting by us and by our current and potential customers, errors may be found in new products or releases aftercommercial shipments begin. This could result in lost revenue or delays in market acceptance, which could havea material adverse effect upon our business, operating results and financial condition.
Our license agreements with customers typically contain provisions designed to limit our exposure toproduct liability claims. It is possible, however, that these provisions may not be effective under the laws ofcertain domestic or international jurisdictions. Although there have been no product liability claims against us todate, our license and support of products may involve the risk of these claims. A successful product liabilityclaim against us could have a material adverse effect on our business, operating results and financial condition.
If we are unable to recruit or retain skilled personnel, or if we lose the services of any of our keymanagement personnel, our business, operating results and financial condition would be materiallyadversely affected
Our future success depends on our continuing ability to attract, train, assimilate and retain highly skilledpersonnel. Competition for these employees is intense. We may not be able to retain our current key employeesor attract, train, assimilate or retain other highly skilled personnel in the future. Our future success also dependsin large part on the continued service of key management personnel, particularly Michael J. Saylor, ourChairman and Chief Executive Officer, and Sanju K. Bansal, our Vice Chairman, Executive Vice President andChief Operating Officer. If we lose the services of one or both of these individuals or other key personnel, or ifwe are unable to attract, train, assimilate and retain the highly skilled personnel we need, our business, operatingresults and financial condition could be materially adversely affected.
Because of the rights of our two classes of common stock, and because we are controlled by our existingholders of class B common stock, these stockholders could transfer control of MicroStrategy to a thirdparty without anyone else’s approval or prevent a third party from acquiring MicroStrategy
We have two classes of common stock: class A common stock and class B common stock. Holders of ourclass A common stock generally have the same rights as holders of our class B common stock, except that
41
holders of class A common stock have one vote per share while holders of class B common stock have ten votesper share. As of March 1, 2004, holders of our class B common stock owned or controlled 3,603,730 shares ofclass B common stock, or 74.4% of the total voting power. Michael J. Saylor, our Chairman and Chief ExecutiveOfficer, controlled 882 shares of class A common stock and 2,849,700 shares of class B common stock, or 58.8%of the total voting power, as of March 1, 2004. Accordingly, Mr. Saylor is able to control MicroStrategy throughhis ability to determine the outcome of elections of our directors, amend our certificate of incorporation and by-laws and take other actions requiring the vote or consent of stockholders, including mergers, going-privatetransactions and other extraordinary transactions and their terms.
Our certificate of incorporation allows holders of class B common stock, almost all of whom are currentemployees or former employees of our company or related parties, to transfer shares of class B common stock,subject to the approval of stockholders possessing a majority of the outstanding class B common stock. Mr.Saylor or a group of stockholders possessing a majority of the outstanding class B common stock could, withoutseeking anyone else’s approval, transfer voting control of MicroStrategy to a third party. Such a transfer ofcontrol could have a material adverse effect on our business, operating results and financial condition. Mr. Saylorwill also be able to prevent a change of control of MicroStrategy, regardless of whether holders of class Acommon stock might otherwise receive a premium for their shares over the then current market price.
We have only limited protection for our proprietary rights in our software, which makes it difficult toprevent third parties from infringing upon our rights
We rely primarily on a combination of copyright, patent, trademark and trade secret laws, customerlicensing agreements, employee and third-party nondisclosure agreements and other methods to protect ourproprietary rights. However, these laws and contractual provisions provide only limited protection. Despite ourefforts to protect our proprietary rights, unauthorized parties may attempt to copy or otherwise obtain and use ourproducts or technology. Policing such unauthorized use is difficult, and we cannot be certain that we can preventit, particularly in countries where the laws may not protect our proprietary rights as fully as in the United States.
Our products may be susceptible to claims by other companies that our products infringe upon theirproprietary rights, which could adversely affect our business, operating results and financial condition
As the number of software products in our target markets increases and the functionality of these productsfurther overlaps, we may become increasingly subject to claims by a third party that our technology infringessuch party’s proprietary rights. Regardless of their merit, any such claims could be time consuming andexpensive to defend, may divert management’s attention and resources, could cause product shipment delays andcould require us to enter into costly royalty or licensing agreements. If successful, a claim of infringementagainst us and our inability to license the infringed or similar technology could have a material adverse effect onour business, operating results and financial condition.
On October 17, 2001, Business Objects filed suit against us in the United States District Court for theNorthern District of California, claiming that our software infringes a patent issued to Business Objects relatingto relational database access (the ‘403 patent). The suit sought injunctive relief and monetary damages. OnAugust 29, 2003, the Court granted our motion for summary judgment and dismissed the lawsuit, ruling as amatter of law that our products do not infringe the ‘403 patent. Business Objects has filed an appeal.
On October 31, 2001, we filed suit against Business Objects, S.A. and its subsidiary, Business ObjectsAmericas, Inc., in the United States District Court for the Eastern District of Virginia, claiming that BusinessObjects’ software infringes two patents held by us relating to asynchronous control of report generation using aweb browser (the ‘033 patent) and a system and method of adapting automatic output of OLAP reports todisparate user output devices (the ‘050 patent). The complaint against Business Objects was amended to addclaims for violations of the federal Computer Fraud and Abuse Act, misappropriation of trade secrets, tortiousinterference with contractual relations, and violations of the Virginia Conspiracy Act. As a result of pre-trial
42
rulings, certain of these claims were dismissed. Our claims for tortious interference and misappropriation of tradesecrets proceeded to trial on October 20, 2003. On October 28, 2003, the Court dismissed the tortiousinterference claim. The Court has yet to issue a ruling on the merits of the misappropriation of trade secretsclaim, for which we are seeking various equitable remedies against Business Objects. In July 2003, the UnitedStates Patent & Trademark Office confirmed the validity of all the claims in the ‘033 and ‘050 patents andterminated reexamination proceedings that Business Objects had requested as to those patents. We agreed todismissal of the ‘033 patent claims without prejudice. Our ‘050 patent claims are currently scheduled to proceedto trial on June 15, 2004. We are seeking monetary damages and injunctive relief.
On December 10, 2003, we filed a complaint for patent infringement against Crystal Decisions, Inc. in theUnited States District Court for the District of Delaware. The lawsuit alleges that Crystal Decisions willfullyinfringes three patents issued to us relating to: (i) asynchronous control of report generation using a web browser(the ‘033 patent); (ii) management of an automatic OLAP report broadcast system (the ‘796 patent); and (iii)providing business intelligence web content with reduced client-side processing (the ‘432 patent). We areseeking monetary damages and injunctive relief. Following the filing of the complaint, Crystal Decisions wasacquired by Business Objects Americas, Inc. Business Objects Americas, Inc. has answered the complaint,denying infringement and seeking a declaration that the patents in suit are invalid and not infringed by BusinessObjects Americas, Inc. The case is in its earliest stages. Trial is scheduled for November 2005.
If the market for business intelligence software fails to grow as we expect, or if businesses fail to adopt ourproducts, our business, operating results and financial condition would be materially adversely affected
Nearly all of our revenues to date have come from sales of business intelligence software and relatedtechnical support, consulting and education services. We expect these sales to account for a large portion of ourrevenues for the foreseeable future. Although demand for business intelligence software has grown in recentyears, the market for business intelligence software applications is still emerging. Resistance from consumer andprivacy groups to increased commercial collection and use of data on spending patterns and other personalbehavior and recent European Union restrictions on the collection and use of personal data may impair thefurther growth of this market, as may other developments. We cannot be sure that this market will continue togrow or, even if it does grow, that businesses will adopt our solutions. We have spent, and intend to keepspending, considerable resources to educate potential customers about business intelligence software in generaland our solutions in particular. However, we cannot be sure that these expenditures will help our productsachieve any additional market acceptance. If the market fails to grow or grows more slowly than we currentlyexpect, our business, operating results and financial condition would be materially adversely affected.
We have substantial real estate lease commitments for unoccupied space and if we are unable to sublet thisspace on acceptable terms our operating results and financial condition could be adversely affected
We are party to real estate leases for approximately 77,000 square feet of vacant office space. Of the 77,000square feet of vacant office space, 31,000 square feet has been subleased as of December 31, 2003. We haveestablished a restructuring reserve of $6.1 million related to the costs of disposition of this space as of December31, 2003. In establishing this reserve, we have assumed that we will be able to sublet the available space andreceive approximately $4.5 million of sublease income relating to this space over the term of the respectiveleases. We may not be able to sublet this space on the assumed terms. If we are unable to do so, we would incuradditional restructuring costs relating to these leases and would expend more cash than currently expected, whichcould have an adverse effect on our operating results and financial condition.
The price of our stock may be extremely volatile
The market price for our class A common stock has historically been volatile and could fluctuatesignificantly for any of the following reasons:
• quarter-to-quarter variations in our operating results;
• developments or disputes concerning proprietary rights;
43
• technological innovations or new products;
• governmental regulatory action;
• general conditions in the software industry;
• increased price competition;
• changes in revenue or earnings estimates by analysts; or
• other events or factors.
Many of the above factors are beyond our control.
The stock market has recently experienced extreme price and volume fluctuations. These fluctuations haveparticularly affected the market price of many software companies, often without regard to their operatingperformance.
ITEM 7A. QUANTITATIVE AND QUALITATIVE DISCLOSURES ABOUTMARKET RISK
The following discussion about our market risk disclosures involves forward-looking statements. Actualresults could differ materially from those projected in the forward-looking statements. We are exposed to theimpact of interest rate changes and foreign currency fluctuations.
Interest Rate Risk
Our exposure to market risk for changes in interest rates relates primarily to our cash equivalents and short-term investments. We invest our excess cash in short-term, fixed income financial instruments. These fixed rateinvestments are subject to interest rate risk and may fall in value if market interest rates increase. If marketinterest rates were to increase immediately and uniformly by 10% from the levels at December 31, 2003, the fairmarket value of the portfolio would decline by an immaterial amount. We have the ability to hold our fixedincome investments until maturity and, therefore, we do not expect our operating results or cash flows to bematerially affected by a sudden change in market interest rates on our investment portfolio.
Foreign Currency Risk
We face exposure to adverse movements in foreign currency exchange rates. Our international revenues andexpenses are denominated in foreign currencies, principally the Euro and the British pound sterling. Thefunctional currency of each of our foreign subsidiaries is the local currency. Our international business is subjectto risks typical of an international business, including, but not limited to differing tax structures, other regulationsand restrictions, and foreign exchange rate volatility. Based on our overall currency rate exposure at December31, 2003, a 10% change in foreign exchange rates would have had an immaterial effect on our financial position,results of operations and cash flows. International revenues were 33.8%, 36.0%, and 34.0% of total revenues in2001, 2002, and 2003, respectively. We anticipate that international revenues will continue to account for asignificant amount of total revenues. To date, we have not hedged the risks associated with foreign exchangeexposure. Although we may do so in the future, we cannot be sure that any hedging techniques we mayimplement will be successful or that our business, results of operations, financial condition and cash flows willnot be materially adversely affected by exchange rate fluctuations.
ITEM 8. FINANCIAL STATEMENTS AND SUPPLEMENTARY DATA
Our consolidated financial statements, together with the related notes and the report of independentaccountants, are set forth on the pages indicated in Item 15.
ITEM 9. CHANGES IN AND DISAGREEMENTSWITH ACCOUNTANTS ON ACCOUNTING ANDFINANCIAL DISCLOSURE
Not applicable.
44
ITEM 9A. CONTROLS AND PROCEDURES
Evaluation of disclosure controls and procedures. Based on their evaluation of the Company’s disclosurecontrols and procedures (as defined in Rules 13a-15(e) and 15d-15(3) under the Exchange Act) as of December31, 2003, the Company’s chief executive officer and chief financial officer have concluded that the Company’sdisclosure controls and procedures are designed to ensure that information required to be disclosed by theCompany in the reports that it files or submits under the Exchange Act is recorded, processed, summarized andreported within the time periods specified in the SEC’s rules and forms and are operating in an effective manner.
Changes in internal controls. No change in our internal control over financial reporting (as defined inRules 13a-15(f) and 15d-15(f) under the Exchange Act) occurred during the fiscal quarter ended December 31,2003 that has materially affected, or is reasonably likely to materially affect, our internal control over financialreporting.
45
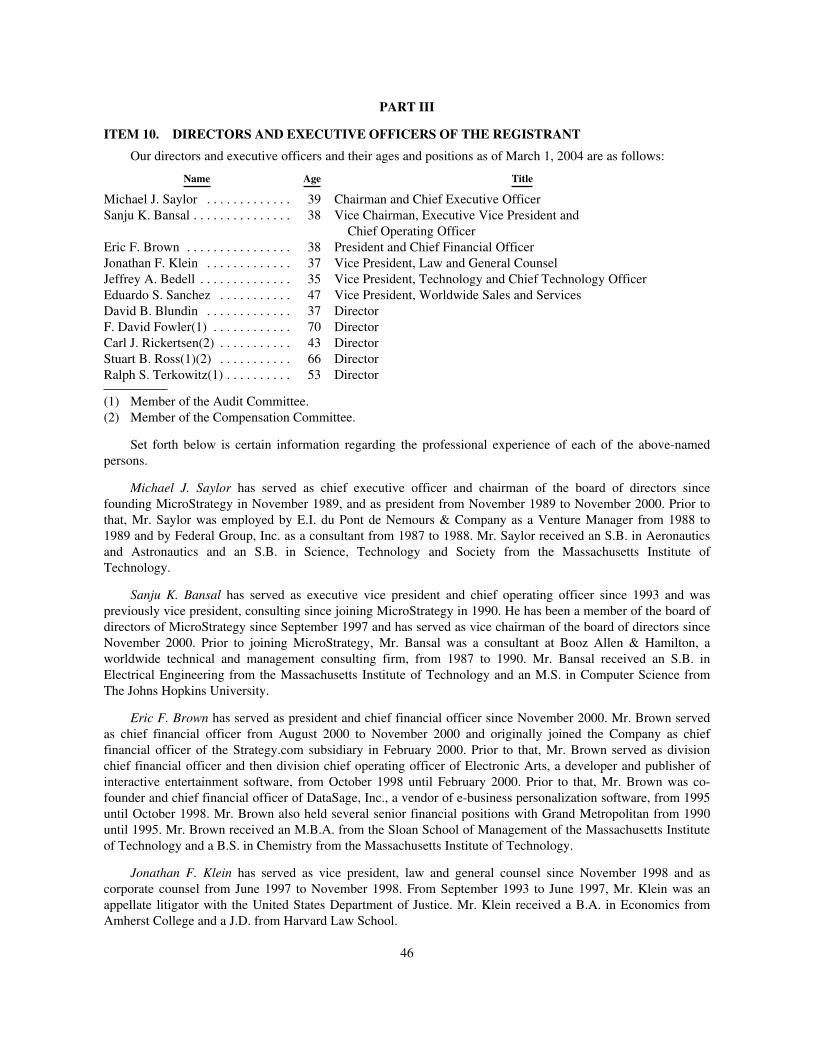
PART III
ITEM 10. DIRECTORS AND EXECUTIVE OFFICERS OF THE REGISTRANT
Our directors and executive officers and their ages and positions as of March 1, 2004 are as follows:
Name Age Title
Michael J. Saylor . . . . . . . . . . . . . 39 Chairman and Chief Executive OfficerSanju K. Bansal . . . . . . . . . . . . . . . 38 Vice Chairman, Executive Vice President and
Chief Operating OfficerEric F. Brown . . . . . . . . . . . . . . . . 38 President and Chief Financial OfficerJonathan F. Klein . . . . . . . . . . . . . 37 Vice President, Law and General CounselJeffrey A. Bedell . . . . . . . . . . . . . . 35 Vice President, Technology and Chief Technology OfficerEduardo S. Sanchez . . . . . . . . . . . 47 Vice President, Worldwide Sales and ServicesDavid B. Blundin . . . . . . . . . . . . . 37 DirectorF. David Fowler(1) . . . . . . . . . . . . 70 DirectorCarl J. Rickertsen(2) . . . . . . . . . . . 43 DirectorStuart B. Ross(1)(2) . . . . . . . . . . . 66 DirectorRalph S. Terkowitz(1) . . . . . . . . . . 53 Director
(1) Member of the Audit Committee.(2) Member of the Compensation Committee.
Set forth below is certain information regarding the professional experience of each of the above-namedpersons.
Michael J. Saylor has served as chief executive officer and chairman of the board of directors sincefounding MicroStrategy in November 1989, and as president from November 1989 to November 2000. Prior tothat, Mr. Saylor was employed by E.I. du Pont de Nemours & Company as a Venture Manager from 1988 to1989 and by Federal Group, Inc. as a consultant from 1987 to 1988. Mr. Saylor received an S.B. in Aeronauticsand Astronautics and an S.B. in Science, Technology and Society from the Massachusetts Institute ofTechnology.
Sanju K. Bansal has served as executive vice president and chief operating officer since 1993 and waspreviously vice president, consulting since joining MicroStrategy in 1990. He has been a member of the board ofdirectors of MicroStrategy since September 1997 and has served as vice chairman of the board of directors sinceNovember 2000. Prior to joining MicroStrategy, Mr. Bansal was a consultant at Booz Allen & Hamilton, aworldwide technical and management consulting firm, from 1987 to 1990. Mr. Bansal received an S.B. inElectrical Engineering from the Massachusetts Institute of Technology and an M.S. in Computer Science fromThe Johns Hopkins University.
Eric F. Brown has served as president and chief financial officer since November 2000. Mr. Brown servedas chief financial officer from August 2000 to November 2000 and originally joined the Company as chieffinancial officer of the Strategy.com subsidiary in February 2000. Prior to that, Mr. Brown served as divisionchief financial officer and then division chief operating officer of Electronic Arts, a developer and publisher ofinteractive entertainment software, from October 1998 until February 2000. Prior to that, Mr. Brown was co-founder and chief financial officer of DataSage, Inc., a vendor of e-business personalization software, from 1995until October 1998. Mr. Brown also held several senior financial positions with Grand Metropolitan from 1990until 1995. Mr. Brown received an M.B.A. from the Sloan School of Management of the Massachusetts Instituteof Technology and a B.S. in Chemistry from the Massachusetts Institute of Technology.
Jonathan F. Klein has served as vice president, law and general counsel since November 1998 and ascorporate counsel from June 1997 to November 1998. From September 1993 to June 1997, Mr. Klein was anappellate litigator with the United States Department of Justice. Mr. Klein received a B.A. in Economics fromAmherst College and a J.D. from Harvard Law School.
46

Jeffrey A. Bedell has served as vice president, technology and chief technology officer since April 2001, asvice president, platform technology from 1999 to 2001, and as senior program manager and director oftechnology programs from 1992 to 1999. Mr. Bedell received a B.A. in Religion from Dartmouth College.
Eduardo S. Sanchez has served as vice president, worldwide sales and services since April 2001, as vicepresident, worldwide sales from 2000 to 2001, as vice president, international operations from 1998 to 2000, asvice president, European operations from 1996 to 1998, as managing director, European operations from 1994 to1996, and as consulting manager, US operations from 1992 to 1994. Mr. Sanchez received a bachelor’s degree inElectrical Engineering from the University of LaPlata in Argentina and a master’s degree in Systems Engineeringfrom George Mason University. Prior to joining MicroStrategy, Mr. Sanchez worked as a consultant in Europe,the United States, South America and Japan, developing and deploying large-scale optimization systems for themanufacturing and power utility sector. In this capacity, he was engaged in significant projects with companiessuch as Mitsubishi, Groupe Saint Gobain, ABB, Siemens and Xerox.
David B. Blundin has been a member of the board of directors of MicroStrategy since September 2002. Mr.Blundin is currently chief executive officer of Vestmark, Inc., a privately-held enterprise software companyfocused on the real-time integration infrastructure market, a position he has held since October 2001. FromJanuary 2000 until October 2001, Mr. Blundin served as chief technologist at Vignette Corporation, a publicly-traded provider of e-business software applications. Mr. Blundin was the chief executive officer of DataSage,Inc., a leading vendor of e-business personalization software, from June 1997 until its acquisition by Vignette inJanuary 2000. Mr. Blundin received a B.S. in Computer Science from the Massachusetts Institute of Technologyin 1988.
F. David Fowler has been a member of the board of directors of MicroStrategy since June 2001. Mr. Fowlerwas the dean of the School of Business and Public Management at The George Washington University from July1992 until his retirement in June 1997 and a member of KPMG LLP from 1963 until his retirement in June 1992.As a member of KPMG, Mr. Fowler served as managing partner of the Washington, DC office from 1987 until1992, as partner in charge of human resources for the firm in New York City, as a member of the firm’s board ofdirectors, operating committee and strategic planning committee and as chairman of the KPMG Foundation andthe KPMG personnel committee. Mr. Fowler is also a member of the board of directors of FBR Funds located inBethesda, Maryland. Mr. Fowler received a B.A./B.S. in Business from the University of Missouri at Columbiain 1955.
Carl J. Rickertsen has been a member of the board of directors of MicroStrategy since October 2002. Mr.Rickertsen is currently managing partner of Pine Creek Partners, a private equity investment firm, a position hehas held since January 2004. From January 1998 until January 2004, Mr. Rickertsen was chief operating officerand a partner at Thayer Capital Partners a private equity investment firm. From September 1994 until January1998, Mr. Rickertsen was a managing partner at Thayer. Mr. Rickertsen was a founding partner of three Thayerinvestment funds totaling over $1.4 billion and is a published author. Mr. Rickertsen is also a member of theboard of directors of Convera Corporation, a publicly-traded search-engine software company, and UnitedAgricultural Products, a distributor of farm and agricultural products. Mr. Rickertsen received a B.S. fromStanford University and an M.B.A. from Harvard Business School.
Stuart B. Ross has been a member of the board of directors of MicroStrategy since June 2001. Mr. Ross heldvarious positions with the Xerox Corporation, a document management technology company, from 1966 untilDecember 1999, including corporate executive vice president, senior vice president of finance and chief financialofficer, vice president/corporate controller and chairman and chief executive officer of Xerox Financial Services.Mr. Ross is also a trustee of the Hansberger Institutional Series, a mutual fund, a member of the board ofdirectors of The World Affairs Forum and a member of the International Executive Service CorporationAdvisory Council. Mr. Ross has been a C.P.A. in the State of New York since 1963. Mr. Ross received a B.S. inAccounting from New York University in 1958 and an M.B.A. from Bernard Baruch College of the City Collegeof New York in 1966.
47

Ralph S. Terkowitz has been a member of the board of directors of MicroStrategy since September 1997.Mr. Terkowitz is currently a special partner at ABS Capital Partners, a private equity investment firm, and aconsultant to The Washington Post Company, a diversified media and education company, positions he has heldsince January 2004. From April 2001 until January 2004, Mr. Terkowitz was chief technology officer for TheWashington Post Company. From 1992 until April 2001, Mr. Terkowitz was vice president, technology for TheWashington Post Company. From February 1995 until February 1996, Mr. Terkowitz was chief executiveofficer, president and publisher of Digital Ink, an Internet publishing venture that launched, among otherventures, WashingtonPost.com and PoliticsNow. In 1998, he was co-chief executive officer of HireSystems andinstrumental in the formation of BrassRing.com. Mr. Terkowitz is also a member of the board of directors ofTruste and Tribe.net. Mr. Terkowitz received an A.B. in Chemistry from Cornell University and an M.S. inChemical Physics from the University of California, Berkeley.
Involvement in Certain Legal Proceedings
On December 14, 2000, Mr. Saylor and Mr. Bansal each entered into a settlement with the SEC inconnection with the restatement of our financial results for 1999, 1998 and 1997. In the settlement, each of Mr.Saylor and Mr. Bansal consented, without admitting or denying the allegations in the SEC’s complaint, to theentry of a judgment enjoining him from violating the antifraud and recordkeeping provisions of the federalsecurities laws and ordering him to pay disgorgement and a civil penalty.
Identification of Audit Committee/Audit Committee Financial Expert
MicroStrategy has a separately-designated standing Audit Committee of the board of directors, whichprovides the opportunity for direct contact between MicroStrategy’s independent auditors and the board ofdirectors. The Audit Committee is currently comprised of Messrs. Fowler, Ross and Terkowitz, and wasestablished in accordance with section 3(a)(58)(A) of the Exchange Act. The board of directors of MicroStrategyhas designated each of Messrs. Fowler and Ross as an audit committee financial expert under Item 401(h) ofRegulation S-K. Both Messrs. Fowler and Ross are “independent” as defined under applicable SEC and Nasdaqrules.
Section 16(a) Beneficial Ownership Reporting Compliance
Section 16(a) of the Exchange Act, requires our directors, executive officers and holders of more than 10%of our class A common stock to file with the SEC initial reports of ownership of our class A common stock andother equity securities on a Form 3 and reports of changes in such ownership on a Form 4 or Form 5. Directors,executive officers, and holders of 10% of our class A common stock are required by SEC regulations to furnishus with copies of all Section 16(a) forms they file. To our knowledge, based solely on a review of our records andrepresentations made by our directors and executive officers regarding their filing obligations, all Section 16(a)filing requirements were satisfied with respect to the fiscal year ended December 31, 2003 (“Fiscal Year 2003”)except that, due to a clerical error, a Form 4 reporting the grant of a stock option to Stuart B. Ross was filed oneday late.
Code of Ethics
On March 5, 2004, the Board of Directors, through its Audit Committee, adopted a Code of Ethics thatapplies to MicroStrategy’s principal executive officer, principal financial officer, principal accounting officer orcontroller, or persons performing similar functions, and such other personnel of MicroStrategy or its majority-owned subsidiaries as may be designated from time to time by the chairman of the Audit Committee. The Codeof Ethics is publicly available at our website www.microstrategy.com. We intend to disclose any amendments tothe Code of Ethics or any waiver from a provision of the Code of Ethics on our website www.microstrategy.com.
48
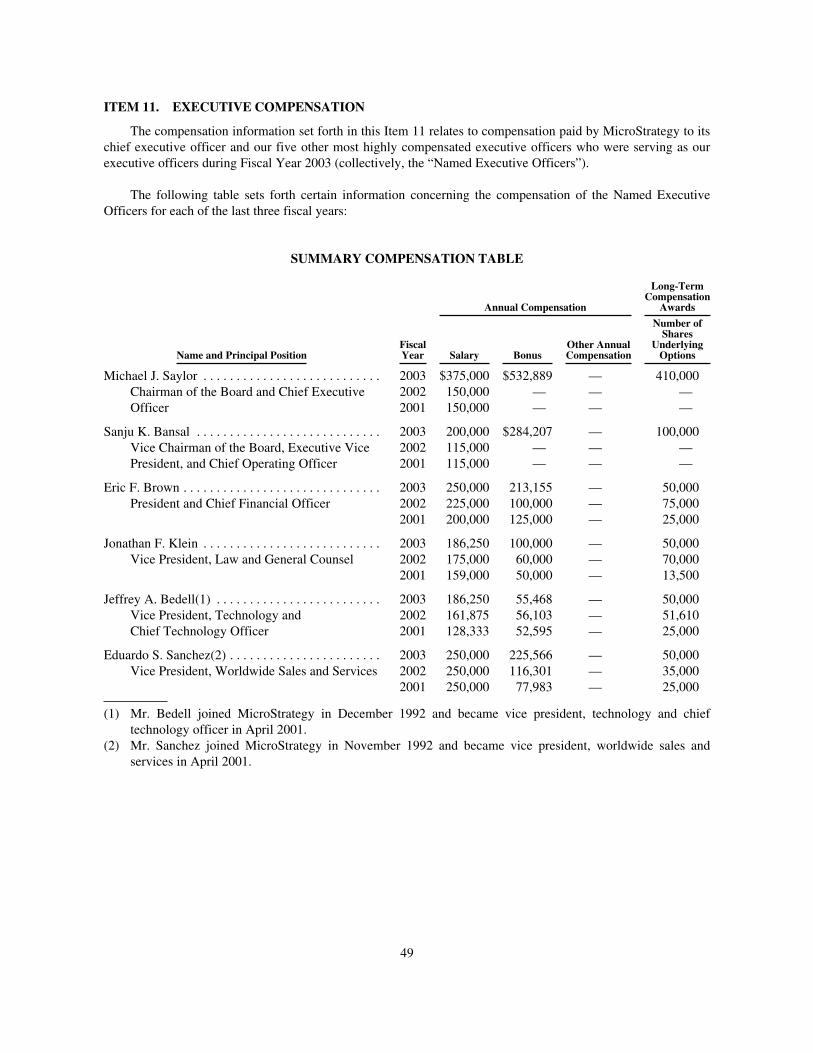
ITEM 11. EXECUTIVE COMPENSATION
The compensation information set forth in this Item 11 relates to compensation paid by MicroStrategy to itschief executive officer and our five other most highly compensated executive officers who were serving as ourexecutive officers during Fiscal Year 2003 (collectively, the “Named Executive Officers”).
The following table sets forth certain information concerning the compensation of the Named ExecutiveOfficers for each of the last three fiscal years:
SUMMARY COMPENSATION TABLE
Annual Compensation
Long-TermCompensationAwards
Name and Principal PositionFiscalYear Salary Bonus
Other AnnualCompensation
Number ofSharesUnderlyingOptions
Michael J. Saylor . . . . . . . . . . . . . . . . . . . . . . . . . . .Chairman of the Board and Chief ExecutiveOfficer
200320022001
$375,000150,000150,000
$532,889——
———
410,000——
Sanju K. Bansal . . . . . . . . . . . . . . . . . . . . . . . . . . . .Vice Chairman of the Board, Executive VicePresident, and Chief Operating Officer
200320022001
200,000115,000115,000
$284,207——
———
100,000——
Eric F. Brown . . . . . . . . . . . . . . . . . . . . . . . . . . . . . .President and Chief Financial Officer
200320022001
250,000225,000200,000
213,155100,000125,000
———
50,00075,00025,000
Jonathan F. Klein . . . . . . . . . . . . . . . . . . . . . . . . . . .Vice President, Law and General Counsel
200320022001
186,250175,000159,000
100,00060,00050,000
———
50,00070,00013,500
Jeffrey A. Bedell(1) . . . . . . . . . . . . . . . . . . . . . . . . .Vice President, Technology andChief Technology Officer
200320022001
186,250161,875128,333
55,46856,10352,595
———
50,00051,61025,000
Eduardo S. Sanchez(2) . . . . . . . . . . . . . . . . . . . . . . .Vice President, Worldwide Sales and Services
200320022001
250,000250,000250,000
225,566116,30177,983
———
50,00035,00025,000
(1) Mr. Bedell joined MicroStrategy in December 1992 and became vice president, technology and chieftechnology officer in April 2001.
(2) Mr. Sanchez joined MicroStrategy in November 1992 and became vice president, worldwide sales andservices in April 2001.
49

Option Grants Table
The following table contains information concerning grants of stock options made to each of the NamedExecutive Officers during Fiscal Year 2003:
OPTION GRANTS IN LAST FISCAL YEARIndividual Grants
Name
Number of Sharesof Class A
Common StockUnderlying OptionsGranted(1)
% of TotalOptions Grantedto Employeesin 2003
ExercisePrice PerShare(2)
ExpirationDate
Potential RealizableValue at AssumedAnnual Rates of StockPrice Appreciation forOption Term(3)
5% 10%
Michael J. Saylor . . . . . . 410,000 39.5% $20.69 2/8/13 $5,334,850 $13,519,558
Sanju K. Bansal . . . . . . . 100,000 9.6% $20.69 2/8/13 $1,301,183 $ 3,297,453
Eric F. Brown . . . . . . . . 50,000 4.8% $20.69 2/8/13 $ 650,591 $ 1,648,727
Jonathan F. Klein . . . . . 50,000 4.8% $20.69 2/8/13 $ 650,591 $ 1,648,727
Jeffrey A. Bedell . . . . . . 50,000 4.8% $20.69 2/8/13 $ 650,591 $ 1,648,727
Eduardo S. Sanchez . . . . 50,000 4.8% $20.69 2/8/13 $ 650,591 $ 1,648,727
(1) These options vest over a five-year period and expire on the tenth anniversary of the date of grant.(2) The exercise price of options of MicroStrategy may be paid in cash or in shares of our class A common
stock, valued at fair market value on the exercise date. All stock options were granted with an exercise priceequal to the fair market value of such stock as determined by our board of directors on the grant date.
(3) The potential realizable value is calculated based on the term of the option at its time of grant (ten years). Itis calculated assuming that the fair market value of our class A common stock on the date of grantappreciates at the indicated annual rate compounded annually for the entire term of the option and that theoption is exercised and sold on the last day of its term for the appreciated stock price.
50

Option Exercises and Holdings
The following table sets forth information concerning each exercise of a stock option during Fiscal Year2003 by each of the Named Executive Officers and the number and value of unexercised options held by each ofthe Named Executive Officers on December 31, 2003.
AGGREGATED OPTION EXERCISES IN LAST FISCAL YEARAND FISCAL YEAR-END OPTION VALUES
Name
Number of Sharesof Class A CommonStock Acquiredon Exercise
ValueRealized(1)
Number of Shares of Class ACommon Stock UnderlyingUnexercised Optionsat Fiscal Year-End
Exercisable/Unexercisable
Value of UnexercisedIn-the-Money Optionsat Fiscal Year-End(2)Exercisable/Unexercisable
Michael J. Saylor . . . . . . . . — $ — — / 410,000 $— /$13,033,900
Sanju K. Bansal . . . . . . . . . . — — — / 100,000 — / 3,179,000
Eric F. Brown . . . . . . . . . . . 31,250 809,125 30,000 / 138,751 — / 4,623,125
Jonathan F. Klein . . . . . . . . 29,986 729,455 7,712 / 112,351 8,329 / 4,284,790
Jeffrey A. Bedell . . . . . . . . . — — 41,839 / 106,482 1,234,099 / 3,755,728
Eduardo S. Sanchez . . . . . . — — 54,250 / 91,750 1,455,755 / 3,189,725
(1) Represents the difference between the exercise price and the fair market value of our class A common stockon the date of exercise.
(2) Value of an unexercised in-the-money option is determined by subtracting the exercise price per share fromthe fair market value per share for the underlying shares as of December 31, 2003, multiplied by the numberof such underlying shares. The fair market value of our class A common stock is based upon the lastreported sale price as reported on the Nasdaq National Market on December 31, 2003 ($52.48 per share).
Directors’ Compensation
Equity Compensation
On February 8, 2003, the compensation committee of the board of directors granted the following stockoptions under our Second Amended and Restated 1999 Stock Option Plan (“1999 Plan”) to directors who wereserving on the board on such date and who were not employees of MicroStrategy or any subsidiary: (1) an optionto purchase 17,000 shares of class A common stock to David B. Blundin, (2) an option to purchase 25,000 sharesof class A common stock to F. David Fowler, (3) an option to purchase 17,000 shares of class A common stockto Jonathan J. Ledecky, (4) an option to purchase 25,000 shares of class A common stock to Carl J. Rickertsen,(5) an option to purchase 17,000 shares of class A common stock to Stuart B. Ross and (6) an option to purchase17,000 shares of class A common stock to Ralph S. Terkowitz. Each of these options has an exercise price equalto the fair market value of the class A common stock on the last trading day immediately preceding the date ofgrant, or $20.69 per share, and becomes exercisable in equal annual installments over a five-year period.
Effective January 1, 2003, directors who are not employees of MicroStrategy or any subsidiary (an “OutsideDirector”) will be granted stock options under our 1999 Plan pursuant to the following standard arrangement: (1)each Outside Director will be granted an option to purchase 17,000 shares of class A common stock upon anOutside Director’s initial election or appointment to the board of directors (“First Option”), and (2) each OutsideDirector will be granted an option to purchase an additional 8,000 shares of class A common stock upon theinitial election or appointment of an Outside Director as the chairperson of the Compensation Committee orAudit Committee of the board of directors (the “Chairperson Option”), provided that the aggregate number ofshares of class A common stock subject to the First Option and any Chairperson Option granted to any individualOutside Director may not exceed 25,000 shares. First Options and Chairperson Options become exercisable inequal annual installments over a five-year period.
51

Each option granted to an Outside Director under the 1999 Plan has an exercise price equal to the lastreported sale price of the class A common stock as reported on the Nasdaq National Market for the most recenttrading day prior to the date of grant. In the event of a merger of MicroStrategy with or into another corporationor another qualifying acquisition event, each option will be assumed or an equivalent option will be substitutedby the successor corporation. If the successor corporation does not assume outstanding options or such optionsare not otherwise exchanged, all outstanding options automatically will become immediately exercisable.
Fees
Effective January 1, 2003, each Outside Director receives an annual retainer of $15,000 (in four quarterlyinstallments payable on the first day of each calendar quarter in arrears) for serving on our board of directors, anda fee of $3,750 for each quarterly meeting of the board of directors that such Outside Director attends in person.Each Outside Director who is a member of the Audit Committee (except the chairperson) also receives $1,000for each meeting of the Audit Committee that such member attends in person. The chairperson of each of theAudit Committee and the Compensation Committee also receives an annual retainer of $7,500 (in four equalquarterly installments payable on the first day of each calendar quarter in arrears), and a fee of $1,875 for eachmeeting of their respective committees that such chairperson attends in person. The annual retainer feesdescribed above are prorated for the number of days that the individual served as an Outside Director or as acommittee chairperson, as the case may be, during the immediately preceding calendar quarter. Each OutsideDirector is reimbursed for all reasonable out-of-pocket expenses incurred by him or her in attending meetings ofthe board of directors and any committee thereof and otherwise in performing his or her duties as an OutsideDirector, subject to compliance with our standard documentation policies regarding reimbursement of businessexpenses.
Employment Agreements
Our employees, including our executive officers, are generally required to enter into confidentialityagreements prohibiting the employees from disclosing any of our confidential or proprietary information. Inaddition, the agreements generally provide that upon termination, an employee will not provide competitiveproducts or services and will not solicit our customers and employees for a period of one year. At the time ofcommencement of employment, our employees also generally sign offer letters specifying certain basic termsand conditions of employment. Otherwise, our employees are generally not subject to written employmentagreements.
In July 2002, each of Messrs. Bedell, Brown, Klein and Sanchez were granted options to purchase 50,000,75,000, 70,000 and 35,000 shares of class A common stock, respectively, under our 1999 Plan. The optionagreements for each of these grants provide for the acceleration of vesting in the event of a change in control ofthe Company such that, as of the effective date of the change in control, at least fifty percent of the original grantis fully vested and the remaining unvested portion will vest as to fifty percent of the remaining unvested shareson the last day of the third month after the effective date of the change in control and the remaining unvestedshares will vest on the last day of the sixth month after the effective date of the change in control. In addition,these option agreements provide that if, following the change in control, such officer’s employment is terminatedby MicroStrategy other than for cause or by such officer for good reason, the option will vest in full on theeffective date of such termination.
52
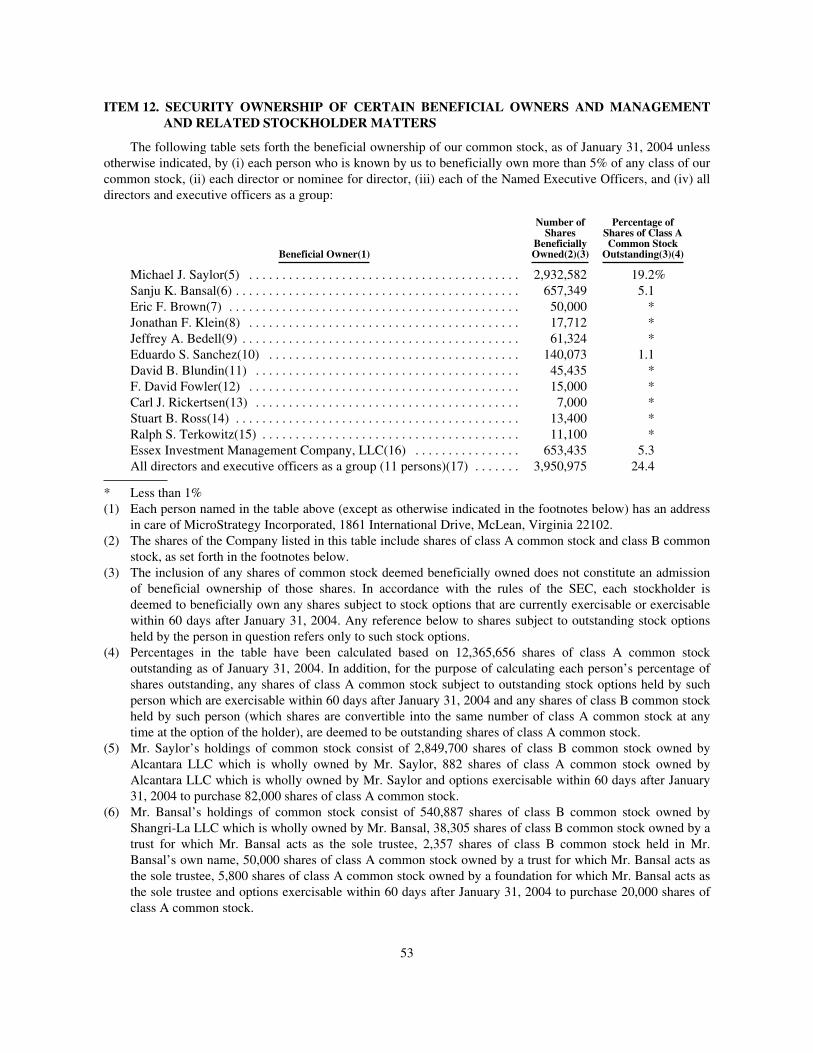
ITEM 12. SECURITY OWNERSHIP OF CERTAIN BENEFICIAL OWNERS AND MANAGEMENTAND RELATED STOCKHOLDERMATTERS
The following table sets forth the beneficial ownership of our common stock, as of January 31, 2004 unlessotherwise indicated, by (i) each person who is known by us to beneficially own more than 5% of any class of ourcommon stock, (ii) each director or nominee for director, (iii) each of the Named Executive Officers, and (iv) alldirectors and executive officers as a group:
Beneficial Owner(1)
Number ofShares
BeneficiallyOwned(2)(3)
Percentage ofShares of Class ACommon StockOutstanding(3)(4)
Michael J. Saylor(5) . . . . . . . . . . . . . . . . . . . . . . . . . . . . . . . . . . . . . . . . . 2,932,582 19.2%Sanju K. Bansal(6) . . . . . . . . . . . . . . . . . . . . . . . . . . . . . . . . . . . . . . . . . . . 657,349 5.1Eric F. Brown(7) . . . . . . . . . . . . . . . . . . . . . . . . . . . . . . . . . . . . . . . . . . . . 50,000 *Jonathan F. Klein(8) . . . . . . . . . . . . . . . . . . . . . . . . . . . . . . . . . . . . . . . . . 17,712 *Jeffrey A. Bedell(9) . . . . . . . . . . . . . . . . . . . . . . . . . . . . . . . . . . . . . . . . . . 61,324 *Eduardo S. Sanchez(10) . . . . . . . . . . . . . . . . . . . . . . . . . . . . . . . . . . . . . . 140,073 1.1David B. Blundin(11) . . . . . . . . . . . . . . . . . . . . . . . . . . . . . . . . . . . . . . . . 45,435 *F. David Fowler(12) . . . . . . . . . . . . . . . . . . . . . . . . . . . . . . . . . . . . . . . . . 15,000 *Carl J. Rickertsen(13) . . . . . . . . . . . . . . . . . . . . . . . . . . . . . . . . . . . . . . . . 7,000 *Stuart B. Ross(14) . . . . . . . . . . . . . . . . . . . . . . . . . . . . . . . . . . . . . . . . . . . 13,400 *Ralph S. Terkowitz(15) . . . . . . . . . . . . . . . . . . . . . . . . . . . . . . . . . . . . . . . 11,100 *Essex Investment Management Company, LLC(16) . . . . . . . . . . . . . . . . 653,435 5.3All directors and executive officers as a group (11 persons)(17) . . . . . . . 3,950,975 24.4
* Less than 1%(1) Each person named in the table above (except as otherwise indicated in the footnotes below) has an address
in care of MicroStrategy Incorporated, 1861 International Drive, McLean, Virginia 22102.(2) The shares of the Company listed in this table include shares of class A common stock and class B common
stock, as set forth in the footnotes below.(3) The inclusion of any shares of common stock deemed beneficially owned does not constitute an admission
of beneficial ownership of those shares. In accordance with the rules of the SEC, each stockholder isdeemed to beneficially own any shares subject to stock options that are currently exercisable or exercisablewithin 60 days after January 31, 2004. Any reference below to shares subject to outstanding stock optionsheld by the person in question refers only to such stock options.
(4) Percentages in the table have been calculated based on 12,365,656 shares of class A common stockoutstanding as of January 31, 2004. In addition, for the purpose of calculating each person’s percentage ofshares outstanding, any shares of class A common stock subject to outstanding stock options held by suchperson which are exercisable within 60 days after January 31, 2004 and any shares of class B common stockheld by such person (which shares are convertible into the same number of class A common stock at anytime at the option of the holder), are deemed to be outstanding shares of class A common stock.
(5) Mr. Saylor’s holdings of common stock consist of 2,849,700 shares of class B common stock owned byAlcantara LLC which is wholly owned by Mr. Saylor, 882 shares of class A common stock owned byAlcantara LLC which is wholly owned by Mr. Saylor and options exercisable within 60 days after January31, 2004 to purchase 82,000 shares of class A common stock.
(6) Mr. Bansal’s holdings of common stock consist of 540,887 shares of class B common stock owned byShangri-La LLC which is wholly owned by Mr. Bansal, 38,305 shares of class B common stock owned by atrust for which Mr. Bansal acts as the sole trustee, 2,357 shares of class B common stock held in Mr.Bansal’s own name, 50,000 shares of class A common stock owned by a trust for which Mr. Bansal acts asthe sole trustee, 5,800 shares of class A common stock owned by a foundation for which Mr. Bansal acts asthe sole trustee and options exercisable within 60 days after January 31, 2004 to purchase 20,000 shares ofclass A common stock.
53
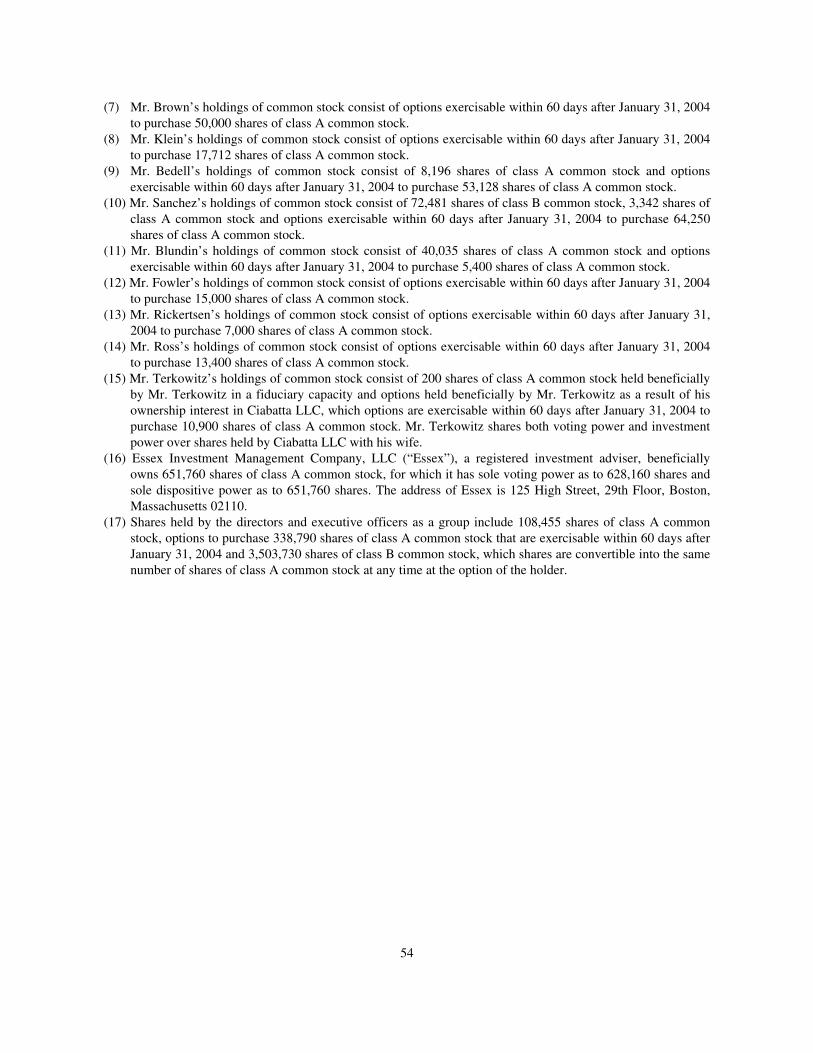
(7) Mr. Brown’s holdings of common stock consist of options exercisable within 60 days after January 31, 2004to purchase 50,000 shares of class A common stock.
(8) Mr. Klein’s holdings of common stock consist of options exercisable within 60 days after January 31, 2004to purchase 17,712 shares of class A common stock.
(9) Mr. Bedell’s holdings of common stock consist of 8,196 shares of class A common stock and optionsexercisable within 60 days after January 31, 2004 to purchase 53,128 shares of class A common stock.
(10) Mr. Sanchez’s holdings of common stock consist of 72,481 shares of class B common stock, 3,342 shares ofclass A common stock and options exercisable within 60 days after January 31, 2004 to purchase 64,250shares of class A common stock.
(11) Mr. Blundin’s holdings of common stock consist of 40,035 shares of class A common stock and optionsexercisable within 60 days after January 31, 2004 to purchase 5,400 shares of class A common stock.
(12) Mr. Fowler’s holdings of common stock consist of options exercisable within 60 days after January 31, 2004to purchase 15,000 shares of class A common stock.
(13) Mr. Rickertsen’s holdings of common stock consist of options exercisable within 60 days after January 31,2004 to purchase 7,000 shares of class A common stock.
(14) Mr. Ross’s holdings of common stock consist of options exercisable within 60 days after January 31, 2004to purchase 13,400 shares of class A common stock.
(15) Mr. Terkowitz’s holdings of common stock consist of 200 shares of class A common stock held beneficiallyby Mr. Terkowitz in a fiduciary capacity and options held beneficially by Mr. Terkowitz as a result of hisownership interest in Ciabatta LLC, which options are exercisable within 60 days after January 31, 2004 topurchase 10,900 shares of class A common stock. Mr. Terkowitz shares both voting power and investmentpower over shares held by Ciabatta LLC with his wife.
(16) Essex Investment Management Company, LLC (“Essex”), a registered investment adviser, beneficiallyowns 651,760 shares of class A common stock, for which it has sole voting power as to 628,160 shares andsole dispositive power as to 651,760 shares. The address of Essex is 125 High Street, 29th Floor, Boston,Massachusetts 02110.
(17) Shares held by the directors and executive officers as a group include 108,455 shares of class A commonstock, options to purchase 338,790 shares of class A common stock that are exercisable within 60 days afterJanuary 31, 2004 and 3,503,730 shares of class B common stock, which shares are convertible into the samenumber of shares of class A common stock at any time at the option of the holder.
54

The following table provides information about the securities authorized for issuance under the Company’sequity compensation plans as of December 31, 2003:
EQUITY COMPENSATION PLAN INFORMATION
(a) (b) (c)
Plan category
Number of securities tobe issued upon exerciseof outstanding options,warrants and rights
Weighted averageexercise price ofoutstanding options,warrants and rights
Number of securitiesremaining available forfuture issuance underequity compensation
plans (excluding securitiesreflected in column (a))
Equity compensation plans approved bystockholders(1) . . . . . . . . . . . . . . . . . . . . . . . 2,436,884(2) $78.96 1,868,751(3)
Equity compensation plans not approved bystockholders . . . . . . . . . . . . . . . . . . . . . . . . . — — —Total . . . . . . . . . . . . . . . . . . . . . . . . . . . . . 2,436,884(2) $78.96 1,868,751(3)
(1) Includes our 1996 Stock Plan (“1996 Plan”), 1997 Stock Option Plan for French Employees (“FrenchPlan”), 1997 Director Option Plan (“1997 Director Plan”), 1998 Employee Stock Purchase Plan (“ESPP”)and 1999 Plan. We are no longer issuing options under our 1996 Plan, 1997 Plan and French Plan.
(2) Does not include options issued under the ESPP for the offering period beginning August 1, 2003 andending on January 31, 2004.
(3) Includes 1,833,756 shares of class A common stock issuable under our 1996 Plan, French Plan, 1997Director Plan and 1999 Plan, as of December 31, 2003. Although there are 419,623 shares available forfuture issuance under the 1996 Plan, the Company does not anticipate making any future stock option grantsunder this plan. The ESPP provides for an increase in the number of shares of our class A common stockavailable for issuance under the plan on June 4 of each year by 20,000 shares, or a lesser amount as may bedetermined by our board of directors. As of December 31, 2003, 34,995 shares of class A common stockwere available for issuance under the ESPP, excluding any options granted for the offering period beginningon August 1, 2003 and ending on January 31, 2004.
ITEM 13. CERTAIN RELATIONSHIPS AND RELATED TRANSACTIONS
Michael J. Saylor, our chairman of the board of directors and chief executive officer, and certain otherMicroStrategy personnel periodically utilize private aircraft when traveling for company business. Mr. Saylorindirectly owns, or has had an ownership interest in, such private aircraft. Under company policy, Mr. Saylor iseligible to receive reimbursement in an amount approximating the cost of a first class commercial airline fare foreach eligible person traveling for company business on each flight, up to a maximum aggregate amount of$10,000 for any given flight. From January 1, 2003 through March 1, 2004, we paid to Mr. Saylor approximately$49,000 in such reimbursement, with an additional amount of approximately $60,000 subject to reimbursement,but not yet paid, for flights taken during such period.
ITEM 14. PRINCIPAL ACCOUNTANT FEES AND SERVICES
Aggregate fees for professional services rendered to the Company by PricewaterhouseCoopers LLP as of orfor the years ended December 31, 2003 and 2002 are summarized in the table below.
2003 2002
Audit . . . . . . . . . . . . . . . . . . . . . . . . . . . . . . . . . . . . . . . . . . . . . . . . $ 862,949 $ 783,960Audit Related . . . . . . . . . . . . . . . . . . . . . . . . . . . . . . . . . . . . . . . . . . 75,530 80,977Tax . . . . . . . . . . . . . . . . . . . . . . . . . . . . . . . . . . . . . . . . . . . . . . . . . . 453,977 335,939All Other . . . . . . . . . . . . . . . . . . . . . . . . . . . . . . . . . . . . . . . . . . . . . 6,400 1,400
Total . . . . . . . . . . . . . . . . . . . . . . . . . . . . . . . . . . . . . . . . . . . . $1,398,856 $1,202,276
55
Audit fees for the years ended December 31, 2003 and 2002, respectively, were for professional servicesrendered for the audits of the consolidated financial statements of the Company and statutory and subsidiaryaudits, income tax provision procedures, and assistance with review of documents filed with the SEC.
Audit Related fees as of the years ended December 31, 2003 and 2002, respectively, were for assurance andrelated services related to employee benefit plan audits, accounting consultations and consultations concerningfinancial and accounting and reporting standards.
Tax fees as of the years ended December 31, 2003 and 2002, respectively, were for services related to taxcompliance, including the preparation of tax returns, tax planning and tax advice.
All Other fees as of the years ended December 31, 2003 and 2002, respectively, were primarily for licensefees for online financial reporting and assurance literature.
Audit Committee Pre-Approval Policies and Procedures
During Fiscal Year 2003, the Audit Committee pre-approved all services (audit and non-audit) provided toMicroStrategy by our independent auditor. In situations where a matter cannot wait until a full Audit Committeemeeting, a subcommittee of the Audit Committee, consisting of the Chairman of the Audit Committee, hasauthority to consider, and if appropriate, approve audit and non-audit services. Any decision by thissubcommittee of the Audit Committee to pre-approve services must be presented to the full Audit Committee forapproval at its next scheduled quarterly meeting. The Audit Committee requires MicroStrategy to make requireddisclosure in our Securities and Exchange Commission periodic reports relating to the approval by the AuditCommittee of audit and non-audit services to be performed by the independent auditor and the fees paid by us forsuch services.
56
PART IV
ITEM 15. EXHIBITS, FINANCIAL STATEMENT SCHEDULES, AND REPORTS ON FORM 8-K
(a) The following documents are filed as part of this Report:
Page
1. Consolidated Financial StatementsReport of Independent Auditors . . . . . . . . . . . . . . . . . . . . . . . . . . . . . . . . . . . . . . . . . . . . . . . . . . . . 58Consolidated Financial Statements:
Balance Sheets . . . . . . . . . . . . . . . . . . . . . . . . . . . . . . . . . . . . . . . . . . . . . . . . . . . . . . . . . . . . . 59Statements of Operations . . . . . . . . . . . . . . . . . . . . . . . . . . . . . . . . . . . . . . . . . . . . . . . . . . . . . 60Statements of Stockholders’ Equity (Deficit) . . . . . . . . . . . . . . . . . . . . . . . . . . . . . . . . . . . . . . 61Statements of Cash Flows . . . . . . . . . . . . . . . . . . . . . . . . . . . . . . . . . . . . . . . . . . . . . . . . . . . . . 63
Notes to Consolidated Financial Statements . . . . . . . . . . . . . . . . . . . . . . . . . . . . . . . . . . . . . . . . . . 65
2. Consolidated Financial Statement Schedule
Schedule II—Valuation and Qualifying Account . . . . . . . . . . . . . . . . . . . . . . . . . . . . . . . . . . . . . . 92
3. Exhibits . . . . . . . . . . . . . . . . . . . . . . . . . . . . . . . . . . . . . . . . . . . . . . . . . . . . . . . . . . . . . . . . . . . . . . . 93
(b) Reports on Form 8-K
On October 28, 2003, the Company filed a Current Report on Form 8-K dated October 28, 2003 toreport that it had issued a press release announcing its financial results for the quarter ended September 30,2003 and providing additional outlook and financial guidance information.
On December 12, 2003, the Company filed a Current Report on Form 8-K dated December 10, 2003 toreport that on December 10, 2003, the Company issued a press release announcing that it had filed a patentinfringement lawsuit against Crystal Decisions, Inc. in the United States District Court for the District ofDelaware.
(c) Exhibits
We hereby file as part of this Form 10-K the exhibits listed in the Index to Exhibits.
(d) Financial Statement Schedule
The following financial statement schedule is filed herewith:
Schedule II—Valuation and Qualifying Account
All other items included in an Annual Report on Form 10-K are omitted because they are not applicable orthe answers thereto are none.
57
REPORT OF INDEPENDENT AUDITORS
To the Board of Directors and StockholdersMicroStrategy Incorporated
In our opinion, the consolidated financial statements listed in the index appearing under Item 15(a)(1) presentfairly, in all material respects, the financial position of MicroStrategy Incorporated and its subsidiaries atDecember 31, 2003 and 2002, and the results of their operations and their cash flows for each of the three yearsin the period ended December 31, 2003 in conformity with accounting principles generally accepted in theUnited States of America. In addition, in our opinion, the financial statement schedule listed under Item 15(a)(2)in the accompanying index presents fairly, in all material respects, the information set forth therein when read inconjunction with the related consolidated financial statements. These financial statements and financial statementschedule are the responsibility of the Company’s management; our responsibility is to express an opinion onthese financial statements and financial statement schedule based on our audits. We conducted our audits of thesestatements in accordance with auditing standards generally accepted in the United States of America, whichrequire that we plan and perform the audit to obtain reasonable assurance about whether the financial statementsare free of material misstatement. An audit includes examining, on a test basis, evidence supporting the amountsand disclosures in the financial statements, assessing the accounting principles used and significant estimatesmade by management, and evaluating the overall financial statement presentation. We believe that our auditsprovide a reasonable basis for our opinion.
/s/ PRICEWATERHOUSECOOPERS LLPPRICEWATERHOUSECOOPERS LLP
McLean, VirginiaFebruary 27, 2004
58
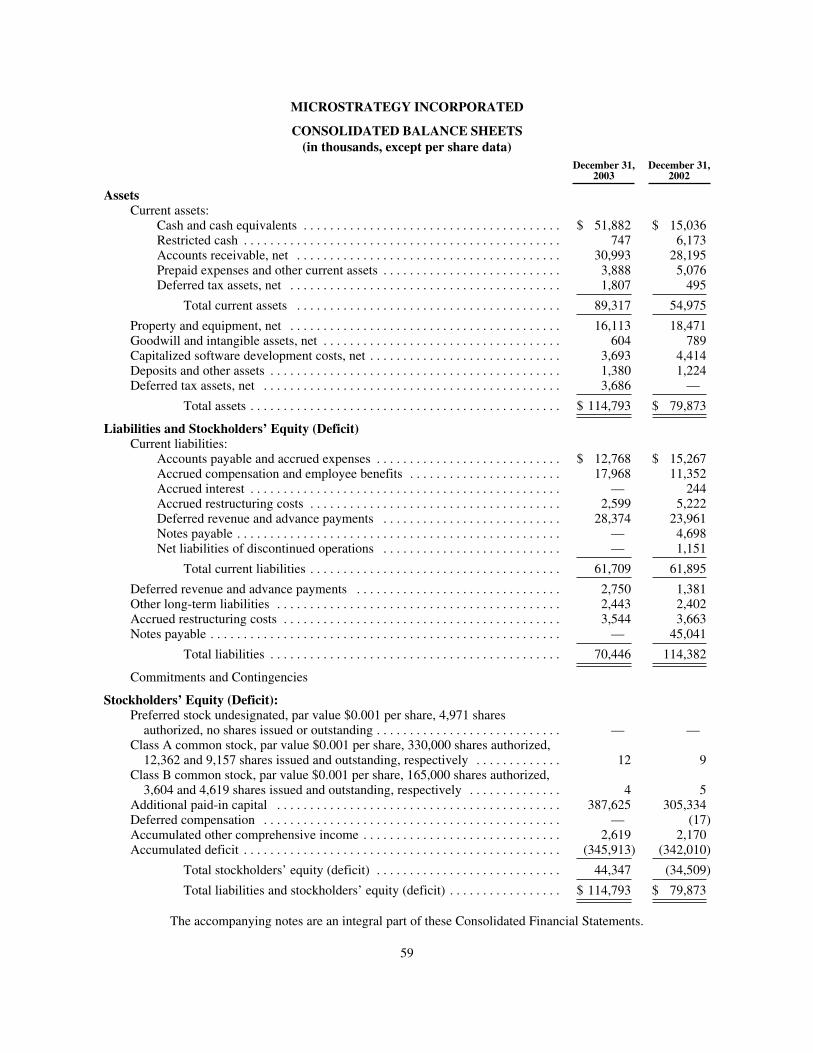
MICROSTRATEGY INCORPORATED
CONSOLIDATED BALANCE SHEETS(in thousands, except per share data)
December 31,2003
December 31,2002
AssetsCurrent assets:
Cash and cash equivalents . . . . . . . . . . . . . . . . . . . . . . . . . . . . . . . . . . . . . . . $ 51,882 $ 15,036Restricted cash . . . . . . . . . . . . . . . . . . . . . . . . . . . . . . . . . . . . . . . . . . . . . . . . 747 6,173Accounts receivable, net . . . . . . . . . . . . . . . . . . . . . . . . . . . . . . . . . . . . . . . . 30,993 28,195Prepaid expenses and other current assets . . . . . . . . . . . . . . . . . . . . . . . . . . . 3,888 5,076Deferred tax assets, net . . . . . . . . . . . . . . . . . . . . . . . . . . . . . . . . . . . . . . . . . 1,807 495
Total current assets . . . . . . . . . . . . . . . . . . . . . . . . . . . . . . . . . . . . . . . . 89,317 54,975
Property and equipment, net . . . . . . . . . . . . . . . . . . . . . . . . . . . . . . . . . . . . . . . . . 16,113 18,471Goodwill and intangible assets, net . . . . . . . . . . . . . . . . . . . . . . . . . . . . . . . . . . . . 604 789Capitalized software development costs, net . . . . . . . . . . . . . . . . . . . . . . . . . . . . . 3,693 4,414Deposits and other assets . . . . . . . . . . . . . . . . . . . . . . . . . . . . . . . . . . . . . . . . . . . . 1,380 1,224Deferred tax assets, net . . . . . . . . . . . . . . . . . . . . . . . . . . . . . . . . . . . . . . . . . . . . . 3,686 —
Total assets . . . . . . . . . . . . . . . . . . . . . . . . . . . . . . . . . . . . . . . . . . . . . . . $ 114,793 $ 79,873
Liabilities and Stockholders’ Equity (Deficit)Current liabilities:
Accounts payable and accrued expenses . . . . . . . . . . . . . . . . . . . . . . . . . . . . $ 12,768 $ 15,267Accrued compensation and employee benefits . . . . . . . . . . . . . . . . . . . . . . . 17,968 11,352Accrued interest . . . . . . . . . . . . . . . . . . . . . . . . . . . . . . . . . . . . . . . . . . . . . . . — 244Accrued restructuring costs . . . . . . . . . . . . . . . . . . . . . . . . . . . . . . . . . . . . . . 2,599 5,222Deferred revenue and advance payments . . . . . . . . . . . . . . . . . . . . . . . . . . . 28,374 23,961Notes payable . . . . . . . . . . . . . . . . . . . . . . . . . . . . . . . . . . . . . . . . . . . . . . . . . — 4,698Net liabilities of discontinued operations . . . . . . . . . . . . . . . . . . . . . . . . . . . — 1,151
Total current liabilities . . . . . . . . . . . . . . . . . . . . . . . . . . . . . . . . . . . . . . 61,709 61,895
Deferred revenue and advance payments . . . . . . . . . . . . . . . . . . . . . . . . . . . . . . . 2,750 1,381Other long-term liabilities . . . . . . . . . . . . . . . . . . . . . . . . . . . . . . . . . . . . . . . . . . . 2,443 2,402Accrued restructuring costs . . . . . . . . . . . . . . . . . . . . . . . . . . . . . . . . . . . . . . . . . . 3,544 3,663Notes payable . . . . . . . . . . . . . . . . . . . . . . . . . . . . . . . . . . . . . . . . . . . . . . . . . . . . . — 45,041
Total liabilities . . . . . . . . . . . . . . . . . . . . . . . . . . . . . . . . . . . . . . . . . . . . 70,446 114,382
Commitments and Contingencies
Stockholders’ Equity (Deficit):Preferred stock undesignated, par value $0.001 per share, 4,971 sharesauthorized, no shares issued or outstanding . . . . . . . . . . . . . . . . . . . . . . . . . . . . — —
Class A common stock, par value $0.001 per share, 330,000 shares authorized,12,362 and 9,157 shares issued and outstanding, respectively . . . . . . . . . . . . . 12 9
Class B common stock, par value $0.001 per share, 165,000 shares authorized,3,604 and 4,619 shares issued and outstanding, respectively . . . . . . . . . . . . . . 4 5
Additional paid-in capital . . . . . . . . . . . . . . . . . . . . . . . . . . . . . . . . . . . . . . . . . . . 387,625 305,334Deferred compensation . . . . . . . . . . . . . . . . . . . . . . . . . . . . . . . . . . . . . . . . . . . . . — (17)Accumulated other comprehensive income . . . . . . . . . . . . . . . . . . . . . . . . . . . . . . 2,619 2,170Accumulated deficit . . . . . . . . . . . . . . . . . . . . . . . . . . . . . . . . . . . . . . . . . . . . . . . . (345,913) (342,010)
Total stockholders’ equity (deficit) . . . . . . . . . . . . . . . . . . . . . . . . . . . . 44,347 (34,509)
Total liabilities and stockholders’ equity (deficit) . . . . . . . . . . . . . . . . . $ 114,793 $ 79,873
The accompanying notes are an integral part of these Consolidated Financial Statements.
59
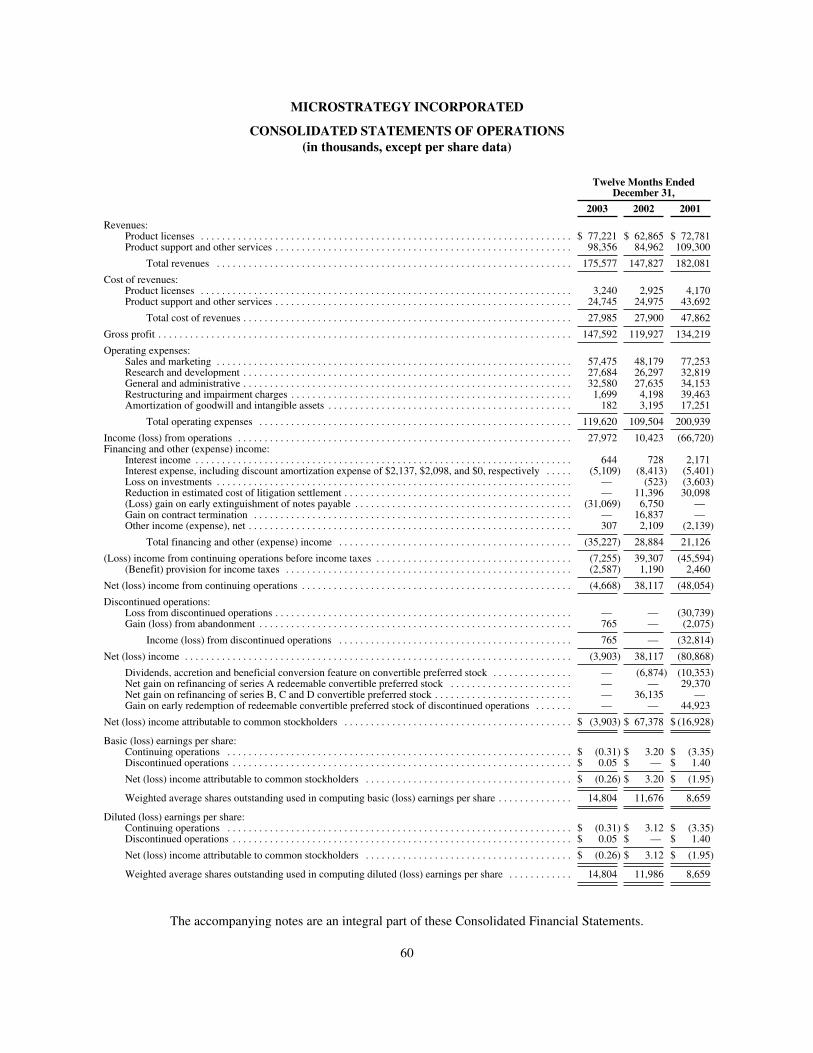
MICROSTRATEGY INCORPORATED
CONSOLIDATED STATEMENTS OF OPERATIONS(in thousands, except per share data)
Twelve Months EndedDecember 31,
2003 2002 2001
Revenues:Product licenses . . . . . . . . . . . . . . . . . . . . . . . . . . . . . . . . . . . . . . . . . . . . . . . . . . . . . . . . . . . . . . . . . . . . . . $ 77,221 $ 62,865 $ 72,781Product support and other services . . . . . . . . . . . . . . . . . . . . . . . . . . . . . . . . . . . . . . . . . . . . . . . . . . . . . . . . 98,356 84,962 109,300
Total revenues . . . . . . . . . . . . . . . . . . . . . . . . . . . . . . . . . . . . . . . . . . . . . . . . . . . . . . . . . . . . . . . . . . . 175,577 147,827 182,081
Cost of revenues:Product licenses . . . . . . . . . . . . . . . . . . . . . . . . . . . . . . . . . . . . . . . . . . . . . . . . . . . . . . . . . . . . . . . . . . . . . . 3,240 2,925 4,170Product support and other services . . . . . . . . . . . . . . . . . . . . . . . . . . . . . . . . . . . . . . . . . . . . . . . . . . . . . . . . 24,745 24,975 43,692
Total cost of revenues . . . . . . . . . . . . . . . . . . . . . . . . . . . . . . . . . . . . . . . . . . . . . . . . . . . . . . . . . . . . . . 27,985 27,900 47,862
Gross profit . . . . . . . . . . . . . . . . . . . . . . . . . . . . . . . . . . . . . . . . . . . . . . . . . . . . . . . . . . . . . . . . . . . . . . . . . . . . . . 147,592 119,927 134,219
Operating expenses:Sales and marketing . . . . . . . . . . . . . . . . . . . . . . . . . . . . . . . . . . . . . . . . . . . . . . . . . . . . . . . . . . . . . . . . . . . 57,475 48,179 77,253Research and development . . . . . . . . . . . . . . . . . . . . . . . . . . . . . . . . . . . . . . . . . . . . . . . . . . . . . . . . . . . . . . 27,684 26,297 32,819General and administrative . . . . . . . . . . . . . . . . . . . . . . . . . . . . . . . . . . . . . . . . . . . . . . . . . . . . . . . . . . . . . . 32,580 27,635 34,153Restructuring and impairment charges . . . . . . . . . . . . . . . . . . . . . . . . . . . . . . . . . . . . . . . . . . . . . . . . . . . . . 1,699 4,198 39,463Amortization of goodwill and intangible assets . . . . . . . . . . . . . . . . . . . . . . . . . . . . . . . . . . . . . . . . . . . . . . 182 3,195 17,251
Total operating expenses . . . . . . . . . . . . . . . . . . . . . . . . . . . . . . . . . . . . . . . . . . . . . . . . . . . . . . . . . . . 119,620 109,504 200,939
Income (loss) from operations . . . . . . . . . . . . . . . . . . . . . . . . . . . . . . . . . . . . . . . . . . . . . . . . . . . . . . . . . . . . . . . 27,972 10,423 (66,720)Financing and other (expense) income:
Interest income . . . . . . . . . . . . . . . . . . . . . . . . . . . . . . . . . . . . . . . . . . . . . . . . . . . . . . . . . . . . . . . . . . . . . . . 644 728 2,171Interest expense, including discount amortization expense of $2,137, $2,098, and $0, respectively . . . . . (5,109) (8,413) (5,401)Loss on investments . . . . . . . . . . . . . . . . . . . . . . . . . . . . . . . . . . . . . . . . . . . . . . . . . . . . . . . . . . . . . . . . . . . — (523) (3,603)Reduction in estimated cost of litigation settlement . . . . . . . . . . . . . . . . . . . . . . . . . . . . . . . . . . . . . . . . . . . — 11,396 30,098(Loss) gain on early extinguishment of notes payable . . . . . . . . . . . . . . . . . . . . . . . . . . . . . . . . . . . . . . . . . (31,069) 6,750 —Gain on contract termination . . . . . . . . . . . . . . . . . . . . . . . . . . . . . . . . . . . . . . . . . . . . . . . . . . . . . . . . . . . . — 16,837 —Other income (expense), net . . . . . . . . . . . . . . . . . . . . . . . . . . . . . . . . . . . . . . . . . . . . . . . . . . . . . . . . . . . . . 307 2,109 (2,139)
Total financing and other (expense) income . . . . . . . . . . . . . . . . . . . . . . . . . . . . . . . . . . . . . . . . . . . . (35,227) 28,884 21,126
(Loss) income from continuing operations before income taxes . . . . . . . . . . . . . . . . . . . . . . . . . . . . . . . . . . . . . (7,255) 39,307 (45,594)(Benefit) provision for income taxes . . . . . . . . . . . . . . . . . . . . . . . . . . . . . . . . . . . . . . . . . . . . . . . . . . . . . . (2,587) 1,190 2,460
Net (loss) income from continuing operations . . . . . . . . . . . . . . . . . . . . . . . . . . . . . . . . . . . . . . . . . . . . . . . . . . . (4,668) 38,117 (48,054)
Discontinued operations:Loss from discontinued operations . . . . . . . . . . . . . . . . . . . . . . . . . . . . . . . . . . . . . . . . . . . . . . . . . . . . . . . . — — (30,739)Gain (loss) from abandonment . . . . . . . . . . . . . . . . . . . . . . . . . . . . . . . . . . . . . . . . . . . . . . . . . . . . . . . . . . . 765 — (2,075)
Income (loss) from discontinued operations . . . . . . . . . . . . . . . . . . . . . . . . . . . . . . . . . . . . . . . . . . . . 765 — (32,814)
Net (loss) income . . . . . . . . . . . . . . . . . . . . . . . . . . . . . . . . . . . . . . . . . . . . . . . . . . . . . . . . . . . . . . . . . . . . . . . . . (3,903) 38,117 (80,868)
Dividends, accretion and beneficial conversion feature on convertible preferred stock . . . . . . . . . . . . . . . — (6,874) (10,353)Net gain on refinancing of series A redeemable convertible preferred stock . . . . . . . . . . . . . . . . . . . . . . . — — 29,370Net gain on refinancing of series B, C and D convertible preferred stock . . . . . . . . . . . . . . . . . . . . . . . . . . — 36,135 —Gain on early redemption of redeemable convertible preferred stock of discontinued operations . . . . . . . — — 44,923
Net (loss) income attributable to common stockholders . . . . . . . . . . . . . . . . . . . . . . . . . . . . . . . . . . . . . . . . . . . $ (3,903) $ 67,378 $ (16,928)
Basic (loss) earnings per share:Continuing operations . . . . . . . . . . . . . . . . . . . . . . . . . . . . . . . . . . . . . . . . . . . . . . . . . . . . . . . . . . . . . . . . . $ (0.31) $ 3.20 $ (3.35)Discontinued operations . . . . . . . . . . . . . . . . . . . . . . . . . . . . . . . . . . . . . . . . . . . . . . . . . . . . . . . . . . . . . . . . $ 0.05 $ — $ 1.40
Net (loss) income attributable to common stockholders . . . . . . . . . . . . . . . . . . . . . . . . . . . . . . . . . . . . . . . $ (0.26) $ 3.20 $ (1.95)
Weighted average shares outstanding used in computing basic (loss) earnings per share . . . . . . . . . . . . . . 14,804 11,676 8,659
Diluted (loss) earnings per share:Continuing operations . . . . . . . . . . . . . . . . . . . . . . . . . . . . . . . . . . . . . . . . . . . . . . . . . . . . . . . . . . . . . . . . . $ (0.31) $ 3.12 $ (3.35)Discontinued operations . . . . . . . . . . . . . . . . . . . . . . . . . . . . . . . . . . . . . . . . . . . . . . . . . . . . . . . . . . . . . . . . $ 0.05 $ — $ 1.40
Net (loss) income attributable to common stockholders . . . . . . . . . . . . . . . . . . . . . . . . . . . . . . . . . . . . . . . $ (0.26) $ 3.12 $ (1.95)
Weighted average shares outstanding used in computing diluted (loss) earnings per share . . . . . . . . . . . . 14,804 11,986 8,659
The accompanying notes are an integral part of these Consolidated Financial Statements.
60
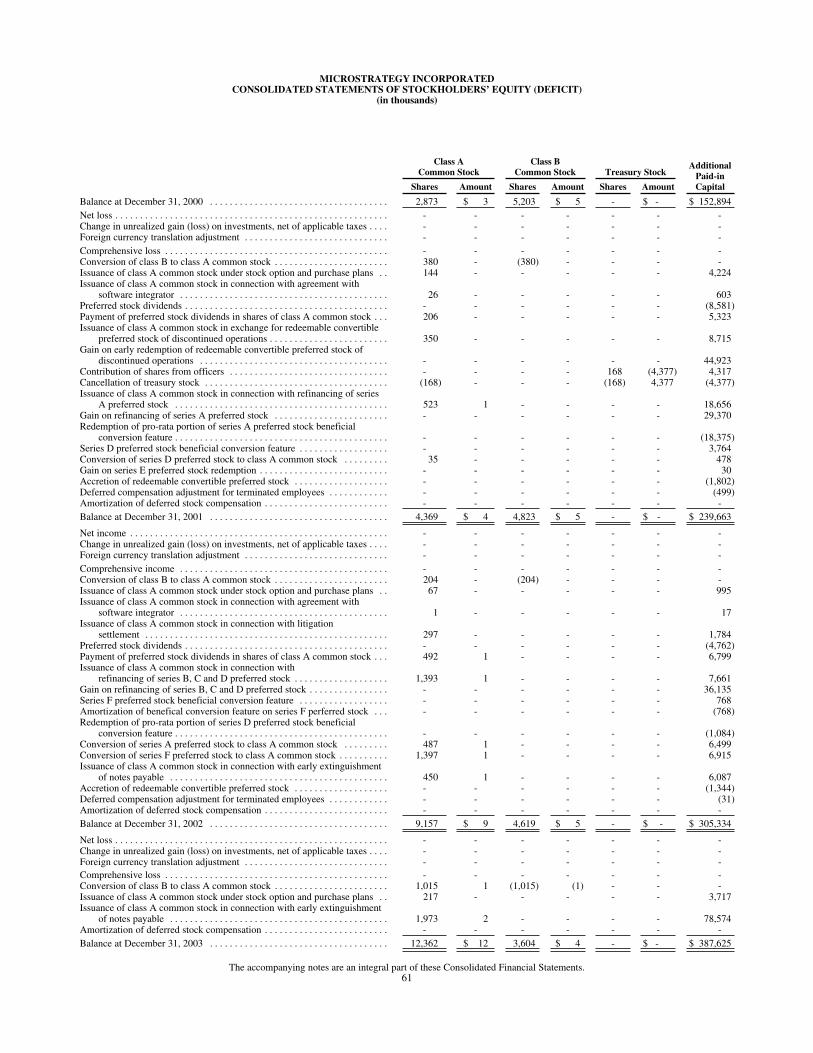
MICROSTRATEGY INCORPORATEDCONSOLIDATED STATEMENTS OF STOCKHOLDERS’ EQUITY (DEFICIT)
(in thousands)
Class ACommon Stock
Class BCommon Stock Treasury Stock
AdditionalPaid-inCapitalShares Amount Shares Amount Shares Amount
Balance at December 31, 2000 . . . . . . . . . . . . . . . . . . . . . . . . . . . . . . . . . . . . 2,873 $ 3 5,203 $ 5 - $ - $ 152,894Net loss . . . . . . . . . . . . . . . . . . . . . . . . . . . . . . . . . . . . . . . . . . . . . . . . . . . . . . . - - - - - - -Change in unrealized gain (loss) on investments, net of applicable taxes . . . . - - - - - - -Foreign currency translation adjustment . . . . . . . . . . . . . . . . . . . . . . . . . . . . . - - - - - - -Comprehensive loss . . . . . . . . . . . . . . . . . . . . . . . . . . . . . . . . . . . . . . . . . . . . . - - - - - - -Conversion of class B to class A common stock . . . . . . . . . . . . . . . . . . . . . . . 380 - (380) - - - -Issuance of class A common stock under stock option and purchase plans . . 144 - - - - - 4,224Issuance of class A common stock in connection with agreement with
software integrator . . . . . . . . . . . . . . . . . . . . . . . . . . . . . . . . . . . . . . . . . . 26 - - - - - 603Preferred stock dividends . . . . . . . . . . . . . . . . . . . . . . . . . . . . . . . . . . . . . . . . . - - - - - - (8,581)Payment of preferred stock dividends in shares of class A common stock . . . 206 - - - - - 5,323Issuance of class A common stock in exchange for redeemable convertible
preferred stock of discontinued operations . . . . . . . . . . . . . . . . . . . . . . . . 350 - - - - - 8,715Gain on early redemption of redeemable convertible preferred stock of
discontinued operations . . . . . . . . . . . . . . . . . . . . . . . . . . . . . . . . . . . . . . - - - - - - 44,923Contribution of shares from officers . . . . . . . . . . . . . . . . . . . . . . . . . . . . . . . . - - - - 168 (4,377) 4,317Cancellation of treasury stock . . . . . . . . . . . . . . . . . . . . . . . . . . . . . . . . . . . . . (168) - - - (168) 4,377 (4,377)Issuance of class A common stock in connection with refinancing of series
A preferred stock . . . . . . . . . . . . . . . . . . . . . . . . . . . . . . . . . . . . . . . . . . . 523 1 - - - - 18,656Gain on refinancing of series A preferred stock . . . . . . . . . . . . . . . . . . . . . . . - - - - - - 29,370Redemption of pro-rata portion of series A preferred stock beneficial
conversion feature . . . . . . . . . . . . . . . . . . . . . . . . . . . . . . . . . . . . . . . . . . . - - - - - - (18,375)Series D preferred stock beneficial conversion feature . . . . . . . . . . . . . . . . . . - - - - - - 3,764Conversion of series D preferred stock to class A common stock . . . . . . . . . 35 - - - - - 478Gain on series E preferred stock redemption . . . . . . . . . . . . . . . . . . . . . . . . . . - - - - - - 30Accretion of redeemable convertible preferred stock . . . . . . . . . . . . . . . . . . . - - - - - - (1,802)Deferred compensation adjustment for terminated employees . . . . . . . . . . . . - - - - - - (499)Amortization of deferred stock compensation . . . . . . . . . . . . . . . . . . . . . . . . . - - - - - - -Balance at December 31, 2001 . . . . . . . . . . . . . . . . . . . . . . . . . . . . . . . . . . . . 4,369 $ 4 4,823 $ 5 - $ - $ 239,663
Net income . . . . . . . . . . . . . . . . . . . . . . . . . . . . . . . . . . . . . . . . . . . . . . . . . . . . - - - - - - -Change in unrealized gain (loss) on investments, net of applicable taxes . . . . - - - - - - -Foreign currency translation adjustment . . . . . . . . . . . . . . . . . . . . . . . . . . . . . - - - - - - -Comprehensive income . . . . . . . . . . . . . . . . . . . . . . . . . . . . . . . . . . . . . . . . . . - - - - - - -Conversion of class B to class A common stock . . . . . . . . . . . . . . . . . . . . . . . 204 - (204) - - - -Issuance of class A common stock under stock option and purchase plans . . 67 - - - - - 995Issuance of class A common stock in connection with agreement with
software integrator . . . . . . . . . . . . . . . . . . . . . . . . . . . . . . . . . . . . . . . . . . 1 - - - - - 17Issuance of class A common stock in connection with litigation
settlement . . . . . . . . . . . . . . . . . . . . . . . . . . . . . . . . . . . . . . . . . . . . . . . . . 297 - - - - - 1,784Preferred stock dividends . . . . . . . . . . . . . . . . . . . . . . . . . . . . . . . . . . . . . . . . . - - - - - - (4,762)Payment of preferred stock dividends in shares of class A common stock . . . 492 1 - - - - 6,799Issuance of class A common stock in connection with
refinancing of series B, C and D preferred stock . . . . . . . . . . . . . . . . . . . 1,393 1 - - - - 7,661Gain on refinancing of series B, C and D preferred stock . . . . . . . . . . . . . . . . - - - - - - 36,135Series F preferred stock beneficial conversion feature . . . . . . . . . . . . . . . . . . - - - - - - 768Amortization of benefical conversion feature on series F perferred stock . . . - - - - - - (768)Redemption of pro-rata portion of series D preferred stock beneficial
conversion feature . . . . . . . . . . . . . . . . . . . . . . . . . . . . . . . . . . . . . . . . . . . - - - - - - (1,084)Conversion of series A preferred stock to class A common stock . . . . . . . . . 487 1 - - - - 6,499Conversion of series F preferred stock to class A common stock . . . . . . . . . . 1,397 1 - - - - 6,915Issuance of class A common stock in connection with early extinguishment
of notes payable . . . . . . . . . . . . . . . . . . . . . . . . . . . . . . . . . . . . . . . . . . . . 450 1 - - - - 6,087Accretion of redeemable convertible preferred stock . . . . . . . . . . . . . . . . . . . - - - - - - (1,344)Deferred compensation adjustment for terminated employees . . . . . . . . . . . . - - - - - - (31)Amortization of deferred stock compensation . . . . . . . . . . . . . . . . . . . . . . . . . - - - - - - -Balance at December 31, 2002 . . . . . . . . . . . . . . . . . . . . . . . . . . . . . . . . . . . . 9,157 $ 9 4,619 $ 5 - $ - $ 305,334
Net loss . . . . . . . . . . . . . . . . . . . . . . . . . . . . . . . . . . . . . . . . . . . . . . . . . . . . . . . - - - - - - -Change in unrealized gain (loss) on investments, net of applicable taxes . . . . - - - - - - -Foreign currency translation adjustment . . . . . . . . . . . . . . . . . . . . . . . . . . . . . - - - - - - -Comprehensive loss . . . . . . . . . . . . . . . . . . . . . . . . . . . . . . . . . . . . . . . . . . . . . - - - - - - -Conversion of class B to class A common stock . . . . . . . . . . . . . . . . . . . . . . . 1,015 1 (1,015) (1) - - -Issuance of class A common stock under stock option and purchase plans . . 217 - - - - - 3,717Issuance of class A common stock in connection with early extinguishment
of notes payable . . . . . . . . . . . . . . . . . . . . . . . . . . . . . . . . . . . . . . . . . . . . 1,973 2 - - - - 78,574Amortization of deferred stock compensation . . . . . . . . . . . . . . . . . . . . . . . . . - - - - - - -Balance at December 31, 2003 . . . . . . . . . . . . . . . . . . . . . . . . . . . . . . . . . . . . 12,362 $ 12 3,604 $ 4 - $ - $ 387,625
The accompanying notes are an integral part of these Consolidated Financial Statements.61
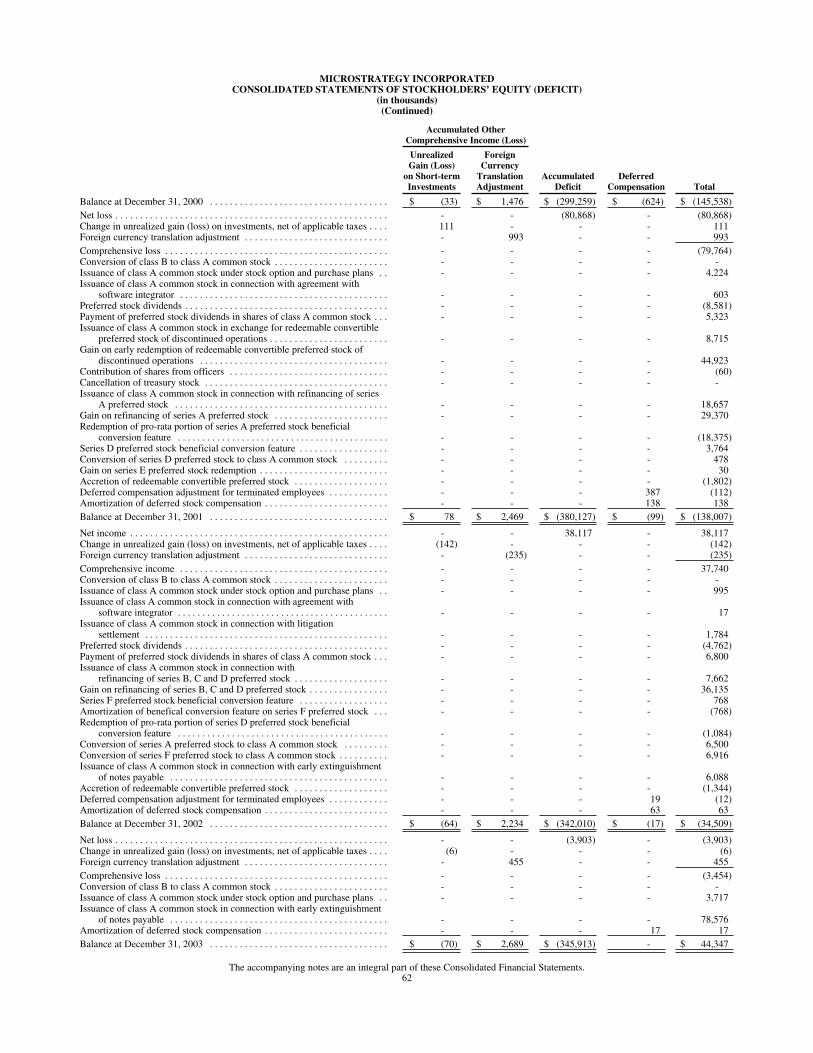
MICROSTRATEGY INCORPORATEDCONSOLIDATED STATEMENTS OF STOCKHOLDERS’ EQUITY (DEFICIT)
(in thousands)(Continued)
Accumulated OtherComprehensive Income (Loss)
UnrealizedGain (Loss)on Short-termInvestments
ForeignCurrencyTranslationAdjustment
AccumulatedDeficit
DeferredCompensation Total
Balance at December 31, 2000 . . . . . . . . . . . . . . . . . . . . . . . . . . . . . . . . . . . . $ (33) $ 1,476 $ (299,259) $ (624) $ (145,538)Net loss . . . . . . . . . . . . . . . . . . . . . . . . . . . . . . . . . . . . . . . . . . . . . . . . . . . . . . . - - (80,868) - (80,868)Change in unrealized gain (loss) on investments, net of applicable taxes . . . . 111 - - - 111Foreign currency translation adjustment . . . . . . . . . . . . . . . . . . . . . . . . . . . . . - 993 - - 993Comprehensive loss . . . . . . . . . . . . . . . . . . . . . . . . . . . . . . . . . . . . . . . . . . . . . - - - - (79,764)Conversion of class B to class A common stock . . . . . . . . . . . . . . . . . . . . . . . - - - - -Issuance of class A common stock under stock option and purchase plans . . - - - - 4,224Issuance of class A common stock in connection with agreement with
software integrator . . . . . . . . . . . . . . . . . . . . . . . . . . . . . . . . . . . . . . . . . . - - - - 603Preferred stock dividends . . . . . . . . . . . . . . . . . . . . . . . . . . . . . . . . . . . . . . . . . - - - - (8,581)Payment of preferred stock dividends in shares of class A common stock . . . - - - - 5,323Issuance of class A common stock in exchange for redeemable convertible
preferred stock of discontinued operations . . . . . . . . . . . . . . . . . . . . . . . . - - - - 8,715Gain on early redemption of redeemable convertible preferred stock of
discontinued operations . . . . . . . . . . . . . . . . . . . . . . . . . . . . . . . . . . . . . . - - - - 44,923Contribution of shares from officers . . . . . . . . . . . . . . . . . . . . . . . . . . . . . . . . - - - - (60)Cancellation of treasury stock . . . . . . . . . . . . . . . . . . . . . . . . . . . . . . . . . . . . . - - - - -Issuance of class A common stock in connection with refinancing of series
A preferred stock . . . . . . . . . . . . . . . . . . . . . . . . . . . . . . . . . . . . . . . . . . . - - - - 18,657Gain on refinancing of series A preferred stock . . . . . . . . . . . . . . . . . . . . . . . - - - - 29,370Redemption of pro-rata portion of series A preferred stock beneficial
conversion feature . . . . . . . . . . . . . . . . . . . . . . . . . . . . . . . . . . . . . . . . . . . - - - - (18,375)Series D preferred stock beneficial conversion feature . . . . . . . . . . . . . . . . . . - - - - 3,764Conversion of series D preferred stock to class A common stock . . . . . . . . . - - - - 478Gain on series E preferred stock redemption . . . . . . . . . . . . . . . . . . . . . . . . . . - - - - 30Accretion of redeemable convertible preferred stock . . . . . . . . . . . . . . . . . . . - - - - (1,802)Deferred compensation adjustment for terminated employees . . . . . . . . . . . . - - - 387 (112)Amortization of deferred stock compensation . . . . . . . . . . . . . . . . . . . . . . . . . - - - 138 138Balance at December 31, 2001 . . . . . . . . . . . . . . . . . . . . . . . . . . . . . . . . . . . . $ 78 $ 2,469 $ (380,127) $ (99) $ (138,007)
Net income . . . . . . . . . . . . . . . . . . . . . . . . . . . . . . . . . . . . . . . . . . . . . . . . . . . . - - 38,117 - 38,117Change in unrealized gain (loss) on investments, net of applicable taxes . . . . (142) - - - (142)Foreign currency translation adjustment . . . . . . . . . . . . . . . . . . . . . . . . . . . . . - (235) - - (235)Comprehensive income . . . . . . . . . . . . . . . . . . . . . . . . . . . . . . . . . . . . . . . . . . - - - - 37,740Conversion of class B to class A common stock . . . . . . . . . . . . . . . . . . . . . . . - - - - -Issuance of class A common stock under stock option and purchase plans . . - - - - 995Issuance of class A common stock in connection with agreement with
software integrator . . . . . . . . . . . . . . . . . . . . . . . . . . . . . . . . . . . . . . . . . . . - - - - 17Issuance of class A common stock in connection with litigation
settlement . . . . . . . . . . . . . . . . . . . . . . . . . . . . . . . . . . . . . . . . . . . . . . . . . - - - - 1,784Preferred stock dividends . . . . . . . . . . . . . . . . . . . . . . . . . . . . . . . . . . . . . . . . . - - - - (4,762)Payment of preferred stock dividends in shares of class A common stock . . . - - - - 6,800Issuance of class A common stock in connection with
refinancing of series B, C and D preferred stock . . . . . . . . . . . . . . . . . . . - - - - 7,662Gain on refinancing of series B, C and D preferred stock . . . . . . . . . . . . . . . . - - - - 36,135Series F preferred stock beneficial conversion feature . . . . . . . . . . . . . . . . . . - - - - 768Amortization of benefical conversion feature on series F preferred stock . . . - - - - (768)Redemption of pro-rata portion of series D preferred stock beneficial
conversion feature . . . . . . . . . . . . . . . . . . . . . . . . . . . . . . . . . . . . . . . . . . . - - - - (1,084)Conversion of series A preferred stock to class A common stock . . . . . . . . . - - - - 6,500Conversion of series F preferred stock to class A common stock . . . . . . . . . . - - - - 6,916Issuance of class A common stock in connection with early extinguishment
of notes payable . . . . . . . . . . . . . . . . . . . . . . . . . . . . . . . . . . . . . . . . . . . . - - - - 6,088Accretion of redeemable convertible preferred stock . . . . . . . . . . . . . . . . . . . - - - - (1,344)Deferred compensation adjustment for terminated employees . . . . . . . . . . . . - - - 19 (12)Amortization of deferred stock compensation . . . . . . . . . . . . . . . . . . . . . . . . . - - - 63 63Balance at December 31, 2002 . . . . . . . . . . . . . . . . . . . . . . . . . . . . . . . . . . . . $ (64) $ 2,234 $ (342,010) $ (17) $ (34,509)
Net loss . . . . . . . . . . . . . . . . . . . . . . . . . . . . . . . . . . . . . . . . . . . . . . . . . . . . . . . - - (3,903) - (3,903)Change in unrealized gain (loss) on investments, net of applicable taxes . . . . (6) - - - (6)Foreign currency translation adjustment . . . . . . . . . . . . . . . . . . . . . . . . . . . . . - 455 - - 455Comprehensive loss . . . . . . . . . . . . . . . . . . . . . . . . . . . . . . . . . . . . . . . . . . . . . - - - - (3,454)Conversion of class B to class A common stock . . . . . . . . . . . . . . . . . . . . . . . - - - - -Issuance of class A common stock under stock option and purchase plans . . - - - - 3,717Issuance of class A common stock in connection with early extinguishment
of notes payable . . . . . . . . . . . . . . . . . . . . . . . . . . . . . . . . . . . . . . . . . . . . - - - - 78,576Amortization of deferred stock compensation . . . . . . . . . . . . . . . . . . . . . . . . . - - - 17 17Balance at December 31, 2003 . . . . . . . . . . . . . . . . . . . . . . . . . . . . . . . . . . . . $ (70) $ 2,689 $ (345,913) - $ 44,347
The accompanying notes are an integral part of these Consolidated Financial Statements.62
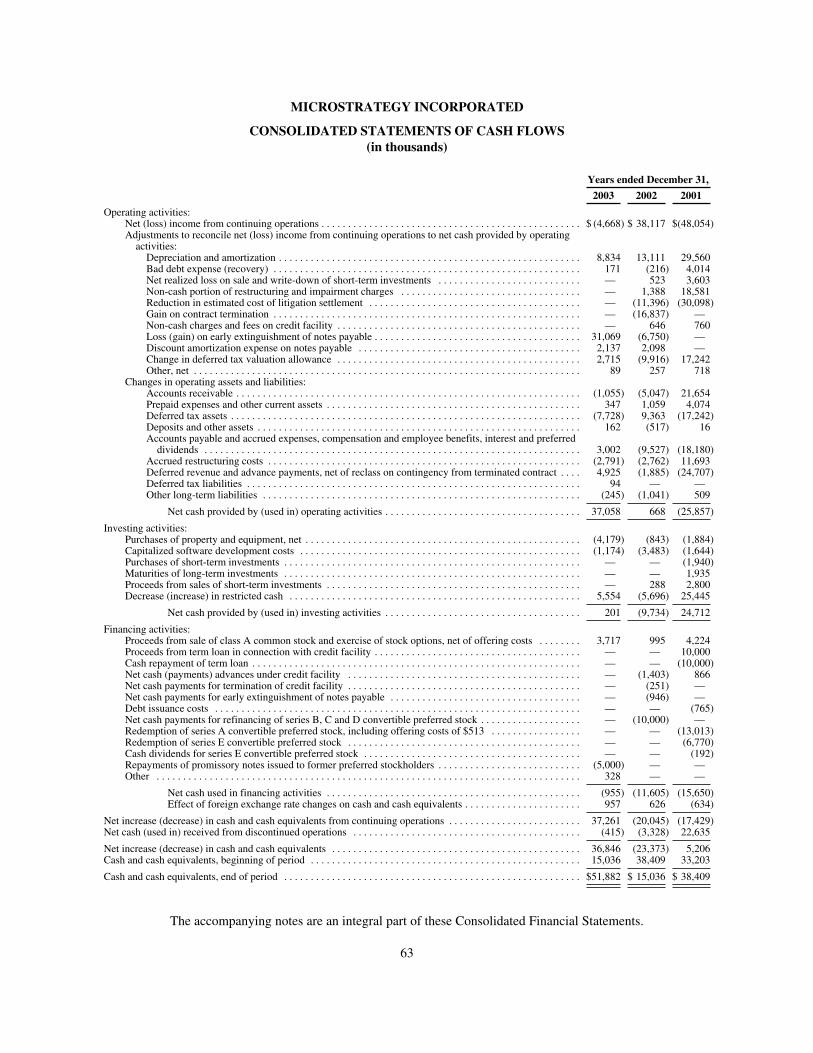
MICROSTRATEGY INCORPORATED
CONSOLIDATED STATEMENTS OF CASH FLOWS(in thousands)
Years ended December 31,
2003 2002 2001
Operating activities:Net (loss) income from continuing operations . . . . . . . . . . . . . . . . . . . . . . . . . . . . . . . . . . . . . . . . . . . . . . . . . $ (4,668) $ 38,117 $(48,054)Adjustments to reconcile net (loss) income from continuing operations to net cash provided by operatingactivities:Depreciation and amortization . . . . . . . . . . . . . . . . . . . . . . . . . . . . . . . . . . . . . . . . . . . . . . . . . . . . . . . . . 8,834 13,111 29,560Bad debt expense (recovery) . . . . . . . . . . . . . . . . . . . . . . . . . . . . . . . . . . . . . . . . . . . . . . . . . . . . . . . . . . 171 (216) 4,014Net realized loss on sale and write-down of short-term investments . . . . . . . . . . . . . . . . . . . . . . . . . . . — 523 3,603Non-cash portion of restructuring and impairment charges . . . . . . . . . . . . . . . . . . . . . . . . . . . . . . . . . . — 1,388 18,581Reduction in estimated cost of litigation settlement . . . . . . . . . . . . . . . . . . . . . . . . . . . . . . . . . . . . . . . . — (11,396) (30,098)Gain on contract termination . . . . . . . . . . . . . . . . . . . . . . . . . . . . . . . . . . . . . . . . . . . . . . . . . . . . . . . . . . — (16,837) —Non-cash charges and fees on credit facility . . . . . . . . . . . . . . . . . . . . . . . . . . . . . . . . . . . . . . . . . . . . . . — 646 760Loss (gain) on early extinguishment of notes payable . . . . . . . . . . . . . . . . . . . . . . . . . . . . . . . . . . . . . . . 31,069 (6,750) —Discount amortization expense on notes payable . . . . . . . . . . . . . . . . . . . . . . . . . . . . . . . . . . . . . . . . . . 2,137 2,098 —Change in deferred tax valuation allowance . . . . . . . . . . . . . . . . . . . . . . . . . . . . . . . . . . . . . . . . . . . . . . 2,715 (9,916) 17,242Other, net . . . . . . . . . . . . . . . . . . . . . . . . . . . . . . . . . . . . . . . . . . . . . . . . . . . . . . . . . . . . . . . . . . . . . . . . . 89 257 718
Changes in operating assets and liabilities:Accounts receivable . . . . . . . . . . . . . . . . . . . . . . . . . . . . . . . . . . . . . . . . . . . . . . . . . . . . . . . . . . . . . . . . . (1,055) (5,047) 21,654Prepaid expenses and other current assets . . . . . . . . . . . . . . . . . . . . . . . . . . . . . . . . . . . . . . . . . . . . . . . . 347 1,059 4,074Deferred tax assets . . . . . . . . . . . . . . . . . . . . . . . . . . . . . . . . . . . . . . . . . . . . . . . . . . . . . . . . . . . . . . . . . . (7,728) 9,363 (17,242)Deposits and other assets . . . . . . . . . . . . . . . . . . . . . . . . . . . . . . . . . . . . . . . . . . . . . . . . . . . . . . . . . . . . . 162 (517) 16Accounts payable and accrued expenses, compensation and employee benefits, interest and preferreddividends . . . . . . . . . . . . . . . . . . . . . . . . . . . . . . . . . . . . . . . . . . . . . . . . . . . . . . . . . . . . . . . . . . . . . . . 3,002 (9,527) (18,180)
Accrued restructuring costs . . . . . . . . . . . . . . . . . . . . . . . . . . . . . . . . . . . . . . . . . . . . . . . . . . . . . . . . . . . (2,791) (2,762) 11,693Deferred revenue and advance payments, net of reclass on contingency from terminated contract . . . . 4,925 (1,885) (24,707)Deferred tax liabilities . . . . . . . . . . . . . . . . . . . . . . . . . . . . . . . . . . . . . . . . . . . . . . . . . . . . . . . . . . . . . . . 94 — —Other long-term liabilities . . . . . . . . . . . . . . . . . . . . . . . . . . . . . . . . . . . . . . . . . . . . . . . . . . . . . . . . . . . . (245) (1,041) 509
Net cash provided by (used in) operating activities . . . . . . . . . . . . . . . . . . . . . . . . . . . . . . . . . . . . . 37,058 668 (25,857)
Investing activities:Purchases of property and equipment, net . . . . . . . . . . . . . . . . . . . . . . . . . . . . . . . . . . . . . . . . . . . . . . . . . . . . (4,179) (843) (1,884)Capitalized software development costs . . . . . . . . . . . . . . . . . . . . . . . . . . . . . . . . . . . . . . . . . . . . . . . . . . . . . (1,174) (3,483) (1,644)Purchases of short-term investments . . . . . . . . . . . . . . . . . . . . . . . . . . . . . . . . . . . . . . . . . . . . . . . . . . . . . . . . — — (1,940)Maturities of long-term investments . . . . . . . . . . . . . . . . . . . . . . . . . . . . . . . . . . . . . . . . . . . . . . . . . . . . . . . . — — 1,935Proceeds from sales of short-term investments . . . . . . . . . . . . . . . . . . . . . . . . . . . . . . . . . . . . . . . . . . . . . . . . — 288 2,800Decrease (increase) in restricted cash . . . . . . . . . . . . . . . . . . . . . . . . . . . . . . . . . . . . . . . . . . . . . . . . . . . . . . . 5,554 (5,696) 25,445
Net cash provided by (used in) investing activities . . . . . . . . . . . . . . . . . . . . . . . . . . . . . . . . . . . . . 201 (9,734) 24,712
Financing activities:Proceeds from sale of class A common stock and exercise of stock options, net of offering costs . . . . . . . . 3,717 995 4,224Proceeds from term loan in connection with credit facility . . . . . . . . . . . . . . . . . . . . . . . . . . . . . . . . . . . . . . . — — 10,000Cash repayment of term loan . . . . . . . . . . . . . . . . . . . . . . . . . . . . . . . . . . . . . . . . . . . . . . . . . . . . . . . . . . . . . . — — (10,000)Net cash (payments) advances under credit facility . . . . . . . . . . . . . . . . . . . . . . . . . . . . . . . . . . . . . . . . . . . . — (1,403) 866Net cash payments for termination of credit facility . . . . . . . . . . . . . . . . . . . . . . . . . . . . . . . . . . . . . . . . . . . . — (251) —Net cash payments for early extinguishment of notes payable . . . . . . . . . . . . . . . . . . . . . . . . . . . . . . . . . . . . — (946) —Debt issuance costs . . . . . . . . . . . . . . . . . . . . . . . . . . . . . . . . . . . . . . . . . . . . . . . . . . . . . . . . . . . . . . . . . . . . . — — (765)Net cash payments for refinancing of series B, C and D convertible preferred stock . . . . . . . . . . . . . . . . . . . — (10,000) —Redemption of series A convertible preferred stock, including offering costs of $513 . . . . . . . . . . . . . . . . . — — (13,013)Redemption of series E convertible preferred stock . . . . . . . . . . . . . . . . . . . . . . . . . . . . . . . . . . . . . . . . . . . . — — (6,770)Cash dividends for series E convertible preferred stock . . . . . . . . . . . . . . . . . . . . . . . . . . . . . . . . . . . . . . . . . — — (192)Repayments of promissory notes issued to former preferred stockholders . . . . . . . . . . . . . . . . . . . . . . . . . . . (5,000) — —Other . . . . . . . . . . . . . . . . . . . . . . . . . . . . . . . . . . . . . . . . . . . . . . . . . . . . . . . . . . . . . . . . . . . . . . . . . . . . . . . . 328 — —
Net cash used in financing activities . . . . . . . . . . . . . . . . . . . . . . . . . . . . . . . . . . . . . . . . . . . . . . . . (955) (11,605) (15,650)Effect of foreign exchange rate changes on cash and cash equivalents . . . . . . . . . . . . . . . . . . . . . . 957 626 (634)
Net increase (decrease) in cash and cash equivalents from continuing operations . . . . . . . . . . . . . . . . . . . . . . . . . 37,261 (20,045) (17,429)Net cash (used in) received from discontinued operations . . . . . . . . . . . . . . . . . . . . . . . . . . . . . . . . . . . . . . . . . . . (415) (3,328) 22,635
Net increase (decrease) in cash and cash equivalents . . . . . . . . . . . . . . . . . . . . . . . . . . . . . . . . . . . . . . . . . . . . . . . 36,846 (23,373) 5,206Cash and cash equivalents, beginning of period . . . . . . . . . . . . . . . . . . . . . . . . . . . . . . . . . . . . . . . . . . . . . . . . . . . 15,036 38,409 33,203
Cash and cash equivalents, end of period . . . . . . . . . . . . . . . . . . . . . . . . . . . . . . . . . . . . . . . . . . . . . . . . . . . . . . . . $51,882 $ 15,036 $ 38,409
The accompanying notes are an integral part of these Consolidated Financial Statements.
63

MICROSTRATEGY INCORPORATED
CONSOLIDATED STATEMENTS OF CASH FLOWS(in thousands)(Continued)
Years ended December 31,
2003 2002 2001
Supplemental disclosure of noncash investing and financing activities:Stock received in exchange for products and services . . . . . . . . . . . . . . . . . . . . . . . . . . . . . . . . . . . . . $ — $ 93 $ 1,153
Public stock received in exchange for stock in private company . . . . . . . . . . . . . . . . . . . . . . . . . . . . . $ — $ — $ 2,017
Issuance of class A common stock in connection with agreement with software integrator . . . . . . . . $ — $ 17 $ 603
Issuance of class A common stock warrants . . . . . . . . . . . . . . . . . . . . . . . . . . . . . . . . . . . . . . . . . . . . . $ — $ 400 $ 414
Payment of convertible preferred stock dividends through the issuance of class A common stockand series D convertible preferred stock . . . . . . . . . . . . . . . . . . . . . . . . . . . . . . . . . . . . . . . . . . . . . . $ — $ 6,800 $ 6,176
Issuance of class A common stock in connection with the conversion of series A preferred stock . . . $ — $ 6,500 $ —
Issuance of class A common stock in connection with litigation settlement . . . . . . . . . . . . . . . . . . . . $ — $ 1,784 $ —
Issuance of promissory notes in connection with litigation settlement . . . . . . . . . . . . . . . . . . . . . . . . . $ — $ 55,000 $ —
Early extinguishment of notes payable . . . . . . . . . . . . . . . . . . . . . . . . . . . . . . . . . . . . . . . . . . . . . . . . . $(46,875) $(11,858) $ —
Issuance of class A common stock in connection with early extinguishment of notes payable . . . . . . $ 78,576 $ 6,088 $ —
Fair value of class A common stock, convertible preferred stock, and promissory notes issued inconnection with refinancing transactions . . . . . . . . . . . . . . . . . . . . . . . . . . . . . . . . . . . . . . . . . . . . . $ — $ 19,078 $ 90,385
Carrying value of convertible preferred stock and accrued and unpaid dividends redeemed andexchanged in connection with refinancing transactions . . . . . . . . . . . . . . . . . . . . . . . . . . . . . . . . . . $ — $(64,265) $(113,880)
Conversion of series D convertible preferred stock through the issuance of class A commonstock . . . . . . . . . . . . . . . . . . . . . . . . . . . . . . . . . . . . . . . . . . . . . . . . . . . . . . . . . . . . . . . . . . . . . . . . . $ — $ — $ 478
Early redemption of redeemable convertible preferred stock of discontinued operations . . . . . . . . . . $ — $ — $ (53,638)
Issuance of class A common stock exchanged for redeemable convertible preferred stock ofdiscontinued operations . . . . . . . . . . . . . . . . . . . . . . . . . . . . . . . . . . . . . . . . . . . . . . . . . . . . . . . . . . . $ — $ — $ 8,715
Issuance of class A common stock in connection with the conversion of series F preferred stock . . . $ — $ 6,916 $ —
Supplemental disclosure of cash flow information:Cash paid during the year for interest . . . . . . . . . . . . . . . . . . . . . . . . . . . . . . . . . . . . . . . . . . . . . . . . . . $ 2,530 $ 8,592 $ 631
Cash paid during the year for income taxes . . . . . . . . . . . . . . . . . . . . . . . . . . . . . . . . . . . . . . . . . . . . . $ 2,057 $ 1,684 $ 1,934
The accompanying notes are an integral part of these Consolidated Financial Statements.
64

MICROSTRATEGY INCORPORATED
NOTES TO CONSOLIDATED FINANCIAL STATEMENTS
(1) Organization
MicroStrategy Incorporated (the “Company” or “MicroStrategy”) is a leading worldwide provider ofbusiness intelligence software that enables companies to analyze the raw data stored across their enterprise toreveal the trends and insights needed to develop solutions to manage their business effectively. MicroStrategysoftware delivers this critical information to workgroups, the enterprise and extranet communities via e-mail,web, fax, wireless and voice communication channels. Businesses can use the Company’s software platform todevelop user-friendly solutions, proactively refine revenue-generating strategies, enhance cost-efficiency andproductivity and improve customer relationships.
The MicroStrategy software platform, MicroStrategy 7i, enables users to query and analyze the mostdetailed, transaction-level databases, turning data into business intelligence and delivering reports and alertsabout the users’ business processes. The web-based architecture provides reporting, security, performance andstandards that are critical for web deployment. With intranet deployments, MicroStrategy’s products provideemployees with information to enable them to make better, more cost-effective business decisions. With extranetdeployments, enterprises can use MicroStrategy 7i to build stronger relationships by linking customers andsuppliers via the Internet. The Company also offers a comprehensive set of consulting, education, technicalsupport and technical advisory services for its customers and strategic partners.
(2) Summary of Significant Accounting Policies
(a) Basis of Presentation
The accompanying consolidated financial statements include the accounts of the Company and itssubsidiaries. The minority interest in the Company’s subsidiary, Alarm.com Incorporated, is included in otherliabilities in the accompanying consolidated balance sheet and is not material. All significant intercompanyaccounts and transactions have been eliminated in consolidation.
(b) Use of Estimates
The preparation of the consolidated financial statements, in conformity with accounting principles generallyaccepted in the United States of America, requires management to make estimates and judgments that affect thereported amounts of assets, liabilities and equity and disclosure of contingent assets and liabilities at the date ofthe financial statements and the reported amounts of revenues and expenses during the reporting period. On anon-going basis, the Company evaluates its estimates, including, but not limited to, those related to revenuerecognition, allowance for doubtful accounts, investments, software development costs, intangible assets,commissions, income taxes, financing operations, restructuring and impairment charges, discontinued operations,and litigation and contingencies. The Company bases its estimates on historical experience and on various otherassumptions that are believed to be reasonable under the circumstances, the results of which form the basis formaking judgments about the carrying value of assets and liabilities that are not readily apparent from othersources. Actual results and outcomes could differ from these estimates and assumptions.
(c) Reclassification
Certain prior year amounts in the consolidated financial statements have been reclassified to conform to thecurrent year presentation.
(d) Discontinued Operations
The historical consolidated financial statements of the Company reflect its subsidiary, Strategy.comIncorporated, as a discontinued operation for all periods presented (Note 3).
65
MICROSTRATEGY INCORPORATED
NOTES TO CONSOLIDATED FINANCIAL STATEMENTS—(Continued)
(e) Cash and Cash Equivalents and Restricted Cash
Cash equivalents include money market instruments and commercial paper. The Company considers allhighly liquid investments with an original maturity of three months or less to be cash equivalents. Restricted cashconsists of compensating cash balances for contractual obligations that do not meet the definition of cashequivalents.
(f) Investments
The Company occasionally invests in readily marketable equity securities. Marketable equity securities areclassified as either trading or available-for-sale. Management determines the appropriate classification ofmarketable securities at the time of purchase and re-evaluates such designation as of each balance sheet date.
Available-for-sale marketable securities are reported at fair value. Unrealized holding gains and losses, netof applicable taxes, on available-for-sale marketable securities are reported in accumulated other comprehensiveincome in stockholders’ equity (deficit) until realized. Management employs a systematic methodology thatconsiders available evidence in evaluating potential impairment of its investments. In the event that the cost of aninvestment exceeds its fair value, management evaluates among other factors, the duration and extent to whichthe fair value is less than cost; the financial health of and business outlook for the investee, including industryand sector performance, changes in technology and operational and financing cash flow factors; and theCompany’s intent and ability to hold the investment. If a decline in fair value is considered to be other thantemporary, the cost basis of the individual security is written down to fair value as a new cost basis and theamount of the write-down is included in results of operations. Interest income is recognized when earned.Realized gains and losses for marketable securities are derived using the specific identification method fordetermining the cost of the securities sold.
(g) Property and Equipment
Property and equipment are stated at cost, net of accumulated depreciation. Depreciation is computed usingthe straight-line method over the estimated useful lives of the assets, as follows: three years for computerequipment and purchased software and five to ten years for furniture and equipment. Leasehold improvementsare amortized using the straight-line method over the estimated useful lives of the improvements or the term ofthe lease, whichever is shorter.
Expenditures for maintenance and repairs are charged to expense as incurred. Expenditures for majorrenewals and betterments that extend the useful lives of property and equipment are capitalized and depreciatedover the remaining useful lives of the asset. When assets are retired or sold, the cost and related accumulateddepreciation are removed from the accounts and any resulting gain or loss is recognized in the results ofoperations.
Included in property and equipment is the cost of internally developed software. In accordance withStatement of Position (“SOP”) 98-1, “Accounting for the Costs of Computer Software Developed or Obtained forInternal Use,” eligible internally developed software costs incurred are capitalized subsequent to the completionof the preliminary project stage. Such costs include external direct material and service costs, employee payrolland payroll-related costs. After all substantial testing and deployment is completed and the software is ready forits intended use, internally developed software costs are amortized using the straight-line method over theestimated useful life of the software, generally up to three years.
66

MICROSTRATEGY INCORPORATED
NOTES TO CONSOLIDATED FINANCIAL STATEMENTS—(Continued)
(h) Goodwill and Intangible Assets
Prior to 2002, goodwill and intangible assets primarily consisted of intangible assets acquired in connectionwith the purchase of the Teracube assets of NCR Corporation (“NCR”), trade names, customer lists, assembledwork force, domain names and an agreement with a software integrator. During 2002, the Company ceasedamortizing goodwill and accordingly did not record any goodwill amortization in 2003 and 2002. As ofDecember 31, 2003 and 2002, goodwill was immaterial. Intangible assets are amortized on the straight-line basisover their respective useful lives ranging from 3 to 20 years. Goodwill and intangible assets, net of accumulatedamortization, were $604,000 and $789,000 at December 31, 2003 and 2002, respectively. As a result of removingfrom the accounts the cost and related accumulated amortization of certain fully amortized intangible assets,accumulated amortization was $464,000 at December 31, 2003. At December 31, 2002, accumulatedamortization was $25.1 million. For the years ended December 31, 2003, 2002 and 2001, the Company recordedamortization expense on goodwill and intangible assets of $182,000, $3.2 million and $17.3 million, respectively.In connection with periodic assessments of the carrying value of its intangible assets, the Company recordedimpairment charges during 2001 and 2002, as discussed below, to write-down the carrying value of its intangibleassets.
(i) Impairment of Long-Lived Assets
The Company reviews long-lived assets, including intangible assets, for impairment annually or wheneverevents or changes in business circumstances indicate that the carrying amount of the assets may not be fullyrecoverable or that the useful lives of these assets are no longer appropriate. Each impairment test is based on acomparison of the undiscounted cash flows to the recorded value of the asset. If impairment is indicated, the assetis written down by the amount in which the carrying value of the asset exceeds the related fair value of the asset.In connection with the restructuring plans adopted during 2001 and a periodic assessment of the carrying value oflong-lived assets, certain assets were deemed to be impaired. Accordingly, the Company recorded an impairmentcharge of $18.6 million during 2001. During 2002, the Company recorded an additional impairment charge of$1.4 million to write-off its Teracube intangible asset (Note 19).
(j) Software Development Costs
In accordance with Statement of Financial Accounting Standards (“SFAS”) No. 86, “Accounting for theCosts of Computer Software to Be Sold, Leased, or Otherwise Marketed,” software development costs areexpensed as incurred until technological feasibility has been established, at which time such costs are capitalizeduntil the product is available for general release to customers. Capitalized software development costs includedirect labor costs and fringe benefit costs attributed to programmers, software engineers and quality control andfield certifiers working on products after they reach technological feasibility but before they are generallyavailable to customers for sale. Technological feasibility is considered to be achieved when a product design andworking model of the software product has been completed. Capitalized software development costs areamortized over the estimated product life of three years, using the greater of the straight-line method or the ratioof current product revenues to the total of current period and projected future revenues. Capitalized softwaredevelopment costs, net of accumulated amortization, are $3.7 million and $4.4 million at December 31, 2003 and2002, respectively. Amortization expense related to software development costs was $1.9 million, $1.4 millionand $641,000 for the years ended December 31, 2003, 2002 and 2001, respectively, and is included in cost ofproduct licenses revenues. During the years ended December 31, 2003 and 2002, the Company capitalizedsoftware development costs of $1.2 million and $3.5 million, respectively.
(k) Legal Costs and Loss Contingencies
The Company accrues legal costs in the period in which expenses are incurred, except in the event of a losscontingency that is believed to be probable and can be reasonably estimated, whereby the Company accrues the
67
MICROSTRATEGY INCORPORATED
NOTES TO CONSOLIDATED FINANCIAL STATEMENTS—(Continued)
legal costs and loss contingency estimated to be incurred through the expected settlement of the contingentmatter. As events evolve during the administration and litigation process and additional information becomesknown, the Company reassesses its estimates related to accrued legal costs and loss contingencies.
(l) Deferred Revenue and Advance Payments
Deferred revenue and advance payments related to product support and other services result from paymentsreceived prior to the performance of services for consulting, education and technical support. Deferred revenueand advance payments related to product licenses result primarily from multiple element arrangements thatinclude future deliverables. Deferred revenue has been classified as either deferred product revenue or deferredproduct support and other services revenue based on the objective fair value of the multiple elements of thearrangement. Non-current deferred revenue and advance payments are expected to be recognized as revenue inone to three years. The Company offsets its accounts receivable and deferred revenue for any billed and unpaiditems included in deferred revenue and advance payments.
(m) Revenue Recognition
Product license revenue is derived from sales of software licenses. Product support and other servicesrevenue consists of revenue derived from technical support services, education, consulting, and other services.The Company’s revenue recognition policies are in accordance with the SEC’s Staff Accounting Bulletin(“SAB”) No. 101, “Revenue Recognition in Financial Statements,” SAB No. 104, “Revenue Recognition,” SOP97-2, “Software Revenue Recognition,” as amended by SOP 98-9, “Modification of SOP 97-2, SoftwareRevenue Recognition, with Respect to Certain Transactions,” and other authoritative accounting literature. In thecase of software arrangements which require significant production, modification or customization of software,the Company follows the guidance in SOP 81-1, “Accounting for Performance of Construction-Type and CertainProduction-Type Contracts.”
SOP 97-2, as amended, requires that revenue recognized from software arrangements be allocated to eachelement of the arrangement based on the relative fair values of the elements, such as software products,maintenance services, installation, training or other elements. Under SOP 97-2, as amended, the determination offair value is based on objective evidence that is specific to the vendor. If such evidence of fair value for anyundelivered element of the arrangement does not exist, all revenue from the arrangement is deferred until suchtime that evidence of fair value does exist or until all elements of the arrangement are delivered, subject to certainlimited exceptions.
The Company’s revenue recognition policy is as follows:
Product license revenue: The Company recognizes revenue from sales of software licenses to end users orresellers upon persuasive evidence of an arrangement (as provided by agreements or contracts executed by bothparties), delivery of the software, and determination that collection of a fixed or determinable fee is reasonablyassured. When the fees for software upgrades and enhancements, technical support, consulting and education arebundled with the license fee, they are unbundled using the Company’s objective evidence of the fair value of theelements represented by the Company’s customary pricing for each element in separate transactions. If suchevidence of fair value exists for all undelivered elements and there is no such evidence of fair value establishedfor delivered elements, revenue is first allocated to the elements where evidence of fair value has beenestablished and the residual amount is allocated to the delivered elements. If evidence of fair value for anyundelivered element of the arrangement does not exist, all revenue from the arrangement is deferred until suchtime that evidence of fair value exists for undelivered elements or until all elements of the arrangement aredelivered, subject to certain limited exceptions set forth in SOP 97-2, as amended. When a software licensearrangement requires the Company to provide significant production, customization or modification of the
68

MICROSTRATEGY INCORPORATED
NOTES TO CONSOLIDATED FINANCIAL STATEMENTS—(Continued)
software, or when the customer considers these services essential to the functionality of the software product,both the product license revenue and consulting services revenue are recognized using the percentage ofcompletion method. Under percentage of completion method accounting, both product license and consultingservices revenue are recognized as work progresses based on labor hours incurred. Contracts accounted for underthe percentage of completion method were immaterial for the years ended December 31, 2003 and 2002. For theyear ended December 31, 2001, contracts accounted for under the percentage of completion method representedapproximately 7.8% of total revenues. Expected losses on contracts in progress are expensed in the period inwhich the losses become probable and reasonably estimable. If an arrangement includes acceptance criteria,revenue is not recognized until the Company can objectively demonstrate that the software or service can meetthe acceptance criteria, or the acceptance period lapses, whichever occurs earlier. If a software licensearrangement obligates the Company to deliver specified future products or upgrades, the revenue is recognizedwhen the specified future product or upgrades are delivered, or when the obligation to deliver specified futureproducts expires, whichever occurs earlier. If a software license arrangement obligates the Company to deliverunspecified future products, then revenue is recognized on the subscription basis, ratably over the term of thecontract.
License revenue derived from sales to resellers or original equipment manufacturers (“OEM”) who purchasethe Company’s products for future resale is recognized upon sufficient evidence that the products have been soldto the ultimate end users, provided all other revenue recognition criteria have been met.
Product support and other services revenue: Technical support revenue is derived from providing technicalsupport and software updates and upgrades to customers. Technical support revenue is recognized ratably overthe term of the contract, which in most cases is one year. Revenue from consulting and education services isrecognized as the services are performed.
Amounts collected prior to satisfying the above revenue recognition criteria are included in deferred revenueand advance payments in the accompanying consolidated balance sheets.
Cost of product licenses consists of the costs to distribute the product, including the costs of the media onwhich it is delivered, shipping and handling costs and royalty payments to third-party vendors, as well asamortization of capitalized software development costs. Cost of product support and other services consistsprimarily of consulting and support personnel salaries and related costs. Research and development costs areexcluded from the cost of revenue.
(n) Advertising Costs
Advertising production costs are expensed the first time the advertisement takes place. Media placementcosts are expensed in the month the advertising appears. Advertising costs were $1.5 million, $1.3 million and$1.4 million for the years ended December 31, 2003, 2002 and 2001, respectively. As of December 31, 2003 and2002, the Company had no prepaid advertising costs.
(o) Income Taxes
The Company is subject to federal and state income taxes and recognizes deferred taxes in accordance withSFAS No. 109, “Accounting for Income Taxes.” This statement provides for a liability approach under whichdeferred income taxes are provided based upon enacted tax laws and rates applicable to the periods in which thetaxes become payable. The Company provides a valuation allowance to reduce deferred tax assets to theirestimated realizable value.
69
MICROSTRATEGY INCORPORATED
NOTES TO CONSOLIDATED FINANCIAL STATEMENTS—(Continued)
(p) Basic and Diluted (Loss) Earnings Per Share
The Company computes basic and diluted (loss) earnings per share in accordance with SFAS No. 128,“Earnings per Share” and Emerging Issues Task Force (“EITF”) Topic D-72, “Effect of Contracts That May BeSettled in Stock or Cash on the Computation of Diluted Earnings per Share”. Additionally, in accordance withEITF Topic D-95, “Effect of Participating Convertible Securities in the Computation of Basic Earnings perShare,” participating securities that are convertible into common stock must be included in the computation ofbasic (loss) earnings per share if their effect is dilutive. Prior to conversion and/or redemption, the Company’sseries A, B, C and D preferred stock had participation rights in the undistributed earnings of the Companyequivalent to those of common shareholders. As a result, the series A, B, C and D preferred stock wereconsidered to be participating convertible securities and were therefore included in the computation of basic(loss) earnings per share to the extent they were dilutive.
Basic (loss) earnings per share is determined by dividing the net (loss) income attributable to commonstockholders (for continuing operations and discontinued operations, as applicable) by the weighted averagenumber of common shares and participating securities outstanding during the period. Participating securities areincluded in the basic (loss) earnings per share calculation when dilutive. Diluted (loss) earnings per share isdetermined by dividing the net (loss) income attributable to common stockholders (for continuing operations anddiscontinued operations, as applicable) by the weighted average number of common shares and potentialcommon shares outstanding during the period. Potential common shares are included in the diluted (loss)earnings per share calculation when dilutive. Potential common shares consisting of common stock issuable uponexercise of outstanding employee stock options and warrants are computed using the treasury stock method.Potential common shares also consisted of common stock issuable upon the conversion of preferred stock.
(q) Foreign Currency Translation
The functional currency of the Company’s international operations is the local currency. Accordingly, allassets and liabilities of these subsidiaries are translated using exchange rates in effect at the end of the period andrevenue and costs are translated using weighted average exchange rates for the period. The related translationadjustments are reported in accumulated other comprehensive income in stockholders’ equity (deficit).Transaction gains and losses arising from transactions denominated in a currency other than the functionalcurrency of the entity involved are included in the results of operations.
(r) Concentrations of Credit Risk
Financial instruments that potentially subject the Company to concentrations of credit risk consist primarilyof cash, cash equivalents and accounts receivable. The Company places its cash equivalents with high credit-quality financial institutions and invests its excess cash primarily in money market instruments. The Companyhas established guidelines relative to credit ratings and maturities that seek to maintain safety and liquidity. TheCompany sells products and services to various companies across several industries throughout the world in theordinary course of business. The Company routinely assesses the financial strength of its customers andmaintains allowances for anticipated losses. As of December 31, 2003 and 2002, no individual customeraccounted for 10% or more of net accounts receivable.
(s) Fair Value of Financial Instruments
The carrying amounts of the Company’s cash, cash equivalents, accounts receivable and accounts payableapproximate fair value. The fair market value for marketable securities is based on quoted market prices whereavailable. The series A, B, C, D, E and F preferred stock were recorded at their respective fair values when issuedand their carrying values approximated fair value. The promissory notes issued in connection with the settlement
70
MICROSTRATEGY INCORPORATED
NOTES TO CONSOLIDATED FINANCIAL STATEMENTS—(Continued)
of the Company’s class action litigation and the promissory notes issued in connection with the Company’srefinancing transaction in August 2002 were recorded at their respective fair values and their carrying valuesapproximated fair value. See factors for determining the fair value of these instruments discussed in Note 10. Thefair market value of the warrants issued in connection with the settlement of the Company’s class actionlitigation is based on quoted market prices.
(t) Stock-Based Compensation
At December 31, 2003, the Company had five stock-based employee compensation plans, which aredescribed more fully in Note 16. In December 2002, the Financial Accounting Standards Board (“FASB”) issuedSFAS No. 148, “Accounting for Stock-Based Compensation – Transition and Disclosure.” SFAS No. 148provides for alternative methods of transition for a voluntary change to the fair value based method of accountingfor stock-based employee compensation. The Company continues to account for its stock-based employeecompensation plans under the recognition and measurement principles of Accounting Principles Board (“APB”)Opinion No. 25, “Accounting for Stock Issued to Employees,” and related interpretations. APB No. 25 providesthat compensation expense relative to a company’s employee stock options is measured based on the intrinsicvalue of the stock options at the measurement date.
If compensation expense had been recorded based on the fair value of awards under the stock option andpurchase plans as set forth in SFAS No. 123, “Accounting for Stock-based Compensation,” as amended, theCompany’s net (loss) income attributable to common stockholders would have been adjusted to the pro formaamounts presented below, for the years ended December 31, (thousands, except per share data):
2003 2002 2001
Net (loss) income attributable to common stockholders, as reported . . . . . . . . . . $ (3,903) $67,378 $(16,928)Stock-based employee compensation expense under fair value based method . . (12,830) (9,250) (12,118)
Pro forma net (loss) income . . . . . . . . . . . . . . . . . . . . . . . . . . . . . . . . . . . . . . . . . $(16,733) $58,128 $(29,046)
Basic net (loss) income per share, as reported . . . . . . . . . . . . . . . . . . . . . . . . . . . $ (0.26) $ 3.20 $ (1.95)
Diluted net (loss) income per share, as reported . . . . . . . . . . . . . . . . . . . . . . . . . . $ (0.26) $ 3.12 $ (1.95)
Basic net (loss) income per share, pro forma . . . . . . . . . . . . . . . . . . . . . . . . . . . . $ (1.13) $ 2.41 $ (3.35)
Diluted net (loss) income per share, pro forma . . . . . . . . . . . . . . . . . . . . . . . . . . . $ (1.13) $ 2.34 $ (3.35)
The fair value of each option is estimated on the date of grant using the Black-Scholes option-pricing modelwith the following assumptions used for option grants under MicroStrategy’s stock option plans issued during2003, 2002 and 2001, respectively: volatility factors of 85%, 127% and 120%, risk-free interest rates of 3%, 4%and 5%, weighted-average expected life of 5 years and no dividend yields.
The following assumptions were used for shares issued during 2003, 2002 and 2001, respectively, underMicroStrategy’s employee stock purchase plan: volatility factors of 85%, 127% and 120%, risk free interest ratesof 3%, 4% and 5%, weighted-average expected life of 6 months and no dividend yields.
The weighted average fair value of grants made under MicroStrategy’s stock option plans during 2003, 2002and 2001 were $15.65, $22.71 and $28.20, respectively.
(u) Comprehensive Income (Loss)
Other comprehensive income (loss) recorded by the Company is comprised of accumulated currencytranslation adjustments and unrealized gains and losses on available-for-sale marketable securities, net of relatedtax effects.
71
MICROSTRATEGY INCORPORATED
NOTES TO CONSOLIDATED FINANCIAL STATEMENTS—(Continued)
(v) Recent Accounting Standards
In November 2002, the FASB issued FASB Interpretation No. 45 (“FIN 45”), “Guarantor’s Accounting andDisclosure Requirements for Guarantees, Including Indirect Guarantees of Indebtedness of Others.” FIN 45requires a company to recognize the fair value for certain guarantee obligations on the date of issuance of theguarantee. The initial recognition and measurement provisions of FIN 45 are applicable on a prospective basisfor guarantee arrangements issued or modified by the Company after December 31, 2002. FIN 45 also requires acompany to make certain additional disclosures even when the likelihood of payment under the guarantee isremote. The adoption of FIN 45 had no impact on the results of operations of the Company.
Pursuant to FIN 45 and subsequent FASB staff positions, intellectual property infringementindemnifications are subject to the disclosure requirements of FIN 45, but are exempt from its initial recognitionand measurement provisions. The Company typically includes its standard intellectual property indemnificationclauses in its software license agreements. Pursuant to these clauses, the Company agrees to defend and holdharmless the indemnified party, typically the Company’s customers, business partners, and their directors,officers, employees and agents, in connection with certain intellectual property infringement claims by thirdparties relating to the Company’s products. The term of the indemnification clauses varies, typically rangingfrom five years to perpetuity, and generally applies at any time after the execution of the software licenseagreement. In addition, the Company generally warrants that its software products will perform in all materialrespects in accordance with its standard published software specifications in effect at the time of delivery of thelicensed products to the customer for a specified period of time following delivery, typically 90 to 180 days. TheCompany has not experienced any material intellectual property indemnification or warranty claims historicallyand has no amounts accrued as of December 31, 2003 relating to such obligations.
The Company is also a party to a variety of other agreements with current and former customers, vendors,landlords, employees, directors and others pursuant to which it may be obligated to make payments to guaranteedparties. For example, such indemnification arrangements may obligate the Company to make payments to aproperty owner in the event of an adverse judgment in a lawsuit or the imposition of additional taxes inconnection with real estate leased by the Company. These obligations may require the other party to make anadverse claim pursuant to procedures specified in the specific agreement, and the Company’s obligations may belimited in terms of time, and/or amount, or otherwise be qualified. It is not possible to predict the maximumpotential amount of future payments under such agreements due to the limited history of prior indemnificationclaims and the unique facts and circumstances involved in each particular agreement. To date, the Company hasnot incurred material indemnification expense under these agreements and has not accrued any amounts relatingto such provisions in the accompanying financial statements.
In November 2002, the EITF reached a consensus on EITF Issue No. 00-21, “Revenue Arrangements withMultiple Deliverables.” EITF Issue No. 00-21 provides guidance on how to account for arrangements thatinvolve the delivery or performance of multiple products, services and/or rights to use assets. EITF Issue No. 00-21 is applicable to revenue arrangements entered into or modified after June 30, 2003. The provisions of thisconsensus did not have any effect on the Company’s financial position and results of operations.
In January 2003, the FASB issued FIN 46, “Consolidation of Variable Interest Entities, an Interpretation ofARB No. 51.” In December 2003, the FASB revised FIN No. 46 to reflect decisions it made regarding a numberof implementation issues. FIN No. 46, as revised, requires that the primary beneficiary of a variable interestentity consolidate the entity even if the primary beneficiary does not have a majority voting interest. Thisinterpretation applies to certain entities in which equity investors do not have the characteristics of a controllingfinancial interest or do not have sufficient equity at risk for the entity to finance its activities without additionalsubordinated financial support. This interpretation also identifies those situations where a controlling financialinterest may be achieved through arrangements that do not involve voting interests. The interpretation also
72
MICROSTRATEGY INCORPORATED
NOTES TO CONSOLIDATED FINANCIAL STATEMENTS—(Continued)
establishes additional disclosures which are required regarding an enterprise’s involvement with a variableinterest entity when it is not the primary beneficiary. The requirements of this interpretation are required to beapplied for all new variable interest entities created or acquired after January 31, 2003. For variable interestentities created or acquired prior to February 1, 2003, the provisions must be applied for the first interim orannual period ending after December 15, 2003. The Company does not have any controlling interest, contractualrelationships or other business relationships with unconsolidated variable interest entities and therefore theadoption of this standard did not have any effect on the Company’s financial position and results of operations.
In April 2003, the FASB issued SFAS No. 149, “Amendment of Statement 133 on Derivative Instrumentsand Hedging Activities.” SFAS No. 149 amends and clarifies accounting for derivative instruments, includingcertain derivative instruments embedded in other contracts, and for hedging activities under SFAS No. 133. Thestatement requires that contracts with comparable characteristics be accounted for similarly and clarifies when aderivative contains a financing component that warrants special reporting in the statement of cash flows. SFASNo. 149 is effective for contracts entered into or modified after June 30, 2003, except in certain circumstances,and for hedging relationships designated after June 30, 2003. The adoption of this standard did not have amaterial impact on the Company’s financial position and results of operations.
In May 2003, the FASB issued SFAS No. 150, “Accounting for Certain Financial Instruments withCharacteristics of Both Liabilities and Equity,” which is effective for all financial instruments created ormodified after May 31, 2003 and otherwise is effective July 1, 2003. SFAS No. 150 establishes standards forclassifying and measuring as liabilities certain financial instruments that embody obligations of the issuer andhave characteristics of both liabilities and equity. The adoption of this standard did not have any effect on theCompany’s financial position and results of operations.
(3) Discontinued Operations
During 2001, the Company substantially curtailed, discontinued and ultimately shut down the operations ofits subsidiary, Strategy.com Incorporated. Accordingly, during 2001, the Company recorded a loss fromabandonment of its discontinued operations of $2.1 million. The loss from abandonment included remaininglease payments associated with abandoned computer equipment, personal property taxes due under equipmentleases, certain other costs and accruals for estimated results from operations. Subsequent to the abandonment, theCompany continued to assess the valuation of these liabilities during each successive financial reporting period.During 2003, management concluded that the probability of incurring additional obligations or being required toperform services relating to a particular contract was remote. As a result, the Company reversed the accruedliability relating to this contract and recorded a gain on discontinued operations in the amount of $765,000 during2003. The historical consolidated financial statements of the Company reflect Strategy.com as a discontinuedoperation for all periods presented. Strategy.com had no revenues for the years ended December 31, 2003 and2002. For the year ended December 31, 2001, Strategy.com had revenues of $8.9 million. Included withinStrategy.com’s net loss for the year ended December 31, 2001 were restructuring and impairment charges of$19.4 million. The charge was comprised of a write-down of impaired assets of $17.3 million and otherrestructuring costs associated with severance and exiting facilities. The net assets of Strategy.com as ofDecember 31, 2003 included tax refunds and other receivables of $29,000 and are included in prepaid expensesand other current assets in the accompanying consolidated balance sheet. The net liabilities of Strategy.com as ofDecember 31, 2002, included within net liabilities of discontinued operations, included accounts payable andaccrued expenses of $1.2 million. As liabilities are satisfied in future periods, the expenditures will continue to beclassified as cash used in discontinued operations in the accompanying consolidated statements of cash flows.
73

MICROSTRATEGY INCORPORATED
NOTES TO CONSOLIDATED FINANCIAL STATEMENTS—(Continued)
(4) Investments
During 2000 and 2001, the Company received shares of Exchange Applications, Inc. (“ExchangeApplications”) common stock in consideration for the sale of MicroStrategy software, technical support andconsulting services. Due to a significant decrease in the market value of Exchange Applications’ stock andbecause the timing and amount of future recovery, if any, was uncertain (“other-than-temporary decline”), theCompany wrote down the investment to its fair value and recognized an aggregate loss of $1.4 million during2001. As a result of further impairments to the value of Exchange Applications’ stock and subsequent sales, theCompany recorded aggregate losses of $171,000 during 2002.
In 2000, the Company invested $5.0 million in exchange for an approximate 5% interest in a private voiceportal technology company. In 2001, this voice portal technology company was acquired by a publicly-tradedcompany for a combination of cash and common stock. In connection with the transaction, MicroStrategyrecorded a loss of $840,000 during 2001 based on the difference between its original basis in its investment andthe fair value of the consideration received. Due to an other-than-temporary decline in the market value of thepublicly-traded company’s common stock, the Company wrote down the investment to its fair value at December31, 2001, and recognized a loss of $1.4 million during 2001. During 2002, the Company recognized an additionalaggregate loss of $352,000 related to the write-down and final sale of this investment.
As of December 31, 2003 and 2002, all short-term investments of the Company had been substantially soldor written-off.
(5) Accounts Receivable
Accounts receivable, net of allowances, consist of the following, as of December 31, (in thousands):
2003 2002
Billed and billable . . . . . . . . . . . . . . . . . . . . . . . . . . . . . . . . . . . . . . . . . . $ 61,118 $ 49,688Less: billed and unpaid deferred revenue . . . . . . . . . . . . . . . . . . . . . . . . (27,621) (17,841)
33,497 31,847Less: allowance for doubtful accounts . . . . . . . . . . . . . . . . . . . . . . . . . . (2,504) (3,652)
$ 30,993 $ 28,195
The Company offsets its accounts receivable and deferred revenue for any billed and unpaid items includedin deferred revenue and advance payments.
(6) Property and Equipment
Property and equipment consist of the following, as of December 31, (in thousands):
2003 2002
Computer equipment and purchased software . . . . . . . . . . . . . . . . . . . . $ 19,973 $ 18,779Furniture and equipment . . . . . . . . . . . . . . . . . . . . . . . . . . . . . . . . . . . . . 12,387 12,319Leasehold improvements . . . . . . . . . . . . . . . . . . . . . . . . . . . . . . . . . . . . 10,178 9,852Internally developed software . . . . . . . . . . . . . . . . . . . . . . . . . . . . . . . . 4,444 4,444
46,982 45,394Less: accumulated depreciation and amortization . . . . . . . . . . . . . . . . . (30,869) (26,923)
$ 16,113 $ 18,471
Depreciation and amortization expense related to property and equipment was $6.8 million, $8.5 million and$11.7 million for the years ended December 31, 2003, 2002 and 2001, respectively.
74

MICROSTRATEGY INCORPORATED
NOTES TO CONSOLIDATED FINANCIAL STATEMENTS—(Continued)
(7) Deferred Revenue and Advance Payments
Deferred revenue and advance payments from customers consist of the following, as of December 31, (inthousands):
2003 2002
Current:Deferred product licenses revenue . . . . . . . . . . . . . . . . . . . . . . . . . . . . . . . . . . . . . $ 4,490 $ 1,790Deferred product support and other services revenue . . . . . . . . . . . . . . . . . . . . . . 50,497 38,876
54,987 40,666Less: billed and unpaid deferred revenue . . . . . . . . . . . . . . . . . . . . . . . . . . . . . . . . (26,613) (16,705)
$ 28,374 $ 23,961
Non-current:Deferred product licenses revenue . . . . . . . . . . . . . . . . . . . . . . . . . . . . . . . . . . . . . $ 378 $ 663Deferred product support and other services revenue . . . . . . . . . . . . . . . . . . . . . . 3,380 1,854
3,758 2,517Less: billed and unpaid deferred revenue . . . . . . . . . . . . . . . . . . . . . . . . . . . . . . . . (1,008) (1,136)
$ 2,750 $ 1,381
The Company offsets its accounts receivable and deferred revenue for any billed and unpaid items includedin deferred revenue and advance payments.
(8) Contingency from Terminated Contract
On June 28, 2002, the Company and Exchange Applications entered into an arrangement to terminate thesoftware development and OEM agreement that the companies had entered into as of December 28, 1999. Inconnection with the arrangement, the Company paid $120,000 to Exchange Applications and granted ExchangeApplications a limited license to support Exchange Applications’ customers that had purchased products prior tothe effective date of the arrangement. As a result, the Company recognized $210,000 of product support andother services revenues in 2002 through the date of termination and recorded a $16.8 million gain on contracttermination during the second quarter of 2002 relating to the remaining contingency from terminated contractthat had previously been recorded.
(9) Litigation
(a) Securities Litigation
In 2000, the Company and certain of its officers and directors were named as defendants in a privatesecurities class action lawsuit and a shareholder derivative lawsuit. The Company entered into agreements tosettle these lawsuits in 2000 and subsequently completed its distribution of consideration under these lawsuitsduring 2002.
Based on the terms of the settlement agreements, the Company established an initial estimate for the cost ofthe litigation settlement during 2000. Subsequently, during each successive financial reporting period prior todistribution of the consideration, the Company updated the estimated value assigned to each individualcomponent of the settlement based upon valuation assumptions stemming from the settlement. As a result ofchanges in the estimated market borrowing rate and discount on the promissory notes, declines in the value of theCompany’s class A common stock and reductions in the estimated fair value of warrants issued in connection
75
MICROSTRATEGY INCORPORATED
NOTES TO CONSOLIDATED FINANCIAL STATEMENTS—(Continued)
with the litigation settlement, the Company recorded aggregate reductions in the provision for the litigationsettlement of $11.4 million and $30.1 million during the years ended December 31, 2002 and 2001, respectively.As distribution of the consideration was completed during the third quarter of 2002, no reductions were recordedduring the year ended December 31, 2003. The reduction in estimated cost of litigation settlement was comprisedof the following, (in thousands):
2003 2002 2001
Promissory notes . . . . . . . . . . . . . . . . . . . . . . . . . . . . . . . . . . . . . . . . . . $ — $ 2,500 $(16,700)Class A common stock . . . . . . . . . . . . . . . . . . . . . . . . . . . . . . . . . . . . . — (8,910) (5,806)Warrants . . . . . . . . . . . . . . . . . . . . . . . . . . . . . . . . . . . . . . . . . . . . . . . . — (4,852) (7,782)Pending loss on additional settlement . . . . . . . . . . . . . . . . . . . . . . . . . — (134) 190
Reduction in estimated cost of litigation settlement . . . . . . . . . . . . . . $ — $(11,396) $(30,098)
The Company substantially reduced its outstanding obligations relating to the accrued litigation settlementupon completing its distribution of the consideration under the private securities class action settlement during2002. As of December 31, 2003 and December 31, 2002, the Company’s remaining obligations relating to thelitigation settlement were for accrued administration costs of $119,000 and $208,000, respectively, which areincluded in accounts payable and accrued expenses and other long-term liabilities in the accompanyingconsolidated balance sheets.
(b) Business Objects Litigation
On October 2, 2001, the Company filed a lawsuit in the Virginia Circuit Court for Fairfax County againsttwo field employees of Business Objects, S.A. This lawsuit alleged that these employees, who previously workedfor the Company, breached their fiduciary and contractual obligations to the Company by, among other things,misappropriating its trade secrets and confidential information and soliciting its employees and customers. Thecomplaint sought injunctive relief and damages. On October 17, 2001, Business Objects filed suit against theCompany in the United States District Court for the Northern District of California, claiming that the Company’ssoftware infringes a patent issued to Business Objects relating to relational database access (the ‘403 patent). Thesuit sought injunctive relief and monetary damages. On August 29, 2003, the Court granted the Company’smotion for summary judgment and dismissed the lawsuit, ruling as a matter of law that MicroStrategy’s productsdo not infringe the ‘403 patent. Business Objects has filed an appeal.
On October 31, 2001, the Company filed suit against Business Objects, S.A. and its subsidiary, BusinessObjects Americas, Inc., in the United States District Court for the Eastern District of Virginia, claiming thatBusiness Objects’ software infringes two patents held by the Company relating to asynchronous control of reportgeneration using a web browser (the ‘033 patent) and a system and method of adapting automatic output ofOLAP reports to disparate user output devices (the ‘050 patent). On March 13, 2002, the Company voluntarilydismissed without prejudice its lawsuit pending in the Virginia Circuit Court for Fairfax County against the twofield employees of Business Objects. The complaint against Business Objects was amended to add claims forviolations of the federal Computer Fraud and Abuse Act, misappropriation of trade secrets, tortious interferencewith contractual relations, and violations of the Virginia Conspiracy Act. As a result of pre-trial rulings, certainof these claims were dismissed. The Company’s claims for tortious interference and misappropriation of tradesecrets proceeded to trial on October 20, 2003. On October 28, 2003, the Court dismissed the tortiousinterference claim. The Court has yet to issue a ruling on the merits of the misappropriation of trade secretsclaim, for which the Company is seeking various equitable remedies against Business Objects. In July 2003, theUnited States Patent & Trademark Office confirmed the validity of all the claims in the ‘033 and ‘050 patentsand terminated reexamination proceedings that Business Objects had requested as to those patents. The Companyagreed to dismissal of the ‘033 patent claims without prejudice. The Company’s ‘050 patent claims are currently
76
MICROSTRATEGY INCORPORATED
NOTES TO CONSOLIDATED FINANCIAL STATEMENTS—(Continued)
scheduled to proceed to trial on June 15, 2004. The Company is seeking monetary damages and injunctive relief.The outcome of this litigation is not presently determinable, and as such, the Company is currently unable toestimate a potential range of gain or loss, if any, relating to these actions. Accordingly, no provision for thesematters has been made in the accompanying consolidated financial statements.
(c) ePlus Legal Matter
On February 2, 2004, ePlus Group, Inc. (“ePlus”) filed suit against the Company claiming breach of contractrelating to the master lease agreement that the companies had entered into on November 1, 1999, under which theCompany leased equipment from ePlus. ePlus claims that equipment returned by the Company upon expirationof the lease term was not in satisfactory condition and seeks damages of approximately $2.0 million plus interest,taxes and attorney’s fees. The Company intends to vigorously defend the case. Although the ultimate outcome ofthis litigation is uncertain, the Company does not believe that the litigation will have a material adverse effect onthe Company’s financial position or results of operations.
(d) Other Matters
The Company is also involved in other legal proceedings through the normal course of business.Management believes that any unfavorable outcome related to these other proceedings will not have a materialeffect on the Company’s financial position, results of operations or cash flows.
(10) Notes Payable and Borrowings
The following summarizes the Company’s notes payable as of, (in thousands):
2003 2002
PrincipalAmount Discount
CarryingValue
PrincipalAmount Discount
CarryingValue
71⁄2% series A unsecured notes . . . . . . . . . . . . . . . $— $— $— $63,295 $(18,254) $45,041Promissory notes issued to former preferredstockholders . . . . . . . . . . . . . . . . . . . . . . . . . . . . — — — 5,000 (302) 4,698
$— $— $— $68,295 $(18,556) $49,739
Classified as:Current notes payable . . . . . . . . . . . . . . . . . . $— $ 4,698Long-term notes payable . . . . . . . . . . . . . . . . — 45,041
$— $49,739
(a) 71⁄2% Series A Unsecured Notes
Pursuant to settlement agreements relating to the Company’s securities class action litigation, the Companyissued to class members, among other consideration, an aggregate principal amount of $80.3 million of its 7 ½%series A unsecured notes (“Series A Notes”). The Series A Notes accrued interest at a rate of 7.5% per annum,payable semi-annually, and were to mature on June 24, 2007. Based upon market conditions and an estimatedmarket borrowing rate of 18%, a discount of $25.3 million was computed on the Series A Notes at the time ofissuance. The discount was amortized to interest expense over the term of such notes, using the effective interestmethod.
77
MICROSTRATEGY INCORPORATED
NOTES TO CONSOLIDATED FINANCIAL STATEMENTS—(Continued)
Interest charges on the Series A Notes began accruing on April 2, 2001. For the years ended December 31,2003, 2002 and 2001, total interest expense on the Series A Notes was $4.3 million, $7.7 million and $4.5million, respectively, including stated interest expense of $2.5 million, $5.8 million and $4.5 million,respectively, and discount amortization expense of $1.8 million, $1.9 million and $0, respectively. During theyears ended December 31, 2003, 2002 and 2001, the Company made interest payments on the Series A Notes of$2.0 million, $8.3 million and $0, respectively.
On June 23, 2003, the Company announced that it had elected to convert the then remaining $53.0 million inprincipal amount outstanding of its Series A Notes plus accrued and unpaid interest into shares of the Company’sclass A common stock in accordance with the terms of the indenture pursuant to which the Series A Notes wereissued. On July 30, 2003, the Company completed the conversion and issued 1,654,839 shares of class Acommon stock and approximately $47,000 in cash in lieu of fractional shares. In connection with this transaction,the Company recorded a loss during the third quarter of 2003 on the early extinguishment of notes payable in theamount of $30.2 million equal to the excess of the fair value of the consideration transferred to the holders of theSeries A Notes of $70.0 million over the carrying value of such extinguished notes plus accrued and unpaidinterest of $39.8 million. Upon completion of this transaction, the Company’s remaining obligations relating toits Series A Notes were eliminated. Prior to this transaction, the Company repurchased Series A Notes during thefirst and second quarters of 2003 with an aggregate principal amount of $10.3 million in exchange for 317,810shares of class A common stock. As a result of these repurchases, the Company recorded a net loss during thefirst and second quarters of 2003 on the early extinguishment of notes payable in the amount of $840,000 equalto the excess of the aggregate fair value of the consideration transferred to the holders of the Series A Notes of$8.5 million over the carrying value of such extinguished notes plus accrued and unpaid interest of $7.7 millionin aggregate. As a result of these transactions during 2003, the Company recorded an aggregate net loss on theearly extinguishment of notes payable in the amount of $31.1 million.
During 2002, the Company repurchased Series A Notes with an aggregate principal amount of $17.0 millionin exchange for 450,324 shares of class A common stock and approximately $946,000 in cash. As a result ofthese repurchases, the Company recorded an aggregate gain during 2002 on the early extinguishment of notespayable in the amount of $6.8 million equal to the excess of the carrying value of the Series A Notes plus accruedand unpaid interest of $13.8 million in aggregate over the fair value of the consideration transferred to theholders of such extinguished notes of $7.0 million. Because the Company repurchased Series A Notes on severaloccasions during 2002 and 2003, management determined that the extinguishments were not infrequent inoccurrence and, therefore, concluded that the extinguishments would not be presented as extraordinary items inthe accompanying consolidated statements of operations.
(b) Promissory Notes Issued to Former Preferred Stockholders
In connection with the refinancing of its series B, C and D preferred stock in August 2002, the Companyissued to preferred stockholders, among other consideration, $5.0 million in promissory notes which accruedinterest at a rate of 7.5% per annum, payable semi-annually, and matured on July 31, 2003. Based upon marketconditions and an estimated market borrowing rate of 18%, a discount of $500,000 was computed on thesepromissory notes at the time of issuance. The discount was amortized to interest expense over the term of suchpromissory notes, using the effective interest method.
For the years ended December 31, 2003 and 2002, total interest expense on the promissory notes issued toformer preferred stockholders was $518,000 and $350,000, respectively, including stated interest expense of$216,000 and $152,000, respectively, and discount amortization expense of $302,000 and $198,000, respectively.
Upon maturity of the promissory notes on July 31, 2003, the Company paid $5.2 million to repay in full theprincipal and interest due under the promissory notes issued to former preferred stockholders. During the year
78
MICROSTRATEGY INCORPORATED
NOTES TO CONSOLIDATED FINANCIAL STATEMENTS—(Continued)
ended December 31, 2003, the Company made total interest payments on the promissory notes of $369,000,including the interest payment made upon maturity. The Company did not make any interest payments during theyear ended December 31, 2002.
(c) Credit Facility
On May 19, 2003, the Company entered into a $10 million secured credit facility (the “Credit Facility”) withBank of America, N.A. The Credit Facility consists of a $10 million revolving line of credit subject to borrowingbase limitations based on accounts receivable, as defined in the agreement. The Credit Facility, which matures inApril 2004, includes a letter of credit sub-limit of $10 million and is secured by substantially all of the assets ofthe Company. Bank of America has an option to extend the maturity date by one additional year. During the yearended December 31, 2003, the Company had not drawn any cash against the Credit Facility and had no amountsoutstanding under the Credit Facility as of December 31, 2003. After consideration of outstanding letters ofcredit of $5.1 million and borrowing base limitations applicable to the Credit Facility, the Company had $4.9million of borrowing capacity as of December 31, 2003.
At the Company’s option, borrowings under the Credit Facility bear interest at a variable rate equal toLIBOR plus 2.5% to 3.0%, depending on the outstanding balance, or the prime rate plus 1.0%. The CreditFacility also includes a 2.0% letter of credit fee.
Under the terms of the Credit Facility, the Company is required to maintain compliance with certainfinancial covenants, the most restrictive of which include achieving certain minimum earnings amounts andmaximum debt to earnings ratios, maintaining minimum liquidity amounts and minimizing the ability to investfurther in subsidiaries. As of December 31, 2003, the Company was in compliance with all covenants containedin the Credit Facility.
In connection with obtaining the Credit Facility, the Company’s previous letter of credit security agreementwith Bank of America, under which outstanding letters of credit of $5.6 million were secured by an equal amountof restricted cash, was terminated.
During the year ended December 31, 2002, the Company made payments under its previous credit facilitiesof $4.4 million, which were offset in part by cash advances of $3.0 million. Additionally, during 2002, theCompany paid $251,000 in fees and other charges to terminate the credit facility then in effect and wrote-offunamortized deferred financing costs of $417,000. During the year ended December 31, 2001, the Companymade payments under its previous credit facilities and term loan of $15.2 million, which were offset byborrowings and other cash advances of $16.1 million.
(11) Commitments and Contingencies
The Company leases office space and computer and other equipment under operating lease agreementsexpiring at various dates through 2010. In addition to base rent, the Company is responsible for certain taxes,utilities and maintenance costs and several leases include options for renewal or purchase. Future minimumpayments under noncancellable operating leases and agreements with initial terms of greater than one yearconsist of the following (in thousands):
2004 . . . . . . . . . . . . . . . . . . . . . . . . . . . . . . . . . . . . . . . . . . . . . . . . . . . . . . . . . . . . . . $12,3482005 . . . . . . . . . . . . . . . . . . . . . . . . . . . . . . . . . . . . . . . . . . . . . . . . . . . . . . . . . . . . . . 11,4092006 . . . . . . . . . . . . . . . . . . . . . . . . . . . . . . . . . . . . . . . . . . . . . . . . . . . . . . . . . . . . . . 9,6272007 . . . . . . . . . . . . . . . . . . . . . . . . . . . . . . . . . . . . . . . . . . . . . . . . . . . . . . . . . . . . . . 7,7002008 . . . . . . . . . . . . . . . . . . . . . . . . . . . . . . . . . . . . . . . . . . . . . . . . . . . . . . . . . . . . . . 7,775Thereafter . . . . . . . . . . . . . . . . . . . . . . . . . . . . . . . . . . . . . . . . . . . . . . . . . . . . . . . . . . 10,119
$58,978
79

MICROSTRATEGY INCORPORATED
NOTES TO CONSOLIDATED FINANCIAL STATEMENTS—(Continued)
Included within the commitments table above are gross restructuring-related lease obligations of $9.4million (Note 19).
Total rental expense for the years ended December 31, 2003, 2002 and 2001 was approximately $12.3million, $13.4 million and $20.7 million, respectively.
The Company subleases office space under operating lease agreements expiring at various dates through2009. The total future minimum rentals to be received under these noncancellable sublease agreements are asfollows (in thousands):
2004 . . . . . . . . . . . . . . . . . . . . . . . . . . . . . . . . . . . . . . . . . . . . . . . . . . . . . . . . . . . . . . . $ 3662005 . . . . . . . . . . . . . . . . . . . . . . . . . . . . . . . . . . . . . . . . . . . . . . . . . . . . . . . . . . . . . . . 3722006 . . . . . . . . . . . . . . . . . . . . . . . . . . . . . . . . . . . . . . . . . . . . . . . . . . . . . . . . . . . . . . . 2652007 . . . . . . . . . . . . . . . . . . . . . . . . . . . . . . . . . . . . . . . . . . . . . . . . . . . . . . . . . . . . . . . 1572008 . . . . . . . . . . . . . . . . . . . . . . . . . . . . . . . . . . . . . . . . . . . . . . . . . . . . . . . . . . . . . . . 161Thereafter . . . . . . . . . . . . . . . . . . . . . . . . . . . . . . . . . . . . . . . . . . . . . . . . . . . . . . . . . . . 27
$1,348
(12) Income Taxes
U.S. and international components of (loss) income from continuing operations before income taxes werecomprised of the following, for the years ended December 31, (in thousands):
2003 2002 2001
U.S. . . . . . . . . . . . . . . . . . . . . . . . . . . . . . . . . . . . . . . . . . . . . . . . . . . . . $(14,615) $36,060 $(44,831)Foreign . . . . . . . . . . . . . . . . . . . . . . . . . . . . . . . . . . . . . . . . . . . . . . . . . . 7,360 3,247 (763)
Total . . . . . . . . . . . . . . . . . . . . . . . . . . . . . . . . . . . . . . . . . . . . . . . . $ (7,255) $39,307 $(45,594)
The (benefit) provision for income taxes from continuing operations consists of the following, for the yearsended December 31, (in thousands):
2003 2002 2001
Current:Federal . . . . . . . . . . . . . . . . . . . . . . . . . . . . . . . . . . . . . . . . . . . . . . . . . . $ 55 $ 5 $ 81State . . . . . . . . . . . . . . . . . . . . . . . . . . . . . . . . . . . . . . . . . . . . . . . . . . . . — — —Foreign . . . . . . . . . . . . . . . . . . . . . . . . . . . . . . . . . . . . . . . . . . . . . . . . . 1,788 1,680 2,379
$ 1,843 $1,685 $2,460
Deferred:Federal . . . . . . . . . . . . . . . . . . . . . . . . . . . . . . . . . . . . . . . . . . . . . . . . . . $ — $ — $ —State . . . . . . . . . . . . . . . . . . . . . . . . . . . . . . . . . . . . . . . . . . . . . . . . . . . . — — —Foreign . . . . . . . . . . . . . . . . . . . . . . . . . . . . . . . . . . . . . . . . . . . . . . . . . (4,430) (495) —
$(4,430) $ (495) $ —
Total (benefit) provision . . . . . . . . . . . . . . . . . . . . . . . . . . . . . . . . . . . . . . . . $(2,587) $1,190 $2,460
80
MICROSTRATEGY INCORPORATED
NOTES TO CONSOLIDATED FINANCIAL STATEMENTS—(Continued)
The (benefit) provision for income taxes differs from the amount computed by applying the federal statutoryincome tax rate to the Company’s (loss) income from continuing operations before income taxes as follows, forthe years ended December 31, (in thousands):
2003 2002 2001
Income tax (benefit) expense at federal statutory rate . . . . . . . . . . . . . . $(2,539) $ 13,364 $(15,502)State taxes, net of federal tax effect . . . . . . . . . . . . . . . . . . . . . . . . . . . . (508) 1,074 (1,710)Goodwill amortization and other permanent differences . . . . . . . . . . . . 573 806 501Change in rates on deferred taxes . . . . . . . . . . . . . . . . . . . . . . . . . . . . . (2,659) — —Impact of international operations . . . . . . . . . . . . . . . . . . . . . . . . . . . . . (985) (128) 3,315Research and development tax credit . . . . . . . . . . . . . . . . . . . . . . . . . . . 816 (1,100) (1,879)Reserves on securities litigation . . . . . . . . . . . . . . . . . . . . . . . . . . . . . . . — (1,836) (1,217)Change in valuation allowance . . . . . . . . . . . . . . . . . . . . . . . . . . . . . . . 2,715 (10,990) 18,952
$(2,587) $ 1,190 $ 2,460
The change in rates on deferred tax assets resulted in an increase in domestic deferred tax assets which werefully offset by an increase in the Company’s valuation allowance.
Deferred income taxes reflect the net tax effects of the temporary differences between the carrying amountsof assets and liabilities for financial reporting purposes and the amounts used for income tax purposes.Significant components of the Company’s deferred tax assets and liabilities are as follows, as of December 31,(in thousands):
2003 2002
Deferred tax assets, net:Allowances and reserves . . . . . . . . . . . . . . . . . . . . . . . . . . . . . . . . . . . . . . . . . . . . . . $ 2,956 $ 3,662Reserve for litigation settlement . . . . . . . . . . . . . . . . . . . . . . . . . . . . . . . . . . . . . . . . . — 17,116Net operating loss carryforwards . . . . . . . . . . . . . . . . . . . . . . . . . . . . . . . . . . . . . . . . 120,198 91,781Deferred revenue adjustment . . . . . . . . . . . . . . . . . . . . . . . . . . . . . . . . . . . . . . . . . . . 1,013 1,658Unrealized gain . . . . . . . . . . . . . . . . . . . . . . . . . . . . . . . . . . . . . . . . . . . . . . . . . . . . . . 358 3,722Amortization . . . . . . . . . . . . . . . . . . . . . . . . . . . . . . . . . . . . . . . . . . . . . . . . . . . . . . . . 17,715 20,153Tax credit carryforwards . . . . . . . . . . . . . . . . . . . . . . . . . . . . . . . . . . . . . . . . . . . . . . 13,325 10,525Restructuring and other . . . . . . . . . . . . . . . . . . . . . . . . . . . . . . . . . . . . . . . . . . . . . . . 3,058 3,508
158,623 152,125Valuation allowance . . . . . . . . . . . . . . . . . . . . . . . . . . . . . . . . . . . . . . . . . . . . . . . . . . (145,634) (141,683)
Deferred tax assets, net of valuation allowance . . . . . . . . . . . . . . . . . . . . . . . . . . . . . 12,989 10,442
Deferred tax liabilities:Prepaid expenses and other assets . . . . . . . . . . . . . . . . . . . . . . . . . . . . . . . . . . . . . . . 801 399Depreciation . . . . . . . . . . . . . . . . . . . . . . . . . . . . . . . . . . . . . . . . . . . . . . . . . . . . . . . . 1,493 5,103Deferred revenue adjustment . . . . . . . . . . . . . . . . . . . . . . . . . . . . . . . . . . . . . . . . . . . 854 —Capitalized software development costs . . . . . . . . . . . . . . . . . . . . . . . . . . . . . . . . . . 2,617 2,106Internally developed software costs . . . . . . . . . . . . . . . . . . . . . . . . . . . . . . . . . . . . . . 1,731 1,689Unbilled receivables . . . . . . . . . . . . . . . . . . . . . . . . . . . . . . . . . . . . . . . . . . . . . . . . . . — 650
Total deferred tax liabilities . . . . . . . . . . . . . . . . . . . . . . . . . . . . . . . . . . . . . . . . . . . . 7,496 9,947
Total net deferred taxes . . . . . . . . . . . . . . . . . . . . . . . . . . . . . . . . . . . . . . . . . . . . . . . $ 5,493 $ 495
81

MICROSTRATEGY INCORPORATED
NOTES TO CONSOLIDATED FINANCIAL STATEMENTS—(Continued)
The Company recorded a net $4.0 million increase in the valuation allowance for the year ended December31, 2003 related to changes in deferred tax assets and the reduction of valuation allowances on net operating losscarryforwards in certain foreign subsidiaries. As of December 31, 2003, management has concluded that avaluation allowance is required on its domestic and certain other deferred tax assets based on its assessment thatthe realization of deferred tax assets meets the “more likely than not” criteria under SFAS No. 109. If ouroperations, and particularly our domestic operations, continue to demonstrate profitability in 2004, afterexcluding permanent differences and certain non-recurring items, we may reduce a substantial amount of ourvaluation allowance.
Deferred tax assets and liabilities have not been provided to account for basis differences and undistributedearnings of foreign subsidiaries because such amounts have been indefinitely reinvested or may be distributed ina tax-free manner.
The Company has foreign net operating loss carryforwards of $24.1 million, which begin to expire in 2005.The Company has domestic net operating loss carryforwards of $290.0 million, which will begin to expire in2019. The Company has research and development tax credit carryforwards of $6.2 million, which begin toexpire in 2018. The timing and manner in which the Company will utilize the net operating loss carryforwardsand research and development tax credit carryforwards in any year, or in total, may be limited by provisions ofthe Internal Revenue Code regarding changes in ownership of the Company.
On February 21, 2004, the Company received notification from the Internal Revenue Service that itscalendar year 2000 corporate income tax return had been selected for audit. Management believes that adequateprovision has been made for any adjustments that may result from tax examinations. However, the outcome ofthis tax audit cannot be predicted with certainty. Should any issues addressed in the Company’s tax audit beresolved in a manner not consistent with management’s expectations, the Company could be required to adjust itsprovision for income taxes in the period such resolution occurs.
(13) Redeemable Convertible Preferred Stock
In June 2001, the Company refinanced all but 650 shares of its outstanding series A redeemable convertiblepreferred stock by redeeming or exchanging the then remaining 11,850 shares of its series A preferred stock for$12.5 million in cash, 522,604 shares of class A common stock, plus an additional 34,243 shares of class Acommon stock for accrued and unpaid dividends, and series B, C, D and E redeemable convertible preferredstock with an aggregate stated value of $83.6 million. In connection with this refinancing transaction, theCompany recorded a net gain attributable to common stockholders of $29.4 million. This net gain represented theexcess of the carrying value of the series A preferred stock over the fair value of the consideration transferred tothe holders of such preferred securities, equal to $11.0 million, plus the pro-rata portion of the previouslyrecognized beneficial conversion feature on the series A preferred stock redeemed of $18.4 million. Based on thevaluation of the series D preferred stock at the time of issuance, the Company recorded a beneficial conversionfeature in the amount of $3.8 million based on the difference between the fair market value of the Company’sclass A common stock on the closing date of the transaction and the effective conversion price of the series Dpreferred stock issued as consideration.
Subsequent to this refinancing transaction, the Company paid $6.8 million in cash to redeem all of theoutstanding shares of series E preferred stock. The cash redemption payment was substantially equal to thecarrying value of the series E preferred stock on the date of redemption. Additionally, in 2001, the Companyissued 35,000 shares of class A common stock in connection with the conversion of 175 shares of series Dpreferred stock at the option of the holders.
82
MICROSTRATEGY INCORPORATED
NOTES TO CONSOLIDATED FINANCIAL STATEMENTS—(Continued)
In June 2002, on the date of maturity of the series A preferred stock, the then remaining 650 shares of seriesA preferred stock mandatorily converted into class A common stock. As a result, the Company issued 487,402shares of class A common stock plus 7,478 shares of class A common stock for accrued and unpaid dividends.
In August 2002, the Company completed a refinancing of its then outstanding shares of series B, C and Dconvertible preferred stock for $10.0 million in cash, $5.0 million in promissory notes, 697,728 shares of class Acommon stock, plus an additional 695,318 shares of class A common stock which were converted prior to theclosing, and series F preferred stock with a stated value of $20.96 million. In connection with this refinancingtransaction, the Company recorded a net gain attributable to common stockholders of $36.1 million. This net gainrepresented the excess of the aggregate carrying value of the series B, C and D preferred stock plus accrued andunpaid dividends over the fair value of the total consideration transferred to the holders of such preferredsecurities, equal to $35.2 million, plus the previously recognized beneficial conversion feature on the series Dpreferred stock of $1.1 million, less fees and other costs of $132,000. Based on the valuation of the series Fpreferred stock at the time of issuance, the Company recorded a beneficial conversion feature in the amount of$768,000 based on the difference between the fair market value of the Company’s class A common stock on theclosing date of the transaction and the effective conversion price of the series F preferred stock issued asconsideration. Because the series F preferred stock was convertible immediately upon issuance, the Companyfully amortized such beneficial conversion feature on the date of issuance. Subsequent to the refinancingtransaction in August 2002, holders elected to convert all of the outstanding shares of series F preferred stock. Asa result, the Company issued 1,397,174 shares of class A common stock in connection with the conversion.
Prior to the refinancing transactions, the Company accrued dividends on its outstanding shares of preferredstock in accordance with terms stipulated in the preferred stock agreements. For the years ended December 31,2002 and 2001, the Company accrued total dividends of $4.8 million and $8.6 million, respectively, on all of itsseries of preferred stock. During the year ended December 31, 2002, the Company paid aggregate preferred stockdividends valued at $6.8 million through the issuance of 492,058 shares of class A common stock in lieu of cash.During the year ended December 31, 2001, the Company paid aggregate preferred stock dividends valued at $6.2million through the issuance of 206,266 shares of class A common stock and 175.6 shares of series D preferredstock in lieu of cash.
Additionally, for the years ended December 31, 2002 and 2001, the Company recorded accretion on itspreferred stock of $1.3 million and $1.8 million, respectively, to accrete the carrying value of its series B and Cpreferred stock to its stated value and to accrete the carrying value of the beneficial conversion feature on itsseries D preferred stock.
(14) Redeemable Convertible Preferred Stock of Discontinued Operations
In January 2001, Strategy.com completed a second closing in a round of financing and issued 3,134,796shares of series A redeemable convertible preferred stock to a group of institutional and accredited investors forproceeds of $10.0 million.
On August 29, 2001, the Company entered into an exchange agreement pursuant to which MicroStrategyacquired all outstanding shares of Strategy.com’s series A preferred stock in exchange for 350,000 shares ofMicroStrategy’s class A common stock. Based on the closing price of the Company’s class A common stock of$24.90 per share on the date of the closing and the carrying value of Strategy.com’s series A preferred stock of$53.6 million on that same date, the early redemption resulted in a consolidated gain of $44.9 million attributableto common stockholders. This gain represented the excess of the carrying value of Strategy.com’s preferred stockover the fair value of the Company’s class A common stock exchanged in the transaction.
83
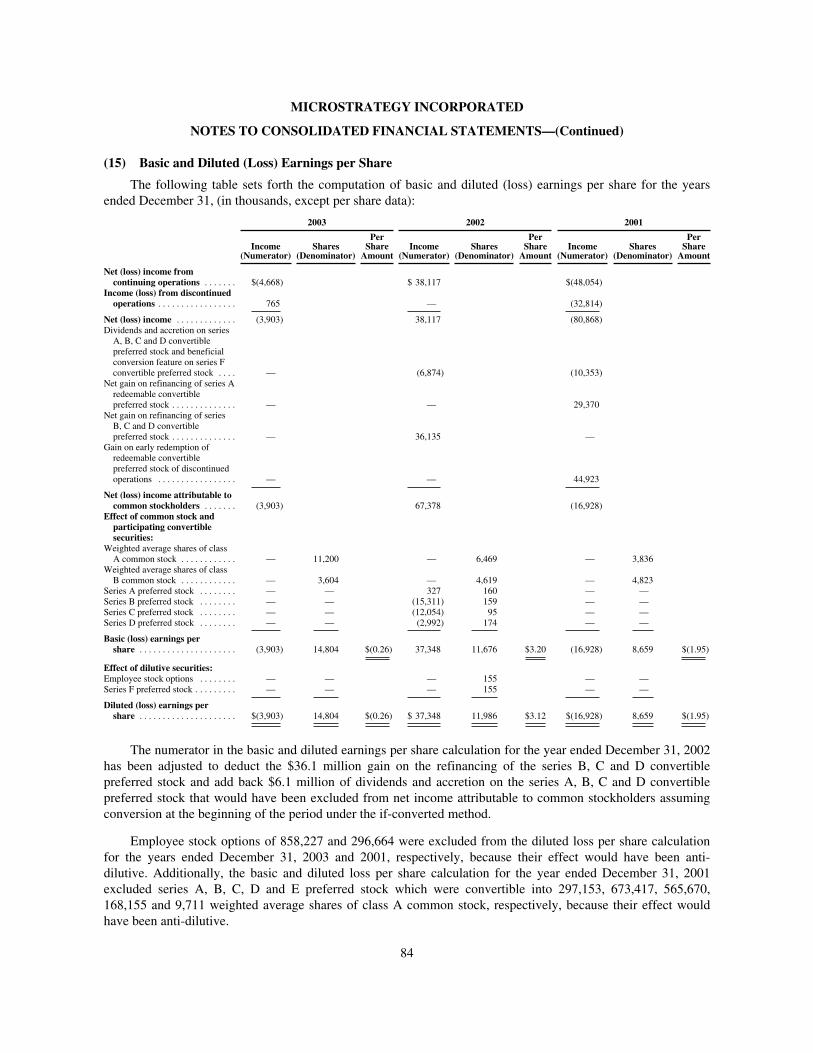
MICROSTRATEGY INCORPORATED
NOTES TO CONSOLIDATED FINANCIAL STATEMENTS—(Continued)
(15) Basic and Diluted (Loss) Earnings per Share
The following table sets forth the computation of basic and diluted (loss) earnings per share for the yearsended December 31, (in thousands, except per share data):
2003 2002 2001
Income(Numerator)
Shares(Denominator)
PerShareAmount
Income(Numerator)
Shares(Denominator)
PerShareAmount
Income(Numerator)
Shares(Denominator)
PerShareAmount
Net (loss) income fromcontinuing operations . . . . . . . $(4,668) $ 38,117 $(48,054)Income (loss) from discontinuedoperations . . . . . . . . . . . . . . . . . 765 — (32,814)
Net (loss) income . . . . . . . . . . . . . (3,903) 38,117 (80,868)Dividends and accretion on seriesA, B, C and D convertiblepreferred stock and beneficialconversion feature on series Fconvertible preferred stock . . . . — (6,874) (10,353)
Net gain on refinancing of series Aredeemable convertiblepreferred stock . . . . . . . . . . . . . . — — 29,370
Net gain on refinancing of seriesB, C and D convertiblepreferred stock . . . . . . . . . . . . . . — 36,135 —
Gain on early redemption ofredeemable convertiblepreferred stock of discontinuedoperations . . . . . . . . . . . . . . . . . — — 44,923
Net (loss) income attributable tocommon stockholders . . . . . . . (3,903) 67,378 (16,928)Effect of common stock andparticipating convertiblesecurities:
Weighted average shares of classA common stock . . . . . . . . . . . . — 11,200 — 6,469 — 3,836
Weighted average shares of classB common stock . . . . . . . . . . . . — 3,604 — 4,619 — 4,823
Series A preferred stock . . . . . . . . — — 327 160 — —Series B preferred stock . . . . . . . . — — (15,311) 159 — —Series C preferred stock . . . . . . . . — — (12,054) 95 — —Series D preferred stock . . . . . . . . — — (2,992) 174 — —
Basic (loss) earnings pershare . . . . . . . . . . . . . . . . . . . . . (3,903) 14,804 $(0.26) 37,348 11,676 $3.20 (16,928) 8,659 $(1.95)
Effect of dilutive securities:Employee stock options . . . . . . . . — — — 155 — —Series F preferred stock . . . . . . . . . — — — 155 — —
Diluted (loss) earnings pershare . . . . . . . . . . . . . . . . . . . . . $(3,903) 14,804 $(0.26) $ 37,348 11,986 $3.12 $(16,928) 8,659 $(1.95)
The numerator in the basic and diluted earnings per share calculation for the year ended December 31, 2002has been adjusted to deduct the $36.1 million gain on the refinancing of the series B, C and D convertiblepreferred stock and add back $6.1 million of dividends and accretion on the series A, B, C and D convertiblepreferred stock that would have been excluded from net income attributable to common stockholders assumingconversion at the beginning of the period under the if-converted method.
Employee stock options of 858,227 and 296,664 were excluded from the diluted loss per share calculationfor the years ended December 31, 2003 and 2001, respectively, because their effect would have been anti-dilutive. Additionally, the basic and diluted loss per share calculation for the year ended December 31, 2001excluded series A, B, C, D and E preferred stock which were convertible into 297,153, 673,417, 565,670,168,155 and 9,711 weighted average shares of class A common stock, respectively, because their effect wouldhave been anti-dilutive.
84
MICROSTRATEGY INCORPORATED
NOTES TO CONSOLIDATED FINANCIAL STATEMENTS—(Continued)
(16) Stockholders’ Equity
(a) Reverse Stock Split
On July 29, 2002, the Company’s Board of Directors approved a reverse stock split of the Company’scommon stock at a ratio of one-for-ten, causing each outstanding share of class A common stock and class Bcommon stock to convert automatically into one-tenth of a share of class A common stock and class B commonstock, respectively. The reverse split became effective at the close of business on July 30, 2002. Stockholders’equity has been restated to give retroactive recognition to the stock splits for all periods presented byreclassifying the excess par value resulting from the reduced aggregate number of shares from common stock topaid-in capital. All references to common share and per common share amounts for all periods presented havebeen retroactively restated to reflect the stock splits.
(b) Stock Plans
In February 1996, MicroStrategy adopted the 1996 Stock Plan in order to provide an incentive to eligibleemployees and officers of MicroStrategy. A total of 1,228,266 shares of class A common stock are reservedunder the 1996 Stock Plan, as amended. As of December 31, 2003, options to purchase 1,533,964 shares havebeen granted, of which 725,321 have been canceled. As of December 31, 2003, 419,623 shares were available forgrant under the 1996 Stock Plan; however, the Company does not anticipate making any future stock optiongrants under this plan.
In March 1997, MicroStrategy adopted the 1997 Stock Option Plan for French Employees, which providesfor the granting of options to purchase the Company’s class A common stock to employees of MicroStrategyFrance SARL, the Company’s French subsidiary. A total of 80,000 shares of class A common stock are reservedunder the 1997 Stock Option Plan for French Employees, as amended. As of December 31, 2003, options topurchase 55,887 shares have been granted, of which 22,230 have been canceled. The term of the 1997 StockOption Plan for French Employees expired in 2002. Accordingly, as of December 31, 2003, no shares wereavailable for grant under the 1997 Stock Option Plan for French Employees.
In September 1997, MicroStrategy adopted the 1997 Director Option Plan, which provides for grants ofnonqualified stock options to non-employee directors of MicroStrategy. A total of 44,000 shares of class Acommon stock are reserved under the 1997 Director Option Plan, as amended. As of December 31, 2003, optionsto purchase 44,000 shares have been granted, of which 12,200 have been canceled. As of December 31, 2003, noshares were available for grant under the 1997 Director Option Plan. The Company is no longer issuing optionsunder this plan.
In April 1999, MicroStrategy adopted the 1999 Stock Option Plan, which provides for grants of stockoptions to eligible employees, officers and directors of MicroStrategy. As of December 31, 2003, a total of3,850,000 shares of class A common stock were reserved under the 1999 Stock Option Plan, as amended. As ofDecember 31, 2003, options to purchase 3,796,283 shares have been granted, of which 1,360,416 have beencanceled. As of December 31, 2003, 1,414,133 shares were available for grant under the 1999 Stock Option Plan.
Shares of class A common stock will be issued upon exercise of any of the stock options granted under thestock plans. Stock options granted to date generally vest ratably over four to five years from the date of grant andexpire ten years after grant. The stock option exercise price of incentive stock options under MicroStrategy’sstock option plans may not be less than the determined fair market value at the date of grant.
85
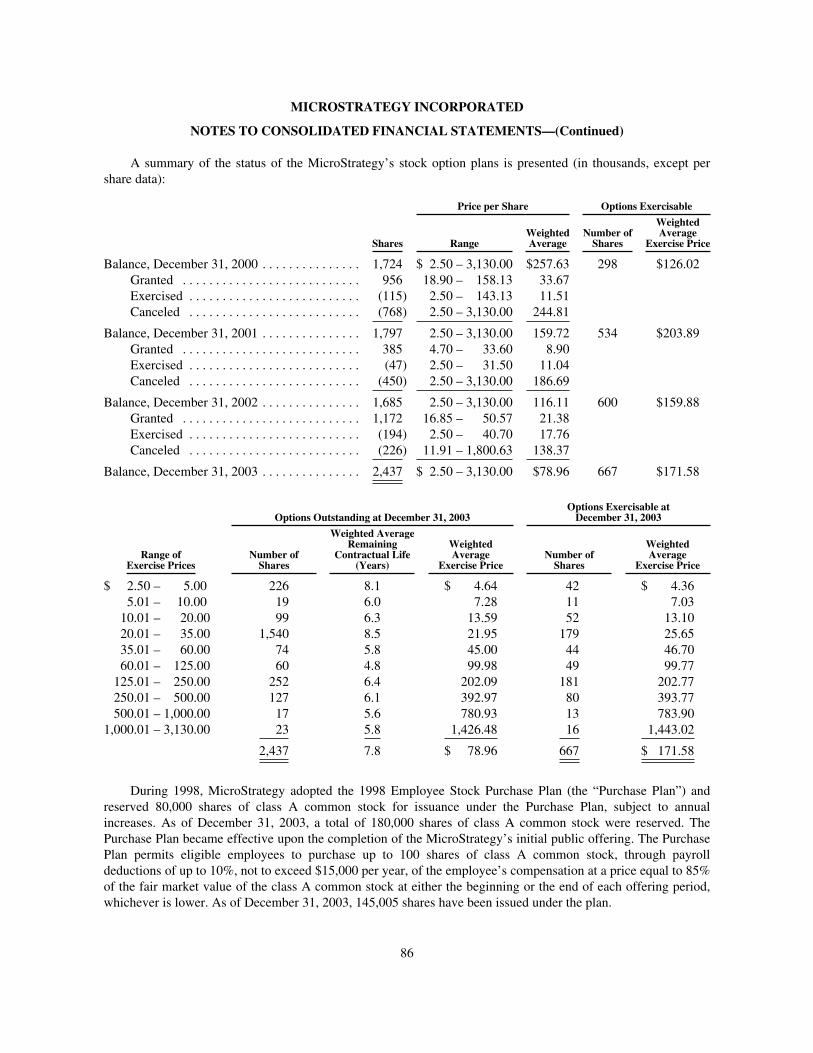
MICROSTRATEGY INCORPORATED
NOTES TO CONSOLIDATED FINANCIAL STATEMENTS—(Continued)
A summary of the status of the MicroStrategy’s stock option plans is presented (in thousands, except pershare data):
Price per Share Options Exercisable
Shares RangeWeightedAverage
Number ofShares
WeightedAverage
Exercise Price
Balance, December 31, 2000 . . . . . . . . . . . . . . . 1,724 $ 2.50 – 3,130.00 $257.63 298 $126.02Granted . . . . . . . . . . . . . . . . . . . . . . . . . . . 956 18.90 – 158.13 33.67Exercised . . . . . . . . . . . . . . . . . . . . . . . . . . (115) 2.50 – 143.13 11.51Canceled . . . . . . . . . . . . . . . . . . . . . . . . . . (768) 2.50 – 3,130.00 244.81
Balance, December 31, 2001 . . . . . . . . . . . . . . . 1,797 2.50 – 3,130.00 159.72 534 $203.89Granted . . . . . . . . . . . . . . . . . . . . . . . . . . . 385 4.70 – 33.60 8.90Exercised . . . . . . . . . . . . . . . . . . . . . . . . . . (47) 2.50 – 31.50 11.04Canceled . . . . . . . . . . . . . . . . . . . . . . . . . . (450) 2.50 – 3,130.00 186.69
Balance, December 31, 2002 . . . . . . . . . . . . . . . 1,685 2.50 – 3,130.00 116.11 600 $159.88Granted . . . . . . . . . . . . . . . . . . . . . . . . . . . 1,172 16.85 – 50.57 21.38Exercised . . . . . . . . . . . . . . . . . . . . . . . . . . (194) 2.50 – 40.70 17.76Canceled . . . . . . . . . . . . . . . . . . . . . . . . . . (226) 11.91 – 1,800.63 138.37
Balance, December 31, 2003 . . . . . . . . . . . . . . . 2,437 $ 2.50 – 3,130.00 $78.96 667 $171.58
Options Outstanding at December 31, 2003Options Exercisable atDecember 31, 2003
Range ofExercise Prices
Number ofShares
Weighted AverageRemaining
Contractual Life(Years)
WeightedAverage
Exercise PriceNumber ofShares
WeightedAverage
Exercise Price
$ 2.50 – 5.00 226 8.1 $ 4.64 42 $ 4.365.01 – 10.00 19 6.0 7.28 11 7.0310.01 – 20.00 99 6.3 13.59 52 13.1020.01 – 35.00 1,540 8.5 21.95 179 25.6535.01 – 60.00 74 5.8 45.00 44 46.7060.01 – 125.00 60 4.8 99.98 49 99.77125.01 – 250.00 252 6.4 202.09 181 202.77250.01 – 500.00 127 6.1 392.97 80 393.77500.01 – 1,000.00 17 5.6 780.93 13 783.90
1,000.01 – 3,130.00 23 5.8 1,426.48 16 1,443.02
2,437 7.8 $ 78.96 667 $ 171.58
During 1998, MicroStrategy adopted the 1998 Employee Stock Purchase Plan (the “Purchase Plan”) andreserved 80,000 shares of class A common stock for issuance under the Purchase Plan, subject to annualincreases. As of December 31, 2003, a total of 180,000 shares of class A common stock were reserved. ThePurchase Plan became effective upon the completion of the MicroStrategy’s initial public offering. The PurchasePlan permits eligible employees to purchase up to 100 shares of class A common stock, through payrolldeductions of up to 10%, not to exceed $15,000 per year, of the employee’s compensation at a price equal to 85%of the fair market value of the class A common stock at either the beginning or the end of each offering period,whichever is lower. As of December 31, 2003, 145,005 shares have been issued under the plan.
86

MICROSTRATEGY INCORPORATED
NOTES TO CONSOLIDATED FINANCIAL STATEMENTS—(Continued)
In December 2003, the Company’s majority-owned subsidiary, Alarm.com, adopted the 2003 StockIncentive Plan, which provides for grants of stock options to eligible employees, officers and non-employees ofAlarm.com. A total of 10,000 shares of Alarm.com class A common stock are reserved under the 2003 StockIncentive Plan. As of December 31, 2003, options to purchase 5,500 shares have been granted to employees ofAlarm.com. As of December 31, 2003, 4,500 shares are available for grant under the 2003 Stock Incentive Plan.
Shares of Alarm.com class A common stock will be issued upon exercise of any stock options granted underthe stock plan and will create additional minority interest. Stock options granted to date vest over approximatelyfour years from the date of grant and expire ten years after grant. The stock option exercise price of incentivestock options under Alarm.com’s stock option plan may not be less than the determined fair value at the date ofgrant.
A summary of the status of the 2003 Stock Incentive Plan of Alarm.com is presented (in thousands, exceptper share data):
Shares
Weighted AverageExercise Priceper Share
Balance, December 31, 2002 . . . . . . . . . . . . . . . . . . . . . . . . . . . . . . . . . . . . . . — $ —Granted . . . . . . . . . . . . . . . . . . . . . . . . . . . . . . . . . . . . . . . . . . . . . . . . . . . 5,500 12.00Exercised . . . . . . . . . . . . . . . . . . . . . . . . . . . . . . . . . . . . . . . . . . . . . . . . . . — —Canceled . . . . . . . . . . . . . . . . . . . . . . . . . . . . . . . . . . . . . . . . . . . . . . . . . . — —
Balance, December 31, 2003 . . . . . . . . . . . . . . . . . . . . . . . . . . . . . . . . . . . . . . 5,500 $12.00
All options under the 2003 Stock Incentive Plan were granted at the then determined per share fair value atthe date of grant of $12.00. These options will expire if not exercised by December 2013 and the weightedaverage remaining contractual life of the options outstanding at December 31, 2003 is approximately 9.9 years.
(c) Litigation Settlement
Pursuant to settlement agreements relating to the Company’s securities class action litigation (Note 9), theCompany issued to class members, among other consideration, 297,330 shares of class A common stock andwarrants to purchase 189,698 shares of class A common stock at an exercise price of $400.00 per share, whichexpire on June 24, 2007.
In addition, prior to the distribution of the securities issued as part of the class action settlement, certainofficers and directors of the Company tendered to the Company for no consideration an aggregate of 168,350shares of class A common stock for cancellation. Since two of these directors and officers are principalshareholders of the Company, their actions were deemed to be actions undertaken on behalf of the Company foraccounting purposes. Accordingly, the Company recognized a capital contribution during 2001 for the sharesreceived from these directors and officers of approximately $4.3 million, representing the fair value of the stockon the date of the contribution. Upon receipt, the Company immediately canceled the contributed shares.Accordingly, upon completion of the distribution of the securities under the settlement agreements, the Companyeffected a net issuance of 128,980 shares of class A common stock as part of the class action settlement.
(17) Employee Benefit Plan
The Company sponsors a benefit plan to provide retirement and incidental benefits for its employees, knownas the MicroStrategy Incorporated 401(k) Savings Plan (the “Plan”). Participants may make voluntarycontributions to the Plan of up to 20% of their annual base pre-tax compensation, cash bonuses and commissionsnot to exceed the federally determined maximum allowable contribution amounts. The Plan permits fordiscretionary company contributions; however, no contributions were made for the years presented.
87

MICROSTRATEGY INCORPORATED
NOTES TO CONSOLIDATED FINANCIAL STATEMENTS—(Continued)
(18) Segment Information
On December 31, 2001, the Company discontinued the operations of Strategy.com and shut down itsservices. Accordingly, the historical consolidated financial statements of the Company have been reclassified topresent Strategy.com as a discontinued operation for all periods presented (Note 3). Prior to this, the Companyhad two operating segments and had begun operating its business as such in the latter part of 1999. As a result ofthe shutting down of Strategy.com operations, the Company operates in one significant business segment—business intelligence.
The following summary discloses total revenues and long-lived assets, excluding long-term deferred taxassets, long-term investments and long-term net assets of discontinued operations, according to geographicregion (in thousands):
Domestic International Consolidated
Year ended December 31, 2003Total license and service revenues . . . . . . . . . . . . . . . . . . . . $115,795 $59,782 $175,577Long-lived assets . . . . . . . . . . . . . . . . . . . . . . . . . . . . . . . . . 19,061 2,729 21,790
Year ended December 31, 2002Total license and service revenues . . . . . . . . . . . . . . . . . . . . $ 94,682 $53,145 $147,827Long-lived assets . . . . . . . . . . . . . . . . . . . . . . . . . . . . . . . . . 22,735 2,090 24,825
Year ended December 31, 2001Total license and service revenues . . . . . . . . . . . . . . . . . . . . $120,560 $61,521 $182,081Long-lived assets . . . . . . . . . . . . . . . . . . . . . . . . . . . . . . . . . 33,067 2,630 35,697
The domestic region includes operations in the U.S. and Canada. The international region includesoperations in all other foreign countries. Transfers relating to intercompany software fees from international todomestic operations of $23.2 million, $20.1 million and $9.7 million for 2003, 2002 and 2001, respectively, havebeen excluded from the above tables and eliminated in the consolidated financial statements.
For the years ended December 31, 2003, 2002 and 2001, no individual customer accounted for 10% or moreof consolidated total revenue.
(19) Restructuring and Impairment Charges
During 2001, the Company adopted restructuring plans which included a strategic decision to focusoperations on the business intelligence market, the elimination or reduction of speculative technology initiatives,a reduction of the Company’s workforce and a consolidation of its multiple Northern Virginia facilities into asingle location in McLean, Virginia.
As a result of these restructuring plans, the Company recorded restructuring and impairment charges of$27.3 million during 2001 for severance costs and other benefits for terminated employees, costs associated withexiting facilities and fees incurred for professional services directly related to the restructuring. Costs associatedwith exiting facilities included estimated sublease losses, representing the excess of lease costs over subleaseincome, estimated sublease commissions and concessions and other facility closing costs including rent expensewhile the office space is vacant. On a quarterly basis, the Company assesses the adequacy of its restructuringreserve based upon changes in current market conditions. Due to a decline in estimated sublease rates and anincrease in the expected length of time to sublease vacant space, the Company updated its accrued restructuringcosts by recording additional sublease losses of $2.8 million during 2002. During 2003, the Company furtherupdated its estimated sublease losses and recorded an increase in its restructuring reserve of $1.7 million due to asustained high level of vacancy rates in the commercial real estate market and difficulties experienced insubleasing idle space.
88
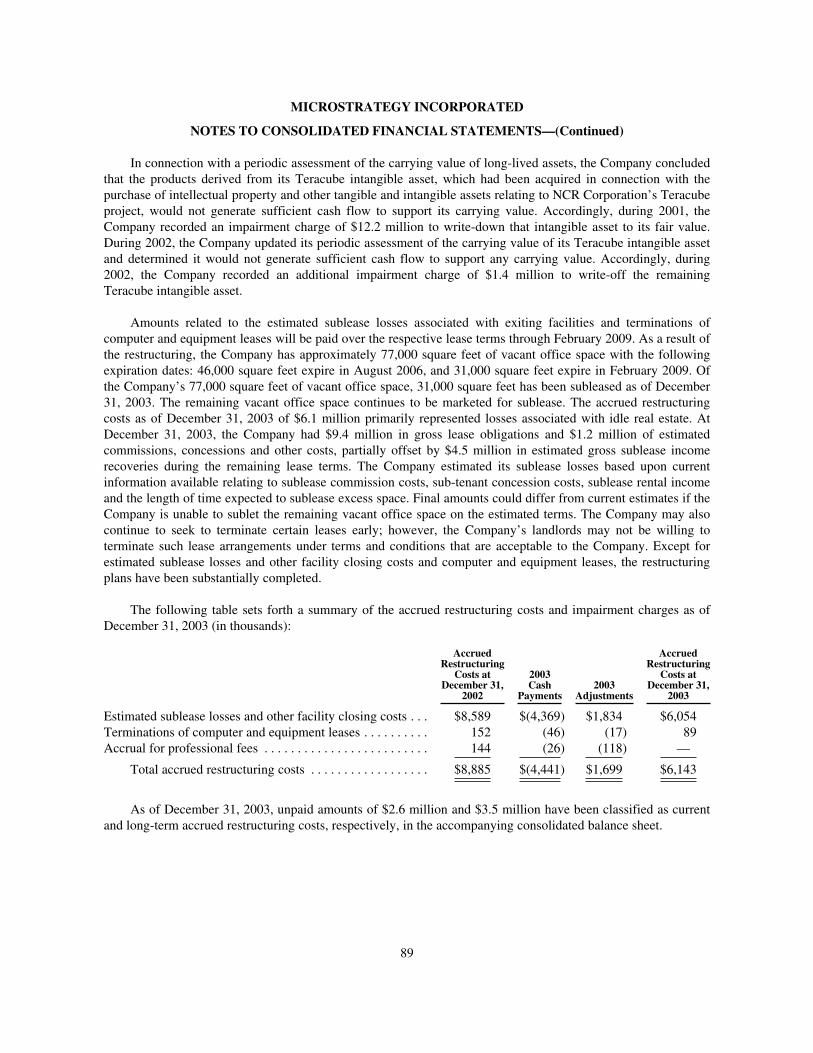
MICROSTRATEGY INCORPORATED
NOTES TO CONSOLIDATED FINANCIAL STATEMENTS—(Continued)
In connection with a periodic assessment of the carrying value of long-lived assets, the Company concludedthat the products derived from its Teracube intangible asset, which had been acquired in connection with thepurchase of intellectual property and other tangible and intangible assets relating to NCR Corporation’s Teracubeproject, would not generate sufficient cash flow to support its carrying value. Accordingly, during 2001, theCompany recorded an impairment charge of $12.2 million to write-down that intangible asset to its fair value.During 2002, the Company updated its periodic assessment of the carrying value of its Teracube intangible assetand determined it would not generate sufficient cash flow to support any carrying value. Accordingly, during2002, the Company recorded an additional impairment charge of $1.4 million to write-off the remainingTeracube intangible asset.
Amounts related to the estimated sublease losses associated with exiting facilities and terminations ofcomputer and equipment leases will be paid over the respective lease terms through February 2009. As a result ofthe restructuring, the Company has approximately 77,000 square feet of vacant office space with the followingexpiration dates: 46,000 square feet expire in August 2006, and 31,000 square feet expire in February 2009. Ofthe Company’s 77,000 square feet of vacant office space, 31,000 square feet has been subleased as of December31, 2003. The remaining vacant office space continues to be marketed for sublease. The accrued restructuringcosts as of December 31, 2003 of $6.1 million primarily represented losses associated with idle real estate. AtDecember 31, 2003, the Company had $9.4 million in gross lease obligations and $1.2 million of estimatedcommissions, concessions and other costs, partially offset by $4.5 million in estimated gross sublease incomerecoveries during the remaining lease terms. The Company estimated its sublease losses based upon currentinformation available relating to sublease commission costs, sub-tenant concession costs, sublease rental incomeand the length of time expected to sublease excess space. Final amounts could differ from current estimates if theCompany is unable to sublet the remaining vacant office space on the estimated terms. The Company may alsocontinue to seek to terminate certain leases early; however, the Company’s landlords may not be willing toterminate such lease arrangements under terms and conditions that are acceptable to the Company. Except forestimated sublease losses and other facility closing costs and computer and equipment leases, the restructuringplans have been substantially completed.
The following table sets forth a summary of the accrued restructuring costs and impairment charges as ofDecember 31, 2003 (in thousands):
AccruedRestructuringCosts at
December 31,2002
2003CashPayments
2003Adjustments
AccruedRestructuringCosts at
December 31,2003
Estimated sublease losses and other facility closing costs . . . $8,589 $(4,369) $1,834 $6,054Terminations of computer and equipment leases . . . . . . . . . . 152 (46) (17) 89Accrual for professional fees . . . . . . . . . . . . . . . . . . . . . . . . . 144 (26) (118) —
Total accrued restructuring costs . . . . . . . . . . . . . . . . . . $8,885 $(4,441) $1,699 $6,143
As of December 31, 2003, unpaid amounts of $2.6 million and $3.5 million have been classified as currentand long-term accrued restructuring costs, respectively, in the accompanying consolidated balance sheet.
89
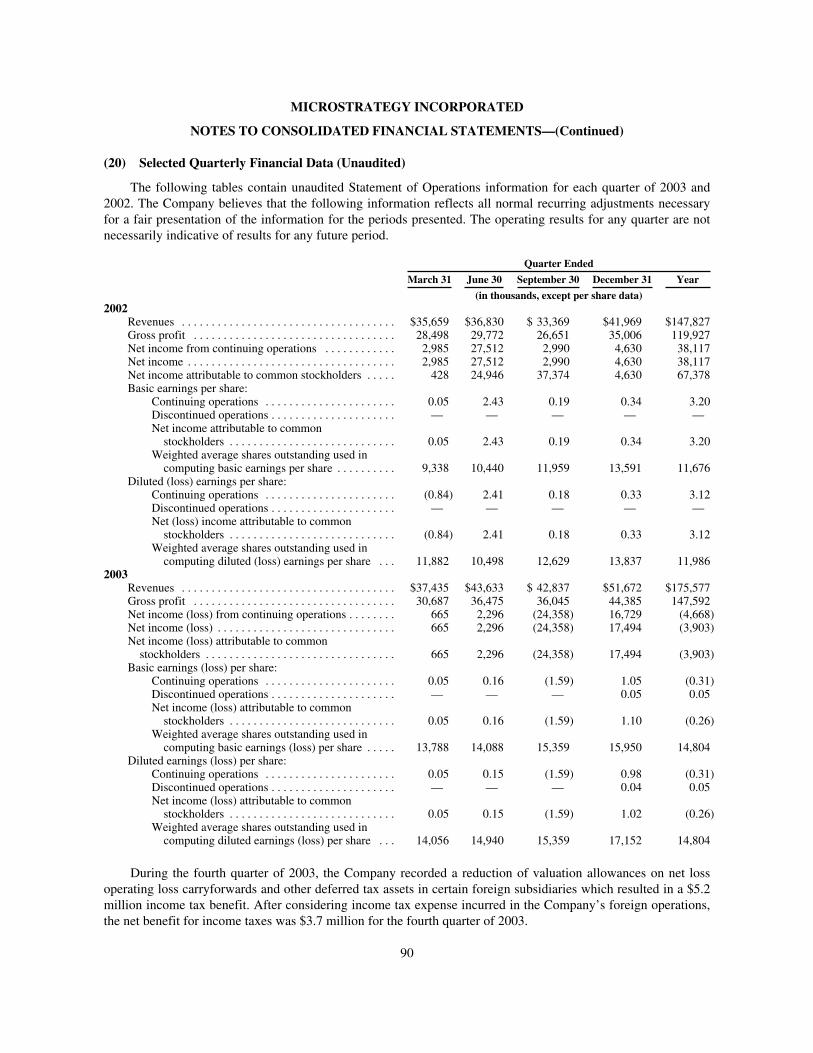
MICROSTRATEGY INCORPORATED
NOTES TO CONSOLIDATED FINANCIAL STATEMENTS—(Continued)
(20) Selected Quarterly Financial Data (Unaudited)
The following tables contain unaudited Statement of Operations information for each quarter of 2003 and2002. The Company believes that the following information reflects all normal recurring adjustments necessaryfor a fair presentation of the information for the periods presented. The operating results for any quarter are notnecessarily indicative of results for any future period.
Quarter Ended
March 31 June 30 September 30 December 31 Year
(in thousands, except per share data)2002
Revenues . . . . . . . . . . . . . . . . . . . . . . . . . . . . . . . . . . . . $35,659 $36,830 $ 33,369 $41,969 $147,827Gross profit . . . . . . . . . . . . . . . . . . . . . . . . . . . . . . . . . . 28,498 29,772 26,651 35,006 119,927Net income from continuing operations . . . . . . . . . . . . 2,985 27,512 2,990 4,630 38,117Net income . . . . . . . . . . . . . . . . . . . . . . . . . . . . . . . . . . . 2,985 27,512 2,990 4,630 38,117Net income attributable to common stockholders . . . . . 428 24,946 37,374 4,630 67,378Basic earnings per share:
Continuing operations . . . . . . . . . . . . . . . . . . . . . . 0.05 2.43 0.19 0.34 3.20Discontinued operations . . . . . . . . . . . . . . . . . . . . . — — — — —Net income attributable to commonstockholders . . . . . . . . . . . . . . . . . . . . . . . . . . . . 0.05 2.43 0.19 0.34 3.20
Weighted average shares outstanding used incomputing basic earnings per share . . . . . . . . . . 9,338 10,440 11,959 13,591 11,676
Diluted (loss) earnings per share:Continuing operations . . . . . . . . . . . . . . . . . . . . . . (0.84) 2.41 0.18 0.33 3.12Discontinued operations . . . . . . . . . . . . . . . . . . . . . — — — — —Net (loss) income attributable to commonstockholders . . . . . . . . . . . . . . . . . . . . . . . . . . . . (0.84) 2.41 0.18 0.33 3.12
Weighted average shares outstanding used incomputing diluted (loss) earnings per share . . . 11,882 10,498 12,629 13,837 11,986
2003Revenues . . . . . . . . . . . . . . . . . . . . . . . . . . . . . . . . . . . . $37,435 $43,633 $ 42,837 $51,672 $175,577Gross profit . . . . . . . . . . . . . . . . . . . . . . . . . . . . . . . . . . 30,687 36,475 36,045 44,385 147,592Net income (loss) from continuing operations . . . . . . . . 665 2,296 (24,358) 16,729 (4,668)Net income (loss) . . . . . . . . . . . . . . . . . . . . . . . . . . . . . . 665 2,296 (24,358) 17,494 (3,903)Net income (loss) attributable to commonstockholders . . . . . . . . . . . . . . . . . . . . . . . . . . . . . . . . 665 2,296 (24,358) 17,494 (3,903)
Basic earnings (loss) per share:Continuing operations . . . . . . . . . . . . . . . . . . . . . . 0.05 0.16 (1.59) 1.05 (0.31)Discontinued operations . . . . . . . . . . . . . . . . . . . . . — — — 0.05 0.05Net income (loss) attributable to commonstockholders . . . . . . . . . . . . . . . . . . . . . . . . . . . . 0.05 0.16 (1.59) 1.10 (0.26)
Weighted average shares outstanding used incomputing basic earnings (loss) per share . . . . . 13,788 14,088 15,359 15,950 14,804
Diluted earnings (loss) per share:Continuing operations . . . . . . . . . . . . . . . . . . . . . . 0.05 0.15 (1.59) 0.98 (0.31)Discontinued operations . . . . . . . . . . . . . . . . . . . . . — — — 0.04 0.05Net income (loss) attributable to commonstockholders . . . . . . . . . . . . . . . . . . . . . . . . . . . . 0.05 0.15 (1.59) 1.02 (0.26)
Weighted average shares outstanding used incomputing diluted earnings (loss) per share . . . 14,056 14,940 15,359 17,152 14,804
During the fourth quarter of 2003, the Company recorded a reduction of valuation allowances on net lossoperating loss carryforwards and other deferred tax assets in certain foreign subsidiaries which resulted in a $5.2million income tax benefit. After considering income tax expense incurred in the Company’s foreign operations,the net benefit for income taxes was $3.7 million for the fourth quarter of 2003.
90

SIGNATURES
Pursuant to the requirements of Section 13 or 15(d) of the Securities Exchange Act of 1934, the registranthas duly caused this report to be signed on its behalf by the undersigned, thereunto duly authorized.
MICROSTRATEGY INCORPORATED(Registrant)
By: /S/ MICHAEL J. SAYLOR
Name: Michael J. SaylorTitle: Chairman of the Board of Directors and
Chief Executive Officer
Date: March 11, 2004
Pursuant to the requirements of the Securities Exchange Act of 1934, this report has been signed below bythe following persons on behalf of the registrant and in the capacities and on the dates indicated.
Name Position Date
/S/ MICHAEL J. SAYLORMichael J. Saylor
Chairman of the Board of Directorsand Chief Executive Officer(Principal Executive Officer)
March 11, 2004
/S/ ERIC F. BROWN
Eric F. Brown
President and Chief Financial Officer(Principal Financial and AccountingOfficer)
March 11, 2004
/S/ SANJU K. BANSAL
Sanju K. Bansal
Vice Chairman of the Board ofDirectors, Executive Vice Presidentand Chief Operating Officer
March 11, 2004
/S/ DAVID B. BLUNDIN
David B. Blundin
Director March 11, 2004
/S/ F. DAVID FOWLER
F. David Fowler
Director March 11, 2004
/S/ CARL J. RICKERTSEN
Carl J. Rickertsen
Director March 11, 2004
/S/ STUART B. ROSS
Stuart B. Ross
Director March 11, 2004
/S/ RALPH S. TERKOWITZ
Ralph S. Terkowitz
Director March 11, 2004
91
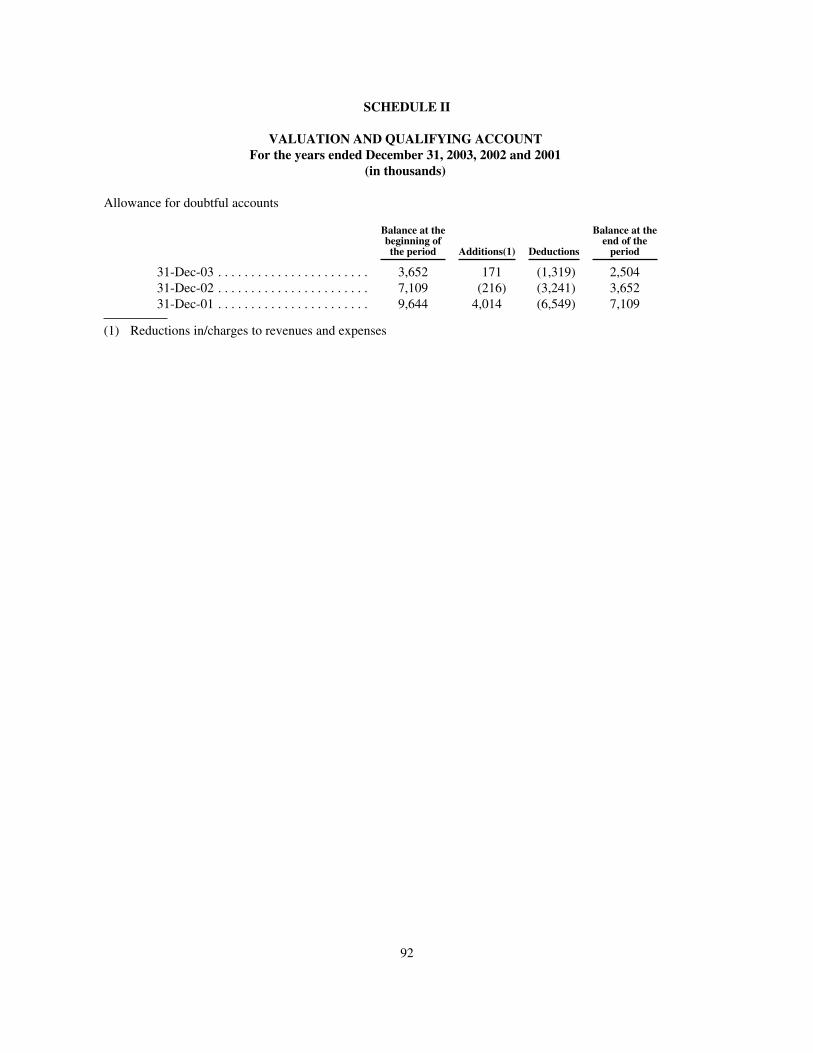
SCHEDULE II
VALUATION AND QUALIFYING ACCOUNTFor the years ended December 31, 2003, 2002 and 2001
(in thousands)
Allowance for doubtful accounts
Balance at thebeginning ofthe period Additions(1) Deductions
Balance at theend of theperiod
31-Dec-03 . . . . . . . . . . . . . . . . . . . . . . . 3,652 171 (1,319) 2,50431-Dec-02 . . . . . . . . . . . . . . . . . . . . . . . 7,109 (216) (3,241) 3,65231-Dec-01 . . . . . . . . . . . . . . . . . . . . . . . 9,644 4,014 (6,549) 7,109
(1) Reductions in/charges to revenues and expenses
92

INDEX TO EXHIBITS
ExhibitNumber Description
3.1 Second Restated Certificate of Incorporation of the registrant (filed as Exhibit 3.1 to the registrant’sQuarterly Report on Form 10-Q for the quarterly period ended March 31, 2003 (File No. 000-24435)and incorporated by reference herein).
3.2 Amended and Restated By-Laws of the registrant.
4.1 Form of Certificate of Class A Common Stock of the registrant (filed as Exhibit 4.1 to the registrant’sQuarterly Report on Form 10-Q for the quarterly period ended June 30, 2003 (File No. 000-24435)and incorporated by reference herein).
4.2 Warrant Agreement, dated as of January 11, 2001, by and between the registrant and American StockTransfer & Trust Company, included as Exhibit E to the Stipulation of Settlement regarding thesettlement of the class action lawsuit, dated as of January 11, 2001 (filed as Exhibit 10.29 to theregistrant’s Annual Report on Form 10-K for the fiscal year ended December 31, 2000 (File No. 000-24435) and incorporated by reference herein).
10.1 Amended and Restated 1996 Stock Plan of the registrant (filed as Exhibit 10.1 to the registrant’sQuarterly Report on Form 10-Q for the quarterly period ended September 30, 1998 (File No. 000-24435) and incorporated by reference herein).*
10.2 Amended and Restated 1997 Stock Option Plan for French Employees of the registrant (filed as Exhibit10.1 to the registrant’s Quarterly Report on Form 10-Q for the quarterly period ended March 31,2001 (File No. 000-24435) and incorporated by reference herein).
10.3 1997 Director Option Plan of the registrant, as amended by Amendment No. 1 thereto (filed as Exhibit10.3 to the registrant’s Annual Report on Form 10-K for the fiscal year ended December 31, 1999(File No. 000-24435) and incorporated by reference herein).*
10.4 Amendment No. 2 to the registrant’s 1997 Director Option Plan (filed as Exhibit 10.1 to the registrant’sQuarterly Report on Form 10-Q for the quarterly period ended September 30, 2001 (File No. 000-24435) and incorporated by reference herein).*
10.5 1998 Employee Stock Purchase Plan of the registrant (filed as Exhibit 10.4 to the registrant’s AnnualReport on Form 10-K for the fiscal year ended December 31, 1998 (File No. 000-24435) andincorporated by reference herein).*
10.6 Form of Second Amended and Restated 1999 Stock Option Plan of the registrant (filed as Exhibit 10.7to the registrant’s Annual Report on Form 10-K for the fiscal year ended December 31, 2002 (FileNo. 000-24435) and incorporated by reference herein).*
10.7 Stock Option Agreement, dated July 26, 2002, between Eric F. Brown and the registrant, providing forthe grant of an incentive stock option (filed as Exhibit 10.8 to the registrant’s Annual Report on Form10-K for the fiscal year ended December 31, 2002 (File No. 000-24435) and incorporated byreference herein).*
10.8 Stock Option Agreement, dated July 26, 2002, between Eric F. Brown and the registrant, providing forthe grant of a nonstatutory stock option (filed as Exhibit 10.9 to the registrant’s Annual Report onForm 10-K for the fiscal year ended December 31, 2002 (File No. 000-24435) and incorporated byreference herein).*
10.9 Stock Option Agreement, dated July 26, 2002, between Jonathan F. Klein and the registrant, providingfor the grant of an incentive stock option (filed as Exhibit 10.10 to the registrant’s Annual Report onForm 10-K for the fiscal year ended December 31, 2002 (File No. 000-24435) and incorporated byreference herein).*
93
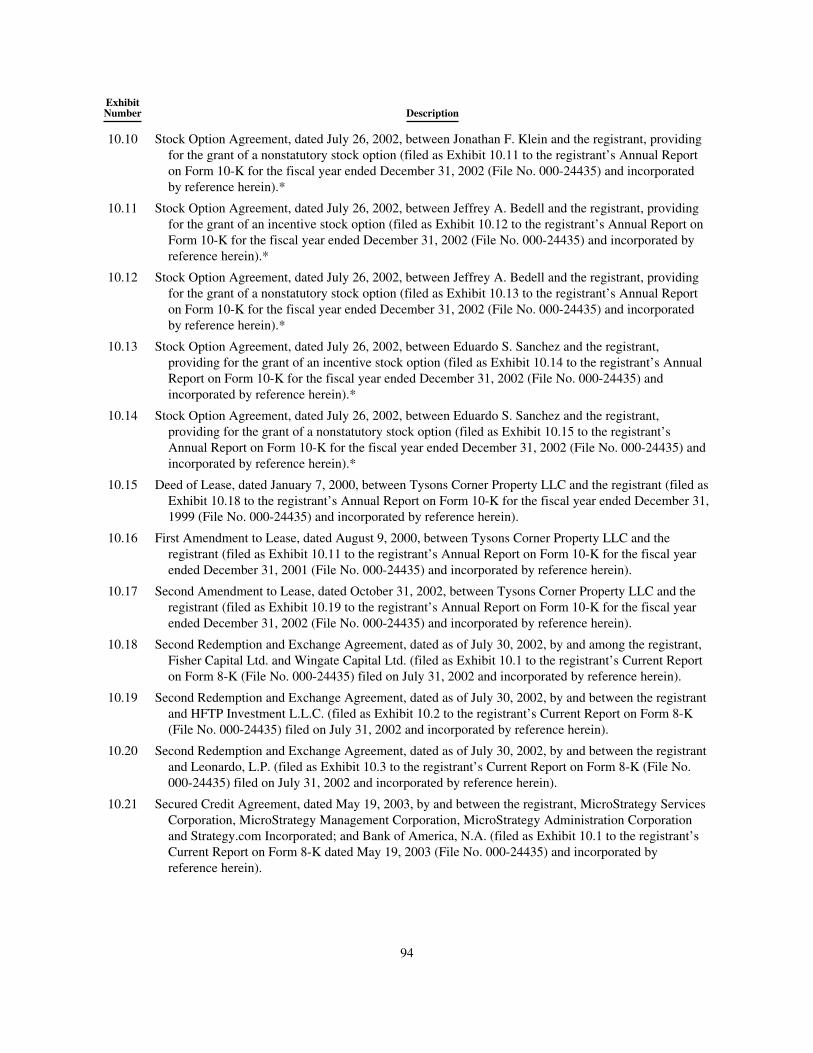
ExhibitNumber Description
10.10 Stock Option Agreement, dated July 26, 2002, between Jonathan F. Klein and the registrant, providingfor the grant of a nonstatutory stock option (filed as Exhibit 10.11 to the registrant’s Annual Reporton Form 10-K for the fiscal year ended December 31, 2002 (File No. 000-24435) and incorporatedby reference herein).*
10.11 Stock Option Agreement, dated July 26, 2002, between Jeffrey A. Bedell and the registrant, providingfor the grant of an incentive stock option (filed as Exhibit 10.12 to the registrant’s Annual Report onForm 10-K for the fiscal year ended December 31, 2002 (File No. 000-24435) and incorporated byreference herein).*
10.12 Stock Option Agreement, dated July 26, 2002, between Jeffrey A. Bedell and the registrant, providingfor the grant of a nonstatutory stock option (filed as Exhibit 10.13 to the registrant’s Annual Reporton Form 10-K for the fiscal year ended December 31, 2002 (File No. 000-24435) and incorporatedby reference herein).*
10.13 Stock Option Agreement, dated July 26, 2002, between Eduardo S. Sanchez and the registrant,providing for the grant of an incentive stock option (filed as Exhibit 10.14 to the registrant’s AnnualReport on Form 10-K for the fiscal year ended December 31, 2002 (File No. 000-24435) andincorporated by reference herein).*
10.14 Stock Option Agreement, dated July 26, 2002, between Eduardo S. Sanchez and the registrant,providing for the grant of a nonstatutory stock option (filed as Exhibit 10.15 to the registrant’sAnnual Report on Form 10-K for the fiscal year ended December 31, 2002 (File No. 000-24435) andincorporated by reference herein).*
10.15 Deed of Lease, dated January 7, 2000, between Tysons Corner Property LLC and the registrant (filed asExhibit 10.18 to the registrant’s Annual Report on Form 10-K for the fiscal year ended December 31,1999 (File No. 000-24435) and incorporated by reference herein).
10.16 First Amendment to Lease, dated August 9, 2000, between Tysons Corner Property LLC and theregistrant (filed as Exhibit 10.11 to the registrant’s Annual Report on Form 10-K for the fiscal yearended December 31, 2001 (File No. 000-24435) and incorporated by reference herein).
10.17 Second Amendment to Lease, dated October 31, 2002, between Tysons Corner Property LLC and theregistrant (filed as Exhibit 10.19 to the registrant’s Annual Report on Form 10-K for the fiscal yearended December 31, 2002 (File No. 000-24435) and incorporated by reference herein).
10.18 Second Redemption and Exchange Agreement, dated as of July 30, 2002, by and among the registrant,Fisher Capital Ltd. and Wingate Capital Ltd. (filed as Exhibit 10.1 to the registrant’s Current Reporton Form 8-K (File No. 000-24435) filed on July 31, 2002 and incorporated by reference herein).
10.19 Second Redemption and Exchange Agreement, dated as of July 30, 2002, by and between the registrantand HFTP Investment L.L.C. (filed as Exhibit 10.2 to the registrant’s Current Report on Form 8-K(File No. 000-24435) filed on July 31, 2002 and incorporated by reference herein).
10.20 Second Redemption and Exchange Agreement, dated as of July 30, 2002, by and between the registrantand Leonardo, L.P. (filed as Exhibit 10.3 to the registrant’s Current Report on Form 8-K (File No.000-24435) filed on July 31, 2002 and incorporated by reference herein).
10.21 Secured Credit Agreement, dated May 19, 2003, by and between the registrant, MicroStrategy ServicesCorporation, MicroStrategy Management Corporation, MicroStrategy Administration Corporationand Strategy.com Incorporated; and Bank of America, N.A. (filed as Exhibit 10.1 to the registrant’sCurrent Report on Form 8-K dated May 19, 2003 (File No. 000-24435) and incorporated byreference herein).
94
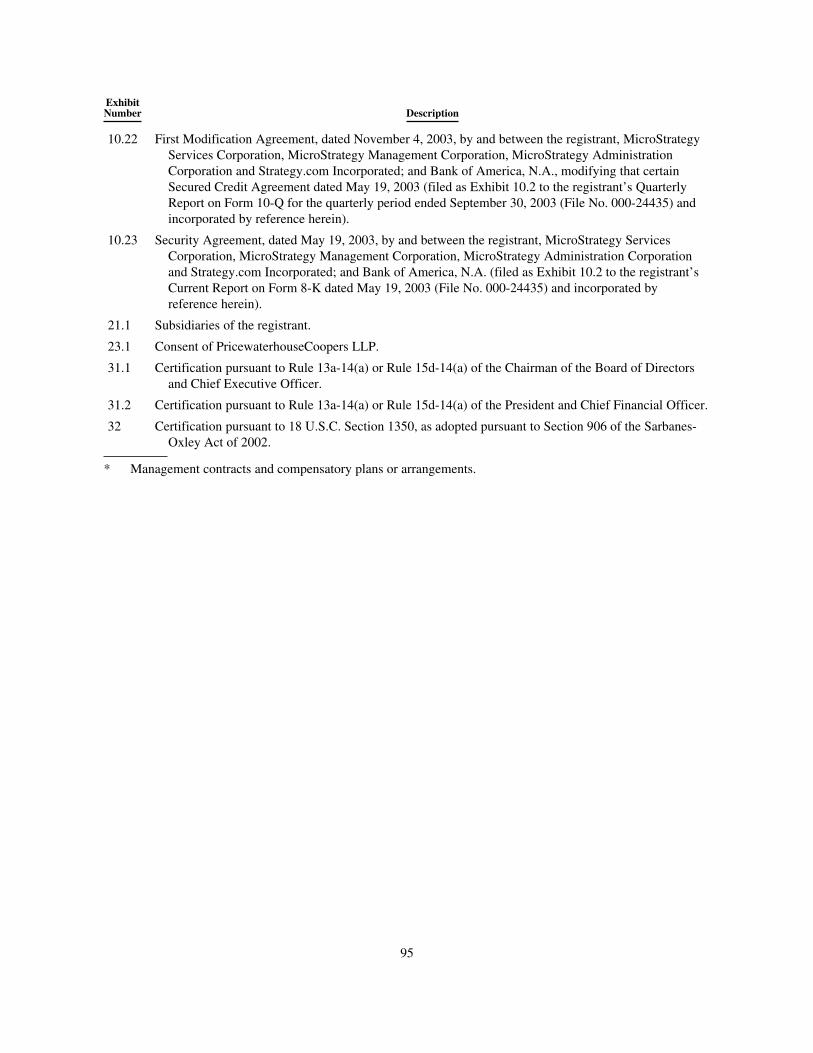
ExhibitNumber Description
10.22 First Modification Agreement, dated November 4, 2003, by and between the registrant, MicroStrategyServices Corporation, MicroStrategy Management Corporation, MicroStrategy AdministrationCorporation and Strategy.com Incorporated; and Bank of America, N.A., modifying that certainSecured Credit Agreement dated May 19, 2003 (filed as Exhibit 10.2 to the registrant’s QuarterlyReport on Form 10-Q for the quarterly period ended September 30, 2003 (File No. 000-24435) andincorporated by reference herein).
10.23 Security Agreement, dated May 19, 2003, by and between the registrant, MicroStrategy ServicesCorporation, MicroStrategy Management Corporation, MicroStrategy Administration Corporationand Strategy.com Incorporated; and Bank of America, N.A. (filed as Exhibit 10.2 to the registrant’sCurrent Report on Form 8-K dated May 19, 2003 (File No. 000-24435) and incorporated byreference herein).
21.1 Subsidiaries of the registrant.
23.1 Consent of PricewaterhouseCoopers LLP.
31.1 Certification pursuant to Rule 13a-14(a) or Rule 15d-14(a) of the Chairman of the Board of Directorsand Chief Executive Officer.
31.2 Certification pursuant to Rule 13a-14(a) or Rule 15d-14(a) of the President and Chief Financial Officer.
32 Certification pursuant to 18 U.S.C. Section 1350, as adopted pursuant to Section 906 of the Sarbanes-Oxley Act of 2002.
* Management contracts and compensatory plans or arrangements.
95

SECURITIES AND EXCHANGE COMMISSIONWashington, D.C. 20549
FORM 10-K/A(Amendment No. 1)
È ANNUAL REPORT PURSUANT TO SECTION 13 OR 15(D) OF THESECURITIES EXCHANGE ACT OF 1934
For the fiscal year ended December 31, 2003
OR
‘ TRANSITION REPORT PURSUANT TO SECTION 13 OR 15(D) OF THESECURITIES AND EXCHANGE ACT OF 1934
For the transition period from to
Commission File Number 000-24435
MICROSTRATEGY INCORPORATED(Exact name of registrant as specified in its charter)
Delaware 1861 International Drive, McLean, VA 22102 51-0323571(State of incorporation) (Address of Principal Executive Offices) (Zip Code) (I.R.S. Employer
Identification Number)
Registrant’s telephone number, including area code:
(703) 848-8600
Securities registered pursuant to Section 12(b) of the Act:
Not applicable
Securities registered pursuant to Section 12(g) of the Act:
Class A common stock, par value $0.001 per share
Warrants to Purchase Class A Common Stock, par value $0.001 per share(Title of class)
Indicate by check mark whether the registrant: (1) has filed all reports required to be filed by Section 13 or15(d) of the Securities Exchange Act of 1934 during the preceding 12 months (or for such shorter period that theregistrant was required to file such reports), and (2) has been subject to such filing requirements for the past 90days. Yes È No ‘
Indicate by check mark if disclosure of delinquent filers pursuant to Item 405 of Regulation S-K is notcontained herein, and will not be contained, to the best of registrant’s knowledge, in definitive proxy orinformation statements incorporated by reference in Part III of this Form 10-K or any amendment to thisForm 10-K. ‘
Indicate by check mark whether the registrant is an accelerated filer (as defined in Rule 12b-2 of the Act).Yes È No ‘
The aggregate market value of the voting stock held by non-affiliates of the registrant (based on the lastreported sale price of the Registrant’s class A common stock on June 30, 2003 on the Nasdaq National Market)was approximately $381.9 million.
The number of shares of the registrant’s class A common stock and class B common stock outstanding onMarch 1, 2004 was 12,431,663 and 3,603,730, respectively.
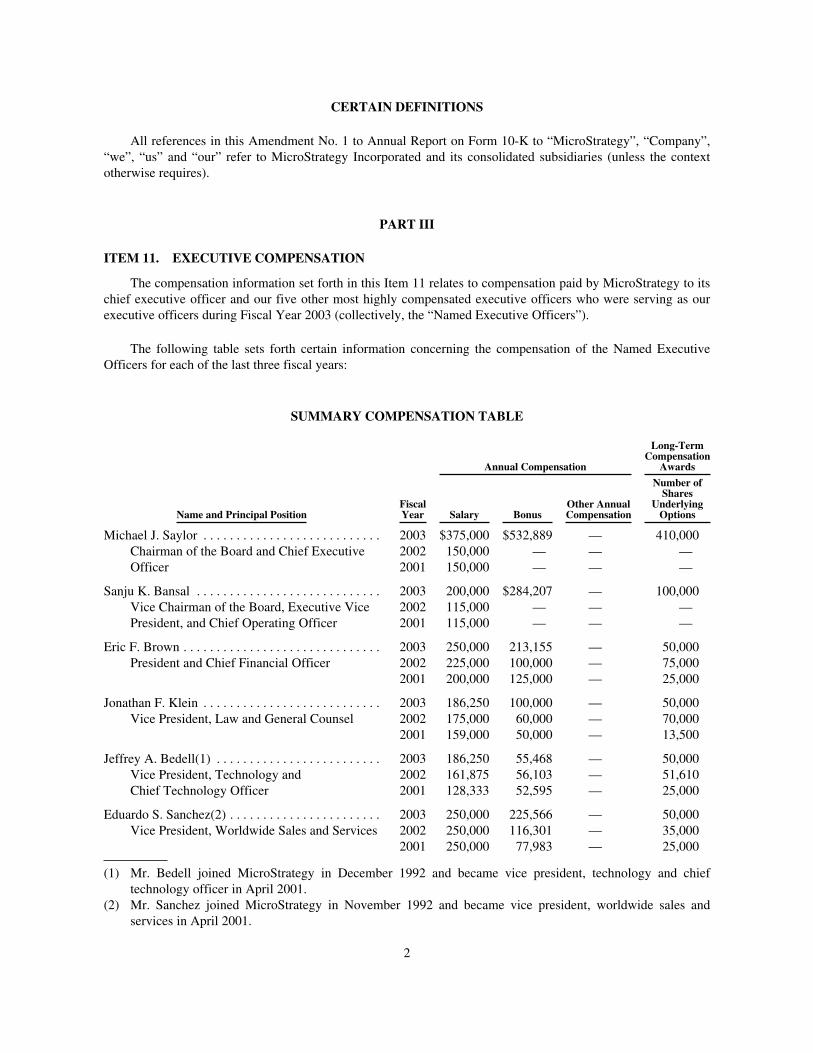
CERTAIN DEFINITIONS
All references in this Amendment No. 1 to Annual Report on Form 10-K to “MicroStrategy”, “Company”,“we”, “us” and “our” refer to MicroStrategy Incorporated and its consolidated subsidiaries (unless the contextotherwise requires).
PART III
ITEM 11. EXECUTIVE COMPENSATION
The compensation information set forth in this Item 11 relates to compensation paid by MicroStrategy to itschief executive officer and our five other most highly compensated executive officers who were serving as ourexecutive officers during Fiscal Year 2003 (collectively, the “Named Executive Officers”).
The following table sets forth certain information concerning the compensation of the Named ExecutiveOfficers for each of the last three fiscal years:
SUMMARY COMPENSATION TABLE
Annual Compensation
Long-TermCompensationAwards
Name and Principal PositionFiscalYear Salary Bonus
Other AnnualCompensation
Number ofSharesUnderlyingOptions
Michael J. Saylor . . . . . . . . . . . . . . . . . . . . . . . . . . .Chairman of the Board and Chief ExecutiveOfficer
200320022001
$375,000150,000150,000
$532,889——
———
410,000——
Sanju K. Bansal . . . . . . . . . . . . . . . . . . . . . . . . . . . .Vice Chairman of the Board, Executive VicePresident, and Chief Operating Officer
200320022001
200,000115,000115,000
$284,207——
———
100,000——
Eric F. Brown . . . . . . . . . . . . . . . . . . . . . . . . . . . . . .President and Chief Financial Officer
200320022001
250,000225,000200,000
213,155100,000125,000
———
50,00075,00025,000
Jonathan F. Klein . . . . . . . . . . . . . . . . . . . . . . . . . . .Vice President, Law and General Counsel
200320022001
186,250175,000159,000
100,00060,00050,000
———
50,00070,00013,500
Jeffrey A. Bedell(1) . . . . . . . . . . . . . . . . . . . . . . . . .Vice President, Technology andChief Technology Officer
200320022001
186,250161,875128,333
55,46856,10352,595
———
50,00051,61025,000
Eduardo S. Sanchez(2) . . . . . . . . . . . . . . . . . . . . . . .Vice President, Worldwide Sales and Services
200320022001
250,000250,000250,000
225,566116,30177,983
———
50,00035,00025,000
(1) Mr. Bedell joined MicroStrategy in December 1992 and became vice president, technology and chieftechnology officer in April 2001.
(2) Mr. Sanchez joined MicroStrategy in November 1992 and became vice president, worldwide sales andservices in April 2001.
2
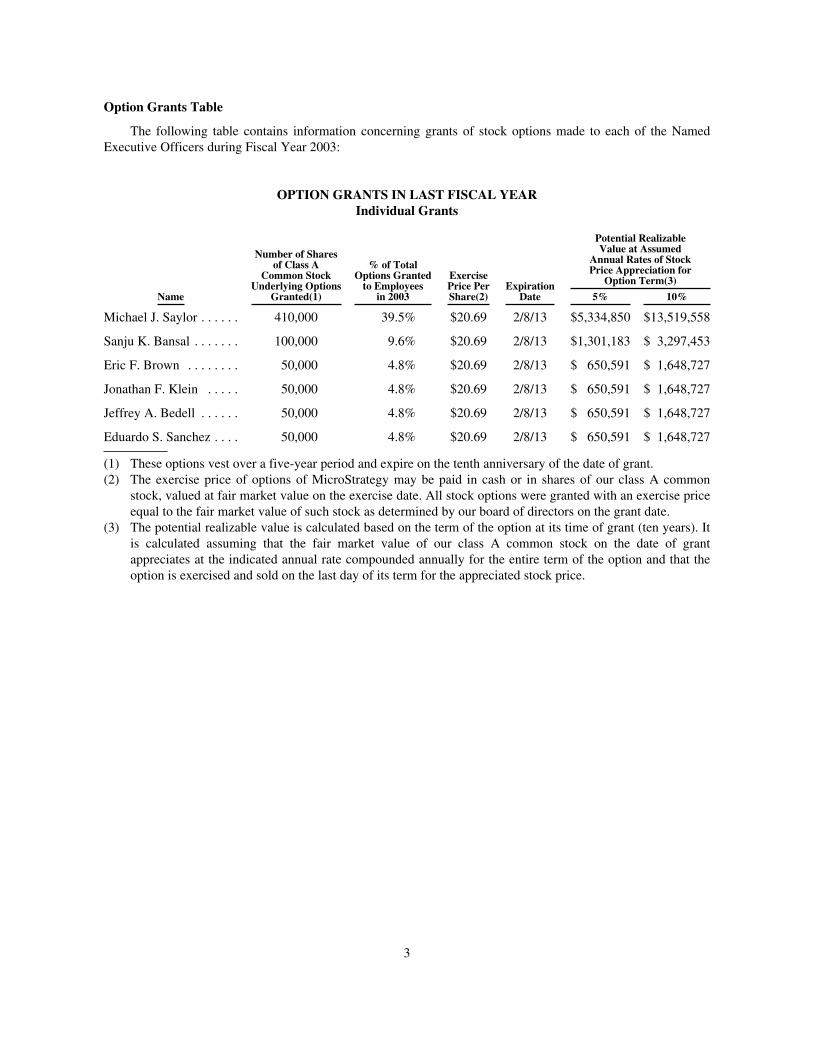
Option Grants Table
The following table contains information concerning grants of stock options made to each of the NamedExecutive Officers during Fiscal Year 2003:
OPTION GRANTS IN LAST FISCAL YEARIndividual Grants
Name
Number of Sharesof Class A
Common StockUnderlying OptionsGranted(1)
% of TotalOptions Grantedto Employeesin 2003
ExercisePrice PerShare(2)
ExpirationDate
Potential RealizableValue at AssumedAnnual Rates of StockPrice Appreciation forOption Term(3)
5% 10%
Michael J. Saylor . . . . . . 410,000 39.5% $20.69 2/8/13 $5,334,850 $13,519,558
Sanju K. Bansal . . . . . . . 100,000 9.6% $20.69 2/8/13 $1,301,183 $ 3,297,453
Eric F. Brown . . . . . . . . 50,000 4.8% $20.69 2/8/13 $ 650,591 $ 1,648,727
Jonathan F. Klein . . . . . 50,000 4.8% $20.69 2/8/13 $ 650,591 $ 1,648,727
Jeffrey A. Bedell . . . . . . 50,000 4.8% $20.69 2/8/13 $ 650,591 $ 1,648,727
Eduardo S. Sanchez . . . . 50,000 4.8% $20.69 2/8/13 $ 650,591 $ 1,648,727
(1) These options vest over a five-year period and expire on the tenth anniversary of the date of grant.(2) The exercise price of options of MicroStrategy may be paid in cash or in shares of our class A common
stock, valued at fair market value on the exercise date. All stock options were granted with an exercise priceequal to the fair market value of such stock as determined by our board of directors on the grant date.
(3) The potential realizable value is calculated based on the term of the option at its time of grant (ten years). Itis calculated assuming that the fair market value of our class A common stock on the date of grantappreciates at the indicated annual rate compounded annually for the entire term of the option and that theoption is exercised and sold on the last day of its term for the appreciated stock price.
3
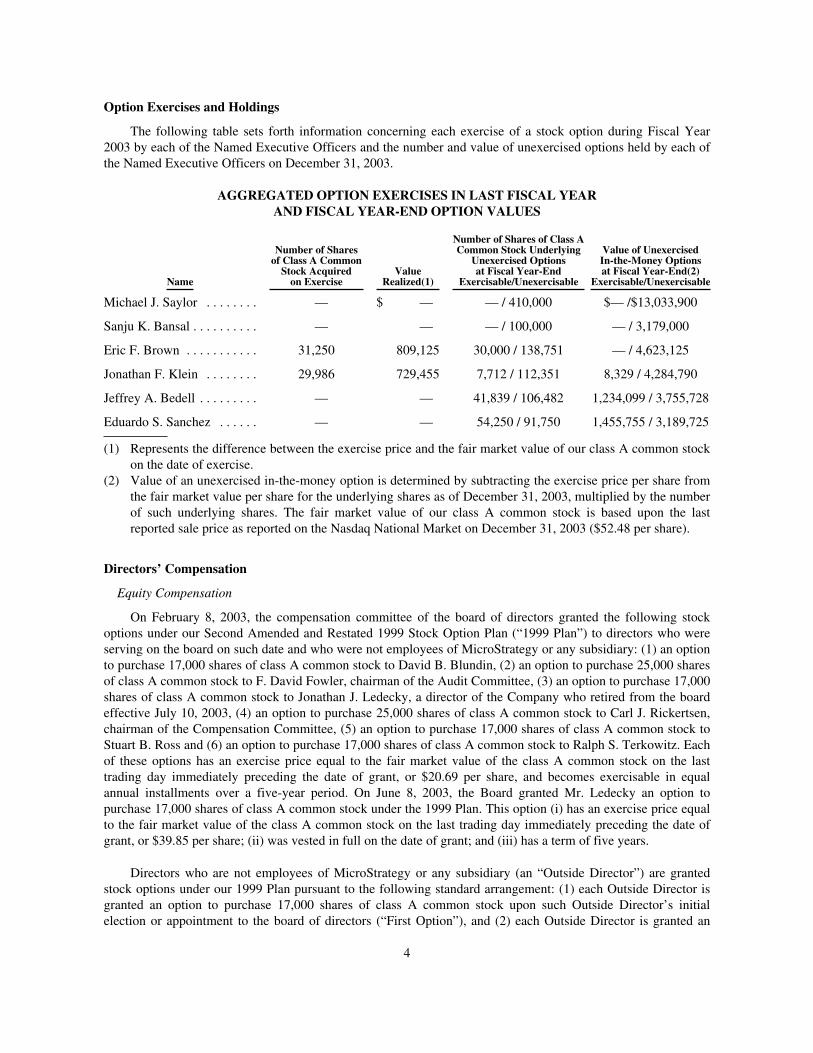
Option Exercises and Holdings
The following table sets forth information concerning each exercise of a stock option during Fiscal Year2003 by each of the Named Executive Officers and the number and value of unexercised options held by each ofthe Named Executive Officers on December 31, 2003.
AGGREGATED OPTION EXERCISES IN LAST FISCAL YEARAND FISCAL YEAR-END OPTION VALUES
Name
Number of Sharesof Class A CommonStock Acquiredon Exercise
ValueRealized(1)
Number of Shares of Class ACommon Stock UnderlyingUnexercised Optionsat Fiscal Year-End
Exercisable/Unexercisable
Value of UnexercisedIn-the-Money Optionsat Fiscal Year-End(2)Exercisable/Unexercisable
Michael J. Saylor . . . . . . . . — $ — — / 410,000 $— /$13,033,900
Sanju K. Bansal . . . . . . . . . . — — — / 100,000 — / 3,179,000
Eric F. Brown . . . . . . . . . . . 31,250 809,125 30,000 / 138,751 — / 4,623,125
Jonathan F. Klein . . . . . . . . 29,986 729,455 7,712 / 112,351 8,329 / 4,284,790
Jeffrey A. Bedell . . . . . . . . . — — 41,839 / 106,482 1,234,099 / 3,755,728
Eduardo S. Sanchez . . . . . . — — 54,250 / 91,750 1,455,755 / 3,189,725
(1) Represents the difference between the exercise price and the fair market value of our class A common stockon the date of exercise.
(2) Value of an unexercised in-the-money option is determined by subtracting the exercise price per share fromthe fair market value per share for the underlying shares as of December 31, 2003, multiplied by the numberof such underlying shares. The fair market value of our class A common stock is based upon the lastreported sale price as reported on the Nasdaq National Market on December 31, 2003 ($52.48 per share).
Directors’ Compensation
Equity Compensation
On February 8, 2003, the compensation committee of the board of directors granted the following stockoptions under our Second Amended and Restated 1999 Stock Option Plan (“1999 Plan”) to directors who wereserving on the board on such date and who were not employees of MicroStrategy or any subsidiary: (1) an optionto purchase 17,000 shares of class A common stock to David B. Blundin, (2) an option to purchase 25,000 sharesof class A common stock to F. David Fowler, chairman of the Audit Committee, (3) an option to purchase 17,000shares of class A common stock to Jonathan J. Ledecky, a director of the Company who retired from the boardeffective July 10, 2003, (4) an option to purchase 25,000 shares of class A common stock to Carl J. Rickertsen,chairman of the Compensation Committee, (5) an option to purchase 17,000 shares of class A common stock toStuart B. Ross and (6) an option to purchase 17,000 shares of class A common stock to Ralph S. Terkowitz. Eachof these options has an exercise price equal to the fair market value of the class A common stock on the lasttrading day immediately preceding the date of grant, or $20.69 per share, and becomes exercisable in equalannual installments over a five-year period. On June 8, 2003, the Board granted Mr. Ledecky an option topurchase 17,000 shares of class A common stock under the 1999 Plan. This option (i) has an exercise price equalto the fair market value of the class A common stock on the last trading day immediately preceding the date ofgrant, or $39.85 per share; (ii) was vested in full on the date of grant; and (iii) has a term of five years.
Directors who are not employees of MicroStrategy or any subsidiary (an “Outside Director”) are grantedstock options under our 1999 Plan pursuant to the following standard arrangement: (1) each Outside Director isgranted an option to purchase 17,000 shares of class A common stock upon such Outside Director’s initialelection or appointment to the board of directors (“First Option”), and (2) each Outside Director is granted an
4
option to purchase an additional 8,000 shares of class A common stock upon the initial election or appointmentof such Outside Director as the chairperson of the Compensation Committee or Audit Committee of the board ofdirectors (the “Chairperson Option”), provided that the aggregate number of shares of class A common stocksubject to the First Option and any Chairperson Option granted to any individual Outside Director may notexceed 25,000 shares. First Options and Chairperson Options become exercisable in equal annual installmentsover a five-year period.
Each option granted to an Outside Director under the 1999 Plan has an exercise price equal to the lastreported sale price of the class A common stock as reported on the Nasdaq National Market for the most recenttrading day prior to the date of grant. In the event of a merger of MicroStrategy with or into another corporationor another qualifying acquisition event, each option will be assumed or an equivalent option will be substitutedby the successor corporation. If the successor corporation does not assume outstanding options or such optionsare not otherwise exchanged, all outstanding options automatically will become immediately exercisable.
Cash Compensation
Each Outside Director receives an annual retainer of $15,000 (in four quarterly installments payable on thefirst day of each calendar quarter in arrears) for serving on our board of directors, and a fee of $3,750 for eachquarterly meeting of the board of directors that such Outside Director attends in person. Each Outside Directorwho is a member of the Audit Committee (except the chairperson) also receives $1,000 for each meeting of theAudit Committee that such member attends in person. The chairperson of each of the Audit Committee and theCompensation Committee also receives an annual retainer of $7,500 (in four equal quarterly installments payableon the first day of each calendar quarter in arrears), and a fee of $1,875 for each meeting of their respectivecommittees that such chairperson attends in person. The annual retainer fees described above are prorated for thenumber of days that the individual served as an Outside Director or as a committee chairperson, as the case maybe, during the immediately preceding calendar quarter. Each Outside Director is reimbursed for all reasonableout-of-pocket expenses incurred by him or her in attending meetings of the board of directors and any committeethereof and otherwise in performing his or her duties as an Outside Director, subject to compliance with ourstandard documentation policies regarding reimbursement of business expenses.
Employment Agreements
Our employees, including our executive officers, are generally required to enter into confidentialityagreements prohibiting the employees from disclosing any of our confidential or proprietary information. Inaddition, the agreements generally provide that upon termination, an employee will not provide competitiveproducts or services and will not solicit our customers and employees for a period of one year. At the time ofcommencement of employment, our employees also generally sign offer letters specifying certain basic termsand conditions of employment. Otherwise, our employees are generally not subject to written employmentagreements.
In July 2002, each of Messrs. Bedell, Brown, Klein and Sanchez were granted options to purchase 50,000,75,000, 70,000 and 35,000 shares of class A common stock, respectively, under our 1999 Plan. The optionagreements for each of these grants provide for the acceleration of vesting in the event of a change in control ofthe Company such that, as of the effective date of the change in control, at least fifty percent of the original grantis fully vested and the remaining unvested portion will vest as to fifty percent of the remaining unvested shareson the last day of the third month after the effective date of the change in control and the remaining unvestedshares will vest on the last day of the sixth month after the effective date of the change in control. In addition,these option agreements provide that if, following the change in control, such officer’s employment is terminatedby MicroStrategy other than for cause or by such officer for good reason, the option will vest in full on theeffective date of such termination.
5

PART IV
ITEM 15. EXHIBITS, FINANCIAL STATEMENT SCHEDULES, AND REPORTS ON FORM 8-K
(c) Exhibits
We hereby file as part of this Amendment No. 1 to Form 10-K the exhibits listed in the Index toExhibits.
6
SIGNATURES
Pursuant to the requirements of Section 13 or 15(d) of the Securities Exchange Act of 1934, the registranthas duly caused this report to be signed on its behalf by the undersigned, thereunto duly authorized.
MICROSTRATEGY INCORPORATED(Registrant)
By: /S/ ERIC F. BROWN
Name: Eric F. BrownTitle: President and Chief Financial Officer
Date: March 26, 2004
7

INDEX TO EXHIBITS
ExhibitNumber Description
10.24* Stock Option Agreement, dated June 9, 2003, between Jonathan J. Ledecky and the registrant,providing for the grant of a nonstatutory stock option.
31.1 Certification pursuant to Rule 13a-14(a) or Rule 15d-14(a) of the Chairman of the Board of Directorsand Chief Executive Officer.
31.2 Certification pursuant to Rule 13a-14(a) or Rule 15d-14(a) of the President and Chief Financial Officer.
* Management contracts and compensatory plans or arrangements.
8