Embed Size (px)
Citation preview

MICROSTRATEGY SALES REPORTING
SUPPL IER PORTAL
D E C E M B E R 8 , 2 0 2 0
0.01
W a y n e B l a c k &
S n e h a R a k h e j a

Agenda
1. Introductions
2. Overview of Weekly Supplier Sales Reporting
3. Setup and User access
4. Demonstration of contents and navigation
5. Troubleshooting / Support

New MicroStrategy
RDW
Google BigQuery

Weekly Sales Reporting
Recognised challenges with existing reporting
• Manual process
• Time to receive
• Multiple reports to capture different cuts of data
• No consistency in provision of analytics / highlights
In response commenced development of new reporting tool
• Automated weekly (Sunday afternoon), best of breed tool
• Self Service (secure authentication)
• Provision to include additional data fields
• Dashboards, graphs and item tracker
Google BigQuery

Supplier Requests Registration
One-off activitySecure access to Myer network

Place Request - Supplier Requests Registration

If anyone tries to login without approval

Approval and Authentication – B2B Administrator approves or rejects
Validates against Microsoft account
Supplier Receives Welcome Email with
Link

Pre-Existing Microsoft User
If your company uses Microsoft for managing user accounts, you will be redirected to anAuthentication Page where you enter your password associated with your company email

Not Yet a Microsoft User
The error below often indicates that your company may not use Microsoft for managing user accounts. To proceed further, you will need to create a Microsoft account, which will then be associated toyour email address. Click on the “Create One” link, then follow the instructions.
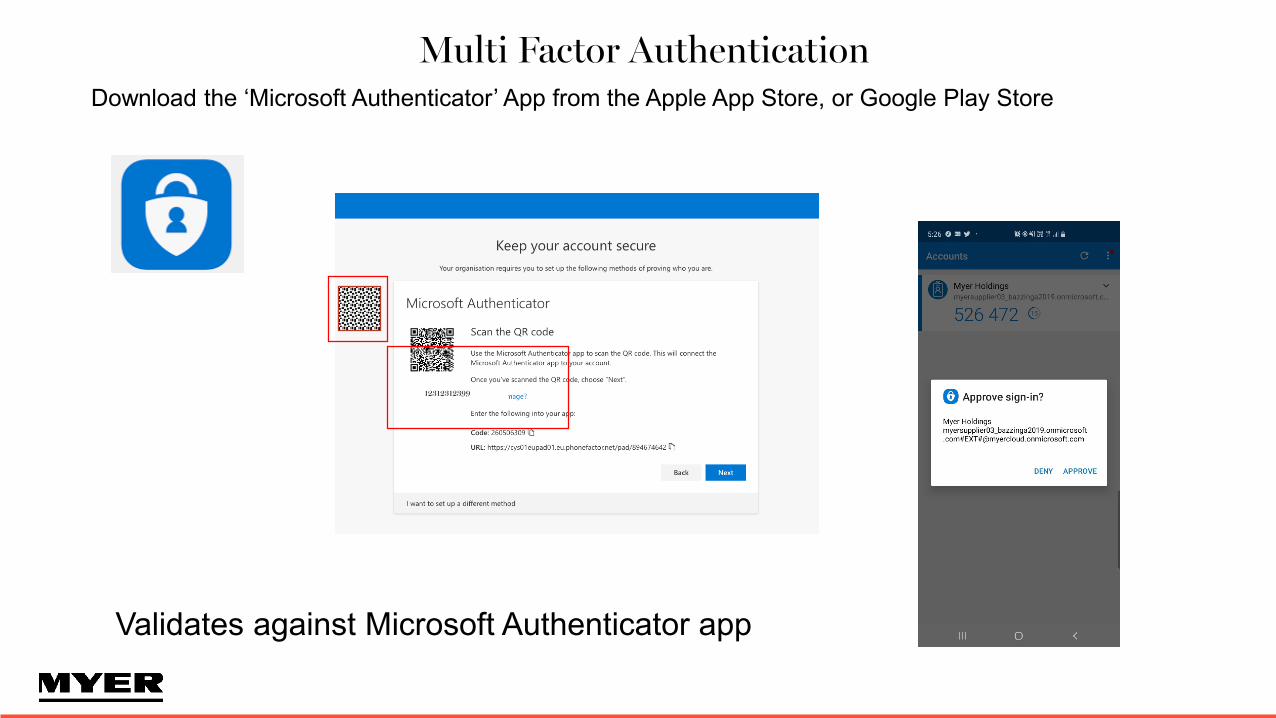
Multi Factor Authentication
Validates against Microsoft Authenticator app
12312312399
Download the ‘Microsoft Authenticator’ App from the Apple App Store, or Google Play Store

12
Business Intelligence team completes setup
USER
SECURITY FILTERUser GroupLimits access to certain TPC’s, Suppliers or Stores only.Each User will belong to one and only one of these Groups per MSTR Project.
PROJECT ACCESSUser GroupAllows access to one or multiple Microstrategy Projects, eg RDW, CIW.Each user will belong to one or multiple of these Groups.
PRIVILEGESUser GroupAllows User to utilise different aspects of the Microstrategy program, eg Create Report, Export to Excel.Each User will belong to one or multiple of these Groups.
MYER TEAMSUser GroupAllows access to folders and reports, eg Item Snapshot report, Space Planning Reports.Each user will belong to one or multiple of these Groups.
• LDAP Users
• Privilege Supplier Consumer User
• Project Access WEB MYER SUPPLIER REPORTING
• Suppler Team Wholesale• Supplier Team Wholesale with GP• Supplier Team Concessions
End to end process 3-5 days

Demonstration

Access to MicroStrategy
On your browser, type into the URL bar: myapps.microsoft.com
If prompted, make sure to select your
company email address

Once signed into myapps. This is the
landing screen for you to access
microstrategy. Click on the tile
If you do not see the Myer logo you may be on your company’s My Apps page. Click your name to toggle between organisations.

16
1
You are now inside Microstrategy.
Click to go down to the next lower level
2
Click on Shared Reports3
Click on the next folder
4
This BLUE icon is the dashboard.
Click on it

17
The “Prompts” allow you to select which
data to include in the dashboard
How to Run Your Dashboard
18
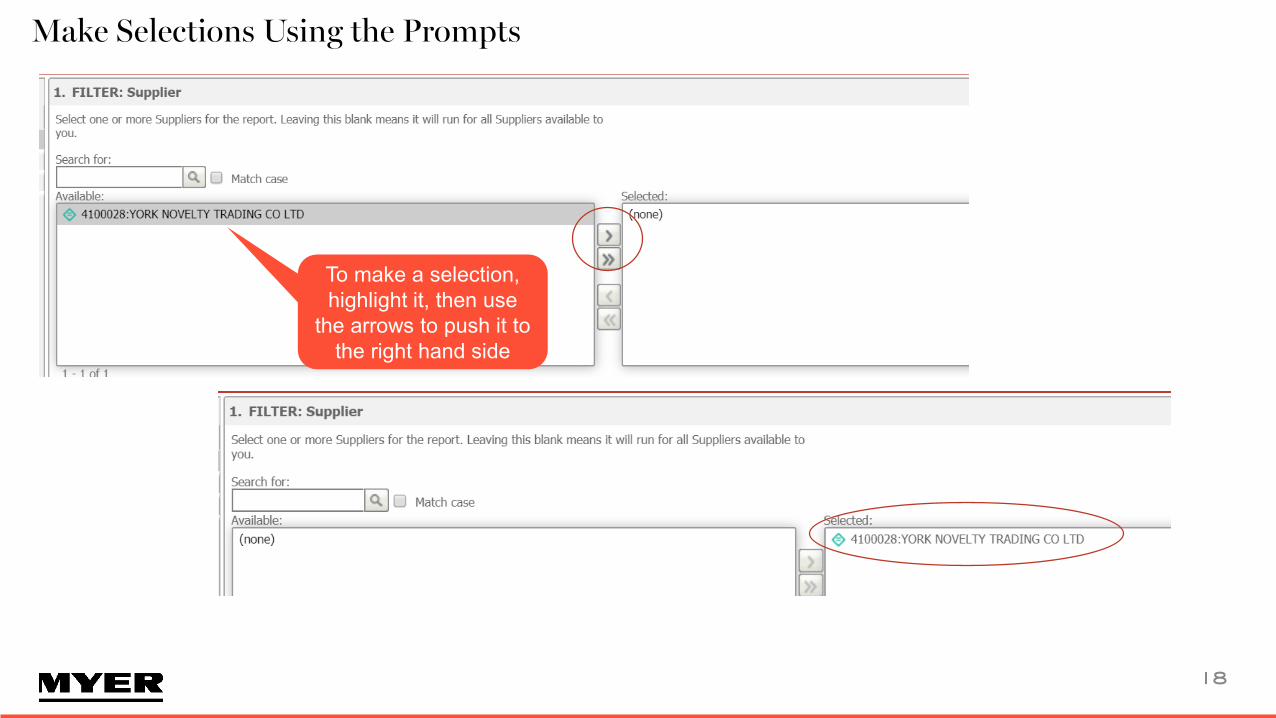
Make Selections Using the Prompts
To make a selection, highlight it, then use
the arrows to push it to the right hand side

19
Prompt 2 TPC (optional) – if required, limit the dashboard to
selected TPC’s
Available Prompts
Prompt 3 Category (optional) – if required, limit the dashboard to
selected Categories
Click “RUN DOSSIER” to launch
the dashboard
Prompt 1.Supplier –Select one or more Myer Supplier ID’s
Prompt 4 Brand (optional) – if required, limit the dashboard to
selected Brands

Explaining the Dashboard
The first page of the dashboard is broken into 3 sections. 1.Contents Panel
2. Main body of the dashboard3. Filter Panel
1 2 3

When there is a long list of information a scroll bar will appear
Clicking the “Contents” or “Filter” buttons allows you to hide or show
these panels

FILTERSThe Dashboard has the ability to
filter on many different things on the right hand PanelOn this dashboard the filter has been placed on
“Region - VIC”. The current page, plus ALL other pages now show data for Victoria ONLY

Pop Out Boxes
If you click the double arrows in the top right corner of any box it allows that particular box to
show full screen
Clicking the double arrows again will return it to normal size

Hover Over
Hovering over any graph will give you quick pop up about what each section represents. Some
hover-boxes also contain additional metrics

Multi select
Clicking the pie charts on Page 1 changes ALL Page 1 data to be
for that wedge only
Using the CTRL key allows you to select multiple wedges.
Clicking the white space next to the Pie removes this filtering

Adding and exportingTo add more
information or export, select
the 3 dots circled, a pop up will appear.
To add extra data please see below steps.
1. Click + 2. Choose additional attributes or
metrics as required

Adding and exporting cont…
The additional attributes or metrics will appear in
this pop out window
An export of the data can be then created for Excel,
PDF or CSV(data)

Sales and Stock Position
Sales $ LW vs Sales $ LY Stock position based on the last 4 weeks average sales
The second page of the dashboard is split into 2 sections. Sales $ and Weeks Cover of Stock On Hand
The data on the left represents the Sales $. The bars are Sales $ for Last Week, the lines
are Sales $ for the same week Last Year
This section has
been filtered on
NSW REGION

Top 10
Page 3 – Top 10 Items at Style Colour (for Apparel suppliers)
Page 4 – Top 10 Items at SKU (for non-Apparel suppliers)
What is Style colour?
Item level information
whereby all sizes of the same
coloured item have been
grouped together
What is SKU?individual item
level information

Item Tracker
Item Tracker: Summary of information about the products
ranged and how they performed last week. Ranked by highest Sales Units sold
Note:Filters can be used at any time on any of the contents pages
Page 5 – Item Tracker at Style Colour (for Apparel suppliers)
Page 6 – Item Tracker at SKU (for non-Apparel suppliers)

Item Tracker - Sorting
If you click on any of the headings you
can sort the data just like Excel
The Item Tracker works very similar to Excel, there
are many functions that you can do in the dashboard
such as Sort, Totals, Hide

Item Tracker cont…
To get totals, right click on the Metric headings eg:
Sales Un, and right click to select Show Totals
The top line then changes the data to be the summary of totals for each Metric provided in the dashboard

Item Tracking cont…
To clear any filtering you have done, hover in the left
corner and click the icon that appears
Clear All, or clear individual filters
Right clicking on values allows you to KEEP ONLY
rows that have this value, or EXCLUDE all rows with this
value

Map
An exciting feature we built is a Map showing the weeks cover of your
product at each store
What do the bubbles mean?
The size indicates the Weeks Cover.
The larger the bubble, the higher the Weeks Cover
The position indicates the geographic location

Understanding the Map
Filters can be used at any time to narrow
the information
If you hover over any bubble a pop up
appears with extra information about that
particular store

When filtering a Region or Location
the map automatically
zooms in or out
Understanding the Map
If you zoom in you see where the stores are
located and their distance to one another.
To manually zoom you can use the + or – on the map, or use the scroll on your mouse

Understanding the Map
There are 10 map styles to choose from
The map style chosen here is satellite view. The more you zoom
in the more detail you can see

Understanding the MapWhere are our Online store and DC’s located?
The DCs are pictured out in the ocean
The Online store is pictured in central Australia

NEXT STEPS
• Quick Reference Guide - feedback appreciated
• Stop sending weekly reports
• Report feedback welcome – however enhancements not immediate
SUPPORT
Login / Access Issues [email protected]
Refresher /user training [email protected]
Dashboard/data queries Merchandise team

Myer-TCS Confidential
TROUBLESHOOTING

Trouble Shooting: Log-in with correct account
Ensure you are using your company account
If there is more than one account select your company account

If you do not see the Myer logo you may be on your company’s My Apps page.
To navigate to the Myer My Apps page, click on the log in at the top right and toggle between
organisations.
Trouble Shooting: Can’t see “Microstrategy” tile
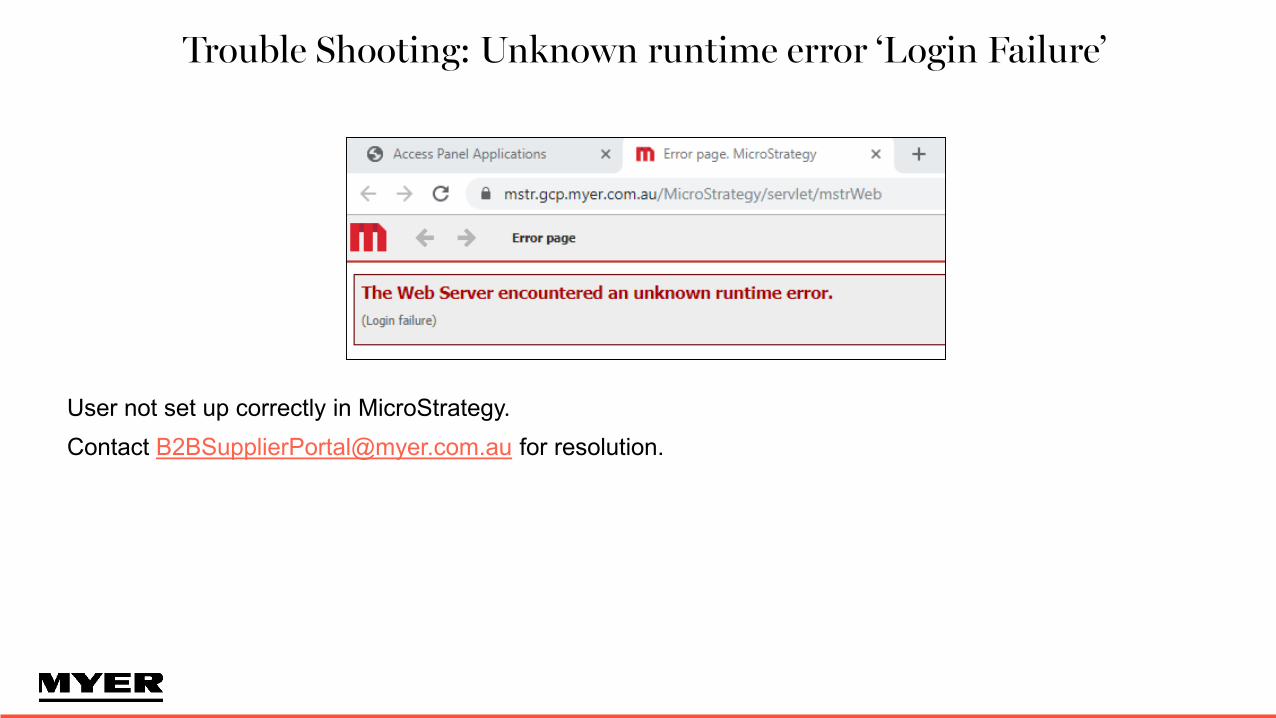
Trouble Shooting: Unknown runtime error ‘Login Failure’
User not set up correctly in MicroStrategy. Contact [email protected] for resolution.

Trouble Shooting: “The following privilege is required…”
User is set up to access Microstrategy, however additional changes are required. Contact [email protected] for resolution.

Trouble Shooting: “Error in login Please contact your Administrator”
An error has occurred with the browser window, clear your browser cache to resolve this:

Trouble Shooting: “Your user session has been lost…”
Your session has timed outDO NOT try entering your email and password. Instead 1. Click on the refresh button (in Chrome
this is the circular arrow in the top left corner, next to the Home icon)
2. As pop up will appear titled ‘Confirm Form Resubmission’
3. Click ‘Continue’ 4. If this doesn’t work then close the
browser completely (not just the one tab, but the entire browser), then start logging in again

Trouble Shooting: “Error in Process method of Component”For Suppliers with thousands of SKU’s, this error means too much data has been asked for. Return to the Prompts and select less data (eg select 1 or 2 TPC’s only)

Trouble Shooting: “…does not have Use access to the Report”
User not set up properly in Microstrategy, contact [email protected] for resolution

THANK YOU