Embed Size (px)
Citation preview
Report EUR 26445 EN
20 13
Sergio González Ana Ruiz Karl-Fredrik Nilsson
Microstructural analysis of thermal fatigue damage in 316L pipes
European Commission
Joint Research Centre
Institute for Energy and Transport
Contact information
Karl-Fredrik Nilsson
Address: Joint Research Centre, P.O. Box 2, NL-1755 ZG Petten, The Netherlands
E-mail: [email protected]
Tel.: +31 224 56 5420
http://iet.jrc.ec.europa.eu/
http://www.jrc.ec.europa.eu/
Legal Notice
Neither the European Commission nor any person acting on behalf of the Commission
is responsible for the use which might be made of this publication.
Europe Direct is a service to help you find answers to your questions about the European Union
Freephone number (*): 00 800 6 7 8 9 10 11
(*) Certain mobile telephone operators do not allow access to 00 800 numbers or these calls may be billed.
A great deal of additional information on the European Union is available on the Internet.
It can be accessed through the Europa server http://europa.eu/.
JRC87415
EUR 26445 EN
ISBN 978-92-79-35100-6 (pdf)
ISSN 1831-9424 (online)
doi:10.2790/12330
Luxembourg: Publications Office of the European Union, 2013
© European Union, 2013
Reproduction is authorised provided the source is acknowledged.
1
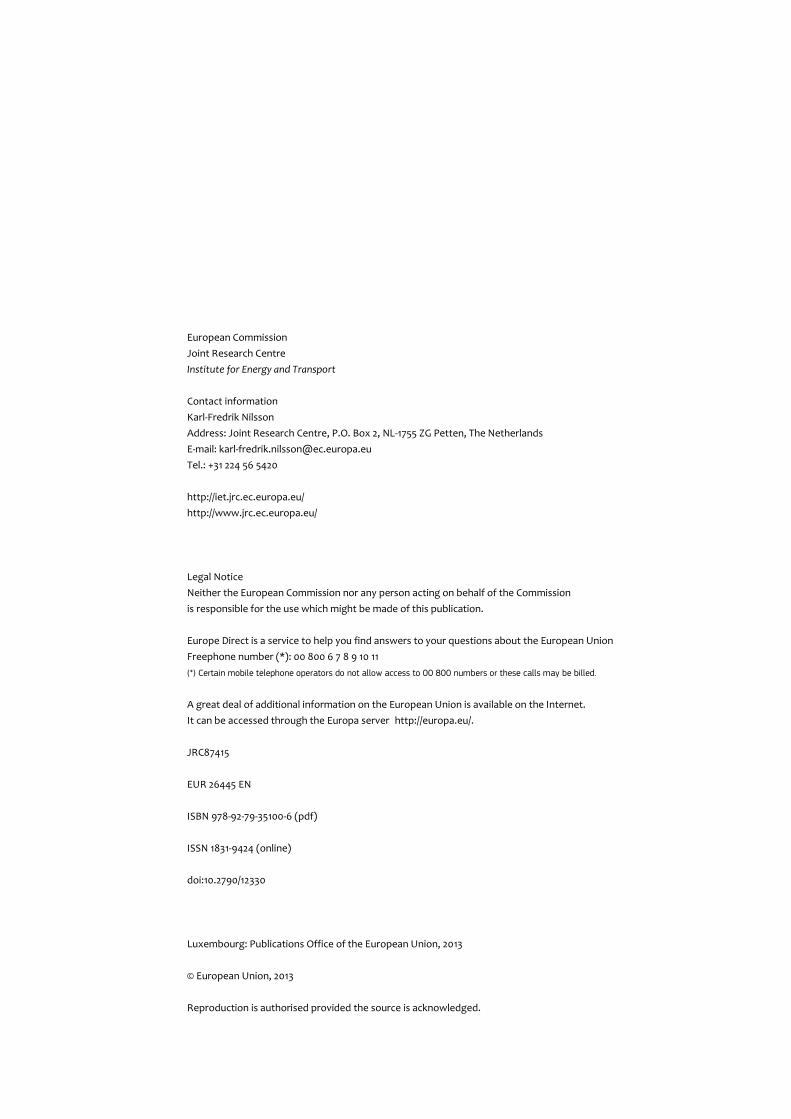
Microstructural analysis of thermal fatigue damage in 316L pipes Sergio González, Ana Ruiz, Karl-Fredrik Nilsson
Summary
This report summarizes the data and main conclusions derived from microstructural characterisation of 316L pipes subjected to thermal fatigue with a peak temperature of 550°C. TOFD measurements are compared with measured crack depths from cut segments, and fracture mode and corrosion have been assessed by SEM and EDX, respectively.
1. Introduction
Thermal fatigue is one of the major degradation mechanisms for components in nuclear reactors. JRC has therefore developed a research programme where thick-walled pipes are heated by induction heating from the outside and repetitively cooled from the inside using room-temperature water; and where the damage evolution is assessed by in-house models [1]. One of the special and complicating issues with thermal fatigue is the intricate damage. The damage starts with a network of surface cracks, from which a large number of deeper axial and circumferential cracks will develop. The large number of propagating cracks interact in a complex way so that individual cracks may temporarily arrest whereas others may accelerate. Non-destructive monitoring of the damage using Time-of-Flight-Diffraction (TOFD) was a key element in the JRC research programme. The measurement of crack depths using TOFD becomes very demanding for the complex crack configurations in thermal fatigue and the reliability can also be questioned. In this report we summarize some destructive microstructural analyses on two pipe components that were tested until a through-wall crack had developed. The analysis had two specific objectives: i) to compare measured crack depths with TOFD measurements to assess the reliabil or intergranular and whether crack propagation was also driven by corrosion. ity of the TOFD ii) to determine the fracture mode, in particular whether crack propagation was transgranular
2. Comparison of TOFD measurement of crack propagation with visual
measurements using a calliper.
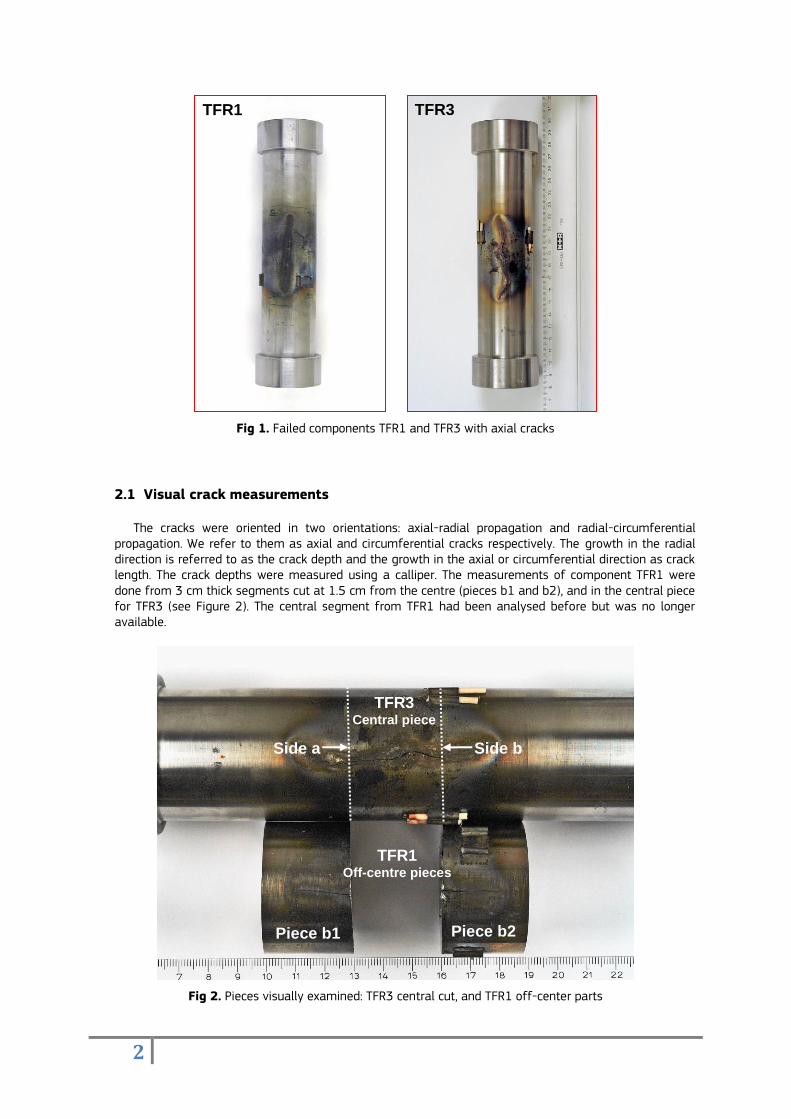
Two components subjected to the same nominal thermal fatigue loading, namely TFR1 and TFR3, have been used for visual examination and comparison with TOFD data. The test parameters are listed in Table 1. Both components failed by axial through-wall cracking (Figure 1) at different lifetimes (46000 cycles for TFR1 and 90000 for TFR3).
Test tQuench /tHeat
[s]
Tmax
[ºC]
Twater
[ºC]
Tin
[ºC]
Axial
force
[kN]
Crack
initiation
(Ni) 1000
Number
of cycles
1000
Max crack depth
[mm] / Failure
TFR1 5/45 550 25 ~300 - ≤10 46 Axial crack failure
Circ: 5.8
TFR3 5/45 550 25 ~300 - ≤10 90 Axial crack failure
Circ: 7.4
Table 1. Thermal fatigue test summary
2
Fig 1. Failed components TFR1 and TFR3 with axial cracks
2.1 Visual crack measurements
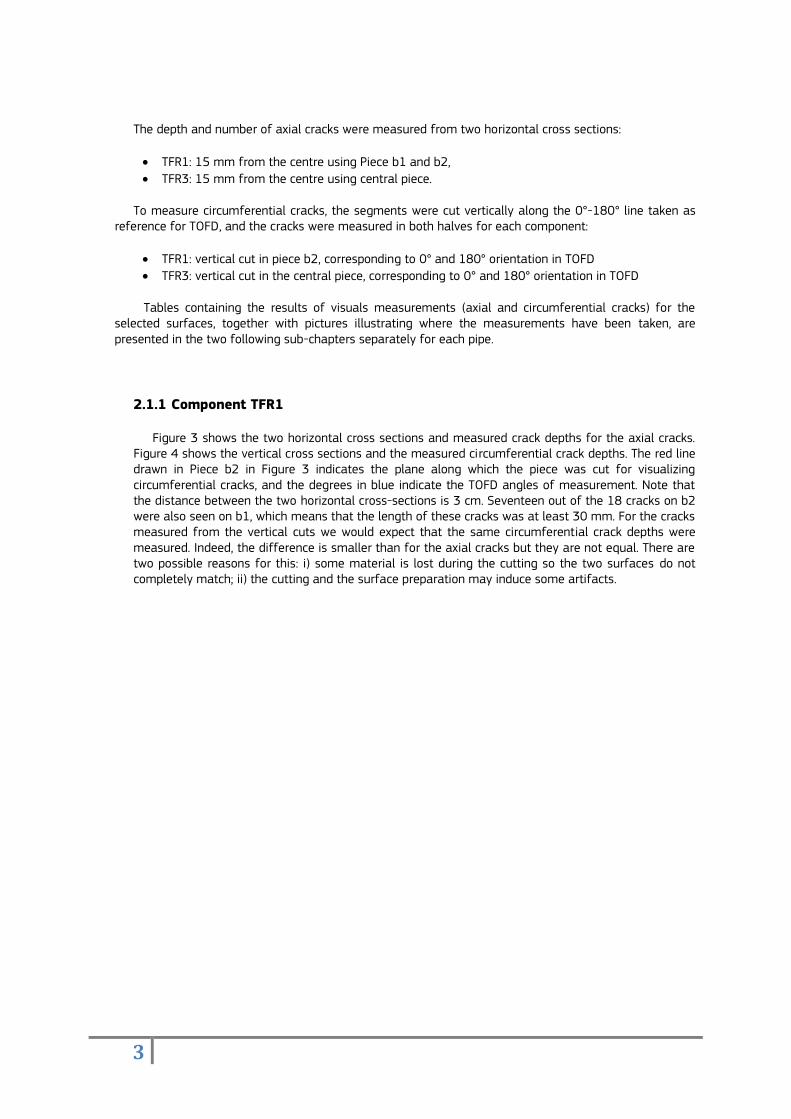
The cracks were oriented in two orientations: axial-radial propagation and radial-circumferential propagation. We refer to them as axial and circumferential cracks respectively. The growth in the radial direction is referred to as the crack depth and the growth in the axial or circumferential direction as crack length. The crack depths were measured using a calliper. The measurements of component TFR1 were done from 3 cm thick segments cut at 1.5 cm from the centre (pieces b1 and b2), and in the central piece for TFR3 (see Figure 2). The central segment from TFR1 had been analysed before but was no longer available.
Fig 2. Pieces visually examined: TFR3 central cut, and TFR1 off-center parts
TFR3
TFR3 Central piece
TFR1 Off-centre pieces
Piece b2 Piece b1
Side a Side b
TFR1
3
The depth and number of axial cracks were measured from two horizontal cross sections:
TFR1: 15 mm from the centre using Piece b1 and b2,
TFR3: 15 mm from the centre using central piece.
To measure circumferential cracks, the segments were cut vertically along the 0°-180° line taken as reference for TOFD, and the cracks were measured in both halves for each component:
TFR1: vertical cut in piece b2, corresponding to 0° and 180° orientation in TOFD
TFR3: vertical cut in the central piece, corresponding to 0° and 180° orientation in TOFD
Tables containing the results of visuals measurements (axial and circumferential cracks) for the selected surfaces, together with pictures illustrating where the measurements have been taken, are presented in the two following sub-chapters separately for each pipe.
2.1.1 Component TFR1
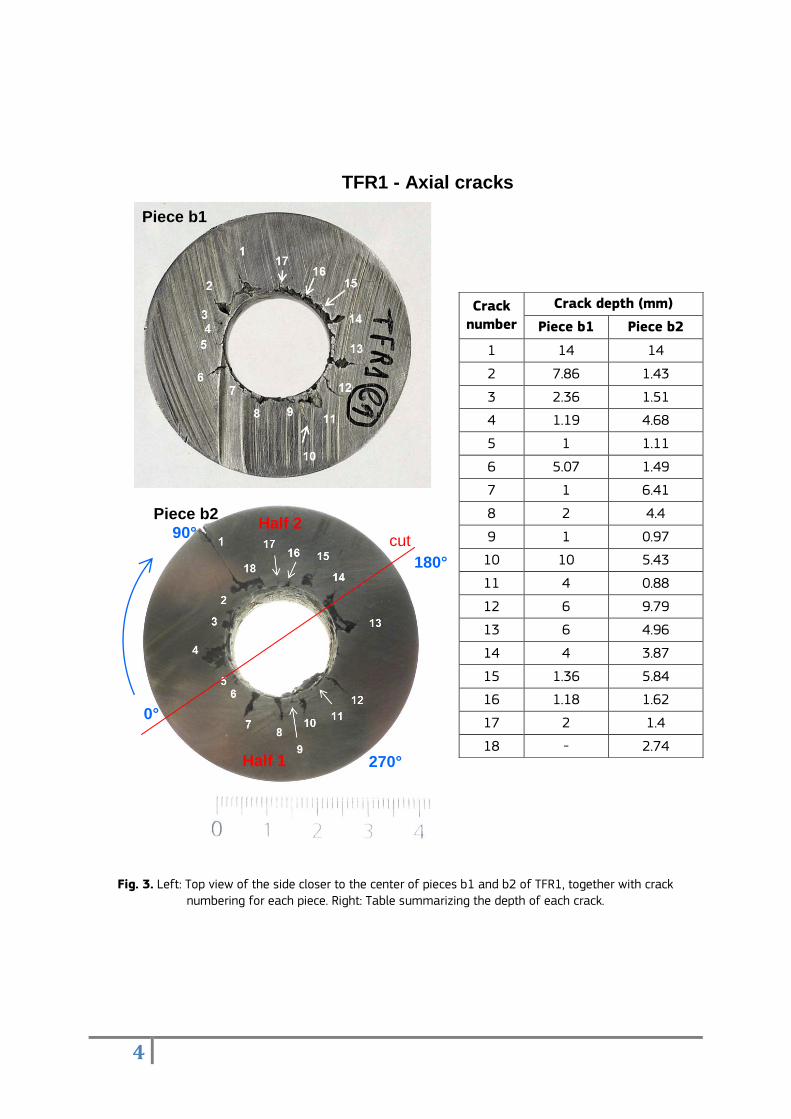
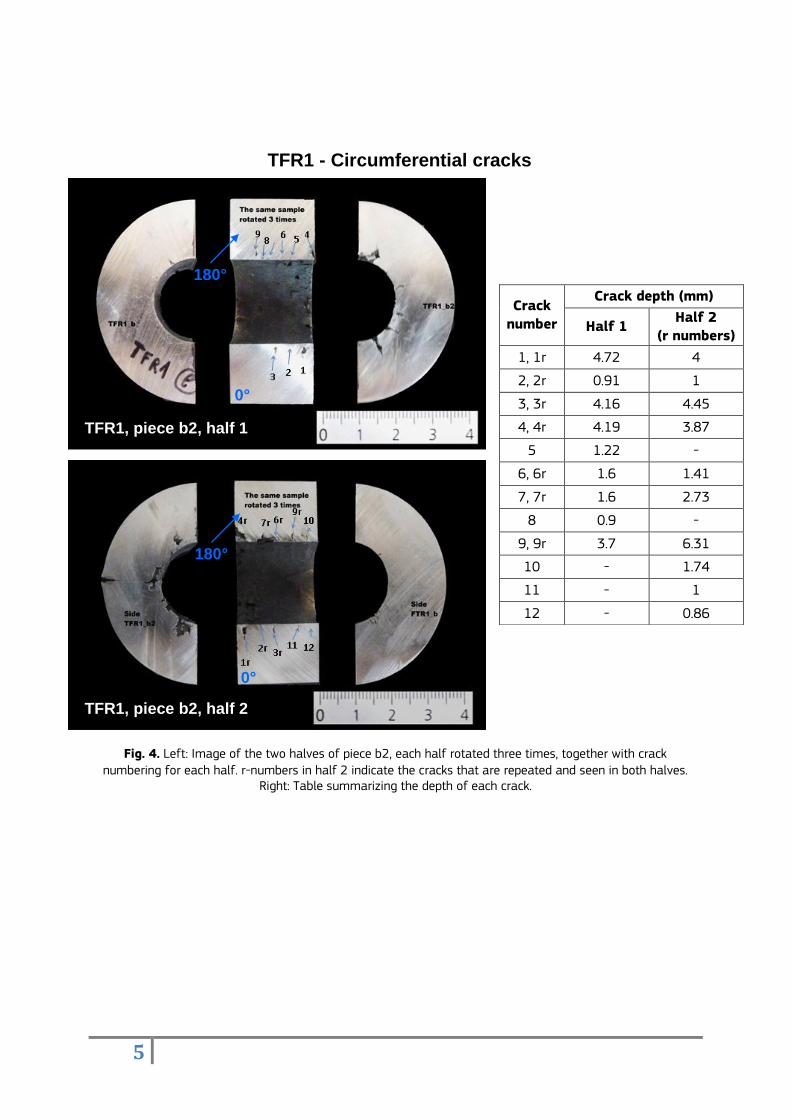
Figure 3 shows the two horizontal cross sections and measured crack depths for the axial cracks. Figure 4 shows the vertical cross sections and the measured circumferential crack depths. The red line drawn in Piece b2 in Figure 3 indicates the plane along which the piece was cut for visualizing circumferential cracks, and the degrees in blue indicate the TOFD angles of measurement. Note that the distance between the two horizontal cross-sections is 3 cm. Seventeen out of the 18 cracks on b2 were also seen on b1, which means that the length of these cracks was at least 30 mm. For the cracks measured from the vertical cuts we would expect that the same circumferential crack depths were measured. Indeed, the difference is smaller than for the axial cracks but they are not equal. There are two possible reasons for this: i) some material is lost during the cutting so the two surfaces do not completely match; ii) the cutting and the surface preparation may induce some artifacts.
4
Fig. 3. Left: Top view of the side closer to the center of pieces b1 and b2 of TFR1, together with crack numbering for each piece. Right: Table summarizing the depth of each crack.
Crack
number
Crack depth (mm)
Piece b1 Piece b2
1 14 14
2 7.86 1.43
3 2.36 1.51
4 1.19 4.68
5 1 1.11
6 5.07 1.49
7 1 6.41
8 2 4.4
9 1 0.97
10 10 5.43
11 4 0.88
12 6 9.79
13 6 4.96
14 4 3.87
15 1.36 5.84
16 1.18 1.62
17 2 1.4
18 - 2.74
Piece b1
Piece b2
Half 1
Half 2 cut
180°
90°
0°
270°
TFR1 - Axial cracks
5
Fig. 4. Left: Image of the two halves of piece b2, each half rotated three times, together with crack
numbering for each half. r-numbers in half 2 indicate the cracks that are repeated and seen in both halves. Right: Table summarizing the depth of each crack.
Crack
number
Crack depth (mm)
Half 1 Half 2
(r numbers)
1, 1r 4.72 4
2, 2r 0.91 1
3, 3r 4.16 4.45
4, 4r 4.19 3.87
5 1.22 -
6, 6r 1.6 1.41
7, 7r 1.6 2.73
8 0.9 -
9, 9r 3.7 6.31
10 - 1.74
11 - 1
12 - 0.86
TFR1, piece b2, half 1
0°
180°
TFR1, piece b2, half 2
0°
180°
TFR1 - Circumferential cracks
6
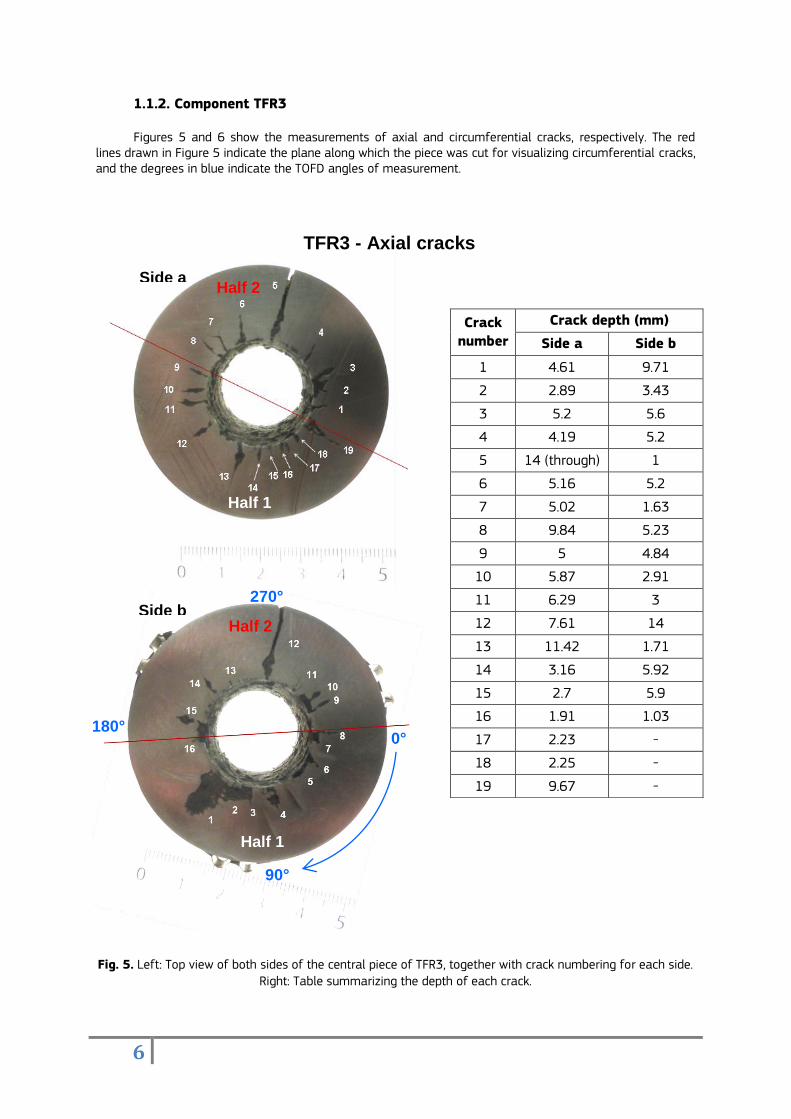
1.1.2. Component TFR3
Figures 5 and 6 show the measurements of axial and circumferential cracks, respectively. The red lines drawn in Figure 5 indicate the plane along which the piece was cut for visualizing circumferential cracks, and the degrees in blue indicate the TOFD angles of measurement.
Fig. 5. Left: Top view of both sides of the central piece of TFR3, together with crack numbering for each side.
Right: Table summarizing the depth of each crack.
Crack
number
Crack depth (mm)
Side a Side b
1 4.61 9.71
2 2.89 3.43
3 5.2 5.6
4 4.19 5.2
5 14 (through) 1
6 5.16 5.2
7 5.02 1.63
8 9.84 5.23
9 5 4.84
10 5.87 2.91
11 6.29 3
12 7.61 14
13 11.42 1.71
14 3.16 5.92
15 2.7 5.9
16 1.91 1.03
17 2.23 -
18 2.25 -
19 9.67 -
Side a
Half 1
Half 2
Side b
Half 1
Half 2
180°
90°
0°
270°
TFR3 - Axial cracks
7
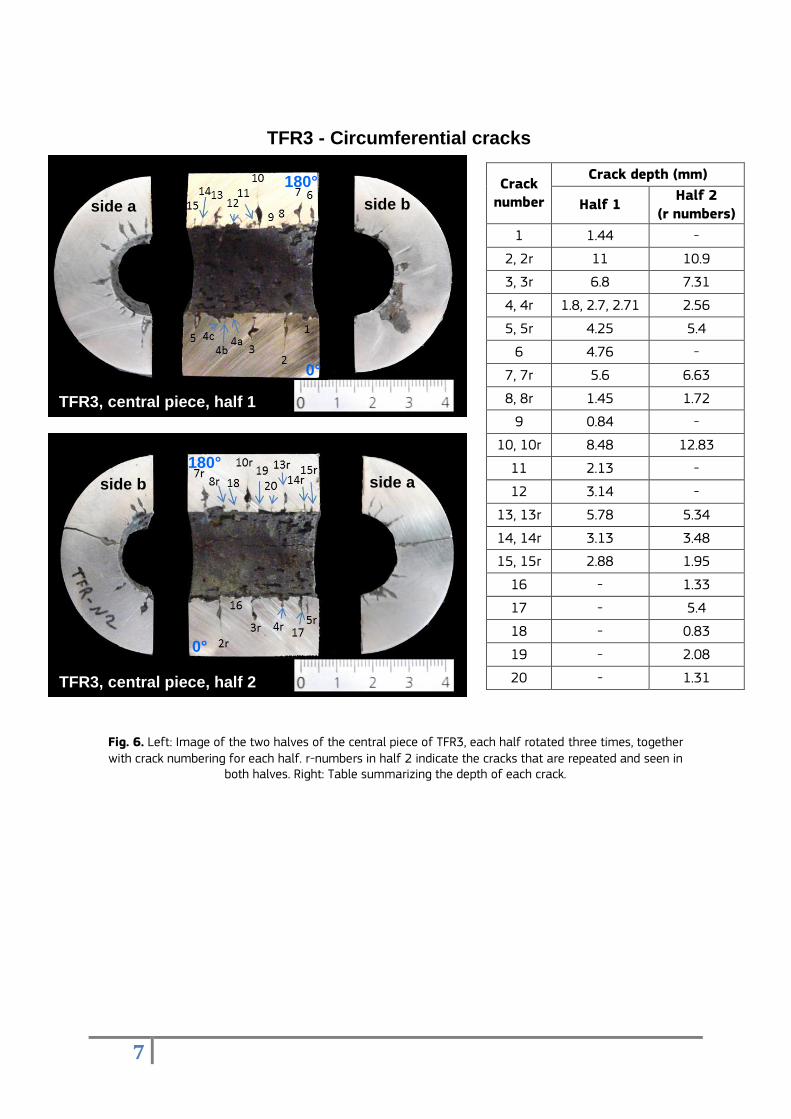
Fig. 6. Left: Image of the two halves of the central piece of TFR3, each half rotated three times, together with crack numbering for each half. r-numbers in half 2 indicate the cracks that are repeated and seen in
both halves. Right: Table summarizing the depth of each crack.
Crack number
Crack depth (mm)
Half 1 Half 2
(r numbers)
1 1.44 -
2, 2r 11 10.9
3, 3r 6.8 7.31
4, 4r 1.8, 2.7, 2.71 2.56
5, 5r 4.25 5.4
6 4.76 -
7, 7r 5.6 6.63
8, 8r 1.45 1.72
9 0.84 -
10, 10r 8.48 12.83
11 2.13 -
12 3.14 -
13, 13r 5.78 5.34
14, 14r 3.13 3.48
15, 15r 2.88 1.95
16 - 1.33
17 - 5.4
18 - 0.83
19 - 2.08
20 - 1.31 TFR3, central piece, half 2
side b side a
0°
180°
TFR3, central piece, half 1
side a side b
0°
180°
TFR3 - Circumferential cracks
8
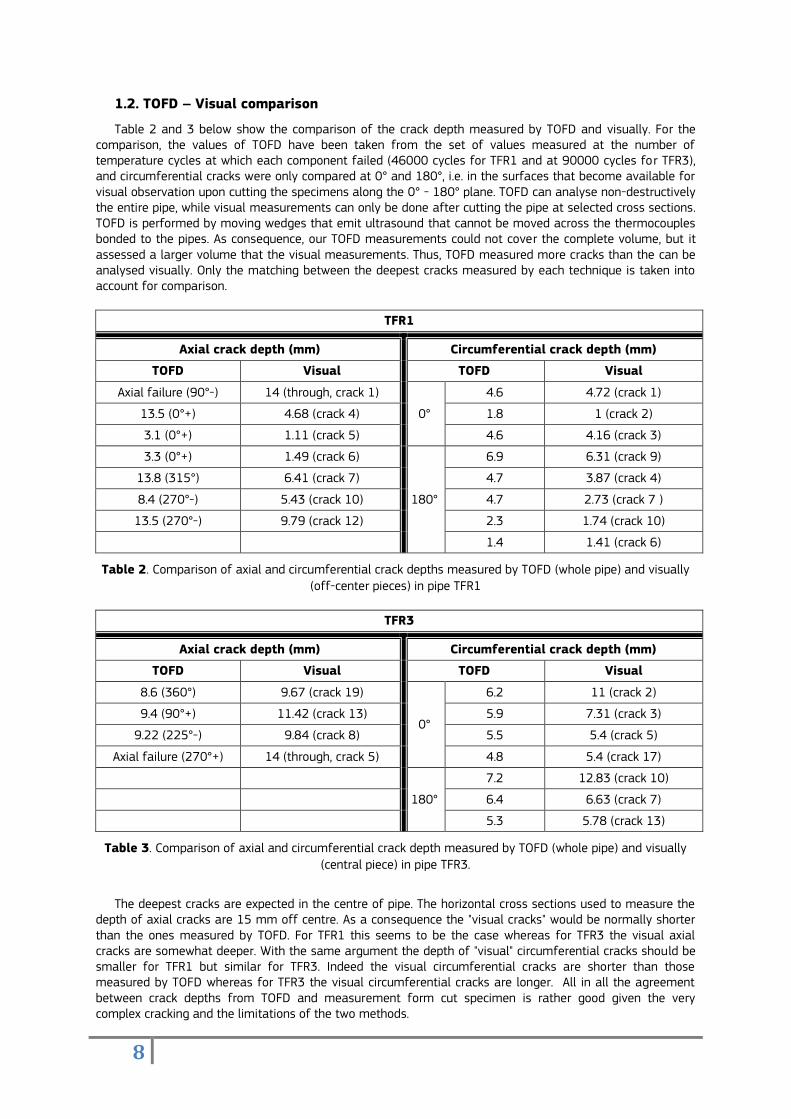
1.2. TOFD – Visual comparison
Table 2 and 3 below show the comparison of the crack depth measured by TOFD and visually. For the comparison, the values of TOFD have been taken from the set of values measured at the number of temperature cycles at which each component failed (46000 cycles for TFR1 and at 90000 cycles for TFR3), and circumferential cracks were only compared at 0° and 180°, i.e. in the surfaces that become available for visual observation upon cutting the specimens along the 0° - 180° plane. TOFD can analyse non-destructively the entire pipe, while visual measurements can only be done after cutting the pipe at selected cross sections. TOFD is performed by moving wedges that emit ultrasound that cannot be moved across the thermocouples bonded to the pipes. As consequence, our TOFD measurements could not cover the complete volume, but it assessed a larger volume that the visual measurements. Thus, TOFD measured more cracks than the can be analysed visually. Only the matching between the deepest cracks measured by each technique is taken into account for comparison.
TFR1
Axial crack depth (mm) Circumferential crack depth (mm)
TOFD Visual TOFD Visual
Axial failure (90°-) 14 (through, crack 1)
0°
4.6 4.72 (crack 1)
13.5 (0°+) 4.68 (crack 4) 1.8 1 (crack 2)
3.1 (0°+) 1.11 (crack 5) 4.6 4.16 (crack 3)
3.3 (0°+) 1.49 (crack 6)
180°
6.9 6.31 (crack 9)
13.8 (315°) 6.41 (crack 7) 4.7 3.87 (crack 4)
8.4 (270°-) 5.43 (crack 10) 4.7 2.73 (crack 7 )
13.5 (270°-) 9.79 (crack 12) 2.3 1.74 (crack 10)
1.4 1.41 (crack 6)
Table 2. Comparison of axial and circumferential crack depths measured by TOFD (whole pipe) and visually (off-center pieces) in pipe TFR1
TFR3
Axial crack depth (mm) Circumferential crack depth (mm)
TOFD Visual TOFD Visual
8.6 (360°) 9.67 (crack 19)
0°
6.2 11 (crack 2)
9.4 (90°+) 11.42 (crack 13) 5.9 7.31 (crack 3)
9.22 (225°-) 9.84 (crack 8) 5.5 5.4 (crack 5)
Axial failure (270°+) 14 (through, crack 5) 4.8 5.4 (crack 17)
180°
7.2 12.83 (crack 10)
6.4 6.63 (crack 7)
5.3 5.78 (crack 13)
Table 3. Comparison of axial and circumferential crack depth measured by TOFD (whole pipe) and visually
(central piece) in pipe TFR3.
The deepest cracks are expected in the centre of pipe. The horizontal cross sections used to measure the depth of axial cracks are 15 mm off centre. As a consequence the "visual cracks" would be normally shorter than the ones measured by TOFD. For TFR1 this seems to be the case whereas for TFR3 the visual axial cracks are somewhat deeper. With the same argument the depth of "visual" circumferential cracks should be smaller for TFR1 but similar for TFR3. Indeed the visual circumferential cracks are shorter than those measured by TOFD whereas for TFR3 the visual circumferential cracks are longer. All in all the agreement between crack depths from TOFD and measurement form cut specimen is rather good given the very complex cracking and the limitations of the two methods.
9
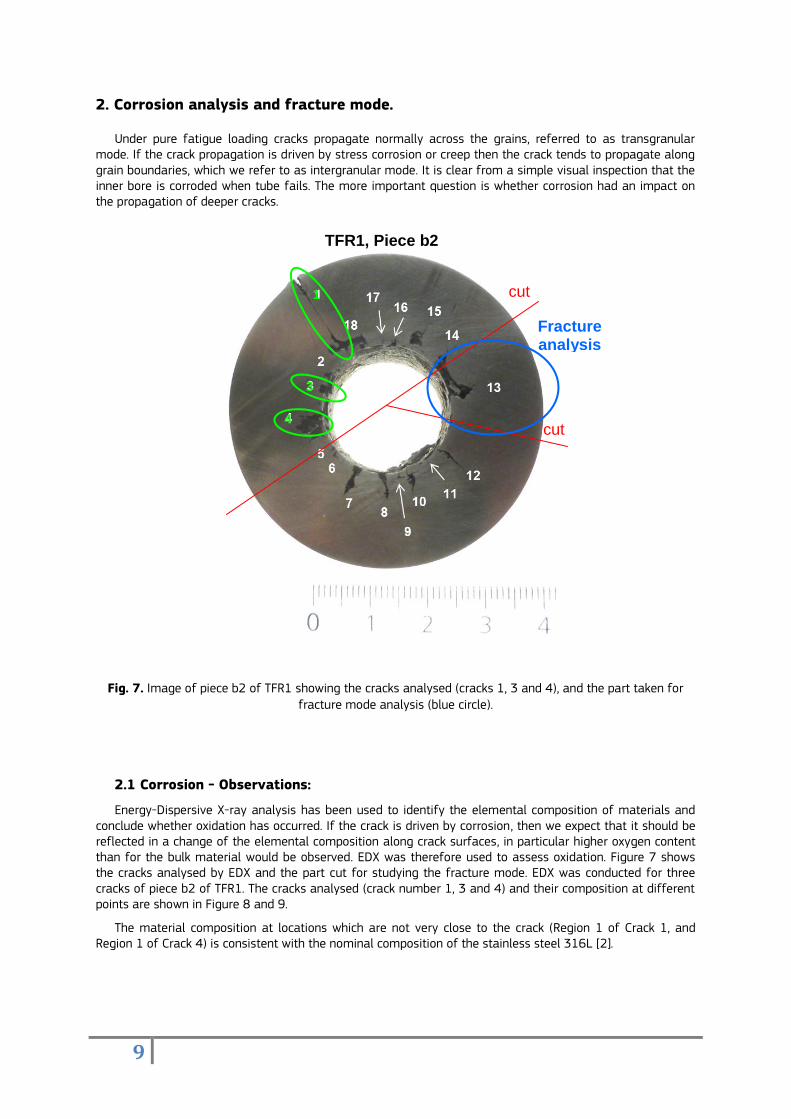
2. Corrosion analysis and fracture mode.
Under pure fatigue loading cracks propagate normally across the grains, referred to as transgranular mode. If the crack propagation is driven by stress corrosion or creep then the crack tends to propagate along grain boundaries, which we refer to as intergranular mode. It is clear from a simple visual inspection that the inner bore is corroded when tube fails. The more important question is whether corrosion had an impact on the propagation of deeper cracks.
Fig. 7. Image of piece b2 of TFR1 showing the cracks analysed (cracks 1, 3 and 4), and the part taken for fracture mode analysis (blue circle).
2.1 Corrosion - Observations:
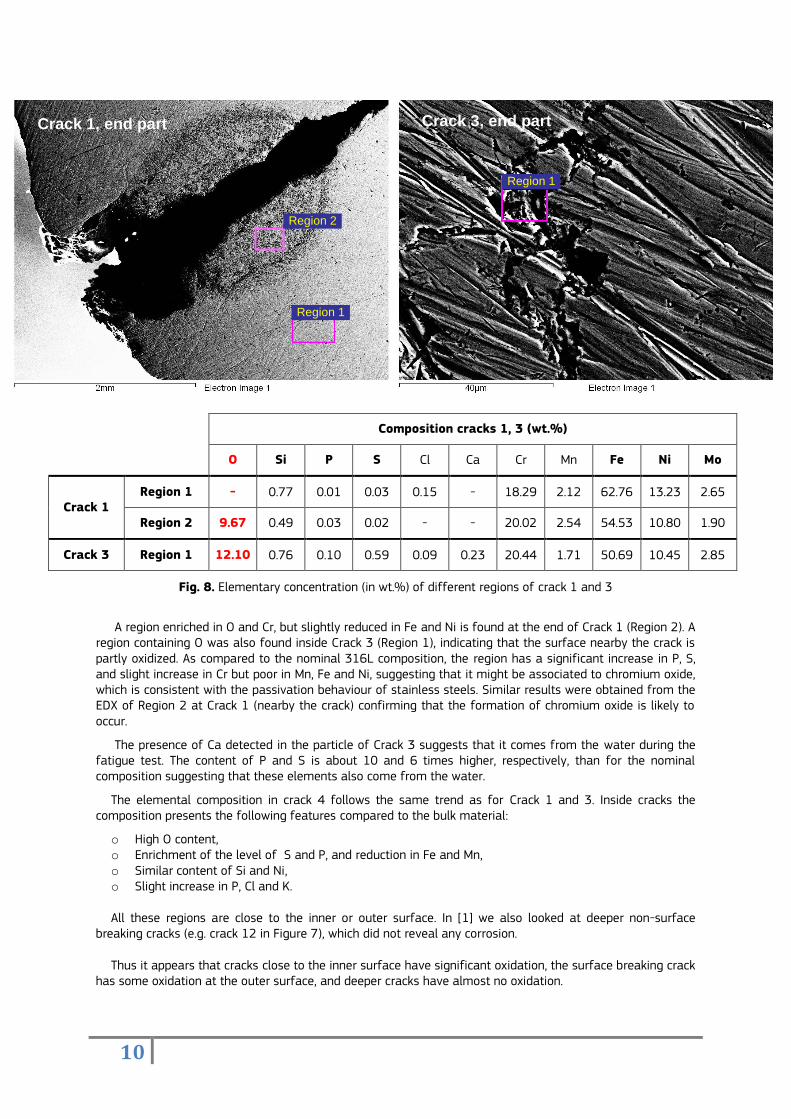
Energy-Dispersive X-ray analysis has been used to identify the elemental composition of materials and conclude whether oxidation has occurred. If the crack is driven by corrosion, then we expect that it should be reflected in a change of the elemental composition along crack surfaces, in particular higher oxygen content than for the bulk material would be observed. EDX was therefore used to assess oxidation. Figure 7 shows the cracks analysed by EDX and the part cut for studying the fracture mode. EDX was conducted for three cracks of piece b2 of TFR1. The cracks analysed (crack number 1, 3 and 4) and their composition at different points are shown in Figure 8 and 9.
The material composition at locations which are not very close to the crack (Region 1 of Crack 1, and Region 1 of Crack 4) is consistent with the nominal composition of the stainless steel 316L [2].
TFR1, Piece b2
cut
cut
1
3
4
Fracture analysis
10
Composition cracks 1, 3 (wt.%)
O Si P S Cl Ca Cr Mn Fe Ni Mo
Crack 1 Region 1 - 0.77 0.01 0.03 0.15 - 18.29 2.12 62.76 13.23 2.65
Region 2 9.67 0.49 0.03 0.02 - - 20.02 2.54 54.53 10.80 1.90
Crack 3 Region 1 12.10 0.76 0.10 0.59 0.09 0.23 20.44 1.71 50.69 10.45 2.85
Fig. 8. Elementary concentration (in wt.%) of different regions of crack 1 and 3
A region enriched in O and Cr, but slightly reduced in Fe and Ni is found at the end of Crack 1 (Region 2). A region containing O was also found inside Crack 3 (Region 1), indicating that the surface nearby the crack is partly oxidized. As compared to the nominal 316L composition, the region has a significant increase in P, S, and slight increase in Cr but poor in Mn, Fe and Ni, suggesting that it might be associated to chromium oxide, which is consistent with the passivation behaviour of stainless steels. Similar results were obtained from the EDX of Region 2 at Crack 1 (nearby the crack) confirming that the formation of chromium oxide is likely to occur.
The presence of Ca detected in the particle of Crack 3 suggests that it comes from the water during the fatigue test. The content of P and S is about 10 and 6 times higher, respectively, than for the nominal composition suggesting that these elements also come from the water.
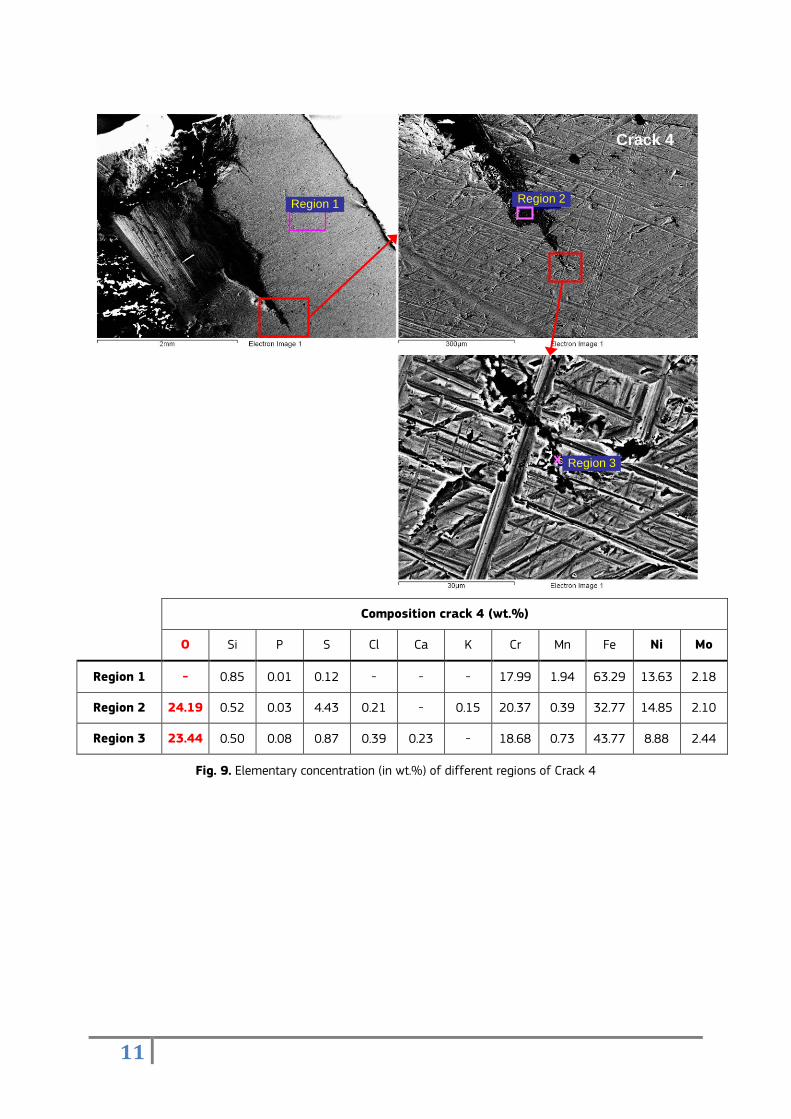
The elemental composition in crack 4 follows the same trend as for Crack 1 and 3. Inside cracks the composition presents the following features compared to the bulk material:
o High O content, o Enrichment of the level of S and P, and reduction in Fe and Mn, o Similar content of Si and Ni, o Slight increase in P, Cl and K.
All these regions are close to the inner or outer surface. In [1] we also looked at deeper non-surface breaking cracks (e.g. crack 12 in Figure 7), which did not reveal any corrosion.
Thus it appears that cracks close to the inner surface have significant oxidation, the surface breaking crack has some oxidation at the outer surface, and deeper cracks have almost no oxidation.
Crack 1, end part
Region 1
Region 2
Crack 3, end part
Region 1
11
Composition crack 4 (wt.%)
O Si P S Cl Ca K Cr Mn Fe Ni Mo
Region 1 - 0.85 0.01 0.12 - - - 17.99 1.94 63.29 13.63 2.18
Region 2 24.19 0.52 0.03 4.43 0.21 - 0.15 20.37 0.39 32.77 14.85 2.10
Region 3 23.44 0.50 0.08 0.87 0.39 0.23 - 18.68 0.73 43.77 8.88 2.44
Fig. 9. Elementary concentration (in wt.%) of different regions of Crack 4
Region 3 x
Region 2
Crack 4
Region 1
12
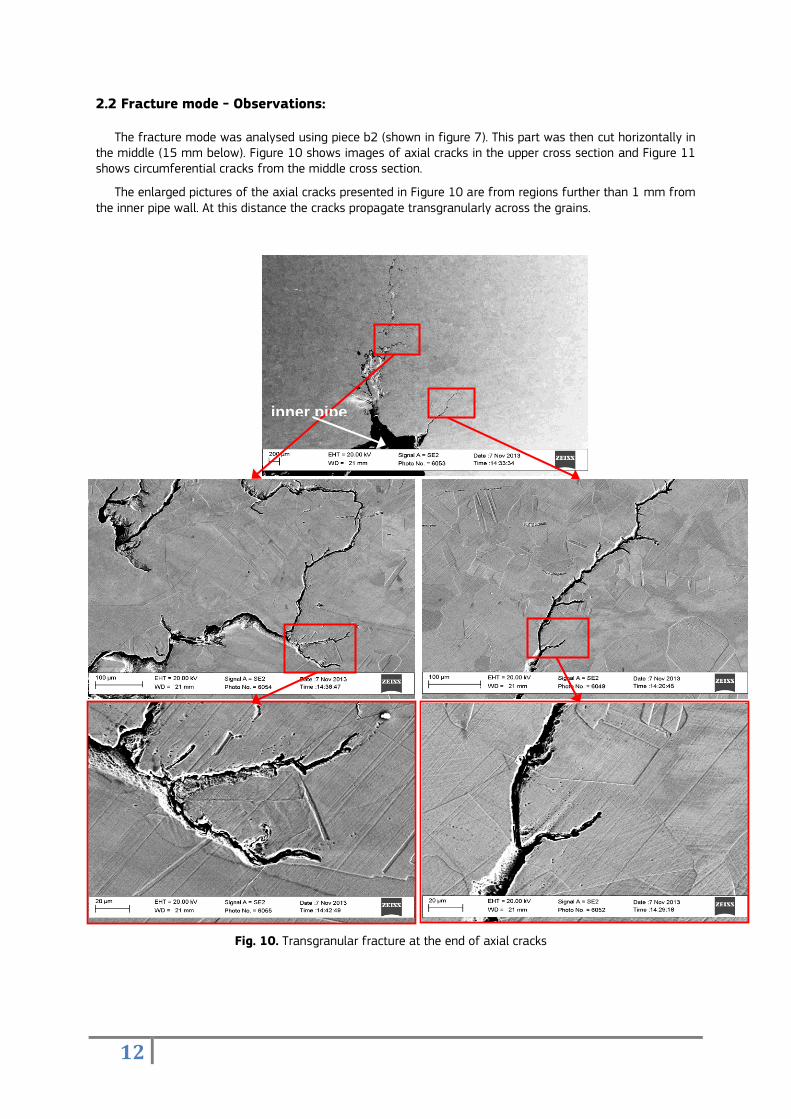
2.2 Fracture mode - Observations:
The fracture mode was analysed using piece b2 (shown in figure 7). This part was then cut horizontally in the middle (15 mm below). Figure 10 shows images of axial cracks in the upper cross section and Figure 11 shows circumferential cracks from the middle cross section.
The enlarged pictures of the axial cracks presented in Figure 10 are from regions further than 1 mm from the inner pipe wall. At this distance the cracks propagate transgranularly across the grains.
Fig. 10. Transgranular fracture at the end of axial cracks
inner pipe wall
13
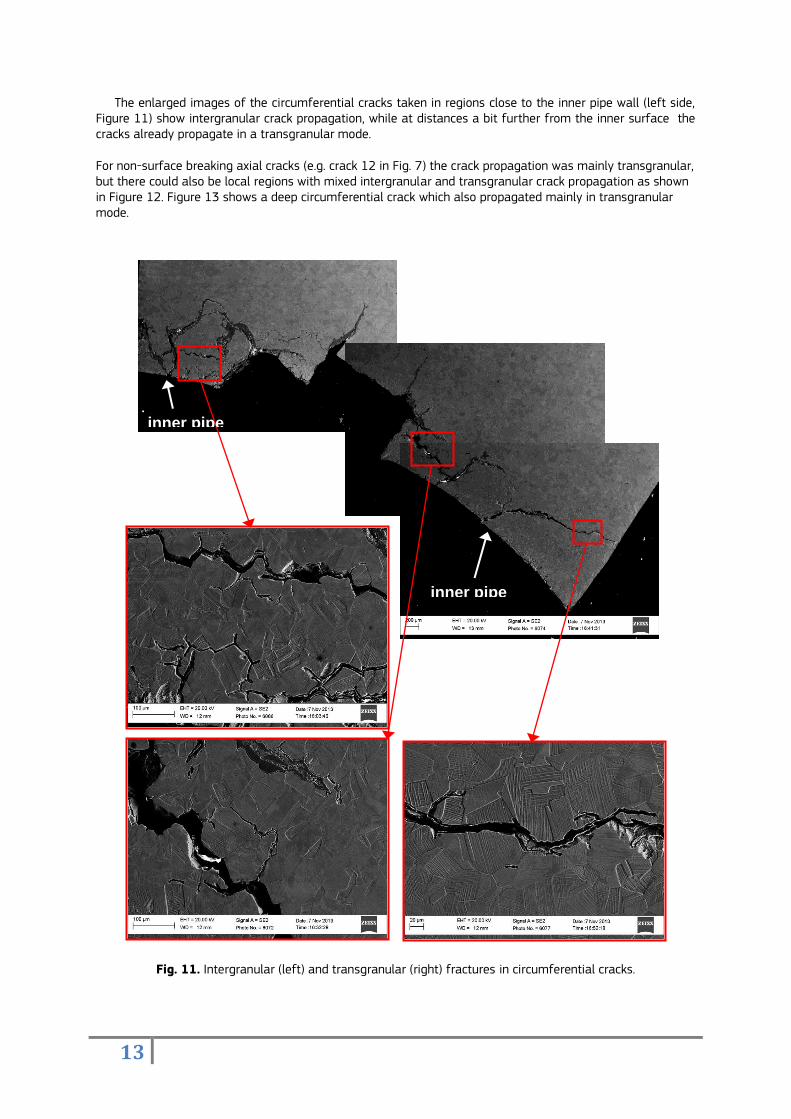
The enlarged images of the circumferential cracks taken in regions close to the inner pipe wall (left side, Figure 11) show intergranular crack propagation, while at distances a bit further from the inner surface the cracks already propagate in a transgranular mode.
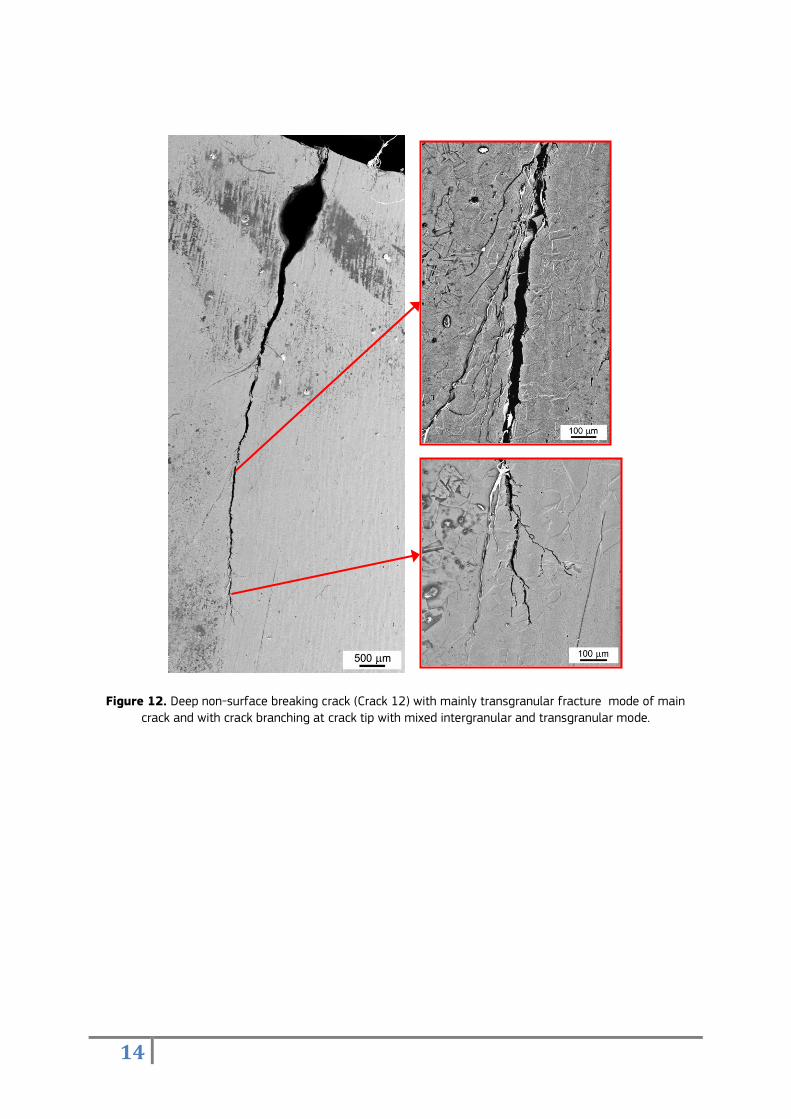
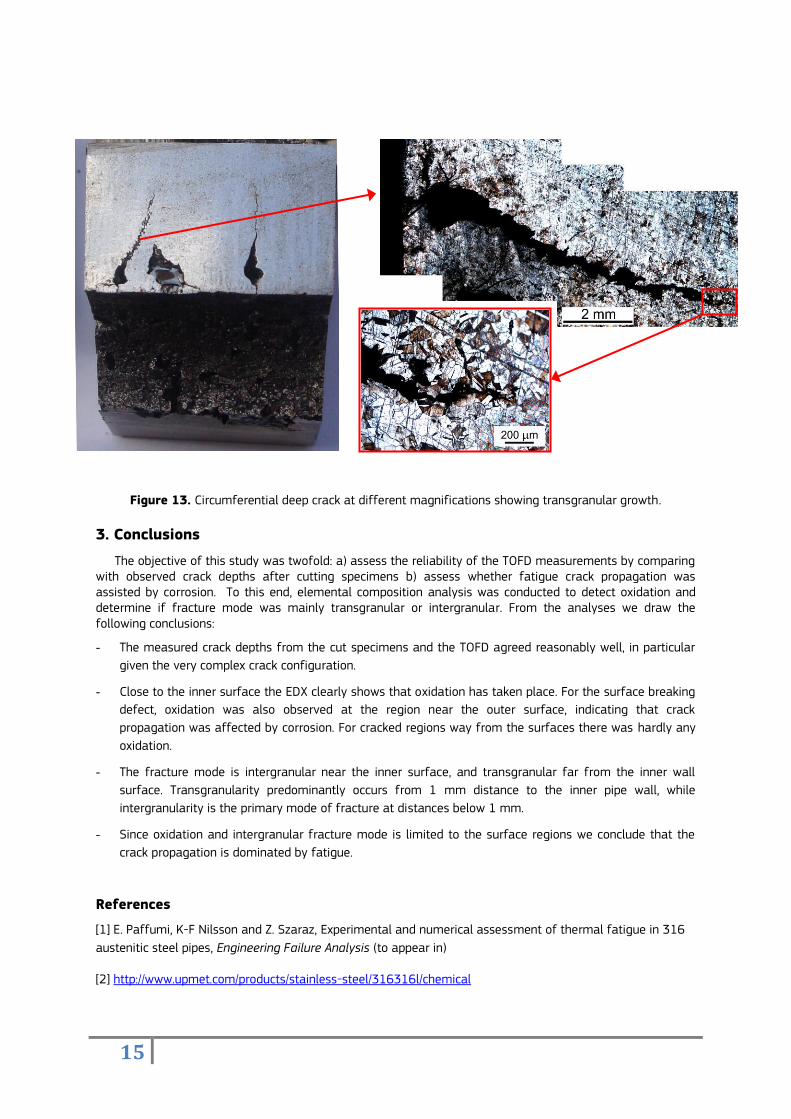
For non-surface breaking axial cracks (e.g. crack 12 in Fig. 7) the crack propagation was mainly transgranular, but there could also be local regions with mixed intergranular and transgranular crack propagation as shown in Figure 12. Figure 13 shows a deep circumferential crack which also propagated mainly in transgranular mode.
Fig. 11. Intergranular (left) and transgranular (right) fractures in circumferential cracks.
inner pipe wall
inner pipe wall
14
Figure 12. Deep non-surface breaking crack (Crack 12) with mainly transgranular fracture mode of main
crack and with crack branching at crack tip with mixed intergranular and transgranular mode.
15
Figure 13. Circumferential deep crack at different magnifications showing transgranular growth.
3. Conclusions
The objective of this study was twofold: a) assess the reliability of the TOFD measurements by comparing with observed crack depths after cutting specimens b) assess whether fatigue crack propagation was assisted by corrosion. To this end, elemental composition analysis was conducted to detect oxidation and determine if fracture mode was mainly transgranular or intergranular. From the analyses we draw the following conclusions:
- The measured crack depths from the cut specimens and the TOFD agreed reasonably well, in particular
given the very complex crack configuration.
- Close to the inner surface the EDX clearly shows that oxidation has taken place. For the surface breaking
defect, oxidation was also observed at the region near the outer surface, indicating that crack
propagation was affected by corrosion. For cracked regions way from the surfaces there was hardly any
oxidation.
- The fracture mode is intergranular near the inner surface, and transgranular far from the inner wall
surface. Transgranularity predominantly occurs from 1 mm distance to the inner pipe wall, while
intergranularity is the primary mode of fracture at distances below 1 mm.
- Since oxidation and intergranular fracture mode is limited to the surface regions we conclude that the
crack propagation is dominated by fatigue.
References
[1] E. Paffumi, K-F Nilsson and Z. Szaraz, Experimental and numerical assessment of thermal fatigue in 316
austenitic steel pipes, Engineering Failure Analysis (to appear in)
[2] http://www.upmet.com/products/stainless-steel/316316l/chemical
16
This page was left blank intentionally
\
European Commission
EUR 26445 – Joint Research Centre – Institute for Energy and Transport
Title: Microstructural analysis of thermal fatigue damage in 316L pipes
Authors: Sergio González, Ana Ruiz-Moreno, Karl-Fredrik Nilsson
Luxembourg: Publications Office of the European Union
2013 – 16 pp. – 21.0 x 29.7 cm
EUR – Scientific and Technical Research series –ISSN 1831-9424 (online)
ISBN 978-92-79-35100-6 (pdf)
doi:10.2790/12330
Abstract
This report summarizes the data and main conclusions derived from microstructural characterisation of 316L pipes subjected to
thermal fatigue with a peak temperature of 550°C. TOFD measurements are compared with measured crack depths from cut
segments, and fracture mode and corrosion have been assessed by SEM and EDX, respectively.
z
As the Commission’s in-house science service, the Joint Research Centre’s mission is to provide EU policies with independent, evidence-based scientific and technical support throughout the whole policy cycle. Working in close cooperation with policy Directorates-General, the JRC addresses key societal challenges while stimulating innovation through developing new standards, methods and tools, and sharing and transferring its know-how to the Member States and international community. Key policy areas include: environment and climate change; energy and transport; agriculture and food security; health and consumer protection; information society and digital agenda; safety and security including nuclear; all supported through a cross-cutting and multi-disciplinary approach.
LD
-NA
-26
44
5-E
N-N
ISBN: 978-92-79-35100-6


![Comprehensive study of intermetallic compounds in solar cell … · 2020-03-25 · thermomechanical fatigue[8]. The goals are to describe microstructural changes during thermal aging,](https://img.pdfslide.net/doc/110x75/5e933c7e94927f1e8336998a/comprehensive-study-of-intermetallic-compounds-in-solar-cell-2020-03-25-thermomechanical.jpg)


![EffectofColdWorkingontheDrivingForceoftheCrackGrowth ... · 2020. 8. 25. · Mechanical parameters 600 alloy 316L-CW0 316L-CW10 316L-CW20 Oxide film Yield strength (MPa) 436 [11]](https://img.pdfslide.net/doc/110x75/60b30c27e742c032c66e8a0b/effectofcoldworkingonthedrivingforceofthecrackgrowth-2020-8-25-mechanical.jpg)

![Microstructural creep, fatigue and creep-fatigue modeling of ......modeling the response of metallic materials under di erent loading conditions [14] across di erent deformation mecha-nisms](https://img.pdfslide.net/doc/110x75/60deaa56f9a3fa7ea40f40c6/microstructural-creep-fatigue-and-creep-fatigue-modeling-of-modeling-the.jpg)