Embed Size (px)
Citation preview
NASA Contractor Report 198376
NASA-CR-198376 19960001958
Microstructure and Properties of Cryomilled Nickel Aluminide Extruded With Chromium or Molybdenum
Beverly I.M. Aikin Case Western Reserve University Cleveland, Ohio
Robert M. Dickerson and Patricia O. Dickerson NYMA, Inc. Brook Park, Ohio
August 1995
Prepared for Lewis Research Center Under Cooperative Agreement NCC3-144 and NASA Contract NAS3-27186
National Aeronautics and Space Administration
1111111111111 1111 IIIII 11111 11111111111111 1111 NF01390
- - ~ , - -- ------- - ----
~.
! '~r~1 IQ~h: • "t-!.-' r '-i I ~
1IIIIIIIIIIIIIIIIil~~llf~llfll~'II~1111111111111111111I 3 1176014227590
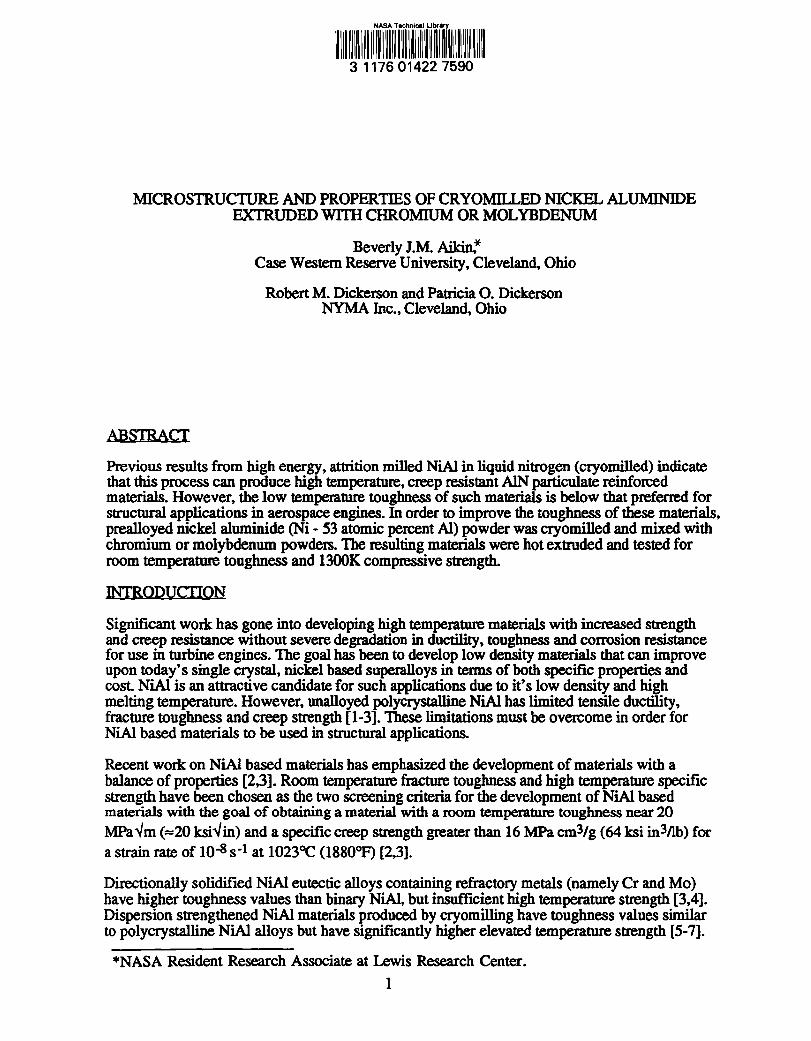
MICROSTRUCTURE AND PROPERTIES OF CRYOMILLED NICKEL ALUMINIDE EXTRUDED WITH CHROMIUM OR MOLYBDENUM
ABSlRACI
Beverly I.M. Aikin: Case Western Reserve University, Cleveland, Ohio
Robert M. Dickerson and Patricia O. Dickerson NYMA Inc., Cleveland, Ohio
Previous results from high energy, attrition milled NiAl in liquid nitrogen (cryomilled) indicate that this process can produce high temperature, creep resistant AlN particulate reinforced materials. However, the low temperature toughness of such materials is below that preferred for structural applications in aerospace engines. In order to improve the toughness of these materials, prea1loyed nickel aluminide (Ni - 53 atomic percent At) powder was cryomilled and mixed with chromium or molybdenum powders. The resulting materials were hot extruded and tested for room temperature toughness and 1300K compressive strength.
INTRODUCTION
Significant work has gone into developing high temperature materials with increased strength and creep resistance without severe degradation in ductility, toughness and corrosion resistance for use in turbine engines. The goal has been to develop low density materials that can improve upon today's single crystal, nickel based superalloys in tenns of both specific properties and cost. NiAl is an attractive candidate for such applications due to it's low density and high melting temperature. However, unalloyed polycrystalline NiAl has limited tensile ductility, fracture toughness and creep strength [1-3]. These limitations must be overcome in order for NiAl based materials to be used in structural applications.
Recent work on NiAl based materials has emphasized the development of materials with a balance of properties [2,3]. Room temperature fracture toughness and high temperature specific strength have been chosen as the two screening criteria for the development of NiAl based materials with the goal of obtaining a material with a room temperature toughness near 20 MPa"m (=20 ksi"in) and a specific creep strength greater than 16 MPa cm3/g (64 ksi in3llb) for a strain rate of 10-8 s-1 at 10230C (I8800f') [2,3].
Directionally solidified NiAl eutectic alloys containing refractory metals (namely Cr and Mo) have higher toughness values than binary NiAl. but insufficient high temperature strength [3,4]. Dispersion strengthened NiAl materials produced by cryomilling have toughness values similar to polycrystalline NiAl alloys but have significantly higher elevated temperature strength [5-7].
*NASA Resident Research Associate at Lewis Research Center. 1
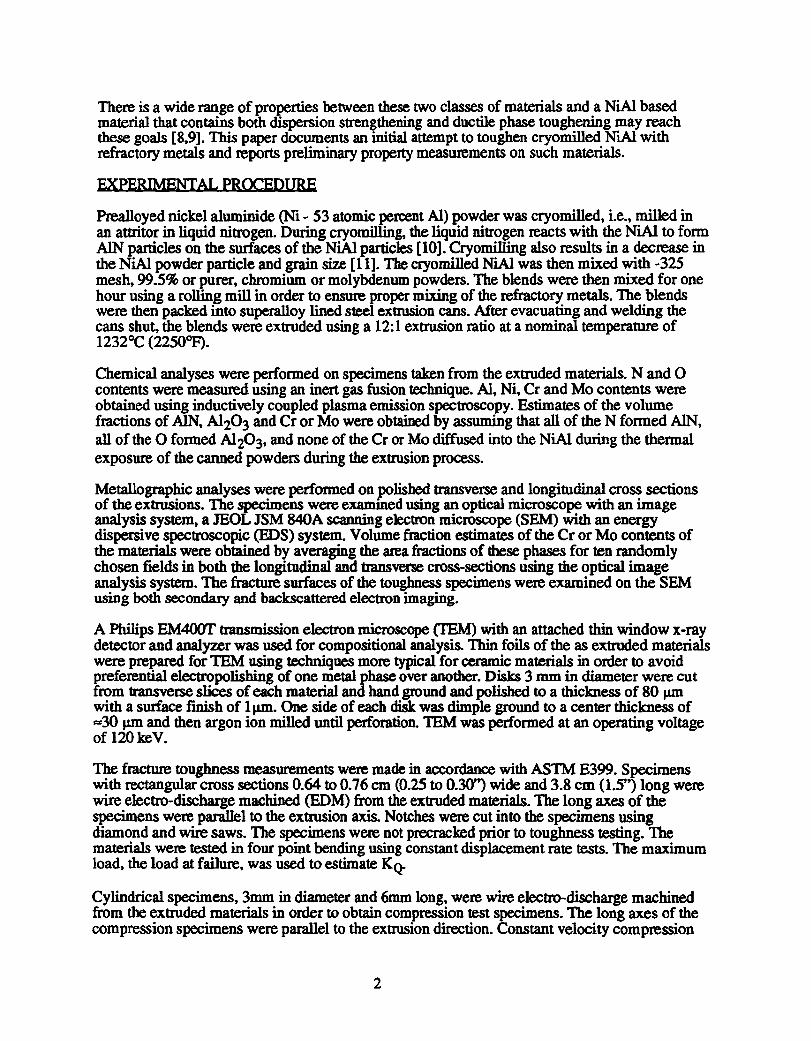
There is a wide range of properties between these two classes of materials and a NiAl based material that contains both dispersion strengthening and ductile phase toughening may reach these goals [8.9]. This paper documents an initial attempt to toughen cryomilled NiAl with refractory metals and reports preliminary property measurements on such materials.
EXPERIMENTAL PROCEDURE
PreaI10yed nickel aluminide (Ni - 53 atomic percent AI) powder was cryomilled, i.e., milled in an attritor in liquid nitrogen. During cryomilling, the liquid nitrogen reacts with the N"lAl to form AlN particles on the surfaces of the NiAl particles [10]. Cryomilling also results in a decrease in the NiAl powder particle and grain size [11]. The cryomilled NiAl was then mixed with -325 mesh, 99.5% or purer, chromium or molybdenum powders. The blends were then mixed for one hour using a rolling mill in order to ensure proper mixing of the refractory metals. The blends were then packed into superalloy lined steel extrusion cans. Mter evacuating and welding the cans shut, the blends were extruded using a 12:1 extrusion ratio at a nominal temperature of 1232°C (22500J<).
Chemical analyses were performed on specimens taken from the extruded materials. N and ° contents were measured using an inert gas fusion technique. AI, Ni. Cr and Mo contents were obtained using inductively coupled plasma emission spectroscopy. Estimates of the volume fractions of AlN. Al203 and Cr or Mo were obtained by assuming that all of the N formed AlN. all of the ° formed AI203. and none of the Cr or Mo diffused into the NiAl during the thermal exposure of the canned powders during the extrusion process.
Metallograpbic analyses were performed on polished transverse and longitudinal cross sections of the extrusions. The specimens were examined using an optical microscope with an image analysis system. a lEOL JSM 840A scanning electron microscope (SEM) with an energy dispersive spectroscopic (EDS) system. Volume fraction estimates of the Cr or Mo contents of the materials were obtained by averaging the area fractions of these phases for ten randomly chosen fields in both the longitudinal and transverse cross-sections using the optical image analysis system. The fracture surfaces of the toughness specimens were examined on the SEM using both secondary and backscattered electron imaging.
A Philips EM400T transmission electron microscope (TEM) with an attached thin window x-ray detector and analyzer was used for compositional analysis. Thin foils of the as extruded materials were prepared for TEM using techniques more typical for ceramic materials in order to avoid preferential electropolishing of one metal phase over another. Disks 3 mm in diameter were cut from transverse slices of each material and hand ground and polished to a thickness of 80 J.LID with a surface finish of 1 J.1Ill. One side of each disk was dimple ground to a center thickness of =30 J1l1l and then argon ion milled until perforation. TEM was performed at an operating voltage of 120keV.
The fracture toughness measurements were made in accordance with ASTM E399. Specimens with rectangular cross sections 0.64 to 0.76 em (0.25 to 0.30") wide and 3.8 cm (1.5") long were wire electro-discharge machined (EDM) from the extruded materials. The long axes of the specimens were parallel to the extrusion axis. Notches were cut into the specimens using diamond and wire saws. The specimens were not precracked prior to toughness testing. The materials were tested in four point bending using constant displacement rate tests. The maximum load. the load at failure. was used to estimate KQ-
Cylindrical specimens, 3mm in diameter and 6mm long. were wire electro-discharge machined from the extruded materials in order to obtain compression test specimens. The long axes of the compression specimens were parallel to the extrusion direction. Constant velocity compression
2
tests atcrosshead speeds ranging from 0.005 to 5 X 10⁻⁶ inlmin (2.1 X 10⁻³ to 8.47 X 10⁻⁷ mm1s) were conducted in air at 1027°C (1880°F). Load-time charts were converted, assuming conservation of volume, to true compressive stresses, strains and strain rates via the offset method [12,13].
EXPERIMENTAL RESULTS
The results of the chemical analyses of the extruded materials are listed in Table 1. There was significant N and 0 pickup during cryomilling and subsequent processing. There was also some slight Cr contamination in the Mo containing material. Converting the chemistries to volume percent constituents (Table 2) indicate that the materials came close to their intended volume fractions of refractory materials, as expected - 10 and 30 volume percent chromium and 12 volume percent Mo. The materials also contained approximately 10 volume percent AlN and 3 volume percent Al203.
Table 1. Chemical Analysis of Extruded Materials in Weight Percent.
Material AI 0- Mo Ni N 0 NlAiI AlN-lOCr 29.6 11.9 55.8 1.80 0.87 N1AlIAlN-3OCr 21.4 34.9 41.4 1.50 0.83 NiAVAlN-12Mo 26.0 0.1 20.8 49.9 2.18 1.03
Table 2. Estimated Volume Percents of Constituent Phases from Chemical Analyses.
Material NiAVAlN-lOCr NiAll AlN-3OCr NiAlIAlN-12Mo
MAl 77 58 71
AlN 10 8 13
3 3 4
cr 10 31 0.1
Mo
13
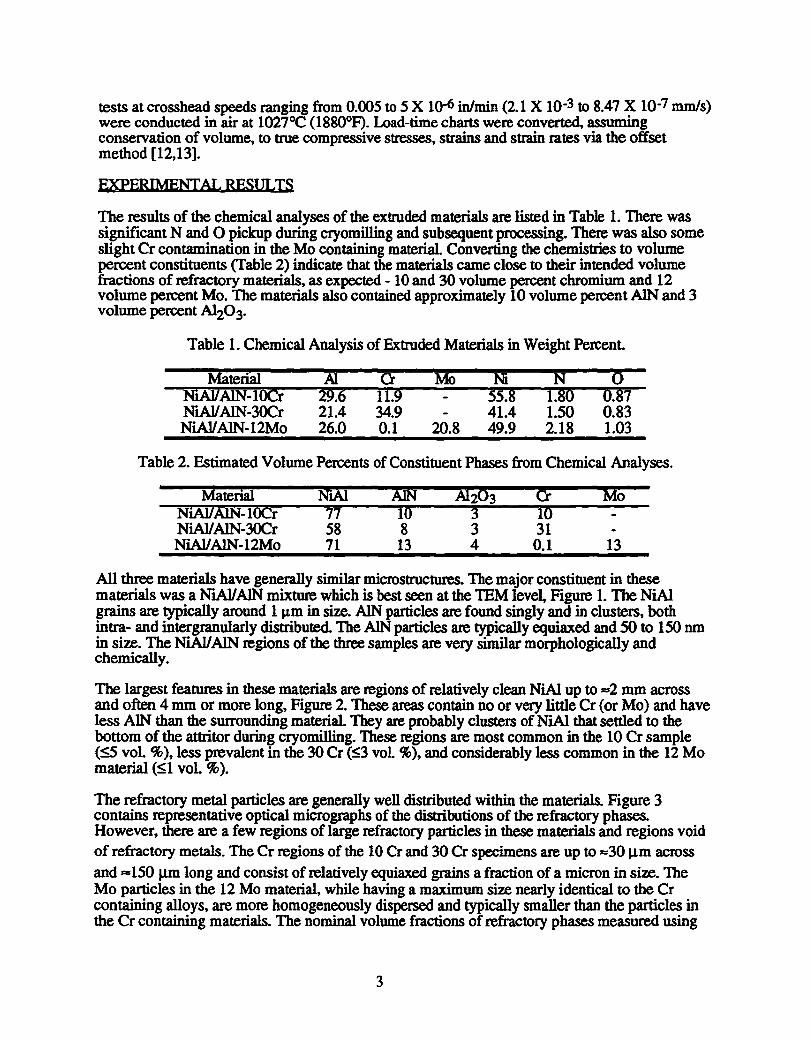
All three materials have generally similar microstructures. The major constituent in these materials was a NiAlIAlN mixture which is best seen at the lEM level, Figure 1. The NiAl grains are typically around 1 J.Lm in size. AlN particles are found singly and in clusters, both intra.- and intergranularly distributed. The AlN particles are typicallyequiaxed and 50 to 150 nm in size. The NiAll AlN regions of the three samples are very similar morphologically and chemically.
The largest features in these materials are regions of relatively clean NiAl up to =2 mm across and often 4 mm or more long, Figure 2. These areas contain no or very little Cr (or Mo) and have less AlN than the SUlTounding material. They are probably clusters of NiAl that settled to the bottom of the attritor during cryomilling. These regions are most common in the 10 Cr sample (~ voL %), less prevalent in the 30 Cr (S3 voL %), and considerably less common in the 12 Mo material (Sl vol. %).
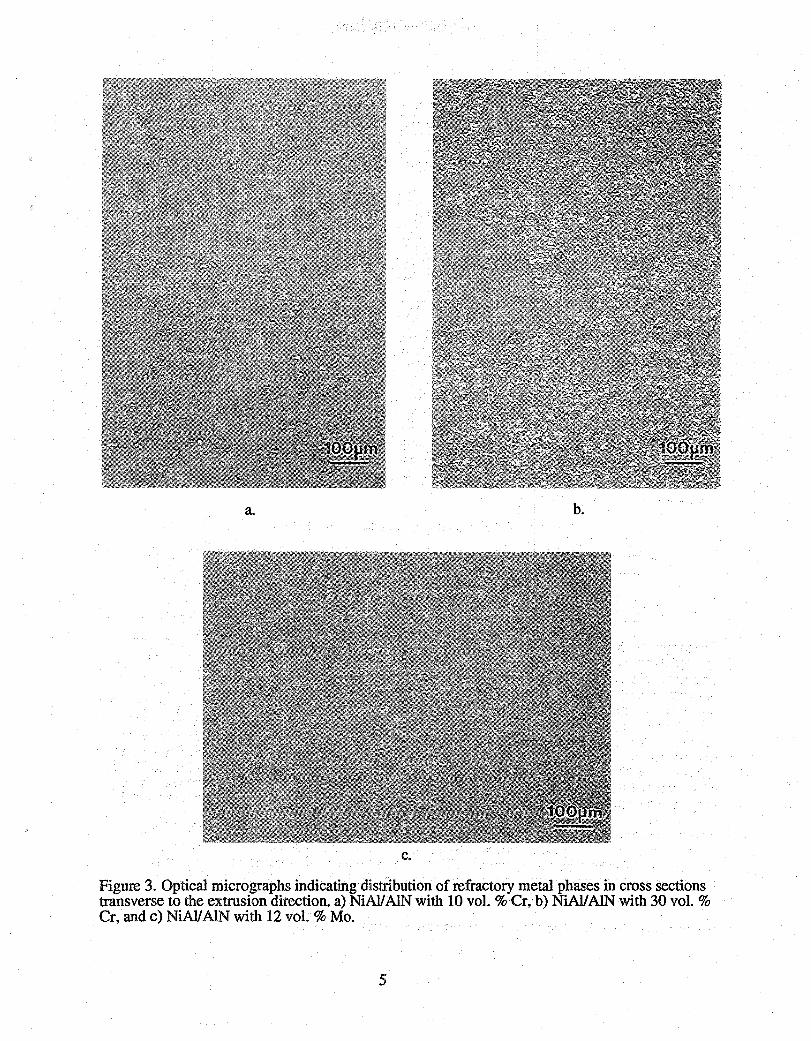
The refractory metal particles are generally well distributed within the materials. Figure 3 contains representative optical micrographs of the distributions of the refractory phases. However, there are a few regions of large refractory particles in these materials and regions void of refractory metals. The Cr regions of the 10 Cr and 30 Cr specimens are up to =30 J.1m across and =150 JJ.m long and consist of relatively equiaxed grains a fraction of a micron in size. The Mo particles in the 12 Mo material, while having a maximum size nearly identical to the Cr containing alloys, are more homogeneously dispersed and typically smaller than the particles in the Cr containing materials. The nominal volume fractions of refractory phases measured using
3
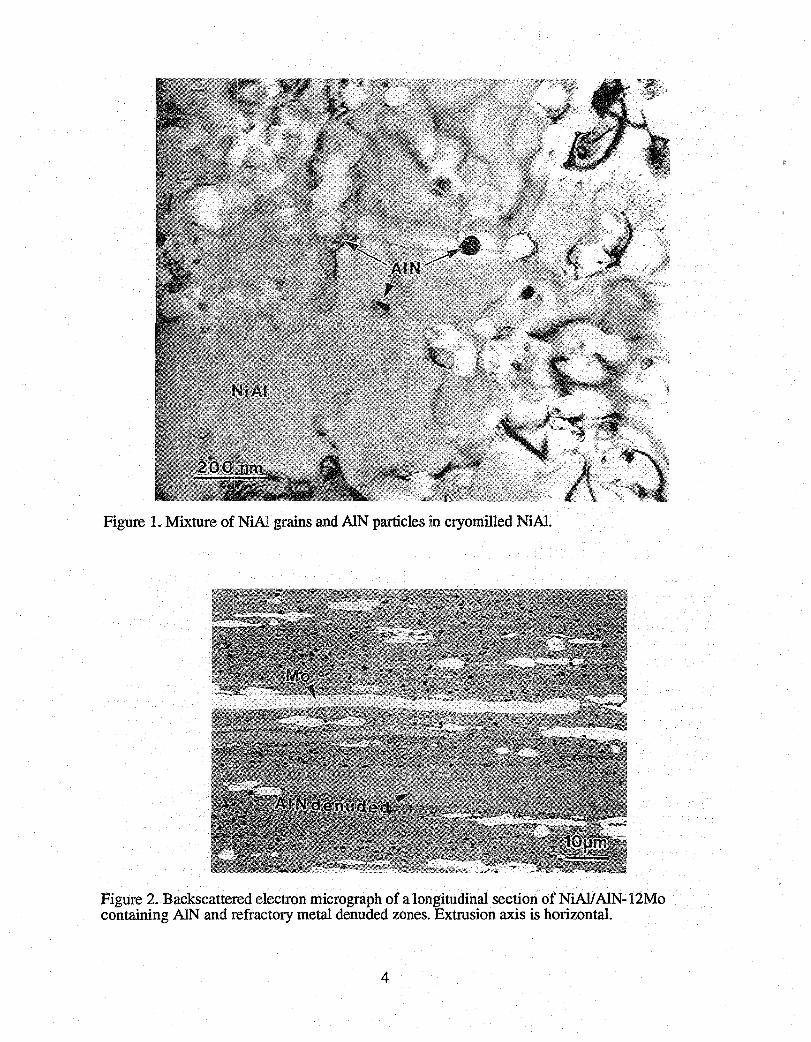
Figure 1. Mixture of NiAl grains and AlN particles in cryomilled NiAl.
Figure 2. Backscattered electron micrograph of a longitudinal section of NiAll AIN-12Mo containing AlN and refractory metal denuded zones. Extrusion axis is horizontal.
4
a b.
c.
Figure 3. Optical micrographs indicating distribution of refractory metal phases in cross sections transverse to the extlUsion direction. a) NiA1lAlN with 10 vol. % Cr. b) NiA1IAlN with 30 vol. % Cr, and c) NiA1lAlN with 12 vol. % Mo.
5
the optical image analysis system, Table 3, are similar to those estimated from the chemical analyses. The significant variations in the N"lAlI AlN-30 Cr distribution is due to the presence of the large Cr particles and the AlN denuded zones.
Table 3. Volume Percents of Refractory Phases from Metallographic Analyses.
Material Transverse section LongitudiD8i section NlAlIAlN-IOCr 9± I 9±3 N'lAlIAlN-3OCr 32 ± 3 20 ± 7 N'1A1IAlN-12Mo 9± 1 12±3
Ranges represent 95% Confidence intervalS about the Mean
Room temperature fracture toughness tests were performed on notched specimens for each material. The estimated room temperature fracture toughness values, ~, are listed in Table 4. No value is listed for N'1AIIAlN+IOCr Specimen A due to a failure to record the load during testing. The 30 Cr material has a slightly higher average toughness than the 10 Cr specimen due to a larger amount of refractory material. The 12 Mo material has the highest average toughness.
All of the fracture surfaces show evidence of the difficulty in notching the specimens, Figure 4 for example. The notched areas contain numerous machining striations, imbedded SiC particles, and bowed notches. These features certainly influenced the fracture toughness results listed in Table 4. The bowed notch root and the tilt in the notch with respect to the testing axis may cause an overestimate of the fracture toughness value. However, the presence of an inhomogeneous microstructure at the notch root may lead to stress concentrations which could lead to an underestimate of the fracture toughness.
Fracture Toughness Measurements, KQo in MPa...Jm.
Material N1A17AlN-lOCr NlAlI AlN-3OCr NiAlIAlN-12Mo
Specimen A
14.23 19.47
SP!fimeDB .83
13.86 13.14
Average
14.0 16.3
There appear to be multiple fracture origins at the notch root, Figure 5 for example. These are located in areas which contain both AlN denuded zones and large refractory particles. The fracture surfaces of the toughness specimens are not flat and vary in roughness due to microstructural inhomogeneities. The crack path was more tortuous through areas containing a uniform refractory particle size and distribution than the crack path through areas that contained no refractory particles. The lower roughness (and by implication toughness) areas are the AlN denuded zones mentioned previously. The Cr and Mo particles, in regions where they were well dispersed, partially debonded from the matrix and necked during fracture, Figure 6. The largest refractory particles generally failed by intergranular fracture. The lower toughness for the 12 Mo specimen B could be attributed to an extremely inhomogeneous microstructure at the notch. A large Mo particle and a number of AlN denuded zones were present at the notch root, Figure 7.
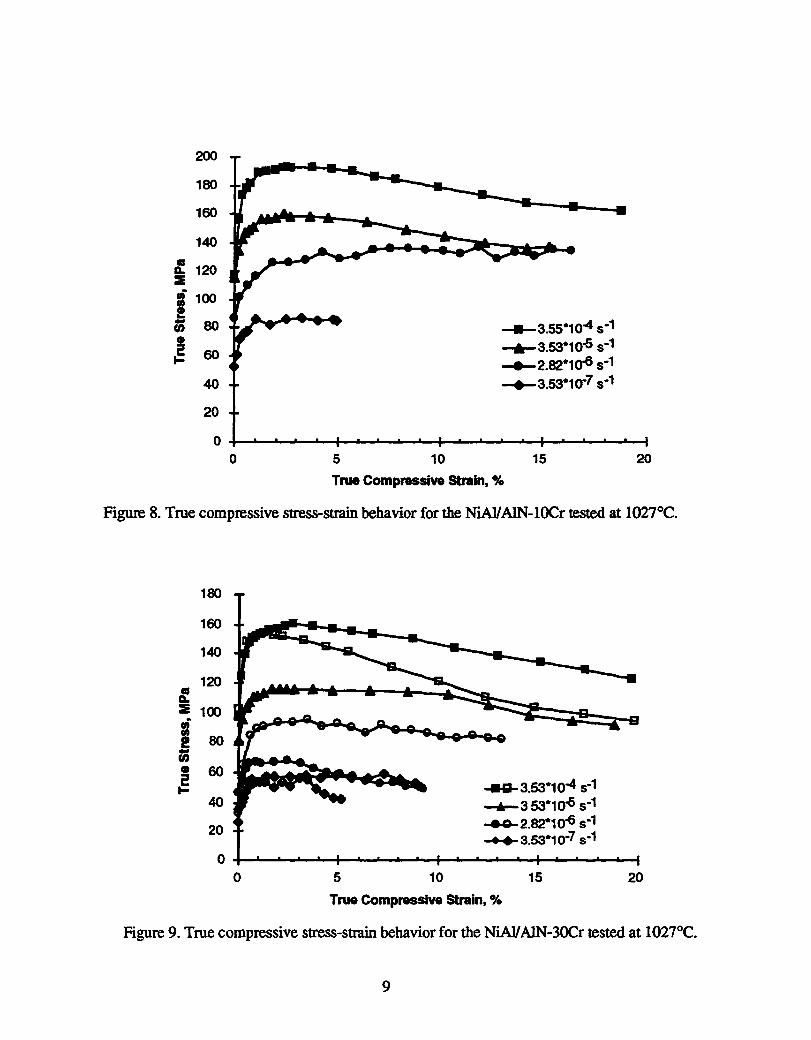
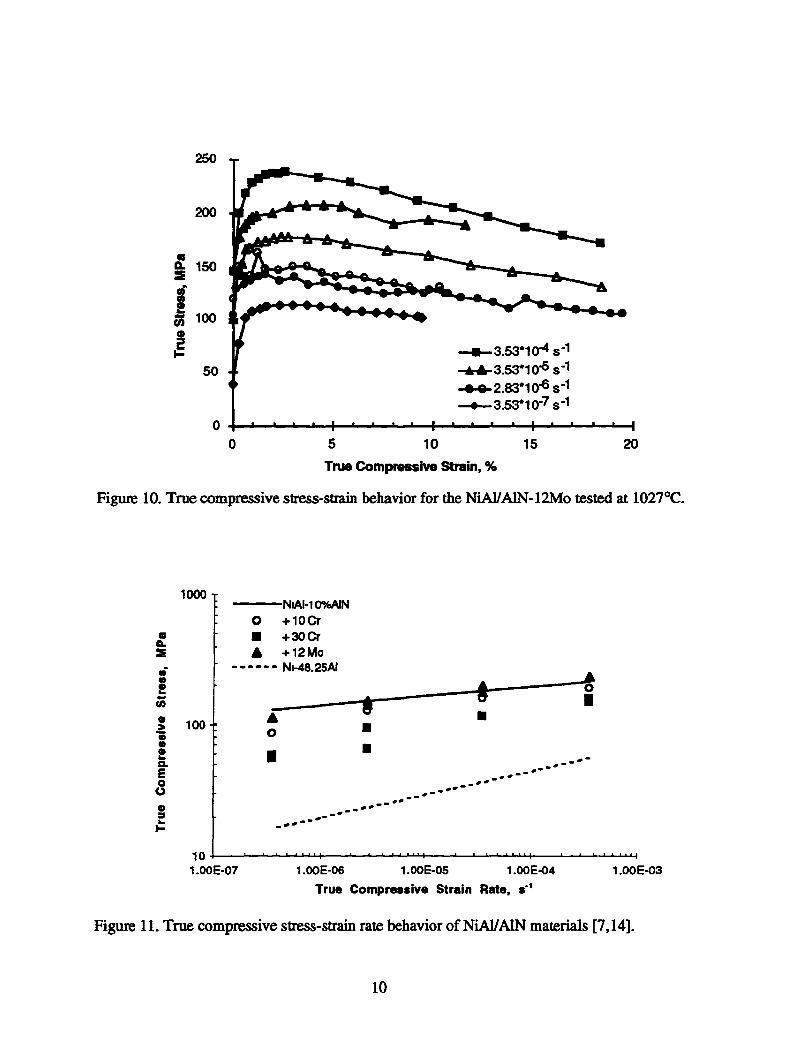
The true compressive stress-strain diagrams for the materials tested at 10270C (1880°F) are given in Figures 8-10. Rapid work hardening occurs during the flCSt 1 % of defonnation, irrespective of the strain rate or material. The rapid strain hardening is succeeded by more gradual work hardening until a maximum stress is reached after about 2-3% strain and is generally followed by slow strain softening. The true compressive flow stress-strain rate data taken from the constant velocity tests at 3% strain are given in Figure 11 along with similar data for polycrystalline NiAl and NiAVAlN without refractory metal additions [7.14]. The Mo
6
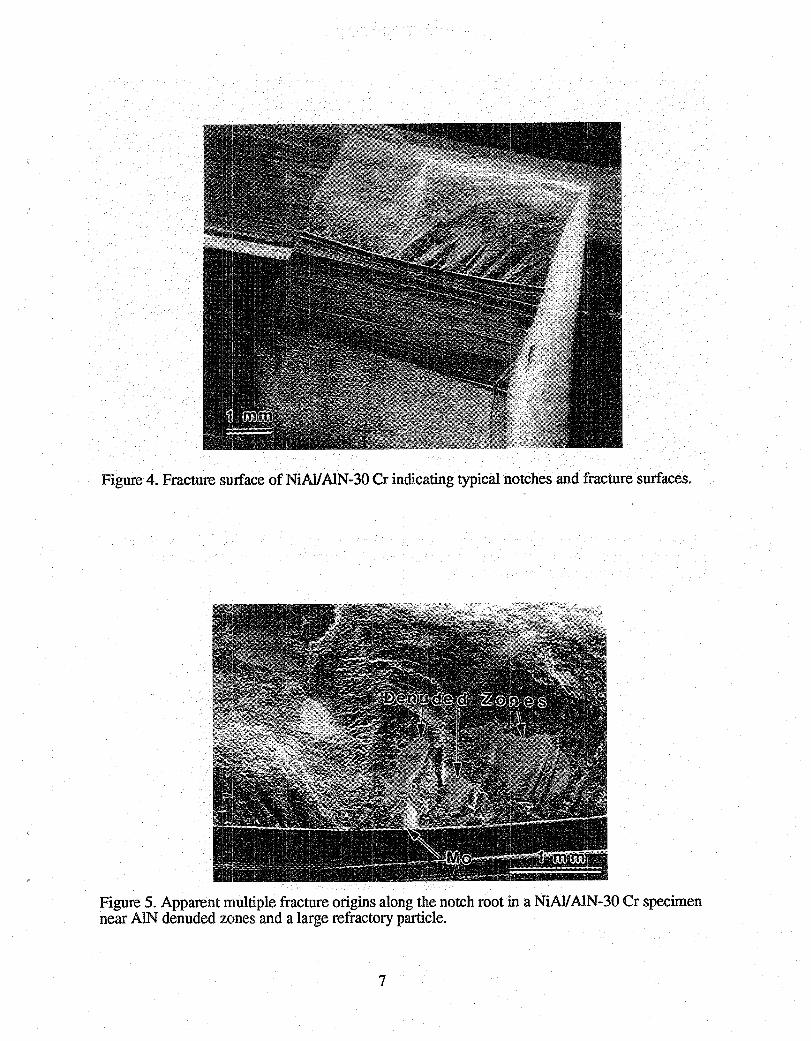
Figure 4. Fracture surface of NiAll AIN-30 Cr indicating typical notches and fracture surfaces.
Figure 5. Apparent multiple fracture origins along the notch root in a NiAllAlN-30 Cr specimen near AlN denuded zones and a large refractory particle.
7

a. b.
Figure 6. Debonding and necking of refractory metal particles in a NiAll AlN-12Mo specimen. a) Secondary electron image to show surface roughness, b) Backscattered electron image to highlight the presen<;e ofMo (white).
Figure 7. Fracture surface of NiAVAlN-12 Mo showing a large Mo particle and AlN denuded region at the notch root.
8
200
180
160
140 .. 120 D.
~
i 100 ! U; 80
~ 60 ... 40
20
0 0 5 10
_3.55.104 s-l --'-3.53·10~ s-l ___ 2.82·10-6 s-l
-+-3.53.10-7 s-l
15
True Compressive strain. %
20
Figure 8. True compressive stress-strain behavior for the NiAlIAlN-IOCr tested at l027°C.
180
160
140
120 .. D. ~ 100 • .,
80 l! u; • 60 :s .. ...
40
20
0 0 5 10
........ 3.53.104 s-l -+-353·10~ 5-1 .....0-2.82.10-6 5 -1 ....... 3.53.10-7 s-l
15
True Compressive Strain. %
20
Figure 9. True compressive stress-strain behavior for the NiAlIAlN-3OCr tested at l027°C.
9
250
200
:. 150 :E ,. I
100 en ! t-
50
o 5 10
___ 3.53*104 s-1
~3.53*10-5 s-1 -e.+2.83*10~ s-1 ~3.53*10-7 s-1
15
True Compressive Strain, %
20
Figure 10. True compressive stress-strain behavior for the NiAIIAlN-12Mo tested at 1027°C.
• CL ~
.-• • .. -en
• ~ • • • .. D-E 8 • :I .. I-
1000
100
---NIAl-10%A1N o + lOCr • +30Cr • +12Mo
- - - - - - NI-48.2SAI
• o
• ",.-- ".-- .. --
8 • • ... -- .-.- .. . -", .. -
•
_ .... .... --
• o • . ... --.. -
10+-----~~~~+-~~~~~~~~~~~~~~~~~
1.00E-07 1.00E-06 1.00E-OS 1.00E-04 1.00E-03
True Compressive Strain Rate, S-1
Figure 11. True compressive stress-strain rate behavior ofNiAVAlN materials [7,14].
10
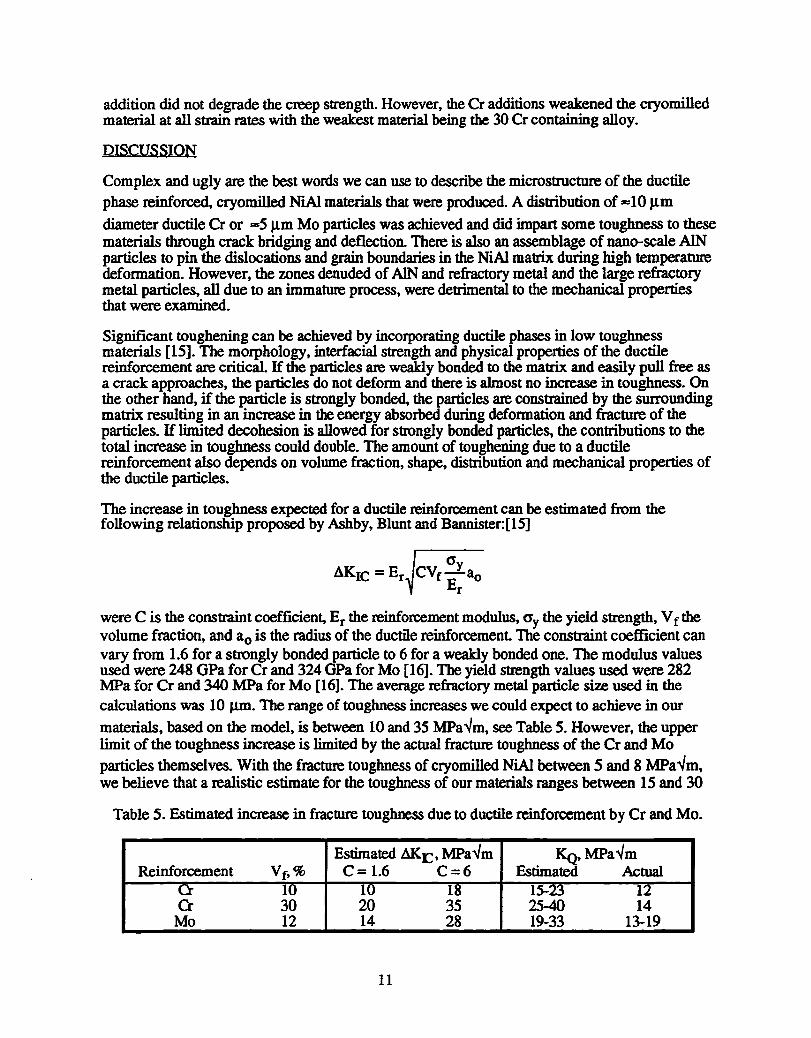
addition did not degrade the creep strength. However, the Cr additions weakened the cryomilled material at all strain rates with the weakest material being the 30 Cr containing alloy.
DISCUSSION
Complex and ugly are the best words we can use to describe the microstructure of the ductile phase reinforced, cryomilled NlAl materials that were produced. A distribution of = 1 0 J.Lm diameter ductile Cr or =5 J.Lm Mo particles was achieved and did impart some toughness to these materials through crack bridging and deflection. There is also an assemblage of nano-scale AlN particles to pin the dislocations and grain boundaries in the NiAl matrix during high temperature deformation. However, the zones denuded of AlN and refractory metal and the large refractory metal particles, all due to an immature process, were detrimental to the mechanical properties that were examined.
Significant toughening can be achieved by incorporating ductile phases in low toughness materials [15]. The morphology, interfacial strength and physical properties of the ductile reinforcement are critical. If the particles are weakly bonded to the matrix and easily pull free as a crack approaches, the particles do not deform and there is almost no increase in toughness. On the other hand, if the particle is strongly bonded, the particles are constrained by the surrounding matrix resulting in an increase in the energy absorbed during deformation and fracture of the particles. If limited decohesion is allowed for strongly bonded particles, the contributions to the total increase in toughness could double. The amount of toughening due to a ductile reinforcement also depends on volume fraction, shape, distribution and mechanical properties of the ductile particles.
The increase in toughness expected for a ductile reinforcement can be estimated from the following relationship proposed by Ashby, Blunt and Bannister:[15]
were C is the constraint coefficient, Er the reinforcement modulus, Gy the yield strength, V f the volume fraction, and ao is the radius of the ductile reinforcement The constraint coefficient can vary from 1.6 for a strongly bonded particle to 6 for a weakly bonded one. The modulus values used were 248 GPa for Cr and 324 GPa for Mo [16]. The yield strength values used were 282 MPa for Cr and 340 MPa for Mo [16]. The average refractory metal particle size used in the calculations was 10 JlID. The range of toughness increases we could expect to achieve in our materials, based on the model, is between 10 and 35 MPavm, see Table 5. However, the upper limit of the toughness increase is limited by the actual fracture toughness of the Cr and Mo particles themselves. With the fracture toughness of cryomilled NiAl between 5 and 8 MPavm, we believe that a realistic estimate for the toughness of our materials ranges between 15 and 30
Table 5. Estimated increase in fracture toughness due to ductile reinforcement by Cr and Mo.
Estimated AKI> MPavm Ko,MPa...Jm Reinforcement Vf,% C= 1.6 C=6 Estimated Actual
Cr 10 10 18 15-23 12 Cr 30 20 35 25-40 14
Mo 12 14 28 19-33 13-19
11
MPa"m. This range is less than that predicted by Ashby's equation due to the limited toughness of the refractory metals used. Processing, and therefore microstructural, improvements could push these types of materials into the upper end of this range.
The elevated temperature constant displacement rate compression tests for the ductile reinforced, cryomilled NiAl were done in order to help screen the materials for potential creep strength. The strongest material at I0270C (1880~ and all strain rates was the NiAlIAlN - 12 Mo material, Figure 12. Its strength was similar to the strength ofNiAl materials with 10 vol.% AlN produced by cryomilling [7]. On can infer from this result that the low level of AlN denuded zones «1 %) was not detrimental to the creep strength of the N"1A1IAlN - 12 Mo material. All three materials described in this paper were significantly stronger than polycrystalline Ni - 48.25 at. % AI [14]. However, the material containing 30 vol. % Cr was noticeably weaker than that with 10 vol. % Cr indicating that one may need to compromise on the amount of ductile phase reinforcement needed for toughening in order to maintain high temperature strength.
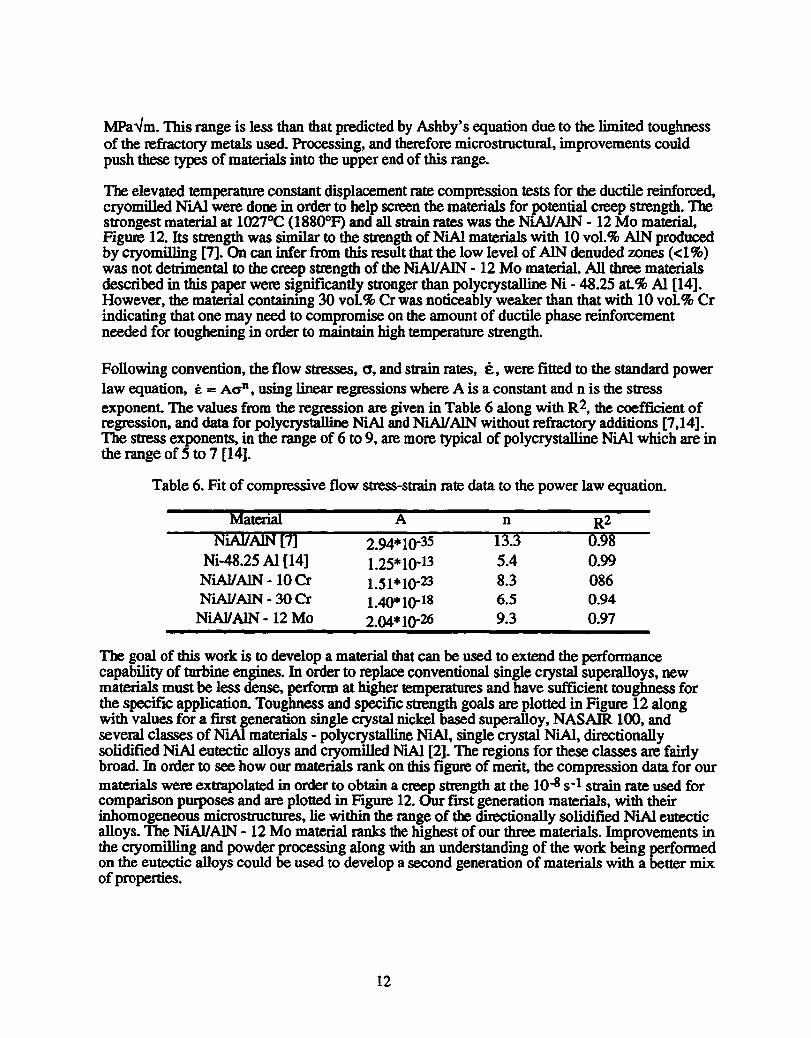
Following convention, the flow stresses, G, and strain rates, £, were fitted to the standard power law equation, t = AaD
, using linear regressions where A is a constant and n is the stress exponent. The values from the regression are given in Table 6 along with R 2, the coefficient of regression. and data for polycrystalline NiAl and NiAlIAlN without refractory additions [7,14]. The stress exponents, in the range of 6 to 9, are more typical of polycrystalline NiAl which are in the range of 5 to 7 [14].
Table 6. Fit of compressive flow stress-strain rate data to the power law equation.
Material A n R2 NiAl7AlN [7] 2.94*10-35 13.3 0.98
Ni-48.25 AI [14] 1.25*10-13 5.4 0.99 NiAll AlN - 10 Cr 1.51*10-23 8.3 086 NiAVAlN - 30 Cr 1.40*10-18 6.5 0.94
NiA1IAlN - 12 Mo 2.04*10-26 9.3 0.97
The goal of this work is to develop a material that can be used to extend the performance capability of turbine engines. In order to replace conventional single crystal superalloys, new materials must be less dense, perform at higher temperatures and have sufficient toughness for the specific application. Toughness and specific strength goals are plotted in Figure 12 along with values for a first generation single crystal nickel based superalloy, NASAIR 100, and several classes of NlAl materials - polycrystalline NiAl, single crystal NiAl, directionally solidified NtAl eutectic alloys and cryomilled NlAl [2]. The regions for these classes are fairly broad. In order to see how our materials rank on this figure of merit, the compression data for our materials were extrapolated in order to obtain a creep strength at the 10-8 s-1 strain rate used for comparison purposes and are plotted in Figure 12. Our first generation materials, with their inhomogeneous microstructures, lie within the range of the directionally solidified NiAl eutectic alloys. The NiAlIAlN - 12 Mo material ranks the highest of our three materials. Improvements in the cryomilling and powder processing along with an understanding of the work being performed on the eutectic alloys could be used to develop a second generation of materials with a better mix of properties.
12
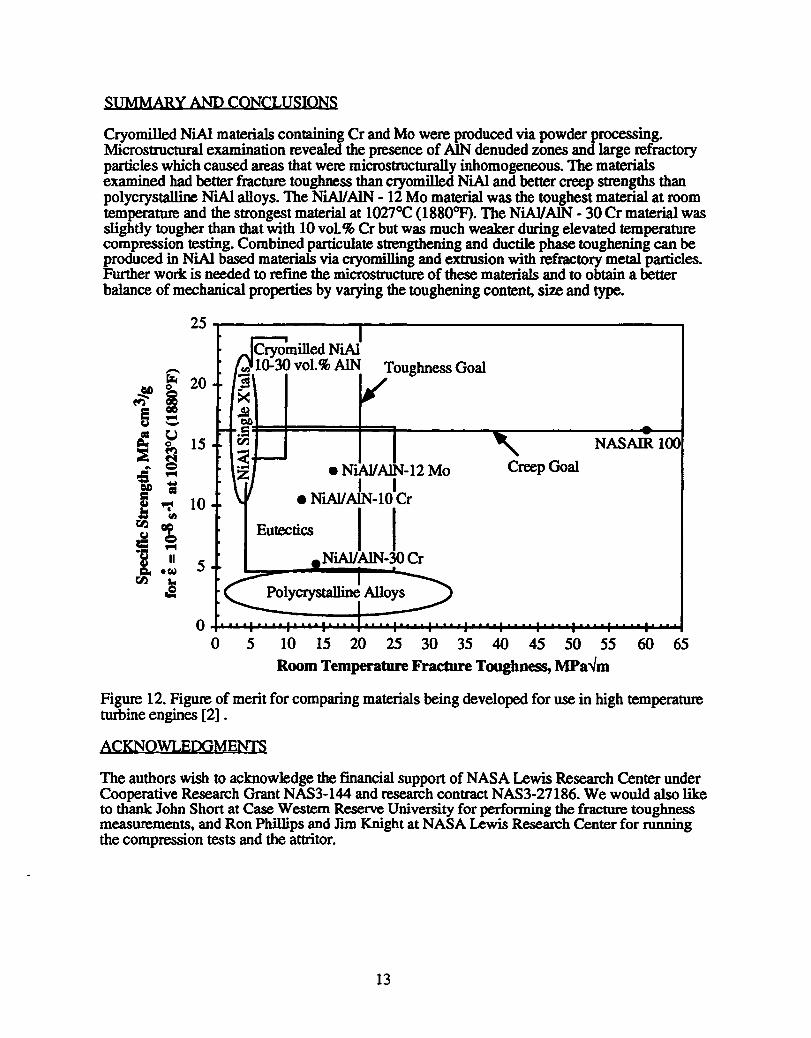
SUMMARY AND CONCLUSIONS
Cryomilled NiAl materials containing Cr and Mo were produced via powder processing. Microstructural examination revealed the presence of AlN denuded zones and large refractory particles which caused areas that were microstructurally inhomogeneous. The materials examined had better fracture toughness than cryomilled NW and better creep strengths than polycrystalline NiAl alloys. The NiA1IAlN - 12 Mo material was the toughest material at room temperature and the strongest material at 1027°C (1880°F). The NiAVAlN - 30 Cr material was slightly tougher than that with 10 voL % Cr but was much weaker during elevated temperature compression testing. Combined particulate strengthening and ductile phase toughening can be produced in NiAl based materials via cryomilling and extrusion with refractory metal particles. Further work is needed to refme the microstructure of these materials and to obtain a better balance of mechanical properties by varying the toughening content, size and type.
25
- Toughness Goal ~ 20
..!!I ° f') i e .-I u -~
t,) 15 NASAIR 100 ° f') .. a • NiAVAlN-12 Mo Creep Goal
05 .-I .... I I ell ell
! ~ 10 • NlAlIAlN-IOCr fIl I rIl \ u e: .-I -2 " 5 NiAlIAlN-30 Cr
Q.. eW rIl ... .s
0 0 5 10 15 20 25 30 35 40 45 50 55 60 65
Room Temperature Fracture Toughness, MPavm
Figure 12. Figure of merit for comparing materials being developed for use in high temperature turbine engines [2] .
ACKNOWLEDGMENTS
The authors wish to acknowledge the fmancial support of NASA Lewis Research Center under Cooperative Research Grant NAS3-144 and research contract NAS3-27186. We would also like to thank John Short at Case Western Reserve University for perfonning the fracture toughness measurements, and Ron Phillips and Tun Knight at NASA Lewis Research Center for running the compression tests and the attritor.
13
REFERENCES
1. 1.J. Lewandowski, O.M. Michal, I. Locci and J.D. Rigney, Alloy Phil$ Stability and IX8im. eds. OM. Stocks, A.F. Giamei, and D.P. Pope, Materials Research Society, vol. 186 (1990) 341-347.
2. R.D. Noebe, M.O. Hebsur, J.D. Whittenberger, M.V. Nathal and B. Oliver, HITEMP Reyiew 1994 Adyanced row Temperature En&ine Materials Iechnolo&y Prouam Volume II: CompressorO'urbine Materials-Metals and MMC's, NASA CP-I0146 (1994) 54-1 to 54-14.
3. D.R. Johnson, S.M. Joslin, B.F. Oliver, R.D. Noebe and 1.0. Whittenberger, Eimt International Conference on Processin& Materials for Properties," eds. H. Henein and I. Oti. The Minerals, Metals & Materials Society (1993) 865-870.
4. P.R. Subramanian, M.O. Mendiratta, and D.B. Miracle, Metall. and Mat. Trans. A, vol. 2SA (1994) 2769-2781.
5. S. Dymek, M. Dollar, S.J. Hwang and P. Nash, Mat Res. Soc. Symp. Proc., vol. 288 (1993) 1117-1122.
6. J. D. Whittenberger, Structural Inteaneta.llics, eds. R. Darolia, 1.1. Lewandowski, C.T. Liu, P.L. Martin, D.B. Miracle and M.V. Nathal, The Minerals, Metals & Materials Society, (1993) 819-828.
7. J. D. Whittenberger, E. Artz and M.J. Luton, J. Mater. Res., vol. 5 (1990) 2819-2827. 8. H. Clemens,I. Rumberg, P. Schretter, P. Grable, O. Lang, A Wanner and E.Arzt, Mat
Res. Soc. Symp. Proc., vo1288 (1993) 1087-1092. 9. V.C. Nardone, Composites Science and Technology, vo152 (1994) 151-161. 10. BJ.M. Aikin, R.M. Dickerson, D.T. Jayne, S. Fanner and 1.0. Whittenberger, Scripta
Metall. et Mat, vol. 30 (1994) 119-122. 11. BJ.M. Aikin, 1.0. Whittenberger and M.G. Hebsur, Proceedin&S of the 2nd International
Conference on Structural &wJications of Mechanical AlloyinK, eds. J.l. deBarbadillo and F.H. Froes, ASM International, Materials Park, OH, (1993) 283-290.
12. 1.0. Whittenberger, Mater. Sci. Eng., vol. 57 (1983) 77. 13. J.D. Whittenberger, Mater. Sci. Eng., vol. 73 (1985) 87. 14. J.D. Whittenberger, J. of Mater. Sci., vol 22 (1987) 394-402. 15. M.F. Ashby, FJ. Blunt and M. Bannister, Acta Metall., vol. 37 (1989) 1847-1857. 16. H.E. Boyer and T.L. Gall, Metals Handbook Desk Edition. American Society for Metals,
Metals Park, OB, (1985) 1-45,47: 14-5,9.
14
REPORT DOCUMENTATION PAGE Form Approved OMS No 0704-0188
Pubhc repol'lln9 burden for this coIlecIJon 01 InformabOn IS eetmalad to average 1 hoUr per response. including the bma tor r-mg instruc:lions, I81UChllg exlsbng data sources. galhenng and maintalmng the data 11MCIed. and ~Ing and nMewfng the coIlecIIon 01 InIormaIIon Send comments regarding 111. burden estmaIe or any other aspect 01 111. collectlOll oIlnformallOn. Including 8U~ lor reducing thIS burden. to Washington Headquarters SeMces. Dirac:toral8 lor InlormaIIOn 0peraIi0n& and Reports. 1215 JIIIerson DaVIS Highway. Suite 1204. Arington. A 22202-4302. and to the OffICII 01 Management and Budge!. Paperwork RaducbOn PIOf8CI (07~188). Washington. DC 20503.
1 AGENCY USE ONLY (Lsaw blanK) 12. REPORT DATE 13. REPORT TYPE AND DATES COVERED
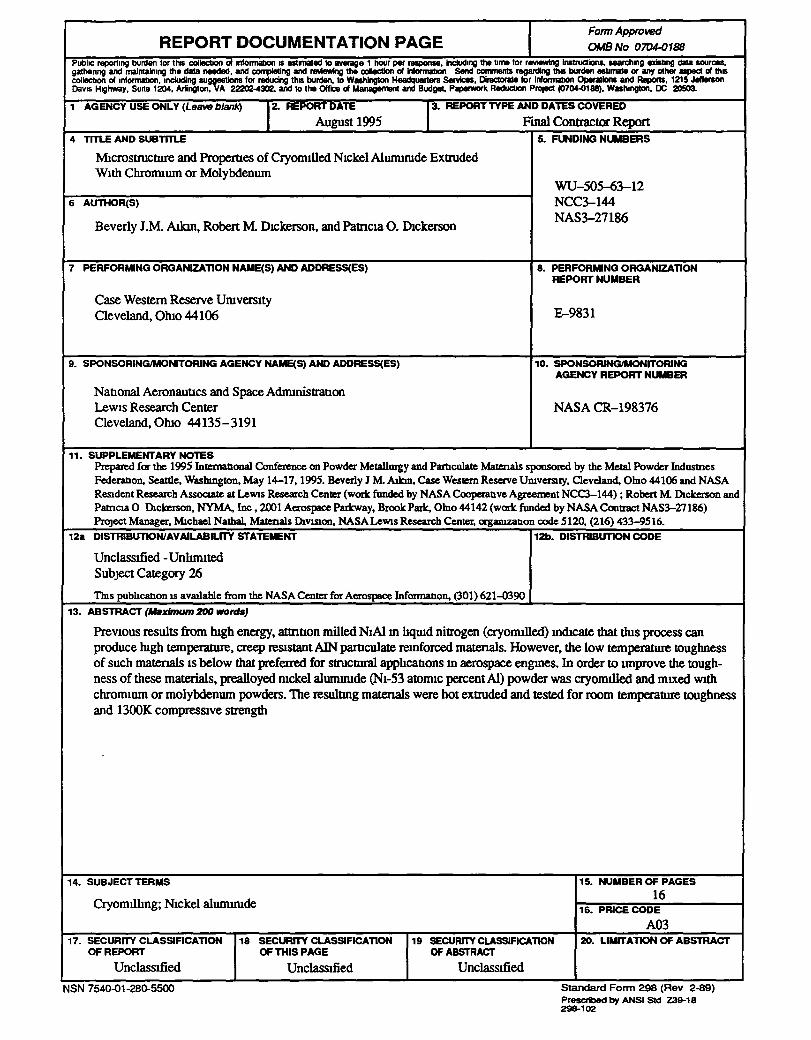
August 1995 Final Contractor Report 4 TITLE AND SUBlTTLE 5. FUNDING NUMBERS
Microstructure and Propernes of Cryomdled NIckel AIummIde Extruded WIth ChromIum or Molybdenum
WU-50~3-12 6 AUTHOR(S) NCC3--144
Beverly J .M. Allan, Robert M DICkerson, and PaUlCla O. DIckerson NAS3-27186
7 PERFORMING ORGANIZATION NAME(S) AND ADDRESS(ES) 8. PERFORMING ORGANIZATION REPORT NUMBER
Case Western Reserve UruversIty Cleveland, OhIO 44106 E-9831
9. SPONSORINGJMONITORING AGENCY NAME(S) AND ADDRESS(ES) 10. SPONSORINGIMONITORING AGENCY REPORT NUMBER
NatIonal AeronautIcs and Space AdnnnistratIon LeWIS Research Center NASA CR-198376 Cleveland, OhIo 44135-3191
11. SUPPLEMENTARY NOTES Prepared for the 1995 Intcmanonal Conference on Powder MetallDIgy and Partlculate Matenals sponsored by the Metal Powder Industnes Federabon, Seattle, Waslnngton, May 14-17, 1995. Beverly J M Allan. Case Western Reserve UmveISJ.ty. Cleveland, Olno 44106 and NASA Re51dent Research ASSOClate at LeWIS Research CenlCr (work funded by NASA Cooperab.ve Agreement NCC3-144) ; Robert M Dlckerson and PatnCla 0 Dlckerson. NYMA. Inc. 2001 Aerospace Parkway. BrookParlt, Olno 44142 (work funded by NASA Contract NAS3-27186) Project Manager. MIchael Nathal, Matenals DlVlSlOll. NASALew1s Research CenlCr. cqamzatlon code 5120. (216) 433-9516.
12. DISTRlBUTIONlAV A1LABIUTY STATEMENT 12b. DISTRIBUTION CODE
UnclasSIfied -Unwmted SubjeCt Category 26
TIns pubhcab.on IS avallable from the NASA Center for Aerospace Infonnab.on. (301) 621~90
13. ABSTRACT {IIaxlmum 200 words}
PreVIOUS results from bIgh energy, attrItIon milled NIAI 10 hqwd nitrogen (cryomIlled) 10dIcate that dus process can produce hIgh temperature, creep resIStant AIN partIculate remforced materIals. However, the low temperature toughness of such matenals IS below that preferred for structural apphcatIons 10 aerospace engmes. In order to unprove the tough-ness of these materials, prealloyed ruckel alumlDlde (NI-53 atomIC percent AI) powder was cryomdled and mIXed WIth chromIum or molylxlenwn powders. The resulung matenals were hot extruded and tested for room temperature toughness and 1300K compresSIve strength
-
14. SUBJECT TERMS
CryomIlhng; NIckel alumlDlde
17. SECURrTY CLASSIFICATION 18 SECURrTY CLASSIFICATION OF REPORT OF THIS PAGE
UnclasSIfied UnclassIfied
NSN 7540-01-280-5500
19 SECURITY CLASSIFICATION OF ABSTRACT
UnclassIfied
15. NUMBER OF PAGES
16 16. PRICE CODE
A03 20. LIMITATION OF ABSTRACT
Standard Form 298 (Rev 2-89) Prescrbed by ANSI Std Z3&-18 298-102

End of Document