Embed Size (px)
Citation preview

1
Microstructure, Mechanical and Tribological Properties of Reactive
Magnetron Sputtered Titanium Carbide Coatings
K. Polychronopoulou1,3*
, N. Demas1, S. Hinder
2, M.Baker
2, C. Rebholz
3, K. Böbel
4, A.A.
Polycarpou1
1Department of Mechanical Science and Engineering, University of Illinois at Urbana-
Champaign, Urbana, IL 61801, U.S.A.
2 The Surface Analysis Laboratory, University of Surrey, Guildford, UK
3Department of Mechanical and Manufacturing Engineering, University of Cyprus, 1678,
Nicosia, Cyprus
4Department PA-ATMO1/SGP21, Engineering Process Technology, Robert Bosch GmbH,
Postfach 300220, 70442 Stuttgart, GERMANY
*corresponding author: e-mail: [email protected], tel.:00357-22892197, fax: 0035722-
892254.
Abstract
This study describes the correlation between the microstructure, mechanical and
tribological properties of Ti1-xCx coatings (with x being in the range of 0-1), deposited by
reactive magnetron sputtering from a Ti target in Ar/C2H2 mixtures at ~200 °C. The
mechanical and tribological properties were found to strongly depend on the chemical
composition and the microstructure present. Very dense structures and high hardness and
elastic modulus values, combined with low wear rates, were observed for films with
chemical composition close to TiC. X-ray diffraction studies showed that the coating
deposited at high C2H2 flow rates composed of randomly oriented TiC crystallites.
Morphological investigations by scanning electron microscopy indicate that the
morphology is strongly dependent on the carbon content of the coating. Coatings overall
composition, and relative phase fraction are investigated using X-ray photoelectron
spectroscopy. The presence of free amorphous carbon as DLC was found in the case of the
coatings deposited at 43 and 50 sccm of C2H2, where this is not the case for coatings
deposited at lower C2H2 flow rates. Both the mechanical properties and tribological
2
performance of the coatings were found to be dependent on carbon content and the
optimum performance was that of the coating deposited at 43 sccm where a nanocomposite
dual system is formed.
Keywords: carbides, nanocrystalline, sputtering, tribology.
Introduction
Hard and low-friction carbon-based tribological (solid lubricant) thin films and
coatings, the subject of a large amount of research over the last approximately 25 years [1]
cover a wide range of industrial applications such as automotive, forming, punching, plastic
moulding, biocompatible implants, and computer hard drives. Hard carbon based coatings
have previously been shown to substantially increase contact fatigue life when applied to
steel substates [2]. Metal-free and metal-containing hard carbon based coatings have been
intensively studied. Metal-containing coatings are reported to possess better adhesion to
steel substrates than metal free hard carbon based coatings [3].
Transition metal carbides, such as TiC, characterized by short bonds, high hardness,
high strength and high thermal and chemical stability, are widely used as wear resistant
materials in, for example, carbide cutting tools [4]. One class of metal containing hard
carbon based coatings are deposited by sputtering pure metal cathodes in inert/hydrobarbon
gas mixtures, where coating deposition results from the reaction, at the substrate surface, of
sputtered metal atom flux with gas phase ionic and radical hydrocarbon species generated
from the glow discharge plasma [5]. In the last few years, advances in coating deposition
technologies have resulted in the development of supertough wear-resistant coatings, based
on nanocrystalline carbides (TiC, WC) in an amorphous diamond-like carbon matrix [6].
Another approach has been based on metal–metal nanocomposite coatings, promising
considerable scope to provide a low coating elastic modulus, while allowing ceramic values
of hardness to be achieved. Various studies have shown that physical vapor deposited
(PVD) metallic coatings doped with nitrogen, carbon or boron (primarily in supersaturated
interstitial solid solution) can provide ceramic or near-ceramic hardness, while retaining a
low elastic modulus similar to that of the metal substrate component [7, 8]. These coatings

3
performed better in laboratory tribological tests compared to (often much harder) ceramic
nitride, carbide or boride equivalents, with a correspondingly higher elastic modulus [7, 8].
In this study, we report the synthesis of TiC coatings by sputtering pure Ti cathode
in the presence of different Ar/C2H2 flow ratios. Experimental results for the influence of
various amounts of carbon on the structure, mechanical and tribological properties of PVD
deposited Ti1-xCx films are presented. The overall result of this investigation can be
summarized by stating that coatings deposited at intermediate C2H2 flow rates presented a
denser structure and in turn possessed improved mechanical properties and better
tribological performance.
Experimental
Coating Synthesis
Ti-C coatings were deposited onto polished 100Cr6 substrates by reactive magnetron
sputtering from a segmented Ti target (5.7 W/cm2) of 1000 mm x 175 mm x 11 mm in
argon/acetylene (Ar/C2H2) mixtures, using an industrial magnetron sputtering PVD unit
with a base pressure of < 10-5
mbar and deposition pressure of 3-3.5 x 10⁻³
mbar, depending
on the acetylene flow rate (varied from 0 to 63 sccm). Substrate temperature and target to
substrate distance were kept constant at ~ 200 °C and 200 mm, respectively, and no
substrate bias voltage was applied. Prior to deposition, the 100Cr6 stainless steel substrates
were ultrasonically cleaned in acetone and then in ethanol, then placed in the chamber on
the substrate table. Coatings for mechanical tests were then deposited to a thickness of 2 to
3.0 µm.
Coating Analysis
The crystallographic structure and texture of the films were analysed by glancing-angle X-
ray diffraction (GAXRD), using CuKα
radiation at an incident angle of 5.0°. Chemical
composition of the Ti-C coatings was determined by X-ray photoelectron spectroscopy
(XPS), using a VG-Scientific Sigma Probe spectrometer employing a monochromated Al-
Kα source and a hemispherical analyser. Etching was performed at 3kV on a main chamber
pressure of 1x10⁻⁷
mbar giving ~0.75 µA of etch current and using the x10 magnification

4
setting (~5mm etch area). The microstructure was investigated using Transmission electron
micfroscopy (TEM). [u1]Fracture cross-sections of coated samples were prepared for SEM
morphology and topography studies. Film thickness was measured using a Calotester from
CSM (and verified by SEM cross-sectional measurements). The ball-crater method was
applied using the Calotester to determine the thickness of different layers. The procedure
was performed using a 20 mm diameter ball with 1000 1/min and 60 s of grinding period.
Coating adhesion was evaluated according to the Rockwell C hardness test [9], where a
coated sample is placed under the Rockwell indenter and a pilot load is applied before the
main load is introduced. Coating cracks and/or delamination is compared against a defined
adhesion strength quality, with a classification from HF1 to HF6, where HF1 indicates
good adhesion, with only radial cracks around the indent and HF6 indicates poor adhesion.
Hardness and elastic modulus values were determined using a Fischerscope H100 and a
Clark Digital Microhardness Tester, both equipped with a Vickers indenter, and a Hysitron
TriboScope, equipped with a Berkovich indenter. Loads were varied between 10 to 50 mN
(Fisherscope and Clark Digital Microhardness Tester) and 3 to 6 mN (Triboscope), with a
sequence of ten indents at each load.
Ball-on-disc dry sliding experiments were conducted at room temperature (22oC) at
a controlled humidity 20% using a Standard Tribometer, shown in Figure 1. The sliding
velocity was 0.1 m/s and a track radius of 11 mm. For better control of the experimental
conditions Ruby balls were used so the only contribution to wear is from the coating. Ruby
balls of 0.6 mm diameter were chosen as counterpart. The abrasive conditions of the Ruby
counterpart were simulated using a load of 10 N corresponding to an initial Hertzian
pressure of ….MPa[u2]. The resulting wear marks were analysed by optical microscopy and
the coating wear volumes were in turn evaluated by stylus profilometry (TENCOR P-15).
Results and Discussion
Microstructure
Figure 2 shows the X-ray diffraction (XRD) patterns of the Ti-C coatings as deposited on
100Cr6 substrate at different C2H2/Ar flow rates. The standard 2θ positions for fcc (cubic)
TiC (JCPDS # 32-1383) is added to the figure The coating deposited at zero C2H2 flow rate
the main crystalline phase was, as expected, metallic Ti (101) as indicated by reflection

5
which corresponds to Ti at 39.5o. Ti-C coatings deposited at low C2H2 flow rates (25 and 37
sccm) present reflections which correspond to understoichiometric TiC0.2 and TiC0.7,
phases (as shown from XPS studies), respectively. The peaks now presented to be shifted
from 39.5 (pure Ti) to 36.9o (25 sccm) and 36.1
o (37 sccm), respectively. The coatings
deposited at high C2H2 flow rates (43 and 50 sccm) exhibited reflections which correspond
to randomly oriented TiC crystallites. As the flow rate of C2H2 increased the diffraction
peak appeared at a lower angle. This is in agreement with an increase in the TiC lattice
parameters as more carbon is incorporated in the lattice leading to the formation of
stoichiometric and overstoichiometric TiC crystallites. In all cases no graphitic carbon peak
or amorphous carbon was observed. To determine the crystallinity grade of the produced
coatings, the grain size was determined from the Full Width Half Maximum (FWHM) of
the X-ray peaks throughout the equation [10]:
FWHMcos9.0sizegrain
θλ=
where, λ is the wavelength of the incident radiation and θ is the Bragg’s angle. FWHM
analysis indicated that the TiC-crystallite size is in the range of 7-18 nm. However, this
particle size is different from that estimated from TEM studies. This suggests that the
microstructure consists of stressed nanometer-sized metal carbide crystallites embedded in
a matrix of amorphous carbon. This is in agreement with other similar systems in the
published literature [11-13].
Laser Raman Spectroscopy was performed to clarify the binding state of the
amorphous carbon and the results are shown in Figure 3. Raman bands of about 1550 cm-1
which appeared in the TiC (43 sccm) are attributed to the amorphous carbon with high
hardness, i.e., i-carbon or diamond like carbon probably with the bond of sp3 hybrid orbital
[14]. However, Raman bands of about 1380 and 1600 cm-1
which appeared in the case of
TiC (deposited at 100 sccm) indicate that disordered graphite exists in this coating [14].
SEM
Figure 4 shows representative scanning electron microphotographs obtained over
the cross-sections of two different coatings. As it is clearly seen in Fig. 4(a), the coating
deposited at zero C2H2 flow rate exhibits columnar microstructure which is typical for a

6
microcrystalline coating, whereas Ti-C coating deposited at 43 sccm C2H2 (Fig. 4(b))
exhibits a featureless “glassy” structure which is typical for a nanocrystalline growth mode.
From SEM studies performed on all the coatings under study it was found that coatings
deposited at C2H2 flow rates lower than 43 sccm presented a columnar microstructure
where the size of the columns appears to depend on the metal and carbon content of the
coating. The observed gradual change from a columnar towards to a non-columnar
morphology at higher C2H2 flow rates is probably due to increasingly concurrent growth
conditions of two different phases, amorphous carbon and TiC.
TEM
Figure 5 presents dark field transmission electron microscopy images obtained over
TiC coatings deposited at 25 (Fig. 5a) and 43 (Fig. 5b) sccm flow rate of C2H2,
respectively. From these images the average grain size is estimated to be approximately 6
nm and 4 nm for the first and the second coating, respectively. This difference in average
grain size can be rationalized from the fact that in coating deposited at 25, there is only the
TiCx phase, whilst for coating deposited at 43, both TiCx and DLC are present, so
competitive grain growth leads to smaller grain sizes.
XPS
The chemical bonding structure of the near surface region of the coatings was studied by
XPS. Error! Reference source not found. shows the respective T 2p (Fig. 6a) and C 1s
(Fig. 6b) core-level spectra of the coatings deposited at different C2H2 flow rates. XPS
analysis was performed, after sputter cleaning of the surface with an Ar ion rastered beam.
The photoelectron peak Ti2p3/2 of a binding energy close to 454 eV corresponds to the
carbide [15]. As the C concentration is increased, the Ti 2p peak shifts to higher binding
energy, whereas the C 1s carbidic peak remains at the same energy. This is consistent with a
progressive change in the TiCx stoichiometry. As x increases (from sub-stoichiometric
towards stoichiometric and over-stoichimetric), then the nearest neighbour environment of
C atoms within TiCx will remain almost unchanged, but for the Ti atoms, there is an
increasing number of nearest neighbour C atoms, hence the Ti 2p3/2 peak shifts to higher
binding energies.

7
XPS results obtained on samples deposited at different C2H2 flow rates clearly
revealed that C 1s presents more than one components, as clearly seen in Fig. 7. The fitted
peak areas are a qualitative measure for the abundance of the individual bonds in the near
surface region of each sample. The peak fitting of C 1s region was based on the binding
energies of different C species, such as: bulk TiC at 282.1±0.2 eV, C atoms at the edge of
the TiC nanocrystallites at 283.1±0.2 eV, sp2 C at 284.5±0.2eV and sp
3 C at 285.2±0.2eV
[15, 16, 17]. Figure 7 presents the peak fitting of C 1s region for the coatings deposited at
25 and 43 sccm, respectively. It can be observed that the C 1s region of coating deposited at
25 sccm C2H2 presents contributions only from bulk TiC (282 eV) and Ti at the edge of TiC
grains (283 eV). On the other case presented, coating deposited at 43 sccm C2H2,
contributions from bulk Ti, Ti at the edge of TiC grains, sp2 C, and sp
3 C can be seen.
Results of the overall TiCx stoichiometry and relative phase fraction are given in Table 1.
Relative phase fraction was based on the assumption that a simple two phase system is
present (TiC and DLC). According to the literature peaks at 282.1 and 283.1 eV give the
carbide content and peaks at 284.4 and 285.2 eV give the DLC content [18].
Hardness and Elastic Modulus
Hardness and elastic modulus values, determined using a Fischerscope H100, as a
function of C2H2 flow rate are plotted in Figure 8. Evaluation of these measurements was
done using a Hysitron Triboscope instrument. For pure Ti coating (0 sccm C2H2), hardness
values of approximately 6 GPa were observed (similar to bulk values). This low hardness
value can be attributed to the soft metallic character of the coating according to XRD
studies presented. With increasing C2H2 flow rate, the amount of carbon in solid solution
in the titanium lattice increased. This is also in agreement with the 2 theta shift of XRD
peaks at lower angles, as previously discussed. Hence, the hardness increase can be
explained in terms of solid solution strengthening of the Ti coating with C-atoms. Another
reason for hardness increase is the changing of carbon binding state from graphite to
amorphous. A further increase in carbon led to an increase in hardness for coatings
consisting of the TiC phase (43 sccm C2H2). For this coating, XPS studies revealed the
presence of nanocrystalline TiC and 13 at.% of amorphous DLC phase. The amount of
amorphous phase coincides with a monolayer surrounding the nanocrystallites leading in

8
this way to hardness improvement [19]. This structure generates increased hardness
because the mobility of dislocations is hindered and the grain boundary sliding is
suppressed at the decreased grain size.
Also, from Error! Reference source not found. it is clear that increasing the C2H2
flow rate (from 0 to 43 sccm) causes a rather significant increase in the elastic modulus
values (from 131±7 to 249±12 GPa). On the other hand, for coatings deposited at high
C2H2 flow rates a decrease in elastic modulus is observed. For coatings deposited at 43, 50,
and 100 C2H2 flow rate the crystallite size of TiCx, as estimated using Scherrer equation
Error! Reference source not found., was found to be smaller than the one of the coatings
deposited at low C2H2 flow rate due to competitive grain growth in these cases. Strong
correlations between the variations of the elastic properties and the variations in the film
thickness, grain size, has been previously reported 0.
According to the literature [21] the Ti dissolution limit in an a-C matrix is 4 - 8
at.%. As the Ti composition increases beyond the dissolution limit, the volume fraction of
TiC nanometer sized crystallites embedded within the a-C matrix increases. With increasing
TiC nanocluster volume fraction, the average coating modulus and hardness increase
significantly. Increasing C2H2 flow rate in values higher than 43 sccm, a decrease in
hardness and elastic modulus values was observed. The exact physical mechanism
responsible for such decreases are unclear, but are likely to be related to the change in
bonding configurations in the near region of TiC crystallites. Also, this decrease could be
attributed to the change from a uniform to a non-uniform lattice expansion as more C in
incorporated into the TiC lattice leading to the formation of overstoichiometric
nanocrystallites [22].
An important parameter describing the plasticity of the material is H/E ratio. For the
coatings studied here this ratio was found to increase in the 0.05-0.15 range as C2H2 flow
rate increases. Highest H/E values ratio (elastic behaviour 0) was found for coatings
deposited at C2H2 flow rates in the 43-100 sccm range. The coatings deposited at a lower
C2H2 flow rates, exhibit the lowest H/E values corroborating their more plastic behaviour.
Tribological Performance[u3]
9
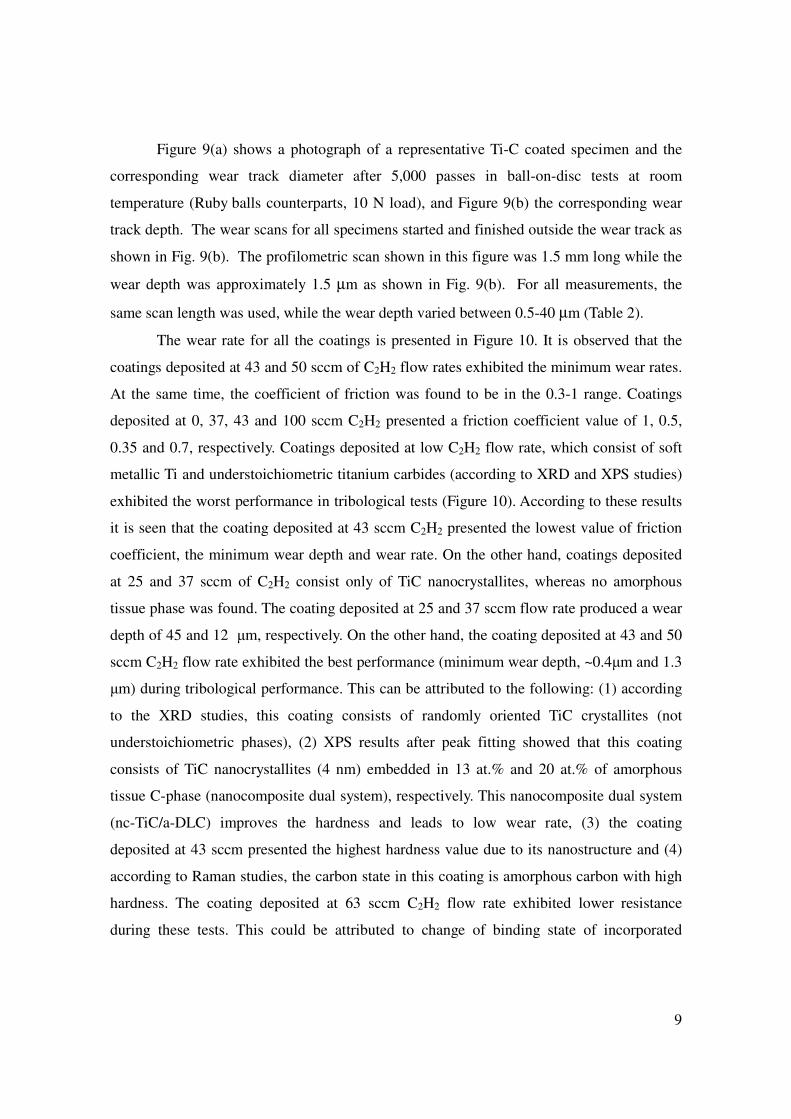
Figure 9(a) shows a photograph of a representative Ti-C coated specimen and the
corresponding wear track diameter after 5,000 passes in ball-on-disc tests at room
temperature (Ruby balls counterparts, 10 N load), and Figure 9(b) the corresponding wear
track depth. The wear scans for all specimens started and finished outside the wear track as
shown in Fig. 9(b). The profilometric scan shown in this figure was 1.5 mm long while the
wear depth was approximately 1.5 µm as shown in Fig. 9(b). For all measurements, the
same scan length was used, while the wear depth varied between 0.5-40 µm (Table 2).
The wear rate for all the coatings is presented in Figure 10. It is observed that the
coatings deposited at 43 and 50 sccm of C2H2 flow rates exhibited the minimum wear rates.
At the same time, the coefficient of friction was found to be in the 0.3-1 range. Coatings
deposited at 0, 37, 43 and 100 sccm C2H2 presented a friction coefficient value of 1, 0.5,
0.35 and 0.7, respectively. Coatings deposited at low C2H2 flow rate, which consist of soft
metallic Ti and understoichiometric titanium carbides (according to XRD and XPS studies)
exhibited the worst performance in tribological tests (Figure 10). According to these results
it is seen that the coating deposited at 43 sccm C2H2 presented the lowest value of friction
coefficient, the minimum wear depth and wear rate. On the other hand, coatings deposited
at 25 and 37 sccm of C2H2 consist only of TiC nanocrystallites, whereas no amorphous
tissue phase was found. The coating deposited at 25 and 37 sccm flow rate produced a wear
depth of 45 and 12 µm, respectively. On the other hand, the coating deposited at 43 and 50
sccm C2H2 flow rate exhibited the best performance (minimum wear depth, ~0.4µm and 1.3
µm) during tribological performance. This can be attributed to the following: (1) according
to the XRD studies, this coating consists of randomly oriented TiC crystallites (not
understoichiometric phases), (2) XPS results after peak fitting showed that this coating
consists of TiC nanocrystallites (4 nm) embedded in 13 at.% and 20 at.% of amorphous
tissue C-phase (nanocomposite dual system), respectively. This nanocomposite dual system
(nc-TiC/a-DLC) improves the hardness and leads to low wear rate, (3) the coating
deposited at 43 sccm presented the highest hardness value due to its nanostructure and (4)
according to Raman studies, the carbon state in this coating is amorphous carbon with high
hardness. The coating deposited at 63 sccm C2H2 flow rate exhibited lower resistance
during these tests. This could be attributed to change of binding state of incorporated

10
carbon in TiC coatings. These states could be graphite-like, diamond like or interstitial
carbon [14].
Conclusions
In summary, we report results on the influence of the structure and chemistry on
mechanical and tribological properties of magnetron sputtered Ti1-xCx coatings. We showed
that the coatings structure gradually changes from understoichiometric titanium carbide
towards stoichiometric and overstoichiometric TiC with increasing C2H2 flow rates, while
an addition al amorphous DLC phase can be formed at intermediate C2H2 flow rates
changing the whole system from one phase (TiCx) to two phase (nc-TiCx/a-DLC)
nanocomposite system. These structural changes are accompanied by very dense coating
growth modes which lead to with highest hardness and elastic modulus, combined with low
wear rates and friction coefficient values.
Acknowledgements
The authors gratefully acknowledge financial support from the Cyprus Fulbright
Committee, the Air Conditioning and Refrigeration Center, an Industry-University
Cooperative Research Center at the University of Illinois at Urbana-Champaign, the Center
for Microanalysis of Materials, University of Illinois, which is partially supported by the
U.S. Department of Energy under grant DEFG02-91-ER45439 and FP6 Marie Curie
Actions (project EXT-0023899 - NanoHeaters) of European Commission.

11
References
[1] C. Donnet, A.Erdemir, Surf. Coat. Technol. 180/181 (2004) 76.
[2] R. Wei, P.J. Wilbur, F.M. Kustas, J. Tribol.:ASME 114 (1992) 298.
[3] C.P.Klages, R. Memming, Mater. Sci. Forum 52/53 (1989) 609.
[4] A.Mani, P. Aubert, F.Mercier, H.Khodja, C.Berthierd, P. Houdy, Surface & Coatings
Technology 194 (2005)190.
[5] K.Bewilogua, H.Dimigen, Surf. Coat. Technol. 61 (1993) 144.
[6] A.A.Voevodin, J.S. Zabinski, Thin Solid Films 370 (2000) 223.
[7] A. Leyland, A. Matthews, Wear 1-2 (2000) 1.
[8] A.Leyland, A.Matthews, Surface and Coatings Technology 177-188 (2004) 317.
[9] Grenzmusterkatalog Haftfestigkeit, EPT21-ATMO, Robert Bosch GmbH, Stuttgart-
Germany, 2005.
[10] H.P. Klug, L.E. Alexander, X-ray Diffraction Procedure, Wiley, London, 1988.
[11] D. Nilsson, E. Coronel, U. Wiklund, Proceedings of the 6th
International Tribology
Conference-AUSTRIB’02, vol. I, 95.
[12] A.A. Voevodin, S.V. Prasad, J.S. Zabinski, J. Appl. Phys. 82 (1997) 855.
[13] B. Feng, D.M. Cao, W.J. Meng, , J.Xu, , R.C. Tittsworth, L.E. Rehn, P.M. Baldo,
G.L.Doll, Surf. Coat. Technol. 148 (2001) 153.
[14] K. Oguri, T.Arai, Thin Solid Films 186 (1990) L29.
[15] Kusano, E., Satoh, A., Kitagawa, M., Nanto, H., Kinbara, A., Thin Solid Films 343
(1999) 254.
[16] M. Stuber, H. Leiste, S.Urlich, H.Holleck, D. Schild, Surf. Coat. Technol. 150 (2002)
218.
[17]............
[18]..........
[19] M.A. Baker, Surf. & Coat. Technol. 201 (2007) 6105.
[20] D. Maier-Schneider, A Köprülülü, S. Ballhausen Holm, E. Obermeier, J. Micromech.
Microeng. 6 (1996) 436.
[21] W.J. Meng, R.C. Tittsworth, J.C. Jiang, J. Appl. Phys. 88 (2000) 2840.
[22] C. Rebholz, J.M. Schneider, H. Ziegele, B. Rähle, A. Leyland, A. Matthews, Vacuum
49 (1998) 265.

12
[23] J.A. Greenwood, J.B.P. Williamson, Proc.Roy.Soc.Lond.A 295 (1966) 300.

13
Table Captions:
Table 1: Stoichiometry and Relative phase fraction for TiC coatings deposited at different
C2H2 flow rates, as obtained from XPS studies
Table 2: Effect of C2H2 flow rate on wear depth and friction coefficient for TiC coatings

14
Figure Captions:
Figure 1: High Temperature Tribometer (HTT) for friction coefficient and wear depth
evaluation of Ti-C coatings.
Figure 2: XRD patterns of Ti-C coatings deposited at different C2H2 flow rates.
Figure 3: Raman spectra obtained over the Ti-C coatings deposited at (a) 43 sccm and
(b)100 sccm, flow rates of C2H2.
Figure 4: Scanning electron microphotographs obtained over Ti-C coatings deposited at (a)
0 and (b) 43 sccm of C2H2, respectively.
Figure 5: Dark Field transmission electron microphotographs of TiC coatings deposited at
(a) 25 and (b) 43 sccm of C2H2.
Figure 6: (a) Ti 2p and (b) C 1s XPS core level spectra for the Ti-C coating deposited at
variable C2H2 flow rate.
Figure 7: C 1s peak fitting for the TiC coatings deposited at 25 and 43 sccm C2H2.
Figure 8: Hardness and elastic modulus of Ti-C coatings.
Figure 9: (a) Ball-on-disc wear track of coated specimen after tribological test at 10N
(5,000 passes) against Ruby ball counterpart and (b) corresponding wear track
depth.
Figure 10: Effect of C2H2 flow rate on the wear rate for TiC coatings different deposited at
C2H2 flow rates in the 0-100 range.

15
Table 1: Polychronopoulou et al.
C2H2 flow
rate
% Carbide % DLC TiCx nanocrystallite
stoichiometry
0
25 100 0 TiC0.2
37 100 0 TiC0.7
43 87 13 TiC1.0
50 80 20 TiC1.1
100 0 100 DLC

16
Table 1: Polychronopoulou et al.
C2H2 Flow rate
(sccm)
0 25 37 43 50 100
Wear Depth (µm)
Over 30 mins
41 45.6 12 1.05, 0.6, 1.8 1.53, 1.25 40
Friction Coefficient 1+ 1+ 0.5+ 0.38, 0.4, 0.35 0.35 0.7

17
Figure 1: Polychronopoulou et al.

18
Figure 2: Polychronopoulou et al.
37
25
0
2theta (deg)30 40 50 60 70 80
(111)
C2H
2
(sscm)(222)
(311)
(220)
(200)
100
50
43

19
Figure 3: Polychronopoulou et al.
1200 1400 1600 1800 20001000
1100
1200
1300
1400
1500
1600(a)
1550
Inte
nsit
y (
a.u
)
Raman Shift (cm-1)
1200 1400 1600 1800 200030000
32500
35000
37500
40000
42500
45000 (b)
1388
1580
Inte
nsit
y (
a.u
)
Raman Shift (cm-1)

20
Figure 4: Polychronopoulou et al.
2 µµµµm
0 sccm C2H2
2 µµµµm
43 sccm C2H2
(a) (b)
2 µµµµm
0 sccm C2H2
2 µµµµm
43 sccm C2H2
(a) (b)

21
Figure 5: Polychronopoulou et al.
25 sccm (a)
(b)
20 nm
20 nm
43 sccm
25 sccm (a)
(b)
20 nm
20 nm
43 sccm

22
Figure 6: Polychronopoulou et al.
0
3000
6000
9000
12000
15000
451.5453.5455.5457.5459.5461.5463.5465.5
Binding Energy / eV
Co
un
ts / s
Ti 2p
100
0
37
50
43
25
(a)
(b)
C1s
0
500
1000
1500
2000
2500
3000
275.5277.5279.5281.5283.5285.5287.5289.5
Binding Energy / eV
Co
un
ts / s
100
0
37
50
43
25
Figure 7: Polychronopoulou et al.

23
120
140
160
180
200
220
240
260
280
300
320
340
360
380
400
276277278279280281282283284285286287288289290
Co
unts
/ s
Binding Energy (eV)
C1s
C1s A
C1s B
0
100
200
300
400
500
600
700
800
900
1000
1100
1200
275276277278279280281282283284285286287288289
Cou
nts
/ s
Binding Energy (eV)
C1s
C1s A
C1s BC1s C
C1s E
(a)
(b)
25 sccm C2H2
43 sccm C2H2

24
Figure 8: Polychronopoulou et al.
0
10
20
30
40
0 20 40 60 80 100
C2H2 gas flow (sccm)
H (
GP
a)
0
100
200
300
400
E (
GP
a)
H [GPa] E [GPa]

25
Figure 9: Polychronopoulou et al.
0 0.5 1 1.5-2
-1.5
-1
-0.5
0
0.5
1
W ear Scan (mm)
We
ar
De
pth
(µ
m)
Wear track
Machining marks (a)
(b)
Wear track
Wear scan
0 0.5 1 1.5-2
-1.5
-1
-0.5
0
0.5
1
W ear Scan (mm)
We
ar
De
pth
(µ
m)
Wear track
Machining marks (a)
(b)
Wear track
Wear scan

26
Figure 10: Polychronopoulou et al.
0.0E+00
1.0E-01
2.0E-01
3.0E-01
4.0E-01
5.0E-01
6.0E-01
7.0E-01
8.0E-01
We
ar
rate
(m
m3m
-1)
0 25 37 43 50 100
Sccm


![Phase stability of AlYB14 sputtered thin filmshenkelmanlab.org/pubs/kolpin09_355006.pdf · AlxYyB14 samples were synthesized by magnetron sputtering within a combinatorial setup [12]](https://img.pdfslide.net/doc/110x75/5e4bb86a8d90841bf1702312/phase-stability-of-alyb14-sputtered-thin-alxyyb14-samples-were-synthesized-by-magnetron.jpg)