Embed Size (px)
Citation preview

Microwave curing parameters of in-situ concrete repairs
MANGAT, Pal <http://orcid.org/0000-0003-1736-8891>, GRIGORIADIS, Konstantinos and ABUBAKRI, Shahriar <http://orcid.org/0000-0001-6046-311X>
Available from Sheffield Hallam University Research Archive (SHURA) at:
http://shura.shu.ac.uk/12154/
This document is the author deposited version. You are advised to consult the publisher's version if you wish to cite from it.
Published version
MANGAT, Pal, GRIGORIADIS, Konstantinos and ABUBAKRI, Shahriar (2016). Microwave curing parameters of in-situ concrete repairs. Construction and Building Materials, 112, 856-866.
Copyright and re-use policy
See http://shura.shu.ac.uk/information.html
Sheffield Hallam University Research Archivehttp://shura.shu.ac.uk
1
Microwave Curing Parameters of In-situ Concrete Repairs 1
P. S. Mangat*, K. Grigoriadis, S. Abubakri 2
Centre for Infrastructure Management, Materials & Engineering Research Institute, Sheffield 3
Hallam University, Howard Street, Sheffield, S1 1WB, UK (*Corresponding author. Fax: 4
+44 114 225 3501; Tel: +44 114 225 3339) 5
Emails: [email protected] (P. S. Mangat), [email protected] (K. Grigoriadis), 6
[email protected] (S. Abubakri) 7
8
Abstract 9
Different proprietary repair materials and a CEM II mortar were used to characterise the 10
relationship between the main parameters of microwave curing (power, curing time, 11
temperature rise and volume). The time-temperature-power relationships are linear for 12
normal, non-rapid setting repair materials cured within the recommended temperature range 13
taking account of temperature variation and heat of hydration. A general relationship between 14
the microwave curing parameters of power, temperature rise, curing time and repair volume 15
has been derived. It has been used to design and operate a prototype system. Steel 16
reinforcement in the repair remains free from arcing under microwave exposure. 17
18
Keywords 19
Concrete, Microwave curing, Patch repair. 20
21
1. Introduction 22
Reinforced and pre-stressed concrete has been used at a massive scale for the construction 23
of infrastructure in the last century with the secure assumption of its lasting durability. While 24
the large majority of concrete construction is durable, repair is increasingly needed due to 25
2
various concrete degradation mechanisms, abnormal loading or poor workmanship. 26
According to CONREPNET [1] more than 50% of Europe's annual construction budget is 27
spent on rehabilitation and refurbishment projects including the repair of deteriorated 28
concrete structures. In the United States the annual cost of repair, strengthening and 29
protection of concrete structures is between $18 and $21 billion [2]. 30
Concrete repair can be applied either to provide structural strengthening or to protect the 31
durability of a structure. Patch repair is perhaps the most common type of concrete repair. It 32
can be defined as the repair of relatively small areas in large surfaces such as bridge and car 33
park decks, bridge piers and shear walls in buildings. Emmons [3] provides detailed 34
information on the various stages of a typical patch repair scheme. 35
Selection of suitable repair materials and their proper curing is of great importance in 36
minimising restrained shrinkage and ensuring the long-term durability of patch repairs. 37
Differential shrinkage of the repair patch relative to the substrate is the most common cause 38
of cracking and failure of patch repairs. Under normal curing conditions, it may take 24 hours 39
or more for OPC based repair materials to set and it may take several days before sufficient 40
compressive strength is developed to carry the applied loads [4]. Under more extreme 41
conditions such as repair application in cold weather, strength development may be 42
compromised. Accelerating the curing process by applying heat or using admixtures can be 43
beneficial in these situations. Rapid compressive strength development is also desirable when 44
repairing localised damage in bridge decks or runways, such as potholes, areas damaged by 45
heavily corroded reinforcement or severely delaminated areas. A compressive strength of 46
approximately 14 MPa should be achieved for a road to be re-opened [5]. A correspondingly 47
strong bond between the substrate and the repair patch is also critically important to provide 48
durable repairs. 49

3
The rate of compressive strength development in OPC concrete can be increased by the 50
application of thermal energy [6]. Thermal curing of concrete repair patches is often used in 51
cold weather to prevent damage caused by freezing temperatures and to accelerate the repair 52
process. Thermal curing can also be used in more general conditions to accelerate the 53
hardening of repair patches for rapid opening of roads to traffic. The heating methods 54
commonly adopted use open flame heaters or provide heating enclosures around the repaired 55
area. These methods are inefficient and waste energy relative to microwave curing. They 56
provide non-uniform heat through convection to the patch repair with high temperature at the 57
surface and significant temperature gradients into the repair patch. The effect of such curing 58
is damaging to the homogeneity and quality of hydration products. Rapid hydration caused by 59
high temperature produces very fine C-S-H gel surrounded by unhydrates which hinder 60
further hydration and can cause a reduction in long term strength development [7]. Non 61
uniform heating also produces differential thermal strains causing microcracking which 62
reduces the durability of the patch repair. Thermal blankets based on a conductive polymer 63
technology have been developed [8], which transfer heat from the surface into a repair patch 64
with the associated disadvantage of non-uniform heat transfer by convection. The technology 65
is expensive and cumbersome to use on site. 66
The application of microwave curing on site will introduce new technology in the 67
construction industry to replace inefficient current practices with more effective and 68
economical methods. It will contribute to the introduction of automation in the repair sector 69
through robotic controlled microwave curing systems. The industrial prototype developed in 70
the MCure project of the European Commission FP7 programme (see acknowledgements) 71
incorporates such technology which will be further enhanced in the next stage of industrial 72
system production. Health and safety issues on site have been rigorously addressed in the 73
project and the industrial systems will have European regulatory certification. 74

4
The development of a microwave heating system to provide early age curing to concrete 75
repair patches has the potential to revolutionise the concrete repair industry by transforming 76
the efficiency and economics of thermal curing. Its effectiveness for cold weather curing will 77
prevent disruption to construction activity in winter, which will have a major economic 78
impact by allowing continued construction activity during winter. Microwave heating is more 79
economical than the thermal curing methods currently used on site such as open flame heaters 80
with or without an enclosure around a repaired area. The energy use and CO2 emission will 81
also be lower. It has also the potential of reducing the use of expensive and environmentally 82
undesirable chemical admixtures in proprietary repair formulations to accelerate curing. 83
Thermal curing, including microwave curing, leads to higher strength at early age which 84
allows rapid progress of repair work. There is a reduction in long term strength, values of up 85
to 20% and 6.75% have been reported for conventional thermal curing [6, 9] and microwave 86
curing [10], respectively. However, the early age strength and the repair-substrate interfacial 87
bond strength are the important properties required for a durable repair that can be applied 88
rapidly. Long term strength is of secondary importance as long as it satisfies the specified 89
requirement. Microwave curing delivers on the requirements of early age compressive 90
strength and long term bond strength [10]. 91
Microwave heating, which is based on dissipation of internal energy due to the excitation of 92
molecular dipoles when exposed to an electromagnetic field, is an economical method of 93
providing a higher rate of temperature increase [4] and more uniform heating than the 94
traditional heating methods [11]. Hence, a much shorter exposure time (typically less than 60 95
minutes) is required for microwave curing to achieve high early age compressive strength [9]. 96
Various studies [4, 9, 12-17] on microwave curing of OPC mortars made with different w/c 97
ratios have confirmed the ability of microwave curing to significantly increase early age 98
strength. 99

5
This paper provides a scientific framework on microwave curing of in-situ concrete repairs 100
for the FP7 MCure project on the development of an energy efficient system for accelerated 101
curing during repair of concrete structures. It is the first of a series of papers defining the 102
relationship between microwave curing and the primary characteristics of concrete repairs. It 103
derives relationships between the key parameters of concrete repair and microwave energy 104
input. These results were used in developing and operating the prototype of a mobile 105
microwave curing system for onsite use, which is compatible with EC standards. 106
107
2. Experimental Procedure 108
2.1. Materials and equipment 109
Microwave curing investigation was carried out on the following commercial repair 110
materials: 111
Repair Material 1: A polymer-modified cement mortar, fibre-reinforced and shrinkage-112
compensated. Density of the fresh mix was 1730 kg/m3. 113
Repair Material 2: A polymer-modified rapid-setting cement mortar and fibre-reinforced. 114
Density of the fresh mix was 2140 kg/m3. 115
Repair Material 3: A polymer-modified cement mortar, fibre-reinforced and shrinkage-116
compensated. Density of the fresh mix was 2280 kg/m3. 117
Repair Material 4: A rapid hardening cement concrete with pulverised fuel ash and 118
shrinkage-compensated. Density of the fresh mix was 2260 kg/m3. 119
Repair Material 5: A polymer-modified cement mortar and fibre-reinforced. Density of fresh 120
mix was 1500 kg/m3. 121
Repair Material 6: A polymer-modified cement, rapid setting concrete. Density of fresh mix 122
was 2200 kg/m3. 123
6
Repair Material 7: A mortar with CEM II/A-L 32.5 N cement [18], coarse sharp sand (50% 124
passing a 600 m sieve) and w/c ratio of 0.5. Density of fresh mix was 2200 kg/m3. 125
126
Two commercial microwave ovens were used, a Logik Model L25MDM13 with a 127
maximum nominal output power of 900 Watts (manufacturer's specification) and a Sharp 128
Model R-2370 with a maximum nominal output power of 1300 Watts (manufacturer's 129
specification). Both microwave ovens could be set to generate power at incremental levels of 130
10% up to 100% of their maximum output. The microwave frequency for both ovens is 2.45 131
GHz. The microwave ovens were calibrated [11] according to ASTM F1317-98 [19] and BS 132
EN 60705: 2012 [20] to determine their actual power outputs which in the case of the Logik 133
Model L25MDM13 differed significantly from the manufacturer's specification. Unless 134
otherwise mentioned, all values of microwave power given subsequently in the paper are the 135
actual power values. 136
137
2.2. Details of specimens, mixing and microwave curing 138
2.2.1. Repair material specimens for surface temperature monitoring 139
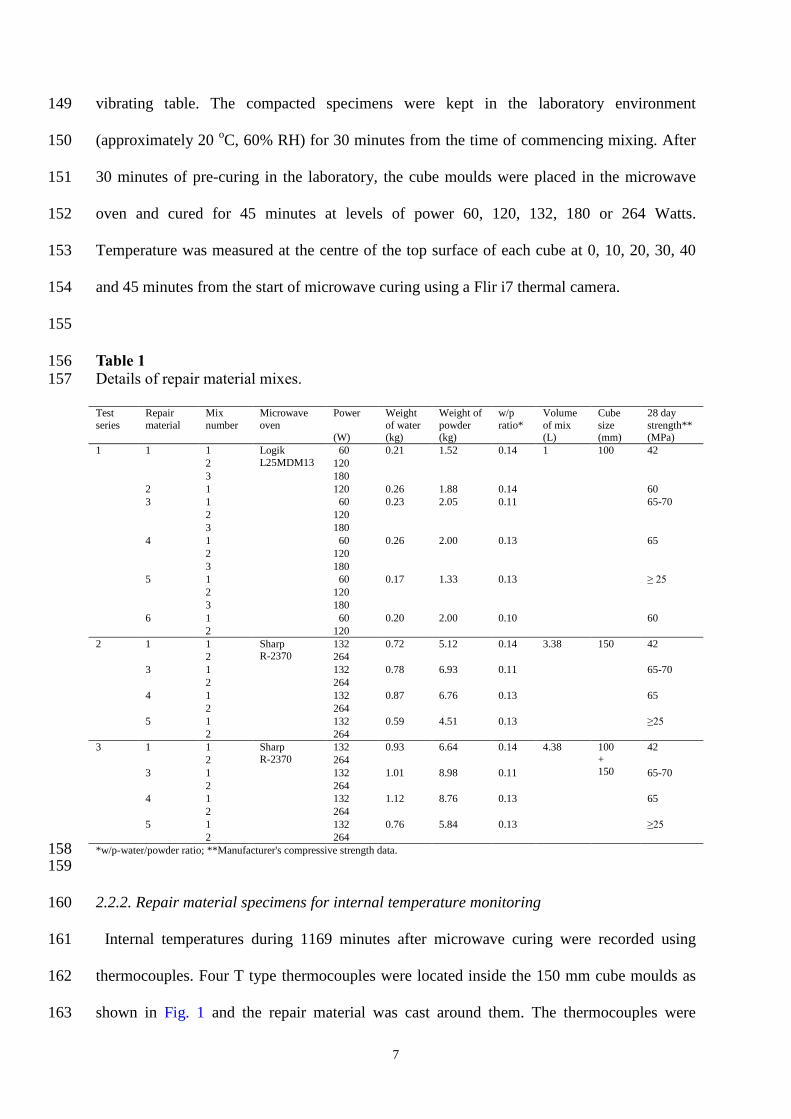
Three volumes of specimens, 1, 3.38 and 4.38 litres were used for microwave curing [11]. 140
Specimens were cast in polystyrene cube moulds of 100 mm and 150 mm internal 141
dimensions. The 1 litre volume was provided by a 100 mm mould, the 3.38 litre volume by a 142
150 mm mould and the 4.38 litre volume comprised of the combined 100 mm and 150 mm 143
cube moulds. 144
Details of all repair material mixes are given in Table 1. The mix proportions recommended 145
by the manufacturers of each repair material were used. The quantity of each repair material 146
and water, given in Table 1, was mixed together in a Hobart mixer to produce the required 147
volume of mix for the cube mould. Each mix was cast in the cube mould and compacted on a 148
7
vibrating table. The compacted specimens were kept in the laboratory environment 149
(approximately 20 oC, 60% RH) for 30 minutes from the time of commencing mixing. After 150
30 minutes of pre-curing in the laboratory, the cube moulds were placed in the microwave 151
oven and cured for 45 minutes at levels of power 60, 120, 132, 180 or 264 Watts. 152
Temperature was measured at the centre of the top surface of each cube at 0, 10, 20, 30, 40 153
and 45 minutes from the start of microwave curing using a Flir i7 thermal camera. 154
155
Table 1 156 Details of repair material mixes. 157
Test
series
Repair
material
Mix
number
Microwave
oven
Power
(W)
Weight
of water (kg)
Weight of
powder (kg)
w/p
ratio*
Volume
of mix (L)
Cube
size (mm)
28 day
strength** (MPa)
1 1 1 Logik
L25MDM13
60 0.21 1.52 0.14 1 100 42
2 120
3 180
2 1 120 0.26 1.88 0.14 60
3 1 60 0.23 2.05 0.11 65-70
2 120
3 180
4 1 60 0.26 2.00 0.13 65
2 120
3 180
5 1 60 0.17 1.33 0.13 ≥ 25
2 120
3 180
6 1 60 0.20 2.00 0.10 60
2 120
2 1 1 Sharp R-2370
132 0.72 5.12 0.14 3.38 150 42
2 264
3 1 132 0.78 6.93 0.11 65-70
2 264
4 1 132 0.87 6.76 0.13 65
2 264
5 1 132 0.59 4.51 0.13 ≥25
2 264
3 1 1 Sharp
R-2370
132 0.93 6.64 0.14 4.38 100
+ 150
42
2 264
3 1 132 1.01 8.98 0.11 65-70
2 264
4 1 132 1.12 8.76 0.13 65
2 264
5 1 132 0.76 5.84 0.13 ≥25
2 264
*w/p-water/powder ratio; **Manufacturer's compressive strength data. 158 159
2.2.2. Repair material specimens for internal temperature monitoring 160
Internal temperatures during 1169 minutes after microwave curing were recorded using 161
thermocouples. Four T type thermocouples were located inside the 150 mm cube moulds as 162
shown in Fig. 1 and the repair material was cast around them. The thermocouples were 163

8
located at 37.5, 75, 112.5 and 150 mm from the top surface of the specimens along the 164
vertical centroidal axis. Temperature measurements were taken every 30 seconds using a 165
Data Taker DT85G digital logger. Details of the two repair material mixes used for this 166
investigation are given in Table 2. 167
168
Table 2 169 Details of repair material mixes for internal temperature monitoring. 170
Repair
material
Mix number Microwave oven Power
(W)
w/p* w/c** Volume of mix
(L)
Cube size
(mm)
4 1 Sharp R-2370 132 0.13 − 3.38 150
7 2 − 0.5
* w/p-water/powder ratio; ** w/c-water/cement ratio. 171
172
173
Fig. 1. Schematic diagram of thermocouples located inside a 150 mm cube specimen. 174
175
2.2.3. Repair material specimens for investigating the effect of ambient (initial) temperature 176
on microwave curing temperature 177
The effect of different ambient temperatures of the fresh mix of a repair material on the 178
microwave curing temperatures developed with time was investigated [11]. The investigation 179
simulated the application of repairs in different in-situ conditions including cold weather. The 180
constituent materials of each mix were conditioned and mixed at three different ambient 181
temperature ranges: very low (1.7-6.5 oC), low (8.9-10.0
oC) and medium range (15.8-18.3 182
oC). The constituent materials were kept overnight in an environmental chamber to condition 183
9
them to the selected ambient temperature. The ambient temperature was maintained during 184
mixing and for 30 minutes after casting a 150 mm cube specimen (3.38 litres volume) for 185
each mix. Materials 1, 3, 4 and 5 were tested using the Sharp R-2370 microwave oven at an 186
actual output power of 132 Watts. Temperature measurements at the centre of the top surface 187
of the cubes were taken at 0, 10, 20, 30, 40 and 45 minutes from the start of microwave 188
curing using a Flir i7 thermal camera. 189
190
2.2.4. Steel reinforced mortar specimens for investigating safety of microwave curing 191
Long and pointed metallic objects or very thin metal strips when placed in a microwave 192
oven act as an antenna and reflect the microwave energy. At high levels of microwave power 193
this can create electric arcs (sparks) which can increase the temperature of its magnetron. 194
This can reduce the life of the magnetron. An investigation of the safety of microwave curing 195
was carried out on specimens cast with 1, 2 or 3 steel bars placed horizontally along the entire 196
length of the 100 mm cube as shown in Fig. 2a. Details of all steel reinforced mortar mixes 197
are given in Table 3. The total length of each steel bar was 140 mm to cover the cube length 198
(100 mm) plus 20 mm thickness of two mould walls. Steel bars of diameters 10, 8 or 6 mm 199
were located through holes drilled in the side faces of the mould. In addition, one specimen 200
was made with 6 mm diameter bars protruding 30 mm from each side face of the mould as 201
shown in Fig. 2b. The total length of each steel bar was 200 mm. Both galvanised and normal 202
mild steel bars were used. The top cover to steel bars was 25, 15 or 5 mm as shown in Fig. 3. 203
A quantity of CEM II cement [18], sharp coarse sand and water (w/c ratio of 0.5) were 204
mixed together to produce a 1 litre mix for the cube mould. Each cube was cast and 205
compacted on a vibrating table and kept in the laboratory environment (approximately 20 oC, 206
60% RH) for 30 minutes after commencing mixing. After 30 minutes of pre-curing in the 207
laboratory, the cube moulds were placed in the microwave oven and cured for either 45 or 15 208

10
minutes at powers ranging from 60 to 420 Watts (Table 3). The temperature at the mid-point 209
of the top surface of the cube was measured at the end of microwave curing (maximum 210
temperature) using a Flir i7 thermal camera. 211
Fig. 2a. Moulds with 1, 2 or 3 steel bars
placed inside them and top cover 25 mm.
Fig. 2b. Mould with steel bars protruding
(exposed) and top cover 5 mm.
212
Fig. 3. Plain (control) and steel reinforced specimens with different top covers after 213
microwave curing. 214
215
216
217
218
219
220
221
222
223
224
225
226
227
228
11
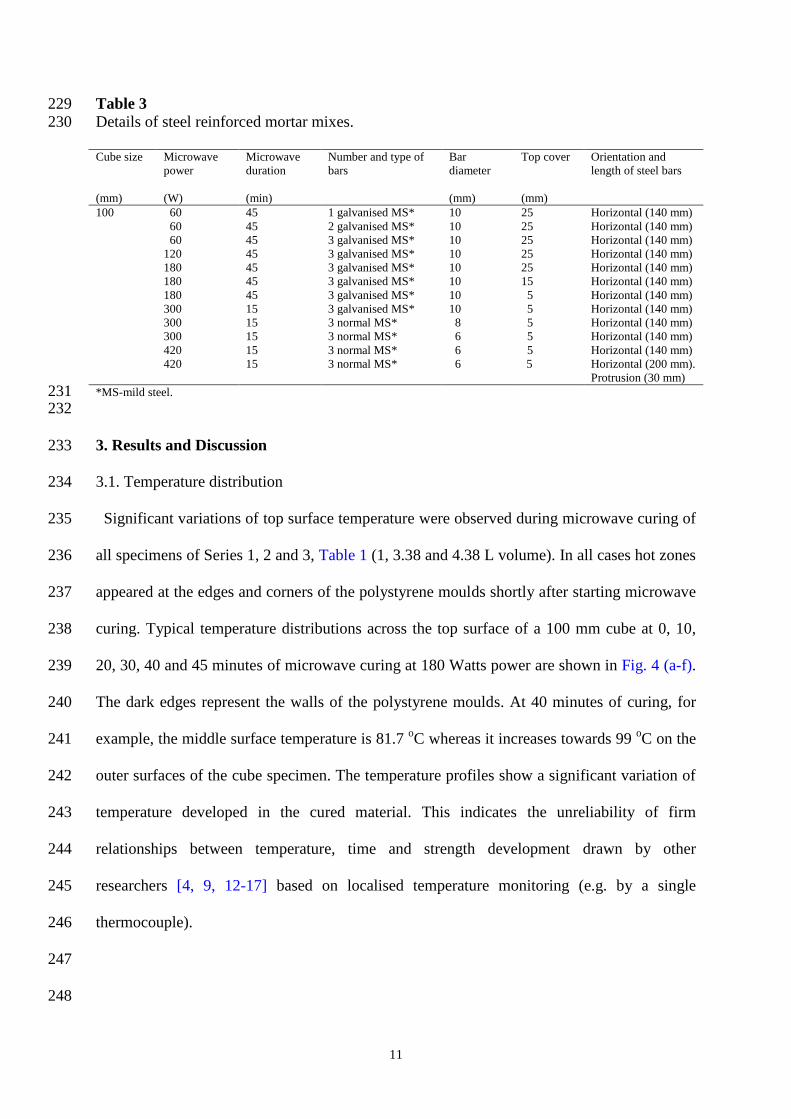
Table 3 229 Details of steel reinforced mortar mixes. 230
Cube size
(mm)
Microwave
power
(W)
Microwave
duration
(min)
Number and type of
bars
Bar
diameter
(mm)
Top cover
(mm)
Orientation and
length of steel bars
100 60 45 1 galvanised MS* 10 25 Horizontal (140 mm)
60 45 2 galvanised MS* 10 25 Horizontal (140 mm)
60 45 3 galvanised MS* 10 25 Horizontal (140 mm)
120 45 3 galvanised MS* 10 25 Horizontal (140 mm)
180 45 3 galvanised MS* 10 25 Horizontal (140 mm)
180 45 3 galvanised MS* 10 15 Horizontal (140 mm)
180 45 3 galvanised MS* 10 5 Horizontal (140 mm)
300 15 3 galvanised MS* 10 5 Horizontal (140 mm)
300 15 3 normal MS* 8 5 Horizontal (140 mm)
300 15 3 normal MS* 6 5 Horizontal (140 mm)
420 15 3 normal MS* 6 5 Horizontal (140 mm)
420 15 3 normal MS* 6 5 Horizontal (200 mm).
Protrusion (30 mm)
*MS-mild steel. 231 232
3. Results and Discussion 233
3.1. Temperature distribution 234
Significant variations of top surface temperature were observed during microwave curing of 235
all specimens of Series 1, 2 and 3, Table 1 (1, 3.38 and 4.38 L volume). In all cases hot zones 236
appeared at the edges and corners of the polystyrene moulds shortly after starting microwave 237
curing. Typical temperature distributions across the top surface of a 100 mm cube at 0, 10, 238
20, 30, 40 and 45 minutes of microwave curing at 180 Watts power are shown in Fig. 4 (a-f). 239
The dark edges represent the walls of the polystyrene moulds. At 40 minutes of curing, for 240
example, the middle surface temperature is 81.7 oC whereas it increases towards 99
oC on the 241
outer surfaces of the cube specimen. The temperature profiles show a significant variation of 242
temperature developed in the cured material. This indicates the unreliability of firm 243
relationships between temperature, time and strength development drawn by other 244
researchers [4, 9, 12-17] based on localised temperature monitoring (e.g. by a single 245
thermocouple). 246
247
248

12
(a) At 0 minutes
(b) At 10 minutes
(c) At 20 minutes
(d) At 30 minutes
(e) At 40 minutes
(f) At 45 minutes
249 Fig. 4 (a-f). Top surface temperature distribution of Material 1 100 mm cube subjected to 180 250
W of microwave power. 251
252
Significant variations of top surface temperature at the end of microwave curing were 253
observed between different repair materials of the same volume exposed to the same power. 254
Typical temperature distributions of the six repair material specimens after 45 minutes of 255
microwave curing at 120 Watts are shown in Fig. 5 (a-f). 256
257
258
259
260
261
262
263
264
265

13
(a) Material 1
(b) Material 2
(c) Material 3
(d) Material 4
(e) Material 5
(f) Material 6
266
Fig. 5 (a-f). Top surface temperature of the six repair materials (1 litre volume subjected to 267
120 W power) at 45 minutes of microwave curing. 268
269
Materials 2 and 6 developed particularly high temperatures (89.4 oC and 99.6
oC 270
respectively) at the end of microwave curing compared with the normal Materials 1 and 3 271
which developed 59.7 oC, and 58.1
oC, respectively. This is because both 2 and 6 are rapid 272
setting repair materials. Material 4, which is a rapid hardening material did not develop 273
higher temperatures than Materials 1 and 3. The admixtures, additives and the fineness of 274
cement used in the repair mortars 2, 5 and 6 appear to affect the temperature. However, since 275
the details of the constituents of these commercial materials are not available, precise 276
conclusions cannot be drawn. There is no clear relationship between water/powder (w/p) or 277
density of the mixes and the temperature developed by microwave curing. For example both 278
normal Materials 1 and 3 have w/p ratios 0.14 and 0.11 respectively (Table 1) but the 279
temperatures developed after 45 minutes of microwave curing are similar (57.9 oC and 58.1 280
oC, respectively). Materials 1 and 5 on the other hand have similar w/p ratios (0.14 and 0.13, 281
respectively) and densities (1730 and 1500 kg/m3, respectively) but they developed 282

14
significantly different temperatures after 45 minutes of microwave curing (59.7 and 75.4 oC, 283
respectively). It is clear, therefore, that the constituents of repair materials, rather than their 284
w/p ratio or density, are the main factors which control the microwave curing temperature. 285
286
3.2. Time-temperature relationship 287
A linear increase of top surface temperature with microwave curing time was observed for 288
the repair materials, material volumes and power levels used. A typical time-temperature 289
graph is given in Fig. 6, for 1 litre volume of Material 4 subjected to microwave power levels 290
of 60, 120 and 180 Watts. However, the fast setting repair Material 2 showed a discontinuous 291
linear time-temperature relationship as shown in Fig. 7 (volume 1 litre, power 120 Watts). 292
The rapid hardening material underwent a phase change from semi-fluid to hardened material 293
at high temperature during microwave curing. This is represented by the two different linear 294
relationships shown in Fig. 7. The maximum curing temperature attained is excessive 295
(reaching 90 oC) which would not be desirable in practice. Materials with this kind of time-296
temperature relationship would not be suitable for microwave curing unless the ambient 297
temperature is very low (cold weather application), when low power curing may be 298
appropriate. 299
The linear relationships of the type shown in Fig. 6 would be applicable to most practical in-300
situ microwave curing situations where the maximum temperature remains below the 301
recommended limit [11]. The industrial microwave curing system developed in this project 302
will be based on this type of relationship. 303

15
304
Fig. 6. Top surface middle point time-temperature relationship for Material 4 (1 litre volume). 305
306
307 308
Fig. 7. Top surface middle point time-temperature relationship for Material 2 (1 litre volume) 309
at 120 W. 310
311
3.3 Volume-temperature relationship 312
The thermodynamic formula for absorbed microwave power Pabs relates the volume V and 313
temperature rise as follows [21] 314
𝑃𝑎𝑏𝑠
𝑉=
𝑐𝜌(𝑇𝑓−𝑇a)
𝑡 (1) 315
316
where, Pabs is the microwave power (W); V is the volume (L); c is the heat capacity (J/kg/oC); 317
is the density (kg/m3); Tf is the temperature at the end of microwave curing (
oC); Ta is the 318
ambient temperature (oC); t is the microwave curing time (min). 319
0
10
20
30
40
50
60
70
80
0 10 20 30 40 50
Tem
per
atu
re (
oC
)
Time (mins)
Actual Output Power 60 W
Actual Output Power 120 W
Actual Output Power 180 W
T(t) = 2.32t + 27.42 R² = 0.996
T(t) = 0.69t + 59.52 R² = 0.992
0
20
40
60
80
100
0 10 20 30 40 50
Tem
per
atu
re (
oC
)
Time (mins)
Material 2Volume: 1 l (100 mm cube)Actual Output Power: 120 W

16
320
This expression is applied to the experimental data of this investigation in Fig. 8, at a 321
constant applied microwave power of (120-132 W) for a constant time of 45 mins for 322
Materials 1, 3, 4 and 5. The ambient temperature of all tests ranged between 15.8 and 20.3 oC. 323
Eq. 1 is re-written in the form 324
∆𝑇 =𝑃𝑎𝑏𝑠𝑡
𝑐𝜌𝑉−1 (2) 325
where, ∆𝑇 = 𝑇𝑓 − 𝑇a (3) 326
327
Fig. 8 shows a linear relationship between T and V for the constant power and microwave 328
curing time for the experimental data of Materials 1, 3, 4 and 5. The slope of the graphs in 329
Fig. 8 is a function of Pabs, t, c and ρ. The density ρ of Materials 1, 3, 4 and 5 is 1730, 2280, 330
2260 and 1500 kg/m3, respectively. The coefficient c accounts for the different constituents 331
of the repair materials and their mix proportions. 332
333
Fig. 8 Volume-temperature rise relationships of repair materials 1, 3, 4 and 5 at 132 W. 334
335
336
3.4. Rate of temperature increase with microwave power 337
Time-temperature relationships of the repair materials and volumes at different power levels 338
described in Section 3.2 were analysed to determine the rate of temperature increase, dT/dt 339
(slope ), with time. The rapid setting Materials 2 and 6 were excluded since they developed 340
0
10
20
30
40
50
60
70
0 1 2 3 4 5
T
(oC
)
Volume (l)
Material 1 (120-132 W)
Material 3 (120-132 W)
Material 4 (120-132 W)
Material 5 (120-132 W)
17
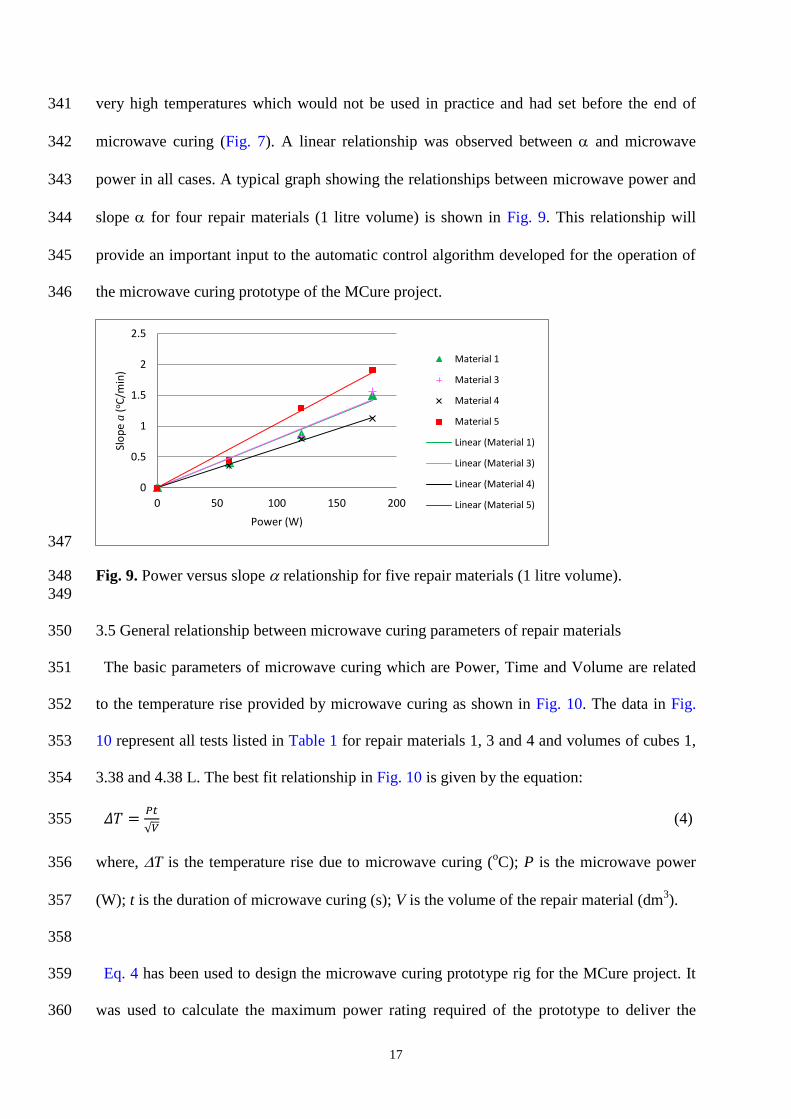
very high temperatures which would not be used in practice and had set before the end of 341
microwave curing (Fig. 7). A linear relationship was observed between and microwave 342
power in all cases. A typical graph showing the relationships between microwave power and 343
slope for four repair materials (1 litre volume) is shown in Fig. 9. This relationship will 344
provide an important input to the automatic control algorithm developed for the operation of 345
the microwave curing prototype of the MCure project. 346
347
Fig. 9. Power versus slope relationship for five repair materials (1 litre volume). 348
349
3.5 General relationship between microwave curing parameters of repair materials 350
The basic parameters of microwave curing which are Power, Time and Volume are related 351
to the temperature rise provided by microwave curing as shown in Fig. 10. The data in Fig. 352
10 represent all tests listed in Table 1 for repair materials 1, 3 and 4 and volumes of cubes 1, 353
3.38 and 4.38 L. The best fit relationship in Fig. 10 is given by the equation: 354
𝛥𝑇 =𝑃𝑡
√𝑉 (4) 355
where, T is the temperature rise due to microwave curing (oC); P is the microwave power 356
(W); t is the duration of microwave curing (s); V is the volume of the repair material (dm3). 357
358
Eq. 4 has been used to design the microwave curing prototype rig for the MCure project. It 359
was used to calculate the maximum power rating required of the prototype to deliver the 360
0
0.5
1
1.5
2
2.5
0 50 100 150 200
Slo
pe
a (
oC
/min
)
Power (W)
Material 1
Material 3
Material 4
Material 5
Linear (Material 1)
Linear (Material 3)
Linear (Material 4)
Linear (Material 5)

18
specified range of parameters , t and V required for in-situ curing of scaled up repair 361
elements [22]. The parameters T and t were also specified on the basis of the results 362
reported in the paper. Scaled up field trials on the MCure prototype proved that its design 363
delivered the specified parameters [22]. 364
365
Fig. 10. General relationship between microwave curing parameters of repair materials 1, 3 366
and 4 367
368
3.6. Internal temperature development 369
Typical time-internal temperature graphs accompanied by time-top surface temperature 370
graphs for both normally cured (at 20 oC) and microwave cured specimens of Material 4 are 371
shown in Fig. 11 and Fig. 12, respectively. The internal temperatures were monitored from 372
thermocouples located within the 150 mm cube specimens (3.38 litre volume) which were 373
microwave cured for 45 minutes at 132 Watts. The relationship under normal curing (20 oC) 374
given in Fig. 11 shows one hump at about 775 minutes (775 + 30 pre-curing after mixing = 375
805 minutes from the start of hydration), representing the peak heat of hydration temperature 376
of about 45 oC. This represents a temperature rise of 25
oC due to heat of hydration. The 377
corresponding microwave cured sample shows the first hump at 45 minutes (Fig. 12) when 378
the peak microwave curing temperature is reached followed by a second hump at about 245 379
minutes (275 minutes from the start of hydration, 200 minutes after the end of microwave 380
curing) indicating the peak heat of hydration point. It is clear that the heat of hydration 381
y = 0.0001x R² = 0.88
0
10
20
30
40
50
60
70
0 100000 200000 300000 400000 500000
T
(oC
)
Pt/V0.5 (Ws/dm1.5)
19
reaction is significantly accelerated by microwave curing reducing the peak time from 805 to 382
275 minutes while increasing the peak temperature to 79 oC. This shows a temperature rise of 383
34 oC from the end of microwave curing (45
oC) to the peak of hydration (79
oC). Fig. 12 384
shows that heat of hydration develops after the microwave curing period and has an 385
insignificant effect on the temperatures developed during microwave curing as shown in Fig. 386
6. Other results reported by the authors [23] for 100 mm cube specimens microwave cured to 387
about 40 oC show that, for non-rapid setting repair materials, the maximum temperature of 388
between 53.8 and 71.1 oC is reached at 10-60 minutes after the end of microwave curing. 389
The acceleration of heat hydration with microwave curing observed in Fig. 11 and Fig. 12 390
agrees with the results of Theo et al. [24] for microwave cured precast ferrocement roofing 391
slabs of approximately 11 litres volume. The slabs were cured for 10-20 minutes at 3000 392
Watts microwave power. Maximum heat of hydration occurred during microwave curing, 393
leading to high temperatures (approximately 70 oC) at the end of curing. 394
The results discussed above show that both the microwave curing temperature and the heat 395
of hydration contribute to the maximum temperature developed in the concrete volume within 396
a short period after the end of microwave curing. In practice, the maximum temperature 397
during this period should remain below the limit which affects durability [6] and the 398
maximum temperature used for microwave curing should reflect this. 399
Fig. 12 shows that the top surface mid-point temperatures measured by the thermal camera 400
closely follow the internal temperatures (thermocouple readings) developed during the 45 401
minutes of microwave curing. Thereafter the internal temperatures are higher due to the 402
accelerated heat of hydration. The hot spots developed at the edges of the cube specimens get 403
significantly hotter (Fig. 12, thermal camera, top surface hot spot) but their temperature drops 404
immediately at the end of microwave curing to the level of mid-point surface temperature. 405

20
406
Fig. 11. Typical internal temperature-time relationship for Material 4 (3.38 litres volume) 407
cured at 20 oC. 408
409
410
Fig. 12. Typical internal temperature-time relationship for Material 4 (3.38 litres volume) 411
microwave cured at 132 W for 45 minutes, followed by curing at 20 oC. 412
413
3.7 Permissible Microwave Curing Temperature 414
The maximum temperature of 79 oC reached at the peak of hydration (Fig. 12) is excessive 415
from the considerations of long-term durability [6]. Curing of concrete at temperatures 416
exceeding about 70 oC can lead to durability problems such as delayed ettringite formation 417
and loss of long-term strength [6]. Therefore, limits need to be set to the maximum 418
microwave curing temperature for in-situ curing, taking account of the heat of hydration and 419
0
10
20
30
40
50
60
70
80
90
0 250 500 750 1000 1250
Tem
per
atu
re (
oC
)
Time (mins)
Thermocouple 1(37.5 mm from top surface)
Thermocouple 2(75 mm from top surface)
Thermocouple 3(112.5 mm from top surface)
Thermocouple 4(150 mm from top surface)
Thermal camera(Top surface middle point)
0
10
20
30
40
50
60
70
80
90
0 250 500 750 1000 1250
Tem
per
atu
re (
oC
)
Time (mins)
Thermocouple 1(37.5 mm from top surface)
Thermocouple 2(75 mm from top surface)
Thermocouple 3(112.5 mm from top surface)
Thermocouple 4(150 mm from top surface)
Thermal camera(Top surface middle point)
Thermal camera(Top surface hot spot)

21
temperature variations (hot spots) which occur during microwave curing. This can be done by 420
adopting the following equations to determine the permissible temperature: 421
𝑻𝒎 + 𝜟𝑻𝒉 ≤𝟕𝟎
𝜸𝑻 (5) 422
𝜟𝑻𝒉 = 𝑻𝒉 − 𝑻𝒎 (6) 423
424
where, Tm is the permissible temperature at the end of microwave curing (oC); Th is the peak 425
heat of hydration temperature of unhardened concrete (oC); is the factor of safety 426
accounting for microwave curing temperature variations (hot spots). 427
The temperatures at the hot spots reported in this paper are likely to have been exaggerated 428
by the edge effects of the polystyrene moulds. More accurate information will be obtained 429
from the larger scale trials to be carried out with the microwave curing prototype. In addition, 430
the prototype will adopt a magnetron of higher specifications, which will provide more 431
uniform heating. Consequently, the value of is likely to be small. Most concrete repairs are 432
relatively small (thin) and, therefore, their volume will not cause excessive heat of hydration. 433
The acceleration of hydration by microwave curing, however, can lead to high temperature 434
before the repair hardens thereby raising durability concerns. The upper limit set by durability 435
considerations regulates the maximum microwave curing temperature Tm. The temperature 436
increase relative to the ambient (Ta), T = Tm − Ta available for microwave curing at low 437
ambient temperatures is high and, therefore, exceeding the durability upper limit temperature 438
is less likely to cause a problem than in repairs applied at high ambient temperatures. The 439
authors have used a microwave curing temperature Tm of 40 oC in subsequent tests which 440
recorded a maximum temperature (Tm + Th) of 71.1 oC for seven repair materials [23]. 441
3.8. Effect of ambient temperature on the microwave curing temperature 442

22
A summary of results which include the temperature rise T, the rate of temperature 443
increase (dT/dt) and maximum temperature after microwave curing for 45 minutes at 132 444
Watts, is given in Table 4 for all repair materials prepared at different ambient temperatures. 445
Fig. 13 shows the time-temperature relationships under microwave curing of Repair Material 446
5 prepared at different ambient temperatures of 1.7 oC, 8.9
oC and 15.8
oC (Material 5 mixes 447
1, 2 and 3 respectively, Table 4). The graphs are typical of repair materials 1, 3, 4 and 5 448
(Table 4) which show a linear increase in temperature with time. 449
The results in Table 4 for Materials 1, 3 and 4 show that the temperature rise T achieved 450
after 45 minutes of microwave curing is greater at lower temperature, resulting in a higher 451
rate of temperature rise dT/dt at lower ambient temperatures. For example, the temperature 452
rise of Material 1 at ambient temperature of 3 oC is 0.88
oC/min compared with 0.8
oC/min at 453
17.1 oC ambient temperature. The corresponding rates for Material 3 are 0.74
oC/min and 454
0.59 oC/min for ambient temperatures of 6.5 and 18.3
oC, while the corresponding rates for 455
Material 4 are 0.61 oC/min and 0.47
oC/min for ambient temperatures of 3.2 and 17.8
oC. 456
However, this trend is reversed for repair Material 5 which heats more rapidly at higher 457
ambient temperatures (see Fig. 5). 458
459
Fig. 13. Time-temperature profile of Material 5 prepared at 1.7 oC, 8.9
oC and 15.8
oC and 460
microwave cured for 45 minutes at 132 W. 461
462
463
0
10
20
30
40
50
60
70
0 10 20 30 40 50
Tem
per
atu
re (
oC
)
Time (mins)
Ambient Temperature: 1.7 ˚C
Ambient Temperature: 8.9 ˚C
Ambient Temperature: 15.8 ˚C

23
Table 4 464 Summary of microwave curing temperatures developed at different ambient temperatures. 465
466 Repair
material
Mix Power
(W)
Volume
(L)
Ambient
temperature
(oC)
Maximum
temperature*
(oC)
T
(oC)
ddt
(oC/min)
1 1 132 3.38 3.0 42.5 39.5 0.88
2 10.0 47.2 37.2 0.83
3 17.1 52.9 35.8 0.80
3 1 6.5 39.9 33.4 0.74
2 9.1 43.8 34.7 0.77
3 18.3 45.0 26.7 0.59
4 1 3.2 30.5 27.3 0.61
2 9.9 35.0 25.1 0.56
3 17.8 39.0 21.2 0.47
5 1 1.7 41.4 39.7 0.88
2 8.9 51.7 42.8 0.95
3 15.8 62.2 46.4 1.03
*Temperature measured at the centre of the top surface of cube by using a Flir i7 thermal camera. 467
468
3.9. Effect of steel reinforcement 469
No sparks or arcing was observed during microwave curing of all steel reinforced cube 470
specimens. Typical temperature distributions of a plain (control at 120 Watts), a mild steel 471
reinforced (3 steel bars, 10 mm diameter, 25 mm cover at 120 Watts) and a mild steel 472
reinforced (3 protruding steel bars, 6 mm diameter, 5mm cover at 420 Watts) specimen are 473
shown in Fig. 14a-c, respectively. No significant changes in top surface temperature 474
distribution and mid-point surface temperatures were observed by varying the type of mild 475
steel (galvanised or normal), number of steel bars (1, 2 or 3), bar diameter (10, 8 or 6 mm) or 476
top cover (25, 15 or 5 mm). 477
Fig. 14c shows the extreme case of steel bars protruding from the cube moulds. The 478
temperatures in the protruding parts of the steel bars are on the lower end of the recorded 479
temperature scale and are much lower than the mortar specimen. There was no arcing 480
observed in these tests. 481
The above results are provided to allay health and equipment safety concerns. The effects of 482
microwave curing on the bond strength of the steel reinforcement were also investigated, 483
which will be reported in another paper. 484

24
Fig. 14a. Temperature distribution of plain
(control) mortar specimen after 45 minutes of
microwave curing at 120 W.
Fig. 14b. Temperature distribution of steel
reinforced mortar specimen (3 steel bars, 10
mm diameter, 25 mm top cover) after 45
minutes of microwave curing at 120 W.
Fig. 14c. Temperature distribution of steel reinforced mortar specimen (3 protruding steel
bars, 6 mm diameter, 5 mm top cover) after 15 minutes of microwave curing at 420 W.
485
486
Conclusions 487
The following conclusions can be drawn from the results presented in the paper: 488
Microwave curing is suitable for normal, non-rapid setting repair materials which are not 489
cured to excessively high temperatures. The cumulative total of the microwave curing and 490
the heat of hydration temperatures of the fresh material should be kept below the limit set 491
by durability considerations. 492
Considerable variation of temperature occurs on the surface of microwave cured cubes. 493
This should be taken into account in the cumulative total temperature of the microwave 494
cured material. 495
The temperature during microwave curing increases linearly with time and power input 496
under the recommended moderate limits of microwave curing temperatures. 497

25
Microwave curing accelerates hydration and reduces the time taken to reach peak heat of 498
hydration temperature. 499
The maximum microwave curing temperature is affected by the initial (ambient) 500
temperature of the fresh mix. 501
The rate of temperature increase with microwave curing time (slope dT/dt) increases 502
linearly with the applied power. The rapid setting materials are an exception unless the 503
curing temperature Tm is relatively low. 504
The presence of steel reinforcement in repair mortar does not cause any arcing during 505
microwave curing. This also applies to steel located at very low cover (5 mm) and to 506
exposed steel bars protruding from the mortar surface. 507
508
Acknowledgements 509
The authors gratefully acknowledge the funding provided by the European Commission 7th
510
Framework Programme for the MCure project (Grant No: 605664) which produced this 511
research and developed a prototype for microwave curing of concrete repair. 512
513
References 514
[1] G. Tilly, J. Jacobs, Concrete Repairs: Observations on performance in service and 515
current practice. CONREPNET Project Report. Watford, UK: IHS BRE Press; 2007. 516
[2] P.H. Emmons, D.J. Sordyl, The state of the concrete repair industry and a vision for its 517
future. Concr Repair Bull 2006; 6: 7-14. 518
[3] P.H. Emmons, Concrete repair maintenance illustrated. 1st ed. John Willey and Sons; 519
1992. 520
26
[4] C.K.Y. Leung, T. Pheeraphan, Microwave curing of Portland cement concrete: 521
experimental results and feasibility for practical application. Constr Build Mater 1995; 522
9: 67-73, http://dx.doi.org/10.1016/0950-0618(94)00001-I. 523
[5] F. Parker, W.L. Shoemaker, Rapid-setting PCC pavement patching materials. New 524
pavement materials. American Society of Civil Engineers 1988; 81-95. 525
[6] A.M. Neville, Properties of concrete. 5th
ed. Harlow, Essex: Pearson Education 526
Limited; 2011. 527
[7] K.C.G. Ong, A. Akbarnezhad, Microwave-Assisted Concrete Technology: Production, 528
Demolition and Recycling. 1st ed. Boca Raton, Florida: CRC Press, Taylor and 529
FrancisGroup; 2014. 530
[8] P.S. Mangat, D.J. Catley, A novel low-voltage heating system for curing and protection 531
of early age concrete. Concr Plant International 2005; 4: 106-112. 532
[9] X. Wu, J. Dong, M. Tang, Microwave curing technique in concrete manufacture. Cem 533
Concr Res 1987; 17: 205-210, http://dx.doi.org/10.1016/0008-8846(87)90103-7. 534
[10] K. Grigoriadis, P.S. Mangat, Bond between microwave cured repair and concrete 535
substrate (submitted to Materials and Structures) 536
[11] P. Mangat, K. Grigoriadis, S. Abubakri, Microwave curing of concrete bridge repairs. 537
In: Proceedings of the 16th
European bridge conference. Edinburgh, 2015. 538
[12] N. Makul, B. Chatveera, P. Ratanadecho, Use of microwave energy for accelerated 539
curing of concrete: a review. Songklanakarin J Sci Technol 2009; 31: 1-13. 540
[13] J. Pera, J. Ambroise, M. Farha, Microwave processing of fibre reinforced cement 541
composites. In: Proceedings of the 4th
RILEM international symposium on fibre 542
reinforced cement and concrete. Sheffield 1992. p. 61-9. 543

27
[14] C.K.Y. Leung, T. Pheeraphan, Determination of optimal process for microwave curing 544
of concrete. Cem Concr Res 1997; 27: 463-472, http://dx.doi.org/10.1016/S0008-545
8846(97)00015-X. 546
[15] M.G. Lee, Preliminary study for strength and freeze-thaw durability of microwave and 547
steam-cured concrete. J Mat Civ Eng 2007; 11: 972-6, 548
http://dx.doi.org/10.1061/(ASCE)0899-1561(2007)19:11(972). 549
[16] N. Makul, D.K. Agrawal, Influence of microwave-accelerated curing procedures on the 550
microstructure and strength characteristics of Type I-Portland cement pastes. J Ceram 551
Process Res 2011; 12: 376-381. 552
[17] D. Sohn, D.L. Johnson, Microwave curing effects on the 28-day strength of 553
cementitious materials. Cem Concr Res 1999; 29: 241-7, 554
http://dx.doi.org/10.1016/S0008-8846(98)00189-6. 555
[18] BS EN 197-1, Cement-Part 1: Composition, specifications and conformity criteria for 556
common cements. London (UK): British Standards Institution; 2011. 557
[19] ASTM F1317, Standard test method for calibration of microwave ovens. West 558
Conshohocken, PA, (USA): ASTM International; 1998. 559
[20] BS EN 60705, Household microwave ovens. Methods for measuring performance. 560
London (UK): British Standards Institution; 2012. 561
[21] Y. Shamis, A. Taube, N. Mitik-Dineva, R. Croft, R.J. Crawford, E.P. Ivanova, Specific 562
electromagnetic effects of microwave radiation on escherichia coli. Appl Environ 563
Microbiol 2011; 77(9): 3017-3023, http://dx.doi.org/10.1128/AEM.01899-10. 564
[22] P.S. Mangat, K. Grigoriadis, S. Abubakri, A. Javaid, C. Zhao. Microwave system for 565
in-situ curing of concrete repair. In: Proceedings of the 6th
international conference on 566
concrete repair. Thessaloniki 2016. 567
28
[23] P.S. Mangat, K. Grigoriadis, S. Abubakri. Temperature development in microwave 568
cured repair materials. In: Proceedings of the 6th
international conference on concrete 569
repair. Thessaloniki 2016. 570
[24] C.P. Theo, K.C.G. Ong, C.H. Shum, S.T. Tan, Accelerated heating of precast 571
ferrocement secondary roofing slabs using microwave energy. In: Proceedings of the 572
27th
conference on our world in concrete & structures. Singapore: Singapore Concrete 573
Institute 2002. p. 589-596. 574