Embed Size (px)
Citation preview
1• Microwave Remote Sensing Group
P. Pampaloni
Microwave Remote Sensing Group (MRSG)
Institute of Applied Physics -CNR, Florence, Italy
Microwave remote sensing of soil moisture and snow cover
• crowave Remote Sensing Group
EC. Project EnviSnow- Snow Parameter Retrieval Algorithms
EC. Project Floodman - flood forecasting, warning and management system based on satellite radar images,
ASI- PC Project : Nowcasting
2• Microwave Remote Sensing Group
Introduction
Soil moisture and snow cover area (and physical conditions) play a fundamental role in the energy and hydrologcal budget at global and local scale as well as in dramatic events such as landslides, avalnches and floods.
Soil moisture is a key variable, which influences re-distribution of radiant energy, the runoff, and percolation
Snow represents an important natural reservoir of fresh water and a primary resource for the production of electric power (at least in many countries). Moreover, rapid changes in snow accumulation and physical conditions can cause dramatic events
The estimate of these quantities by using RS methods is very important and a challenge for the research

3• Microwave Remote Sensing Group
The need of Remote Sensing data
Science Issues: Knowledge of the Earth system
Climate changes
Hydrological and carbon cycles
Ocean circulation
Applications
Management of renewable and non renewable resources
Disaster monitoring and forecasting
4• Microwave Remote Sensing Group
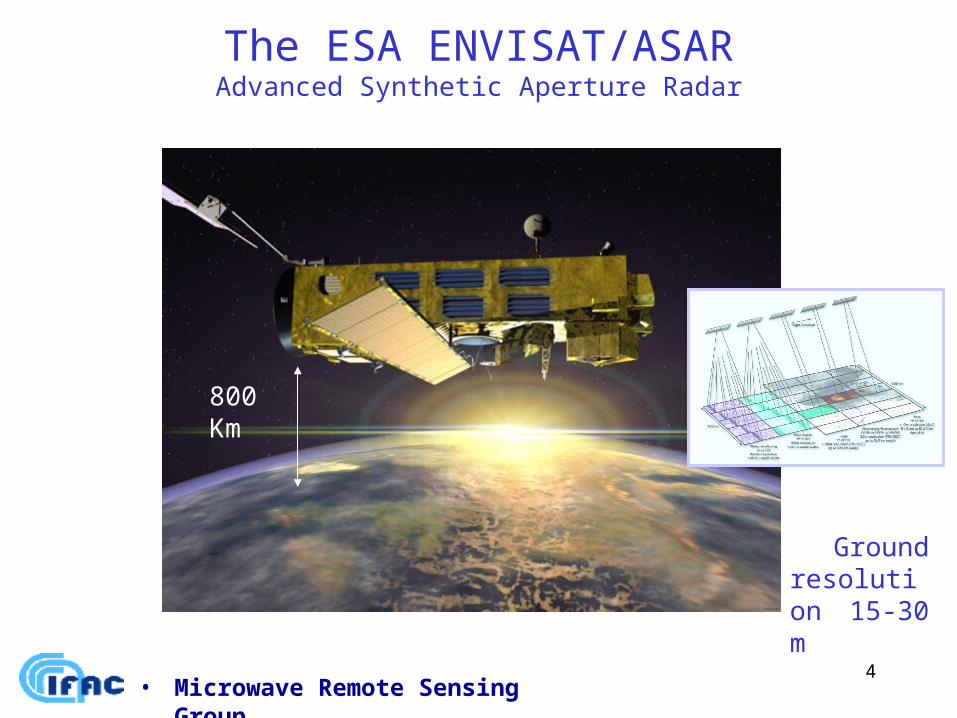
The ESA ENVISAT/ASARAdvanced Synthetic Aperture Radar
800 Km
Ground resolution 15-30 m
5• Microwave Remote Sensing Group
Why microwaves ?
Operation independent of solar light Low sensitivity to clouds and precipitations Strong sensitivity to water in land surfaces Penetration in vegetation, snow (and soil)
6• Microwave Remote Sensing Group
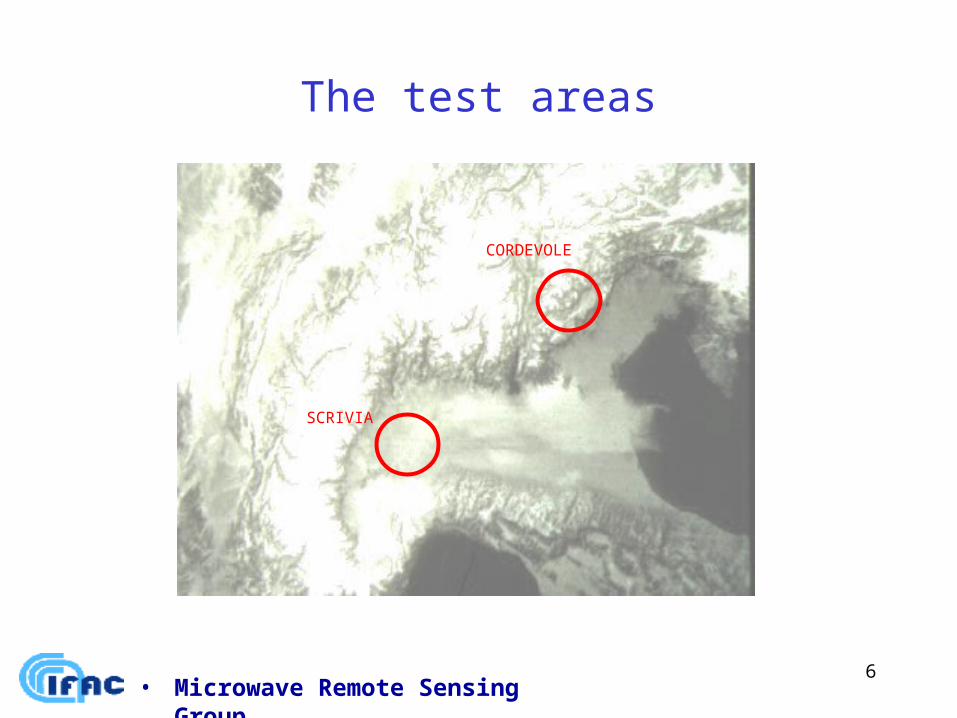
The test areas
SCRIVIA
CORDEVOLE
7• Microwave Remote Sensing Group
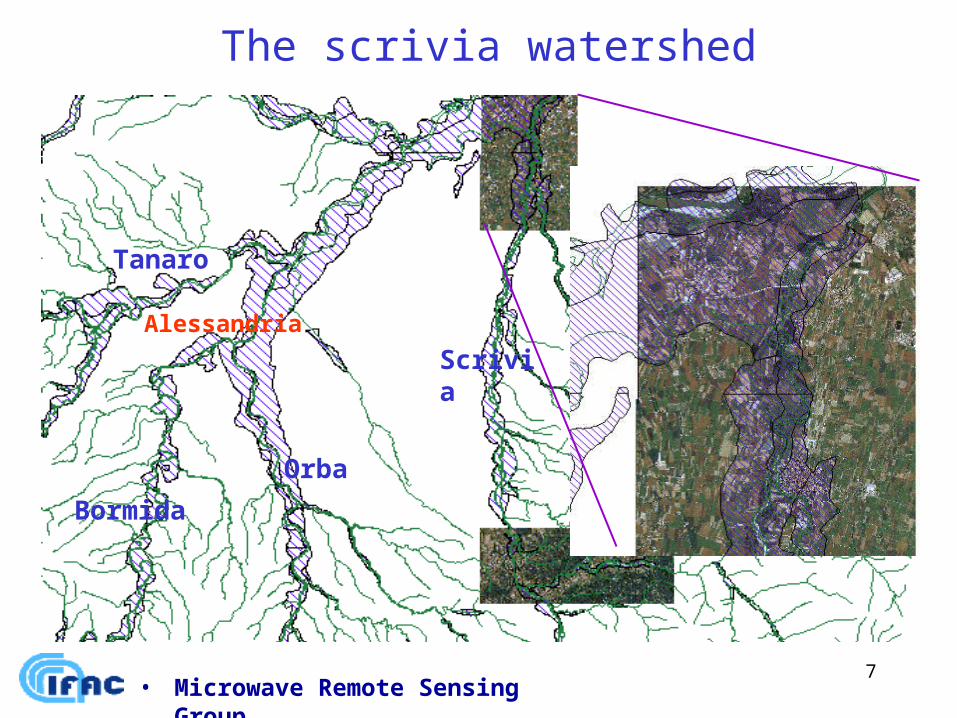
The scrivia watershed Po
Scrivia
Tanaro
Bormida
Orba
Alessandria
8• Microwave Remote Sensing Group
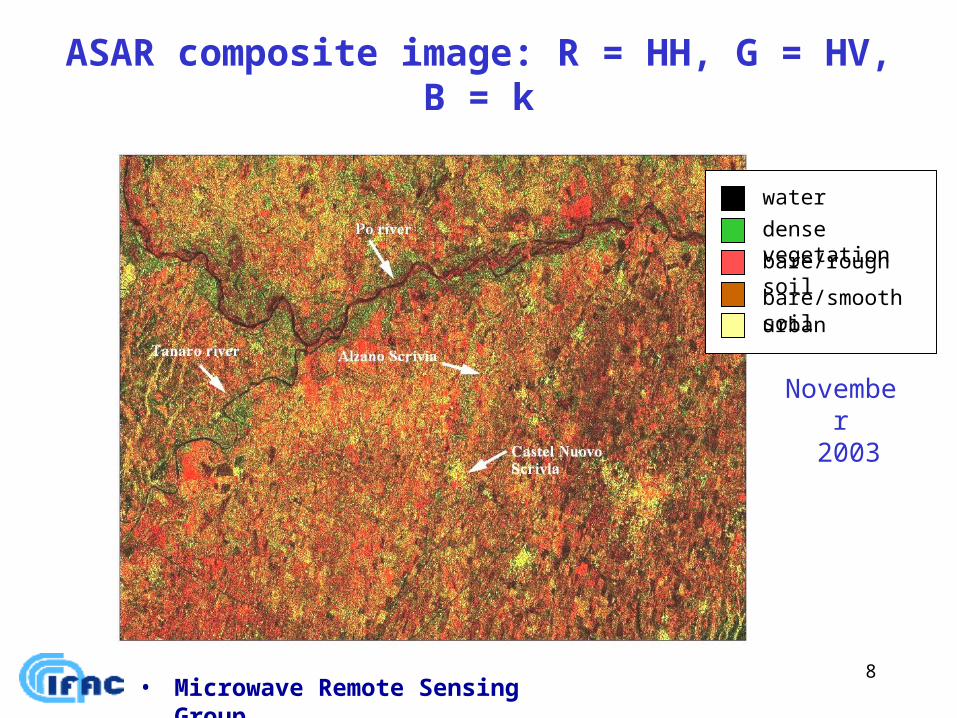
ASAR composite image: R = HH, G = HV, B = k
water
dense vegetationbare/rough soil
urbanbare/smooth soil
November 2003
9• Microwave Remote Sensing Group
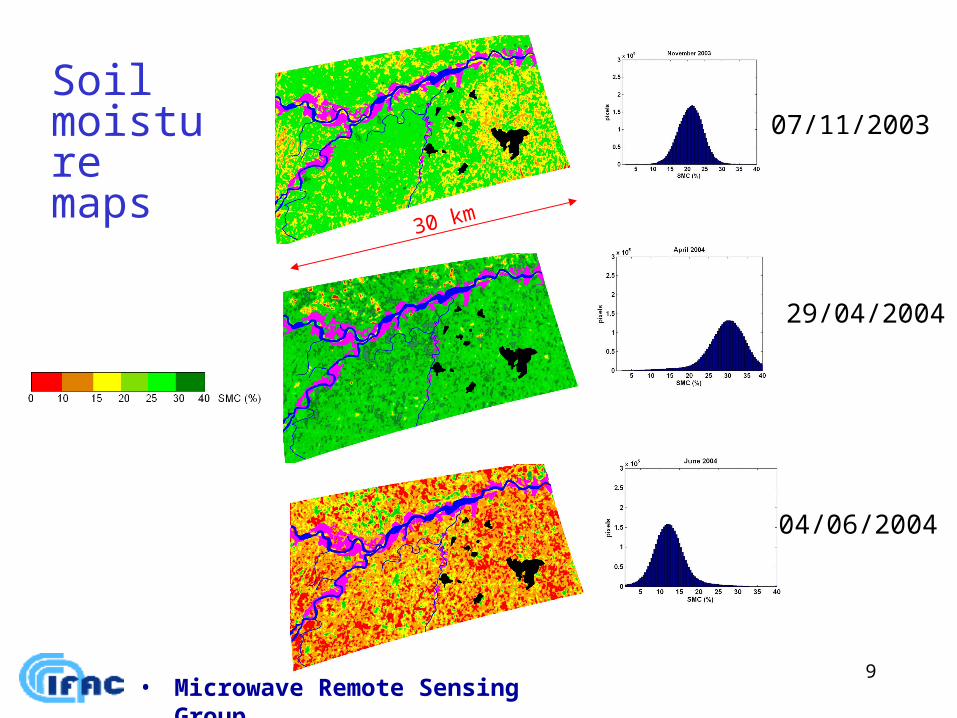
Soil moisture maps
07/11/2003
29/04/2004
04/06/2004
30 km
10• Microwave Remote Sensing Group
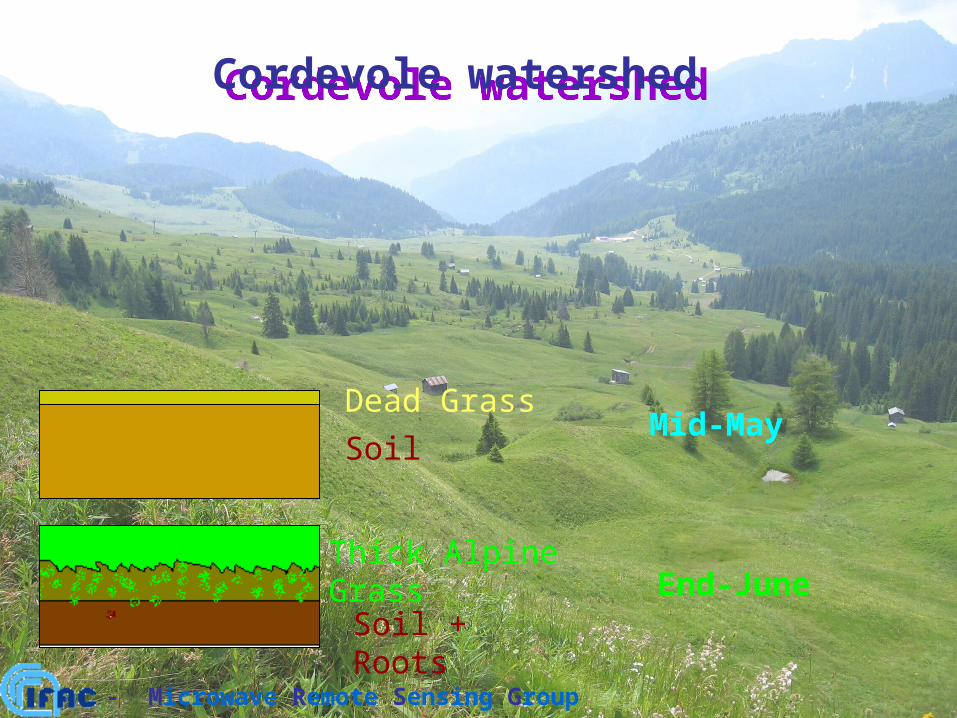
Cordevole watershedCordevole watershed
Thick Alpine Grass
Soil + Roots
Dead Grass
SoilMid-May
End-June
- Microwave Remote Sensing Group
11• Microwave Remote Sensing Group
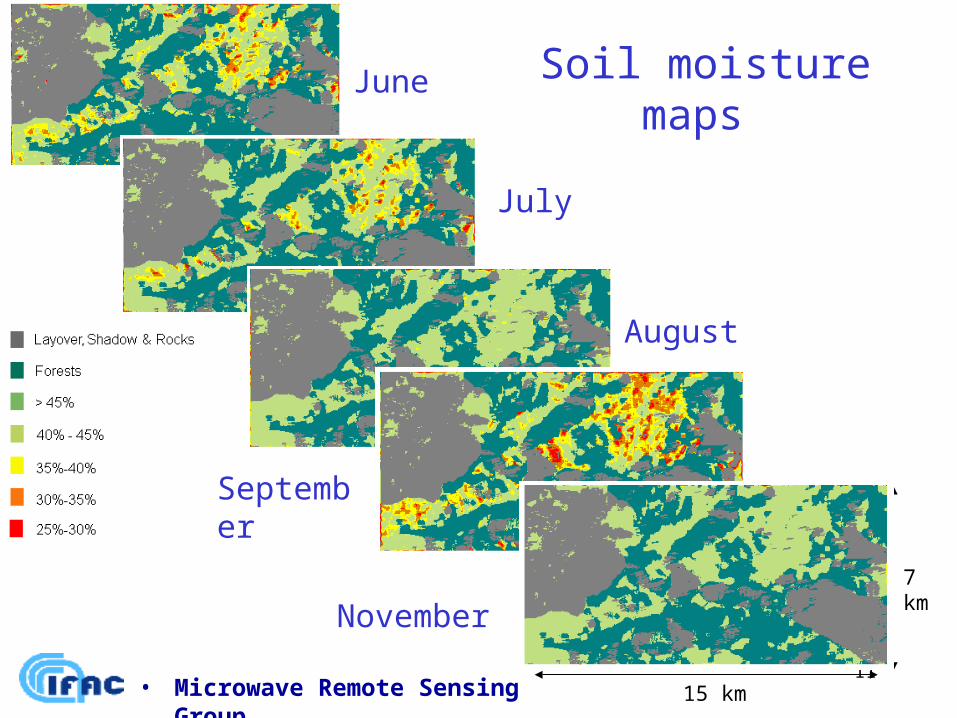
Soil moisture maps
June
July
August
September
15 km
7 km
November
12• Microwave Remote Sensing Group
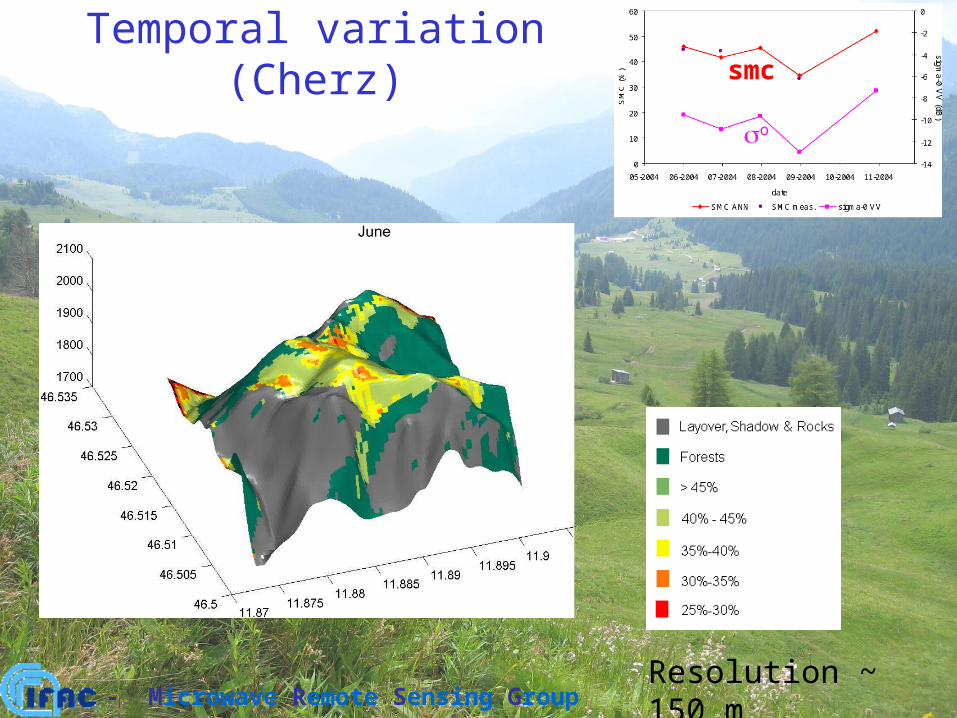
Temporal variation (Cherz)
Resolution ~ 150 m
o
smc
- Microwave Remote Sensing Group
13• Microwave Remote Sensing Group
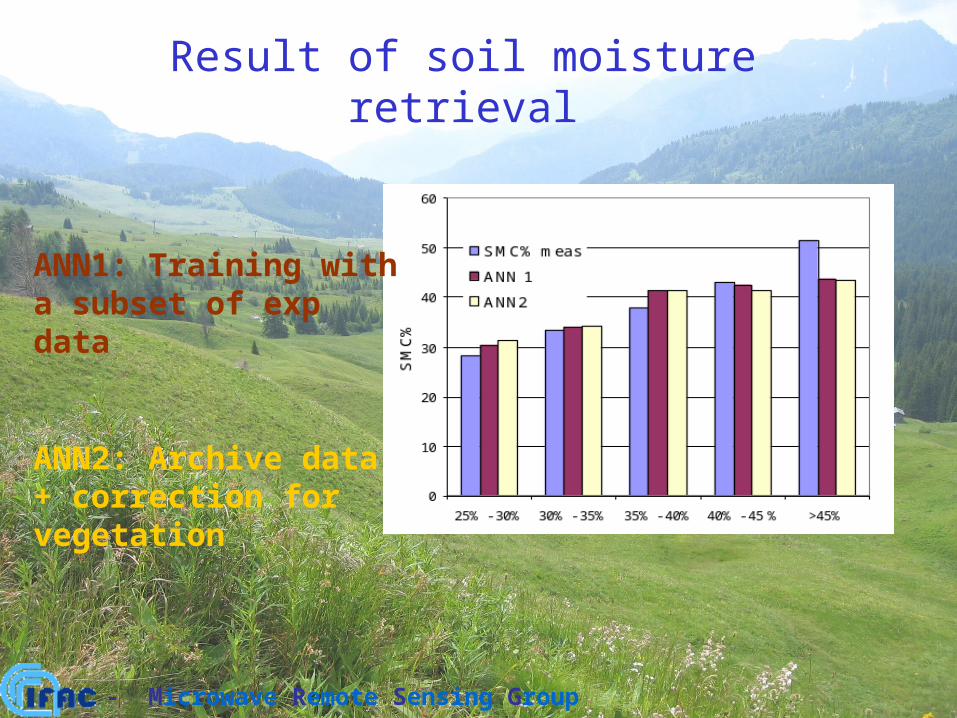
Result of soil moisture retrieval
ANN1: Training with a subset of exp data
ANN2: Archive data + correction for vegetation
- Microwave Remote Sensing Group
14• Microwave Remote Sensing Group
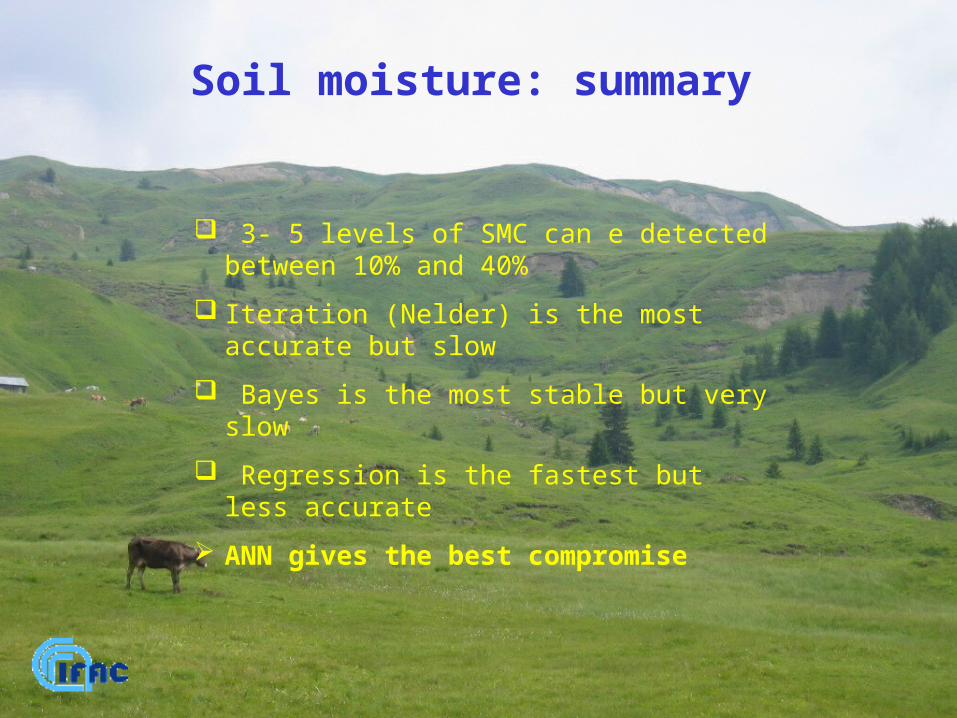
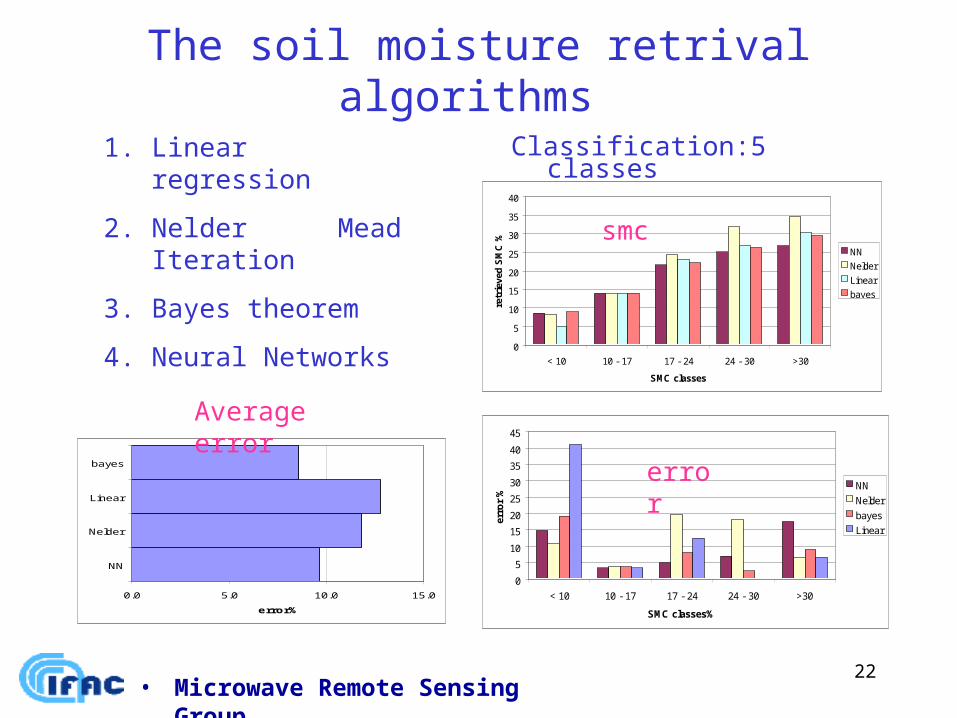
Soil moisture: summary
3- 5 levels of SMC can e detected between 10% and 40%
Iteration (Nelder) is the most accurate but slow
Bayes is the most stable but very slow
Regression is the fastest but less accurate
ANN gives the best compromise
15• Microwave Remote Sensing Group
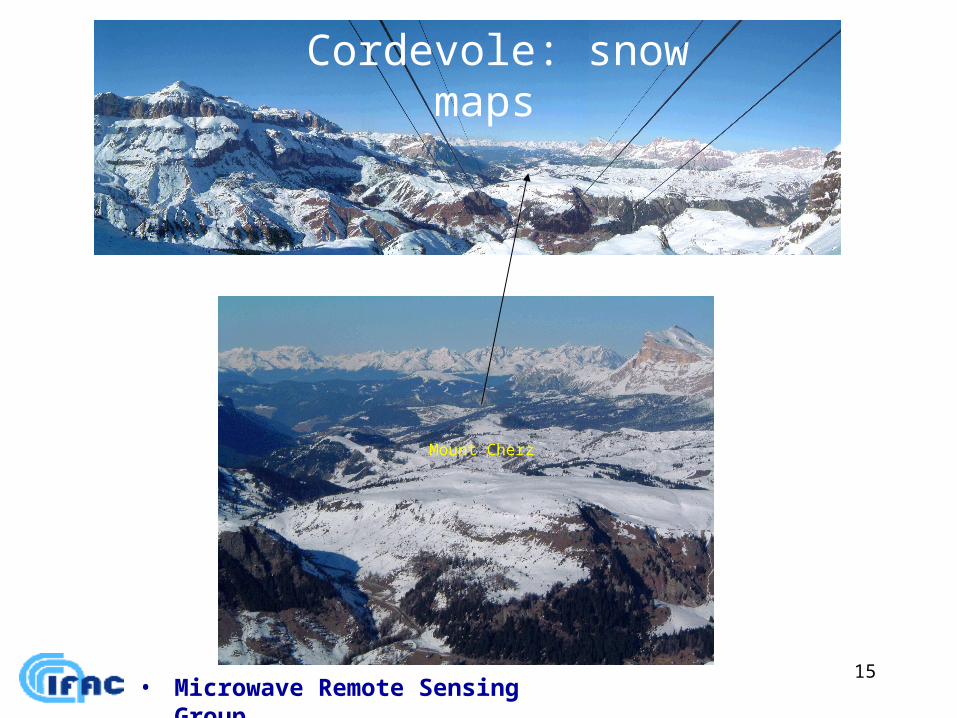
Mount Cherz
Cordevole: snow maps
16• Microwave Remote Sensing Group
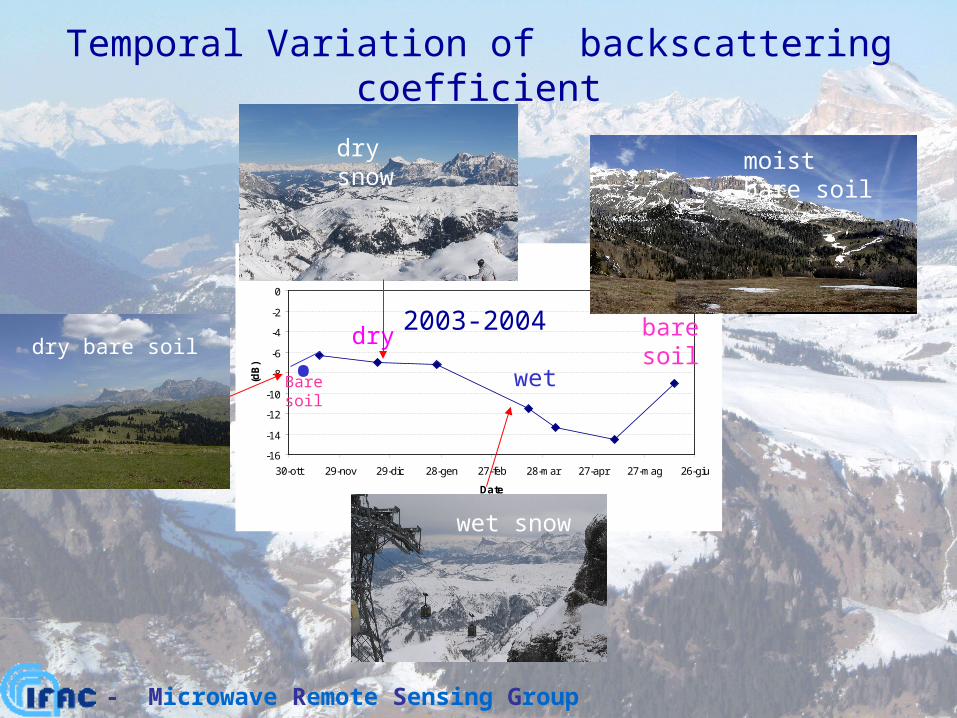
Temporal Variation of backscattering coefficient
- Microwave Remote Sensing Group
o
Backscattering
-16
-14
-12
-10
-8
-6
-4
-2
0
30-ott 29-nov 29-dic 28-gen 27-feb 28-mar 27-apr 27-mag 26-giu
Date
(dB
)
Backscattering
bare soil
2003-2004
wet
dry
o
moist bare soil dry snow
wet snow
dry bare soil .Bare soil
17• Microwave Remote Sensing Group
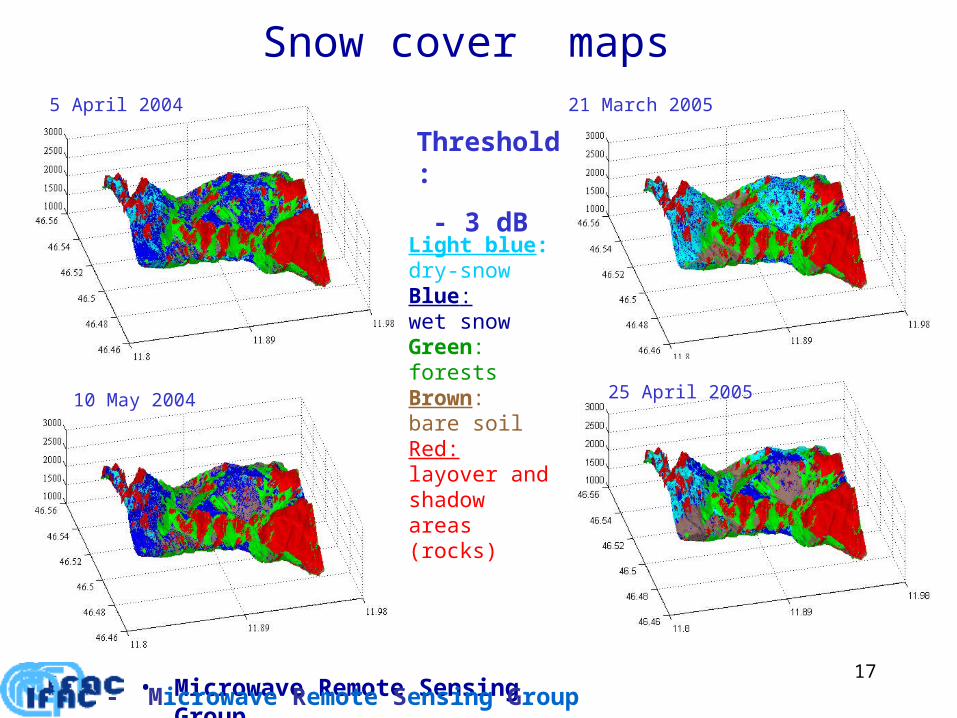
Snow cover maps
- Microwave Remote Sensing Group
Light blue: dry-snow Blue: wet snowGreen: forestsBrown: bare soilRed: layover and shadow areas (rocks)
21 March 2005
25 April 2005
5 April 2004
10 May 2004
Threshold:
- 3 dB
18• Microwave Remote Sensing Group
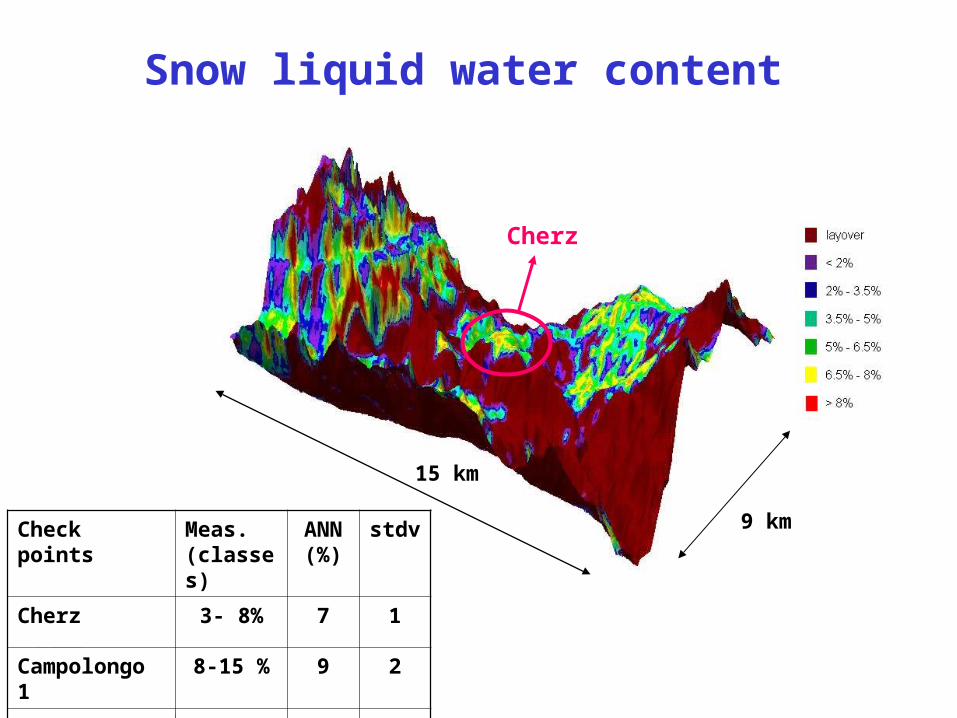
Snow liquid water content
9 km
15 km
Cherz
Check points Meas. (classes)
ANN (%)
stdv
Cherz 3- 8% 7 1
Campolongo 1 8-15 % 9 2
Campolongo 2 8-15 % 10 1
19• Microwave Remote Sensing Group
Thanks for your attention
• crowave Remote Sensing Group
20• Microwave Remote Sensing Group
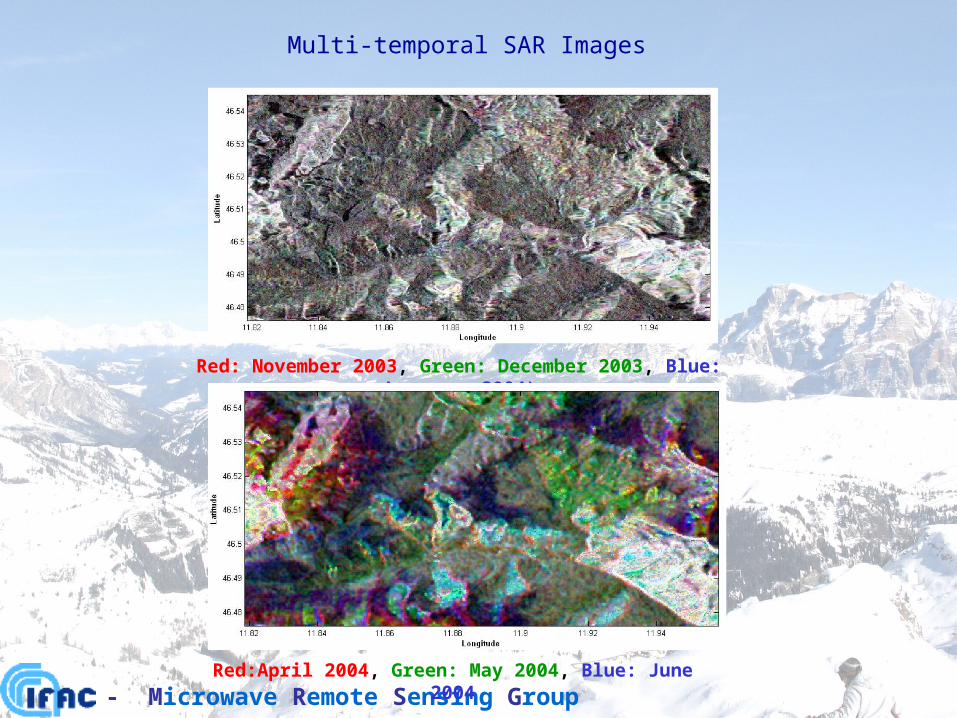
Multi-temporal SAR Images
- Microwave Remote Sensing Group
Red: November 2003, Green: December 2003, Blue: January 2004)
Red:April 2004, Green: May 2004, Blue: June 2004
21• Microwave Remote Sensing Group
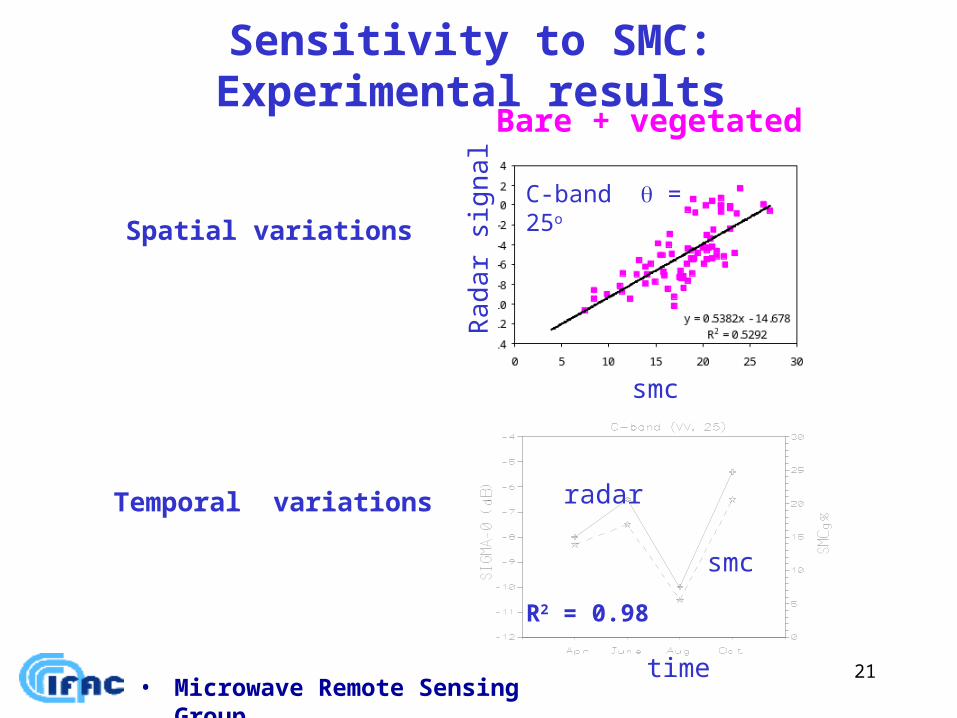
Sensitivity to SMC: Experimental results
Bare + vegetated soils
Spatial variations C-band = 25o
Temporal variations R
ad
ar
sig
nal
R2 = 0.98
smc
time
smc
radar
22• Microwave Remote Sensing Group
The soil moisture retrival algorithms
0
5
10
15
20
25
30
35
40
< 10 10 - 17 17 - 24 24 - 30 >30
SMC classes
retr
ieve
d S
MC
%
NN
Nelder
Linear
bayes
0
5
10
15
20
25
30
35
40
45
< 10 10 - 17 17 - 24 24 - 30 >30
SMC classes%
erro
r %
NN
Nelder
bayes
Linear
0.0 5.0 10.0 15.0
NN
Nelder
Linear
bayes
error%
1. Linear regression
2. Nelder Mead Iteration
3. Bayes theorem
4. Neural Networks
Classification:5 classes
smc
error
Average error


![Technical Seminar Presentation-2004 MICROWAVE REMOTE SENSING Kishore Kumar ParidaEC200117313 [1] Microwave Remote Sensing (MRS) Presented by Kishore Kumar](https://img.pdfslide.net/doc/110x75/56649eb35503460f94bba821/technical-seminar-presentation-2004-microwave-remote-sensing-kishore-kumar.jpg)