Embed Size (px)
Citation preview
Mid-femur geometry and biomechanicalproperties in 15- to 18-yr-old female athletes
CRAIG S. DUNCAN, CAMERON J. R. BLIMKIE, ALLAN KEMP, WILLIAM HIGGS, CHRISTOPHER T. COWELL,HELEN WOODHEAD, JULIE N. BRIODY, and ROBERT HOWMAN-GILES
The University of Sydney, The Australian Catholic University, The New Children’s Hospital, Sydney, AUSTRALIA; andMcMaster University, Hamilton, CANADA
ABSTRACT
DUNCAN, C. S., C. J. R. BLIMKIE, A. KEMP, W. HIGGS, C. T. COWELL, H. WOODHEAD, J. N. BRIODY, and R.HOWMAN-GILES. Mid-femur geometry and biomechanical properties in 15- to 18-yr-old female athletes. Med. Sci. Sports Exerc.,Vol. 34, No. 4, pp. 673–681, 2002. Purpose: Right-leg mid-femur geometry and biomechanical indices of bone strength werecompared among elite cyclists (CYC), runners (RUN), swimmers (SWIM), triathletes (TRI), and controls (C)—10 subjects per group.Methods: Bone cross-sectional areas (CSA), volumes (Vol), and cross-sectional moments of inertia (CSMI) were assessed by magneticresonance imaging (MRI), and cortical volumetric bone density (volBMD) was determined as the quotient of DXA-derived bonemineral content (BMC) and MRI-derived cortical bone volume. Bone strength index (BSI) was calculated as the product of corticalvolBMD and CSMI. Results: RUN had higher (P � 0.05) size- (femur length and body mass) adjusted (ANCOVA) cortical CSA thanC, SWIM, and CYC; and higher size, age, and years of sport-specific training- (YST) adjusted cortical CSA than SWIM and CYC.TRI had higher (P � 0.05) size-adjusted CSA than SWIM. SWIM and CYC had significantly larger (P � 0.05) size-adjusted medullarycavity CSA than RUN and TRI, and the difference between CYC and RUN persisted after additional adjustment for age and YST. RUNhad significantly (P � 0.05) greater size-adjusted CSMI and BSI than C, SWIM, and CYC; and higher size, age, and YST-adjustedCSMI and BSI than SWIM and CYC. Mid-femur areal bone mineral density (BMD) was significantly (P � 0.05) higher for RUNcompared with CYC only, but there were no other differences among groups for BMC, bone volumes, or volumetric total or corticalBMD. Conclusions: Running, a weight-bearing exercise, is associated with more favorable geometric and biomechanical character-istics in relation to bone strength, compared with the weight supported activities of swimming and cycling. Differences may reflectskeletal adaptations to the specific mechanical-loading patterns inherent in these sports. Key Words: ELITE FEMALE ATHLETES,BMD AND CONTENT, MID-FEMUR CROSS-SECTIONAL AREAS, MOMENT OF INERTIA AND VOLUMES, BONESTRENGTH INDEX, WEIGHT-BEARING AND WEIGHT SUPPORTED ACTIVITY, MRI
The influence of physical activity on bone mass, con-tent (BMC), and density (BMD) has been extensivelyinvestigated in both growing animals (27,28) and
young children (2,5,10). The results of these studies suggestthat increased mechanical loading has a positive influenceon bone mineral status when the nature, magnitude, andduration of exercise are adequate. These adaptations alsoappear to be greater in the developing (5), compared withthe mature, skeleton (7). Increasing physical activity duringchildhood has therefore been proposed as a primary strategyfor optimizing peak bone mass (2,5), an identified predictorof fracture risk in later adult life (20).
To date, most of the physical activity studies of childrenand adolescents have focused on bone mineral mass ordensity as the surrogate measures of in vivo bone strength(2,4,5,29). These are clinically valid measures in the contextof osteoporosis, as bone mass and density correlate signif-icantly with fracture force in in vitro studies and are signif-icant predictors of fracture risk in adult humans (3,20).
However, the physical relationship between bone densityand propensity to fracture under conditions of controlledloading is quite variable, with a large proportion of unex-plained variance (21–88%) between bone density and bonestrength (11). Additionally, there is considerable overlap inBMD between subjects presenting with either osteoporoticor nonosteoporotic fractures (e.g., stress fractures) and thosewho are fracture free (6). These findings suggest that otherfactors besides bone mineral status, including perhaps bonegeometry, biomechanical, and material properties, may playan important role in determining bone strength and func-tional competency at all stages of the life cycle in humans.
The influence of exercise on these nonmineral propertiesof bone has not been extensively investigated in children(�19 yr of age). The paucity of information on geometricand biomechanical adaptations to exercise in this populationstems mostly from technological limitations in measuringthese parameters accurately and with minimal health risk.Studies utilizing computed tomography (QCT or pQCT)expose children to undesirable levels of radiation, and DXA,because of its uni-planar nature, may have limited accuracyand reliability in measuring internal dimensions and biome-chanical properties, and is incapable of providing 3-D anal-ysis of long-bone geometry.
0195-9131/02/3404-0673/$3.00/0MEDICINE & SCIENCE IN SPORTS & EXERCISE®
Copyright © 2002 by the American College of Sports Medicine
Submitted for publication February 2001.Accepted for publication July 2001.
673
A new approach was used recently (11), which combinedmeasures of bone mineral (cortical volBMD) and biome-chanical (CSMI) properties derived from pQCT, to estimatein vivo bone strength (bone strength index; BSI) of the ratfemur. BSI correlated more strongly with actual fractureload than either BMD or CSMI, suggesting that this mightbe a more useful predictor of fracture risk than currentlyused indices. We (30) have recently developed a similarapproach using nonionizing MRI to measure gross geometryand biomechanical properties of the mid-femur in children,and in combination with regional BMC measures fromDXA, estimates of in vivo bone strength. This is the firststudy that we are aware of that has combined these tech-nologies to compare in vivo bone geometry and biomechani-cal characteristics among athletes from sports with substan-tially different mechanical-loading patterns. This approachprovides a useful noninvasive research model for examiningbiological adaptability of the long bones to myriad loadingconditions across multiple fronts (e.g., bone density, geom-etry, and biomechanical characteristics) in humans. Whetherthis approach can be extended to other sites and provesclinically useful (e.g., in the diagnosis of osteoporosis)remains to be determined.
The purpose of this study therefore, was to comparelong-bone (femur) total and cortical volumetric BMD, ge-ometry, biomechanical, and estimated bone-strength char-acteristics of elite teenage female athletes from sports withsubstantially different mechanical-loading patterns. Bonegeometry and biomechanical characteristics derived fromMRI, and BMC from DXA were combined to estimate truevolumetric bone density and in vivo bone strength index,similar to the approach used by Ferretti et al. (11). Across-sectional study design, incorporating elite female ath-letes was used that compared triathletes to athletes whospecialized in either swimming, cycling, or running. Tria-thlon, a new Olympic sport comprised of swimming, cy-cling, and running events involves both weight-bearing andnonweight-bearing exercise and an unusual load distributionpattern. With this model, we are able to compare differencesin bone geometry and biomechanical characteristics be-tween weight-bearing (running) and nonweight-bearing (cy-cling and swimming) sports, with a sport that incorporatesboth types of loading conditions (triathlon). We hypothe-sized that runners with relatively high-volume weight-bear-ing loads would have increased gross-bone geometry andbiomechanical properties compared with all other groups,that triathletes would be intermediate between the runnersand the other groups (because their sport includes an ele-ment of weight-bearing, albeit at lower volume), and thatthere would be no difference between controls and thenonweight-bearing athletes, the swimmers and cyclists.
MATERIALS AND METHODS
Study participants. Fifty female subjects, aged 15–18yr were recruited for this study. Groups were comprised ofswimmers, cyclists, runners, triathletes, and nonathletic con-trols (N � 10/group). Subjects comprised a subsample of
volunteers from a larger study (9), who were able to committo an additional hour of testing for MRI scanning. Allathletes specialized in endurance events and were eitherstate- or national-level representatives. Athletes participatedin at least 8·wk�1 of training and/or competition during theprevious year. Furthermore, two cyclists, swimmers, andrunners, and one triathlete performed supplemental strengthtraining ranging from 30 to 60 min, and 1 to 3 times perweek. Because there were no within-group differences (val-ues were within the 95% confidence intervals) for any of thedependent variables between subjects who strength trainedand those who did not, subjects who did supplemental strengthtraining were retained in their original groups for subsequentdata analysis. Controls were involved in less than 2 h·wk�1 ofphysical activity and had never been involved in elite compet-itive sport. All subjects were Caucasian, and girls were post-menarchal by at least 1 yr, having had eight or more menstrualcycles during the previous 12 months.
This study was approved jointly by the Human EthicsCommittee of the University of Sydney and The New Chil-dren’s Hospital, Sydney. An investigator explained the pro-cedures and requirements, and then each participant gavewritten informed consent.
Procedures. Participants were required to make onevisit to our laboratory for a period of 3 h. During this time,bone geometry, BMD, anthropometry, general health, andphysical activity were assessed. All procedures were con-ducted at The Children’s Hospital, Westmead, and TheChildren’s Hospital Institute of Sports Medicine, whichadjoins the hospital. Measurements were completed within1 month of the respective sports’ national championships, tocoincide with peak training loads.
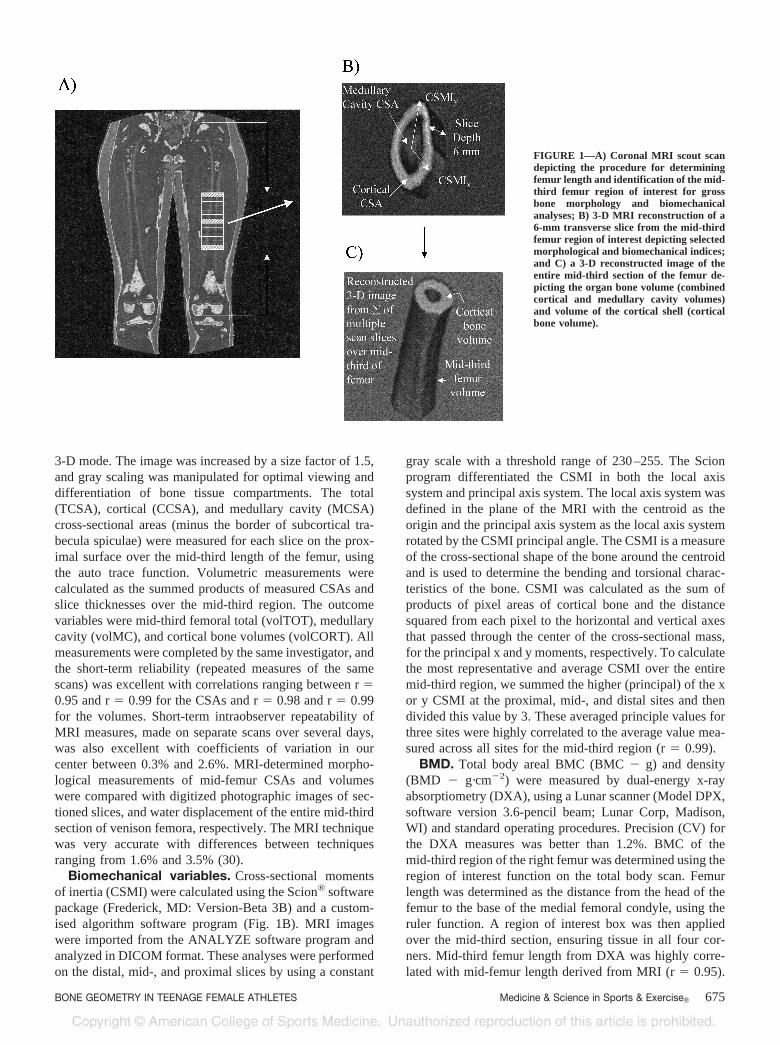
Bone morphology. Bone geometry of the mid-sectionof the right femur was measured by MRI using a 1.5-TeslaPhilips ACS-NT MRI (The Netherlands) scanner with amanufacturer supplied body coil. The mid-third section wasidentified from an initial scout scan in the coronal plane ofthe full length of the femur, and was measured as thedistance from the head of the femur to the base of the medialfemoral condyle (Fig. 1a). Subjects were required to removeall metal and to relax in a supine position in the magnetaperture with their leg firmly supported in a custom builtholding device for approximately 40 min. Images wereacquired with a proton density weighted 2-D Turbo spinecho sequence (TE/TR/�15 ms/1600 ms) for both the scoutand acquisition images. Contiguous transverse images (slicethickness � 6 mm, FOV � 250 mm, in plane pixel reso-lution � 488 �m2) perpendicular to the long axis of thefemur were made of the mid-third section, proceeding in adistal to proximal direction. Images were burned to CD-ROM in DICOM format and then analyzed off-line on adedicated computer system.
Measures of bone geometry were obtained using theANALYZE® software program (Mayo Foundation, Roch-ester: MN, version 7.0) on a Windows NT platform. Imageswere imported from CD-ROM in DICOM format, and con-verted into ANALYZE format before analysis. The imagewas then analyzed using the region of interest function, in
674 Official Journal of the American College of Sports Medicine http://www.acsm-msse.org
3-D mode. The image was increased by a size factor of 1.5,and gray scaling was manipulated for optimal viewing anddifferentiation of bone tissue compartments. The total(TCSA), cortical (CCSA), and medullary cavity (MCSA)cross-sectional areas (minus the border of subcortical tra-becula spiculae) were measured for each slice on the prox-imal surface over the mid-third length of the femur, usingthe auto trace function. Volumetric measurements werecalculated as the summed products of measured CSAs andslice thicknesses over the mid-third region. The outcomevariables were mid-third femoral total (volTOT), medullarycavity (volMC), and cortical bone volumes (volCORT). Allmeasurements were completed by the same investigator, andthe short-term reliability (repeated measures of the samescans) was excellent with correlations ranging between r �0.95 and r � 0.99 for the CSAs and r � 0.98 and r � 0.99for the volumes. Short-term intraobserver repeatability ofMRI measures, made on separate scans over several days,was also excellent with coefficients of variation in ourcenter between 0.3% and 2.6%. MRI-determined morpho-logical measurements of mid-femur CSAs and volumeswere compared with digitized photographic images of sec-tioned slices, and water displacement of the entire mid-thirdsection of venison femora, respectively. The MRI techniquewas very accurate with differences between techniquesranging from 1.6% and 3.5% (30).
Biomechanical variables. Cross-sectional momentsof inertia (CSMI) were calculated using the Scion® softwarepackage (Frederick, MD: Version-Beta 3B) and a custom-ised algorithm software program (Fig. 1B). MRI imageswere imported from the ANALYZE software program andanalyzed in DICOM format. These analyses were performedon the distal, mid-, and proximal slices by using a constant
gray scale with a threshold range of 230–255. The Scionprogram differentiated the CSMI in both the local axissystem and principal axis system. The local axis system wasdefined in the plane of the MRI with the centroid as theorigin and the principal axis system as the local axis systemrotated by the CSMI principal angle. The CSMI is a measureof the cross-sectional shape of the bone around the centroidand is used to determine the bending and torsional charac-teristics of the bone. CSMI was calculated as the sum ofproducts of pixel areas of cortical bone and the distancesquared from each pixel to the horizontal and vertical axesthat passed through the center of the cross-sectional mass,for the principal x and y moments, respectively. To calculatethe most representative and average CSMI over the entiremid-third region, we summed the higher (principal) of the xor y CSMI at the proximal, mid-, and distal sites and thendivided this value by 3. These averaged principle values forthree sites were highly correlated to the average value mea-sured across all sites for the mid-third region (r � 0.99).
BMD. Total body areal BMC (BMC � g) and density(BMD � g·cm�2) were measured by dual-energy x-rayabsorptiometry (DXA), using a Lunar scanner (Model DPX,software version 3.6-pencil beam; Lunar Corp, Madison,WI) and standard operating procedures. Precision (CV) forthe DXA measures was better than 1.2%. BMC of themid-third region of the right femur was determined using theregion of interest function on the total body scan. Femurlength was determined as the distance from the head of thefemur to the base of the medial femoral condyle, using theruler function. A region of interest box was then appliedover the mid-third section, ensuring tissue in all four cor-ners. Mid-third femur length from DXA was highly corre-lated with mid-femur length derived from MRI (r � 0.95).
FIGURE 1—A) Coronal MRI scout scandepicting the procedure for determiningfemur length and identification of the mid-third femur region of interest for grossbone morphology and biomechanicalanalyses; B) 3-D MRI reconstruction of a6-mm transverse slice from the mid-thirdfemur region of interest depicting selectedmorphological and biomechanical indices;and C) a 3-D reconstructed image of theentire mid-third section of the femur de-picting the organ bone volume (combinedcortical and medullary cavity volumes)and volume of the cortical shell (corticalbone volume).
BONE GEOMETRY IN TEENAGE FEMALE ATHLETES Medicine & Science in Sports & Exercise� 675
A total body phantom (constructed of aluminum strips andrice bags mounted together—as recommended by LunarCorp.) was used for quality control during the study period.The CV was 1.5% for mid-femur BMC.
The same investigator completed and analyzed all scansusing standard analysis protocols. The percent body fat andlean tissue mass (g) were also obtained from the total bodyscan. The CV was 4.9% for lean tissue mass (LTM). Par-ticipants wore light clothing without zippers or buttons andremoved all jewelry for the scanning procedures.
Bone strength index. The bone strength index of theentire mid-third region of the femur was determined by usinga previously published equation: bone strength index (BSI) �CSMI � Volumetric Cortical BMD (11). The CSMI wasobtained as previously described in the biomechanical vari-ables of the Materials and Methods section. The volumetriccortical BMD was derived as the quotient of DXA-derivedmid-femoral BMC divided by the MRI-derived mid-femoralcortical bone volume (volCORT). BSI is a measure of thecombined influences of bone mineral status and the distributionof this mineral within the bone organ, to bone strength.
Normalization for size. In addition to mechanicalloading, measures of bone morphology and biomechanicalindices may also be influenced by interindividual variationin both bone size and body mass. All measures of absoluteCSAs, CSMI, and BSI were therefore adjusted (ANCOVA)for the covariates body mass and femur length (from MRI),to account for these potential confounding size influences.Body mass rather than lean body mass was used as theadjustment for body size, because differences among groupsfor the dependent variables were identical, regardless ofwhich of these variables was used, and because the gravi-tational influence on the skeleton during weight-bearingactivity is determined by the mass of the subject, indepen-dent of its composition.
Dietary intake. Participants were given written and ver-bal instructions regarding accurate and thorough completionof a 3-d diet history. All foods and beverages were recordedfor 2 weekdays and 1 day on the weekend. This diary wasreturned to the investigators and the data analyzed using theServe (Sydney, Australia) dietary analysis program, to as-certain average daily total energy and calcium intakes.
Physical activity, training, and medical histories.A physical activity questionnaire (NSW Schools PhysicalActivity Questionnaire, 1998) was completed on the day oftesting to determine the activity levels of controls. Thisquestionnaire solicited information on the frequency, type,and duration of activities over the previous year. Athleteswere required to record their training history for a period of2 wk after testing. Years of total and sport-specific (YST)training (e.g., swimming, running, cycling) as well asweekly average total training hours, including supplementalforms of training, were recorded. Athletes were given verbaland written instructions on how to complete this diary. Amedical history questionnaire was used to identify men-strual status, cigarette consumption, and medication usage.The questionnaire was completed at the time of testing withthe aid of an investigator.
Statistical analysis. A one-way analysis of variance(ANOVA) was used to identify differences among groupsfor all raw data. Post hoc analysis was performed only forvariables with a significant main effect in ANOVA. Bonegeometry and biomechanical variables were also adjustedfor possible size influences (body mass and femur length) byusing ANCOVA. Additionally, to account for the possibleinfluence of differences in age, and YST, all measures ofsize-adjusted bone morphology (CSAs) and biomechanicalindices (CSMI and BSI) were also adjusted using AN-COVA, with age and YST as covariates. Due to the expenseof, and limited access to MRI, the sample size in this studywas relatively small. Accepting these constraints, we haveused the relatively low stringency LSD post hoc test todetermine differences among groups. Observed statisticalpower was above 0.80 for all bone geometry and biome-chanical variables except total CSA, with a power of 0.75.The statistical software program SPSS version 8.0 (Chicago,IL) was used for all data analysis, and differences wereconsidered significant if P � 0.05.
RESULTS
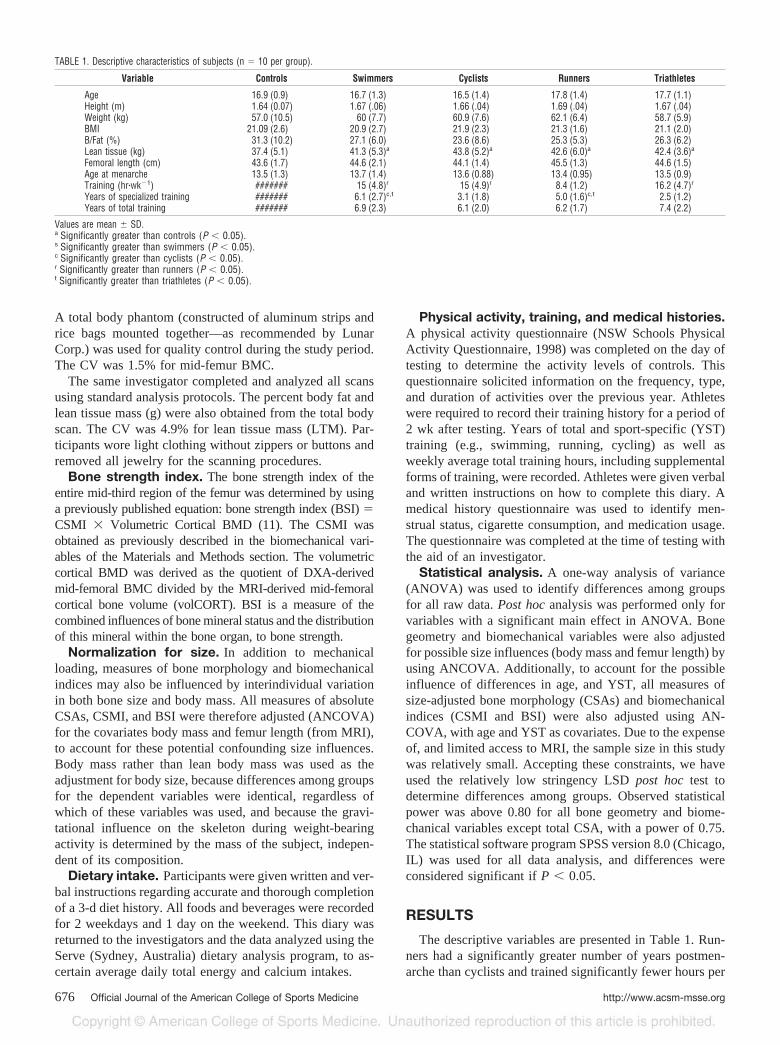
The descriptive variables are presented in Table 1. Run-ners had a significantly greater number of years postmen-arche than cyclists and trained significantly fewer hours per
TABLE 1. Descriptive characteristics of subjects (n � 10 per group).
Variable Controls Swimmers Cyclists Runners Triathletes
Age 16.9 (0.9) 16.7 (1.3) 16.5 (1.4) 17.8 (1.4) 17.7 (1.1)Height (m) 1.64 (0.07) 1.67 (.06) 1.66 (.04) 1.69 (.04) 1.67 (.04)Weight (kg) 57.0 (10.5) 60 (7.7) 60.9 (7.6) 62.1 (6.4) 58.7 (5.9)BMI 21.09 (2.6) 20.9 (2.7) 21.9 (2.3) 21.3 (1.6) 21.1 (2.0)B/Fat (%) 31.3 (10.2) 27.1 (6.0) 23.6 (8.6) 25.3 (5.3) 26.3 (6.2)Lean tissue (kg) 37.4 (5.1) 41.3 (5.3)a 43.8 (5.2)a 42.6 (6.0)a 42.4 (3.6)a
Femoral length (cm) 43.6 (1.7) 44.6 (2.1) 44.1 (1.4) 45.5 (1.3) 44.6 (1.5)Age at menarche 13.5 (1.3) 13.7 (1.4) 13.6 (0.88) 13.4 (0.95) 13.5 (0.9)Training (hr�wk�1) ####### 15 (4.8)r 15 (4.9)r 8.4 (1.2) 16.2 (4.7)r
Years of specialized training ####### 6.1 (2.7)c,t 3.1 (1.8) 5.0 (1.6)c,t 2.5 (1.2)Years of total training ####### 6.9 (2.3) 6.1 (2.0) 6.2 (1.7) 7.4 (2.2)
Values are mean � SD.a Significantly greater than controls (P � 0.05).s Significantly greater than swimmers (P � 0.05).c Significantly greater than cyclists (P � 0.05).r Significantly greater than runners (P � 0.05).t Significantly greater than triathletes (P � 0.05).
676 Official Journal of the American College of Sports Medicine http://www.acsm-msse.org
week than all other sport groups. Runners specialized intheir sport significantly longer than triathletes, and swim-mers had specialized in their sport significantly longer thanboth triathletes and cyclists. All sport groups had signifi-cantly larger lean tissue mass (LTM) than controls.
There were no significant differences in dietary calciumintake (controls 671 mg � 170 mg, swimmers 988 mg �270 mg, cyclists 873 mg � 254 mg, runners 984 mg � 536mg, and triathletes 681 mg � 413 mg) among groups.Likewise, average daily energy intakes were similar (P �0.05) across groups, ranging from 7109 � 1352 to 9806 �2418 kJ (means � SD).
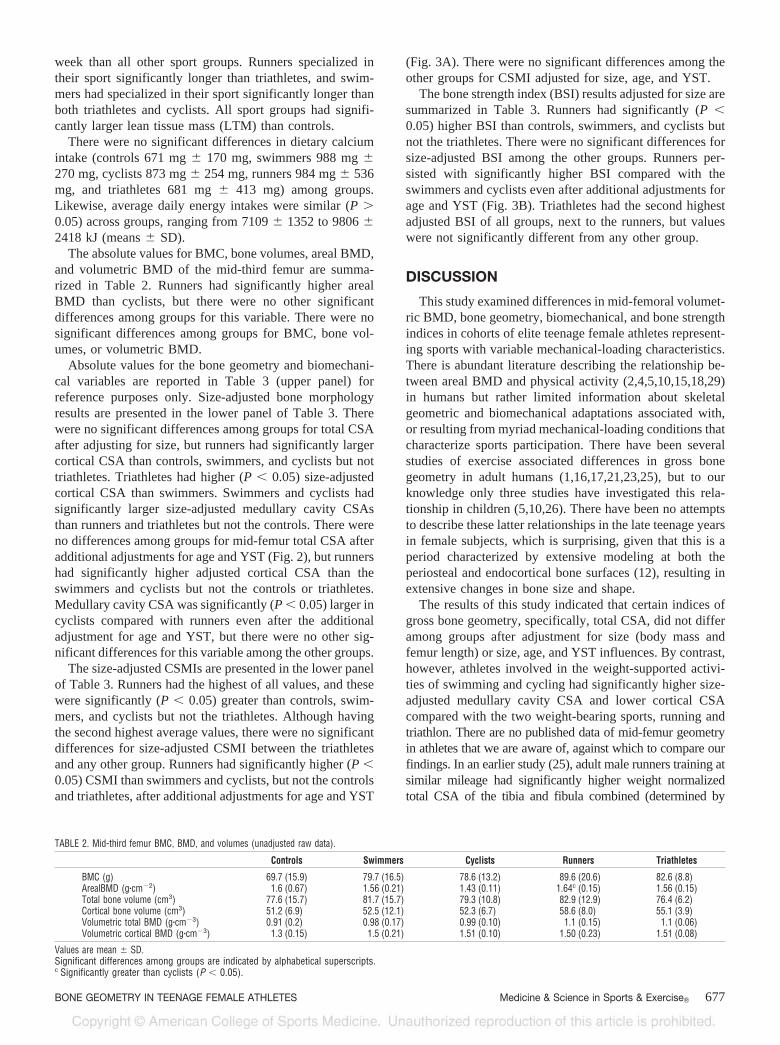
The absolute values for BMC, bone volumes, areal BMD,and volumetric BMD of the mid-third femur are summa-rized in Table 2. Runners had significantly higher arealBMD than cyclists, but there were no other significantdifferences among groups for this variable. There were nosignificant differences among groups for BMC, bone vol-umes, or volumetric BMD.
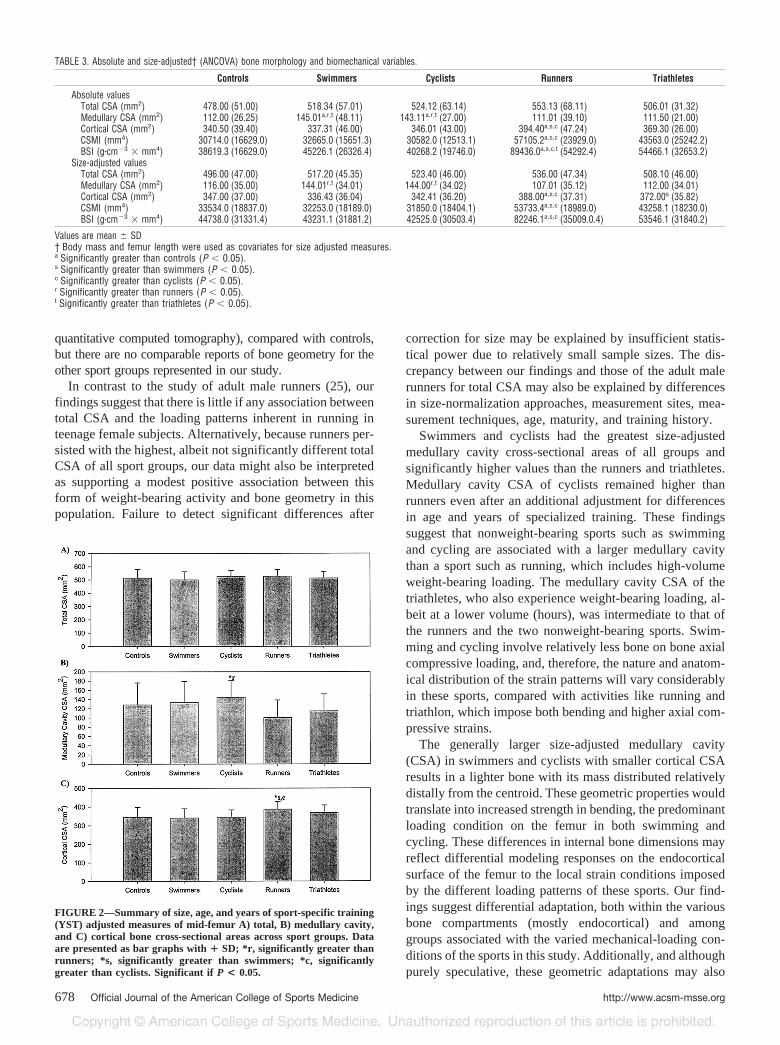
Absolute values for the bone geometry and biomechani-cal variables are reported in Table 3 (upper panel) forreference purposes only. Size-adjusted bone morphologyresults are presented in the lower panel of Table 3. Therewere no significant differences among groups for total CSAafter adjusting for size, but runners had significantly largercortical CSA than controls, swimmers, and cyclists but nottriathletes. Triathletes had higher (P � 0.05) size-adjustedcortical CSA than swimmers. Swimmers and cyclists hadsignificantly larger size-adjusted medullary cavity CSAsthan runners and triathletes but not the controls. There wereno differences among groups for mid-femur total CSA afteradditional adjustments for age and YST (Fig. 2), but runnershad significantly higher adjusted cortical CSA than theswimmers and cyclists but not the controls or triathletes.Medullary cavity CSA was significantly (P � 0.05) larger incyclists compared with runners even after the additionaladjustment for age and YST, but there were no other sig-nificant differences for this variable among the other groups.
The size-adjusted CSMIs are presented in the lower panelof Table 3. Runners had the highest of all values, and thesewere significantly (P � 0.05) greater than controls, swim-mers, and cyclists but not the triathletes. Although havingthe second highest average values, there were no significantdifferences for size-adjusted CSMI between the triathletesand any other group. Runners had significantly higher (P �0.05) CSMI than swimmers and cyclists, but not the controlsand triathletes, after additional adjustments for age and YST
(Fig. 3A). There were no significant differences among theother groups for CSMI adjusted for size, age, and YST.
The bone strength index (BSI) results adjusted for size aresummarized in Table 3. Runners had significantly (P �0.05) higher BSI than controls, swimmers, and cyclists butnot the triathletes. There were no significant differences forsize-adjusted BSI among the other groups. Runners per-sisted with significantly higher BSI compared with theswimmers and cyclists even after additional adjustments forage and YST (Fig. 3B). Triathletes had the second highestadjusted BSI of all groups, next to the runners, but valueswere not significantly different from any other group.
DISCUSSION
This study examined differences in mid-femoral volumet-ric BMD, bone geometry, biomechanical, and bone strengthindices in cohorts of elite teenage female athletes represent-ing sports with variable mechanical-loading characteristics.There is abundant literature describing the relationship be-tween areal BMD and physical activity (2,4,5,10,15,18,29)in humans but rather limited information about skeletalgeometric and biomechanical adaptations associated with,or resulting from myriad mechanical-loading conditions thatcharacterize sports participation. There have been severalstudies of exercise associated differences in gross bonegeometry in adult humans (1,16,17,21,23,25), but to ourknowledge only three studies have investigated this rela-tionship in children (5,10,26). There have been no attemptsto describe these latter relationships in the late teenage yearsin female subjects, which is surprising, given that this is aperiod characterized by extensive modeling at both theperiosteal and endocortical bone surfaces (12), resulting inextensive changes in bone size and shape.
The results of this study indicated that certain indices ofgross bone geometry, specifically, total CSA, did not differamong groups after adjustment for size (body mass andfemur length) or size, age, and YST influences. By contrast,however, athletes involved in the weight-supported activi-ties of swimming and cycling had significantly higher size-adjusted medullary cavity CSA and lower cortical CSAcompared with the two weight-bearing sports, running andtriathlon. There are no published data of mid-femur geometryin athletes that we are aware of, against which to compare ourfindings. In an earlier study (25), adult male runners training atsimilar mileage had significantly higher weight normalizedtotal CSA of the tibia and fibula combined (determined by
TABLE 2. Mid-third femur BMC, BMD, and volumes (unadjusted raw data).
Controls Swimmers Cyclists Runners Triathletes
BMC (g) 69.7 (15.9) 79.7 (16.5) 78.6 (13.2) 89.6 (20.6) 82.6 (8.8)ArealBMD (g�cm�2) 1.6 (0.67) 1.56 (0.21) 1.43 (0.11) 1.64c (0.15) 1.56 (0.15)Total bone volume (cm3) 77.6 (15.7) 81.7 (15.7) 79.3 (10.8) 82.9 (12.9) 76.4 (6.2)Cortical bone volume (cm3) 51.2 (6.9) 52.5 (12.1) 52.3 (6.7) 58.6 (8.0) 55.1 (3.9)Volumetric total BMD (g�cm�3) 0.91 (0.2) 0.98 (0.17) 0.99 (0.10) 1.1 (0.15) 1.1 (0.06)Volumetric cortical BMD (g�cm�3) 1.3 (0.15) 1.5 (0.21) 1.51 (0.10) 1.50 (0.23) 1.51 (0.08)
Values are mean � SD.Significant differences among groups are indicated by alphabetical superscripts.c Significantly greater than cyclists (P � 0.05).
BONE GEOMETRY IN TEENAGE FEMALE ATHLETES Medicine & Science in Sports & Exercise� 677
quantitative computed tomography), compared with controls,but there are no comparable reports of bone geometry for theother sport groups represented in our study.
In contrast to the study of adult male runners (25), ourfindings suggest that there is little if any association betweentotal CSA and the loading patterns inherent in running inteenage female subjects. Alternatively, because runners per-sisted with the highest, albeit not significantly different totalCSA of all sport groups, our data might also be interpretedas supporting a modest positive association between thisform of weight-bearing activity and bone geometry in thispopulation. Failure to detect significant differences after
correction for size may be explained by insufficient statis-tical power due to relatively small sample sizes. The dis-crepancy between our findings and those of the adult malerunners for total CSA may also be explained by differencesin size-normalization approaches, measurement sites, mea-surement techniques, age, maturity, and training history.
Swimmers and cyclists had the greatest size-adjustedmedullary cavity cross-sectional areas of all groups andsignificantly higher values than the runners and triathletes.Medullary cavity CSA of cyclists remained higher thanrunners even after an additional adjustment for differencesin age and years of specialized training. These findingssuggest that nonweight-bearing sports such as swimmingand cycling are associated with a larger medullary cavitythan a sport such as running, which includes high-volumeweight-bearing loading. The medullary cavity CSA of thetriathletes, who also experience weight-bearing loading, al-beit at a lower volume (hours), was intermediate to that ofthe runners and the two nonweight-bearing sports. Swim-ming and cycling involve relatively less bone on bone axialcompressive loading, and, therefore, the nature and anatom-ical distribution of the strain patterns will vary considerablyin these sports, compared with activities like running andtriathlon, which impose both bending and higher axial com-pressive strains.
The generally larger size-adjusted medullary cavity(CSA) in swimmers and cyclists with smaller cortical CSAresults in a lighter bone with its mass distributed relativelydistally from the centroid. These geometric properties wouldtranslate into increased strength in bending, the predominantloading condition on the femur in both swimming andcycling. These differences in internal bone dimensions mayreflect differential modeling responses on the endocorticalsurface of the femur to the local strain conditions imposedby the different loading patterns of these sports. Our find-ings suggest differential adaptation, both within the variousbone compartments (mostly endocortical) and amonggroups associated with the varied mechanical-loading con-ditions of the sports in this study. Additionally, and althoughpurely speculative, these geometric adaptations may also
FIGURE 2—Summary of size, age, and years of sport-specific training(YST) adjusted measures of mid-femur A) total, B) medullary cavity,and C) cortical bone cross-sectional areas across sport groups. Dataare presented as bar graphs with � SD; *r, significantly greater thanrunners; *s, significantly greater than swimmers; *c, significantlygreater than cyclists. Significant if P < 0.05.
TABLE 3. Absolute and size-adjusted† (ANCOVA) bone morphology and biomechanical variables.
Controls Swimmers Cyclists Runners Triathletes
Absolute valuesTotal CSA (mm2) 478.00 (51.00) 518.34 (57.01) 524.12 (63.14) 553.13 (68.11) 506.01 (31.32)Medullary CSA (mm2) 112.00 (26.25) 145.01a,r,t (48.11) 143.11a,r,t (27.00) 111.01 (39.10) 111.50 (21.00)Cortical CSA (mm2) 340.50 (39.40) 337.31 (46.00) 346.01 (43.00) 394.40a,s,c (47.24) 369.30 (26.00)CSMI (mm4) 30714.0 (16629.0) 32665.0 (15651.3) 30582.0 (12513.1) 57105.2a,s,c (23929.0) 43563.0 (25242.2)BSI (g�cm�3 � mm4) 38619.3 (16629.0) 45226.1 (26326.4) 40268.2 (19746.0) 89436.0a,s,c,t (54292.4) 54466.1 (32653.2)
Size-adjusted valuesTotal CSA (mm2) 496.00 (47.00) 517.20 (45.35) 523.40 (46.00) 536.00 (47.34) 508.10 (46.00)Medullary CSA (mm2) 116.00 (35.00) 144.01r,t (34.01) 144.00r,t (34.02) 107.01 (35.12) 112.00 (34.01)Cortical CSA (mm2) 347.00 (37.00) 336.43 (36.04) 342.41 (36.20) 388.00a,s,c (37.31) 372.00s (35.82)CSMI (mm4) 33534.0 (18837.0) 32253.0 (18189.0) 31850.0 (18404.1) 53733.4a,s,c (18989.0) 43258.1 (18230.0)BSI (g�cm�3 � mm4) 44738.0 (31331.4) 43231.1 (31881.2) 42525.0 (30503.4) 82246.1a,s,c (35009.0.4) 53546.1 (31840.2)
Values are mean � SD† Body mass and femur length were used as covariates for size adjusted measures.a Significantly greater than controls (P � 0.05).s Significantly greater than swimmers (P � 0.05).c Significantly greater than cyclists (P � 0.05).r Significantly greater than runners (P � 0.05).t Significantly greater than triathletes (P � 0.05).
678 Official Journal of the American College of Sports Medicine http://www.acsm-msse.org
confer a performance advantage in swimming and cyclingby minimizing the external mass to be acted upon duringmovement in both sports and by increasing buoyancy inswimming.
Runners had the largest size-adjusted CSMIs, and theseresults were significantly greater than controls and bothnonweight-bearing sports. The differences between runnersand the nonweight-bearing sports swimming and cyclingpersisted even after further adjustments were made for ageand years of sport-specific training. The CSMI of the tria-thletes was intermediate to the runners and the other sportgroups. There is scant literature on the relationship betweentraining and skeletal CSMI in humans. Two recent studies,however, have failed to demonstrate a positive relationshipbetween increased weight bearing and CSMI in bones of thelower limbs in children (5) and adults (19). Our resultssuggest a positive association between mid-femur CSMIand weight bearing, but not weight-supported activity, atleast among the teenage athletes investigated in this study.The discrepancy between studies may be explained by dif-ferences in loading characteristics, bone measurement sites,age, maturity, and training histories.
The CSMI is a biomechanical variable that reflects andcorrelates with the strength of bone in bending (18,19).Whereas bending would be the predominant loading condi-tion in the nonweight-bearing sports of swimming and cy-cling, the weight-bearing sports of running and triathlonwould, in addition to relatively high bending forces, alsoinclude substantial axial-compressive loading. The observeddifferences in CSMI between the weight-supported and
weight-bearing groups in our study, therefore, may reflectthe differential nature of the loading conditions (e.g., dif-ferences in the absolute and relative magnitudes of bending,compressive, and torsional strains, as well as differences inmuscle moments) inherent in these sports. Furthermore,these differences may reflect sport-specific training adapta-tions favoring optimization of bone geometry for perfor-mance enhancement in these sports.
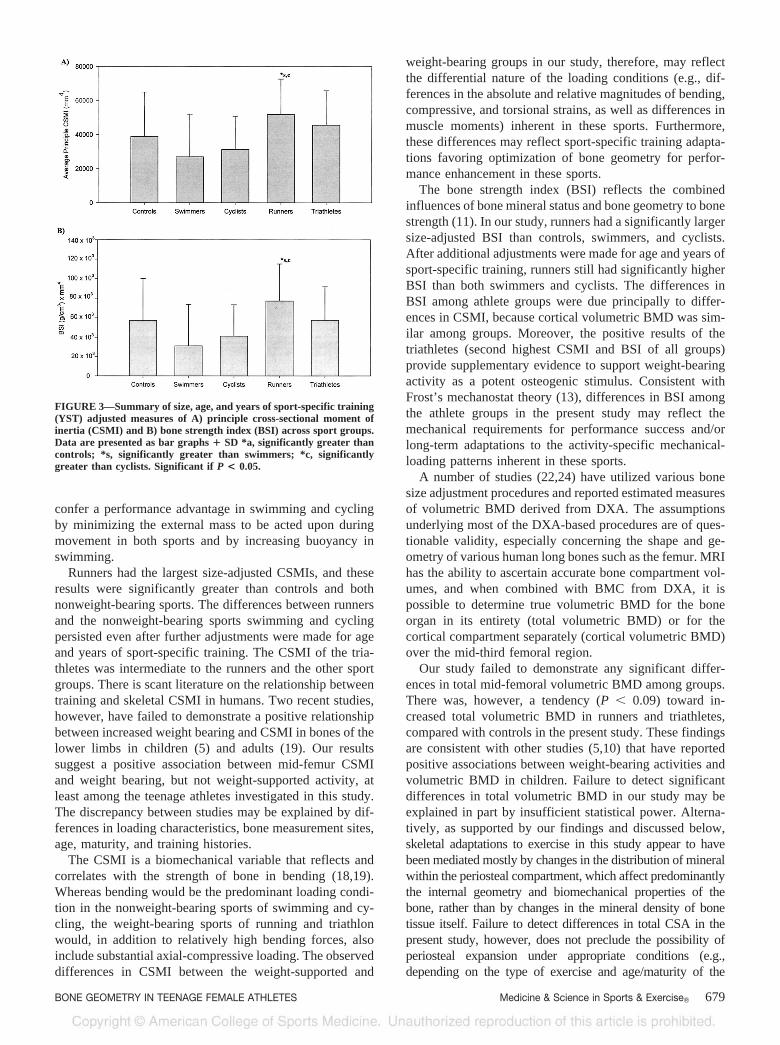
The bone strength index (BSI) reflects the combinedinfluences of bone mineral status and bone geometry to bonestrength (11). In our study, runners had a significantly largersize-adjusted BSI than controls, swimmers, and cyclists.After additional adjustments were made for age and years ofsport-specific training, runners still had significantly higherBSI than both swimmers and cyclists. The differences inBSI among athlete groups were due principally to differ-ences in CSMI, because cortical volumetric BMD was sim-ilar among groups. Moreover, the positive results of thetriathletes (second highest CSMI and BSI of all groups)provide supplementary evidence to support weight-bearingactivity as a potent osteogenic stimulus. Consistent withFrost’s mechanostat theory (13), differences in BSI amongthe athlete groups in the present study may reflect themechanical requirements for performance success and/orlong-term adaptations to the activity-specific mechanical-loading patterns inherent in these sports.
A number of studies (22,24) have utilized various bonesize adjustment procedures and reported estimated measuresof volumetric BMD derived from DXA. The assumptionsunderlying most of the DXA-based procedures are of ques-tionable validity, especially concerning the shape and ge-ometry of various human long bones such as the femur. MRIhas the ability to ascertain accurate bone compartment vol-umes, and when combined with BMC from DXA, it ispossible to determine true volumetric BMD for the boneorgan in its entirety (total volumetric BMD) or for thecortical compartment separately (cortical volumetric BMD)over the mid-third femoral region.
Our study failed to demonstrate any significant differ-ences in total mid-femoral volumetric BMD among groups.There was, however, a tendency (P � 0.09) toward in-creased total volumetric BMD in runners and triathletes,compared with controls in the present study. These findingsare consistent with other studies (5,10) that have reportedpositive associations between weight-bearing activities andvolumetric BMD in children. Failure to detect significantdifferences in total volumetric BMD in our study may beexplained in part by insufficient statistical power. Alterna-tively, as supported by our findings and discussed below,skeletal adaptations to exercise in this study appear to havebeen mediated mostly by changes in the distribution of mineralwithin the periosteal compartment, which affect predominantlythe internal geometry and biomechanical properties of thebone, rather than by changes in the mineral density of bonetissue itself. Failure to detect differences in total CSA in thepresent study, however, does not preclude the possibility ofperiosteal expansion under appropriate conditions (e.g.,depending on the type of exercise and age/maturity of the
FIGURE 3—Summary of size, age, and years of sport-specific training(YST) adjusted measures of A) principle cross-sectional moment ofinertia (CSMI) and B) bone strength index (BSI) across sport groups.Data are presented as bar graphs � SD *a, significantly greater thancontrols; *s, significantly greater than swimmers; *c, significantlygreater than cyclists. Significant if P < 0.05.
BONE GEOMETRY IN TEENAGE FEMALE ATHLETES Medicine & Science in Sports & Exercise� 679
subjects), as such associations have been documented exten-sively in human exercise studies (16,21,23,25).
Our data suggest that interpretation of the putative influ-ence of exercise on bone adaptation may vary, depending onwhether comparisons are made solely on the basis of arealand compartmentalized (e.g., cortical) volumetric BMD orconcurrently with the additional consideration of differencesin bone geometry and biomechanical characteristics. Therewere no significant differences in areal (with the exceptionof the difference between runners and cyclist), total volu-metric, or cortical volumetric BMD among groups in thepresent study, suggesting a lack of association betweenexercise, regardless of its nature (weight-bearing or non-weight-bearing), bone mineralization, and, by inference,bone strength. By contrast, our findings clearly indicate apositive association between weight-bearing exercise andbone biomechanical indices (CSMI and BSI) that reflectdifferences in the distribution of mineral within the variousbone compartments and increased bone strength. The higherCSMI and BSI in runners and intermediate (between run-ners and the other groups) levels in triathletes would provideincreased resistance (bone strength) to the relatively highbending strains induced by weight-bearing during runningin both sports.
Our findings also suggest that the significant difference inareal BMD between the runners and cyclists was due en-tirely to differences in bone size, because the difference didnot persist when BMC was normalized for cortical bonevolume. The DXA technique adjusts BMC for scanned bonearea, not bone volume, and this limitation may misrepresenttrue tissue level volumetric BMD differences or changes inhuman exercise studies. A similar finding was also reportedin a recent study (16), where the greater BMC in the dom-inant arm of tennis players, compared with the nondominantarm, was primarily due to differences in bone size. Addi-tionally, the similarity in cortical volumetric BMD amonggroups suggests that the constituent mineral density of cor-tical bone tissue is largely independent of the nature of thesport-specific loading patterns inherent in the sports inves-tigated in this study. The gross morphology of bone (espe-cially the endocortical compartment) and its biomechanicalcharacteristics appear to be more strongly associated withsport-specific loading patterns inherent in this study than theconstituent mineral composition of the tissue itself. Whetherthese findings apply to other skeletal regions and to othersports remains to be determined.
Collectively, these findings suggest that caution is war-ranted in the interpretation of bone strength adaptations toexercise based solely on differences in areal or volumetricBMD. DXA-derived areal and volumetric bone densitymeasures are insensitive to changes in internal bone geom-etry and biomechanical properties, and may not provide anaccurate estimate of bone strength in human exercise stud-ies. For a more thorough understanding of skeletal adapta-tions to exercise in humans, future studies should, in addi-tion to the traditional measures of BMC and BMD, alsoinclude measurements of bone geometry and biomechanical
properties. This is perhaps an even more important issue inthe developing, compared with the mature, skeleton, giventhe dramatic changes that occur in both internal and externalbone dimensions during growth in humans (12).
We have used a simple qualitative approach in this studyto differentiate the mechanical-loading characteristics of thevarious sports in terms of the relative contributions of com-pressive, torsional, and bending stresses placed on the femurduring specific sport activities. We were unable to quantifythe actual or relative contributions of ground reaction forcesand muscle moments acting on the femur, which ultimatelyinduce the aforementioned compressive, bending, and tor-sional stresses during these sport activities. Given the vari-ability in muscle force requirements among different sports,and the putative importance of muscle force in osteogenicdifferentiation (14), this would seem an interesting andnecessary follow-up to the current investigation.
Because this is a cross-sectional study, selection biascannot be discounted as a possible explanation for the ob-served differences in gross bone geometry and biomechani-cal outcomes among groups. It makes little biological sense,however, to suggest that participation in these competitivesports is due entirely to selection based on larger bonedimensions. If differences were due entirely to selection onthis basis, then this would be evident in both nonspecific aswell as site-specific skeletal adaptations. This is clearly notthe case in the present study, where there were no differ-ences in stature (a general measure of overall skeletal size)or femur length among the various groups of athletes. Fur-thermore, there were no differences in BMD of the skull(2.05 � 0.15–2.17 � 0.19 g·cm�2 means � SD; P � 0.05)among groups, which some investigators (8) interpret asevidence against selection bias. Collectively, these findingssuggest that the observed differences in bone geometry andbiomechanical characteristics in our study are more likelyassociated with the sport- and site-specific loading patternsinherent to these sports than to selection bias based onskeletal size. Lastly, the validity of the MRI-derivedestimates of volumetric BMD are dependent on the as-sumption of equal cortical bone porosity among groups;at comparable stages of maturity and in conditions ofgood health, as was the case for all subjects in the presentstudy, we have no reason to believe that this assumptionis incorrect.
In conclusion, our results in part support our hypothesisof a positive association between running, a weight-bearingsport, and mid-femur geometry and biomechanical indicesin female teenagers. These positive associations were notonly evident in the runners but also in triathletes, whoincluded only 4 h of weight-bearing (running) into theirregular weekly training program. These findings suggestthat weight-bearing activity is positively associated withskeletal adaptations favoring increased bone strength andthat relatively few hours of additional weight-bearing activ-ity may be sufficient to counter the influence of weight-supported activity on bone geometry and biomechanicalcharacteristics. Weight-supported activities (swimming and
680 Official Journal of the American College of Sports Medicine http://www.acsm-msse.org
cycling), as hypothesized, were not associated with anydifferences in bone indices favoring enhanced bonestrength. Whether increased weight bearing during run-ning results in increased bone geometry and biomechani-cal properties favoring increased bone strength, as sug-gested by our findings, remains to be determined fromprospective, controlled exercise studies. The results ofthis study also illustrate the limitations of bone density
and the importance of additional measures such as bonegeometry and biomechanical properties when assessingthe relationship between skeletal adaptation and mechan-ical loading in humans.
Address for correspondence: Professor C. J. R. Blimkie, FACSM,Department of Kinesiology, McMaster University, Hamilton, Ontario,Canada, L8S 4K1; E-mail: [email protected].
REFERENCES
1. ADAMI, S., D. GATTI, V. BRAGA, D. BIANCHINI, and M. ROSSINI.Site-specific effects of strength training on bone structure andgeometry of ultradistal radius in postmenopausal women. J. BoneMiner. Res. 14:120–124, 1999.
2. BAILEY, D. A., H. A. MCKAY, R. L. MIRWALD, P. R. E. CROCKER,and R. A. FAULKNER. A six-year longitudinal study of the relation-ship of physical activity to bone mineral accrual in growingchildren: The University of Saskatchewan Bone Mineral AccrualStudy. J. Bone Miner. Res. 14:1672–1679, 1999.
3. BARAN, D. T. Magnitude and determinants of premenopausal boneloss. Osteoporos. Int. 4(Suppl. 1):31–34, 1994.
4. BLIMKIE, C. J. R., S. RICE, C. E. WEBBER, J. MARTIN, D. LEVY, andC. L. GORDON. Effects of resistance training on BMC and densityin adolescent females. Can. J. Physiol. Pharmacol. 74:1025–1033,1996.
5. BRADNEY, M., G. PEARCE, G. NAUGHTON, et al. Moderate exerciseduring growth in prepubertal boys: changes in bone mass, size,volumetric density, and bone strength: a controlled prospectivestudy [see comments]. J. Bone Miner. Res. 13:1814–1821, 1998.
6. CARBON, R., P. N. SAMBROOK, V. DEAKIN, et al. Bone density ofelite female athletes with stress fractures [see comments]. Med. J.Aust. 153:373–376, 1990.
7. CAVANAUGH, D. J., and C. E. CANN. Brisk walking does not stopbone loss in postmenopausal women. Bone 9:201–204, 1988.
8. COURTEIX, D., E. LESPESSAILES, S. L. PERES, P. OBERT, P. GERMAIN,and C. L. BENHAMOU. Effect of physical training on bone mineraldensity in prepubertal girls: a comparative study between impactloading and non-impact loading sports. Osteoporos. Int. 8:152–158, 1998.
9. DUNCAN, C. S., C. J. R. BLIMKIE, C. T. COWELL, S. T. BURKE, J. N.BRIODY, and R. HOWMAN-GILES. Bone mineral density in adoles-cent female athletes: relationship to exercise type and musclestrength. Med. Sci. Sports Exerc. 34:286–294, 2002.
10. DYSON, K., C. J. BLIMKIE, K. S. DAVISON, C. E. WEBBER, and J. D.ADACHI. Gymnastic training and bone density in pre-adolescentfemales. Med. Sci. Sports Exerc. 29:443–450, 1997.
11. FERRETTI, J. L., R. F. CAPOZZA, and J. R. ZANCHETTA. Mechanicalvalidation of a tomographic (pQCT) index for noninvasive esti-mation of rat femur bending strength. Bone 18:97–102, 1996.
12. FRISANCHO, A. R., S. M. GARN, and W. ASCOLI. Subperiosteal andendosteal bone apposition during adolescence. Hum. Biol. 639–664, 1970.
13. FROST, H. M. The mechanostat: a proposed pathogenic mechanismof osteoporoses and the bone mass effects of mechanical andnonmechanical agents. Bone Miner. 2:73–85, 1987.
14. FROST, H. M. Muscle, bone, and the Utah paradigm: a 1999overview. Med. Sci. Sports Exerc. 32:911–917, 2000.
15. HAAPASALO, H., P. KANNUS, H. SIEVANEN, et al. Effect of long-termunilateral activity on bone mineral density of female junior tennisplayers. J. Bone Miner. Res. 13:310–319, 1998.
16. HAAPASALO, H., S. KONTULAINEN, H. SIEVANEN, P. KANNUS, M.JARVINEN, and I. VUORI. Exercise-induced bone gain is due to
enlargement in bone size without a change in volumetric bonedensity: a peripheral quantitative computed tomography study ofthe upper arms of male tennis players. Bone 27:351–357, 2000.
17. HAAPASALO, H., H. SIEVANEN, P. KANNUS, A. HEINONEN, P. OJA, andI. VUORI. Dimensions and estimated mechanical characteristics ofthe humerus after long-term tennis loading. J. Bone Miner. Res.11:864–872, 1996.
18. HEINONEN, A., P. OJA, P. KANNUS, et al. Bone mineral density infemale athletes representing sports with different loading charac-teristics of the skeleton. Bone 17:197–203, 1995.
19. HEINONEN, A., H. SIEVANEN, P. KANNUS, P. OJA, and I. VUORI.Effects of unilateral strength training and detraining on bonemineral mass and estimated mechanical characteristics of theupper limb bones in young women. J. Bone Miner. Res. 11:490–501, 1996.
20. JOHNSTON, C. C. J., and C. W. SLEMENDA. Pathogenesis of osteo-porosis. Bone 17:19S–22S, 1995.
21. JONES, H., J. D. PRIEST, W. C. HAYES, C. C. TICHENOR, and D. A.NAGEL. Humeral hypertrophy in response to exercise. J. Bone JointSurg. 59-A:204–208, 1977.
22. KATZMAN, D. K., L. K. BACHRACH, D. R. CARTER, and R. MARCUS.Clinical and anthropometric correlates of bone mineral acquisitionin healthy adolescent girls. J. Clin. Endocrinol. Metab. 73:1332–1339, 1991.
23. KRAHL, H., U. MICHAELIS, H. PIEPER, G. QUACK, and M. MONTAG.Stimulation of bone growth through sports: a radiologic investi-gation of the upper extremities in professional tennis players.Am. J. Sports Med. 22:751–760, 1994.
24. KROGER, H., A. KOTANIEMI, L. KROGER, and E. ALHAVA. Develop-ment of bone mass and bone density of the spine and femoral neck:a prospective study of 65 children and adolescents. Bone Miner.23:171–182, 1993.
25. MACDOUGALL, J. D., C. E. WEBBER, J. MARTIN, et al. Relationshipamong running mileage, bone density, and serum testosterone inmale runners. J. Appl. Physiol. 73:1165–1170, 1992.
26. SCHONAU, E. The development of the skeletal system in childrenand the influence of muscular strength. Horm. Res. 49:27–31,1998.
27. SWISSA-SIVAN, A., A. SIMKIN, I. LEICHTER, et al. Effect of swimmingon bone growth and development in young rats. Bone Miner.7:91–105, 1989.
28. UMEMURA, Y., T. ISHIKO, T. YAMAUCHI, M. KURONO, and S.MASHIKO. Five jumps per day increase bone mass and breakingforce in rats. J. Bone Miner. Res. 12:1480–1485, 1997.
29. WITZKE, K. A., and C. M. SNOW. Effects of plyometric jumptraining on bone mass in adolescent girls. Med. Sci. Sports Exerc.32:1051–1057, 2001.
30. WOODHEAD, H. J., A. F. KEMP, C. J. R. BLIMKIE, et al. Measurementof mid-femoral shaft geometry: repeatability and accuracy usingMRI and dual energy x-ray absorptiometry. J. Bone Miner. Res.16:2251–2259, 2001.
BONE GEOMETRY IN TEENAGE FEMALE ATHLETES Medicine & Science in Sports & Exercise� 681