Embed Size (px)
Citation preview
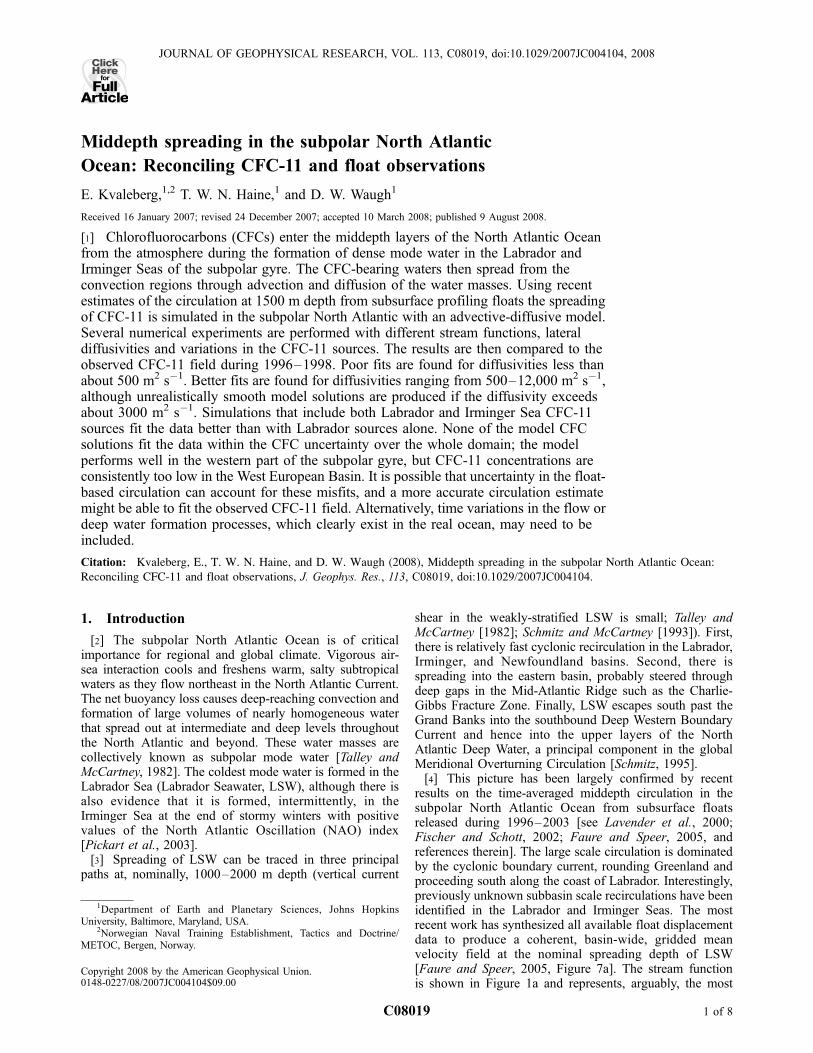
Middepth spreading in the subpolar North Atlantic
Ocean: Reconciling CFC-11 and float observations
E. Kvaleberg,1,2 T. W. N. Haine,1 and D. W. Waugh1
Received 16 January 2007; revised 24 December 2007; accepted 10 March 2008; published 9 August 2008.
[1] Chlorofluorocarbons (CFCs) enter the middepth layers of the North Atlantic Oceanfrom the atmosphere during the formation of dense mode water in the Labrador andIrminger Seas of the subpolar gyre. The CFC-bearing waters then spread from theconvection regions through advection and diffusion of the water masses. Using recentestimates of the circulation at 1500 m depth from subsurface profiling floats the spreadingof CFC-11 is simulated in the subpolar North Atlantic with an advective-diffusive model.Several numerical experiments are performed with different stream functions, lateraldiffusivities and variations in the CFC-11 sources. The results are then compared to theobserved CFC-11 field during 1996–1998. Poor fits are found for diffusivities less thanabout 500 m2 s�1. Better fits are found for diffusivities ranging from 500–12,000 m2 s�1,although unrealistically smooth model solutions are produced if the diffusivity exceedsabout 3000 m2 s�1. Simulations that include both Labrador and Irminger Sea CFC-11sources fit the data better than with Labrador sources alone. None of the model CFCsolutions fit the data within the CFC uncertainty over the whole domain; the modelperforms well in the western part of the subpolar gyre, but CFC-11 concentrations areconsistently too low in the West European Basin. It is possible that uncertainty in the float-based circulation can account for these misfits, and a more accurate circulation estimatemight be able to fit the observed CFC-11 field. Alternatively, time variations in the flow ordeep water formation processes, which clearly exist in the real ocean, may need to beincluded.
Citation: Kvaleberg, E., T. W. N. Haine, and D. W. Waugh (2008), Middepth spreading in the subpolar North Atlantic Ocean:
Reconciling CFC-11 and float observations, J. Geophys. Res., 113, C08019, doi:10.1029/2007JC004104.
1. Introduction
[2] The subpolar North Atlantic Ocean is of criticalimportance for regional and global climate. Vigorous air-sea interaction cools and freshens warm, salty subtropicalwaters as they flow northeast in the North Atlantic Current.The net buoyancy loss causes deep-reaching convection andformation of large volumes of nearly homogeneous waterthat spread out at intermediate and deep levels throughoutthe North Atlantic and beyond. These water masses arecollectively known as subpolar mode water [Talley andMcCartney, 1982]. The coldest mode water is formed in theLabrador Sea (Labrador Seawater, LSW), although there isalso evidence that it is formed, intermittently, in theIrminger Sea at the end of stormy winters with positivevalues of the North Atlantic Oscillation (NAO) index[Pickart et al., 2003].[3] Spreading of LSW can be traced in three principal
paths at, nominally, 1000–2000 m depth (vertical current
shear in the weakly-stratified LSW is small; Talley andMcCartney [1982]; Schmitz and McCartney [1993]). First,there is relatively fast cyclonic recirculation in the Labrador,Irminger, and Newfoundland basins. Second, there isspreading into the eastern basin, probably steered throughdeep gaps in the Mid-Atlantic Ridge such as the Charlie-Gibbs Fracture Zone. Finally, LSW escapes south past theGrand Banks into the southbound Deep Western BoundaryCurrent and hence into the upper layers of the NorthAtlantic Deep Water, a principal component in the globalMeridional Overturning Circulation [Schmitz, 1995].[4] This picture has been largely confirmed by recent
results on the time-averaged middepth circulation in thesubpolar North Atlantic Ocean from subsurface floatsreleased during 1996–2003 [see Lavender et al., 2000;Fischer and Schott, 2002; Faure and Speer, 2005, andreferences therein]. The large scale circulation is dominatedby the cyclonic boundary current, rounding Greenland andproceeding south along the coast of Labrador. Interestingly,previously unknown subbasin scale recirculations have beenidentified in the Labrador and Irminger Seas. The mostrecent work has synthesized all available float displacementdata to produce a coherent, basin-wide, gridded meanvelocity field at the nominal spreading depth of LSW[Faure and Speer, 2005, Figure 7a]. The stream functionis shown in Figure 1a and represents, arguably, the most
JOURNAL OF GEOPHYSICAL RESEARCH, VOL. 113, C08019, doi:10.1029/2007JC004104, 2008ClickHere
for
FullArticle
1Department of Earth and Planetary Sciences, Johns HopkinsUniversity, Baltimore, Maryland, USA.
2Norwegian Naval Training Establishment, Tactics and Doctrine/METOC, Bergen, Norway.
Copyright 2008 by the American Geophysical Union.0148-0227/08/2007JC004104$09.00
C08019 1 of 8
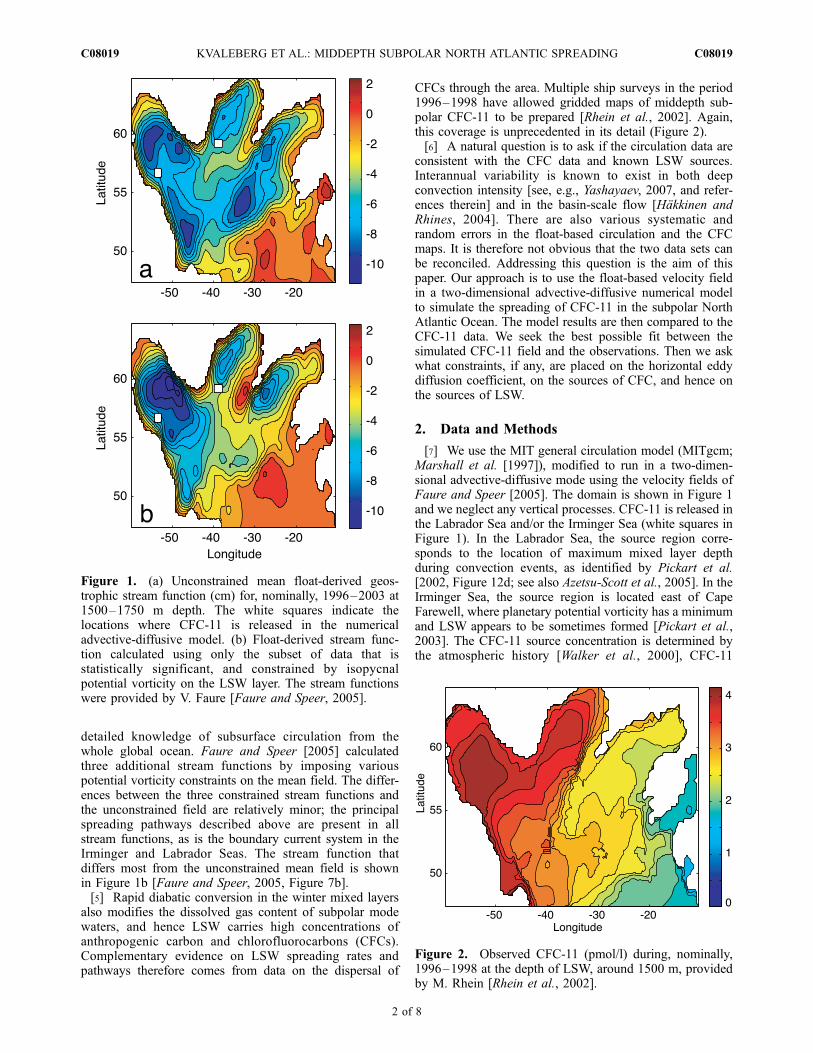
detailed knowledge of subsurface circulation from thewhole global ocean. Faure and Speer [2005] calculatedthree additional stream functions by imposing variouspotential vorticity constraints on the mean field. The differ-ences between the three constrained stream functions andthe unconstrained field are relatively minor; the principalspreading pathways described above are present in allstream functions, as is the boundary current system in theIrminger and Labrador Seas. The stream function thatdiffers most from the unconstrained mean field is shownin Figure 1b [Faure and Speer, 2005, Figure 7b].[5] Rapid diabatic conversion in the winter mixed layers
also modifies the dissolved gas content of subpolar modewaters, and hence LSW carries high concentrations ofanthropogenic carbon and chlorofluorocarbons (CFCs).Complementary evidence on LSW spreading rates andpathways therefore comes from data on the dispersal of
CFCs through the area. Multiple ship surveys in the period1996–1998 have allowed gridded maps of middepth sub-polar CFC-11 to be prepared [Rhein et al., 2002]. Again,this coverage is unprecedented in its detail (Figure 2).[6] A natural question is to ask if the circulation data are
consistent with the CFC data and known LSW sources.Interannual variability is known to exist in both deepconvection intensity [see, e.g., Yashayaev, 2007, and refer-ences therein] and in the basin-scale flow [Hakkinen andRhines, 2004]. There are also various systematic andrandom errors in the float-based circulation and the CFCmaps. It is therefore not obvious that the two data sets canbe reconciled. Addressing this question is the aim of thispaper. Our approach is to use the float-based velocity fieldin a two-dimensional advective-diffusive numerical modelto simulate the spreading of CFC-11 in the subpolar NorthAtlantic Ocean. The model results are then compared to theCFC-11 data. We seek the best possible fit between thesimulated CFC-11 field and the observations. Then we askwhat constraints, if any, are placed on the horizontal eddydiffusion coefficient, on the sources of CFC, and hence onthe sources of LSW.
2. Data and Methods
[7] We use the MIT general circulation model (MITgcm;Marshall et al. [1997]), modified to run in a two-dimen-sional advective-diffusive mode using the velocity fields ofFaure and Speer [2005]. The domain is shown in Figure 1and we neglect any vertical processes. CFC-11 is released inthe Labrador Sea and/or the Irminger Sea (white squares inFigure 1). In the Labrador Sea, the source region corre-sponds to the location of maximum mixed layer depthduring convection events, as identified by Pickart et al.[2002, Figure 12d; see also Azetsu-Scott et al., 2005]. In theIrminger Sea, the source region is located east of CapeFarewell, where planetary potential vorticity has a minimumand LSW appears to be sometimes formed [Pickart et al.,2003]. The CFC-11 source concentration is determined bythe atmospheric history [Walker et al., 2000], CFC-11
Figure 1. (a) Unconstrained mean float-derived geos-trophic stream function (cm) for, nominally, 1996–2003 at1500–1750 m depth. The white squares indicate thelocations where CFC-11 is released in the numericaladvective-diffusive model. (b) Float-derived stream func-tion calculated using only the subset of data that isstatistically significant, and constrained by isopycnalpotential vorticity on the LSW layer. The stream functionswere provided by V. Faure [Faure and Speer, 2005].
Figure 2. Observed CFC-11 (pmol/l) during, nominally,1996–1998 at the depth of LSW, around 1500 m, providedby M. Rhein [Rhein et al., 2002].
C08019 KVALEBERG ET AL.: MIDDEPTH SUBPOLAR NORTH ATLANTIC SPREADING
2 of 8
C08019
solubility [Warner and Weiss, 1985], and a saturation that isallowed to vary between experiments (the final simulatedCFC-11 distribution in each experiment is scaled so that thepeak model concentration matches the data). The model isrun from 1945–1997, then for an additional six months withzero CFC-11 flux so that the sharp CFC-11 maxima withinthe source regions can be redistributed. The southernboundary is open so that CFC-11 can diffuse out of thedomain thereby preventing unrealistic accumulation ofCFC-11 there.[8] There are three sets of numerical experiments distin-
guished by: (1) a CFC-11 source in the Labrador Sea, (2) asource in the Irminger Sea, and (3) sources in both loca-tions, with the Labrador Sea source always active, and theIrminger Sea source active only when the NAO index ispositive. In each set, experiments are run with uniformhorizontal (eddy) diffusivities ranging from 50–12000 m2
s�1. In addition, we also perform experiments with thespatially-varying diffusivity fields used by Straneo et al.[2003] (their Figure 3a), modified to fit our model domain.[9] The float-based stream functions from Faure and
Speer [2005] are averages during the period 1996–2003,at a depth of 1500–1750 m (nominal resolution 1� latitudeby 2� longitude). The first stream function is the uncon-strained mean field, while the remaining three are calculatedusing (1) a barotropic f/h constraint, (2) an isopycnal PV
constraint on the LSW layer, and (3) an isopycnal PVconstraint on the LSW layer, and using only the statisticallysignificant float data (about 8% of the available data). Theunconstrained mean field and stream function (3) are shownin Figure 1. Stream functions (1) and (2) are very similar tothe unconstrained mean field. Further details are given byFaure and Speer [2005], and their Figures 6 and 7 inparticular. Each of the stream function maps is consistentwith the float data and, in a crude way, they represent theuncertainty in the circulation estimate.[10] Although the boundary currents are clearly present in
all four stream functions, uncertainties in boundary currentstrength are relatively large. The conventional picture[Talley and McCartney, 1982; Schmitz, 1996] shows theboundary current east of Newfoundland as a fast pathwayfor LSW export from the subpolar gyre. Floats rarely escapesouth past Flemish Cap and the Grand Banks into thesubtropics, however [Fischer and Schott, 2002; Lavenderet al., 2000]. Resolution of this apparent contradiction isstill pending and it is possible that the float-based velocityfield may be substantially biased in this area [see alsoGetzlaff et al., 2006]. Moreover, considering the wholedomain, only about half of the velocity estimates aresignificant at the 95% confidence level. Uncertainties arelarge in the interior of the domain, and close to Flemish Cap
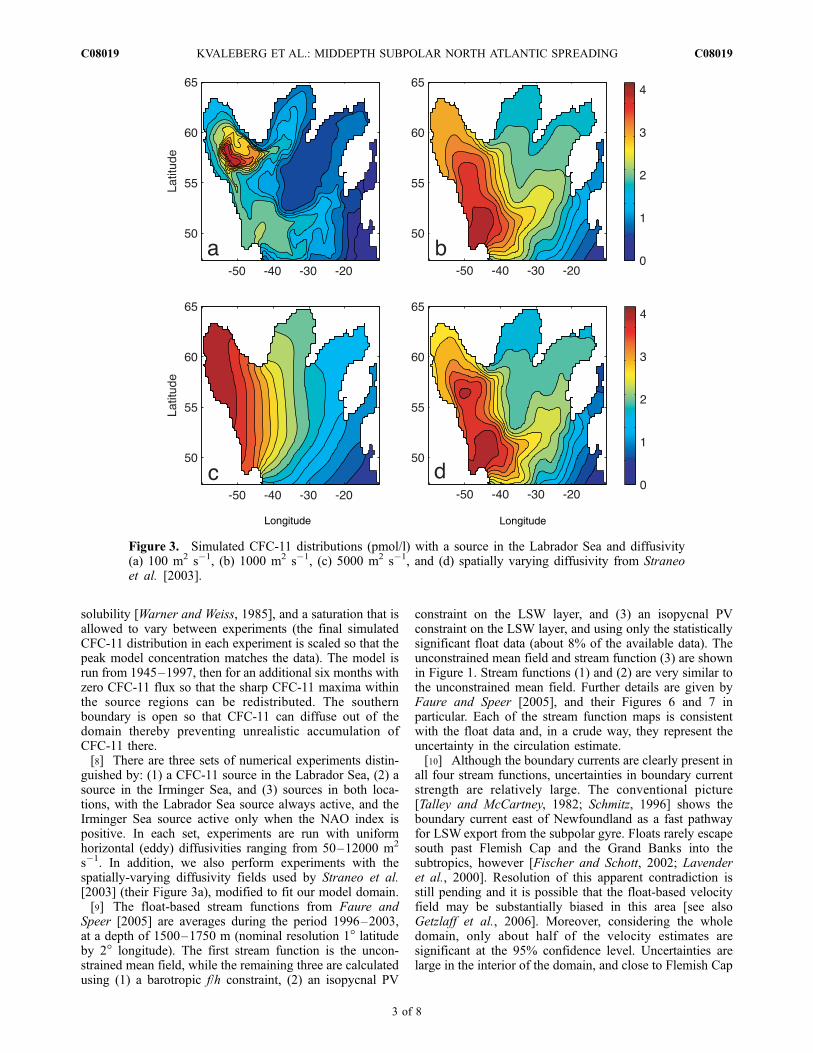
Figure 3. Simulated CFC-11 distributions (pmol/l) with a source in the Labrador Sea and diffusivity(a) 100 m2 s�1, (b) 1000 m2 s�1, (c) 5000 m2 s�1, and (d) spatially varying diffusivity from Straneoet al. [2003].
C08019 KVALEBERG ET AL.: MIDDEPTH SUBPOLAR NORTH ATLANTIC SPREADING
3 of 8
C08019
where the high eddy variability leads to poor sampling bythe floats.[11] Our numerical results are compared to the gridded
CFC-11 field described by Rhein et al. [2002] (Figure 2).CFC-11 data within 27.74 � sq � 27.80 obtained during1996–1998 were gridded using a topography-followinginterpolation scheme and taken to represent the 1997 LSWCFC field. The uncertainty in the gridded CFC-11 field isestimated to be 5–20%, depending on location, and thenominal resolution is 100–200 km. A small gap in theRhein et al. [2002] gridded data was filled by interpolatingthe surrounding values. To quantify the comparisonbetween the simulated CFC-11 field and data we calculatechi-square values (c2) for each model experiment with theformula (cT A�1 c) N�1, where c is a vector containing thedifferences (cm � co) between the simulated (cm) andobserved (co) CFC-11 concentration at each grid point. Thenumber of degrees of freedom, N, is taken as the totalnumber of CFC-11 values and A is a diagonal matrix ofvariances in the observed field from Rhein et al. [2002,Figure 10a] (estimated using a jackknife procedure). Wealso include in A a 5% fractional error to account forinstrumental and calibration uncertainties in the CFC data[Rhein et al., 2002]. The resulting uncertainties in theobserved CFC-11 field thus range from 9–18%. Statisticalconsistency between the numerical experiments and ob-servations requires values of c2 that are close to 1. Inaddition, we estimate characteristic CFC-11 spatial scalesby calculating correlations as a function of separation foreach CFC-11 field.
3. Results
3.1. Labrador Sea CFC-11 Source
[12] Figure 3 shows four experiments with a CFC-11source in the Labrador Sea and diffusivities of: (1) 100 m2
s�1, (2) 1000 m2 s�1, (3) 5000 m2 s�1, and (4) the spatially-varying diffusivity field. For a diffusivity of 100 m2 s�1 thecomparison with the observed CFC-11 field is poor and c2
is 100 (compare Figures 2 and 3a). In this case, CFC-11spreads mostly along the internal recirculation pathwayswithin the Labrador Sea, but the diffusivity is too low toallow sufficient amounts to enter the western boundarycurrent and the advective pathway into the Irminger Sea.The c2 values for experiments with uniform diffusivitiesbetween 500–3000 m2 s�1 are all within 21–23 (oneexample is shown in Figure 3b). In these cases, CFC-11is transported along the advective pathways, but there isalso diffusion across these trajectories into the northernLabrador and Irminger Seas, and into the Iceland Basinacross the strong flow along Reykjanes Ridge. With higherdiffusivities, 5000 and 12,000 m2 s�1, c2 increases to 29and 34, respectively (Table 1).[13] Comparison of the simulated CFC-11 fields with the
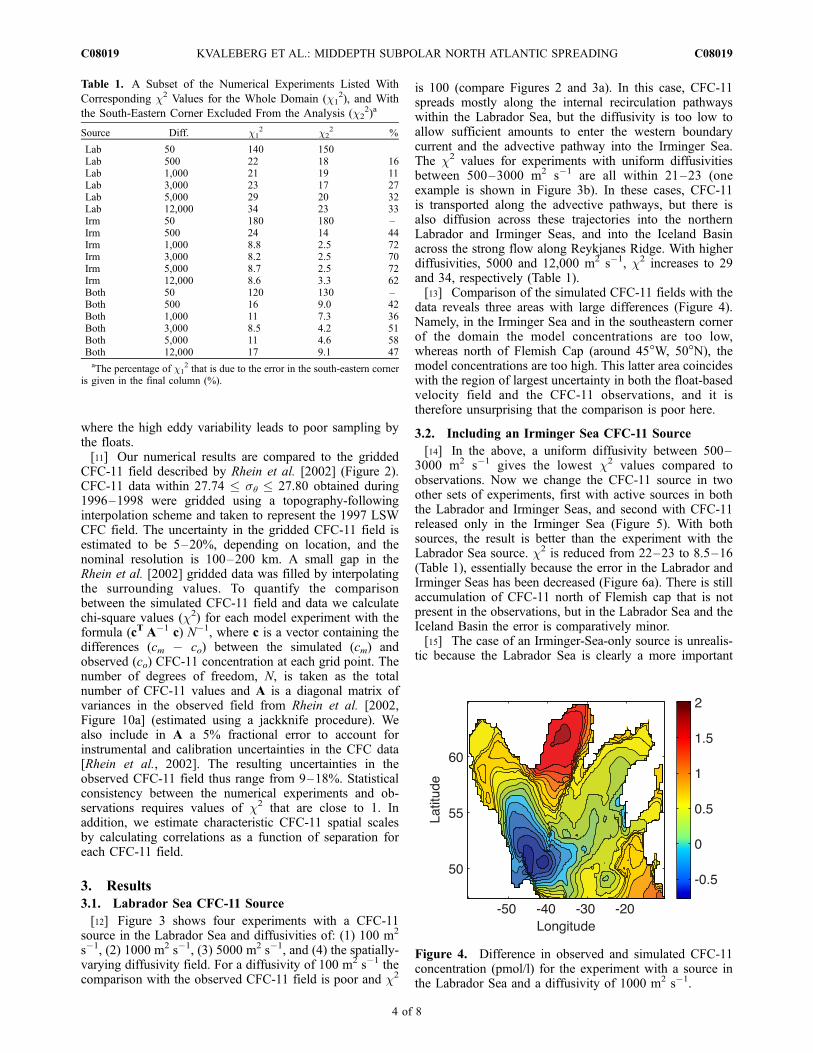
data reveals three areas with large differences (Figure 4).Namely, in the Irminger Sea and in the southeastern cornerof the domain the model concentrations are too low,whereas north of Flemish Cap (around 45�W, 50�N), themodel concentrations are too high. This latter area coincideswith the region of largest uncertainty in both the float-basedvelocity field and the CFC-11 observations, and it istherefore unsurprising that the comparison is poor here.
3.2. Including an Irminger Sea CFC-11 Source
[14] In the above, a uniform diffusivity between 500–3000 m2 s�1 gives the lowest c2 values compared toobservations. Now we change the CFC-11 source in twoother sets of experiments, first with active sources in boththe Labrador and Irminger Seas, and second with CFC-11released only in the Irminger Sea (Figure 5). With bothsources, the result is better than the experiment with theLabrador Sea source. c2 is reduced from 22–23 to 8.5–16(Table 1), essentially because the error in the Labrador andIrminger Seas has been decreased (Figure 6a). There is stillaccumulation of CFC-11 north of Flemish cap that is notpresent in the observations, but in the Labrador Sea and theIceland Basin the error is comparatively minor.[15] The case of an Irminger-Sea-only source is unrealis-
tic because the Labrador Sea is clearly a more important
Table 1. A Subset of the Numerical Experiments Listed With
Corresponding c2 Values for the Whole Domain (c12), and With
the South-Eastern Corner Excluded From the Analysis (c22)a
Source Diff. c12 c2
2 %
Lab 50 140 150Lab 500 22 18 16Lab 1,000 21 19 11Lab 3,000 23 17 27Lab 5,000 29 20 32Lab 12,000 34 23 33Irm 50 180 180 –Irm 500 24 14 44Irm 1,000 8.8 2.5 72Irm 3,000 8.2 2.5 70Irm 5,000 8.7 2.5 72Irm 12,000 8.6 3.3 62Both 50 120 130 –Both 500 16 9.0 42Both 1,000 11 7.3 36Both 3,000 8.5 4.2 51Both 5,000 11 4.6 58Both 12,000 17 9.1 47aThe percentage of c1
2 that is due to the error in the south-eastern corneris given in the final column (%).
Figure 4. Difference in observed and simulated CFC-11concentration (pmol/l) for the experiment with a source inthe Labrador Sea and a diffusivity of 1000 m2 s�1.
C08019 KVALEBERG ET AL.: MIDDEPTH SUBPOLAR NORTH ATLANTIC SPREADING
4 of 8
C08019
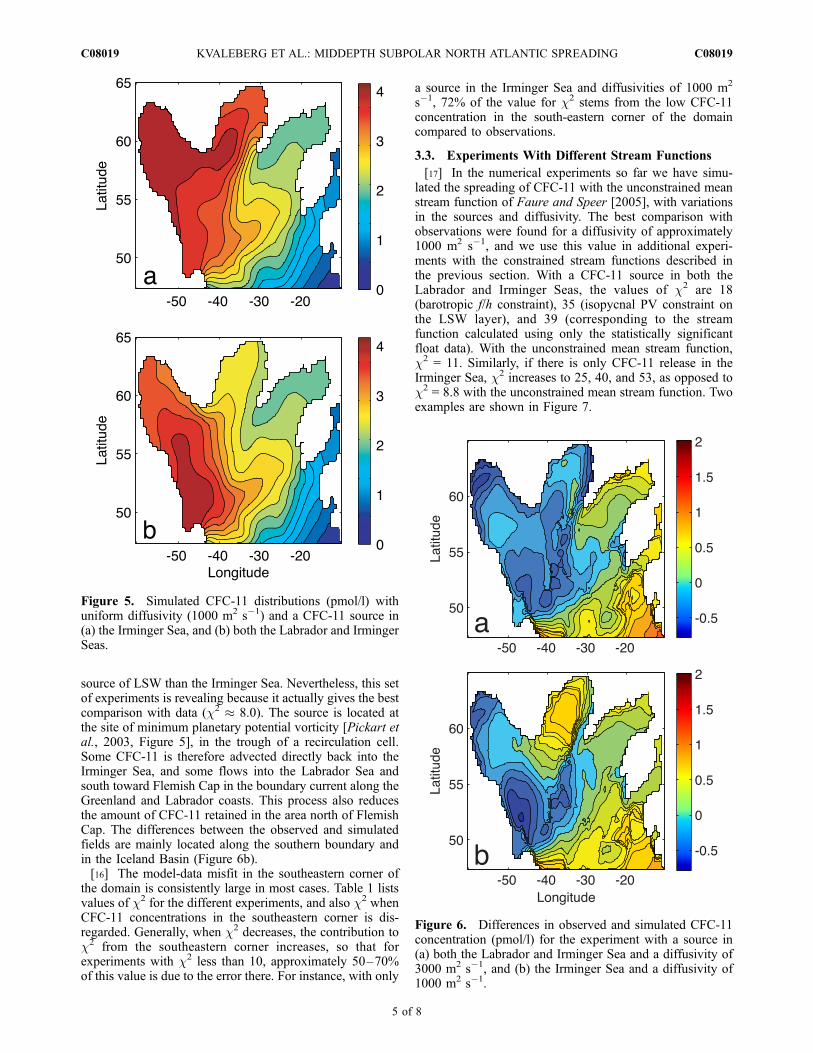
source of LSW than the Irminger Sea. Nevertheless, this setof experiments is revealing because it actually gives the bestcomparison with data (c2 � 8.0). The source is located atthe site of minimum planetary potential vorticity [Pickart etal., 2003, Figure 5], in the trough of a recirculation cell.Some CFC-11 is therefore advected directly back into theIrminger Sea, and some flows into the Labrador Sea andsouth toward Flemish Cap in the boundary current along theGreenland and Labrador coasts. This process also reducesthe amount of CFC-11 retained in the area north of FlemishCap. The differences between the observed and simulatedfields are mainly located along the southern boundary andin the Iceland Basin (Figure 6b).[16] The model-data misfit in the southeastern corner of
the domain is consistently large in most cases. Table 1 listsvalues of c2 for the different experiments, and also c2 whenCFC-11 concentrations in the southeastern corner is dis-regarded. Generally, when c2 decreases, the contribution toc2 from the southeastern corner increases, so that forexperiments with c2 less than 10, approximately 50–70%of this value is due to the error there. For instance, with only
a source in the Irminger Sea and diffusivities of 1000 m2
s�1, 72% of the value for c2 stems from the low CFC-11concentration in the south-eastern corner of the domaincompared to observations.
3.3. Experiments With Different Stream Functions
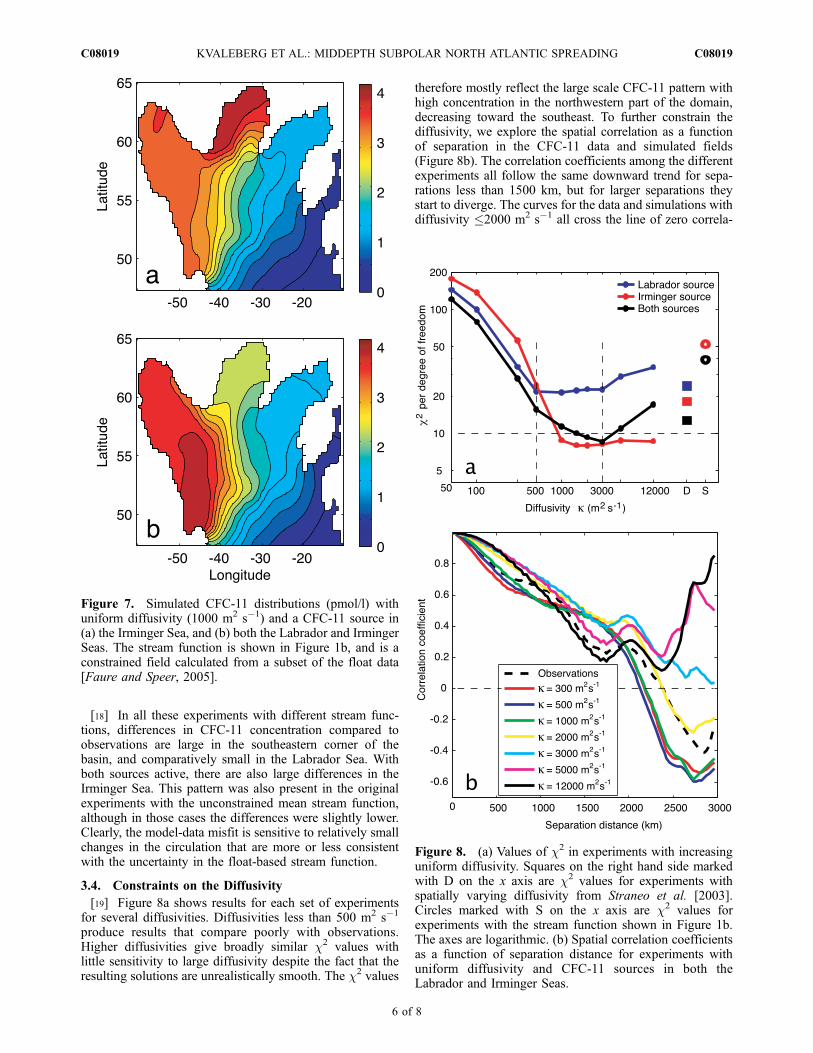
[17] In the numerical experiments so far we have simu-lated the spreading of CFC-11 with the unconstrained meanstream function of Faure and Speer [2005], with variationsin the sources and diffusivity. The best comparison withobservations were found for a diffusivity of approximately1000 m2 s�1, and we use this value in additional experi-ments with the constrained stream functions described inthe previous section. With a CFC-11 source in both theLabrador and Irminger Seas, the values of c2 are 18(barotropic f/h constraint), 35 (isopycnal PV constraint onthe LSW layer), and 39 (corresponding to the streamfunction calculated using only the statistically significantfloat data). With the unconstrained mean stream function,c2 = 11. Similarly, if there is only CFC-11 release in theIrminger Sea, c2 increases to 25, 40, and 53, as opposed toc2 = 8.8 with the unconstrained mean stream function. Twoexamples are shown in Figure 7.
Figure 5. Simulated CFC-11 distributions (pmol/l) withuniform diffusivity (1000 m2 s�1) and a CFC-11 source in(a) the Irminger Sea, and (b) both the Labrador and IrmingerSeas.
Figure 6. Differences in observed and simulated CFC-11concentration (pmol/l) for the experiment with a source in(a) both the Labrador and Irminger Sea and a diffusivity of3000 m2 s�1, and (b) the Irminger Sea and a diffusivity of1000 m2 s�1.
C08019 KVALEBERG ET AL.: MIDDEPTH SUBPOLAR NORTH ATLANTIC SPREADING
5 of 8
C08019
[18] In all these experiments with different stream func-tions, differences in CFC-11 concentration compared toobservations are large in the southeastern corner of thebasin, and comparatively small in the Labrador Sea. Withboth sources active, there are also large differences in theIrminger Sea. This pattern was also present in the originalexperiments with the unconstrained mean stream function,although in those cases the differences were slightly lower.Clearly, the model-data misfit is sensitive to relatively smallchanges in the circulation that are more or less consistentwith the uncertainty in the float-based stream function.
3.4. Constraints on the Diffusivity
[19] Figure 8a shows results for each set of experimentsfor several diffusivities. Diffusivities less than 500 m2 s�1
produce results that compare poorly with observations.Higher diffusivities give broadly similar c2 values withlittle sensitivity to large diffusivity despite the fact that theresulting solutions are unrealistically smooth. The c2 values
therefore mostly reflect the large scale CFC-11 pattern withhigh concentration in the northwestern part of the domain,decreasing toward the southeast. To further constrain thediffusivity, we explore the spatial correlation as a functionof separation in the CFC-11 data and simulated fields(Figure 8b). The correlation coefficients among the differentexperiments all follow the same downward trend for sepa-rations less than 1500 km, but for larger separations theystart to diverge. The curves for the data and simulations withdiffusivity �2000 m2 s�1 all cross the line of zero correla-
Figure 7. Simulated CFC-11 distributions (pmol/l) withuniform diffusivity (1000 m2 s�1) and a CFC-11 source in(a) the Irminger Sea, and (b) both the Labrador and IrmingerSeas. The stream function is shown in Figure 1b, and is aconstrained field calculated from a subset of the float data[Faure and Speer, 2005].
Figure 8. (a) Values of c2 in experiments with increasinguniform diffusivity. Squares on the right hand side markedwith D on the x axis are c2 values for experiments withspatially varying diffusivity from Straneo et al. [2003].Circles marked with S on the x axis are c2 values forexperiments with the stream function shown in Figure 1b.The axes are logarithmic. (b) Spatial correlation coefficientsas a function of separation distance for experiments withuniform diffusivity and CFC-11 sources in both theLabrador and Irminger Seas.
C08019 KVALEBERG ET AL.: MIDDEPTH SUBPOLAR NORTH ATLANTIC SPREADING
6 of 8
C08019
tion at separations of 2100–2400 km, but the curves forexperiments with higher diffusivity never cross zero. Dif-fusivities less than 3000 m2 s�1 therefore give the bestcomparison with observations. Diffusivities greater than thisvalue give simulated CFC-11 fields that are qualitatively toosmooth. The smaller scales present for diffusivity <3000 m2
s�1 do not fit the data very much better, however, becausethe c2 values are not much worse (Figure 8a).[20] For each source configuration, experiments are also
performed with the spatially-varying diffusivity fields fromStraneo et al. [2003] (for example, Figure 3d). The impacton c2 is rather small, however, with just minor differencesfrom the uniform 1000–3000 m2 s�1 diffusivity experi-ments (Figure 8a). In this sense, the spatial field of diffu-sivity is not strongly constrained by the CFC-11 data.
3.5. Sensitivity to Tracer Source
[21] Finally, we address the sensitivity of our results tothe CFC-11 source. The source regions shown in Figure 1are reasonable choices based on the locations of deep winterconvection. Nevertheless, convection to depths below theupper density surface for LSW occurs over a much broaderarea in the Labrador Sea, about 500 km � 600 km [Lilly etal., 1999]. We find that increasing the source area decreasesthe c2 values: For the Labrador Sea source c2 drops from22 to 15 then 13 as the source area increases by factors of 30and 90 over the original experiment. The overall pattern ofmodel CFC field is qualitatively similar in these experi-ments. Similarly, in an experiment where both Labrador andIrminger sources are increased to fill almost all of thesebasins we find that the c2 values improve from 11 to 6.[22] These results show that the CFC field is sensitive to the
source area. A similar improvement can be obtained by usingthe original source area and an artificially-enhanced diffusiv-ity in the Labrador Sea, however, using both sources and aspatially-variable diffusivity that peaks at 4000–5000m2 s�1
in the Labrador and Irminger Seas we achieve a c2 value of3.7, reduced from 8.5 with a constant diffusivity of 3000 m2
s�1. This result is consistent with the results on increasingsource area because it also shows that CFC dispersal from thesites of injection has an important impact. These processes arebeyond the scope of our model, however. They occur at, orbelow, the resolution of the float-based flow field and theCFCdata and therefore constraining these processes is very diffi-cult with these data and model.
4. Discussion
[23] We have used the 1996–2003 average float-basedcirculation field estimated by Faure and Speer [2005] in anadvective-diffusive numerical model to simulate the mid-depth spreading of CFC-11 in the subpolar North Atlantic andcompared to 1996–1998 average CFC-11 data from Rhein etal. [2002]. The main question is: Can the float-based velocityfield be reconciledwith theCFC-11measurements taking intoaccount the errors in the gridded CFC data and, crudely, thefloat-based circulation? The best fit we have found in arealistic configuration has a c2 value of 8.0 and there aremany cases with values less than 10. By this measure, theCFC fields predicted by the float-based flow are close to beingconsistent with the CFC data, but do not fit in a satisfactory
way. Experiments using different stream functions clearlyshow that relatively small changes in the circulation andconditions in the CFC source areas significantly affects thevalues of c2. This suggests that the problem of inferring aunique CFC-11 source pattern or eddy diffusivity is under-determined. Indeed, the best fit simulations include only anIrminger Sea source of LSW, which is obviously unrealistic.We conjecture that a stream function that is simultaneouslyconsistent with the float and CFC data would look similar toFigure 1a with differences that are within the range of thedifferences between the existing estimates.[24] Model CFC-11 concentrations in the south-eastern
corner of the domain are too low in all experiments. Error inthe float circulation is the leading candidate to explain thesediscrepancies, but other possibilities exist too. For example,the model unrealistically omits a (relatively weak) CFCsource in both the deep North Atlantic Current entering thedomain from the southwest, and the Mediterranean Waterentering from the south east. Another possible explanationis time-varying flow or CFC source, which have both beenneglected in this analysis. The subpolar North Atlantic isknown to have undergone substantial changes in bothcirculation and convective activity during this period, how-ever [Haine et al., 2008; Hakkinen and Rhines, 2004]. It istherefore unlikely that these CFC-11 data alone will be ableto exert strong constraints on these changes (although thereis clear evidence of CFC sequestration into different vari-eties of LSW since 1997; Kieke et al. [2006]). Finally, thetime periods and vertical coverage of the float data and CFCdata, while overlapping, do not exactly coincide.[25] Nevertheless, useful constraints are exerted on the
middepth horizontal eddy diffusivity (which accounts forprocesses with scales less than 100–200 km). On the basisof the values ofc2 and the spatial correlation analysis we havefound that values of 500–3000m2 s�1 give similar results thatbest reproduce the observed CFC-11 field. With weakerdiffusivity, the CFC-11 concentration is too low in areas notreached directly by advective pathways, while stronger dif-fusivity leads to a smooth field with no subbasin scalevariability. The range of isopycnal diffusivities that matchthe CFC data is consistent with previous studies that haveestimated isopycnal diffusivities of O(103) m2 s�1 [e.g.,Cunningham and Haine, 1995b; Khatiwala et al., 2002;Straneo et al., 2003]. Moreover, the experiments that includea Labrador Sea and an intermittent Irminger Sea source ofCFC-bearing LSW give better fits than those with only aLabrador Sea source. This result is consistent with the ideaproposed by Pickart et al. [2003], that LSW can be formedboth in the Labrador and Irminger Seas. Finally, because alarge subset of experiments with different diffusivities andCFC-11 sources give similar values of c2, it is reasonable toexpect that other trace substances with similar atmosphericsource functions behave the same. In particular, the float-based circulation field may well give an accurate field ofanthropogenic carbon through the subpolar North AtlanticOcean.
[26] Acknowledgments. We thank V. Faure and K. Speer for kindlyproviding the float data, M. Rhein and D. Kieke for the CFC-11 data, and F.Straneo for the variable diffusivity fields. Careful reviewers helped improvean earlier version of this paper. Funding was provided by the NationalScience Foundation, grants OCE-0326670 and OCE-0136327.
C08019 KVALEBERG ET AL.: MIDDEPTH SUBPOLAR NORTH ATLANTIC SPREADING
7 of 8
C08019
ReferencesAzetsu-Scott, K., E. P. Jones, and R. M. Gershey (2005), Distribution ofwater masses in the Labrador Sea inferred from CFCs and carbon tetra-chloride, Mar. Chem., 94, 55–66.
Cunningham, S. A., and T. W. N. Haine (1995), On Labrador Sea Water inthe Eastern North Atlantic. part II: Mixing dynamics and the advective-diffusive balance, J. Phys. Oceanogr., 25, 666–678.
Faure, V., and K. Speer (2005), Labrador Sea water circulation in the north-ern North Atlantic Ocean, Deep Sea Res., Part II, 52, 565–581.
Fischer, J., and F. A. Schott (2002), Labrador Sea Water tracked byprofiling floats - From the boundary current into the open NorthAtlantic, J. Phys. Oceanogr., 32, 573–584.
Getzlaff, K., C. Boning, and J. Dengg (2006), Lagrangian perspectives ofdeep water export from the subpolar North Atlantic, Geophys. Res. Lett.,33, L21S08, doi:10.1029/2006GL026470.
Haine, T., C. Boning, P. Brandt, J. Fischer, A. Funk, D. Kieke, E. Kvaleberg,M. Rhein, and M. Visbeck (2008), North Atlantic deep water formation inthe Labrador Sea, recirculation through the subpolar gyre, and dischargeto the subtropics, in Arctic-Subarctic Ocean Fluxes, edited by R. R.Dickson et al., pp. 653–701, Springer, Netherlands.
Hakkinen, S., and P. B. Rhines (2004), Decline of subpolar North Atlanticcirculation during the 1990s, Science, 304, 555–559.
Khatiwala, S., P. Schlosser, and M. Visbeck (2002), Rates and mechanismsof water mass transformation in the Labrador Sea as inferred from tracerobservations, J. Phys. Oceanogr., 32, 666–686.
Kieke, D., M. Rhein, L. Stramma, W. M. Smethie, D. A. LeBel, andW. Zenk(2006), Changes in the CFC inventories and formation rates of UpperLabrador Sea Water, 1997–2001, J. Phys. Oceanogr., 36, 64–86.
Lavender, K. L., R. E. Davis, and W. B. Owens (2000), Mid-depth recir-culation observed in the interior Labrador and Irminger Seas by directvelocity measurements, Nature, 407, 66–69.
Lilly, J. M., P. B. Rhines, M. Visbeck, R. Davis, J. R. N. Lazier, F. Schott,and D. Farmer (1999), Observing deep convection in the Labrador Seaduring winter 1994/1995, J. Phys. Oceanogr., 29, 2065–2098.
Marshall, J., A. Adcroft, C. Hill, L. Perelman, and C. C. Heisey (1997), Afinite-volume, incompressible Navier Stokes model for studies of theocean on parallel computers, J. Geophys. Res., 102, 5753–5766.
Pickart, R. S., D. J. Torres, and R. A. Clarke (2002), Hydrography of theLabrador Sea during active convection, J. Phys. Oceanogr., 32, 428–457.
Pickart, R. S., M. A. Spall, M. H. Ribergaard, G. W. K. Moore, and R. F.Milliff (2003), Deep convection in the Irminger Sea forced by the Green-land tip jet, Nature, 424, 152–156.
Rhein, M., J. Fischer, W. M. Smethie, D. Smythe-Wright, R. F. Weiss,C. Mertens, D. H. Min, U. Fleischmann, and A. Putzka (2002), LabradorSea Water: Pathways, CFC-inventory and formation rates, J. Phys. Ocea-nogr., 32, 648–665.
Schmitz, W. J. (1995), On the interbasin-scale thermohaline circulation,Rev. Geophys., 33, 151–173.Schmitz, W. J. (1996), On the World Ocean Circulation, vol. 1, SomeGlobal Features/North Atlantic Circulation, Technical Report, WoodsHole Oceanographic Institution, Woods Hole, Mass.
Schmitz, W. J., and M. S. McCartney (1993), On the North Atlantic circu-lation, Rev. Geophys., 31, 29–49.
Straneo, F., R. S. Pickart, and K. Lavender (2003), Spreading of LabradorSea Water: An advective-diffusive study based on Lagrangian data, DeepSea Res., Part I, 50, 701–719.
Talley, L. D., and M. S. McCartney (1982), Distribution and circulation ofLabrador Sea Water, J. Phys. Oceanogr., 12, 1189–1205.
Walker, S. J., R. F. Weiss, and P. K. Salemeh (2000), Reconstructed his-tories of the annual mean atmospheric mole fractions for the halocarbonsCFC-11, CFC-12, CFC-113, and carbon tetrachloride, J. Geophys. Res.,105, 14,285–14,296.
Warner, M. J., and R. F. Weiss (1985), Solubilities of chlorofluorocarbons11 and 12 in water and sea water, Deep Sea Res., Part I, 32, 1485–1497.
Yashayaev, I. (2007), Hydrographic changes in the Labrador Sea, 1960–2005, Prog. Oceanogr., 73, 242–276.
�����������������������T. W. N. Haine and D. W. Waugh, Department of Earth and Planetary
Sciences, Johns Hopkins University, 329 Olin Hall, 3400 North CharlesStreet, Baltimore, MD 21218, USA. ([email protected])E. Kvaleberg, Norwegian Naval Training Establishment, Tactics and
Doctrine/METOC, P.O. Box 5 Haakonsvern, N-5886 Bergen, Norway.([email protected])
C08019 KVALEBERG ET AL.: MIDDEPTH SUBPOLAR NORTH ATLANTIC SPREADING
8 of 8
C08019