Embed Size (px)
Citation preview

0 | P a g e
Basel 3 Standardised and F-IRB Approaches 20 March 2019
MIDDLE EAST BANK
PILLAR 3 REGULATORY CAPITAL DISCLOSURE

March 20, 2019
1 | P a g e
DISCLOSURE MAP
1. Scope of Application ............................................................................................................................. 2
1.1 Corporate Overview ...................................................................................................................... 2
1.2 Principles of Consolidation ........................................................................................................... 2
1.3 Basel 3 Regulatory Capital Standards and Disclosures ................................................................. 3
2. Capital Structure ................................................................................................................................... 3
3. Capital Adequacy .................................................................................................................................. 4
3.1 Regulatory Capital Ratios .............................................................................................................. 4
3.2 Risk Weighted Assets .................................................................................................................... 5
3.2.1 Standardised Approach ......................................................................................................... 5
3.2.2 Foundation IRB Approach ..................................................................................................... 6
4. Risk Management Structure and Responsibilities ................................................................................ 7
5. Credit Risk ............................................................................................................................................. 7
5.1 Credit Risk Policy ........................................................................................................................... 8
5.2 Credit Approval Process ................................................................................................................ 8
5.3 Credit Risk Exposures .................................................................................................................... 9
5.3.1 Total Asset Balances .............................................................................................................. 9
5.3.2 Cash and Cash Equivalents .................................................................................................... 9
5.3.3 Loans and Leases ................................................................................................................... 9
5.3.4 Debt Securities .................................................................................................................... 10
5.3.5 Equity and Subordinated Debt ............................................................................................ 10
5.3.6 Off-Balance Sheet Exposures .............................................................................................. 10
5.3.7 Geographic and Industry Distribution of Credit Exposures ................................................ 10
5.4 Credit Risk Rating System ........................................................................................................... 10
5.5 Determining Credit Risk Parameters ........................................................................................... 11
5.5.1 Probability of Default (PD) .................................................................................................. 11
5.5.2 Exposure-at-default (EAD) .................................................................................................. 11
5.5.3 Loss-Given-Default (LGD) .................................................................................................... 11
5.6 Credit Risk Mitigation .................................................................................................................. 11
5.7 Stress Testing .............................................................................................................................. 12
6. Market Risk ......................................................................................................................................... 13
6.1 Reporting of Market Risk ............................................................................................................ 13

March 20, 2019
2 | P a g e
6.2 Measuring Market Risk ............................................................................................................... 13
6.3 Interest Rate Risk ........................................................................................................................ 14
6.3.1 Interest Rate Risk on Trading Book (IRRTB) ........................................................................ 14
6.3.2 Interest Rate Risk on Banking Book (IRRBB) ....................................................................... 15
6.4 Foreign Exchange Risk ................................................................................................................. 16
6.5 Equity Risk on the Banking Book ................................................................................................. 16
7. Operational Risk .................................................................................................................................. 16
7.1 Risk and Control Self-Assessment framework ............................................................................ 16
7.2 Operational Risk Portal ............................................................................................................... 17
7.3 New Product and Services Process ............................................................................................. 17
7.4 Risk Inventory.............................................................................................................................. 17
7.5 Updated Standardized Measurement Approach ........................................................................ 17
1. SCOPE OF APPLICATION
1.1 Corporate Overview
Founded in 2012 and headquartered in Tehran, the Middle East Bank (“MEB” or the ”Bank”) defines itself
primarily as a corporate bank. The Bank’s business strategy focuses on providing financing and investment
solutions to its corporate clients, high net-worth individuals and high-income earners. Rather than
focusing on proliferation of branches, MEB seeks to leverage on its unparalleled domestic position in
customer service and technology to deliver services to its client across the country, often through distance
banking and using the internet. Thanks to a dedicated management team, combined with a highly skilled
and motivated workforce, MEB has during a relatively short time-period since its inception managed to
establish itself as one of Iran’s most profitable banks. Officially incorporated at the Companies Registrar
Office of Tehran with registration number 430795, the Bank is listed on the Tehran Stock Exchange (TSE)
under the ticker “vkhavar”.
1.2 Principles of Consolidation
The Consolidated Financial Statements include the accounts of MEB and its subsidiaries, including
companies where the Bank owns a voting interest and for which it has the ability to exercise significant
influence over operating and financing decisions. We have eliminated intercompany accounts and
transactions. Results of operations of acquired companies are included from the dates that the Bank
became the primary beneficiary. Assets held in a custodian capacity are not included in the Consolidated
Financial Statements. The preparation of the Consolidated Financial Statements are in conformity with
March 20, 2019
3 | P a g e
accounting principles generally accepted in Iranian GAAP, qualified by the report of the independent
auditors and legal inspector, included in the Auditor’s Report and Audited Financial Statements section.
1.3 Basel 3 Regulatory Capital Standards and Disclosures
In addition to adhering to the regulatory capital requirements issued by the Central Bank of Iran (“CBI”),
the Bank voluntarily discloses its capital adequacy and liquidity positions according to Basel 3 guidelines.
Basel 3 is a regulatory framework composed of three pillars. The first pillar addresses capital adequacy
and minimum capital requirements. The second pillar requires supervisory review of the capital adequacy
assessment and strategies of banks and financial Institutions. The third pillar promotes market discipline
through transparency and public disclosures of the Bank’s capital adequacy and liquidity. Basel 3 provides
two principal methods for calculating capital adequacy: the Standardised Approach and the Internal
Ratings Based (IRB) approaches. Basel further divides the IRB approaches into the Foundation IRB
approach (F-IRB) and the Advanced IRB approach (A-IRB). At present, MEB calculates its capital adequacy
according to the Standardized Approach, and adopts the F-IRB approach on a partial basis for a subset of
asset classes including corporate loans, specialized lending exposures and off-balance sheet items.
2. CAPITAL STRUCTURE
Basel 3 defines capital within two tiers, Tier 1 capital and Tier 2 capital. Tier 1 is further composed of
Common Equity Tier 1 Capital (CET1) and Additional Tier 1 Capital (AT1). At MEB, we do not presently
utilize capital instruments qualifying as AT1 Capital. Hence, our Tier 1 Capital is comprised entirely of CET1
capital. MEB’s total capital as per Basel 3 is the sum of the Bank’s Tier 1 and Tier 2 capital.
The following table presents the capital composition of the Bank as measured under the Basel 3
Standardised approach as of 20 March 2019. Investment in financial institutions were below the 10% Tier
1 capital threshold, hence no capital deduction was necessary in respect of such investments.
Table 1 - MEB Capital Composition as of 20 March 2019 (m IRR)

March 20, 2019
4 | P a g e
3. CAPITAL ADEQUACY
MEB manages its capital position according to its risk appetite, ensuring the Bank has sufficient capital at
all times to support its business activities in line with its overall business strategy. The Bank’s corporate
governance processes incorporate capital management as an integral factor in the formulation of our
business strategy, risk appetite and risk limits.
We periodically conduct an Internal Capital Adequacy Assessment Process (ICAAP) to capital adequacy
based on our current risk exposures. ICAAP is a prospective estimation of the Bank’s resources and capital
needs under standard and stressed economic/market scenarios.
The Board oversees implementation of the ICAAP. The Risk Management Department regularly updates
the Board concerning economic capital, liquidity adequacy and capital adequacy, as well as assisting the
Board so to enhance the ICAAP supervisory process.
3.1 Regulatory Capital Ratios
MEB was well capitalized as of March 20 2019, exceeding all regulatory capital requirements. MEB
measures and reports its capital adequacy ratio (CAR) in accordance with three separate models: CBI
regulation, Basel 3 Standardised approach, and Basel 3 Foundation-IRB approach.
Please refer to note 51-7-2-1 of the Financial Statements for details of the Bank’s CAR calculation in
accordance with CBI regulations. The table below illustrates the MEB capital ratios under the Basel 3
Standardised and Foundation-IRB approaches.
Table 2 – Summary of Basel 3 Regulatory Capital Ratios
Share Capital 7,000,000
Retained earnings 3,855,701
Statutory Reserves 2,157,117
Other Disclosed Reserves 1,357,122
Goodwill & Intangible Assets (223,950)
Investments in financial firms above 10% of Tier 1 -
Other Regulatory adjustments -
Tier 1 Capital 14,145,990
Re-evaluation Reserves -
General Loss Provisions up to 1.25% of RWA 1,398,006
Other Regulatory adjustments -
Tier 2 Capital 1,398,006
Total Capital under the Standardised Approach 15,543,996

March 20, 2019
5 | P a g e
1 Total capital under the Foundation IRB approach differ from the Standardised approach due to
differences in the amount permitted (up to 1.25% of RWA) in Tier 2 capital related to the qualifying
allowance for credit losses.
2 Tier 1 capital / (balance sheet exposures + converted off-balance sheet exposures).
3.2 Risk Weighted Assets
The Basel 3 Standardized and F-IRB approaches comprise estimates of credit risk, market risk and
operational risk.
3.2.1 Standardised Approach
Under the Standardised approach, we estimate credit risk by classify all credit exposures and risk positions
into pre-defined Basel 3 categories and sub-categories, with stated risk weights for each.
Market risk applies to covered positions that include securities trading, foreign exchange (FX) and
commodity exposures. We calculate the market risk capital according to CBI rules as outlined in note 51-
7-2-2 of the Financial Statements. The calculation of risk-weighted assets for market risk adhere relatively
closely to the guidelines set forth by the Basel 3 Simplified Standardised Approach (published January
2019), albeit adjusted with regards to the Iranian economy.
We measure operational risk using the new standardised approach for calculating operational risk capital
charge, published by the Basel Committee in December 2017.
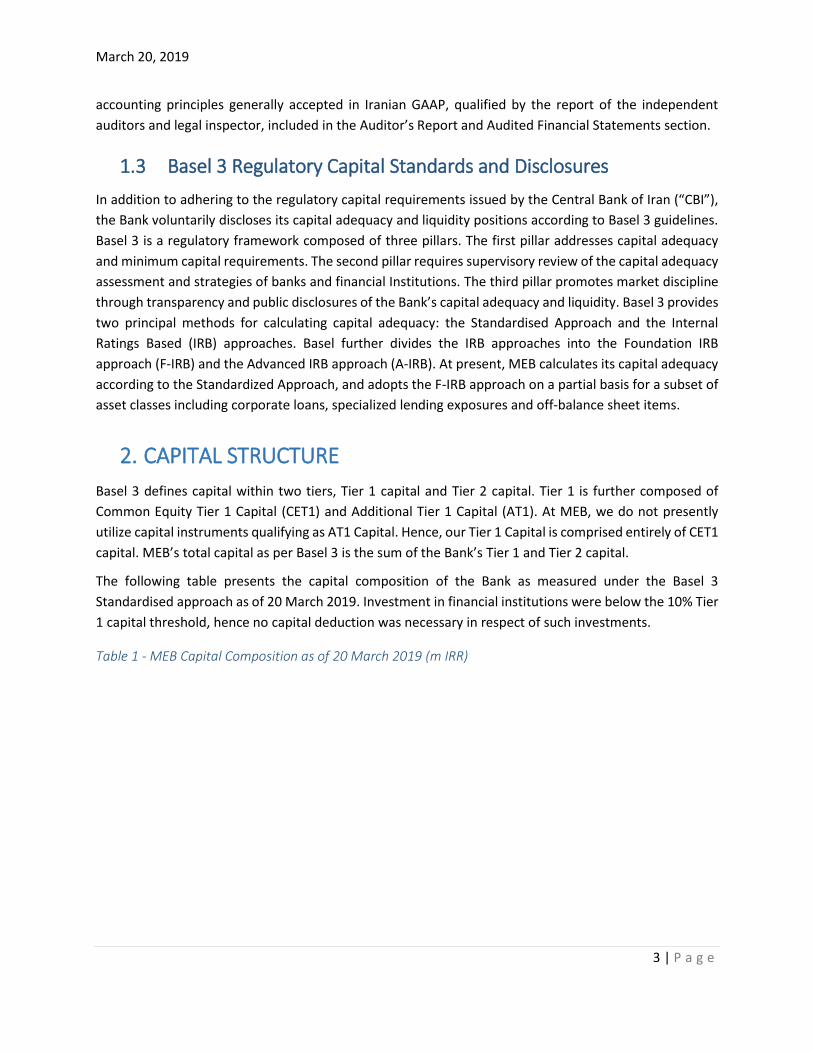
The following tables represents RWA by risk and exposure type under the Basel 3 Standardised approach
as of 20 March 2019.
Table 3 - Risk Weighted Assets under Basel 3 Standardised Approaches as of 20 March 2019
(Rials in millions) Standardised Foundation IRB
Regulatory Capital
Tier 1 capital 14,145,990 14,145,990
Total capital1 15,543,996 15,012,744
Assets
Risk Weighted Assets 140,255,195 144,458,919
Capital Ratios
CET1/Tier 1 CAR 10.1% 9.8%
Total Capital CAR 11.1% 10.4%
Basel III Leverage Ratio2 9.0% 9.0%
Basel 3
March 20, 2019
6 | P a g e
1
3.2.2 Foundation IRB Approach
In addition to the Basel 3 Standardised approach, MEB voluntarily reports its capital position according to
the Basel F-IRB approach using our own empirical models to estimate PD (probability of default) for
corporate exposures, including specialized lending.
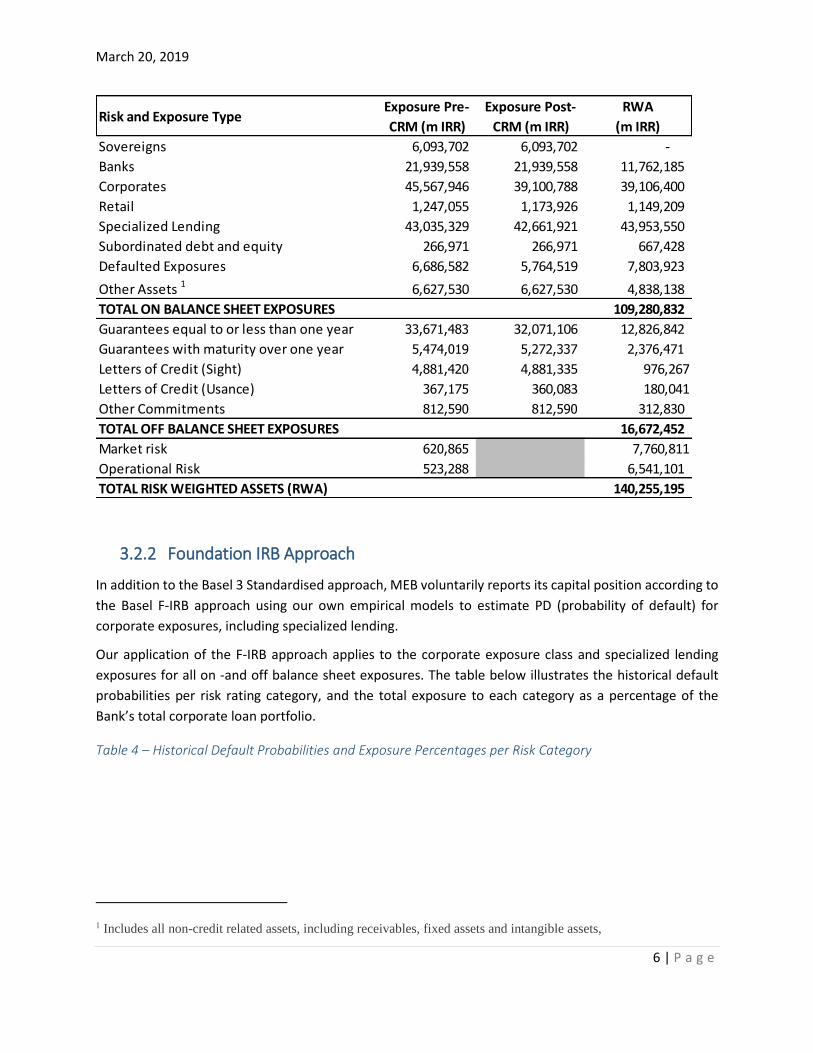
Our application of the F-IRB approach applies to the corporate exposure class and specialized lending
exposures for all on -and off balance sheet exposures. The table below illustrates the historical default
probabilities per risk rating category, and the total exposure to each category as a percentage of the
Bank’s total corporate loan portfolio.
Table 4 – Historical Default Probabilities and Exposure Percentages per Risk Category
1 Includes all non-credit related assets, including receivables, fixed assets and intangible assets,
Risk and Exposure TypeExposure Pre-
CRM (m IRR)
Exposure Post-
CRM (m IRR)
RWA
(m IRR)
Sovereigns 6,093,702 6,093,702 -
Banks 21,939,558 21,939,558 11,762,185
Corporates 45,567,946 39,100,788 39,106,400
Retail 1,247,055 1,173,926 1,149,209
Specialized Lending 43,035,329 42,661,921 43,953,550
Subordinated debt and equity 266,971 266,971 667,428
Defaulted Exposures 6,686,582 5,764,519 7,803,923
Other Assets 1 6,627,530 6,627,530 4,838,138
TOTAL ON BALANCE SHEET EXPOSURES 109,280,832
Guarantees equal to or less than one year 33,671,483 32,071,106 12,826,842
Guarantees with maturity over one year 5,474,019 5,272,337 2,376,471
Letters of Credit (Sight) 4,881,420 4,881,335 976,267
Letters of Credit (Usance) 367,175 360,083 180,041
Other Commitments 812,590 812,590 312,830
TOTAL OFF BALANCE SHEET EXPOSURES 16,672,452
Market risk 620,865 7,760,811
Operational Risk 523,288 6,541,101
TOTAL RISK WEIGHTED ASSETS (RWA) 140,255,195
March 20, 2019
7 | P a g e
As of the 20 March 2019, the weighted average rating for the Bank’s corporate portfolio was “B”. The
Bank’s F-IRB Capital Adequacy Ratio was 10.4%, as illustrated in table 2.
4. RISK MANAGEMENT STRUCTURE AND RESPONSIBILITIES
MEB takes a systematic approach to risk management, defined within our risk strategy framework. The
Risk Committee (RC) meets on a weekly basis to review the Bank’s risk strategy and report any breaches
in risk limits or material risk related issues. The risk strategy outlines clear roles and responsibilities for
the management of risk and provides the basis for delegation of authority to various committees and
executive officers, as well as establishing specific risk limits in respect of the Bank’s activities.
The Basel document titled “Guidelines - Corporate governance principles for banks”, issued October 2014,
forms the basis for the RC’s duties and responsibilities. The RC consists of three Board members, four
Executive Committee members and the Senior Risk Manager (SRM). The SRM is responsible for reporting
material risk-related issues to other members of the RC, as well as executing various resolutions issued by
the RC.
The Risk Management Department operates under the guidance of RC and carries out the policies set
forth by the committee. Headed by the SRM and managed by the Designated Risk Manager, the
department comprises six additional risk officers. The team shares responsibilities for managing all
material risks types (credit risk, market risk, operational risk, and liquidity risk), automation, modelling
and reporting, amongst other duties.
The internal/external corporate audit functions report directly to the Board and/or the CEO. Internal
corporate audit provide independent assessment and validation of key processes and controls across the
Bank, including periodic testing and examination of credit portfolios and processes.
5. CREDIT RISK
Rating
Historical Default
Probability
% of Total Corporate
Exposures
AAA 0.0% 0.0%
AA 0.0% 0.0%
A 0.0% 1.2%
BBB 0.0% 12.4%
BB 3.6% 7.6%
B 4.9% 32.3%
CCC 19.5% 21.4%
C/CC 47.3% 6.0%
Unrated 7.7% 19.2%
TOTAL 100.0%

March 20, 2019
8 | P a g e
Credit risk is the risk of economic loss emanating from the failure of the Bank’s credit customers to meet
their payment obligations in a timely manner. Several products expose us to significant credit risk,
including loans, bank guarantees, letters of credit, debt securities and assets within the trading book.
Recent adverse macroeconomic events in Iran may affect our credit portfolio, including a declining GDP
and consumer spending, coupled with high inflation a volatile FX market, as well as uncertainty concerning
interest rates. Increases in default rates among our credit customers would result in increased charge-offs
and provisions for credit losses.
At MEB, credit risk management for each customer begins with a preliminary assessment of the
customer’s financial profile, credit history, business outlook, management and ownership structure. Using
our industry-specific empirical rating models, and based on available data, we assign each customer a risk
rating ranging from AAA to C/CC. The rating reflects the expected probability of default (PD) for the
customer during the coming financial year. We monitor and review individual credit ratings on an ongoing
basis to reflect changes in general risk profiles of our clients.
In making credit risk recommendations, we consider the customer’s risk rating in addition to collateral,
industry concentrations, aggregate amount of credit lines extended to affiliated/group companies, as well
as the customer’s long-term relationship with the bank.
5.1 Credit Risk Policy
MEB’s credit policy follows CBI regulations as well as guidelines from the Basel Committee on Banking
Supervision (BCBS). The Bank’s overall credit risk bearing capacity is contingent on the credit-to-deposits
ratio, capital adequacy measures, liquidity measures and CBI regulations.
Corporate clients constitute the core of MEB’s credit customers. The Bank also welcomes individual
business owners (sole traders) registered with the Chamber of Commerce and in possession of tax codes.
MEB develops and maintains strong long-term banking relationships with all its credit customers.
The purpose of the majority of MEB’s credit facilities is to assist its clients with their short-term working
capital financing requirements. Our international activities are mainly limited to the importation of raw
materials and spare parts for companies operating within the food and pharmaceutical sectors.
Occasionally, MEB also engages in syndicated funding activities where funding is sourced through the
capital market or state-financed National Development Fund (NDF).
The Credit Department performs its own evaluation on its customers before submitting their information
for assessment by the Risk Management Department. Part of MEB’s credit risk policy is to maintain an
average Moody’s-equivalent credit risk rating above “B2” (similar to S&P/Fitch rating of “B”) in respect of
its overall credit portfolio. Customers with lower credit ratings are required to post sufficient collateral to
cover their higher-than-expected probability of default. We manage concentrations of large loans on an
ongoing basis to ensure they adhere with CBI limitations for “significant loans”.
5.2 Credit Approval Process
March 20, 2019
9 | P a g e
Depending their nature and scope, credit approvals at MEB may take place at either branch level, or at
the Banks’s headquarters within the Central Credit Committee, Supreme Credit Committee or Board
Committee. Note 51-3-4 of the Financial Statements details the organizational hierarchy at MEB for credit
approvals.
For information about the various stages involved in the Bank’s credit approval process, see note 51-3-2
of the Financial Statements.
5.3 Credit Risk Exposures
5.3.1 Total Asset Balances
As of 20 March 2019, the Bank’s total consolidated assets were approximately 139 trillion IRR, up 43
trillion IRR from 20 March 2018. The primary drivers behind the increase in total assets balances was:
Increase in loans driven by strong demand for interbank loans and corporate credit lines.
Higher cash and cash equivalents resulting from strong deposit inflows.
These increases – partially offset by a decrease in equity holdings and a decrease in “other assets” – are
reflected on the consolidated balance sheet.
5.3.2 Cash and Cash Equivalents
Cash and cash equivalents increased 2 trillion IRR, primarily due to strong deposit inflows driven by growth
in customer and client activity and partially offset by loan growth. For more information regarding cash
and cash-equivalent assets of Bank, see note 9 of the Financial Statements.
5.3.3 Loans and Leases
Commercial loans and leases increased approximately by 27 trillion IRR, driven by strong demand for
corporate loans. Loans to banks and financial institutions similarly exhibited a strong increase by around
11 trillion IRR, as illustrated on the balance sheet.
The table below illustrates borrowers’ repayment behavior in respect of the Bank’s performing local-
currency loans, defined as loans with less than 60 days late payment. As of 20 March 2019, such loans
constituted around 92% of the banks total loans portfolio. For information regarding borrowers’
repayment behaviors in respect of non-performing loans with late payment in excess of 60 days, please
refer to note 51-3-7-2 of the Financial Statements.

March 20, 2019
10 | P a g e
Table 5 – Borrowers’ repayment behavior in respect of performing local-currency loans
For more information regarding quality, concentration, collateral, industry distributions and management
of loans and leases, see note 51.3 (“Credit Risk”) of the Financial Statements.
5.3.4 Debt Securities
Debt securities, including investments in Islamic treasury bills, governmental bonds and corporate bonds,
totaled approximately 6 trillion IRR as of 20 March 2019. We use the debt securities portfolio primarily to
manage interest rate and liquidity risk and to take advantage of market conditions that create
economically attractive returns on these investments. For more information on debt securities, see note
12 of the Financial Statements.
5.3.5 Equity and Subordinated Debt
The Bank made a strategic decision to exit its equity-trading portfolio during the past year partially due to
regulatory and capital adequacy treatments of such assets. The Bank’s total equity holdings stood at
around 266,971 m IRR as of 20 March 2019, down from approximately 456,059 m IRR the previous year.
For more information on the bank’s equity investments, see note 12 of the Financial Statements.
5.3.6 Off-Balance Sheet Exposures
The Bank’s total off-balance sheet exposures increased to 45 trillion IRR as of 20 March 2019, from around
35 trillion IRR the previous year. When calculating outstanding amounts in respect of bank guarantees
(BGs), we deduct related cash deposits. We similarly deduct advance payments made by customers in
respect of letters of credit (LCs). For more information regarding the Bank’s off-balance sheet exposures,
see note 47 of the Financial Statements.
5.3.7 Geographic and Industry Distribution of Credit Exposures
For additional information on the geographic and industry distribution of MEB’s credit exposures, refer to
notes 51-3-8-1 (“Distribution of credit facilities and investments by economic sector”) and 52.2
(“Geographical concentration of major items of assets, liabilities and income”) of the Financial
Statements.
5.4 Credit Risk Rating System
% of Total % of Total
Status Description Exposure Amount Number of Loans
Excellent No late payments 28% 28%
Good 1 to 7 days late payment 14% 18%
Average 7 to 25 days late payment 29% 38%
Below average 25 to 60 days late payment 23% 14%
Others No payments due to date 5% 2%
TOTAL 100% 100%

March 20, 2019
11 | P a g e
The Bank’s primary risk rating system consists of a range of internally, empirically developed rating models
based on various industries. Such models are generally based on a combination of data available from
financial statements combined with customer-specific information, and calibrated based on the bank’s
historical default experience. The credit risk team calibrates the models periodically based on the bank’s
historical default experience with existing customers, resulting in generally consistent default
probabilities across risk ratings between different industry categories.
5.5 Determining Credit Risk Parameters
MEB’s capital risk parameters are regularly back-tested and benchmarked to evaluate their ongoing
performance and suitability. Through back testing, we validate the appropriateness of each parameter by
comparing its predicted values to the realized results. We then benchmark each parameter against
external standards or through alternative measurement methodologies to determine its validity.
5.5.1 Probability of Default (PD)
Probability of default or “PD” is an empirical estimate of the average one-year default rate of a customer
over a mix of economic conditions including upturns and downturns. Our method of estimating PDs aligns
our risk ratings with the definition of default according to Basel 3. We define “default” either as write-
offs, or on arrears on payment obligations of more than consecutive 90 days.
5.5.2 Exposure-at-default (EAD)
The exposure-at-default or “EAD” is an empirical estimate of the amount of exposure that is outstanding
to an obligor, when that obligor defaults, based on statistical analyses of historical data.
5.5.3 Loss-Given-Default (LGD)
We define loss-given-default or “LGD” as the estimated economic loss (in percentage terms of the EAD)
that the Bank would expect to incur if the customer (or any obligor within the customer’s rating category)
were to default within a one-year horizon. For the F-IRB approach, we assume a 45% LGD in line with Basel
guidelines.
5.6 Credit Risk Mitigation
The Bank manages the size and risk profile of the loan portfolio through portfolio risk diversification
through loan size and industry concentration. We proactively maintain our credit management practices
and standards to meet the constantly changing economic environments in Iran and abroad.
The Bank bases its credit granting decisions primarily on the credit standing of the borrowers and their
debt servicing ability, rather than collateral postings and/or guarantees. Nevertheless, we use collateral
and third party guarantees whenever possible to mitigate the credit risk assumed and monitor the value
of the collateral on a regular basis.
The main types of collateral taken by the Bank include cash, marketable securities, real estate, equipment
and trade receivable cheques. The practice of using trade receivable cheques as collateral allows the Bank

March 20, 2019
12 | P a g e
to monitor the ongoing cash flow and business performance of the borrower on an ongoing basis. The
Bank also regularly takes personal guarantees and collateral (e.g. principal residences) from key
shareholders and directors, as a form of moral support to ensure ethical fulfillment of the borrower’s
credit obligations vis-a-vis the Bank.
The Bank recognizes the credit risk mitigation (CRM) effect of qualifying collateral, described in Basel 3
with eligible haircuts in its regulatory capital calculations. These include primarily cash deposits and
marketable securities posted by the borrowers. As illustrated in table 3 (“Risk Weighted Assets under
Basel 3 Standardised Approach as of 20 March 2019”), the main reduction in exposure post
implementation of the CRM technique appears within the corporate, retail and defaulted exposure types.
5.7 Stress Testing
The table below illustrates the impact on the Bank’s capital adequacy ratio (CAR) under various credit
stress testing scenarios. Credit exposures included in our stress tests include banks, corporates,
specialized lending and all rated off-balance sheet commitments. Together, these account for almost 90%
of the Bank’s total risk-weighted assets1. Retail exposures (i.e. natural persons) account for less 1% of the
Bank’s risk-weighted assets1, with the remainder primarily consisting of defaulted exposures, non-credit
related assets and to smaller degree; equity investments. Two large specialized lending exposures (namely
Kangan and Sarvak Azar) have appropriate repayment guarantees from the National Iranian Oil Company
(NIOC) and as such, these have been assigned maximum risk weights of no more than 100% within these
stress scenarios. We detail all assumptions used for each stress-test scenario below.
Table 6 – Credit Stress Testing
1- Base Case Scenario:
a. Assuming asset composition and risk weights are equivalent to that of March 20, 2019.
2- Stress Scenario 1 (mild stress):
a. Downgrading all rated corporate loans with by one rating level (three notches).
b. Assuming all loans rated CCC and below become C/CC.
c. Assuming 20% of Grade A bank exposures deteriorate into Grade B.
3- Stress Scenario 2 (moderate stress):
a. Downgrading all corporate loans with by two rating levels (six notches).
1 Excluding market risk and operational risk.
Stress Scenarios
% rated BBB
and above
% rated between
BB and B
% rated
CCC
% rated C/CC
or Unrated F-IRB CAR
Base Case1 13.5% 39.8% 21.4% 25.3% 105.3% 10.4%
Scenario 1 (mild stress)2 1.2% 19.9% 32.2% 46.7% 122.6% 9.3%
Scenario 2 (moderate stress)3 0.0% 13.5% 7.6% 78.9% 139.3% 8.3%
Scenario 3 (severe stress)4 0.0% 1.2% 12.3% 86.5% 187.3% 6.5%
Corporate Portfolio Average Credit
Portfolio Risk
Weight

March 20, 2019
13 | P a g e
b. Assuming all loans rated B and below become C/CC.
c. Assuming 50% of Grade A bank exposures deteriorate into Grade B and 50% of Grade B
bank exposures deteriorate into Grade C.
d. Assuming the all specialized lending exposures deteriorate by one cardinal (in accordance
with Basel's supervisory slotting criteria for specialized lending 1)
4- Stress Scenario 3 (severe stress):
a. Downgrading all performing corporate by three rating levels (nine notches).
b. Assuming all loans rated BB and below become C/CC.
c. Assuming all Grade A Bank exposures deteriorate into Grade B and Grade C by 20% and
80% respectively. Further assuming 50% of all Grade B bank exposures deteriorate into
Grade C.
d. Assuming the all specialized lending exposures deteriorate by two cardinals (in accordance
with Basel's supervisory slotting criteria for specialized lending 1)
6. MARKET RISK
In this section, we discuss the risk that the Bank may sustain negative effects on the value of its assets,
liabilities or earnings due to changes in market conditions. Market risk is especially relevant to the Bank’s
trading book, including bonds and equities, as well as its foreign exchange (FX) exposures.
The Bank’s ALCO committee governs market risk. The committee members meet on a weekly basis to
update senior management and provide recommendations on market risk related matters. The Bank’s
market risk framework comprises policies and practices, validation and valuation procedures and
valuation models. The Risk Management Department employs a range of Value at risk (VaR) models to
monitor the Bank’s market risk on an ongoing basis, in line with sound market practices.
The Bank is in the process of implementing a comprehensive approach to monitoring and stress testing
market risk to ensure it remains well capitalized, even under adverse market conditions.
6.1 Reporting of Market Risk
The Bank currently adopts an approach similar to the Basel 3 Simplified Standardised Approach (published
January 2019) for the calculation of regulatory market risk, albeit adjusted with regards to the Iranian
economy. We outline the calculations in note 51-7-2-2 of the Financial Statements.
6.2 Measuring Market Risk
1 According to Basel’s slotting criteria for Project Finance, cardinals range from 1 (strong) to 5 (default). Risk weights
are 70%, 90%, 115% and 250% for cardinals 1 to 4 respectively. If a project is deemed to be in default and assigned
a cardinal of 5, the full amount of the exposure should be provisioned for and hence deducted from the Bank’s capital.

March 20, 2019
14 | P a g e
Separate from regulatory reporting, the Bank adopts several internal models to measure and control
market risk, primarily based on the VaR approach. Financial exposures measured and controlled by our
internal market risk models include interest rates, foreign exchange, and equity risk.
The VaR method assumes that observed historical changes could predict future movements in market
rates. Complementing the VaR risk estimates, the Bank performs stress testing under various macro-
economic scenarios to identify the Bank’s vulnerability to event risk. The purpose of these tests are to
provide the Bank an early-warning mechanism of in the case of systemic shocks. We base our VaR
calculation on a one-percent probability (one tail) using daily standard deviations over a 10-day horizon.
6.3 Interest Rate Risk
Partially owing to recent debt market developments in Iran, the Bank faces an increased level of interest
rate risk. MEB may face the prospect of losing funds by abiding by regulatory limits on interest rates while
other banks deviate significantly from such regulations.
6.3.1 Interest Rate Risk on Trading Book (IRRTB)
The only assets on the Bank’s trading book as of 20 March 2019 consisted of corporate and government
bonds. During the previous financial year, the government issued new bonds tradable in the secondary
market with discounts. Despite the still relatively small size of the secondary bond market in Iran, we have
witnessed a notable increase in volume expect IRRTB to constitute a larger part of our overall market risk
going forward. Due to the nature of these assets, their values may change due to a range of factors
including yields, market liquidity, inter-market correlations and market volatility. The following table
illustrates the effect of parallel shift in interest rates on the trading book.
Table 7 – IRRTB Stress Testing: Sensitivity of Market Values due to Parallel Shifts in the Yield Curve
Category
400 bp
decrease
200 bp
decrease
200 bp
increase
400 bp
increase
20 March 2019
Fixed Income Securities (m IRR) 209,920 103,091 (99,548) (195,735)
20 March 2018
Fixed Income Securities (m IRR) 261,168 130,584 (126,782) (253,564)
MEB Consolidated
Category
400 bp
decrease
200 bp
decrease
200 bp
increase
400 bp
increase
20 March 2019
Fixed Income Securities (m IRR) 206,814 100,038 (102,501) (198,640)
20 March 2018
Fixed Income Securities (m IRR) 261,168 130,584 (126,782) (253,564)
MEB LLP

March 20, 2019
15 | P a g e
6.3.2 Interest Rate Risk on Banking Book (IRRBB)
MEB does not use floating rates, or significant optionality (e.g. early repayment) within its loan portfolio.
Consequently, we did not observe significant effects on the Bank’s profitability despite lower regulatory
interest rates during the financial year ending March 2019. The following table illustrates the effect of
parallel shift in interest rates on the banking book.
Table 8 – IRRBB Stress Testing: Sensitivity of Income due to Parallel Shifts in the Interest Rates
Category
400 bp
decrease
200 bp
decrease
200 bp
increase
400 bp
increase
20 March 2019
Loans (m IRR) (1,971,992) (985,996) 985,996 1,971,992
Fixed Income Securities (m IRR) 1,600 800 (800) (1,600)
Deposits (m IRR) 2,014,544 1,007,272 (1,007,272) (2,014,544)
Total (m IRR) 44,152 22,076 (22,076) (44,152)
20 March 2018
Loans (m IRR) (1,782,565) (891,283) 891,283 1,782,565
Fixed Income Securities (m IRR) - - - -
Deposits (m IRR) 1,835,333 917,666 (917,666) (1,835,333)
Total (m IRR) 52,767 26,384 (26,384) (52,767)
MEB Consolidated
Category
400 bp
decrease
200 bp
decrease
200 bp
increase
400 bp
increase
20 March 2019
Loans (m IRR) (1,971,992) (985,996) 985,996 1,971,992
Fixed Income Securities (m IRR) 1,600 800 (800) (1,600)
Deposits (m IRR) 2,006,421 1,003,211 (1,003,211) (2,006,421)
Total (m IRR) 36,029 18,014 (18,014) (36,029)
20 March 2018
Loans (m IRR) (1,784,338) (892,169) 892,169 1,784,338
Fixed Income Securities (m IRR) - - - -
Deposits (m IRR) 1,828,808 914,404 (914,404) (1,828,808)
Total (m IRR) 44,469 22,235 (22,235) (44,469)
MEB LLP

March 20, 2019
16 | P a g e
6.4 Foreign Exchange Risk
MEB’s foreign exchange risk is primarily due to off-balance sheet commitments related to imports of
goods. MEB does not engage in speculative foreign exchange activities. The Bank does occasionally
however end up with open long or short positions, mainly because of FX denominated credit products
extended through the NDF or to customers engaging in import/export activities.
The tables within note 51-5-5-2 of the Financial Statements illustrate the possible effects on the
Bank’s income due to FX risk under the single-asset and variance-covariance VaR models.
The tables within note 51-5-6 of the Financial Statements illustrate the expected amount of capital
required to cover FX risk under the single-asset and variance-covariance VaR models.
6.5 Equity Risk on the Banking Book
The total equity exposures of the Bank as of 20 March 2019 were restricted to strategic investments in
ME Life Insurance Company, MEB Brokerage, MEB Currency Exchange and MEB Information Technology
Company. The two tables in note 51-5-6 of the Financial Statements illustrate the VaR measure and
corresponding regulatory capital requirement for our equity exposures using the single-asset method, as
well as the variance-covariance VaR methods.
7. OPERATIONAL RISK
The seven operational risk event types according to Basel committee are:
1- Internal Fraud
2- External Fraud
3- Employment Practices and Workplace Safety
4- Clients, Products, and Business Practice
5- Damage to Physical Assets
6- Business Disruption and Systems Failures
7- Execution, Delivery, and Process Management
Risk Management Department uses these categories to identify and assess operational risks as part of its
Risk and Control Self-Assessment framework, explained below.
7.1 Risk and Control Self-Assessment framework
The operational risk assessment process follows the Risks and Controls Self-Assessment (RCSA)
methodology, according to which:
Each of the Bank’s branches and risk taking units has a designated RCSA representative,
responsible to conduct the process within their unit in close co-ordination with a risk officer.
The designated RCSA representatives determine the frequency and severity of identified
operational risks and divide them into two categories: “material risks” and “non-material risks”.

March 20, 2019
17 | P a g e
The heads of all risk-taking units (in co-ordination with the relevant risk officers) are required to
verify all identified “material risks” within their unit and propose mitigation procedures to control
such risks.
The Risk Management Department classifies all residual risks that remains unhedged following
the application of the Bank’s mitigation procedures as a “material risks” and include them within
its Risk Inventory.
By applying the RCSA, we have identified numerous material operational risks within the various sections
of the Bank and its branches to date.
7.2 Operational Risk Portal
The Bank's Operational Risk Portal allows for timely identification and mitigation of operational risks (e.g.
internal and external fraud) through a confidential online reporting system used by bank employees and
managers. This system has enabled us to identify around 350 operational risk cases to date in various
areas of the Bank and its branches.
7.3 New Product and Services Process
The Bank’s New Product and Services Process (NPSP) ensures that operational risk emanating from new
products and services within the Bank and its branches can be properly identified and mitigated through
a multi-disciplinary, multi-departmental framework.
7.4 Risk Inventory
The Bank’s Risk Inventory is a multi-disciplinary process according to which various types of risks are
collected, identified and assessed at all levels of the Bank. MEB’s Risk Inventory process comprises credit
risk, market risk, operational risk, liquidity risk, concentration risk, legal and compliance risk and
reputational risk. The Risk Inventory provides a detailed catalogue of all identified risks – categorized
according to risk type – within the Bank, along with relevant mitigation procedures.
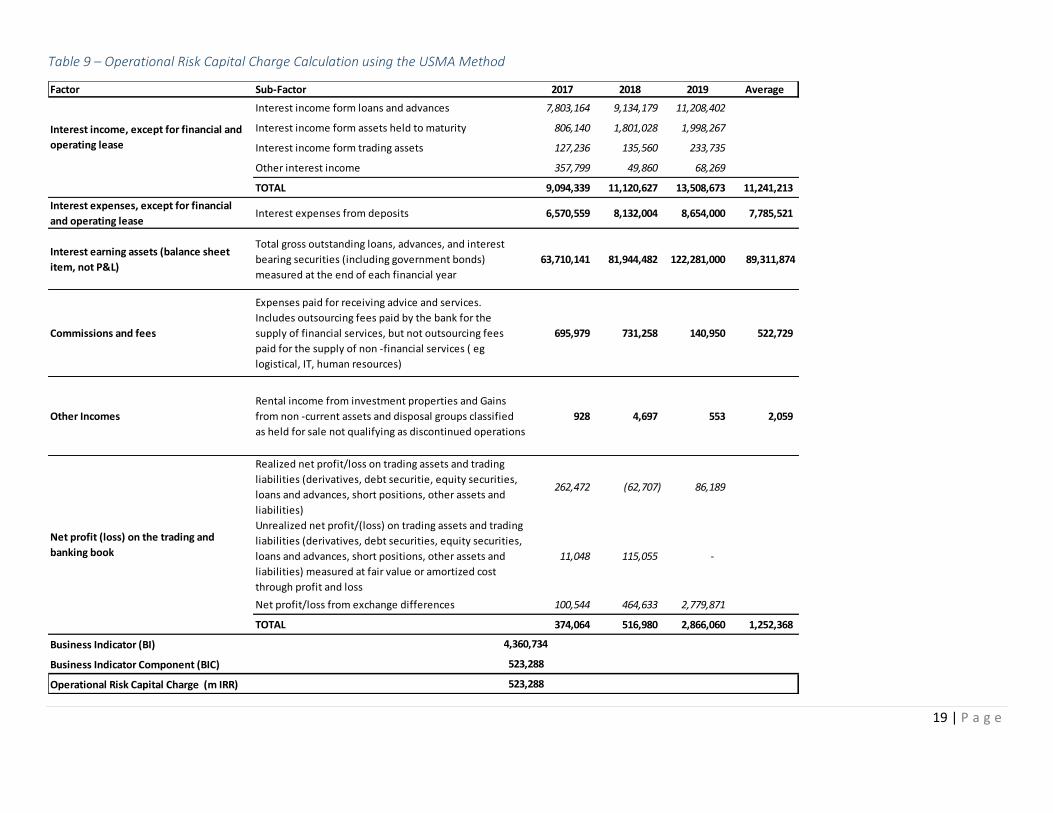
7.5 Updated Standardized Measurement Approach
MEB applies the Updated Standardized Measurement Approach as per Basel 3 (“USMA”) to calculate
operational risk capital charge. According to the approach, we first calculate a value for the Bank’s
business indicator (BI) based on the its interest income and interest expenses, interest earning assets,
services incomes, and net profit/loss on the trading book and banking books. We then convert the
calculated BI amount into the business indicator component (BIC) and map it to the required operational
risk capital charge in accordance with Basel 3 guidelines. However, as the Bank’s BIC is less than 1 billion
Euros, adjustments of the Bank’s operational risk capital using the Internal Loss Multiplier (ILM)
component do not apply. The USMA model uses three-year averages of each of the above components.
March 20, 2019
18 | P a g e
Interest income includes income from loans and advances, securities held to maturity as well as
the trading portfolio, in addition to other income emanating from interest on the Bank’s statuary
deposits.
Interest expenses relate mainly to deposits.
Interest earning assets consist of total gross outstanding balances of loans and other assets such
as fixed income securities.
Services income includes various fees and commissions charged by the Bank in respect of its
products and services.
Financial income relates to realized and unrealized gains and losses on assets measured at either
fair value or through amortized costs.
The table below illustrates the Operational Risk capital charge calculation using the USMA method.
19 | P a g e
Table 9 – Operational Risk Capital Charge Calculation using the USMA Method
Factor Sub-Factor 2017 2018 2019 Average
Interest income form loans and advances 7,803,164 9,134,179 11,208,402
Interest income form assets held to maturity 806,140 1,801,028 1,998,267
Interest income form trading assets 127,236 135,560 233,735
Other interest income 357,799 49,860 68,269
TOTAL 9,094,339 11,120,627 13,508,673 11,241,213
Interest expenses, except for financial
and operating lease Interest expenses from deposits 6,570,559 8,132,004 8,654,000 7,785,521
Interest earning assets (balance sheet
item, not P&L)
Total gross outstanding loans, advances, and interest
bearing securities (including government bonds)
measured at the end of each financial year
63,710,141 81,944,482 122,281,000 89,311,874
Commissions and fees
Expenses paid for receiving advice and services.
Includes outsourcing fees paid by the bank for the
supply of financial services, but not outsourcing fees
paid for the supply of non -financial services ( eg
logistical, IT, human resources)
695,979 731,258 140,950 522,729
Other Incomes
Rental income from investment properties and Gains
from non -current assets and disposal groups classified
as held for sale not qualifying as discontinued operations
928 4,697 553 2,059
Realized net profit/loss on trading assets and trading
liabilities (derivatives, debt securitie, equity securities,
loans and advances, short positions, other assets and
liabilities)
262,472 (62,707) 86,189
Unrealized net profit/(loss) on trading assets and trading
liabilities (derivatives, debt securities, equity securities,
loans and advances, short positions, other assets and
liabilities) measured at fair value or amortized cost
through profit and loss
11,048 115,055 -
Net profit/loss from exchange differences 100,544 464,633 2,779,871
TOTAL 374,064 516,980 2,866,060 1,252,368
Business Indicator (BI)
Business Indicator Component (BIC)
Operational Risk Capital Charge (m IRR)
Net profit (loss) on the trading and
banking book
4,360,734
523,288
523,288
Interest income, except for financial and
operating lease