Embed Size (px)
Citation preview
Midterm
• Vote: Take Home or In Class?
• Same format regardless of choice– Essay/short answer
Content analysis
• Analyzing social artifacts– Books, newspapers, TV shows
• Inexpensive, but time consuming
• Requires interpretation (coding)
Group Project
• Interviews
• Content Analysis– Examination of empirical studies
Pawson article
• There are two dominant methods of evaluating existing social policy/programs:– Numerical Meta-Analysis– Narrative review
Meta-Analysis & Narrative Review
• What information should be extracted from the original studies?
• How should the comparison between different types of initiatives be achieved?
Narrative Review
• The journal articles will be the “observations”. The interpretation and comparison of findings is critical.
• In your final reports you will:– Finding common themes.– Selecting the best programs to highlight. – Identify elements from successful approaches.
Forecasting and Projections
• Not easy (technically complex)
• Not always objective
• 2000 budget surplus– Gore said he could eliminate federal debt by
2012, Bush by 2016– Based on just a few years of (exceptional) data
Federal Budget
• OMB – 1970– The Office of Economic Policy (EP), along
with the Treasury Department and the Council of Economic Advisers (CEA), develops economic assumptions for the Budget and works closely with Budget Review Division on budgetary issues. EP assists with budget estimates, policy proposals, cost models, and other data analytics, especially in the areas of credit and insurance, health, labor, education, and tax policy.
Federal Budget
• CBO – 1974– CBO currently employs about 250 people.
The agency is composed primarily of economists and public policy analysts. About three-quarters of its professional staff hold advanced degrees, mostly in economics or public policy.
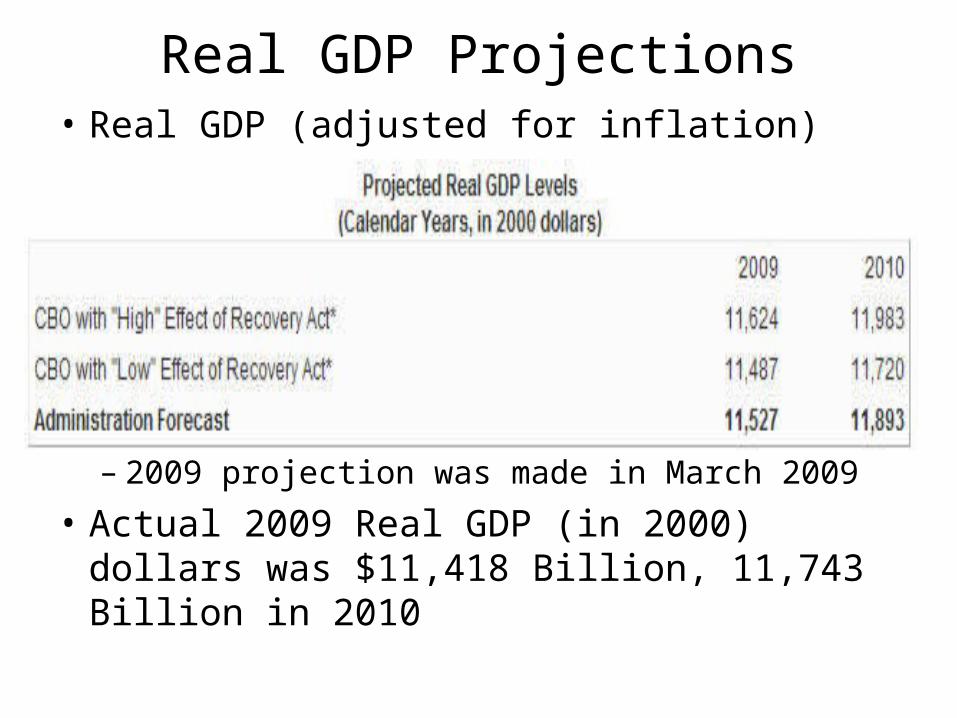
Real GDP Projections• Real GDP (adjusted for inflation)
– 2009 projection was made in March 2009
• Actual 2009 Real GDP (in 2000) dollars was $11,418 Billion, 11,743 Billion in 2010

Nevada Budget
• Economic Forum– 5 member panel – appointed by Governor
• 1 is nominated by the Speaker of the Assembly• 1 is nominated by the Majority Leader of the Senate• 2 year terms
• Forecasts for the state’s revenue sources are prepared by the Fiscal Analysis Division, Budget Division, staff from specific agencies responsible for collecting the revenue source, and a national forecasting firm for the state sales tax and gaming percentage fee tax.
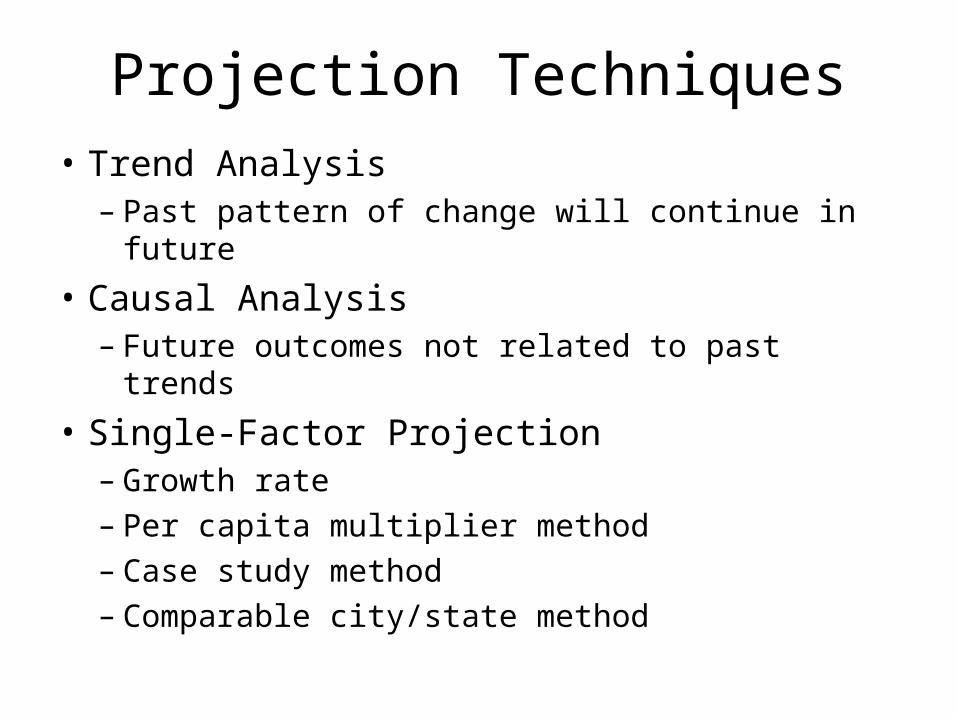
Projection Techniques
• Trend Analysis– Past pattern of change will continue in future
• Causal Analysis– Future outcomes not related to past trends
• Single-Factor Projection– Growth rate– Per capita multiplier method– Case study method– Comparable city/state method

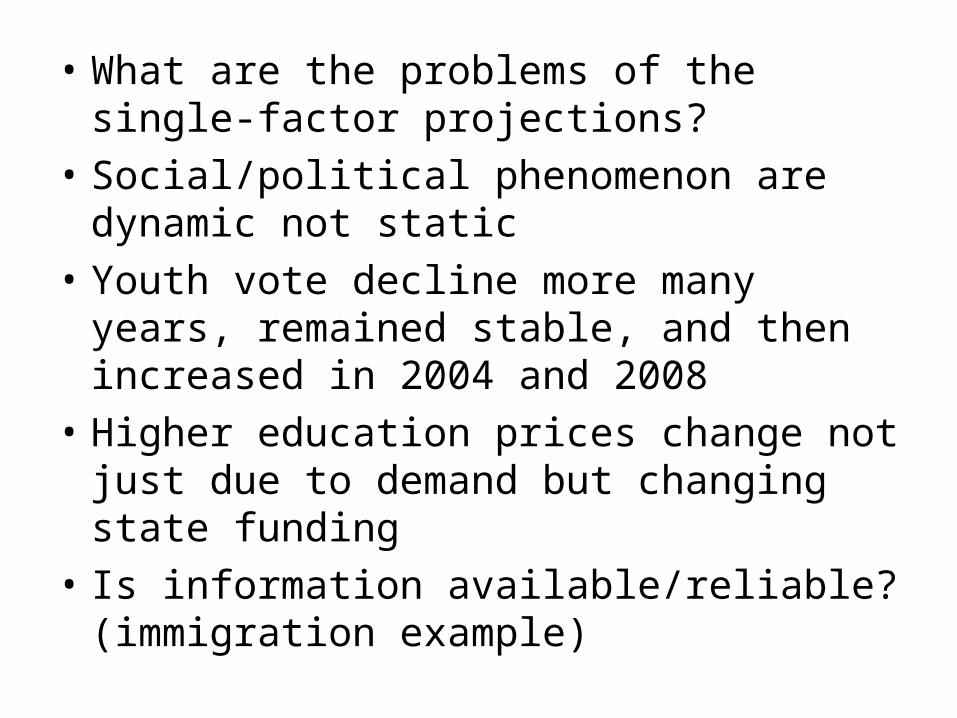
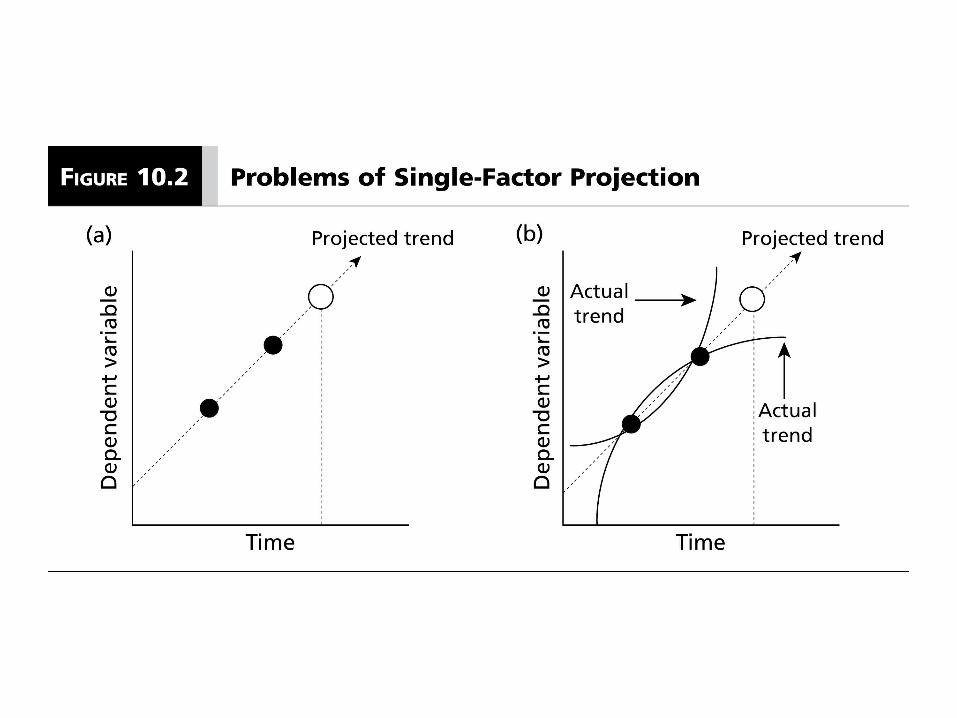
• What are the problems of the single-factor projections?
• Social/political phenomenon are dynamic not static
• Youth vote decline more many years, remained stable, and then increased in 2004 and 2008
• Higher education prices change not just due to demand but changing state funding
• Is information available/reliable? (immigration example)
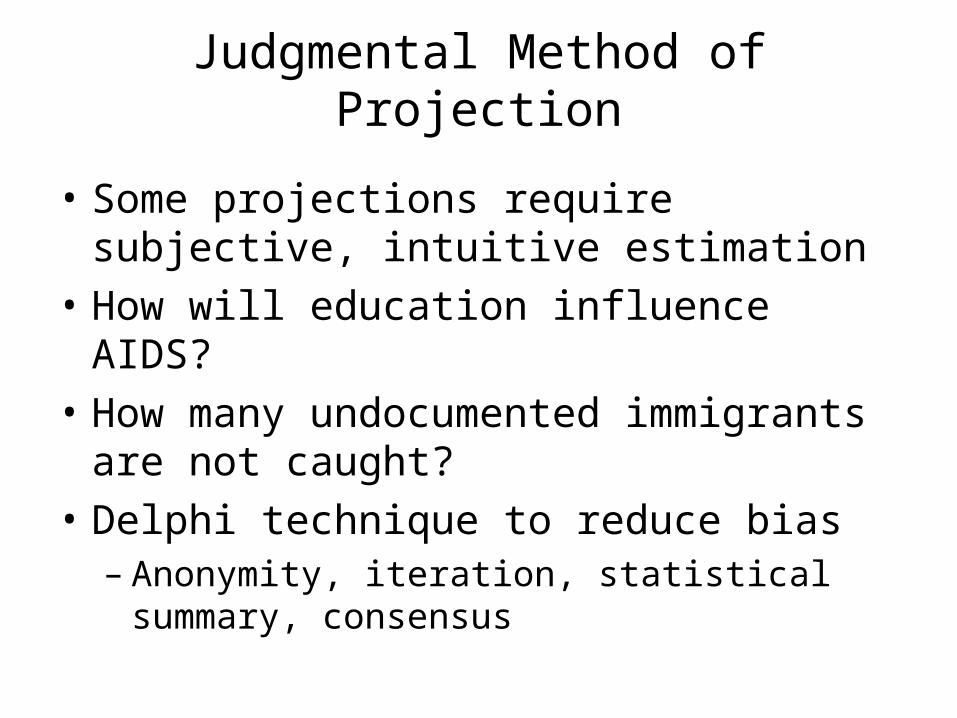
Judgmental Method of Projection
• Some projections require subjective, intuitive estimation
• How will education influence AIDS?
• How many undocumented immigrants are not caught?
• Delphi technique to reduce bias– Anonymity, iteration, statistical summary,
consensus
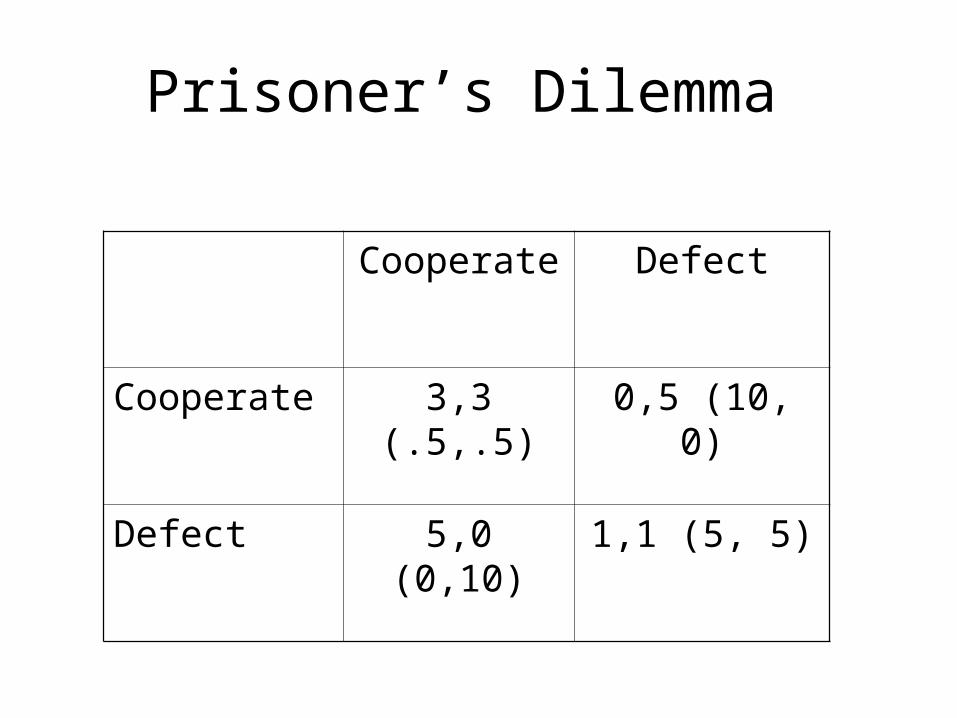
Prisoner’s Dilemma
Cooperate Defect
Cooperate 3,3 (.5,.5) 0,5 (10, 0)
Defect 5,0 (0,10) 1,1 (5, 5)
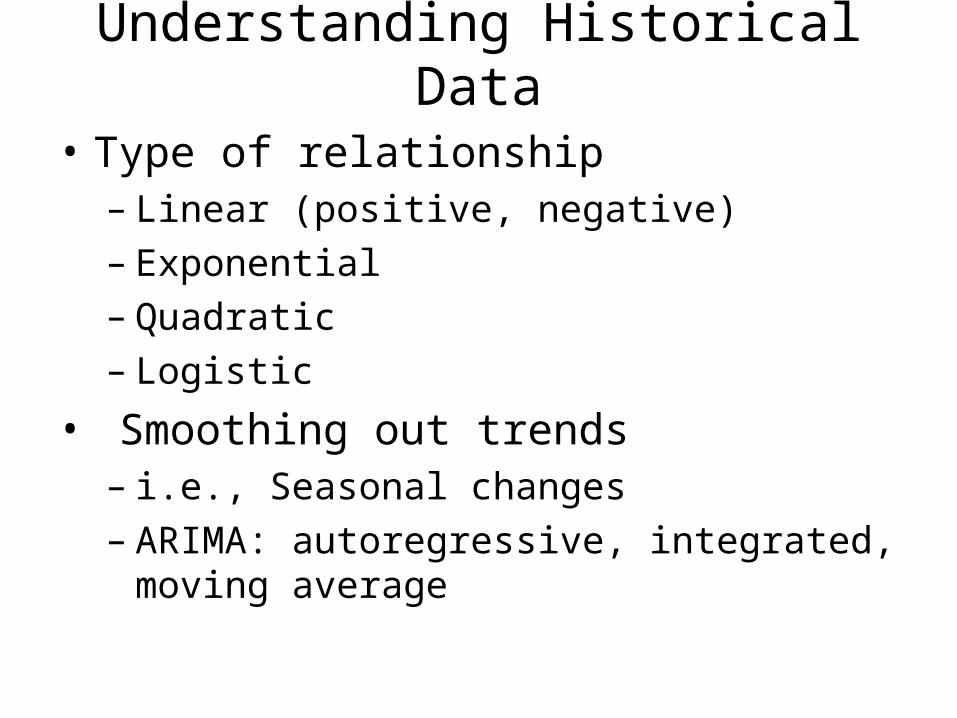
Understanding Historical Data
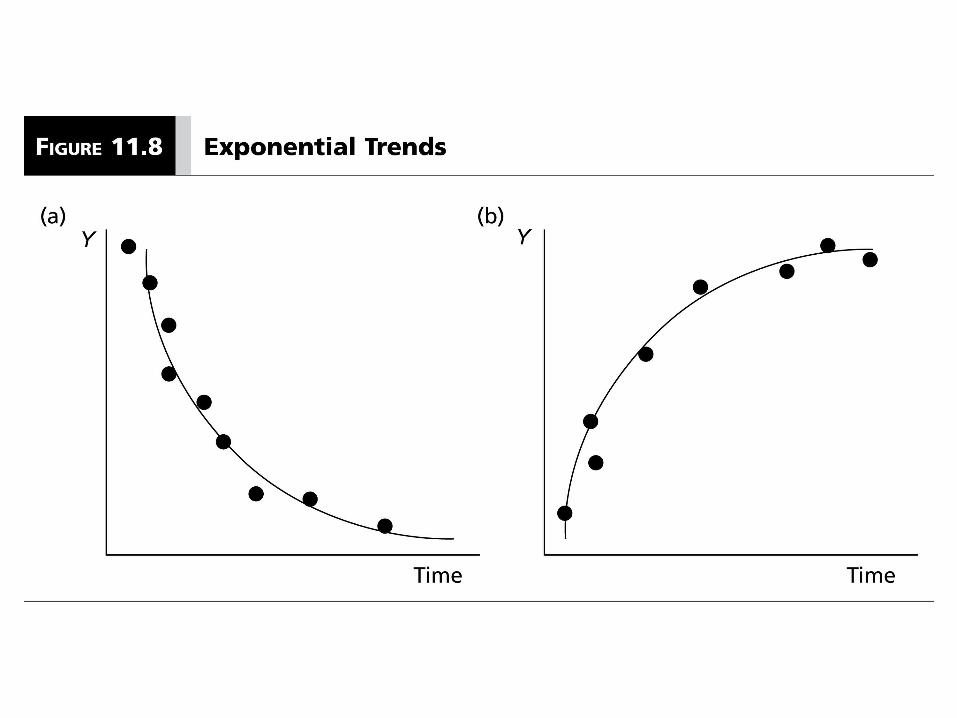
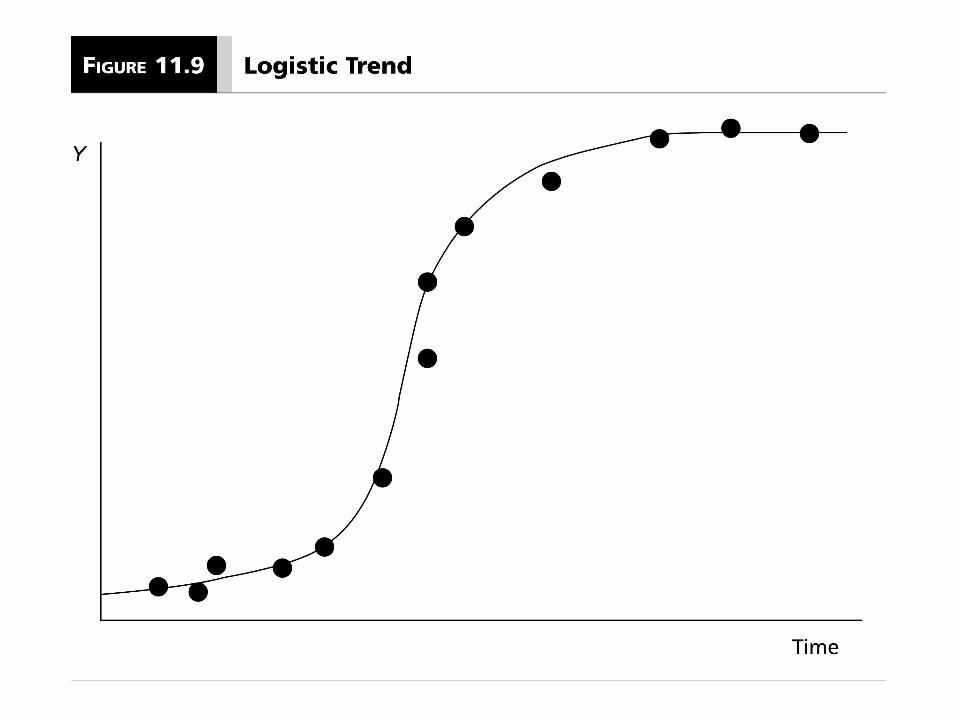
• Type of relationship– Linear (positive, negative)– Exponential– Quadratic– Logistic
• Smoothing out trends– i.e., Seasonal changes– ARIMA: autoregressive, integrated, moving
average


![CROSS-TALK STUDIES - Istituto Nazionale di Fisica … · present regardless the rou6ng à likely MAROC feature LH-RH Xtalk 6 CLAS12 RICH Project Midterm Status Le] OR right channels](https://img.pdfslide.net/doc/110x75/5b9d946509d3f2df1f8d2eb7/cross-talk-studies-istituto-nazionale-di-fisica-present-regardless-the-rou6ng.jpg)