Embed Size (px)
Citation preview
November 2008 - 1 - Midwest Reliability Organization
Midwest Reliability Organization Model Building Manual Addendum - Wind Generation November 7, 2008 Midwest Reliability Organization 2774 Cleveland Ave N Roseville, MN 55113 651-855-1760 Published: November 7, 2008 Prepared by: MRO Model Building Subcommittee Wind Generator Modeling Task Force Approved by MRO Model Building Subcommittee 12/18/2008
Model Building Manual - Wind Generation
November 2008 - 2 - Midwest Reliability Organization
Table of Contents Foreword Executive Summary Revisions 1. General Information ............................................................................... 4
1.1. Introduction .................................................................................... 4 1.2. Purpose .......................................................................................... 4 1.3. Scope of Activities ........................................................................... 4
2. Model Building Resources ....................................................................... 4 3. Power Flow Model .................................................................................. 5
3.1. Wind Generating Plant Topology ........................................................ 5 3.2. Net Representation of Generating Units at a Wind Farm ....................... 6 3.3. MW Dispatch/Modeling ..................................................................... 7 3.4. MVAR Dispatch/Modeling .................................................................. 8 3.5. Power Flow Modeling Conventions .................................................... 12
4. Dynamic Model ..................................................................................... 13 4.1. Choosing the Right Dynamic Model .................................................. 13
5. Short Circuit Model ............................................................................... 15 Appendix A - Wind generation data collection worksheet .......................... 16 Appendix B - Wind Turbine Generator (WTG) – Technology Types ............ 19 Appendix C - PSS/E Dynamic Model Look-up ............................................. 22 Appendix D - MRO Suggested Seasonal Dispatch ....................................... 23 Appendix E - Sample PSS/E power flow data ............................................ 25 Appendix F - Sample PSS/E dynamics data ............................................... 31 Appendix G - Sample Data Request for Wind Power Plants ........................ 39 Appendix H - Bibliography ......................................................................... 42
November 2008 - 3 - Midwest Reliability Organization
Foreword This addendum to the Midwest Reliability Organization (MRO) Model Building Manual provides modeling details specific to wind generation. This document was developed through the efforts of the Wind Generator Modeling Task Force (WGMTF) and subsumed by the MRO Model Building Subcommittee (MBS). The results of studies obtained through the use of the power flow cases developed by the Midwest Reliability Organization will be the sole responsibility of the receiving party. The recipient of MRO power flow cases must assure confidentiality and proprietorship. Executive Summary This document contains recommendations for modeling Wind Turbine Generators (WTG) and associated plant facilities for both power flow and dynamic stability analysis. Recognizing the maturity of industry developments for modeling of WTG’s in power flow, data submitters should adopt the recommendations noted herein. WTG modeling for stability is still evolving and much activity is underway related to developing appropriate models. The IEEE Dynamic Performance of Wind Power Generation Working Group and the Western Electricity Coordinating Council (WECC) Wind Generator Modeling Group are leading the effort to develop improved generic PSS/E wind models applicable for regional (MRO) models. Until these models and the applicable data parameters for specific vendor WTG’s are provided, the following options apply for stability modeling:
• MRO model development Use PSS/E WT3 model for GE 1.5 MW doubly fed induction generators Use standard PSS/E CIMTR1 or CIMTR3 model for remaining wind turbine types Note: The type WT1 and WT2 are expected to be available upon release of PSS/E Version 32.
• WTG Interconnection studies
Use WTG vendor’s detailed model for the machine/plant being studied. Revisions Rev0 - March 1, 2007 - Original document Rev1 – July 3, 2007 – DRAFT Rev2 - October 12, 2007 - 1st release Rev3 – November 7, 2008 – 2nd release (pending MRO MBS approval)

Model Building Manual - Wind Generation
November 2008 - 4 - Midwest Reliability Organization
1. General Information
1.1. Introduction
Additional guidance is needed for modeling wind generation because of the following reasons: • Rapid growth of wind generation – wind generation will contribute a
significant portion of the generation in the MRO footprint, necessitating more accurate studies, which require more detailed and accurate models.
• Wind turbines and control and energy conversion technologies are rapidly evolving.
• Wind generation facilities are composed of a large number of small units, which is the opposite of more traditional generation facilities.
• There are a number of options for the wind turbine dynamic models, however, many are proprietary, inflexible or have very little application experience and guidance upon which to draw.
1.2. Purpose
This addendum will provide the model builders with the instructions, background and guidelines necessary for developing wind generation models for power flow and dynamic studies. It will also provide background considerations for determining dispatch levels.
1.3. Scope of Activities
In carrying out the above purpose, this addendum to the manual will: • Provide instructions for tabulating installed and planned wind
generating facilities within the MRO footprint as per Appendix A. • Provide guidelines for power flow, dynamic and short circuit modeling
of wind facilities. • Provide guidelines for dispatching wind-generating plants under the
various base power flow conditions developed by MRO. • Provide wind generation modeling references and resources.
2. Model Building Resources
Appendix A provides definitions for the tabulation of existing and planned wind generation that will be included in the MRO model series. The populated Wind Data Collection spreadsheet can be found on the MRO ftp site at: ftp://old.midwestreliability.org. Appendix B describes the wind turbine generator (WTG) generic model types. Appendix C lists the make/models available from a variety of wind turbine generator vendors and also specifies the associated WTG generic model type applicable to each make/model based on the technology employed by them.
Model Building Manual - Wind Generation
November 2008 - 5 - Midwest Reliability Organization
3. Power Flow Model
3.1. Wind Generating Plant Topology
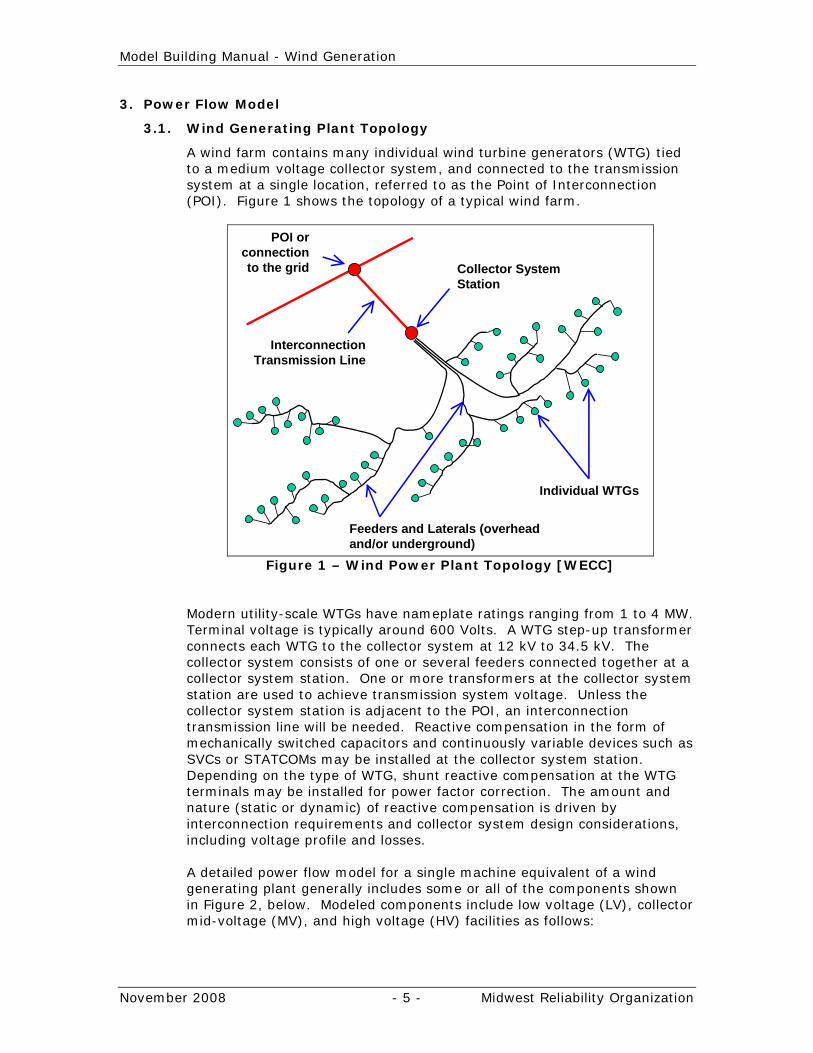
A wind farm contains many individual wind turbine generators (WTG) tied to a medium voltage collector system, and connected to the transmission system at a single location, referred to as the Point of Interconnection (POI). Figure 1 shows the topology of a typical wind farm.
POI or connection to the grid Collector System
Station
Feeders and Laterals (overhead and/or underground)
Individual WTGs
Interconnection Transmission Line
Figure 1 – Wind Power Plant Topology [WECC]
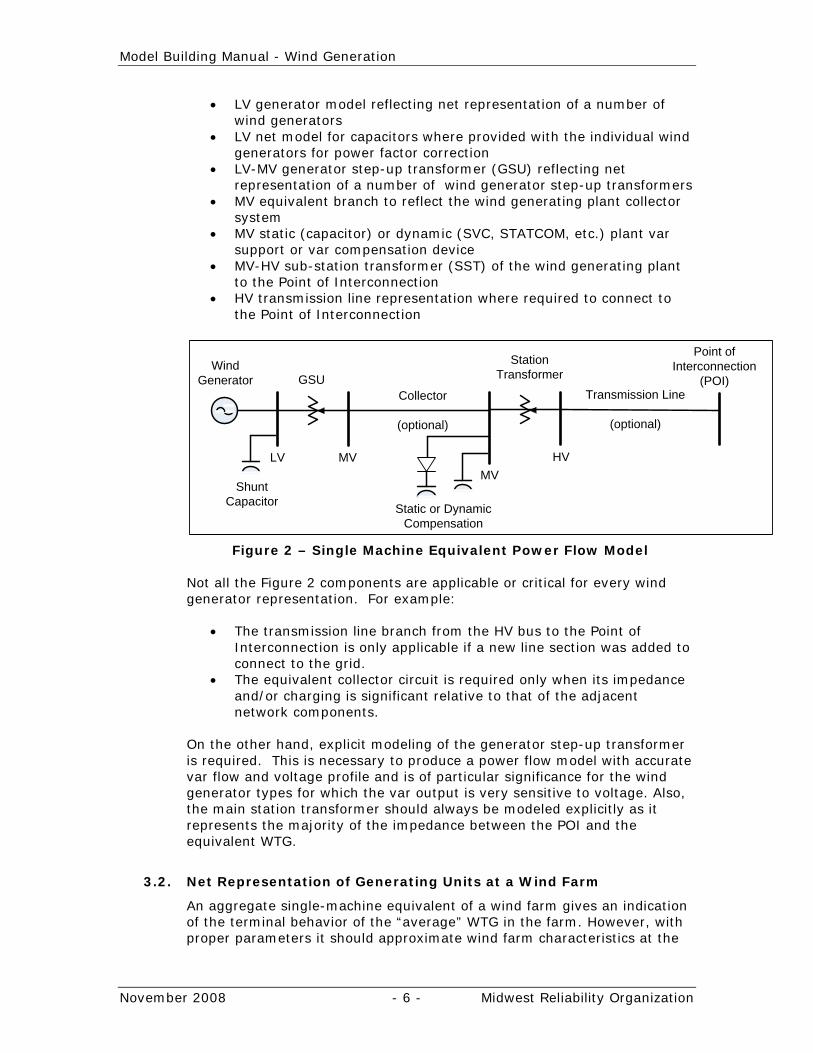
Modern utility-scale WTGs have nameplate ratings ranging from 1 to 4 MW. Terminal voltage is typically around 600 Volts. A WTG step-up transformer connects each WTG to the collector system at 12 kV to 34.5 kV. The collector system consists of one or several feeders connected together at a collector system station. One or more transformers at the collector system station are used to achieve transmission system voltage. Unless the collector system station is adjacent to the POI, an interconnection transmission line will be needed. Reactive compensation in the form of mechanically switched capacitors and continuously variable devices such as SVCs or STATCOMs may be installed at the collector system station. Depending on the type of WTG, shunt reactive compensation at the WTG terminals may be installed for power factor correction. The amount and nature (static or dynamic) of reactive compensation is driven by interconnection requirements and collector system design considerations, including voltage profile and losses. A detailed power flow model for a single machine equivalent of a wind generating plant generally includes some or all of the components shown in Figure 2, below. Modeled components include low voltage (LV), collector mid-voltage (MV), and high voltage (HV) facilities as follows:
Model Building Manual - Wind Generation
November 2008 - 6 - Midwest Reliability Organization
• LV generator model reflecting net representation of a number of wind generators
• LV net model for capacitors where provided with the individual wind generators for power factor correction
• LV-MV generator step-up transformer (GSU) reflecting net representation of a number of wind generator step-up transformers
• MV equivalent branch to reflect the wind generating plant collector system
• MV static (capacitor) or dynamic (SVC, STATCOM, etc.) plant var support or var compensation device
• MV-HV sub-station transformer (SST) of the wind generating plant to the Point of Interconnection
• HV transmission line representation where required to connect to the Point of Interconnection
WindGenerator GSU
Collector
(optional)
Transmission Line
(optional)
Point ofInterconnection
(POI)
LV MV HVMV
Static or DynamicCompensation
ShuntCapacitor
StationTransformer
Figure 2 – Single Machine Equivalent Power Flow Model Not all the Figure 2 components are applicable or critical for every wind generator representation. For example:
• The transmission line branch from the HV bus to the Point of Interconnection is only applicable if a new line section was added to connect to the grid.
• The equivalent collector circuit is required only when its impedance and/or charging is significant relative to that of the adjacent network components.
On the other hand, explicit modeling of the generator step-up transformer is required. This is necessary to produce a power flow model with accurate var flow and voltage profile and is of particular significance for the wind generator types for which the var output is very sensitive to voltage. Also, the main station transformer should always be modeled explicitly as it represents the majority of the impedance between the POI and the equivalent WTG.
3.2. Net Representation of Generating Units at a Wind Farm
An aggregate single-machine equivalent of a wind farm gives an indication of the terminal behavior of the “average” WTG in the farm. However, with proper parameters it should approximate wind farm characteristics at the
Model Building Manual - Wind Generation
November 2008 - 7 - Midwest Reliability Organization
POI. This model is adequate for regional studies where the requirement is to capture the wind farm impact on overall power system performance. The single-machine representation has some limitations. For wind farm generator interconnection studies, where the impact of the wind farm is to be studied in detail, a single-machine representation may not be adequate. If a single-machine representation is used to study the impact of a specific wind farm study results should be interpreted cautiously. Due to collector system effects, terminal voltage of individual WTGs could vary significantly. WTGs that are closest to the POI can experience significantly different terminal voltage compared to WTGs that are electrically farthest from the POI. In actual operation, terminal voltage of some WTGs may reach control or protection limits, resulting in different terminal behavior, or tripping. A single-machine equivalent only provides an indication of the terminal behavior for the “average WTG” in the wind farm. Individual wind generators can be aggregated into a net generator representation only when the units all have the same dynamic characteristics. This is necessary because the same model is used for both power flow and dynamic simulation. Preliminary data should be replaced with as-built data when such data becomes available, certainly shortly after commissioning. For wind plant modeling, the fundamental goal is to aggregate like units as much as possible. The data submitter has the option to break the representation down further based on shared ownership and/or dispatch rights if considered appropriate.
3.3. MW Dispatch/Modeling
Several factors must be considered in setting wind generation schedules in our models:
• Capacity factor Per 2006 and 2007 historical wind generation data for the northern MRO region, seasonal off-peak and peak capacity for wind generating plants varies from 12.0% to 53.3% of the plant’s rated output. See Appendix D. Per the 2006 Minnesota Wind Integration Study, seasonal peak capacity for wind generating plants in the MRO region is expected to range from 37.8 to 50.9% of the plant’s rated output. Also see Appendix D.
• Coincidence of wind generation availability and peak load (or off-peak) The seasonal wind resource in the MRO region is controlled by the jet stream position with the best wind resource expected in the winter, spring, and fall seasons. Some utilities and RTOs (e.g. PJM) have determined that wind statistically delivers 20% of capacity during their summer peak system load conditions.
• Special conditions affecting wind generation availability
Model Building Manual - Wind Generation
November 2008 - 8 - Midwest Reliability Organization
Some wind generators do not operate at extreme temperature (high or low), as discussed below. As a result, some wind generators could be modeled off-line for the summer or winter peak cases.
The recommended wind generation dispatch (Pgen) levels in the MRO models are based on the quantitative analysis of historical wind generation data from the MRO region (Appendix D) as shown in Table 1 below.
NERC/MRO season Peak Off-Peak or Light Load
Spring 35% 35% Summer 20% 35% Fall 35% 35% Winter 35% 35%
Table 1 - Generation Dispatch Levels
Note: The wind generation dispatch levels should be set to suit the particular study being performed.
3.3.1. Modeling WTG at Reduced Generation Output
There are two choices on how to model the dispatch of a WTG at reduced generation output (e.g. 20% of nameplate rating):
a) All machines dispatched at reduced output. Machines can run at 15-20% of rated output under reduced wind speed
b) Reduced number of machines on-line, but each on-line machine at 100% rated output.
Option a) is the recommended approach since it is more plausible that reduced wind speed in a confined geographic area will equally affect the output of all wind turbines within the plant.
3.3.2. Considerations for plants in extreme ambient climate Some regions within the MRO footprint experience extreme ambient conditions. This may impact the availability of their wind generators to operate during those extreme conditions. For example, some wind generators, even with an arctic climate package, may not operate if ambient temperature falls below -30ºC. The data representative may therefore elect to turn their machines off for winter conditions rather than adhere to the MRO region generation guideline outlined in Section 3.3.
3.4. MVAR Dispatch/Modeling
Appendix E provides two examples of power flow modeling data for wind generating plants comprised of sixty 1.65 MW V82 wind turbines (WTG Type 1), and eighty-six 1.5 MW General Electric wind turbines (WTG Type 3) dispatched at 20% rated MW output. Additional information is provided to change this data for 60% and 100% dispatch. This PSS/E version 30 model serves as a good example for the modeling concepts explained below.
Model Building Manual - Wind Generation
November 2008 - 9 - Midwest Reliability Organization
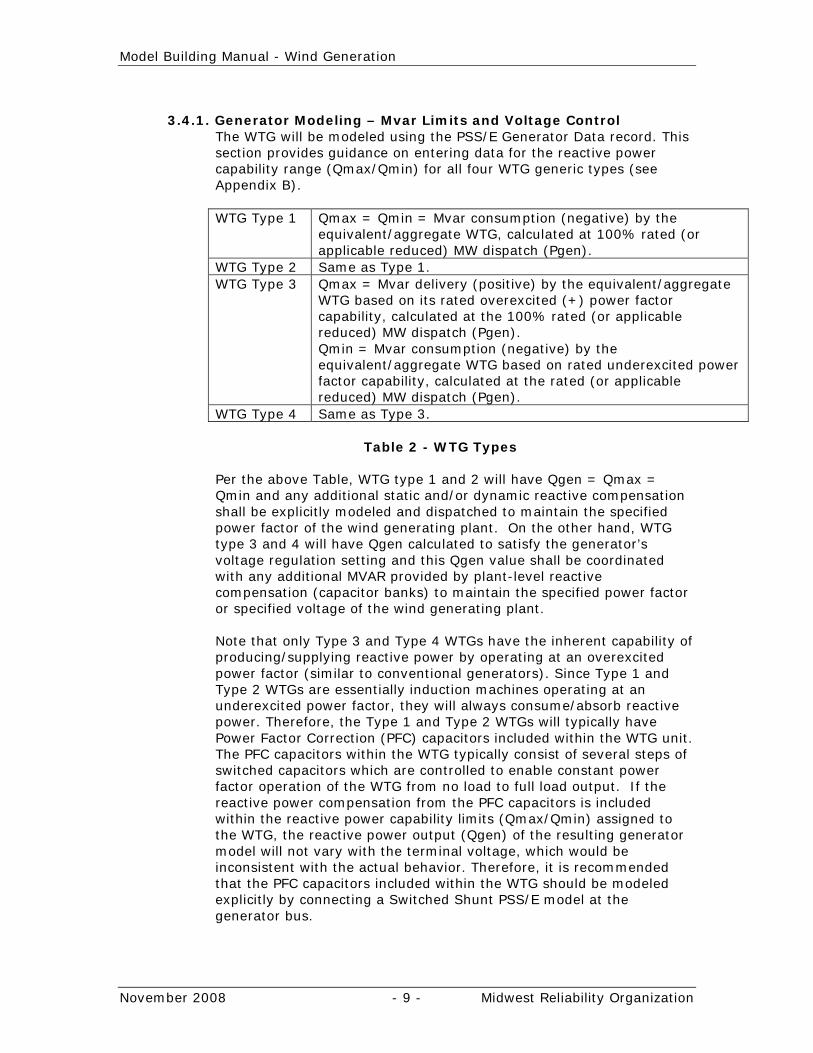
3.4.1. Generator Modeling – Mvar Limits and Voltage Control
The WTG will be modeled using the PSS/E Generator Data record. This section provides guidance on entering data for the reactive power capability range (Qmax/Qmin) for all four WTG generic types (see Appendix B). WTG Type 1 Qmax = Qmin = Mvar consumption (negative) by the
equivalent/aggregate WTG, calculated at 100% rated (or applicable reduced) MW dispatch (Pgen).
WTG Type 2 Same as Type 1. WTG Type 3 Qmax = Mvar delivery (positive) by the equivalent/aggregate
WTG based on its rated overexcited (+) power factor capability, calculated at the 100% rated (or applicable reduced) MW dispatch (Pgen). Qmin = Mvar consumption (negative) by the equivalent/aggregate WTG based on rated underexcited power factor capability, calculated at the rated (or applicable reduced) MW dispatch (Pgen).
WTG Type 4 Same as Type 3.
Table 2 - WTG Types
Per the above Table, WTG type 1 and 2 will have Qgen = Qmax = Qmin and any additional static and/or dynamic reactive compensation shall be explicitly modeled and dispatched to maintain the specified power factor of the wind generating plant. On the other hand, WTG type 3 and 4 will have Qgen calculated to satisfy the generator’s voltage regulation setting and this Qgen value shall be coordinated with any additional MVAR provided by plant-level reactive compensation (capacitor banks) to maintain the specified power factor or specified voltage of the wind generating plant. Note that only Type 3 and Type 4 WTGs have the inherent capability of producing/supplying reactive power by operating at an overexcited power factor (similar to conventional generators). Since Type 1 and Type 2 WTGs are essentially induction machines operating at an underexcited power factor, they will always consume/absorb reactive power. Therefore, the Type 1 and Type 2 WTGs will typically have Power Factor Correction (PFC) capacitors included within the WTG unit. The PFC capacitors within the WTG typically consist of several steps of switched capacitors which are controlled to enable constant power factor operation of the WTG from no load to full load output. If the reactive power compensation from the PFC capacitors is included within the reactive power capability limits (Qmax/Qmin) assigned to the WTG, the reactive power output (Qgen) of the resulting generator model will not vary with the terminal voltage, which would be inconsistent with the actual behavior. Therefore, it is recommended that the PFC capacitors included within the WTG should be modeled explicitly by connecting a Switched Shunt PSS/E model at the generator bus.
Model Building Manual - Wind Generation
November 2008 - 10 - Midwest Reliability Organization
Experience indicates that the WTGs are typically operated in a constant power factor mode, even though the overall wind generating plant may be operated in voltage control mode to regulate the transmission or collector bus voltage. Therefore, it is recommended that the WTG model use default values for the regulated voltage setpoint (VS = 1.0) and the regulated bus (IREG=0). For all wind generating plants having Type 1 and 2 WTGs, this modeling approach is expected to remain adequate. However, for future (or existing) wind generating plants using WTG Types 3 or 4 that may have the ability to be operated in voltage control mode, the modeling parameters VS and IREG may be suitably modified to reflect the actual voltage regulation scheme implemented in the WTG. Note: For Type 1 and 2 WTGs and for Type 3 and 4 WTGs operating in constant power factor mode, the Qmax/Qmin data for reduced MW dispatch can be obtained by proportionately reducing the Mvar capability of the WTG --- that is, constant power factor operation is assumed for all WTG types. For Type 3 and 4 WTGs operating in voltage control mode the Qmax/Qmin data for reduced MW dispatch should be set according to the WTG capability curve. For example, for the suggested MW dispatch at 35% of plant rating in seasonal spring/fall/winter peak models, the Qmax/Qmin values in the generator model for Type 1 and 2 WTGs and for Type 3 and 4 WTGs operating in constant power factor mode would also be 35% of the rated Qmax/Qmin capability (at 100% of plant rating). Note: PSS/E version 31 will allow identification of a machine as a wind generator in power flow. It will also have provision for a machine to be operated in power factor or voltage control mode. Auxiliary power flow data can be entered to automatically adjust Mvar absorption of a WECC Type 1 or 2 machine based on power output (Pgen).
3.4.2. Capacitor Bank Modeling
It is recommended that all capacitor banks within the wind generating plant be explicitly modeled. Typically, this will include the PFC capacitors available within the WTG as well as the mid-voltage (MV) capacitors connected to the collector system bus/feeder. PFC Capacitors: Since these capacitors are switched in/out to operate the WTG in constant power factor control mode, no voltage regulation parameters will be specified in the switched shunt modeling data. Therefore, default values may be used for all model parameters except for MODSW and BINIT. The recommended parameter values are: • MODSW = 0 for Fixed control mode • BINIT = Mvar dispatch based on MW output of WTG and power
factor correction setpoint.
Model Building Manual - Wind Generation
November 2008 - 11 - Midwest Reliability Organization
The number of switched shunt steps and block sizes modeled (Ni, Bi) is up to the user’s discretion. Collector System (MV) Capacitors: The modeling of these capacitors depends on whether the wind generating plant is required to operate in power factor control mode or voltage control mode. Generally, the interconnection agreements of many older wind generating plants (to which FERC Order 661-A does not apply) require them to maintain constant power factor at the Point of Interconnection (POI). For such facilities, the collector system capacitor modeling would be similar to that of the PFC capacitors. For those wind generating plants that are required to operate in accordance with a specified voltage schedule at the POI, the modeling considerations are discussed in the next section.
3.4.3. Wind Generating Plant – Volt-Var Control
In general, wind plants should have a strategy to control voltage at the Point of Interconnection (POI) [FERC Order 661-A]. In practice, this can be achieved in many different ways depending on the number and type of facilities provided. The WTG may or may not have voltage control capability. Where able, there typically is a voltage control hierarchy providing effective control between the faster individual turbine controls and/or dynamic var support device controls (applicable to section 4), reacting to grid disturbances, and the slower plant supervisory control maintaining steady state voltage targets. This may be a complex scheme to provide overall wind generating plant voltage control --- involving the WTGs, supplementary capacitor banks in the collector system, supplementary dynamic var facilities (SVC, STATCOM, etc) in the collector system and wind generating plant step-up substation transformer equipped with on-load tap changers. The following are a few suggested ways of modeling common voltage control schemes: • If the wind generating plant uses switched shunt capacitors (at the
collector station or in the collector feeder system) to regulate the transmission bus POI voltage within the range defined by VSWHI and VSWLO parameters, each shunt capacitor has to be modeled explicitly and switched in the “discrete” control mode (MODSW = 1).
• Wind generating plants using dynamic var devices such as SVCs, STATCOMs, etc. in addition to (or in lieu of) switched shunt capacitors can be modeled on the bus to which the device is connected along with the designated regulated bus and voltage setpoint or regulation range.
• If the WTGs have reactive power capabilities (that is, Type 3 or 4 WTG), the bus number of the voltage regulated bus has to be specified in the generator model.
Depending on the voltage control facilities installed, one or more of the above schemes can be used. The data submitter should model the
Model Building Manual - Wind Generation
November 2008 - 12 - Midwest Reliability Organization
voltage regulation for each facility such that it accurately reflects the actual voltage control scheme used within the wind generating plant.
3.4.4. Rules of Thumb (credit WECC) Based on the above observations, the following rules should be considered to model WTG reactive power capability and power factor correction capacitors:
• When Type 1 and Type 2 WTGs are used, reactive power consumption can be assumed to be ½ of the power output. A capacitor should be shown at the WTG terminals to compensate power factor to unity at nominal voltage. For example, for a 100 MW wind power plant (WPP) at full output, both Qmin and Qmax would be set to -50 Mvar, and add a 50 Mvar shunt capacitor at the WTG terminals. Plant level reactive compensation may still be installed to meet interconnection requirements.
• If Type 3 or Type 4 WTGs are used, but they do not participate in steady-state voltage control, the equivalent generator should be set at a fixed power factor, typically unity. For example, Qmin and Qmax would be set to 0, at any active power level. No shunt capacitor would be needed at the WTG terminals. However, plant-level reactive compensation may still be installed to meet interconnection requirements.
• If Type 3 or Type 4 WTGs are used, and they actively participate in steady-state voltage control with the assistance of an external controller, the equivalent generator should have a reactive capability approximately equal to the WTG nominal range. The regulated bus is typically the POI, the collector system station, or some point in between. External reactive power compensation is not typically installed in these cases. For instance, if a 100 MW WPP employs WTGs with power factor range +/-0.95 at full output, Qmin should be set to -33 Mvar and Qmax should be set to +33 Mvar, assuming full WPP output. If a wind power plant is modeled at power output below rated, the reactive limits should be set according to the WTG capability curve.
3.5. Power Flow Modeling Conventions
A naming convention is recommended in order to provide easy recognition of wind resources in the model and to facilitate adjustment of regional wind dispatch. To distinguish the type of generation resource, it is recommended that the bus name for an existing or committed future wind generator bus end in ‘W’. The recommended valid unit identifiers (ID) for wind generators are W and W1 through W9. Since wind plant modeling generally reflects aggregate representations for many units, 9 ID’s per bus is expected to be sufficient.
Model Building Manual - Wind Generation
November 2008 - 13 - Midwest Reliability Organization
4. Dynamic Model
Based on the variety of wind turbines on the market and the speed at which they are being installed, there are challenges facing the industry in developing reliable, accurate and generic type dynamic models to represent these machines in regional stability studies. Much activity is underway in the industry to develop acceptable wind generation dynamic models for broad distribution, such as the MRO models. Appendix B describes the WTG generic model types recommended by IEEE and WECC. For information purpose, brief descriptions of some typical power control schemes employed with WTGs are also provided in Appendix B.
4.1. Choosing the Right Dynamic Model
The types of PSS/E dynamic simulation models currently available for wind generation include:
• Older standard PSS/E induction generator models such as the CIMTR1 and CIMTR3
• More detailed industry developed generic models, herein referred to as IEEE/WECC models, and
• Fully detailed manufacturer user-written models. Currently, the IEEE/WECC models are under development with the objective to deliver a set of generic dynamic models for each wind turbine type which can be used as standard library models in power system simulation programs such as PSLF and PSS/E. This manual will be updated as new models become available.
4.1.1. Standard Induction Generator The following standard model types are available for dynamic simulation of induction wind generators using PSS/E. They are generic models and hence do not provide detailed representation of the machines. However, they were the best model available prior to 2007 for shared use in regional models. • CIMTR1 - Single-cage or double-cage Induction generator with rotor
flux transients • CIMTR3 - Single-cage or double-cage Induction generator with rotor
flux transients Compared to CIMTR1, the CIMTR3 has an extra state and is more accurate for large frequency deviation, which is required for long-term simulation.
4.1.2. IEEE/WECC Generic Class Type
Recognizing that adequate dynamic models were not available for broad distribution, a large number of industry experts lead by the IEEE Dynamic Performance of Wind Power Generation Working Group
Model Building Manual - Wind Generation
November 2008 - 14 - Midwest Reliability Organization
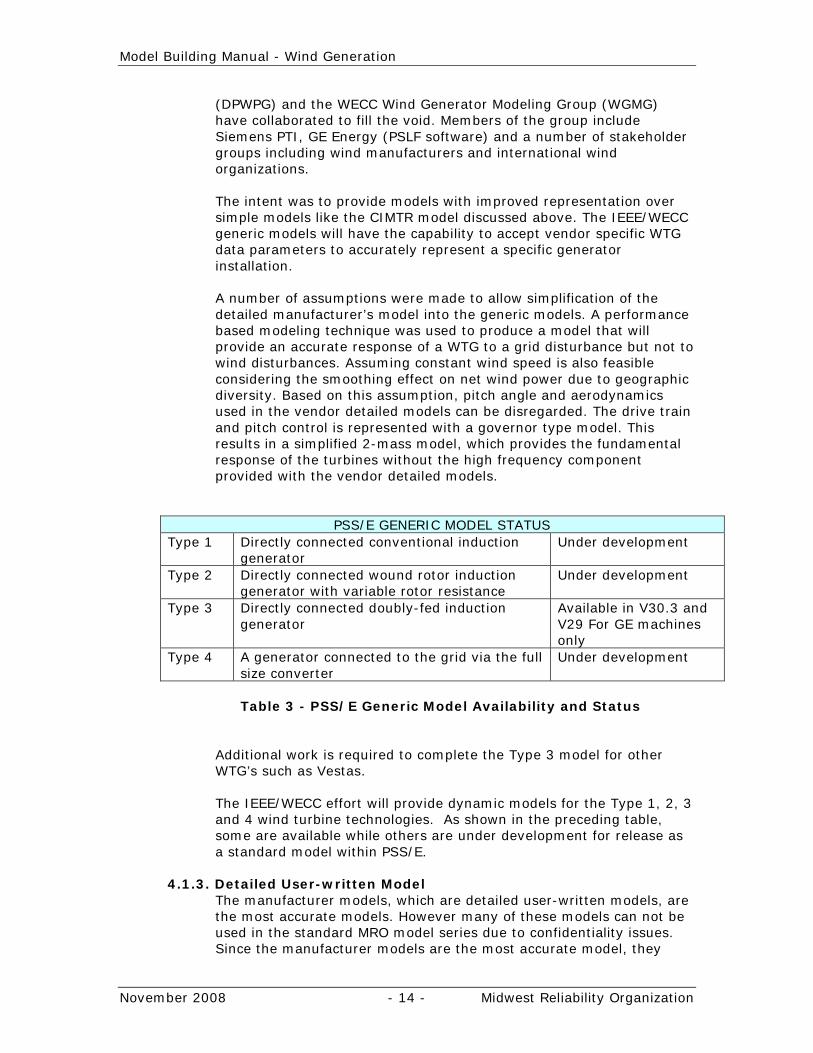
(DPWPG) and the WECC Wind Generator Modeling Group (WGMG) have collaborated to fill the void. Members of the group include Siemens PTI, GE Energy (PSLF software) and a number of stakeholder groups including wind manufacturers and international wind organizations. The intent was to provide models with improved representation over simple models like the CIMTR model discussed above. The IEEE/WECC generic models will have the capability to accept vendor specific WTG data parameters to accurately represent a specific generator installation. A number of assumptions were made to allow simplification of the detailed manufacturer’s model into the generic models. A performance based modeling technique was used to produce a model that will provide an accurate response of a WTG to a grid disturbance but not to wind disturbances. Assuming constant wind speed is also feasible considering the smoothing effect on net wind power due to geographic diversity. Based on this assumption, pitch angle and aerodynamics used in the vendor detailed models can be disregarded. The drive train and pitch control is represented with a governor type model. This results in a simplified 2-mass model, which provides the fundamental response of the turbines without the high frequency component provided with the vendor detailed models.
PSS/E GENERIC MODEL STATUS Type 1 Directly connected conventional induction
generator Under development
Type 2 Directly connected wound rotor induction generator with variable rotor resistance
Under development
Type 3 Directly connected doubly-fed induction generator
Available in V30.3 and V29 For GE machines only
Type 4 A generator connected to the grid via the full size converter
Under development
Table 3 - PSS/E Generic Model Availability and Status
Additional work is required to complete the Type 3 model for other WTG’s such as Vestas. The IEEE/WECC effort will provide dynamic models for the Type 1, 2, 3 and 4 wind turbine technologies. As shown in the preceding table, some are available while others are under development for release as a standard model within PSS/E.
4.1.3. Detailed User-written Model
The manufacturer models, which are detailed user-written models, are the most accurate models. However many of these models can not be used in the standard MRO model series due to confidentiality issues. Since the manufacturer models are the most accurate model, they
Model Building Manual - Wind Generation
November 2008 - 15 - Midwest Reliability Organization
should be used for local Interconnection Assessment studies. Some user written WTG models are currently available from the PTI website without the need for a non-disclosure agreement. Sample Version 30 PSS/E dynamics data for two wind farms are provided in Appendix F. The first is for a wind farm comprised of sixty 1.65 MW Vestas induction machines (Type 1) and the second is for a wind farm comprised of eighty-six GE 1.5 MW machines (Type 3). The different types of wind turbines are discussed in Appendix B.
5. Short Circuit Model
Wind turbine short circuit models are currently being developed through the IEEE and are briefly discussed below. This section of the document will be expanded as more details on the short circuit models become available. Short circuit study representation of wind turbine generators is determined by the specific generator technology. Generally the turbine representation must include all parts that will contribute to the short circuit current for a fault in the vicinity of a wind turbine generator.
• Fixed speed induction generators (wind turbines Type 1 and 2), the machine itself can be modeled to represent a wind turbine generator.
• Variable speed doubly fed induction generator (type 3), the machine must be
modeled and the smaller partial load converters can generally be neglected.
• Variable speed induction generator with full load converter (type 4), the wind turbine generator is decoupled from the AC network therefore only the converter can be modeled to simulate the short circuit behavior of the wind turbine generator.
Model Building Manual - Wind Generation: Appendix A
November 2008 - 16 - Midwest Reliability Organization
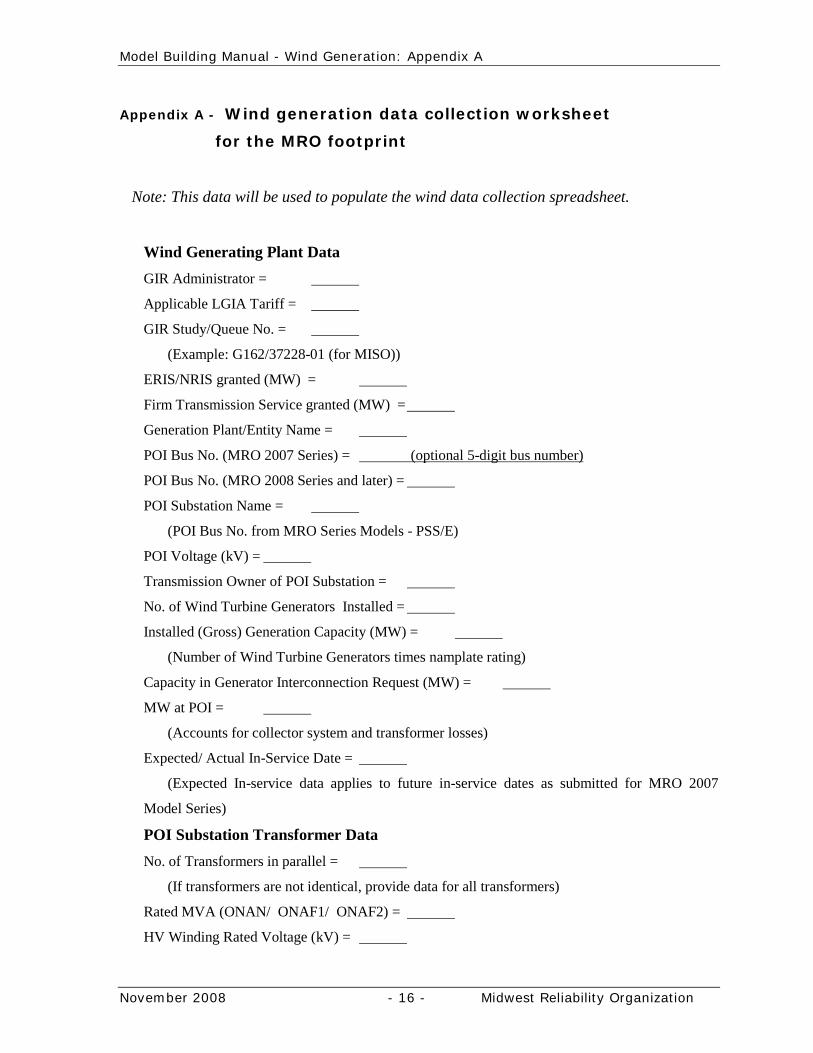
Appendix A - Wind generation data collection worksheet
for the MRO footprint
Note: This data will be used to populate the wind data collection spreadsheet.
Wind Generating Plant Data GIR Administrator =
Applicable LGIA Tariff =
GIR Study/Queue No. =
(Example: G162/37228-01 (for MISO))
ERIS/NRIS granted (MW) =
Firm Transmission Service granted (MW) =
Generation Plant/Entity Name =
POI Bus No. (MRO 2007 Series) = (optional 5-digit bus number)
POI Bus No. (MRO 2008 Series and later) =
POI Substation Name =
(POI Bus No. from MRO Series Models - PSS/E)
POI Voltage (kV) =
Transmission Owner of POI Substation =
No. of Wind Turbine Generators Installed =
Installed (Gross) Generation Capacity (MW) =
(Number of Wind Turbine Generators times namplate rating)
Capacity in Generator Interconnection Request (MW) =
MW at POI =
(Accounts for collector system and transformer losses)
Expected/ Actual In-Service Date =
(Expected In-service data applies to future in-service dates as submitted for MRO 2007
Model Series)
POI Substation Transformer Data No. of Transformers in parallel =
(If transformers are not identical, provide data for all transformers)
Rated MVA (ONAN/ ONAF1/ ONAF2) =
HV Winding Rated Voltage (kV) =
Model Building Manual - Wind Generation: Appendix A
November 2008 - 17 - Midwest Reliability Organization
LV Winding Rated Voltage (kV) =
X (pu) on Rated MVA (ONAN) Base =
R (pu) on Rated MVA (ONAN) Base =
Plant-level Reactive Compensation Collector Bus Voltage (kV) =
Collector Bus No. =
(From MRO Series Models - PSS/E)
Reactive Compensation Device =
(Shunt Caps/ D-VAR/ SVC)
Mvar Range – Qmin (cap bank steps) =
Mvar Range – Qmax (cap bank steps) =
Equivalent Collector Data Feeder No. =
(If multiple projects share a POI, provide the breaker feeder number)
X (pu) on 100 MVA base =
R (pu) on 100 MVA base =
Wind Turbine Generator (WTG) Unit Data Make/ Manufacturer =
Manufacturer Model No. =
WTG Technology TYPE =
1 = conventional induction generator
2 = wound rotor induction generator with variable rotor resistance
3 = doubly fed induction generator
4 = full converter
PSS/E Dynamic Model Name =
Rated Voltage (Volts) =
Rated MW =
Lead PF =
(underexcited /consuming vars - all PFC's OFF)
Model Building Manual - Wind Generation: Appendix A
November 2008 - 18 - Midwest Reliability Organization
Lag PF =
(overexcited/delivering vars - all PFC's ON)
Built-in PFC kvars =
(Unit is kvars per turbine, not Mvars per turbine)
Rated MVA =
Minimum Ambient Operating Limit =
(Wind turbines may not operate above or below these ambient limits)
WTG Unit Step-up Transformer Data Rated MVA (ONAN) =
HV Winding Rated Voltage (kV) =
LV Winding Rated Voltage (Volts) =
X (pu) on Rated MVA Base =
R (pu) on Rated MVA Base =
Supplemental Reference Data GIR Studies Link =
Location - State/ Province =
Location - County =
Submitter's name/email =
Owner 1 (%)=
(Owner of WTG (percent ownership, if multiple owners))
Owner 2 (%)=
(Owner 2, if multiple owners)
Comments =
Model Building Manual - Wind Generation: Appendix B
November 2008 - 19 - Midwest Reliability Organization
Appendix B - Wind Turbine Generator (WTG) – Technology Types
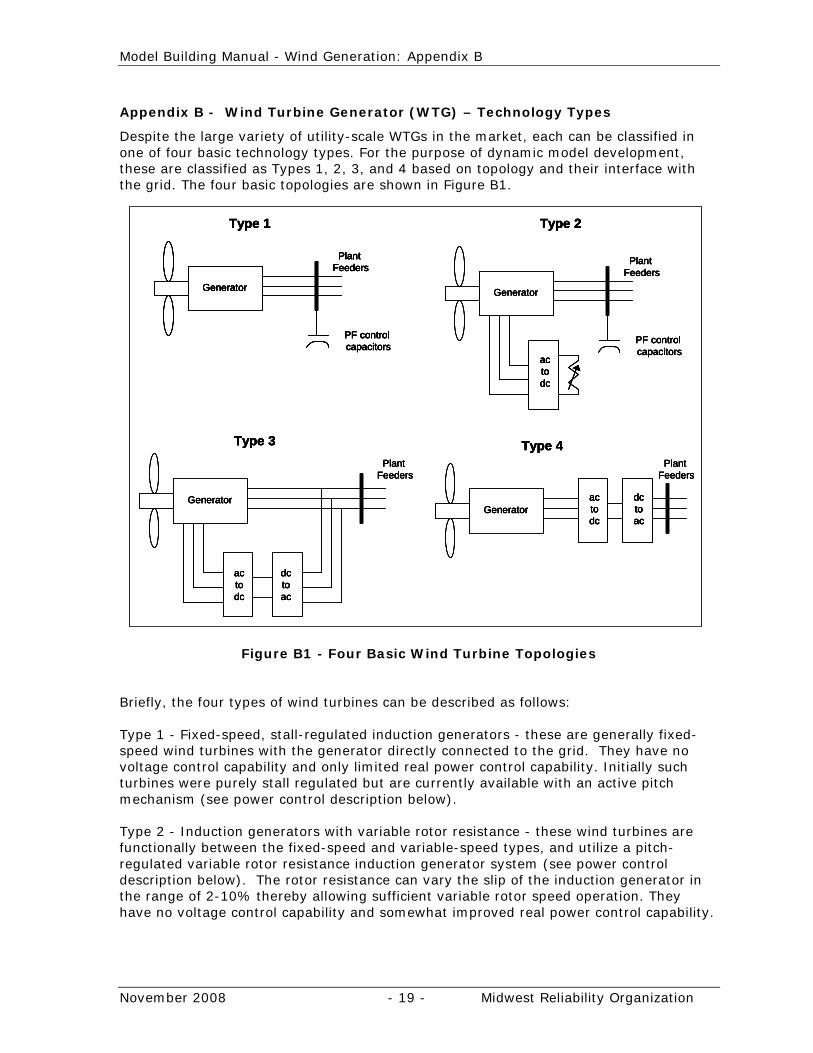
Despite the large variety of utility-scale WTGs in the market, each can be classified in one of four basic technology types. For the purpose of dynamic model development, these are classified as Types 1, 2, 3, and 4 based on topology and their interface with the grid. The four basic topologies are shown in Figure B1.
Figure B1 - Four Basic Wind Turbine Topologies Briefly, the four types of wind turbines can be described as follows: Type 1 - Fixed-speed, stall-regulated induction generators - these are generally fixed-speed wind turbines with the generator directly connected to the grid. They have no voltage control capability and only limited real power control capability. Initially such turbines were purely stall regulated but are currently available with an active pitch mechanism (see power control description below). Type 2 - Induction generators with variable rotor resistance - these wind turbines are functionally between the fixed-speed and variable-speed types, and utilize a pitch-regulated variable rotor resistance induction generator system (see power control description below). The rotor resistance can vary the slip of the induction generator in the range of 2-10% thereby allowing sufficient variable rotor speed operation. They have no voltage control capability and somewhat improved real power control capability.
Generator
Plant Feeders
PF control capacitors
Type 1
Generator
Plant Feeders
PF control capacitors
actodc
Type 2
Generator
Plant Feeders
actodc
Type 3
dctoac
Type 4
Generator
Plant Feeders
actodc
dctoac
Generator
Plant Feeders
PF control capacitors
Type 1
Generator
Plant Feeders
PF control capacitors
actodc
Type 2
Generator
Plant Feeders
actodc
Type 3
dctoac
Type 4
Generator
Plant Feeders
actodc
dctoac
Generator
Plant Feeders
PF control capacitors
Type 1
Generator
Plant Feeders
PF control capacitors
Generator
Plant Feeders
PF control capacitors
Type 1
Generator
Plant Feeders
PF control capacitors
actodc
Type 2
Generator
Plant Feeders
PF control capacitors
actodc
actodc
Type 2
Generator
Plant Feeders
actodc
Type 3
dctoac
Generator
Plant Feeders
actodc
Type 3
dctoac
Type 4
Generator
Plant Feeders
actodc
dctoac
Type 4
Generator
Plant Feeders
actodc
actodc
dctoac
dctoac

Model Building Manual - Wind Generation: Appendix B
November 2008 - 20 - Midwest Reliability Organization
Type 3 - Doubly-fed asynchronous generators with rotor-side converter (Doubly-fed induction generator (DFIG)). With this design a slip-ringed variable speed induction machine is used as a generator with a back-to-back voltage sourced converter feeding the rotor winding and connected between the rotor slip rings and the grid. These machines are capable of voltage control and have high speed real and reactive power control capability. Type 4 - Variable speed generators with full-power converter interface - As the name suggests, this wind turbine generator concept typically consists of a conventional synchronous or induction generator which is connected to the grid through a full converter. The full converter decouples the generator speed from the power system frequency and allows for a wide range of variable speed operation. This concept is different from the others in that the rotor is directly coupled to the generator hence a gearbox is not required. These machines are capable of voltage control and have high speed real and reactive power control capability.
Power Control Description Briefly, WTGs are typically designed to yield maximum power output at wind speeds between 15 and 25 m/s (33.5 and 55.9 miles/hour, respectively). Since higher wind speeds are rare, it is not economical to design the turbines to maximize their output at higher wind speeds. In case of higher wind speeds, in an attempt to prevent damage to the wind turbine, the excess energy in the wind is not harnessed. The present practice is to design all wind turbines with some form of mechanical (slower) and/or electrical (faster) power control. Mechanical wind turbine power control is generally achieved in one of three ways: blade pitch angle control; passive stall control and active stall control. Blade Pitch Angle Control: On a blade pitch angle controlled wind turbine the controller is designed to check the power output of the turbine several times per second. When the power output becomes too high an error signal is sent to the blade pitch mechanism which pitches (turns about the vertical axis) the rotor blades slightly out of the wind. The blades are turned back into the wind whenever the wind drops again. Passive Stall Control: Wind turbines equipped with passive stall control have their blades bolted onto the hub at a fixed angle. The geometry of the blades is designed to ensure that when the wind becomes too high, turbulence is created on the side of the rotor which is not facing the wind. This turbulence or “stall” effect prevents the lifting force of the rotor blade from acting on the rotor. Therefore as the wind speed in the area increases, the angle of attack of the rotor blade will increase, until at some point it starts to stall. Active Stall Control: Active stall is a relatively new technology which combines the advantages of pitch control and passive stall control. It is similar to pitch control in that the wind turbine blades are equipped with a pitch control mechanism. The pitch angle is adjusted slightly and very slowly at higher wind speeds in order to always obtain the correct power level. In order to get fairly large torques at low wind speeds the machines are controlled to pitch their blades. When the machine reaches its rated power and the generator is about to be overloaded, the machines are controlled to pitch their blades in the opposite direction in order to make the blades go into a deeper stall. With active stall the power output can be controlled more accurately than with passive stall. This

Model Building Manual - Wind Generation: Appendix B
November 2008 - 21 - Midwest Reliability Organization
active stall control system can also adjust for variations in air density and pitches the blades to minimize the effects of dust and insect accumulation on the blades. The power electronics of a type 3 or type 4 WTG can provide extremely fast power control (real and reactive power). Detailed technical descriptions of each WTG type and power control technology employed is beyond the scope of this document, however extensive descriptions and functional diagrams are available in the Bibliography and information and workshops produced by efforts underway in the the IEEE, Western Electricity Coordinating Council (WECC), Utility Wind Integration Group (UWIG) and International Council on Large Electric Systems (CIGRE).
Model Building Manual - Wind Generation: Appendix C
November 2008 - 22 - Midwest Reliability Organization
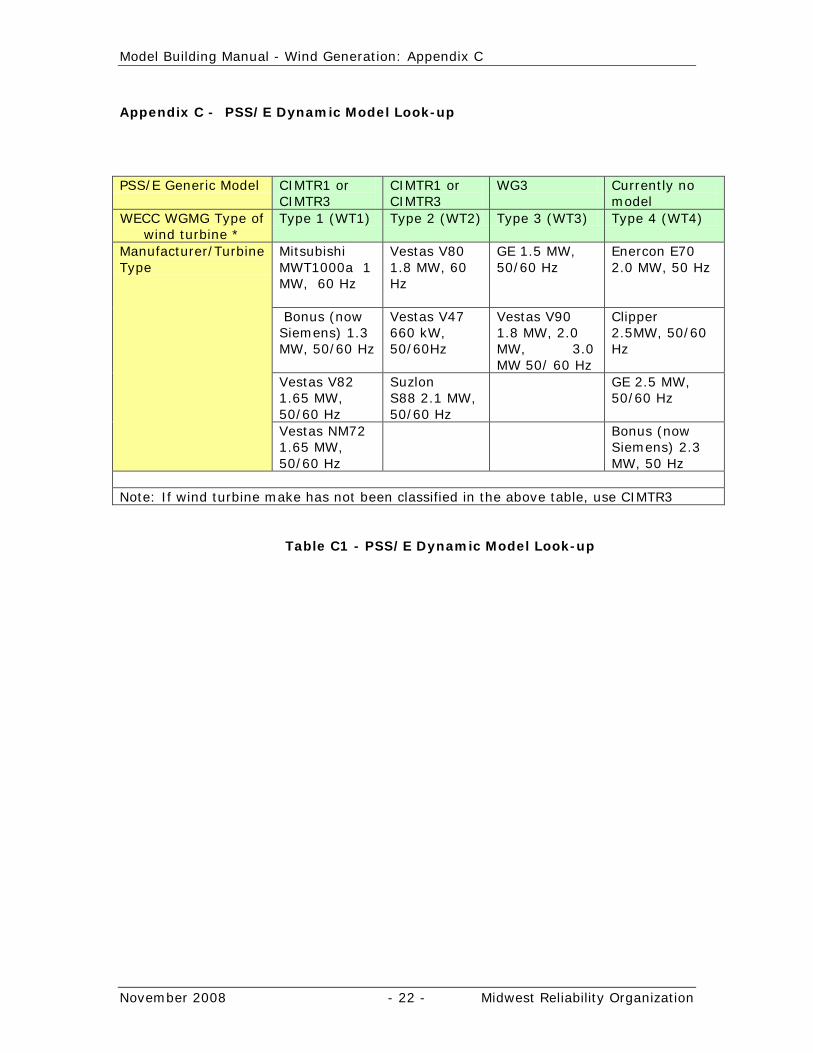
Appendix C - PSS/E Dynamic Model Look-up
PSS/E Generic Model CIMTR1 or CIMTR3
CIMTR1 or CIMTR3
WG3 Currently no model
WECC WGMG Type of wind turbine *
Type 1 (WT1) Type 2 (WT2) Type 3 (WT3) Type 4 (WT4)
Manufacturer/Turbine Type
Mitsubishi MWT1000a 1 MW, 60 Hz
Vestas V80 1.8 MW, 60 Hz
GE 1.5 MW, 50/60 Hz
Enercon E70 2.0 MW, 50 Hz
Bonus (now Siemens) 1.3 MW, 50/60 Hz
Vestas V47 660 kW, 50/60Hz
Vestas V90 1.8 MW, 2.0 MW, 3.0 MW 50/ 60 Hz
Clipper 2.5MW, 50/60 Hz
Vestas V82 1.65 MW, 50/60 Hz
Suzlon S88 2.1 MW, 50/60 Hz
GE 2.5 MW, 50/60 Hz
Vestas NM72 1.65 MW, 50/60 Hz
Bonus (now Siemens) 2.3 MW, 50 Hz
Note: If wind turbine make has not been classified in the above table, use CIMTR3
Table C1 - PSS/E Dynamic Model Look-up
Model Building Manual - Wind Generation: Appendix D
November 2008 - 23 - Midwest Reliability Organization
Appendix D - MRO Suggested Seasonal Dispatch
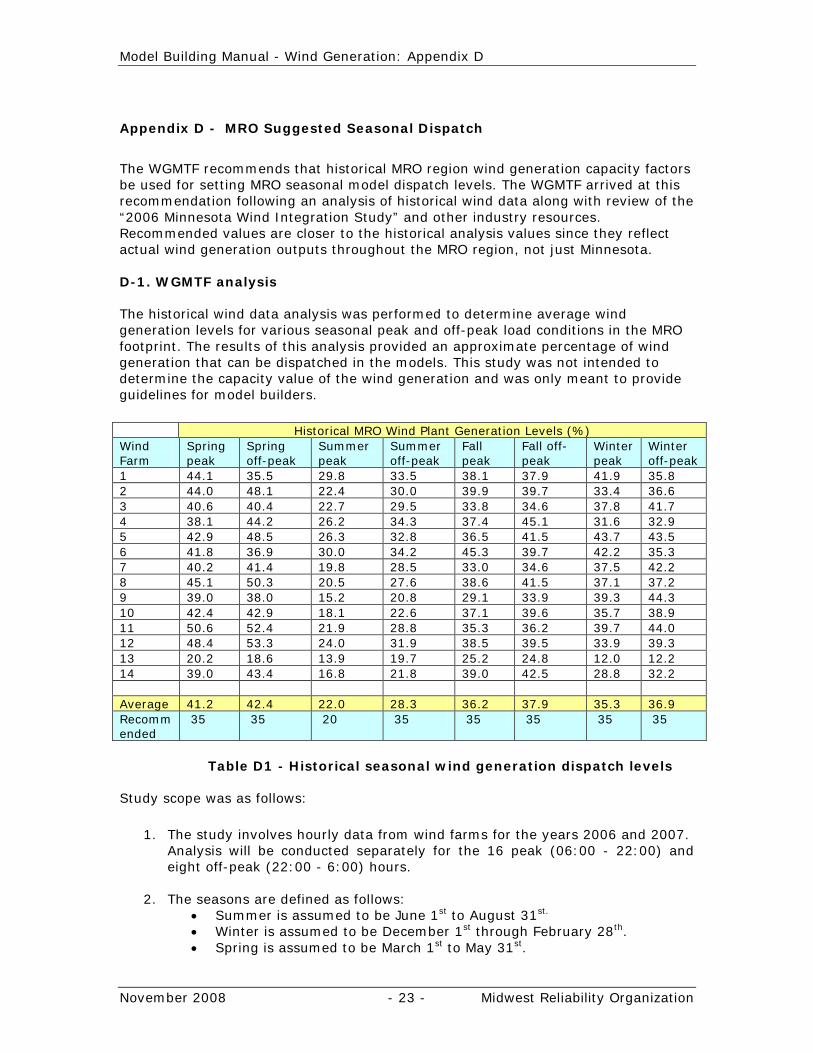
The WGMTF recommends that historical MRO region wind generation capacity factors be used for setting MRO seasonal model dispatch levels. The WGMTF arrived at this recommendation following an analysis of historical wind data along with review of the “2006 Minnesota Wind Integration Study” and other industry resources. Recommended values are closer to the historical analysis values since they reflect actual wind generation outputs throughout the MRO region, not just Minnesota. D-1. WGMTF analysis
The historical wind data analysis was performed to determine average wind generation levels for various seasonal peak and off-peak load conditions in the MRO footprint. The results of this analysis provided an approximate percentage of wind generation that can be dispatched in the models. This study was not intended to determine the capacity value of the wind generation and was only meant to provide guidelines for model builders.
Historical MRO Wind Plant Generation Levels (%)
Wind Farm
Spring peak
Spring off-peak
Summer peak
Summer off-peak
Fall peak
Fall off-peak
Winter peak
Winter off-peak
1 44.1 35.5 29.8 33.5 38.1 37.9 41.9 35.8 2 44.0 48.1 22.4 30.0 39.9 39.7 33.4 36.6 3 40.6 40.4 22.7 29.5 33.8 34.6 37.8 41.7 4 38.1 44.2 26.2 34.3 37.4 45.1 31.6 32.9 5 42.9 48.5 26.3 32.8 36.5 41.5 43.7 43.5 6 41.8 36.9 30.0 34.2 45.3 39.7 42.2 35.3 7 40.2 41.4 19.8 28.5 33.0 34.6 37.5 42.2 8 45.1 50.3 20.5 27.6 38.6 41.5 37.1 37.2 9 39.0 38.0 15.2 20.8 29.1 33.9 39.3 44.3 10 42.4 42.9 18.1 22.6 37.1 39.6 35.7 38.9 11 50.6 52.4 21.9 28.8 35.3 36.2 39.7 44.0 12 48.4 53.3 24.0 31.9 38.5 39.5 33.9 39.3 13 20.2 18.6 13.9 19.7 25.2 24.8 12.0 12.2 14 39.0 43.4 16.8 21.8 39.0 42.5 28.8 32.2 Average 41.2 42.4 22.0 28.3 36.2 37.9 35.3 36.9 Recommended
35 35 20 35 35 35 35 35
Table D1 - Historical seasonal wind generation dispatch levels
Study scope was as follows:
1. The study involves hourly data from wind farms for the years 2006 and 2007.
Analysis will be conducted separately for the 16 peak (06:00 - 22:00) and eight off-peak (22:00 - 6:00) hours.
2. The seasons are defined as follows: • Summer is assumed to be June 1st to August 31st. • Winter is assumed to be December 1st through February 28th. • Spring is assumed to be March 1st to May 31st.
Model Building Manual - Wind Generation: Appendix D
November 2008 - 24 - Midwest Reliability Organization
• Fall is assumed to be September 1st to November 30th.
3 Data was gathered from wind farms located in various regions of the MRO footprint including Manitoba, North Dakota, SW Minnesota, Southeast Minnesota and Wisconsin.
4 The mean value of the on-peak and off peak hourly data over each season
will be recommended as the basis for the MRO base case models as follows: • Peak load models use on-peak hour mean value of wind • Off-peak load models use off-peak hour mean value of wind
5 Wind farms that were in-service throughout the two years (2006 and 2007) were used for the study.
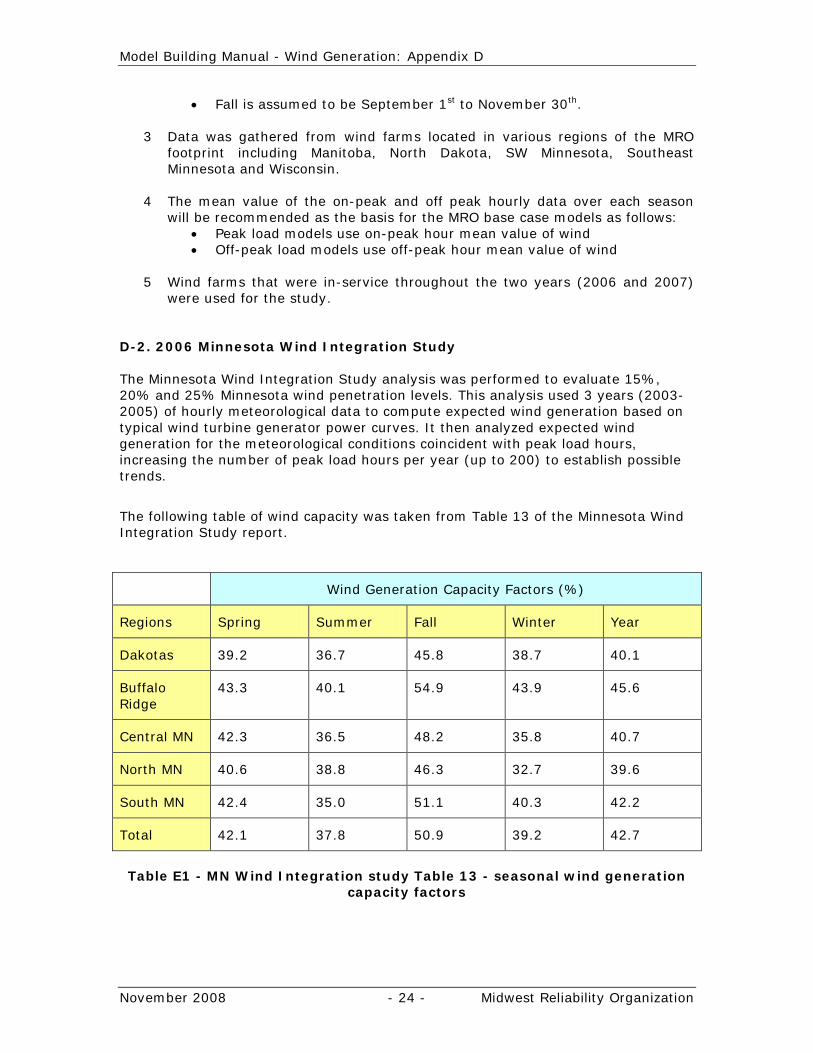
D-2. 2006 Minnesota Wind Integration Study The Minnesota Wind Integration Study analysis was performed to evaluate 15%, 20% and 25% Minnesota wind penetration levels. This analysis used 3 years (2003-2005) of hourly meteorological data to compute expected wind generation based on typical wind turbine generator power curves. It then analyzed expected wind generation for the meteorological conditions coincident with peak load hours, increasing the number of peak load hours per year (up to 200) to establish possible trends.
The following table of wind capacity was taken from Table 13 of the Minnesota Wind Integration Study report.
Wind Generation Capacity Factors (%)
Regions Spring Summer Fall Winter Year
Dakotas 39.2 36.7 45.8 38.7 40.1
Buffalo Ridge
43.3 40.1 54.9 43.9 45.6
Central MN 42.3 36.5 48.2 35.8 40.7
North MN 40.6 38.8 46.3 32.7 39.6
South MN 42.4 35.0 51.1 40.3 42.2
Total 42.1 37.8 50.9 39.2 42.7
Table E1 - MN Wind Integration study Table 13 - seasonal wind generation
capacity factors
Model Building Manual - Wind Generation: Appendix E
November 2008 - 25 - Midwest Reliability Organization
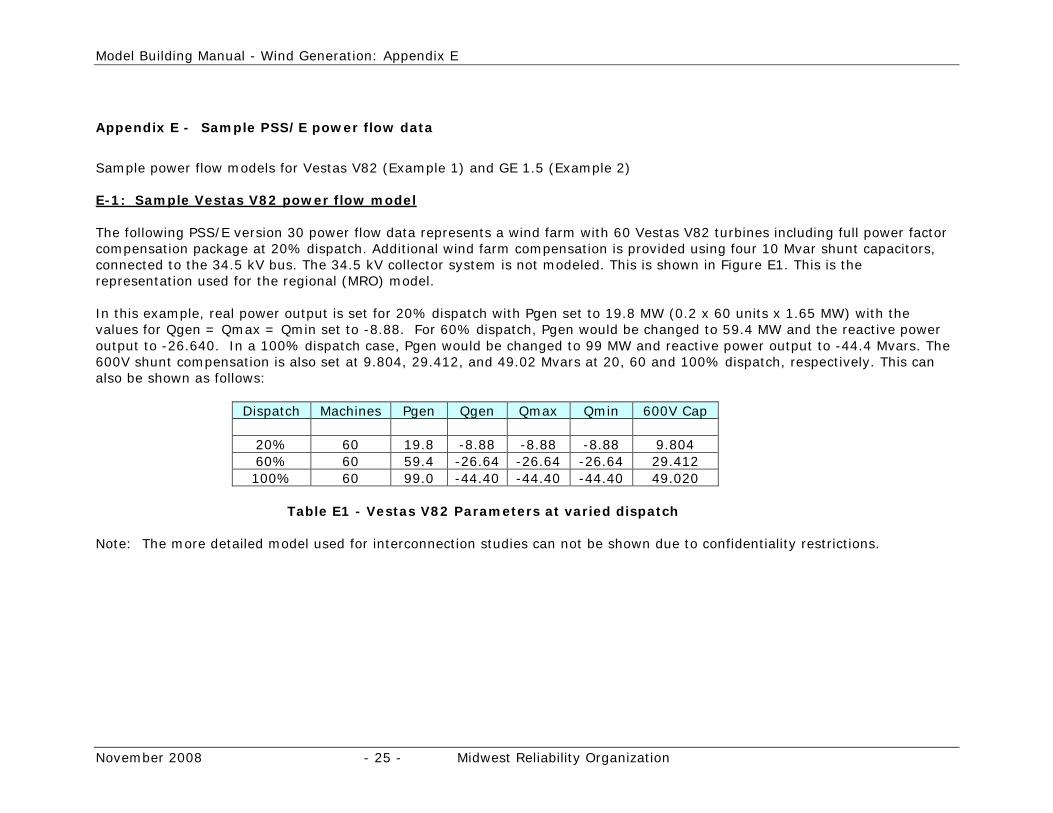
Appendix E - Sample PSS/E power flow data
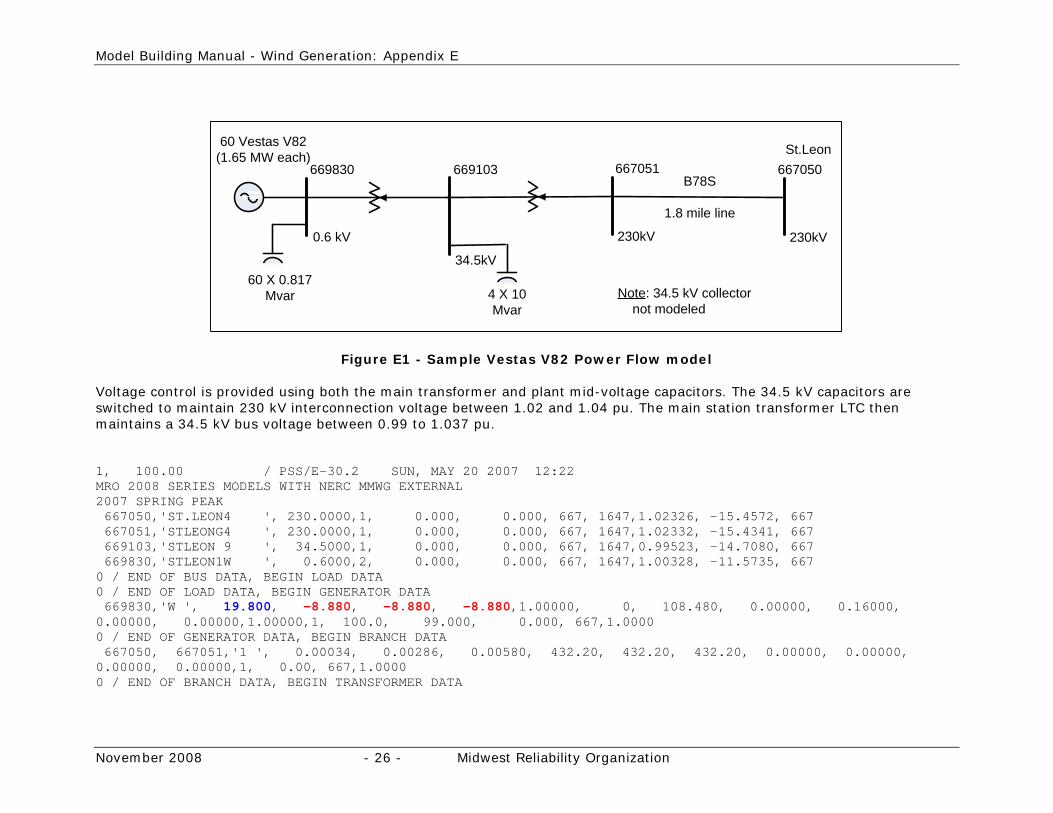
Sample power flow models for Vestas V82 (Example 1) and GE 1.5 (Example 2) E-1: Sample Vestas V82 power flow model The following PSS/E version 30 power flow data represents a wind farm with 60 Vestas V82 turbines including full power factor compensation package at 20% dispatch. Additional wind farm compensation is provided using four 10 Mvar shunt capacitors, connected to the 34.5 kV bus. The 34.5 kV collector system is not modeled. This is shown in Figure E1. This is the representation used for the regional (MRO) model. In this example, real power output is set for 20% dispatch with Pgen set to 19.8 MW (0.2 x 60 units x 1.65 MW) with the values for Qgen = Qmax = Qmin set to -8.88. For 60% dispatch, Pgen would be changed to 59.4 MW and the reactive power output to -26.640. In a 100% dispatch case, Pgen would be changed to 99 MW and reactive power output to -44.4 Mvars. The 600V shunt compensation is also set at 9.804, 29.412, and 49.02 Mvars at 20, 60 and 100% dispatch, respectively. This can also be shown as follows:
Dispatch Machines Pgen Qgen Qmax Qmin 600V Cap
20% 60 19.8 -8.88 -8.88 -8.88 9.804 60% 60 59.4 -26.64 -26.64 -26.64 29.412 100% 60 99.0 -44.40 -44.40 -44.40 49.020
Table E1 - Vestas V82 Parameters at varied dispatch Note: The more detailed model used for interconnection studies can not be shown due to confidentiality restrictions.
Model Building Manual - Wind Generation: Appendix E
November 2008 - 26 - Midwest Reliability Organization
60 Vestas V82 (1.65 MW each)
B78S
1.8 mile line
St.Leon
0.6 kV 230kV
34.5kV
4 X 10 Mvar
60 X 0.817 Mvar
230kV
669830 669103 667051 667050
Note: 34.5 kV collector not modeled
Figure E1 - Sample Vestas V82 Power Flow model Voltage control is provided using both the main transformer and plant mid-voltage capacitors. The 34.5 kV capacitors are switched to maintain 230 kV interconnection voltage between 1.02 and 1.04 pu. The main station transformer LTC then maintains a 34.5 kV bus voltage between 0.99 to 1.037 pu. 1, 100.00 / PSS/E-30.2 SUN, MAY 20 2007 12:22 MRO 2008 SERIES MODELS WITH NERC MMWG EXTERNAL 2007 SPRING PEAK 667050,'ST.LEON4 ', 230.0000,1, 0.000, 0.000, 667, 1647,1.02326, -15.4572, 667 667051,'STLEONG4 ', 230.0000,1, 0.000, 0.000, 667, 1647,1.02332, -15.4341, 667 669103,'STLEON 9 ', 34.5000,1, 0.000, 0.000, 667, 1647,0.99523, -14.7080, 667 669830,'STLEON1W ', 0.6000,2, 0.000, 0.000, 667, 1647,1.00328, -11.5735, 667 0 / END OF BUS DATA, BEGIN LOAD DATA 0 / END OF LOAD DATA, BEGIN GENERATOR DATA 669830,'W ', 19.800, -8.880, -8.880, -8.880,1.00000, 0, 108.480, 0.00000, 0.16000, 0.00000, 0.00000,1.00000,1, 100.0, 99.000, 0.000, 667,1.0000 0 / END OF GENERATOR DATA, BEGIN BRANCH DATA 667050, 667051,'1 ', 0.00034, 0.00286, 0.00580, 432.20, 432.20, 432.20, 0.00000, 0.00000, 0.00000, 0.00000,1, 0.00, 667,1.0000 0 / END OF BRANCH DATA, BEGIN TRANSFORMER DATA
Model Building Manual - Wind Generation: Appendix E
November 2008 - 27 - Midwest Reliability Organization
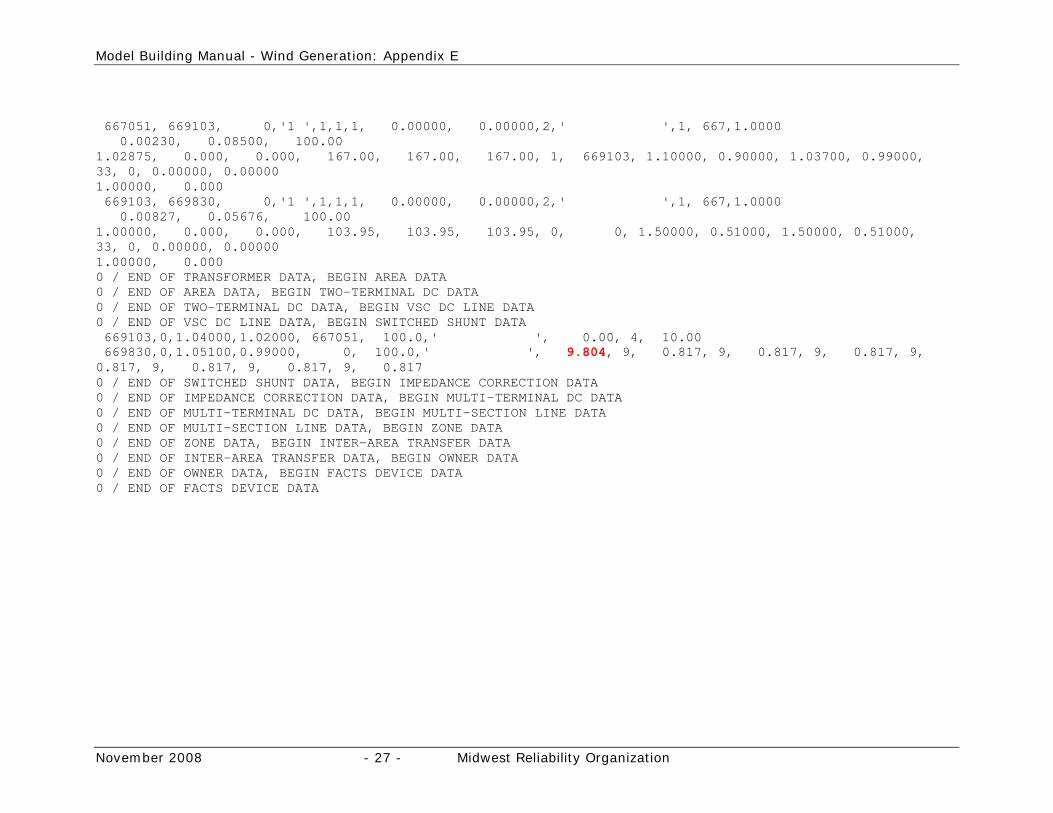
667051, 669103, 0,'1 ',1,1,1, 0.00000, 0.00000,2,' ',1, 667,1.0000 0.00230, 0.08500, 100.00 1.02875, 0.000, 0.000, 167.00, 167.00, 167.00, 1, 669103, 1.10000, 0.90000, 1.03700, 0.99000, 33, 0, 0.00000, 0.00000 1.00000, 0.000 669103, 669830, 0,'1 ',1,1,1, 0.00000, 0.00000,2,' ',1, 667,1.0000 0.00827, 0.05676, 100.00 1.00000, 0.000, 0.000, 103.95, 103.95, 103.95, 0, 0, 1.50000, 0.51000, 1.50000, 0.51000, 33, 0, 0.00000, 0.00000 1.00000, 0.000 0 / END OF TRANSFORMER DATA, BEGIN AREA DATA 0 / END OF AREA DATA, BEGIN TWO-TERMINAL DC DATA 0 / END OF TWO-TERMINAL DC DATA, BEGIN VSC DC LINE DATA 0 / END OF VSC DC LINE DATA, BEGIN SWITCHED SHUNT DATA 669103,0,1.04000,1.02000, 667051, 100.0,' ', 0.00, 4, 10.00 669830,0,1.05100,0.99000, 0, 100.0,' ', 9.804, 9, 0.817, 9, 0.817, 9, 0.817, 9, 0.817, 9, 0.817, 9, 0.817, 9, 0.817 0 / END OF SWITCHED SHUNT DATA, BEGIN IMPEDANCE CORRECTION DATA 0 / END OF IMPEDANCE CORRECTION DATA, BEGIN MULTI-TERMINAL DC DATA 0 / END OF MULTI-TERMINAL DC DATA, BEGIN MULTI-SECTION LINE DATA 0 / END OF MULTI-SECTION LINE DATA, BEGIN ZONE DATA 0 / END OF ZONE DATA, BEGIN INTER-AREA TRANSFER DATA 0 / END OF INTER-AREA TRANSFER DATA, BEGIN OWNER DATA 0 / END OF OWNER DATA, BEGIN FACTS DEVICE DATA 0 / END OF FACTS DEVICE DATA
Model Building Manual - Wind Generation: Appendix E
November 2008 - 28 - Midwest Reliability Organization
86 GE 1.5 WTG(1.50 MW each)
X-96
7.8 mile line
SFL
0.575 kV
138kV
34.5kV
1 X 32.6 Mvar
138kV
699870 699869FWDEC699868 699186
Note: 34.5 kV collector system not modeled
BUTTRNT699270
138kV33542
3.5 mile line
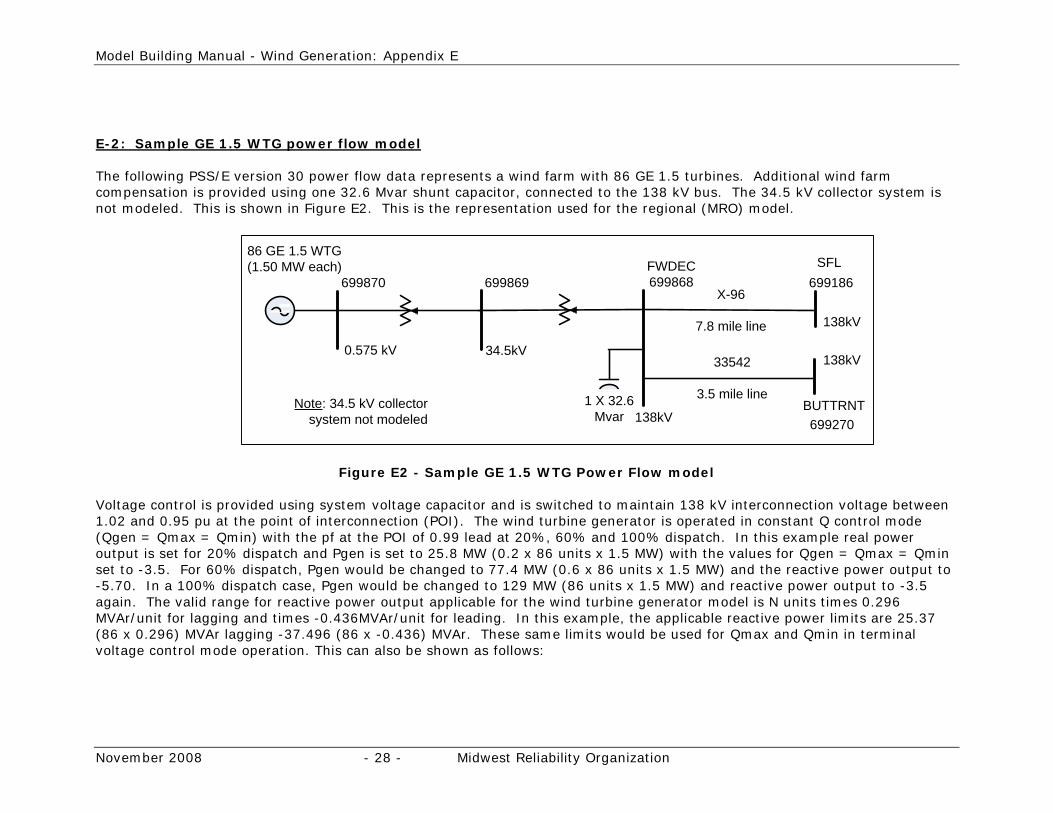
E-2: Sample GE 1.5 WTG power flow model The following PSS/E version 30 power flow data represents a wind farm with 86 GE 1.5 turbines. Additional wind farm compensation is provided using one 32.6 Mvar shunt capacitor, connected to the 138 kV bus. The 34.5 kV collector system is not modeled. This is shown in Figure E2. This is the representation used for the regional (MRO) model.
Figure E2 - Sample GE 1.5 WTG Power Flow model Voltage control is provided using system voltage capacitor and is switched to maintain 138 kV interconnection voltage between 1.02 and 0.95 pu at the point of interconnection (POI). The wind turbine generator is operated in constant Q control mode (Qgen = Qmax = Qmin) with the pf at the POI of 0.99 lead at 20%, 60% and 100% dispatch. In this example real power output is set for 20% dispatch and Pgen is set to 25.8 MW (0.2 x 86 units x 1.5 MW) with the values for Qgen = Qmax = Qmin set to -3.5. For 60% dispatch, Pgen would be changed to 77.4 MW (0.6 x 86 units x 1.5 MW) and the reactive power output to -5.70. In a 100% dispatch case, Pgen would be changed to 129 MW (86 units x 1.5 MW) and reactive power output to -3.5 again. The valid range for reactive power output applicable for the wind turbine generator model is N units times 0.296 MVAr/unit for lagging and times -0.436MVAr/unit for leading. In this example, the applicable reactive power limits are 25.37 (86 x 0.296) MVAr lagging -37.496 (86 x -0.436) MVAr. These same limits would be used for Qmax and Qmin in terminal voltage control mode operation. This can also be shown as follows:
Model Building Manual - Wind Generation: Appendix E
November 2008 - 29 - Midwest Reliability Organization
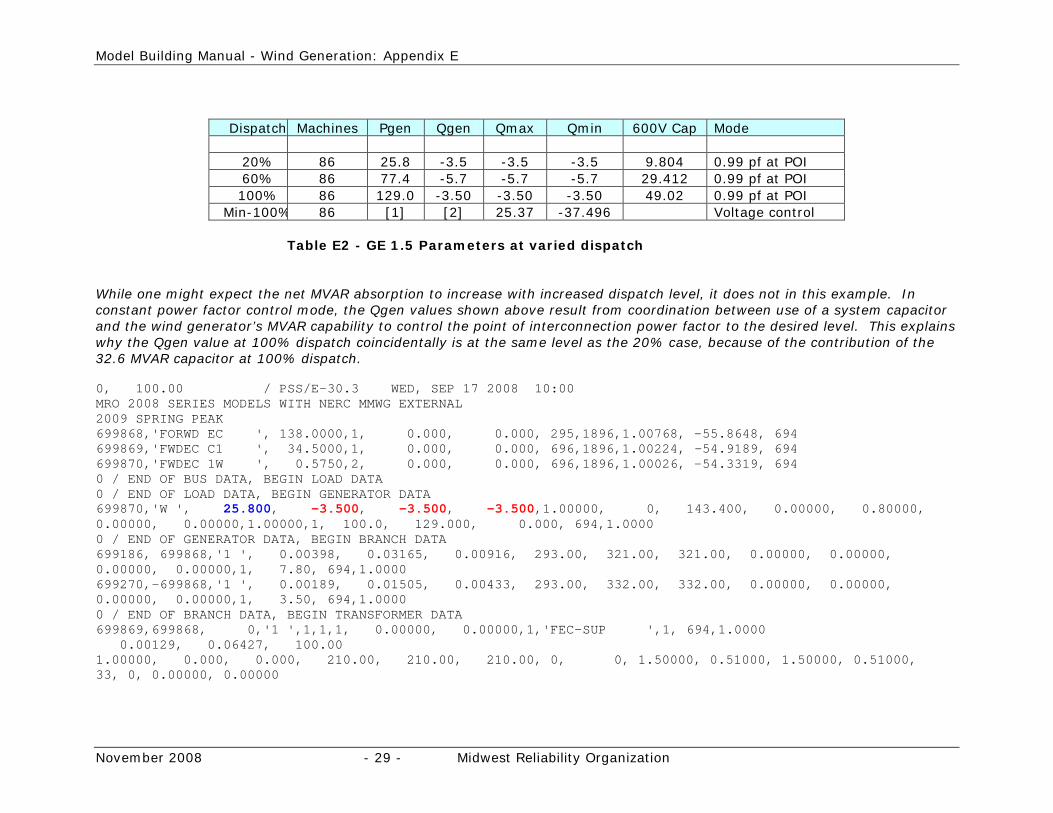
Dispatch Machines Pgen Qgen Qmax Qmin 600V Cap Mode
20% 86 25.8 -3.5 -3.5 -3.5 9.804 0.99 pf at POI 60% 86 77.4 -5.7 -5.7 -5.7 29.412 0.99 pf at POI 100% 86 129.0 -3.50 -3.50 -3.50 49.02 0.99 pf at POI
Min-100% 86 [1] [2] 25.37 -37.496 Voltage control Table E2 - GE 1.5 Parameters at varied dispatch While one might expect the net MVAR absorption to increase with increased dispatch level, it does not in this example. In constant power factor control mode, the Qgen values shown above result from coordination between use of a system capacitor and the wind generator’s MVAR capability to control the point of interconnection power factor to the desired level. This explains why the Qgen value at 100% dispatch coincidentally is at the same level as the 20% case, because of the contribution of the 32.6 MVAR capacitor at 100% dispatch. 0, 100.00 / PSS/E-30.3 WED, SEP 17 2008 10:00 MRO 2008 SERIES MODELS WITH NERC MMWG EXTERNAL 2009 SPRING PEAK 699868,'FORWD EC ', 138.0000,1, 0.000, 0.000, 295,1896,1.00768, -55.8648, 694 699869,'FWDEC C1 ', 34.5000,1, 0.000, 0.000, 696,1896,1.00224, -54.9189, 694 699870,'FWDEC 1W ', 0.5750,2, 0.000, 0.000, 696,1896,1.00026, -54.3319, 694 0 / END OF BUS DATA, BEGIN LOAD DATA 0 / END OF LOAD DATA, BEGIN GENERATOR DATA 699870,'W ', 25.800, -3.500, -3.500, -3.500,1.00000, 0, 143.400, 0.00000, 0.80000, 0.00000, 0.00000,1.00000,1, 100.0, 129.000, 0.000, 694,1.0000 0 / END OF GENERATOR DATA, BEGIN BRANCH DATA 699186, 699868,'1 ', 0.00398, 0.03165, 0.00916, 293.00, 321.00, 321.00, 0.00000, 0.00000, 0.00000, 0.00000,1, 7.80, 694,1.0000 699270,-699868,'1 ', 0.00189, 0.01505, 0.00433, 293.00, 332.00, 332.00, 0.00000, 0.00000, 0.00000, 0.00000,1, 3.50, 694,1.0000 0 / END OF BRANCH DATA, BEGIN TRANSFORMER DATA 699869,699868, 0,'1 ',1,1,1, 0.00000, 0.00000,1,'FEC-SUP ',1, 694,1.0000 0.00129, 0.06427, 100.00 1.00000, 0.000, 0.000, 210.00, 210.00, 210.00, 0, 0, 1.50000, 0.51000, 1.50000, 0.51000, 33, 0, 0.00000, 0.00000
Model Building Manual - Wind Generation: Appendix E
November 2008 - 30 - Midwest Reliability Organization
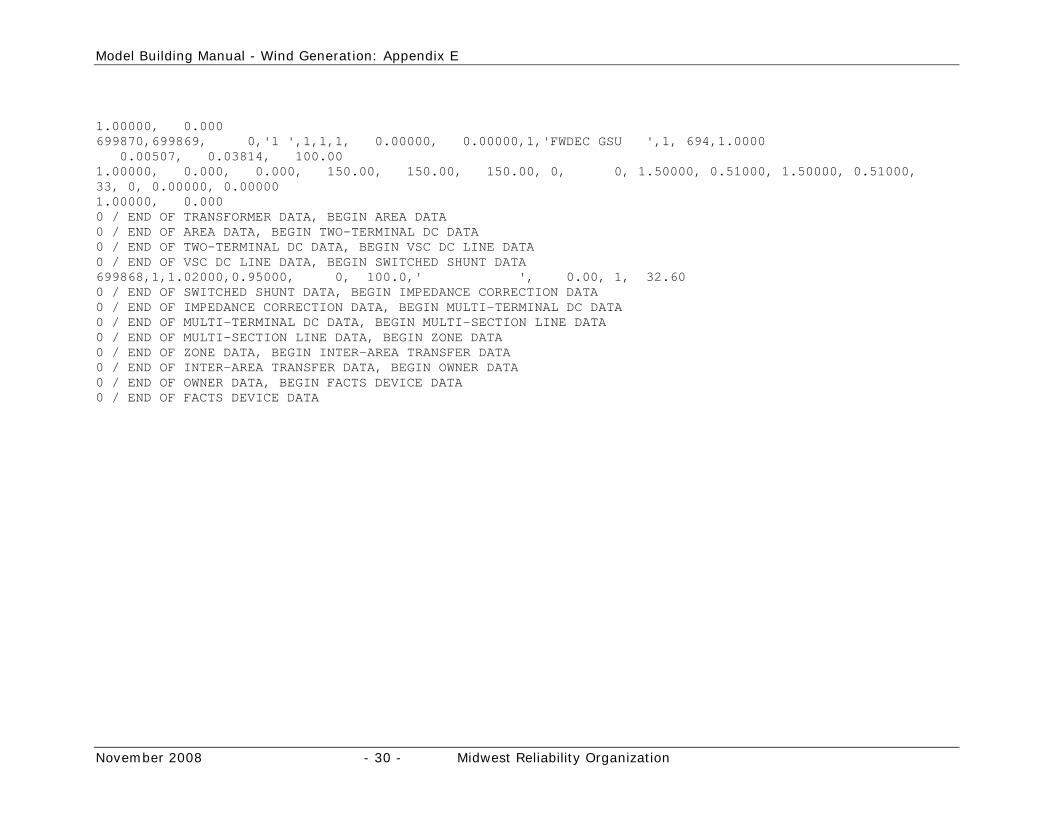
1.00000, 0.000 699870,699869, 0,'1 ',1,1,1, 0.00000, 0.00000,1,'FWDEC GSU ',1, 694,1.0000 0.00507, 0.03814, 100.00 1.00000, 0.000, 0.000, 150.00, 150.00, 150.00, 0, 0, 1.50000, 0.51000, 1.50000, 0.51000, 33, 0, 0.00000, 0.00000 1.00000, 0.000 0 / END OF TRANSFORMER DATA, BEGIN AREA DATA 0 / END OF AREA DATA, BEGIN TWO-TERMINAL DC DATA 0 / END OF TWO-TERMINAL DC DATA, BEGIN VSC DC LINE DATA 0 / END OF VSC DC LINE DATA, BEGIN SWITCHED SHUNT DATA 699868,1,1.02000,0.95000, 0, 100.0,' ', 0.00, 1, 32.60 0 / END OF SWITCHED SHUNT DATA, BEGIN IMPEDANCE CORRECTION DATA 0 / END OF IMPEDANCE CORRECTION DATA, BEGIN MULTI-TERMINAL DC DATA 0 / END OF MULTI-TERMINAL DC DATA, BEGIN MULTI-SECTION LINE DATA 0 / END OF MULTI-SECTION LINE DATA, BEGIN ZONE DATA 0 / END OF ZONE DATA, BEGIN INTER-AREA TRANSFER DATA 0 / END OF INTER-AREA TRANSFER DATA, BEGIN OWNER DATA 0 / END OF OWNER DATA, BEGIN FACTS DEVICE DATA 0 / END OF FACTS DEVICE DATA
Model Building Manual - Wind Generation: Appendix F
November 2008 - 31 - Midwest Reliability Organization
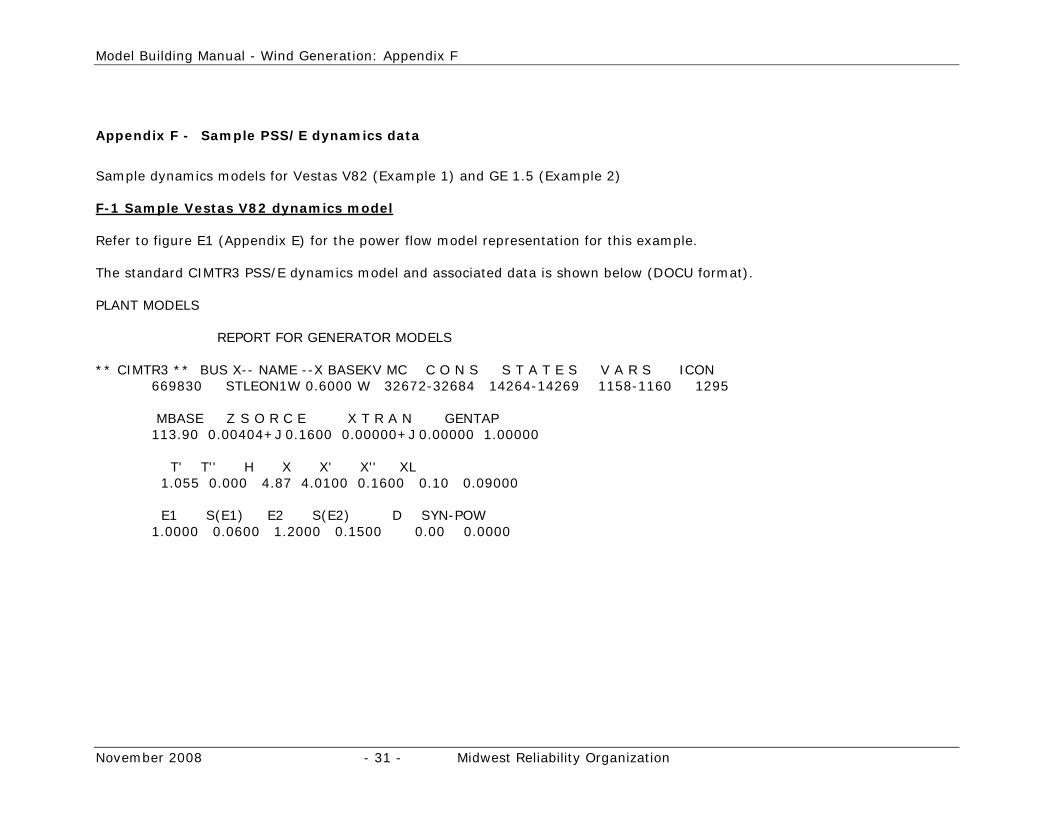
Appendix F - Sample PSS/E dynamics data
Sample dynamics models for Vestas V82 (Example 1) and GE 1.5 (Example 2) F-1 Sample Vestas V82 dynamics model Refer to figure E1 (Appendix E) for the power flow model representation for this example. The standard CIMTR3 PSS/E dynamics model and associated data is shown below (DOCU format). PLANT MODELS REPORT FOR GENERATOR MODELS ** CIMTR3 ** BUS X-- NAME --X BASEKV MC C O N S S T A T E S V A R S ICON 669830 STLEON1W 0.6000 W 32672-32684 14264-14269 1158-1160 1295 MBASE Z S O R C E X T R A N GENTAP 113.90 0.00404+J 0.1600 0.00000+J 0.00000 1.00000 T' T'' H X X' X'' XL 1.055 0.000 4.87 4.0100 0.1600 0.10 0.09000 E1 S(E1) E2 S(E2) D SYN-POW 1.0000 0.0600 1.2000 0.1500 0.00 0.0000
Model Building Manual - Wind Generation: Appendix F
November 2008 - 32 - Midwest Reliability Organization
1. N, Number of original wind turbines lumped to this equivalent WT is set to 86.
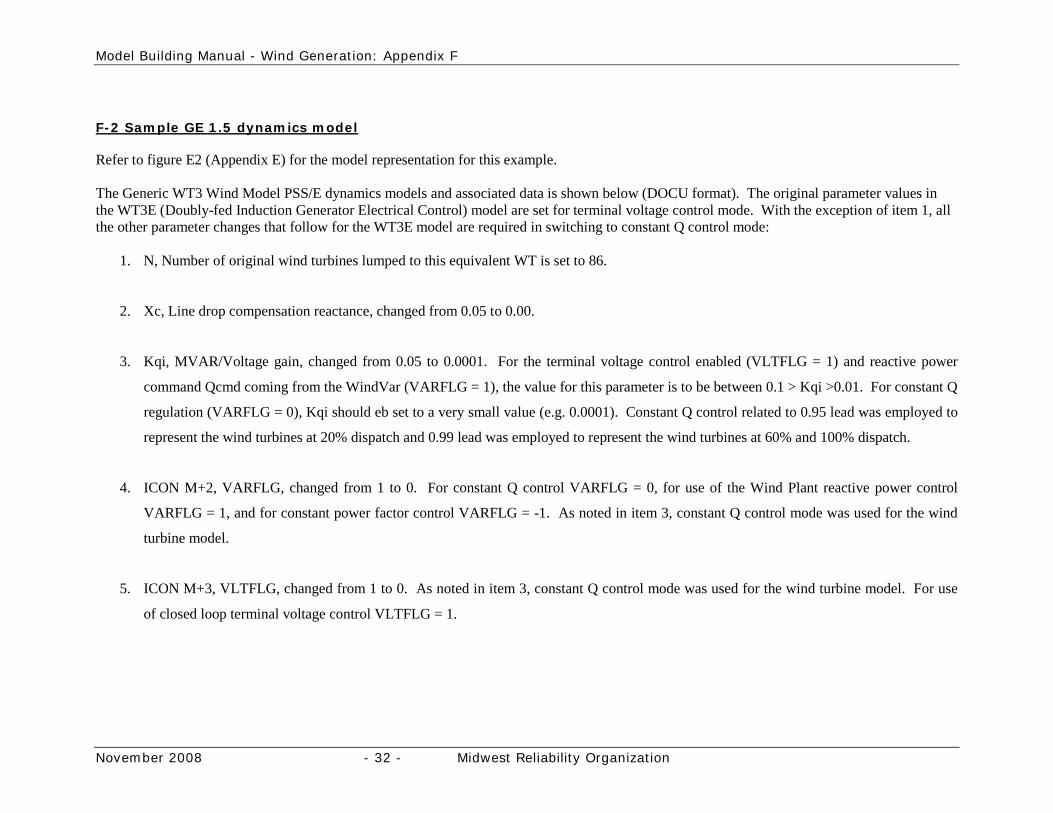
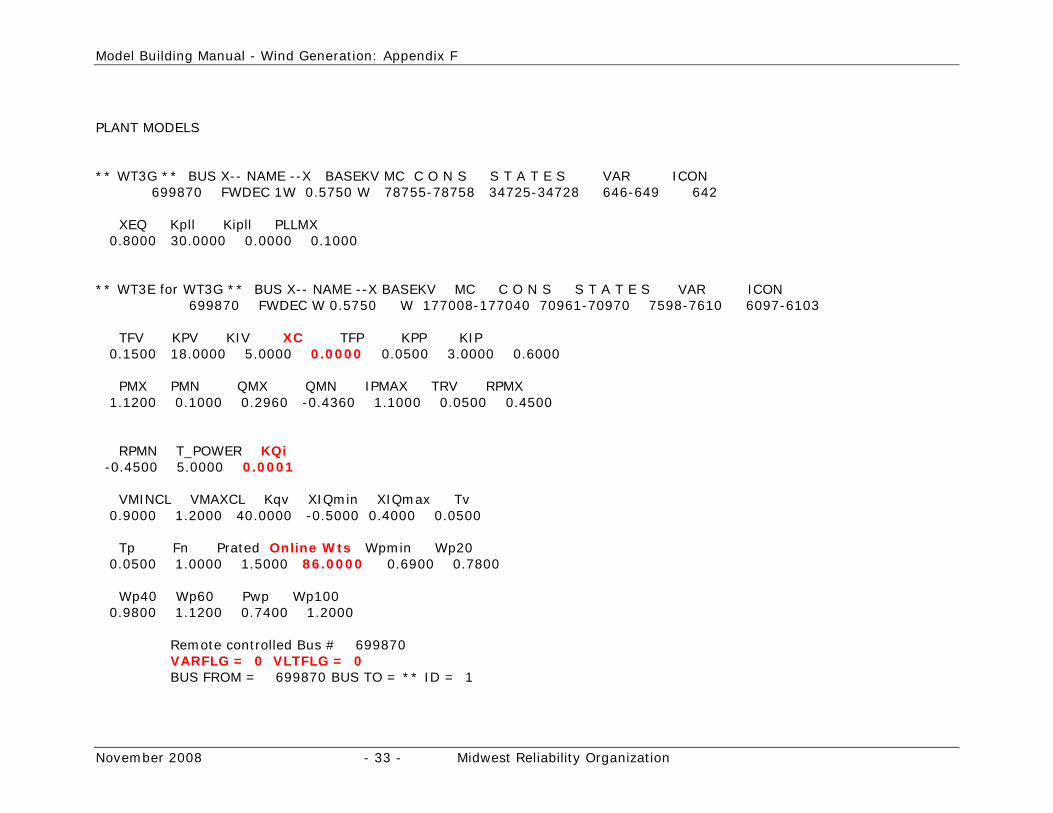
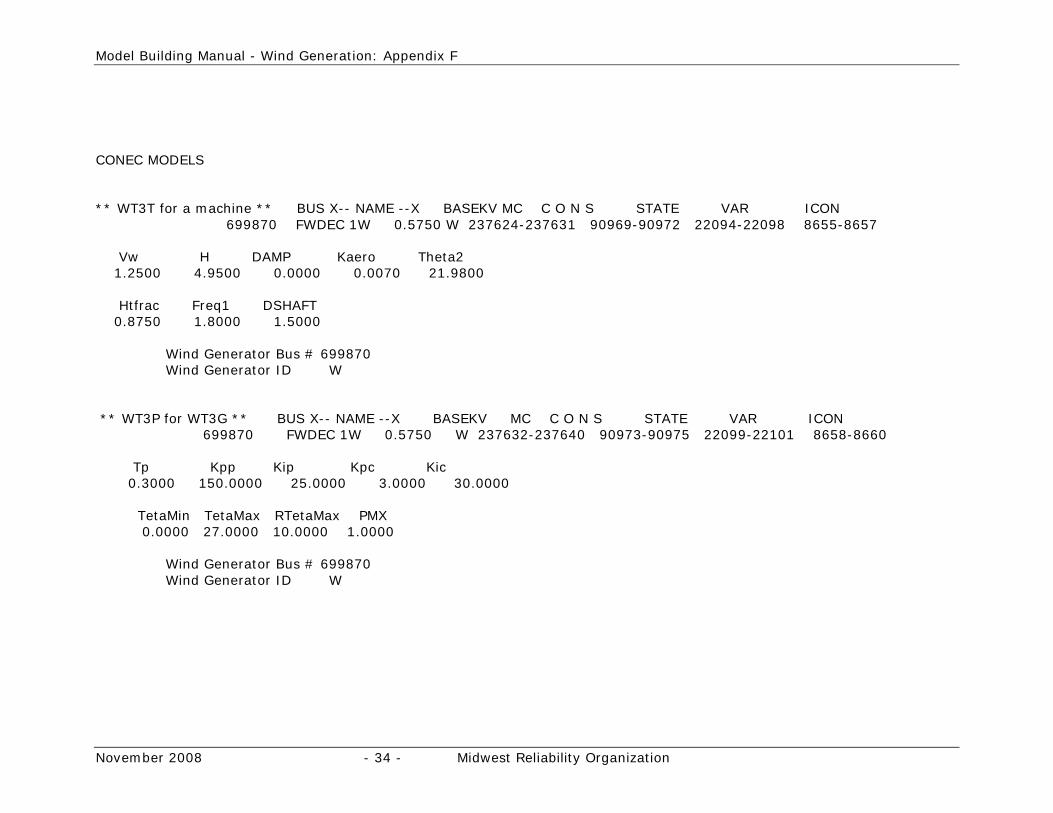
F-2 Sample GE 1.5 dynamics model Refer to figure E2 (Appendix E) for the model representation for this example. The Generic WT3 Wind Model PSS/E dynamics models and associated data is shown below (DOCU format). The original parameter values in the WT3E (Doubly-fed Induction Generator Electrical Control) model are set for terminal voltage control mode. With the exception of item 1, all the other parameter changes that follow for the WT3E model are required in switching to constant Q control mode:
2. Xc, Line drop compensation reactance, changed from 0.05 to 0.00.
3. Kqi, MVAR/Voltage gain, changed from 0.05 to 0.0001. For the terminal voltage control enabled (VLTFLG = 1) and reactive power
command Qcmd coming from the WindVar (VARFLG = 1), the value for this parameter is to be between 0.1 > Kqi >0.01. For constant Q
regulation (VARFLG = 0), Kqi should eb set to a very small value (e.g. 0.0001). Constant Q control related to 0.95 lead was employed to
represent the wind turbines at 20% dispatch and 0.99 lead was employed to represent the wind turbines at 60% and 100% dispatch.
4. ICON M+2, VARFLG, changed from 1 to 0. For constant Q control VARFLG = 0, for use of the Wind Plant reactive power control
VARFLG = 1, and for constant power factor control VARFLG = -1. As noted in item 3, constant Q control mode was used for the wind
turbine model.
5. ICON M+3, VLTFLG, changed from 1 to 0. As noted in item 3, constant Q control mode was used for the wind turbine model. For use
of closed loop terminal voltage control VLTFLG = 1.
Model Building Manual - Wind Generation: Appendix F
November 2008 - 33 - Midwest Reliability Organization
PLANT MODELS ** WT3G ** BUS X-- NAME --X BASEKV MC C O N S S T A T E S VAR ICON 699870 FWDEC 1W 0.5750 W 78755-78758 34725-34728 646-649 642 XEQ Kpll Kipll PLLMX 0.8000 30.0000 0.0000 0.1000 ** WT3E for WT3G ** BUS X-- NAME --X BASEKV MC C O N S S T A T E S VAR ICON 699870 FWDEC W 0.5750 W 177008-177040 70961-70970 7598-7610 6097-6103 TFV KPV KIV XC TFP KPP KIP 0.1500 18.0000 5.0000 0.0000 0.0500 3.0000 0.6000 PMX PMN QMX QMN IPMAX TRV RPMX 1.1200 0.1000 0.2960 -0.4360 1.1000 0.0500 0.4500 RPMN T_POWER KQi -0.4500 5.0000 0.0001 VMINCL VMAXCL Kqv XIQmin XIQmax Tv 0.9000 1.2000 40.0000 -0.5000 0.4000 0.0500 Tp Fn Prated Online Wts Wpmin Wp20 0.0500 1.0000 1.5000 86.0000 0.6900 0.7800 Wp40 Wp60 Pwp Wp100 0.9800 1.1200 0.7400 1.2000 Remote controlled Bus # 699870 VARFLG = 0 VLTFLG = 0 BUS FROM = 699870 BUS TO = ** ID = 1
Model Building Manual - Wind Generation: Appendix F
November 2008 - 34 - Midwest Reliability Organization
CONEC MODELS ** WT3T for a machine ** BUS X-- NAME --X BASEKV MC C O N S STATE VAR ICON 699870 FWDEC 1W 0.5750 W 237624-237631 90969-90972 22094-22098 8655-8657 Vw H DAMP Kaero Theta2 1.2500 4.9500 0.0000 0.0070 21.9800 Htfrac Freq1 DSHAFT 0.8750 1.8000 1.5000 Wind Generator Bus # 699870 Wind Generator ID W ** WT3P for WT3G ** BUS X-- NAME --X BASEKV MC C O N S STATE VAR ICON 699870 FWDEC 1W 0.5750 W 237632-237640 90973-90975 22099-22101 8658-8660 Tp Kpp Kip Kpc Kic 0.3000 150.0000 25.0000 3.0000 30.0000 TetaMin TetaMax RTetaMax PMX 0.0000 27.0000 10.0000 1.0000 Wind Generator Bus # 699870 Wind Generator ID W
Model Building Manual - Wind Generation: Appendix F
November 2008 - 35 - Midwest Reliability Organization
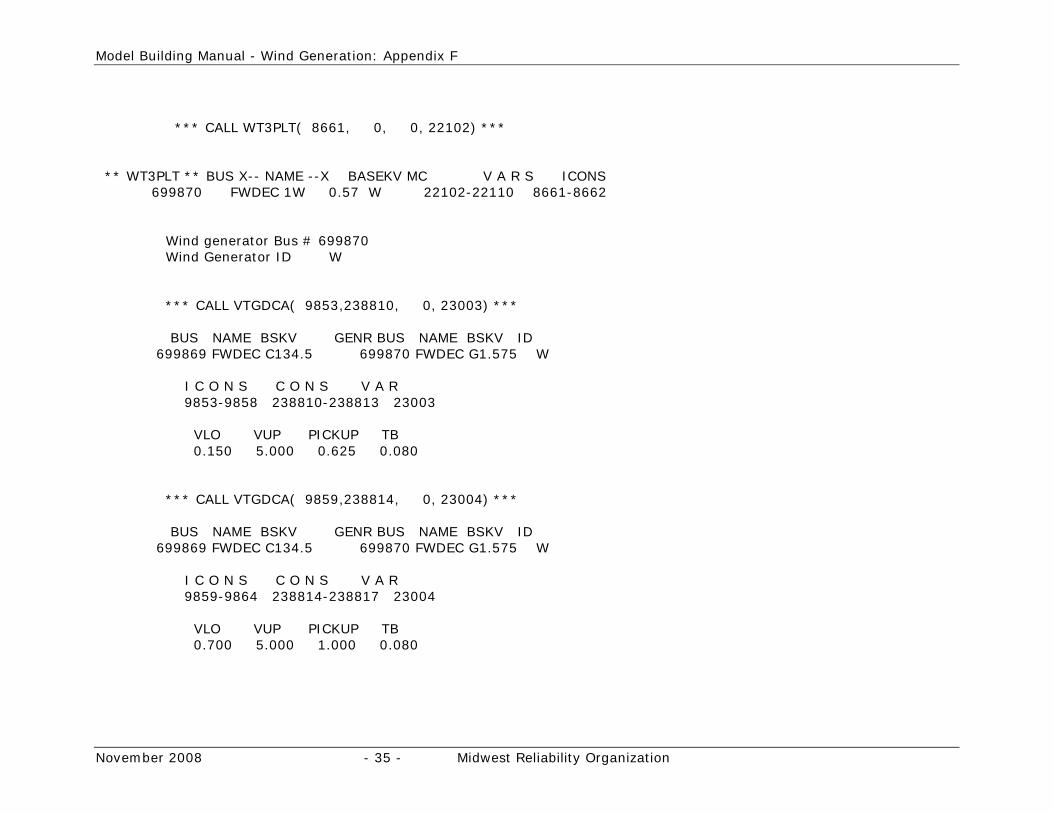
*** CALL WT3PLT( 8661, 0, 0, 22102) *** ** WT3PLT ** BUS X-- NAME --X BASEKV MC V A R S ICONS 699870 FWDEC 1W 0.57 W 22102-22110 8661-8662 Wind generator Bus # 699870 Wind Generator ID W *** CALL VTGDCA( 9853,238810, 0, 23003) *** BUS NAME BSKV GENR BUS NAME BSKV ID 699869 FWDEC C134.5 699870 FWDEC G1.575 W I C O N S C O N S V A R 9853-9858 238810-238813 23003 VLO VUP PICKUP TB 0.150 5.000 0.625 0.080 *** CALL VTGDCA( 9859,238814, 0, 23004) *** BUS NAME BSKV GENR BUS NAME BSKV ID 699869 FWDEC C134.5 699870 FWDEC G1.575 W I C O N S C O N S V A R 9859-9864 238814-238817 23004 VLO VUP PICKUP TB 0.700 5.000 1.000 0.080
Model Building Manual - Wind Generation: Appendix F
November 2008 - 36 - Midwest Reliability Organization
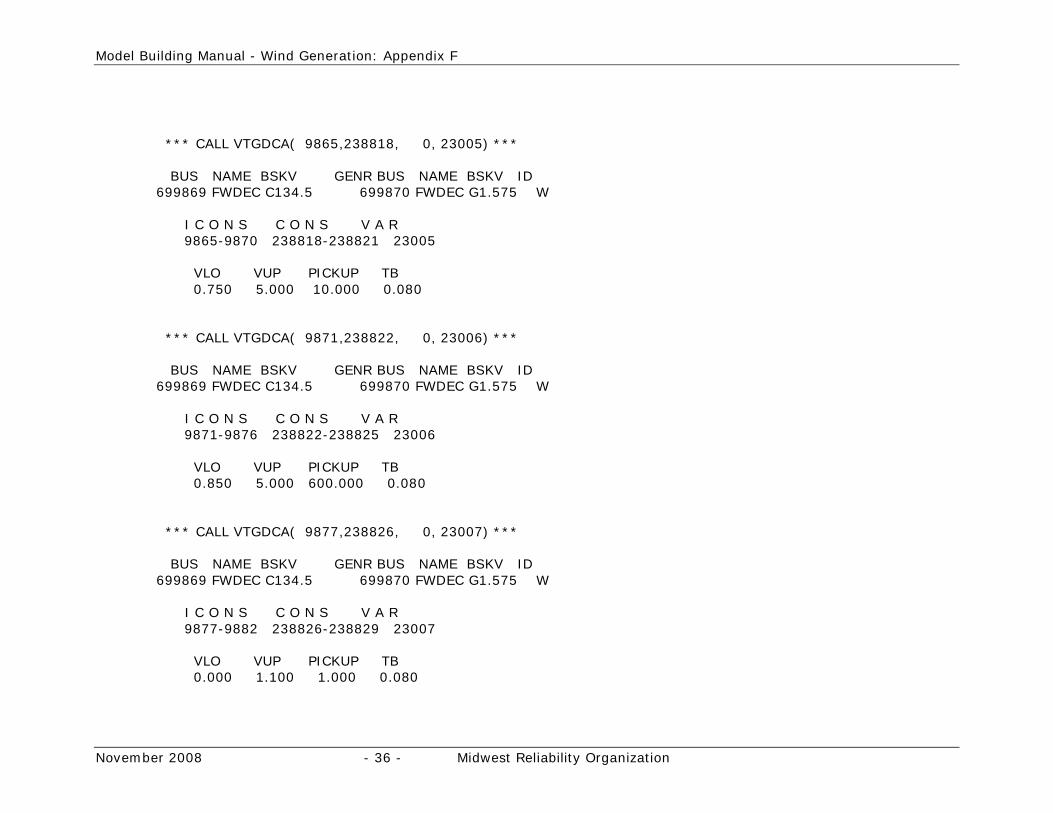
*** CALL VTGDCA( 9865,238818, 0, 23005) *** BUS NAME BSKV GENR BUS NAME BSKV ID 699869 FWDEC C134.5 699870 FWDEC G1.575 W I C O N S C O N S V A R 9865-9870 238818-238821 23005 VLO VUP PICKUP TB 0.750 5.000 10.000 0.080 *** CALL VTGDCA( 9871,238822, 0, 23006) *** BUS NAME BSKV GENR BUS NAME BSKV ID 699869 FWDEC C134.5 699870 FWDEC G1.575 W I C O N S C O N S V A R 9871-9876 238822-238825 23006 VLO VUP PICKUP TB 0.850 5.000 600.000 0.080 *** CALL VTGDCA( 9877,238826, 0, 23007) *** BUS NAME BSKV GENR BUS NAME BSKV ID 699869 FWDEC C134.5 699870 FWDEC G1.575 W I C O N S C O N S V A R 9877-9882 238826-238829 23007 VLO VUP PICKUP TB 0.000 1.100 1.000 0.080
Model Building Manual - Wind Generation: Appendix F
November 2008 - 37 - Midwest Reliability Organization
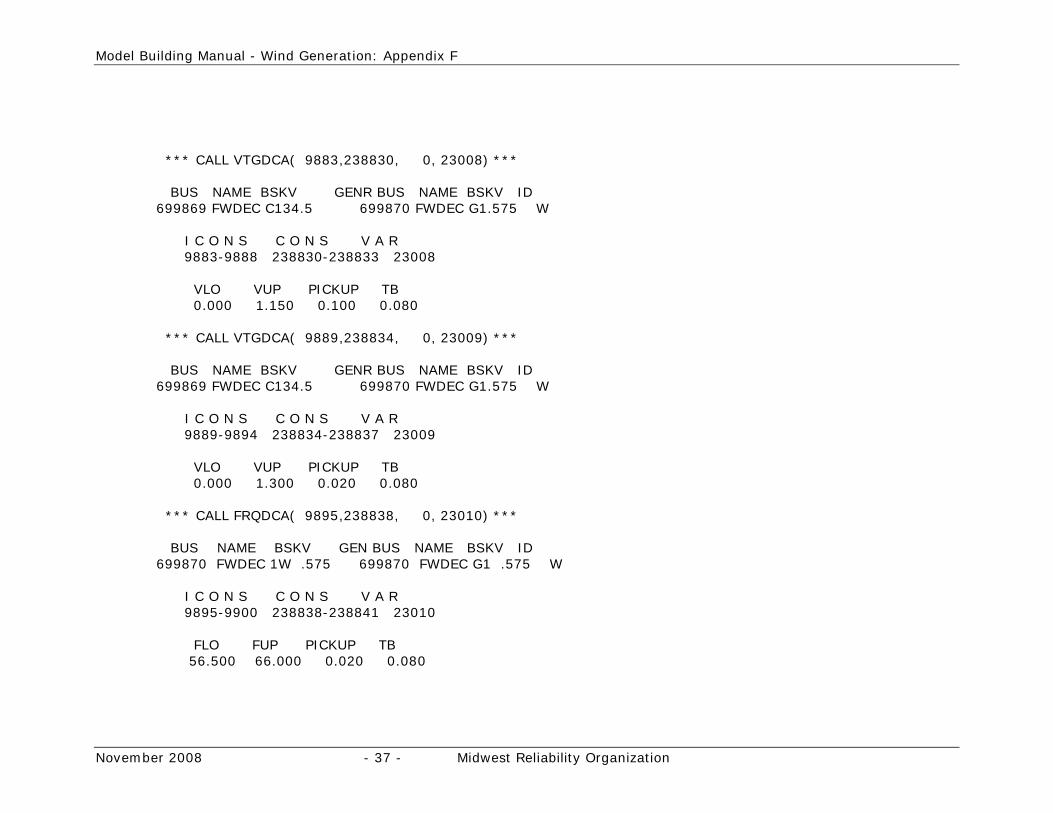
*** CALL VTGDCA( 9883,238830, 0, 23008) *** BUS NAME BSKV GENR BUS NAME BSKV ID 699869 FWDEC C134.5 699870 FWDEC G1.575 W I C O N S C O N S V A R 9883-9888 238830-238833 23008 VLO VUP PICKUP TB 0.000 1.150 0.100 0.080 *** CALL VTGDCA( 9889,238834, 0, 23009) *** BUS NAME BSKV GENR BUS NAME BSKV ID 699869 FWDEC C134.5 699870 FWDEC G1.575 W I C O N S C O N S V A R 9889-9894 238834-238837 23009 VLO VUP PICKUP TB 0.000 1.300 0.020 0.080 *** CALL FRQDCA( 9895,238838, 0, 23010) *** BUS NAME BSKV GEN BUS NAME BSKV ID 699870 FWDEC 1W .575 699870 FWDEC G1 .575 W I C O N S C O N S V A R 9895-9900 238838-238841 23010 FLO FUP PICKUP TB 56.500 66.000 0.020 0.080
Model Building Manual - Wind Generation: Appendix F
November 2008 - 38 - Midwest Reliability Organization
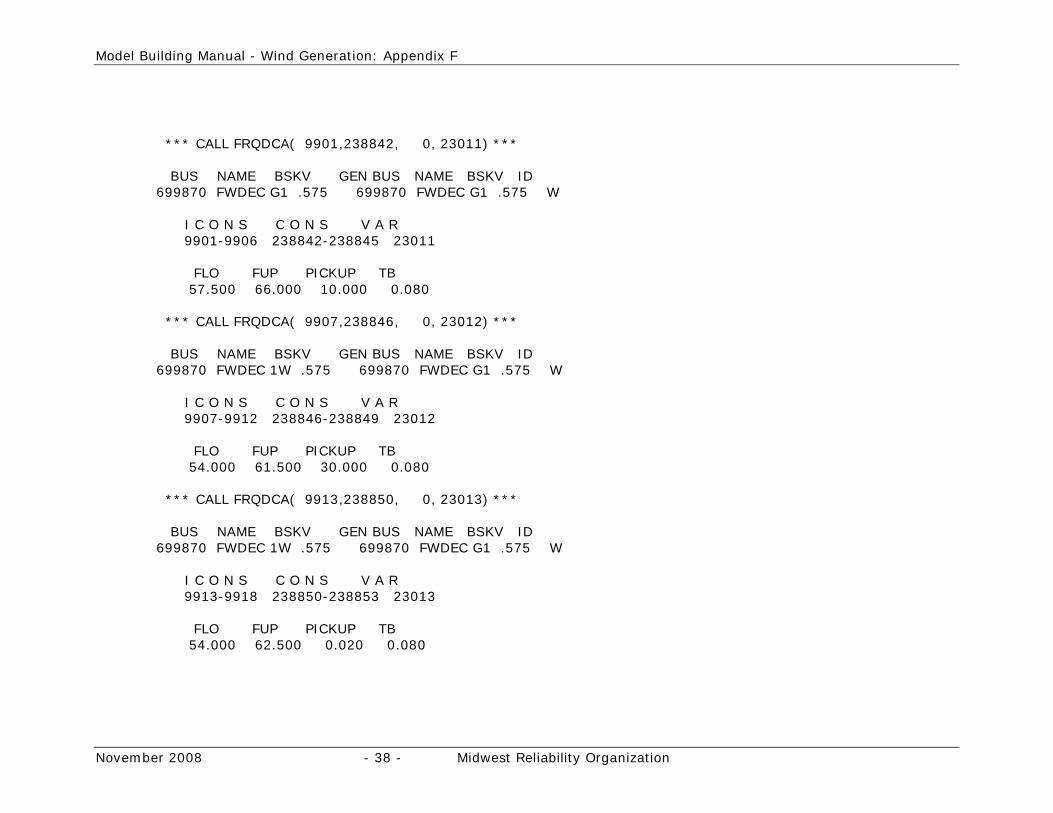
*** CALL FRQDCA( 9901,238842, 0, 23011) *** BUS NAME BSKV GEN BUS NAME BSKV ID 699870 FWDEC G1 .575 699870 FWDEC G1 .575 W I C O N S C O N S V A R 9901-9906 238842-238845 23011 FLO FUP PICKUP TB 57.500 66.000 10.000 0.080 *** CALL FRQDCA( 9907,238846, 0, 23012) *** BUS NAME BSKV GEN BUS NAME BSKV ID 699870 FWDEC 1W .575 699870 FWDEC G1 .575 W I C O N S C O N S V A R 9907-9912 238846-238849 23012 FLO FUP PICKUP TB 54.000 61.500 30.000 0.080 *** CALL FRQDCA( 9913,238850, 0, 23013) *** BUS NAME BSKV GEN BUS NAME BSKV ID 699870 FWDEC 1W .575 699870 FWDEC G1 .575 W I C O N S C O N S V A R 9913-9918 238850-238853 23013 FLO FUP PICKUP TB 54.000 62.500 0.020 0.080
Model Building Manual - Wind Generation: Appendix G
November 2008 - 39 - Midwest Reliability Organization
Appendix G - Sample Data Request for Wind Power Plants
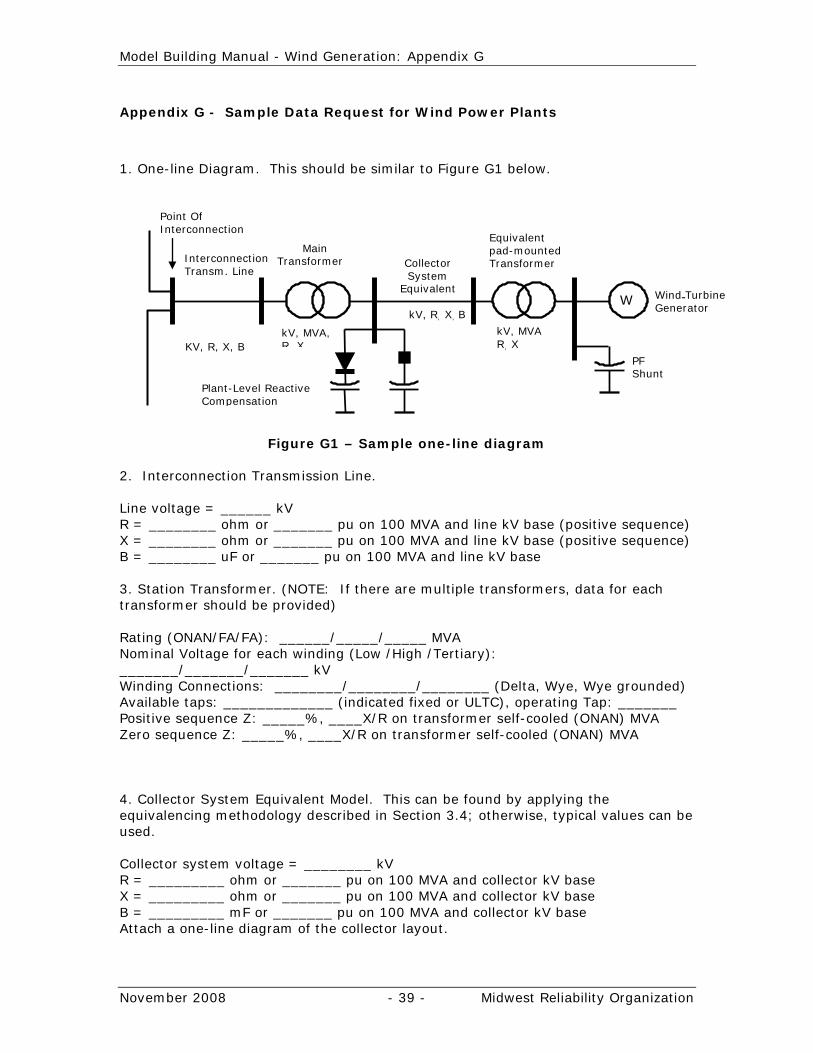
1. One-line Diagram. This should be similar to Figure G1 below.
Figure G1 – Sample one-line diagram 2. Interconnection Transmission Line. Line voltage = ______ kV R = ________ ohm or _______ pu on 100 MVA and line kV base (positive sequence) X = ________ ohm or _______ pu on 100 MVA and line kV base (positive sequence) B = ________ uF or _______ pu on 100 MVA and line kV base 3. Station Transformer. (NOTE: If there are multiple transformers, data for each transformer should be provided) Rating (ONAN/FA/FA): ______/_____/_____ MVA Nominal Voltage for each winding (Low /High /Tertiary): _______/_______/_______ kV Winding Connections: ________/________/________ (Delta, Wye, Wye grounded) Available taps: _____________ (indicated fixed or ULTC), operating Tap: _______ Positive sequence Z: _____%, ____X/R on transformer self-cooled (ONAN) MVA Zero sequence Z: _____%, ____X/R on transformer self-cooled (ONAN) MVA 4. Collector System Equivalent Model. This can be found by applying the equivalencing methodology described in Section 3.4; otherwise, typical values can be used. Collector system voltage = ________ kV R = _________ ohm or _______ pu on 100 MVA and collector kV base X = _________ ohm or _______ pu on 100 MVA and collector kV base B = _________ mF or _______ pu on 100 MVA and collector kV base Attach a one-line diagram of the collector layout.
W
Wind
-
Turbine
Generator
PF
Shunt
Collector
System
Equivalent
Interconnection Transm. Line
Point Of Interconnection
Main
Transformer
KV, R, X, B
kV, MVA, R X
kV, MVA R, X
kV, R, X, B
Plant-Level Reactive Compensation
Equivalent pad-mounted Transformer
Model Building Manual - Wind Generation: Appendix G
November 2008 - 40 - Midwest Reliability Organization
Note: It is also acceptable to provide a complete collector system description similar to Figure 1 of the Power Flow Modeling Guide.
5. Wind-turbine Generator (WTG) Pad-Mounted Transformer. Note: These are typically two-winding air-cooled transformers. If the proposed project contains different types or sizes of pad-mounted transformers, please provide data for each type. Rating: ______ MVA Nominal voltage for each winding (Low /High): _______/_______kV Winding Connections: _______/_______ (Delta, Wye, Wye grounded) Available taps: __________ (please indicated fixed or ULTC), Operating Tap:_______ Positive sequence impedance (Z1) _____%, ____X/R on transformer self-cooled MVA Zero sequence impedance (Z0) _____%, ____X/R on transformer self-cooled MVA 6. WTG Powerflow Data. Proposed projects may include one or more WTG Types (See NOTE 1 below). Please provide the following information for each: Number of WTGs: _______ Nameplate rating (each WTG): ________ MW WTG Manufacturer and Model: _______________ WTG Type: __________ For Type 1 or Type 2 WTGs: Uncompensated power factor at full load: _______ Power factor correction capacitors at full load: ______Mvar Number of shunt stages and size ___________ Please attach capability curve describing reactive power or power factor range from 0 to full output, including the effect of shunt compensation. For Type 3 and Type 3 WTGs: Maximum under-excited power factor at full load: _______ Maximum under-excited power factor at full load: _______ Control mode: _____________ (voltage control, fixed power factor) (See Note 7.2) Please attach capability curve describing reactive power or power factor range from 0 to full output. NOTE 7.1: WTG Type can be one of the following:
• Type 1 – Squirrel-cage induction generator • Type 2 – Wound rotor induction machine with variable rotor resistance • Type 3 – Doubly-fed asynchronous generator • Type 4 – Full converter interface
NOTE 7.2: Type 1 and Type 2 WTGs typically operate on fixed power factor mode
for a wide range of output level, aided by turbine-side power factor correction capacitors (shunt compensation). With a suitable plant-level controller, Type 3 and Type 4 WTGs may be capable of dynamically varying power factor to contribute to voltage control mode operation, if required by the utility. However, this feature is not always available due to commercial and other reasons. The data requested must reflect the WTG capability that can be used in practice. Please consult with the manufacturer when in doubt. The interconnection study

Model Building Manual - Wind Generation: Appendix G
November 2008 - 41 - Midwest Reliability Organization
will determine the voltage control requirements for the project. Plant-level reactive compensation requirements are engineered to meet specific requirements. WTG reactive capability data described above could significantly impact study results and plant-level reactive compensation requirements.
7. Wind Farm Reactive Power Compensation. Provide the following information for wind farm-level reactive compensation, if applicable: Individual shunt capacitor and size of each: ______X_______ MVA Dynamic reactive control device, (SVC, STATCOM): _______________________ Control range ___________________________ Mvar (lead and lag) Control mode (line drop, voltage droop, voltage control): _______________________ Regulation point _______________________ Describe the overall reactive power control strategy: ___________________________________________________________________ 8. Wind-turbine Generator (WTG) Dynamic Data. Model and parameter data required for transient stability analysis is specific to each WTG make and model. The dynamic models must be in an approved WECC format, or in a PSSE or PSLF format that is acceptable to the transmission provider. We strongly suggest that the manufacturers provide this information. Library model name: ______________ Model type (standard library or user-written): ___________ Model access (proprietary or non-proprietary): ___________ Attach full model description and parameter data

Model Building Manual - Wind Generation: Appendix H
November 2008 - 42 - Midwest Reliability Organization
Appendix H - Bibliography
Western Electricity Coordinating Council Modeling and Validation Working Group, “WECC Wind Power Plant Powerflow Modeling Guide”, WECC Wind Generator Modeling Group, January 2008. Ackerman, Thomas. Wind Power in Power Systems. New York: John Wiley & Sons. 2005. Ahlstrom, M. et al., “The Future of Wind Forecasting and Utility Operations,” IEEE Power and Energy Magazine, Nov-Dec 2005. Special Issue: Working With Wind; Integrating Wind into the Power System. American Wind Energy Association. “Electrical Guide to Utility Scale Wind Turbines.” March 2005. Burton, et al. Wind Energy Handbook. Chichester, UK: John Wiley & Sons. 2001. DeMeo, E. et al., “Wind Plant Integration,” IEEE” IEEE Power and Energy Magazine, Nov-Dec 2005. Special Issue: Working With Wind; Integrating Wind into the Power System. EnerNex Corp. / Utility Wind Integration Group / ERCOT, “Short Circuit Studies for Wind Plants,” August 2006. EnerNex Corp. and Windlogics Inc. for the Minnesota Public Utilities Commission, “Final Report – 2006 Minnesota Wind Integration Study, Volume I”, Minnesota Public Utilities Commission, St. Paul, MN, November 30, 2006. EnerNex Corp. and Windlogics Inc. for the Minnesota Public Utilities Commission, “Final Report – 2006 Minnesota Wind Integration Study, Volume II – Characterizing the Minnesota Wind Resource,” Minnesota Public Utilities Commission, St. Paul, MN, November 30, 2006. GE Energy. “The Effects of Integrating Wind Power on Transmission System Planning, Reliability, and Operations: Report on Phase 2,” Prepared for The New York State Energy Research and Development Authority, City, State, March 2005. H. Holttinen et. al, “Design and Operation of Power Systems with Large Amounts of Wind Power Production: IEA Collaboration,” European Wind Energy Conference, Athens, Greece, February 2006. Y.A. Kazochov, J.W. Feltes, and R Zavadil, “Modeling Wind Farms for Power System Stability Studies,” Power Engineering Society General Meeting, 2003, IEEE, Vol. 3, July 2003. M. Milligan, and K. Porter, “Determining the capacity value of wind: A survey of methods and implementation,” Presented at Windpower 2005, Denver, CO, May 2005.

Model Building Manual - Wind Generation: Appendix H
November 2008 - 43 - Midwest Reliability Organization
E. Muljadi, C.P. Butterfield, A. Ellis, J Mechenbier, J. Hochheimer, R.Young, N. Miller, R. Delmerico, R. Zavadil, J.C. Smith, “Equivalencing the Collector System of a Large Wind Plant,” Presented at the IEEE Power Engineering Society, General Meeting 2006, Montreal Quebec, Canada, June 18-22, 2006. E. Muljadi, C.P. Butterfield, A. Ellis, J Mechenbier, J. Hochheimer, R.Young, N. Miller, R. Delmerico, R. Zavadil, J.C. Smith, “Model Validation at the 204 MW New Mexico Wind Energy Center,” Presented at the AWEA WindPower Conference 2006, Pittsburgh, Pennsylvania, June 4-7, 2006. B. Parsons, M. Milligan, J. C. Smith, E. DeMeo, B. Oakleaf, K. Wolf, M. Schuerger, R. Zavadil, M. Ahlstrom, and D. Yen Nakafuji, Grid impacts of wind power variability: recent assessments from a variety of utilities in the United States, presented at the European Wind Energy Conference, Athens, Greece. March 2006. Piwko, R.et al., “Wind Energy Delivery Issues,” IEEE Power and Energy Magazine, Nov-Dec 2005. Special Issue: Working With Wind; Integrating Wind into the Power System. Utility Wind Integration Group, “Utility Wind Integration State of the Art,” May 2006. Y. Wan, “Wind power plant behaviors: analysis of long-term wind power data,” National Renewable Energy Laboratory, Golden, CO, Tech. Rep. NREL/TP-500-36651, 2004. J.G. Slootweg, S.W.H. de Haan, H. Polinder and W.L. Kling, “Modeling Wind Turbines in Power System Dynamics Simulations”, IEEE PES Summer Meeting, July 2001. Torbjorn Thiringer, Andreas Peterson and Tomas Petru, “Grid Disturbance Response of Wind Turbines Equipped with Induction Generator and Doubly-Fed Induction Generator”, IEEE PES Summer Meeting,, July 2003. J.G. Slootweg and W.L. Kling, “Modeling of Large Wind Farms in Power System Simulations”, IEEE PES Summer Meeting, July 2002.


![NERC CIP Compliance - Midwest Reliability Organization · PDF file[NERC CIP Compliance] P a g e | 3 MIDWEST RELIABILITY ORGANIZATION Introduction This paper has been developed to address](https://img.pdfslide.net/doc/110x75/5aa470d57f8b9ac8748bec79/nerc-cip-compliance-midwest-reliability-organization-nerc-cip-compliance-p-a.jpg)

![Statistical Analysis of Abnormal Behavior - certs.lbl.gov · (American Electric Power [AEP]), Terry Bilke (Midwest ISO), Bob Cummings (North American Electric Reliability Corporation](https://img.pdfslide.net/doc/110x75/5fdb5b08d8a2703b77136c67/statistical-analysis-of-abnormal-behavior-certslblgov-american-electric-power.jpg)