Embed Size (px)
Citation preview
Migrant Youths’ Educational Achievement: The Role of Institutions
Deborah A. Cobb-Clarka Mathias Sinningb
and Steven Stillmanc, d
Abstract: We use 2009 Programme for International Student Assessment (PISA) data to link institutional arrangements in OECD countries to the disparity in reading, math, and science test scores for migrant and native-born students. We find that achievement gaps are larger for migrant youths who arrive at older ages and those who do not speak the test language at home. Institutional arrangements often serve to mitigate the achievement gaps of some migrant students while leaving unaffected or exacerbating those of others. For example, earlier school starting ages help migrant youths in some cases but by no means in all. Limited tracking on ability appears beneficial for migrants’ relative achievement, while complete tracking and a large private school sector appear detrimental. Migrant students’ achievement relative to their native-born peers suffers as educational spending and teachers’ salaries increase, but improves when examination is a component of the process for evaluating teachers.
Keywords: Migrant Youths; PISA Test Scores; Schools; Institutions; Academic Achievement
Note: The authors wish to thank Marta Tienda, Alicia Adsera, Francesc Ortega and the participants at the Fifth Annual INSIDE workshop for their comments.
a Melbourne Institute of Applied Economic and Social Research, University of Melbourne, and Institute for the Study of Labor (IZA); email: [email protected] bAustralian National University, RWI, and Institute for the Study of Labor (IZA); email: [email protected] c University of Otago and Institute for the Study of Labor (IZA); email: [email protected] d Corresponding author: Department of Economics, University of Otago, PO Box 56, Dunedin, New Zealand, Phone: 64 3 479 8654.
1
Introduction
There is a clear nexus between a nation’s educational outcomes and its economic growth rate.
However, it is not educational attainment per se but rather what students actually know—as
measured by international standardized tests—that is important for economic growth (see
Fuchs and Wößmann 2007; Hanushek and Wößmann 2011 for reviews). Relatively small
improvements in cognitive skill levels can therefore translate into substantial improvements
in a population’s future well-being (Hanushek and Kimko 2000; OECD 2010a). This
distinction between the quality versus quantity of education is critical because policies
designed to increase educational attainment may not be the same ones that improve student
achievement. It is perhaps not surprising then that researchers are increasingly turning to
cross-country analyses of standardized cognitive-skills tests to understand which educational
policies and which institutional arrangements lead to the best student outcomes (e.g., Bishop
1997; de Heus and Dronkers 2010; Fuchs and Wößmann 2007; Hanushek and Wößmann
2011; Schneeweis 2010; Schütz et al. 2005; 2007; Van de Werfhorst and Mijs 2010).
Against this backdrop, there are several reasons to be concerned about the tendency
for migrants in many countries to underperform on cognitive-skills tests.1 First, successful
integration into the educational system is a particularly salient issue for the millions of
children growing up in migrant families. Many European countries are experiencing serious
problems in integrating migrants and their children (see Algan et al. 2010), while the U.S.
educational system is struggling to cope with a sharp increase in the proportion of students
who are “English Language Learners” (Fix and Capps 2005). Second, educational disparities
tend to persist across generations, which can severely limit intergenerational income mobility
(see Solon 2004; d’Addio 2007). Thus, the long-term economic and social integration of
migrant communities is directly linked to their ability to make effective human capital
investments and to pass these investments on to future generations. Finally, economic growth

2
rates will be lower—and improvements in living standards slower—if education systems
within host countries are not effective in fully developing the skills and talents of migrant
children.
This paper contributes to this emerging literature on the role of education policies
and institutions in student achievement by carefully analyzing cross-national differences in
the nativity gap in cognitive-test scores.2 Our objective is to understand which education
systems, policies, and institutions are most effective in promoting the cognitive development
and educational integration of migrant youths. To this end, we take advantage of Programme
for International Student Assessment (PISA) data for 2009 that provide us with standardized
math, science and language test scores for migrant and native-born students nearing the end
of compulsory schooling across a range of countries. The PISA data are designed to measure
broad competencies rather than understanding of the specific school curriculum, and are
therefore useful in understanding the extent to which students have acquired the knowledge
and skills that are essential in adulthood.
We conduct separate analyses for those migrant students who do and those who do
not speak the host-country language at home, in order to account for the critical role of
language in the formation of cognitive skills. Students with a migration background are also
differentiated by their age at migration in order to account for the point at which they entered
the host-country educational system. We then utilize a number of macro indicators capturing
the nature of immigration policy and educational systems within each host country to shed
light on the policies and institutional arrangements that are most effective in facilitating the
educational integration of migrant youths.
Our focus on migrant youths’ age at migration is fundamental to developing a deeper
understanding of the pathways through which educational institutions matter and of the
critical importance of language skills in achieving the educational integration of migrant

3
children. At its most basic level, age at migration drives the combination of educational
institutions to which children are exposed. Children arriving after age five, for example, miss
out on any benefits associated with attending preschool in the host country. Those arriving
during their high school years do not receive the intensive instruction in numeracy and
literacy skills that they would have received in primary school. These gaps are important, as
many researchers have argued that proficiency in the national language is critical if children
with a migration background are to close the cognitive-skills gap vis-à-vis other children (for
example, Dustmann, et al. 2011; Schneeweis 2010). There appears to be a critical age—
consistent with critical periods in language acquisition—beyond which child migrants face a
much greater risk of not completing high school (Corak 2012; Beck et al. 2012). Similarly,
Washbrook et al. (2011) argue that cross-country differences in cognitive outcomes during
the teen years have their roots in vocabulary deficits in early childhood, which are either
ameliorated or amplified by public policy in the intervening years. The strength of these
public policy effects almost certainly rests on the length of time children are exposed to them.
Finally, differentiating migrant children by their age at arrival is useful in identifying why
some educational institutions appear to have heterogeneous effects on children from different
backgrounds (see Ammermüller 2005; Schneeweis 2010; Van de Werfhorst and Mijs 2010;
Washbrook et al. 2011).
We find that achievement gaps are larger for migrant youths who arrive at older ages
and for those who do not speak the test language at home.3 Institutional arrangements often
serve to mitigate the achievement gaps of some migrant students while leaving unaffected or
exacerbating those of others. For example, earlier school starting ages help migrant youths in
some cases but by no means in all. Limited tracking on ability appears beneficial for
migrants’ relative achievement, while complete tracking and a large private school sector
appear detrimental. Migrant students’ achievement relative to their native-born peers suffers

4
as educational spending and teachers’ salaries increase, but improves when examination is a
component of the process for evaluating teachers.
In Section 2, we discuss the link between educational institutions and the relative
achievement of students with a migration background. The details of the PISA data,
estimation sample, achievement test scores, and institutional measures are presented in
Section 3. Our estimation approach is outlined in Section 4. Section 5 documents the
association between age at migration, the language spoken at home and institutional
arrangements on the one hand, and the nativity gap in student achievement on the other.
Finally, our conclusions and suggestions for future research are discussed in Section 6.
Educational Integration: Which Institutions Matter?
Institutional arrangements matter for economic and social outcomes because they set the
incentives for economic agents and define the constraints under which they will operate. In
their review of prior studies, Fuchs and Wößmann (2007) identify several key features of
educational systems that have been theorized to impact on the quality of education. These
include: (1) the balance of public versus private financing and provision; (2) the
centralization of financing; (3) external versus teacher-based standards and examinations; (4)
centralization versus school autonomy in curricular, budgetary and personnel decisions; and
(5) performance-based incentive contracts.4
Cross-national studies of students’ performance on standardized, cognitive-skills tests
confirm that the institutional arrangements underpinning educational systems have major
implications for both student achievement and the degree of intergenerational persistence in
educational attainment. Curriculum-based external exit exams are associated with improved
student achievement (Bishop 1997), for example. In general, student performance appears to
be enhanced by a combination of (1) centralization of examinations and control mechanisms;
5
(2) school and teacher autonomy (over hiring, teaching methods, etc.); (3) limitations on
teachers’ unions; and (4) competition from private schools (Schütz et al. 2007; Wößmann
2007). Moreover, intergenerational mobility in educational attainment is promoted by earlier
school starting ages and later tracking on ability (Bauer and Riphahn 2007; 2009). Together
these results imply that that the way we choose to organize and fund schools has profound
implications for economic growth, living standards, intergenerational equity, and social
justice.
Researchers have turned their attention to understanding the ways that international
differences in the organization of educational systems affect the educational achievement of
migrant children specifically. Schools do not appear to function equally well for immigrant
and native children. In Germany, for example, the children of immigrants and foreigners
receive less education, are on less favorable education tracks, and have increasing difficulty
in accessing vocational training (Gang and Zimmerman 2000; Frick and Wagner 2000).
Educational attainment is also lower among immigrant youths in the Netherlands (Van Ours
and Veenman 2003) and Denmark (Nielsen et al. 2003), while immigrant youths have an
educational advantage in Canada (Aydemir et al. 2008) and Australia (Cobb-Clark and
Nguyen 2010). Not surprisingly, the educational achievement of migrant children is closely
tied to the educational background of their parents (see Dustmann et al. 2011), leaving
selective immigration policy a major driver of cross-national differences in migrant
children’s relative educational achievement.
At the same time, researchers are working hard to find the link between educational
outcomes for immigrant youths and the institutional design of national education systems
themselves. Nolan (2009), for example, argues that second-generation youths achieve better
educational outcomes in countries in which (1) there is a large tertiary sector5 with easy
access to higher education; (2) face-to-face contact is greater in terms of time; (3) the

6
emphasis on homework is lower; and (4) more resources are provided for youths with
learning problems, particularly language difficulties. Similarly, Schneeweis (2010) finds that
the educational integration of migrant children is facilitated by preschool education, increased
hours of instruction, and, at least for science, central (rather than local) examination of
student outcomes.
There is little doubt that language acquisition is essential to children’s educational
achievement. In particular, literacy skills are the bedrock for building competency in math,
science, social studies, etc. Many migrant children face an extra hurdle as they work to
develop their skills in not one but two languages. It is perhaps not surprising that migrant
children who speak the host-country language at home generally have an educational
advantage over those who do not (e.g., Dustmann et al. 2011; Schneeweis 2010; Washbrook
et al. 2011).
Economists studying the production of cognitive skills have begun to draw on the
insights from developmental psychology, and they increasingly model cognitive achievement
as a process that is cumulative, dependent on parents’ and schools’ investments, and sensitive
to critical periods in a child’s development (e.g. Cunha and Heckman 2008; Cunha et al.
2010; Todd and Wolpin 2003; 2006). Insights from this emerging literature are especially
important for understanding migrant children’s educational outcomes. In particular, Corak
(2012) notes that second-language acquisition is firmly rooted in the idea of “critical”
periods. Although the exact age at which any critical period might occur is subject to debate,
“in general second-language competencies deteriorate for immigrants with age at arrival”
(Corak 2012, 8).6 This raises the possibility that critical periods in children’s language
development may manifest themselves as critical periods in other domains. In particular,
children migrating to Canada or the United States after age nine have a substantially higher
risk of not completing high school, which has important consequences for integration into

7
host-country society (Beck et al. 2012; Corak 2012). These differences in the migration
experiences of children make it vital to focus specifically on children’s ages at migration
when assessing their educational integration.
Literacy skills are not only critical for the development of competency in other
areas, but they are also central to measuring both cognitive skills and academic achievement.
Success on standardized achievement tests like PISA, for example, relies heavily on the
ability to read and write, making it difficult to separate language proficiency from overall
academic ability. Akresh and Akresh (2010) find that the foreign-born children of Hispanic
immigrants who were randomly allowed to take a standard language achievement test in
Spanish scored substantially higher than their peers who took the test in English. U.S.-born
children of Hispanic immigrants, on the other hand, did significantly better if they were
randomly assigned to take the test in English rather than Spanish. The authors conclude that a
substantial portion of the Hispanic-white test gap in math and reading can be explained by
test-score language bias. Similarly Washbrook et al. (2011) find that the young children of
immigrants underperform in vocabulary tests despite exhibiting no differences in behavior or
in nonverbal cognitive skills. Taken together, these results suggest that achievement tests and
other cognitive skill measures, which are heavily reliant on literacy skills, may present a
distorted picture of migrant children’s overall competency. Unfortunately, this may have
long-term consequences, as children who score poorly on achievement tests are often tracked
into lower-level classes or less selective secondary schools (see Akresh and Akresh 2010).
Finally, it is important to note that host-country educational systems and social
policy institutions may either accentuate or mitigate the particular challenges that migrant
children face. Migrant children seem to fare better in English-speaking countries like
Australia, Canada, New Zealand, the United Kingdom, and the United States, particularly
when they have strong English language skills (e.g. Schneeweis 2010; Dustmann et al.

8
2011).7 It is difficult to know whether this occurs because English has emerged as a dominant
international language or because these countries have long histories of receiving—and
therefore integrating—immigrants. The disparity in educational integration within English-
speaking countries strongly suggests that immigration policy also plays an important role.
Australia, and to a lesser extent Canada, explicitly select immigrants on the basis of their
educational qualifications and language skills. Children with a migration background in these
countries have parents who are generally highly educated and speak the national language at
home—advantages that are reflected in the vocabulary test scores of very young migrant
children (Washbrook et al. 2011).
Data
OECD Programme for International Student Assessment (PISA)8
The OECD Programme for International Student Assessment (PISA) is an internationally
standardized assessment that was jointly developed by participating countries and
administered to 15-year-olds in schools. The survey was administered in 43 countries in 2000
(first cycle), 41 countries in 2003 (second cycle), 57 countries in 2006 (third cycle), and 67
countries in 2009 (fourth cycle). In each country, tests are typically administered to between
4,500 and 10,000 students from at least 150 schools (OECD 2009).9 PISA assesses the extent
to which students near the end of compulsory education have acquired the knowledge and
skills that are essential for full participation in society. In all cycles, reading, mathematics and
science are covered not merely in terms of mastery of the school curriculum but in terms of
important knowledge and skills needed in adult life.
Each student takes a two-hour handwritten test. The test include multiple-choice items
and questions that require students to construct their own responses. The items are organized
in groups based on a passage setting out a real-life situation. In total there are six and a half

9
hours of assessment material, but each student is not tested on all the parts. Following the
cognitive test, students also answer a background questionnaire that takes 20 to 30 minutes to
complete and provides information about themselves and their homes. Finally, school
principals are given a 20-minute questionnaire about their schools.
In this paper, we examine data from the most recent cycle of PISA undertaken in
2009. As in the initial cycle, the 2009 PISA focuses on reading literacy. We present results
for this domain along with those for mathematics and scientific literacy. Because we are
concerned with the role of immigration policies and educational institutions in explaining the
relative performance of migrant youths, we restricted our analysis to OECD countries in
order to eliminate sharp differences in political institutions or level of development.10
Analysis sample
We further restrict our analysis sample by dropping a small number of students (841 out of an
initial sample of 298,454) who lack information on age, gender, or school grade. We also
drop 6,131 students who lack country-of-birth information or who do not have country-of-
birth information for at least one parent. Finally, we drop 2,372 students who are foreign-
born but have no foreign-born parents, as they are likely to be a particularly
nonrepresentative group. We then classify all remaining students into the following three
groups: (1) native-born: those born in the country where the test was given who have no
foreign-born parents; (2) first-generation migrant: those not born in the country where the test
was given who have at least one foreign-born parent; and (3) second-generation migrant:
those born in the country where the test was given who have at least one foreign-born parent.
First-generation migrant youths are then further classified into three groups based on
their age at arrival: up to 4, 5–10, and 11–15. These age groups are chosen to correspond to
the major school transition ages in most OECD countries. Because age at arrival is missing
for 1,054 first-generation migrants, we are forced to drop these from the sample.11 These

10
restrictions result in a sample of 238,023 native-born, 14,818 first-generation migrant and
35,215 second-generation migrant students across 34 OECD countries.
Table 1 describes our final analysis sample. Sample sizes range from 3,451 for
Iceland to 36,829 for Mexico, with a total sample size of 288,056. Overall, 82.6 percent of
students are native-born, 5.1 percent are first-generation migrants and 12.2 percent are
second-generation migrants. Among the OECD countries, Luxembourg has the largest
proportion of first- and second-generation migrants, at 57 percent, followed by Australia and
Switzerland at 42 percent and New Zealand at 41 percent. Korea has the smallest proportion
of migrants at 0.3 percent, followed by Poland at 0.6 percent and Japan at 1.1 percent.
Table 1 about here
Measuring PISA Test Scores
PISA includes five plausible values for each test score based on random numbers drawn from
the distribution of scores that could be reasonably assigned to each individual, that is, the
marginal posterior distribution. This is a statistical method for recognizing that a student’s
performance on any individual assessment is somewhat random (see Adams and Wu 2002 for
technical details). We derive mean test scores by averaging the plausible values in the data.
The test scores are standardized across countries so that scores in each domain have a mean
of 500 and a standard deviation of 100. In our regression analysis, we restandardize test
scores in each domain to have a mean of zero and a standard deviation of 1 across our
analysis sample in order to facilitate the interpretation of regression coefficients, which now
represent standard deviation changes in the outcome of interest.
Table 2 presents the distribution of these test scores across countries by nativity and,
for migrants, by language spoken at home. The results reveal that native-born students have
considerably higher test scores than both first- and second-generation migrants in most
countries, particularly when migrants do not speak the test language at home. That said, there
11
are a few countries, specifically Australia, Hungary, Turkey, where it is only first-generation
migrant youths not speaking the test language at home who do not outperform native-born
youths, and others like Canada where the nativity achievement gap is relatively small across
the board. Test score gaps are generally similar across the three domains.
Table 2 about here
Measuring educational institutions
Our objective is to understand how institutional arrangements affect the nativity achievement
gap across countries. We pay particular attention to the way educational systems are
organized, because the design of education policies may affect the performance of native-
born and migrant youths differently. In addition, we control for variations in economic and
demographic characteristics that are associated with the size and educational composition of
immigrant populations and that may determine the educational achievement of migrant
youths. In our analysis, the effect of institutional arrangements on educational achievement is
captured through the inclusion of a series of country-level variables describing the education
system in our regression model. These variables were generated using external country-level
data.
Specifically, we generate variables for the primary school starting age (in years), the
total duration of primary and secondary education (in years), and public spending on
education as a percentage of gross domestic product (GDP), using data from the 2011 World
Development Indicators and Global Development Finance Databank of the World Bank. We
also generate the proportion of students in upper secondary education enrolled in public
schools and average teachers’ salaries (lower secondary education) after 15 years of
experience/minimum training (in equivalent U.S. dollars adjusted for purchasing power
parity, or PPP) using data from OECD (2010b). To obtain a measure of the relative income
position of teachers, we divide their salaries by real GDP per capita (based on PPPs) using
12
data from the World Economic Outlook database of the International Monetary Fund (IMF).
We further use data from OECD (2007) to generate the age at which students are first tracked
(selected) on ability in the education system, the existence of standards-based external
examinations, and the percentages of students in schools in which the principal reported that
achievement data were being used to evaluate teachers’ performance and there was ability
grouping for some or all subjects.
In addition to this set of variables describing educational systems, we also control for
a country’s economic and demographic characteristics by including the number of
immigrants as a percentage of the national population (using data from the United Nations
2005; 2006), the Gini coefficient on income (using data from the World Bank Development
Research Group and Statistics Iceland), and the logarithm of the GDP per capita measure
mentioned above. Table 1 of the appendix shows how institutional arrangements vary by
country.
These are of course not the only features of educational systems that might be of
interest. In particular, we are not accounting for diversity within schools or the way that
children are allocated to schools. Diversity measures are notoriously difficult to calculate and
interpret. Our more parsimonious specification allows us to focus on the substantive
differences in institutional arrangements.
The Estimation Model
Our empirical analysis of students’ test scores begins with a linear regression model of the
following form:
1 2 3 4
1,..., , 1,...., , 1,...., ,isc o isc isc isc isc c iscT M A E X
i N s S c C
(1)
where T is the reading, math or science test score of student i in school s of country c. M
includes four population indicators that identify our three groups of first-generation migrants
13
(i.e. those migrating at up to age four, age 5–10, and age 11–15) and the group of second-
generation migrants. Additionally, M includes interactions between these four population
indicators and an indicator variable for whether or not the student speaks the test language in
a particular country at home. In other words, there are a total of eight migrant groups whose
outcomes are then compared to those for native-born youths.
Our estimation model also includes a set of age (measured in months) and gender
indicators (A). Moreover, we account for the effects of immigrant selection across countries
by controlling for variables related to immigrant parents (E). Specifically, E contains the
highest parental education in years, a variable indicating whether parental education is
missing or not, and an indicator for whether or not migrant youths have two (versus one)
foreign-born parents. We also include a vector of additional individual-specific control
variables denoting the household composition, occupational status and employment status of
the parents, home possessions, home educational resources, home computer possession,
cultural possessions and the number of books at home (X).
Our regression model also includes country-specific fixed effects (αc). These capture
the direct impact of country-specific institutional arrangements on overall educational
achievement in each country as well as any remaining country-specific factors that influence
test scores for both native-born and migrant youths. We refer to equation (1) as our baseline
model. In order to gauge the sensitivity of our results to alternative sets of controls, we also
present and discuss the results of more parsimonious models in Section 5.1.
Our baseline model is useful in helping us understand the nativity achievement gap in
OECD countries between students with the same demographic characteristics, family
background, and home environment. It does nothing to shed light on the role of institutional
arrangements in facilitating (or hindering) migrant students’ relative academic achievement
because any effects of host-country institutions are subsumed in the country-specific fixed
14
effects. It is not possible to account for the effect of institutions on overall student
achievement by adding country-level institutional controls directly to equation (1), since
these controls would be perfectly collinear with the country-specific fixed effects. We can,
however, account for the role of institutions in influencing the relative achievement of native-
born and migrant students. Specifically, we estimate the following model:
1 2 3 4 5
1,..., , 1,...., , 1,...., ,isc o isc isc isc isc isc c c iscT M A E X M I
i N s S c C
(2)
where our country-level variables describing immigration policy and the education system
are captured by the variable vector I. We interact the full set of country-level variables with
our population indicators (M), with native-born youth as the omitted category. Hence, the
coefficients in the vector β5 are interpreted as the differential impact that each country-level
characteristic has on test scores for migrant students arriving at different ages and with
different languages spoken at home relative to the impact each characteristic has on test
scores for native-born students. We refer to equation (2) as our full model. Selected results
from this model are presented and discussed in Section 5.2.
Hanushek and Wößmann (2011) argue that the main challenge in identifying the
causal effects of host-country institutions on educational outcomes is the likely presence of
unobserved country-specific effects that are correlated with student achievement. In principle,
this problem can be overcome with the inclusion of country-specific fixed effects, as we have
done in equations (1) and (2). At the same time, we believe that an equally challenging
problem results from the fact that policy formation itself is almost certainly endogenous. That
is, educational policy typically changes in response to a perceived shortcoming in student
achievement rather than exogenously. There is no straightforward solution to this
endogeneity problem when relying upon observational data. Thus, we interpret our estimates
as descriptive rather than causal.
15
Results
The nativity test-score gap and age at migration
Baseline estimates of the average nativity test-score gap by migrants’ age at migration and
language spoken at home are presented in Table 3. We consider three alternative
specifications, each increasing in controls, as follows: (1) Specification A controls only for
students’ gender, students’ age at the time they took the test, and country-specific fixed
effects; (2) Specification B adds the controls for parents’ education (E); and (3) Specification
C is the baseline model given in equation (1). The first three columns capture the test-score
gap between native-born youths on the one hand and first-generation migrant youths who
speak the test language at home on the other hand. The next three columns reflect the test-
score gap for first-generation migrants not speaking the test language at home, while results
for second-generation migrant youths are presented in the final two columns. Given the
parameterization of PISA test scores (see above), all nativity achievement gaps are expressed
in terms of standard deviations.
Table 3 about here
When we control only for students’ gender and age and country fixed effects
(Specification A), we find that, on average, student achievement gaps in OECD countries are
wider for migrant youths who arrive at older ages and for those who do not speak the test
language at home. In particular, migrant youths arriving in the host country at age four or
younger have reading scores at age 15 that are 0.120 standard deviations lower than their
native-born counterparts if they speak the test language at home and 0.225 standard
deviations lower if they do not. The reading gap for second-generation students speaking the
test language at home is smaller but still statistically significant (0.075 standard deviations),
while the reading achievement gap for second-generation students not speaking the test

16
language at home is more than five times as large. All of these gaps are statistically
significant.
The nativity gap in reading achievement increases sharply with migrant youths’ ages
at migration, whether or not the test language is spoken at home. In particular, the reading
gap among youths who migrated in their primary-school years (ages 5–10) increases to 0.220
standard deviations if they speak the test language at home and to 0.331 standard deviations if
they do not. For those migrating during their high school years (ages 11–15), the reading
achievement gap is larger still. Increased exposure to the host-country educational institutions
is clearly associated with smaller gaps in reading achievement. This relationship between age
at migration and relative reading achievement provides one potential explanation for the
increased risk of dropping out of high school that is observed for those youths migrating after
age nine (see Beck et al. 2012; Corak 2012).
Consistent with previous evidence (Dustmann et al. 2011; Schneeweis 2010;
Washbrook et al. 2011), reading achievement gaps are much larger for youths who do not
speak the test language at home: 0.747 standard deviations versus 0.310 if migrating after age
10, for example. Importantly, these gaps persist into the second generation. In particular,
second-generation migrant youths who do not speak the test language at home have a reading
achievement gap that is similar in size to that of otherwise similar first-generation migrants
who arrive during their primary-school years.
Nativity achievement gaps in math and science in OECD countries are strikingly
similar to that in reading. In fact, only first-generation migrant youths arriving after age 10
and not speaking the test language at home have reading achievement gaps (0.747 standard
deviations) that are larger than their achievement gaps in math (0.553 standard deviations)
and science (0.700 standard deviations). In almost all other cases, the nativity achievement
gap is wider in math and science than it is in reading. It is difficult to know whether this

17
relative underperformance of migrant youths in math and science, however, reflects
differences in academic achievement or language competency.12 Math and science
achievement gaps also widen for youths who have less exposure to host-country educational
institutions and fewer opportunities to speak the host-country language. As was the case for
reading achievement, there remains a sizeable achievement gap in both math and science
among second-generation students who do not speak the test language at home.
The intergenerational persistence in educational achievement and attainment in
OECD countries has been well documented (see d’Addio 2007). As immigrants in many
OECD countries have less education than their native-born counterparts, it is not surprising
then that the gaps in migrant youths’ reading, math, and science achievement all fall
substantially once we account for their parents’ lower levels of education (Specification B).
Achievement gaps across the three domains are virtually eliminated for first-generation
migrants arriving before age 11 and for second-generation migrants once we account for
parental education.13 However, migrant youths who arrive at ages 11 through 15 continue to
experience a gap in reading achievement at age 15 of 0.242–0.564 standard deviations. Gaps
in math and science competency are similar. Interestingly, parental education does little to
mitigate the penalty associated with very late migration. Those youth migrating at ages 11
through 15 remain between a fifth and a half standard deviation behind their native-born
peers whether or not we control for parental education. It is possible that this gap results from
the limited exposure that these young people have had to host-country schools. At the same
time, it is possible that there is a negative selection effect. Families may be prepared to
migrate with adolescent children only if those children are not particularly academically
oriented.
In addition to accounting for parental education, it is important to account for the
extent to which young people’s families are able to support their human capital development.

18
To this end, our full model (Specification C) adds a number of controls that are designed to
capture the effect of young people’s socio-economic background (e.g. parents’ occupational
and employment status), household structure, and educational resources at home
(possessions, books, computers, educational resources, etc.) on their reading, math, and
science achievement.
Accounting for young people’s family background often eliminates—and in some
cases reverses—their achievement gaps. Immigrant youths arriving in the host country before
age 11 are estimated to have significantly higher math achievement (approximately 0.15
standard deviations) at age 15 than do their native-born peers. Only immigrant youth arriving
in the host country during the four years before PISA tests are administered and not speaking
the test language at home continue to have a significant gap in achievement levels: 0.142
standard deviations (math) and 0.402 (reading). In virtually all other cases, accounting for the
effect of family background in addition to parental income is sufficient to eliminate the
nativity achievement gap.14
Overall, these results are consistent with the substantial international literature that
demonstrates the importance of parental education and family resources in promoting
children’s educational achievement. Much of the achievement gap experienced by immigrant
youths in OECD countries is by and large the result of their relatively disadvantaged
circumstances. At the same time, it is clear that the extent of the achievement gap narrows as
youths gain more exposure to host-country schooling and have more opportunities to speak
the test language. There is a substantial achievement penalty, particularly in reading,
associated with delayed migration for those not speaking the test language at home, even
after we account for the parental education and family background.

19
The nativity test-score gap and educational institutions
We turn now to consider how the design of OECD countries’ educational systems is related
to the relative educational achievement of migrant students. In Table 4 (reading), Table 5
(math), and Table 6 (science), we present the estimated effects from a single regression
model where each of our country-level educational controls is interacted with our population
indicators (M*C). This allows us to assess whether specific institutional arrangements are
associated with either an increased or a reduced nativity achievement gap in reading, math, or
science. Although the coefficients are not presented here, the regression model in each case
also controls for students’ demographic characteristics (A), parental education (E), family
background effects (X) and country fixed effects (see equation (2). Finally, as before, the
parameterization of the PISA test scores implies that all nativity achievement gaps are
expressed in terms of standard deviations. Negative values imply that a particular institution
is associated with lower achievement among migrant students relative to their native-born
counterparts (i.e., migrant students are disadvantaged), while positive values imply the
opposite.
Tables 4 - 6 about here
Migrant students’ relative achievement at age 15 is related to the host-country’s
school starting age. These effects, however, differ by the age at which migrant youths arrive
and the specific domain under consideration. Migrant students’ relative achievement is not
significantly different in school systems with early (i.e., age five and younger versus standard
school starting ages (i.e., age six).15 Migrant students’ relative academic achievement often
suffers, however, in educational systems with older school starting ages (i.e., age seven),
particularly when they do not speak the test language at home. For example, first-generation
migrant students who do not speak the test language at home experience an additional
achievement penalty (relative to native-born students) for starting school late, on the order of
20
0.2 to 0.3 standard deviations. This is perhaps not surprising in light of evidence that an
earlier school starting age facilitates intergenerational mobility in educational attainment
(Bauer and Riphahn 2007; 2009). We might expect, then, that starting school at an older age
would be especially problematic for youths who, like their parents, are themselves
immigrants and do not have the advantage of speaking the test language at home.
At the same time, the effect of school starting age on migrant students’ relative
achievement varies in complex ways across achievement domains and with migrants’ age at
arrival. The additional penalty associated with starting school late is largest in science, for
example, for first-generation students who do not speak the language at home and who arrive
young (0.308 standard deviations; see Table 6), while the largest penalty is in reading for
those who arrive older (0.364 standard deviations; see Table 4). Starting school at older ages
generally exposes first-generation migrants who speak the test language at home and arrive at
age four or younger to an additional (relative to the native-born) achievement penalty, but
gives those who arrive at ages 11 through 15 an additional achievement benefit. Finally, we
find no significant effect of differences in the years of compulsory schooling on the relative
reading, math, or science achievement of migrant students.16 Taken together, these results
indicate that additional exposure to host-country schooling benefits certain groups of migrant
youth in some cases—as might be expected—but by no means in all.
The way that schools are organized and classes are formed may also affect migrant
students’ relative performance. In particular, educators often argue that educational outcomes
can be improved if students’ are tracked (streamed) on ability, yet the concern is that
extensive tracking may disadvantage migrant students who may not have the same access to
selective schools or enriched classes as their native-born peers.17 Interestingly, we find that,
across OECD countries as a whole, in many cases migrant students’ relative academic
performance is positively (rather than negatively) related to the extent of ability tracking in

21
the educational system. For example, earlier tracking on ability is associated with a small
improvement in the relative reading, math, and science achievement of first-generation
migrant youths who arrive during their preschool years and speak the test language at home.18
The same is true for first-generation migrant students arriving at ages 11 through 15 who do
not speak the test language at home. The fact that these two very different groups of migrant
students both benefit from being in educational systems that track students earlier is
interesting and may point to the importance of migrants’ having access to both remedial and
extended instruction.19
Importantly, however, while some ability tracking (relative to no ability tracking) has
additional achievement benefits for some migrant students, the reverse is occasionally true of
complete ability tracking, i.e., tracking in all subjects. Moreover, second-generation migrants’
relative math achievement rises with the proportion of upper-secondary students who attend
public schools. On balance then, while some amount of tracking on ability seems to be
associated with improvements in migrants’ relative academic achievement, complete
tracking—either across all subjects within schools or across the public-private school
divide—is often associated with lower relative achievement levels for migrants.
We now consider how school resources and funding levels are related to migrant
students’ relative academic achievement across the OECD. Interestingly, we find no
significant relationship between income levels (as measured by GDP per capita) and migrant
students’ relative achievement in OECD countries.20 Controlling for per capita income,
however, the association between academic achievement and increased educational
expenditure (as a percent of GDP) is often significantly weaker for migrant students than it is
for native-born students. For example, in countries with twice the education spending (as a
percentage of GDP) the reading achievement of second-generation migrants relative to
similar native-born students is between 0.304 (speak the test language at home) and 0.680 (do
22
not speak the test language at home) standard deviations lower than for those migrant
students in countries with less educational expenditure. Similarly, the link between
achievement and higher teacher salaries is also significantly weaker for many migrant groups
than it is for native-born students. To the extent that outcomes are better in countries that
place greater emphasis on educational spending generally and teachers’ salaries in particular,
this implies that migrant students benefit less from this additional expenditure.
The degree of accountability in an educational system has also been linked to
educational outcomes (see Hanushek and Wößmann 2011 for a review). It is often argued
that external examinations of students provides an important signal of students’ overall
competency to potential employers, which can increase the incentives to invest in education.
Teacher assessments, on the other hand, may be useful in ensuring teacher quality. We find
that the link between external examinations and student achievement is in most cases not
statistically different for native-born and migrant students. Where we do find significant
effects, they are often negative, though not always. This is consistent with Schneeweis
(2010), who also finds that external examinations have a mixed association with the
educational integration of migrant youths. At the same time, migrant students’ achievement
relative to their native-born peers improves when examinations are a component of the
process for evaluating teachers. In particular, the effect of exam-based teacher evaluation on
achievement is larger for reading (0.261 standard deviations), math (0.43 standard
deviations), and science (0.347 standard deviations) for first-generation migrant youths who
speak the test language at home and who arrive before the start of primary school than it is
for native-born students.
Finally, migrant youths’ relative academic achievement is related to the wider social
context. In particular, migrant students’ relative academic achievement is enhanced in
countries with proportionately larger foreign-born populations. These countries may simply

23
have more experience in successfully integrating migrant youth into the educational system.
While Schneeweis (2010) suggests that higher levels of income inequality reduce the
educational integration of migrant students, we believe that the story is more nuanced. The
relative achievement gap of first-generation migrant students arriving at younger ages
(through age four) and speaking the test language at home is lower in countries with higher
income inequality (as measured by the Gini coefficient). The opposite is true for similar
migrant students who arrive at older ages (11–15).
Conclusions
The International Organization for Migration estimates that 214 million individuals—many
of them children—are living outside their country of birth.21 Many more children, while born
in the host country, are nonetheless touched by the migration experiences of their parents.
The successful integration of these first- and second-generation migrant children is critical to
ensuring that their skills and talents are not wasted but rather contribute positively to future
economic growth and improved living standards. Our goal is to shed light on the institutional
arrangements that are most effective in promoting the cognitive development and educational
integration of children with a migration background.
We find that achievement gaps are wider for those migrant youths who arrive at
older ages and for those who do not speak the test language at home. Both conclusions are
consistent with the emerging literature suggesting that critical periods in children’s language
development may result in critical periods in other competencies (Beck et al. 2012; Corak
2012). We also find that educational systems do not work equally well for native-born and
migrant students, or indeed for all groups of migrant students. Certain institutional
arrangements, for example, earlier school starting ages, appear to reduce the relative
achievement gap for some migrant students while leaving unaffected or exacerbating the
24
relative achievement gap of others. Other arrangements, such as tracking on ability, are
beneficial for migrant students when implemented in a limited way, but become detrimental
when implemented across the board. Finally, what works for native-born students does not
always work for students with a migration background. In particular, migrant students’
achievement relative to their native-born peers falls as proportionately more funding is
devoted to educational spending generally and teachers’ salaries in particular, but improves
when examination is a component of the process for evaluating teachers. These results are
particularly striking given that our country-specific fixed effects allow us to account for the
multitude of ways that OECD countries differ from one another.
These results lead to a number of important conclusions. First, the relationship
between specific institutional arrangements and migrant youths’ relative achievement at age
15 depends in complex ways on the age at which those youths migrated. In effect, the
institutional arrangements that benefit those arriving at younger ages may not provide the
same benefits to those arriving at older ages. This implies that we need to know more about
what works and why in order to design educational institutions that are sufficiently flexible.
Second, the disparity in results between migrant youths who do and do not speak the
language at home implies that the effectiveness of particular institutional arrangements may
be sensitive to students’ underlying language abilities. This is perhaps not surprising given
the critical role of language in supporting learning across all domains. It does, however, pose
real challenges for educators as they attempt to target interventions and resources toward the
migrant students who need them most. Finally, one might expect that the academic
achievement of second-generation migrant youths who speak the test language at home
would be no different to that of their native-born peers. This is not always the case, however.
Having migrant parents appears to pose additional challenges for second-generation youths
who are not associated with their own personal migration experience or with their parents’
25
educational attainment, their family background, or the language spoken at home. This raises
the possibility that the way that migrant parents interact with and access their children’s
schools may be fundamentally different from otherwise similar native-born parents.
References
Adams, Ray, and Margaret Wu. 2002. PISA 2000 Technical Report. Paris: OECD.
Akresh, Richard, and Ilana Redstone Akresh. 2010. Using achievement tests to measure
language assimilation and language bias among the children of immigrants. Journal of
Human Resources 46 (3):647-667.
Ammermüller, Andreas. 2005. Educational opportunities and the role of institutions. In Paper
Series at IDEAS [database online]. St. Louis, MO: Economic Research: Federal
Reserve Bank of St. Louis. Available from: www.research.stlouisfed.org (accessed 6
January 2012).
Aydemir, Abdurrahman, Wen-Hao Chen, and Miles Corak. 2008. Intergenerational education
mobility among the children of Canadian immigrants. In Education, training and
learning [database online]. Ontario, Canada: Statistics Canada. Available at
www.statcan.gc.ca (accessed 6 January 2012)
Algan, Yann, Christian Dustmann, Albrecht Glitz, and Alan Manning. 2010. The economic
situation of first- and second-generation immigrants in France, Germany, and the
United Kingdom. Economic Journal 120 (542):F4–F30.
Bauer, Philipp, and Regina T. Riphahn. 2007. Heterogeneity in the intergenerational
transmission of educational attainment: Evidence from Switzerland on natives and
second-generation immigrants. Journal of Population Economics 20 (1):121–148.
Bauer, Philipp, and Regina T. Riphahn. 2009. Age at school entry and intergenerational
educational mobility. Economics Letters 103 (2):87–90.

26
Beck, Audrey, Miles Corak, and Marta Tienda. 2011. Age at immigration, social identity, and
the adult attainments of child migrants in the United States and Canada. Paper
presented at the INSIDE Conference, 27 June-28 June 2011. Barcelona, Spain.
Bishop, John, H. 1997. The effect of national standards and curriculum-based exams on
achievement. American Economic Review 87 (2):260–264.
Bleakley, Hoyt, and Aimee Chin. 2010. Age at arrival, English proficiency, and social
assimilation among U.S. Immigrants. American Economic Journal: Applied
Economics 2 (1):165-192.
Cunha, Flavio, and James J. Heckman. 2008. Formulating, identifying and estimating the
technology of cognitive and noncognitive skill formation. Journal of Human
Resources 63 (4):738–782.
Cunha, Flavio, James J. Heckman, and Susanne Schennach. 2010. Estimating the technology
of cognitive and noncognitive skill formation. Econometrica 78 (3):883–931.
Cobb-Clark, Deborah, A., and Trong-Ha Nguyen. 2010. Immigration background and the
intergenerational correlation in education. Institute for the Study of Labor (IZA)
Discussion Paper 4985. Bonn, Germany.
Corak, Miles. Forthcoming. Age at immigration and the education outcomes of children. In
The potential of immigrant youth, eds. Ann Masten, Karmela Liebkind and Donald J.
Hernandez. Cambridge, United Kingdom: Cambridge University Press.
d’Addio, Anna Cristina. 2007. Intergenerational transmission of disadvantage: Mobility or
immobility across generations? A review of the evidence for OECD countries. OECD
Social, Employment and Migration Working Paper 2007, Paris, France.
de Heus, Manon, and Dronkers, Jaap. 2010. The educational performance of children of
immigrants in 16 OECD countries: The influence of educational systems and other
societal features of both countries of destination and origin. The Research Centre for

27
Education and the Labour Market (ROA) Working Paper 2010, Maastricht, The
Netherlands.
Dronkers, Jaap. 2010. Positive but also negative effects of ethnic diversity in schools on
educational performance? An empirical test using cross-national PISA data. The
Research Centre for Education and the Labour Market (ROA) Working Paper 2010,
Maastricht, The Netherlands.
Dustmann, Christian, Tommaso Frattini, and Gianandrea Lanzara. 2011. Educational
achievement of second generation immigrants: An international comparison. Centre
for Research and Analysis of Migration (CReAM) Discussion Paper 25, 2011,
London, United Kingdom.
Entorf, Horst. 2005. What a difference immigration policy makes: A comparison of PISA
scores in Europe and traditional countries of immigration. German Economic Review
6 (3):355–376.
Fix, Michael, and Randy Capps. 2005. Immigrant children, urban schools, and the no child
left behind act. In Migration Information Source [online magazine]. Washington, DC:
Migration Policy Institute. Available from www.migrationinformation.org (accessed 6
January 2012).
Frick, Joachim R., and Gert G. Wagner. 2000. Short term living conditions and long term
prospects of immigrant children in Germany. German Institute for Economic
Research Discussion Paper 229, Berlin Germany.
Fossati, Flavia. 2010. The effect of integration on immigrants' school performance: A
multilevel estimate. Center for Comparative and International Studies (CIS) Working
Paper 2010, Zurich, Switzerland.

28
Fuchs, Thomas, and Ludger Wößmann. 2007. What accounts for international differences in
student performance? A re-examination using PISA data. Empirical Economics 32 (2-
3):433–464.
Gang, Ira N., and Klaus F. Zimmermann. 2000. Is child like parent? Journal of Human
Resources 35 (3):550–569.
Hanushek, Eric A., and Dennis D. Kimko. 2000. Schooling, labour force quality, and the
growth of nations. American Economic Review 90 (5):1184–1208.
Hanushek, Eric A., and Ludger Wößmann. 2008. The role of cognitive skills in economic
development. Journal of Economic Literature 46 (3):607–668.
Hanushek, Eric A., and Ludger Wößmann. 2011. The economics of international differences
in educational achievement. In Handbook of the economics of education, volume 3,
eds. Eric A. Hanushek, Stephen Machin, and Ludger Wößmann, 89–200. San Diego:
Elsevier, B.V.
Levels, Mark, and Jaap Dronkers. 2008. Educational performance of native and immigrant
children from various countries of origin. Ethnic and Racial Studies 31 (8):1404–
1425.
Nielsen, Helena S., Michael Rosholm, Nina Smith, and Leif Husted. 2003. The school-to-
work transition of 2nd generation immigrants in Denmark. Journal of Population
Economics 16 (4):755–786.
OECD. 2007. PISA 2006: Volume 2 – Data. Paris: Organisation for Economic Co-operation
and Development (OECD).
OECD. 2009. PISA .2009 Assessment framework – Key competencies in reading,
mathematics, and science. Paris: Organisation for Economic Co-operation and
Development (OECD).
29
OECD. 2010a. The high cost of low educational performance: The long-run economic
impact of improving PISA outcomes. Paris: Organisation for Economic Co-operation
and Development (OECD).
OECD. 2010b. Education at a glance 2010. Paris: Organisation for Economic Co-operation
and Development (OECD).
Schneeweis, Nicole. 2010. Educational institutions and the integration of migrants. Journal of
Population Economics 24 (4):1281–1308.
Schnepf, Silke Viola. 2007. Immigrants' educational disadvantage: An examination across ten
countries and three surveys. Journal of Population Economics 20 (3):527–545.
Schnepf, Silke Viola. 2008. Inequality of learning amongst immigrant children in
industrialised countries. Institute for the Study of Labor (IZA) Discussion Paper 3337,
Bonn, Germany.
Schütz, Gabriela, Heinrich W. Ursprung, and Ludger Wößmann. 2005. Education policy and
equality of opportunity. Institute for the Study of Labor (IZA) Discussion Paper 1906,
Bonn, Germany.
Schütz, Gabriela, Martin R. West, and Ludger Wößmann. 2007. School accountability,
autonomy, choice, and the equity of student achievement: International evidence from
PISA 2003. OECD Directorate for Education Working Paper, 2007. Paris, France.
Solon, Gary. 2004. A model of intergenerational mobility variation over time and place. In
Generational income mobility in North America and Europe, ed. Miles Corak, 38–47.
Cambridge, United Kingdom: Cambridge University Press.
Todd, Petra E., and Kenneth I. Wolpin. 2003. On the specification and estimation of the
production function for cognitive achievement. Economic Journal 113 (485):F3–F33.

30
Todd, Petra E., and Kenneth I. Wolpin. 2006. The production of cognitive achievement in
children: Home, school and racial test score gaps. University of Pennsylvania
Working Paper, 2006. Philadelphia, PA.
United Nations. 2006. World population policies 2005. Department of Economic and Social
Affairs, United Nations.
United Nations. 2006. International migration. 2006. Department of Economic and Social
Affairs, Population Division. United Nations, United Nations Publication, No.
E.06.XIII.6.
Van de Werfhorst, Herman G., and Jonathan J. B. Mijs. 2010. Achievement inequality and
the institutional structure of educational systems: A comparative perspective. Annual
Review of Sociology 36:407–428.
Van Ours, Jan C., and Justus Veenman. 2003. The educational attainment of second-
generation immigrants in The Netherlands. Journal of Population Economics 16
(4):739–753.
Washbrook, Elizabeth, Jane Waldfogel, Bruce Bradbury, Miles Corak, and Ali Akbar
Ghanghro. Forthcoming. The development of young children of immigrants in
Australia, Canada, the United Kingdom and the United States. Child Development.
Wößmann, Ludger. 2007. International evidence on school competition, autonomy, and
accountability: A review. Peabody Journal of Education 82 (2-3):473-497.

31
Notes
1 See the following for analyses of cross-country differences in the nativity gap in cognitive
test scores: Dronkers (2010); Dustmann et al. (2011); Entorf (2005); Fossati (2010); Levels
and Dronkers (2008); Schneeweis (2010); Schnepf (2007; 2008).
2 The nativity gap refers to the difference in mean test scores for native-born and immigrant
children.
3 The language of the PISA test is typically the language of instruction of the school.
4 See also Hanushek and Wößmann (2011) for a review of studies assessing international
differences in educational achievement.
5 The tertiary education sector encompasses all post-secondary education including
universities and vocational education institutions.
6 Bleakley and Chin (2010) exploit the fact that children learn languages more easily than
adults to construct an instrument for language proficiency based on child immigrants’ age at
arrival. This instrument produces arguably exogenous variation in language proficiency
because children do not choose the timing of their own immigration. The authors use
instrumental variables estimation and find a significant positive effect of English proficiency
on the adult wages of individuals who migrated to the United States as children.
7 In fact, Schneeweis (2010) finds that immigrant children in English-speaking countries have
higher math and science test scores than do otherwise similar native-born children.
8 Much of the background information in this section is taken from the PISA website at
http://www.pisa.oecd.org.
9 In each cycle, a two-stage stratified sampling design is used. A random sample of schools is
selected and then a random selection of students is chosen from each school.

32
10 In particular, PISA also includes developing countries, such as Indonesia, and former
socialist countries, such as Albania.
11 This figure also includes a very small number of individuals who arrived at age 16 in the
country of the exam and hence essentially took the exam immediately after arriving.
12 Achievement gaps are substantially narrower when we do not control for country-specific
fixed effects. This suggests that migrant youth are disproportionately located in countries
where overall achievement in reading, math, and science is higher.
13 The exceptions are that reading and math achievement gaps are small and marginally
significant for: (1) first-generation immigrants arriving between the ages of five and 10 and
speaking the test language at home; and (2) second-generation migrants not speaking the test
language at home. Second-generation migrants not speaking the test language at home also
experience a small and marginally significant gap in science achievement.
14 The exception is that there continues to be a small and marginally significant gap in math
achievement among second-generation immigrants speaking the test language at home.
15 The exception is that starting school at age five or younger (rather than at age six) is
associated with a small additional reading penalty (0.265 standard deviations) for first-
generation migrant children arriving at age four or younger who speak the test language at
home in comparison to the same effect for their native-born peers (see Table 4).
16 Schneeweis (2010) finds that migrant students' relative academic achievement in math and
science would improve with some expansion in annual school hours.
17 In Germany, for example, migrant children are on less favorable education tracks and have
increased difficulty in accessing vocational training (Frick and Wagner 2000; Gang and
Zimmerman 2000).
18 Earlier (versus later) tracking is associated with an improvement in second-generation
migrant students’ science achievement relative to their native-born peers (see Table 6).
33
19 Schneeweis (2010) finds, however, that the availability of enrichment classes is associated
with lower relative math achievement for migrant students as a whole.
20 Schneeweis (2010) finds a similar result in models that include country-specific effects.
21 This represents 3.1 percent of the world's population. See http://www.iom.int/jahia/Jahia/
about-migration/facts-and-figures/lang/en#.

TABLE 1 Nativity Distribution by Country and Language
(in percentages)
Native-Born 1st Generation 2nd Generation
Sample Size
Test Lang
Foreign Lang
Test Lang
Foreign Lang
Australia 57.7 7.5 4.7 26.2 3.9 13,872 Austria 78.1 2.6 2.8 9.9 6.6 6,386 Belgium 73.9 3.6 3.2 13.5 5.8 7,955 Canada 64.5 4.5 6.8 18.9 5.2 22,265 Chile 98.1 0.6 0.0 1.1 0.1 5,475 Czech Republic 91.5 0.5 0.6 7.1 0.4 5,974 Denmark 83.5 2.0 1.6 10.5 2.4 5,698 Estonia 80.9 1.0 0.2 16.5 1.4 4,641 Finland 92.9 0.6 1.4 4.1 1.0 5,705 France 74.4 2.1 1.8 18.2 3.6 4,202 Germany 74.7 3.0 3.5 13.3 5.4 4,345 Greece 82.4 4.3 2.9 9.8 0.6 4,829 Hungary 95.1 1.3 0.1 3.3 0.1 4,543 Iceland 89.9 1.1 2.0 6.3 0.7 3,451 Ireland 74.9 7.7 3.6 13.4 0.5 3,605 Israel 66.4 2.9 4.4 22.9 3.3 5,404 Italy 88.4 2.0 2.7 5.9 1.0 30,257 Japan 98.9 0.1 0.1 0.9 0.0 6,047 Korea 99.7 0.1 0.0 0.2 0.0 4,924 Luxembourg 43.1 7.1 10.3 12.4 27.1 4,439 Mexico 96.6 0.9 0.2 2.2 0.1 36,829 Netherlands 80.1 1.7 2.2 13.2 2.8 4,644 New Zealand 59.1 10.3 8.8 18.1 3.7 4,481 Norway 84.9 1.0 3.1 7.7 3.3 4,555 Poland 99.4 0.0 0.0 0.6 0.0 4,818 Portugal 80.5 3.1 1.0 15.1 0.3 5,580 Slovak Republic 94.1 0.5 0.1 5.0 0.3 4,512 Slovenia 83.6 0.7 1.0 11.2 3.5 6,016 Spain 84.9 5.5 3.6 4.6 1.5 25,120 Sweden 77.5 1.9 2.5 13.6 4.4 4,436 Switzerland 58.3 5.1 4.3 24.2 8.1 11,391 Turkey 98.1 0.2 0.1 1.5 0.0 4,844 United Kingdom 80.9 2.6 3.1 11.3 2.1 11,733 United States 73.1 2.1 4.8 12.3 7.5 5,080
Notes: All results are weighted using the provided student weights.

TABLE 2 Average Test Scores by Nativity, Country and Language
Native-Born
1st Generation 2nd Generation Test Language Foreign Lang Test Language Foreign Lang
Read Math Sci Read Math Sci Read Math Sci Read Math Sci Read Math Sci Overall 495 492 501 -10 -14 -13 -27 -20 -30 3 -2 -3 -25 -30 -33 Australia 511 510 525 20 12 12 -7 8 -11 17 14 14 12 28 6
Austria 482 508 509
-82 -66 -89
-87 -70 -95
-24 -30 -
31 -53 -55 -75
Belgium 525 536 528
-38 -52 -53
-79 -82 -85
-26 -35 -
34 -76 -79 -77 Canada 526 530 534 1 -11 -8 -10 -4 -15 6 -4 -4 -9 -4 -21 Chile 451 423 449 -7 -24 -22 13 16 13 -18 -43 -25
Czech Republic 480 495 502
-8 -4 -1
8 6 9
-17 -19 -
20 17 14 -2
Denmark 501 511 508
-37 -50 -41
-75 -74 -94
-15 -25 -
24 -58 -62 -85
Estonia 508 519 535
-13 -11 -17
-60 -71 -69
-30 -33 -
34 -35 -32 -41
Finland 539 543 557
-45 -42 -50
-85 -62 -90
-15 -21 -
20 -51 -41 -60
France 506 509 510
-58 -55 -61
-67 -63 -65
-24 -32 -
30 -72 -73 -77
Germany 515 530 542
-53 -51 -59
-58 -51 -72
-28 -34 -
42 -60 -64 -87 Greece 489 471 475 -37 -28 -29 -70 -63 -59 -5 -2 -4 -24 -24 -22 Hungary 494 490 502 4 6 2 -15 -24 21 31 27 29 85 43 67
Iceland 504 510 498
-45 -49 -48
-63 -43 -49
-7 -12 -
12 -50 -30 -35 Ireland 499 489 509 1 -2 5 -49 -27 -31 14 13 19 -10 -26 -49 Israel 473 445 453 -18 -10 -26 5 12 0 23 22 23 47 36 43 Italy 491 487 494 -57 -45 -64 -77 -64 -75 -2 -2 -2 -41 -27 -33
Japan 521 530 541
35 54 8
-34 8 -60
-38 -38 -
37 -16 -20 -11
Korea 540 547 539
-6 -11 -18
-28 -40 -
43
Luxembourg 500 516 515
-29 -30 -31
-57 -57 -67
-56 -51 -
62 -41 -43 -48
Mexico 430 423 420
-93 -81 -62
-109 -92 -75
-54 -54 -
41 -85 -58 -44
Netherlands 516 535 533
-35 -38 -48
-42 -56 -77
-21 -30 -
31 -52 -62 -72 New Zealand 522 521 537 31 25 21 -30 -17 -34 11 4 5 -53 -46 -63 Norway 508 503 506 5 4 1 -64 -65 -78 -4 -4 -7 -45 -47 -62
Poland 502 496 510
70 165 137
12 -8 -
10 Portugal 500 497 502 -26 -30 -25 -24 -4 -16 9 6 9 -50 -46 -60 Slovak Republic 479 498 492 -15 -11 -7 -8 -38 -47 -5 -4 -5 -50 -57 -52

Slovenia 489 508 519
-61 -73 -61
-71 -89 -80
-16 -21 -
24 -45 -46 -65 Spain 488 491 495 -45 -59 -49 -69 -63 -69 5 -3 2 -10 -16 -12
Sweden 507 504 506
-43 -44 -51
-84 -62 -87
-12 -18 -
19 -59 -58 -70
Switzerland 512 552 534
-31 -51 -40
-74 -92 -91
-7 -20 -
21 -43 -59 -63 Turkey 465 446 455 63 97 62 -78 -53 -55 36 49 33 5 28 -5 United Kingdom 498 496 518 -9 -15 -2 -44 -33 -38 7 3 4 -27 -19 -36
United States 505 494 510
13 4 0
-26 -19 -33
-1 -8 -
13 -32 -39 -41 Observations 238,023 7,696 7,122 27,422 7,793 Notes: All results are weighted using the provided student weights. The figures for migrant groups are relative to those for the native-born in the same country.

TABLE 3 Overall Migrant Test Score Gap in OECD Countries
(standard errors) 1st Generation - Test Language Spoken at Home 1st Generation - Foreign Language Spoken at Home 2nd Generation
Age at Arrival Age 0-4 Age 5-10 Age 11-15 Age 0-4 Age 5-10 Age 11-15 Test Language Foreign Language
A) Controlling for Country Fixed Effects - R-Squared: Reading = 0.133, Math = 0.155, Science = 0.151 Reading -0.120* -0.220*** -0.310*** -0.225*** -0.331*** -0.747*** -0.0749*** -0.394***
(0.068) (0.066) (0.078) (0.074) (0.059) (0.066) (0.027) (0.044) Math -0.185*** -0.237*** -0.332*** -0.195*** -0.272*** -0.553*** -0.131*** -0.437***
(0.057) (0.065) (0.070) (0.064) (0.056) (0.065) (0.026) (0.041) Science -0.165** -0.244*** -0.375*** -0.302*** -0.392*** -0.700*** -0.149*** -0.485***
(0.066) (0.064) (0.076) (0.069) (0.059) (0.067) (0.027) (0.044) B) Controlling for Parental Education and Country FEs - R-Squared: Reading = 0.210, Math = 0.232, Science = 0.227
Reading -0.052 -0.126* -0.242*** 0.009 -0.070 -0.564*** 0.001 -0.0814* (0.064) (0.066) (0.074) (0.072) (0.052) (0.056) (0.025) (0.046)
Math -0.085 -0.105* -0.223*** 0.084 0.036 -0.327*** -0.036 -0.0839** (0.054) (0.063) (0.066) (0.063) (0.048) (0.055) (0.023) (0.042)
Science -0.030 -0.072 -0.225*** 0.020 -0.041 -0.427*** -0.034 -0.0929** (0.062) (0.064) (0.071) (0.067) (0.052) (0.057) (0.025) (0.045)
C) Controlling for Parental Education, Socioeconomic Status and Child Resources, and Country FEs - R-Squared: Reading = 0.365, Math = 0.383, Science = 0.376 Reading -0.024 -0.051 -0.075 0.062 0.042 -0.402*** -0.001 -0.046
(0.052) (0.053) (0.066) (0.069) (0.050) (0.054) (0.022) (0.042) Math -0.047 -0.018 -0.041 0.146** 0.153*** -0.142*** -0.0333* -0.044
(0.044) (0.050) (0.057) (0.058) (0.047) (0.050) (0.019) (0.038) Science 0.000 0.005 -0.055 0.072 0.068 -0.262*** -0.033 -0.058
(0.050) (0.052) (0.062) (0.065) (0.051) (0.055) (0.021) (0.042) Observations = 288,056
Notes: All regressions include controls for child age, gender and country fixed effects. The second panel adds controls for parent's highest years of education, whether this is missing, and whether any parent was born in the test country. The third panel adds extensive controls for parental socioeconomics status and educational investments. Robust standard errors that account for school (and country) level correlation in errors in parentheses. *** p<0.01, ** p<0.05, * p<0.1

TABLE 4 Relationship between Country-Level Policies and Migrant Reading Test Score Gap in OECD Countries
(standard errors) 1st Gen - Test Language Spoken at Home 1st Gen - Foreign Language Spoken at Home 2nd Generation
Age at Arrival Age 0-4 Age 5-10 Age 11-15 Age 0-4 Age 5-10 Age 11-15 Test Lang Foreign Lang
Log Real GDP Per Capita (PPP) 0.070 0.146 0.258 0.114 0.342* 0.253 0.032 0.056
(0.222) (0.221) (0.275) (0.233) (0.178) (0.255) (0.082) (0.151)
Gini Coefficient on Income -2.148** 0.039 3.680** 0.648 0.254 -0.138 0.341 0.046
(0.950) (1.031) (1.519) (0.934) (0.775) (1.110) (0.339) (0.632)
Log Percent Foreign-born 0.0994** 0.037 0.204** 0.300*** 0.121* 0.085 0.144*** 0.228***
(0.039) (0.082) (0.094) (0.051) (0.063) (0.099) (0.019) (0.055)
School Starting Age <=5 -0.265* -0.090 -0.021 -0.124 -0.153 0.252 -0.080 -0.039
(0.137) (0.186) (0.299) (0.212) (0.191) (0.196) (0.067) (0.157)
School Starting Age =7 -0.142* 0.035 0.225* -0.296** -0.207** -0.364*** 0.020 -0.033
(0.081) (0.110) (0.126) (0.122) (0.089) (0.112) (0.035) (0.072)
Years of Compulsory School 0.027 -0.013 0.020 0.033 -0.073 -0.003 0.038 0.010
(0.070) (0.096) (0.167) (0.093) (0.077) (0.107) (0.031) (0.061) Log Educational Expenditure (% GDP)
-0.539*** -0.927*** -0.224 0.038 -0.706*** -0.194 -0.304*** -0.680***
(0.177) (0.248) (0.244) (0.273) (0.234) (0.225) (0.103) (0.195)
Log Percent Upper Secondary Public -0.057 -0.012 -0.113 0.438 0.204 0.226 0.047 0.174
(0.152) (0.183) (0.274) (0.288) (0.195) (0.226) (0.068) (0.163)
Log (Teacher's Salaries / GDP PC) 0.021 -0.399** -0.398 -0.173 -0.103 -0.501** -0.074 -0.247**
(0.111) (0.172) (0.274) (0.171) (0.163) (0.235) (0.050) (0.099)
Age of First Selection 0.0485*** 0.0399** 0.020 0.019 0.009 0.0617*** 0.006 0.017
(0.017) (0.018) (0.030) (0.020) (0.015) (0.022) (0.008) (0.014)
External Examination 0.013 -0.025 -0.175 -0.190* 0.162 -0.062 0.030 0.031
(0.088) (0.120) (0.163) (0.107) (0.120) (0.130) (0.032) (0.073)
Some Ability Grouping 0.262 0.663*** 0.514* -0.001 0.269 0.096 0.126* 0.185
(0.177) (0.209) (0.294) (0.209) (0.231) (0.249) (0.070) (0.149)
Ability Grouping for All Subjects 0.110 0.309 -0.912 0.098 -0.122 1.331** -0.061 0.151
(0.395) (0.387) (0.689) (0.403) (0.352) (0.531) (0.140) (0.250)
Teachers Evaluated Based on Exams 0.261* -0.234 -0.040 0.111 0.132 0.107 0.120** 0.174*
(0.155) (0.145) (0.224) (0.220) (0.133) (0.169) (0.055) (0.104)
Observations = 288,056
Notes: All regressions include controls for country fixed effects, child age and gender, parent's highest years of education, whether this is missing, and whether any parent was born in the test country and extensive controls for parental socioeconomics status and educational investments. The school starting age variables are relative to the excluded group of Starting Age =6. Robust standard errors that account for school (and country) level correlation in errors in parentheses. *** p<0.01, ** p<0.05, * p<0.1
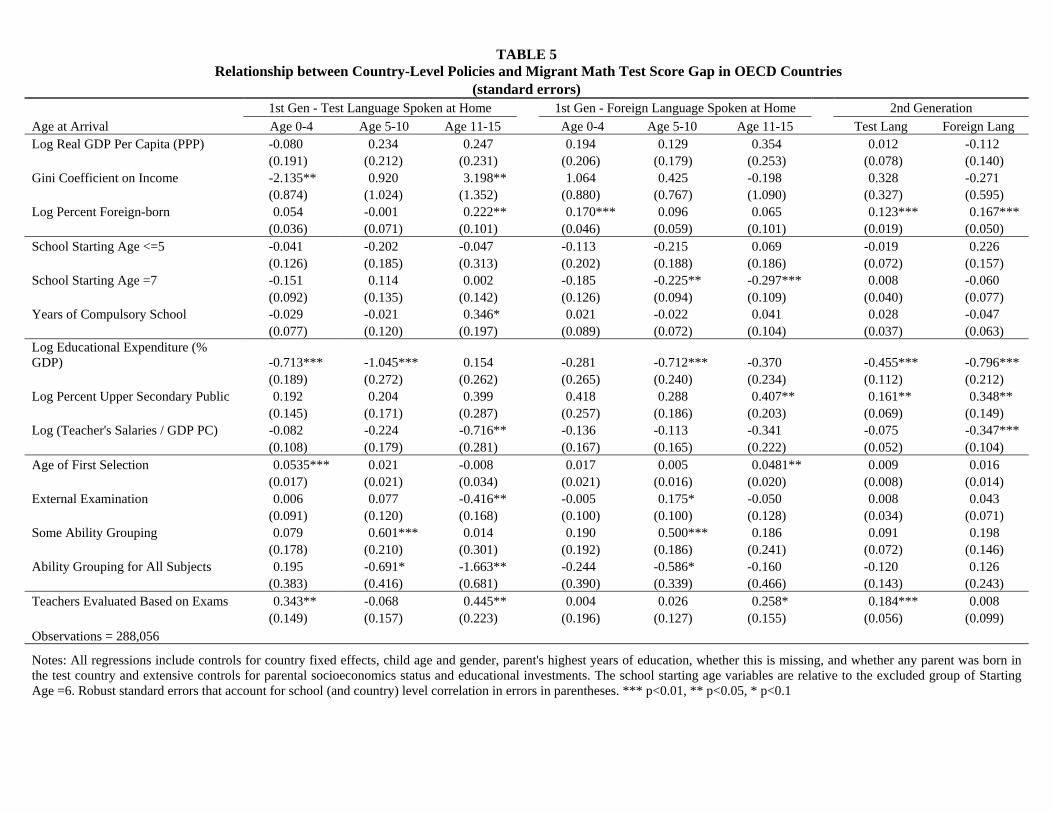
TABLE 5
Relationship between Country-Level Policies and Migrant Math Test Score Gap in OECD Countries (standard errors)
1st Gen - Test Language Spoken at Home 1st Gen - Foreign Language Spoken at Home 2nd Generation Age at Arrival Age 0-4 Age 5-10 Age 11-15 Age 0-4 Age 5-10 Age 11-15 Test Lang Foreign Lang Log Real GDP Per Capita (PPP) -0.080 0.234 0.247 0.194 0.129 0.354 0.012 -0.112
(0.191) (0.212) (0.231) (0.206) (0.179) (0.253) (0.078) (0.140) Gini Coefficient on Income -2.135** 0.920 3.198** 1.064 0.425 -0.198 0.328 -0.271
(0.874) (1.024) (1.352) (0.880) (0.767) (1.090) (0.327) (0.595) Log Percent Foreign-born 0.054 -0.001 0.222** 0.170*** 0.096 0.065 0.123*** 0.167***
(0.036) (0.071) (0.101) (0.046) (0.059) (0.101) (0.019) (0.050) School Starting Age <=5 -0.041 -0.202 -0.047 -0.113 -0.215 0.069 -0.019 0.226
(0.126) (0.185) (0.313) (0.202) (0.188) (0.186) (0.072) (0.157) School Starting Age =7 -0.151 0.114 0.002 -0.185 -0.225** -0.297*** 0.008 -0.060
(0.092) (0.135) (0.142) (0.126) (0.094) (0.109) (0.040) (0.077) Years of Compulsory School -0.029 -0.021 0.346* 0.021 -0.022 0.041 0.028 -0.047
(0.077) (0.120) (0.197) (0.089) (0.072) (0.104) (0.037) (0.063) Log Educational Expenditure (% GDP) -0.713*** -1.045*** 0.154 -0.281 -0.712*** -0.370 -0.455*** -0.796***
(0.189) (0.272) (0.262) (0.265) (0.240) (0.234) (0.112) (0.212) Log Percent Upper Secondary Public 0.192 0.204 0.399 0.418 0.288 0.407** 0.161** 0.348**
(0.145) (0.171) (0.287) (0.257) (0.186) (0.203) (0.069) (0.149) Log (Teacher's Salaries / GDP PC) -0.082 -0.224 -0.716** -0.136 -0.113 -0.341 -0.075 -0.347***
(0.108) (0.179) (0.281) (0.167) (0.165) (0.222) (0.052) (0.104) Age of First Selection 0.0535*** 0.021 -0.008 0.017 0.005 0.0481** 0.009 0.016
(0.017) (0.021) (0.034) (0.021) (0.016) (0.020) (0.008) (0.014) External Examination 0.006 0.077 -0.416** -0.005 0.175* -0.050 0.008 0.043
(0.091) (0.120) (0.168) (0.100) (0.100) (0.128) (0.034) (0.071) Some Ability Grouping 0.079 0.601*** 0.014 0.190 0.500*** 0.186 0.091 0.198
(0.178) (0.210) (0.301) (0.192) (0.186) (0.241) (0.072) (0.146) Ability Grouping for All Subjects 0.195 -0.691* -1.663** -0.244 -0.586* -0.160 -0.120 0.126 (0.383) (0.416) (0.681) (0.390) (0.339) (0.466) (0.143) (0.243) Teachers Evaluated Based on Exams 0.343** -0.068 0.445** 0.004 0.026 0.258* 0.184*** 0.008
(0.149) (0.157) (0.223) (0.196) (0.127) (0.155) (0.056) (0.099) Observations = 288,056
Notes: All regressions include controls for country fixed effects, child age and gender, parent's highest years of education, whether this is missing, and whether any parent was born in the test country and extensive controls for parental socioeconomics status and educational investments. The school starting age variables are relative to the excluded group of Starting Age =6. Robust standard errors that account for school (and country) level correlation in errors in parentheses. *** p<0.01, ** p<0.05, * p<0.1
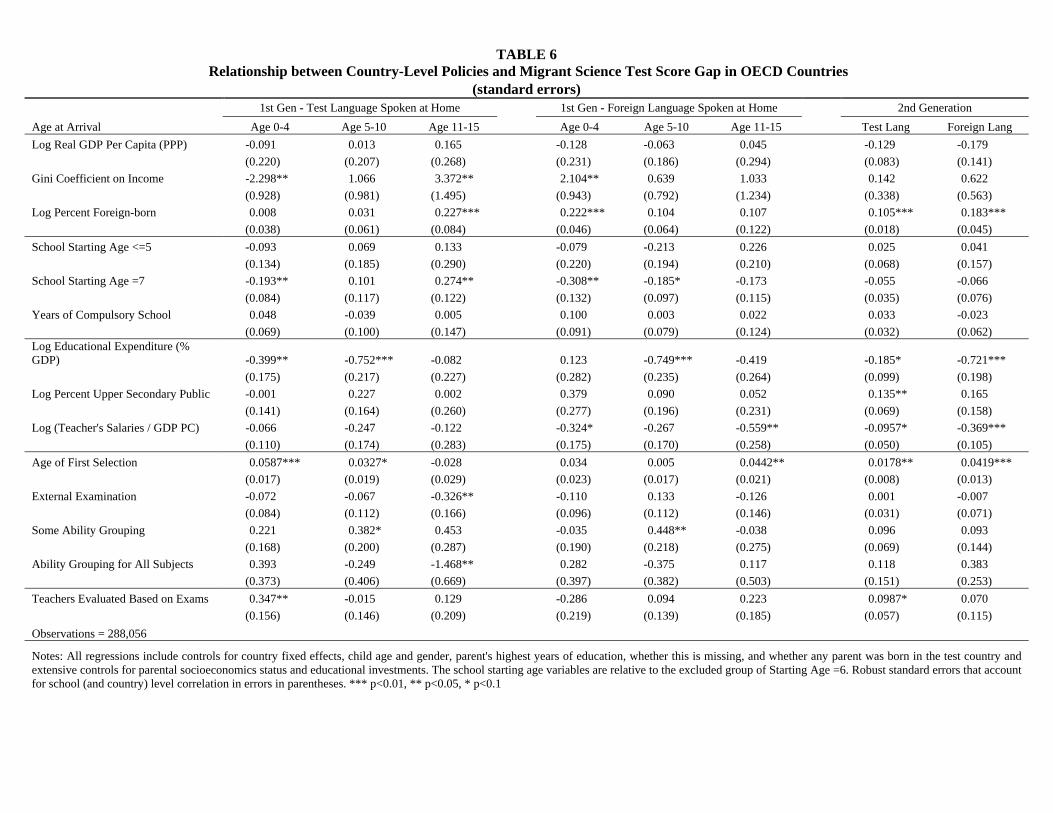
TABLE 6
Relationship between Country-Level Policies and Migrant Science Test Score Gap in OECD Countries (standard errors)
1st Gen - Test Language Spoken at Home 1st Gen - Foreign Language Spoken at Home 2nd Generation
Age at Arrival Age 0-4 Age 5-10 Age 11-15 Age 0-4 Age 5-10 Age 11-15 Test Lang Foreign Lang
Log Real GDP Per Capita (PPP) -0.091 0.013 0.165 -0.128 -0.063 0.045 -0.129 -0.179
(0.220) (0.207) (0.268) (0.231) (0.186) (0.294) (0.083) (0.141)
Gini Coefficient on Income -2.298** 1.066 3.372** 2.104** 0.639 1.033 0.142 0.622
(0.928) (0.981) (1.495) (0.943) (0.792) (1.234) (0.338) (0.563)
Log Percent Foreign-born 0.008 0.031 0.227*** 0.222*** 0.104 0.107 0.105*** 0.183***
(0.038) (0.061) (0.084) (0.046) (0.064) (0.122) (0.018) (0.045)
School Starting Age <=5 -0.093 0.069 0.133 -0.079 -0.213 0.226 0.025 0.041
(0.134) (0.185) (0.290) (0.220) (0.194) (0.210) (0.068) (0.157)
School Starting Age =7 -0.193** 0.101 0.274** -0.308** -0.185* -0.173 -0.055 -0.066
(0.084) (0.117) (0.122) (0.132) (0.097) (0.115) (0.035) (0.076)
Years of Compulsory School 0.048 -0.039 0.005 0.100 0.003 0.022 0.033 -0.023
(0.069) (0.100) (0.147) (0.091) (0.079) (0.124) (0.032) (0.062) Log Educational Expenditure (% GDP) -0.399** -0.752*** -0.082 0.123 -0.749*** -0.419 -0.185* -0.721***
(0.175) (0.217) (0.227) (0.282) (0.235) (0.264) (0.099) (0.198)
Log Percent Upper Secondary Public -0.001 0.227 0.002 0.379 0.090 0.052 0.135** 0.165
(0.141) (0.164) (0.260) (0.277) (0.196) (0.231) (0.069) (0.158)
Log (Teacher's Salaries / GDP PC) -0.066 -0.247 -0.122 -0.324* -0.267 -0.559** -0.0957* -0.369***
(0.110) (0.174) (0.283) (0.175) (0.170) (0.258) (0.050) (0.105)
Age of First Selection 0.0587*** 0.0327* -0.028 0.034 0.005 0.0442** 0.0178** 0.0419***
(0.017) (0.019) (0.029) (0.023) (0.017) (0.021) (0.008) (0.013)
External Examination -0.072 -0.067 -0.326** -0.110 0.133 -0.126 0.001 -0.007
(0.084) (0.112) (0.166) (0.096) (0.112) (0.146) (0.031) (0.071)
Some Ability Grouping 0.221 0.382* 0.453 -0.035 0.448** -0.038 0.096 0.093
(0.168) (0.200) (0.287) (0.190) (0.218) (0.275) (0.069) (0.144)
Ability Grouping for All Subjects 0.393 -0.249 -1.468** 0.282 -0.375 0.117 0.118 0.383
(0.373) (0.406) (0.669) (0.397) (0.382) (0.503) (0.151) (0.253)
Teachers Evaluated Based on Exams 0.347** -0.015 0.129 -0.286 0.094 0.223 0.0987* 0.070
(0.156) (0.146) (0.209) (0.219) (0.139) (0.185) (0.057) (0.115)
Observations = 288,056
Notes: All regressions include controls for country fixed effects, child age and gender, parent's highest years of education, whether this is missing, and whether any parent was born in the test country and extensive controls for parental socioeconomics status and educational investments. The school starting age variables are relative to the excluded group of Starting Age =6. Robust standard errors that account for school (and country) level correlation in errors in parentheses. *** p<0.01, ** p<0.05, * p<0.1
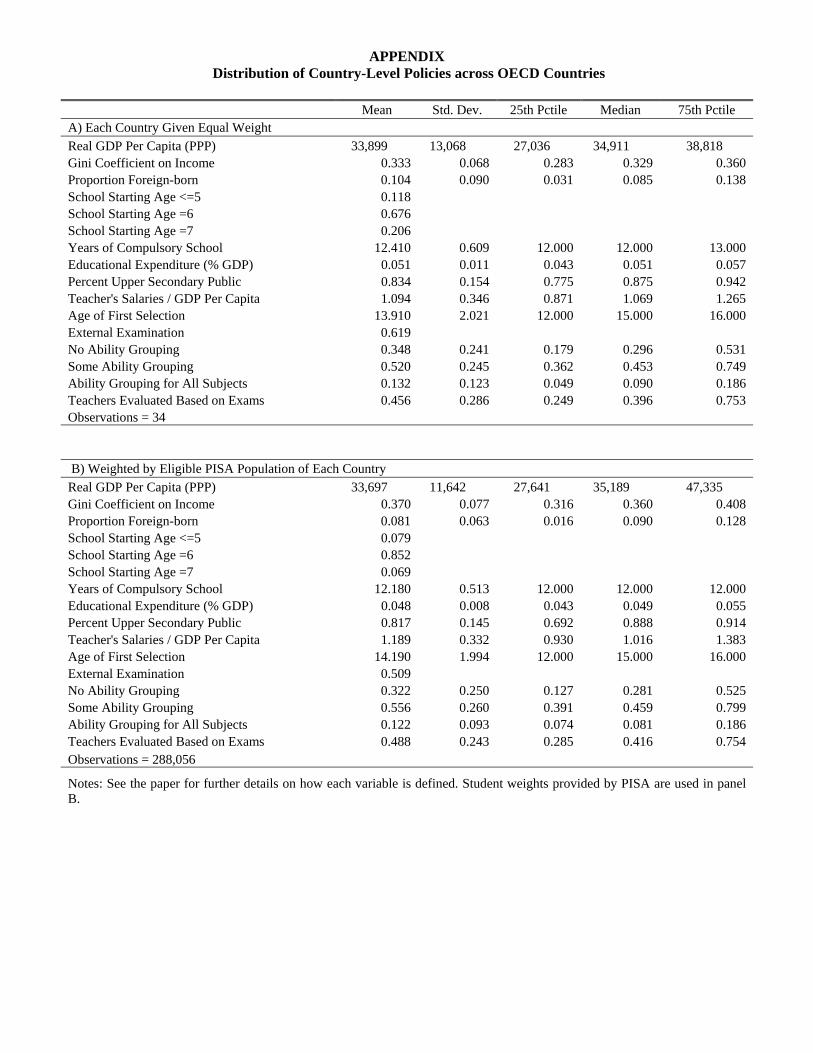
APPENDIX Distribution of Country-Level Policies across OECD Countries
Mean Std. Dev. 25th Pctile Median 75th Pctile A) Each Country Given Equal Weight Real GDP Per Capita (PPP) 33,899 13,068 27,036 34,911 38,818 Gini Coefficient on Income 0.333 0.068 0.283 0.329 0.360 Proportion Foreign-born 0.104 0.090 0.031 0.085 0.138 School Starting Age <=5 0.118 School Starting Age =6 0.676 School Starting Age =7 0.206 Years of Compulsory School 12.410 0.609 12.000 12.000 13.000 Educational Expenditure (% GDP) 0.051 0.011 0.043 0.051 0.057 Percent Upper Secondary Public 0.834 0.154 0.775 0.875 0.942 Teacher's Salaries / GDP Per Capita 1.094 0.346 0.871 1.069 1.265 Age of First Selection 13.910 2.021 12.000 15.000 16.000 External Examination 0.619 No Ability Grouping 0.348 0.241 0.179 0.296 0.531 Some Ability Grouping 0.520 0.245 0.362 0.453 0.749 Ability Grouping for All Subjects 0.132 0.123 0.049 0.090 0.186 Teachers Evaluated Based on Exams 0.456 0.286 0.249 0.396 0.753 Observations = 34 B) Weighted by Eligible PISA Population of Each Country Real GDP Per Capita (PPP) 33,697 11,642 27,641 35,189 47,335 Gini Coefficient on Income 0.370 0.077 0.316 0.360 0.408 Proportion Foreign-born 0.081 0.063 0.016 0.090 0.128 School Starting Age <=5 0.079 School Starting Age =6 0.852 School Starting Age =7 0.069 Years of Compulsory School 12.180 0.513 12.000 12.000 12.000 Educational Expenditure (% GDP) 0.048 0.008 0.043 0.049 0.055 Percent Upper Secondary Public 0.817 0.145 0.692 0.888 0.914 Teacher's Salaries / GDP Per Capita 1.189 0.332 0.930 1.016 1.383 Age of First Selection 14.190 1.994 12.000 15.000 16.000 External Examination 0.509 No Ability Grouping 0.322 0.250 0.127 0.281 0.525 Some Ability Grouping 0.556 0.260 0.391 0.459 0.799 Ability Grouping for All Subjects 0.122 0.093 0.074 0.081 0.186 Teachers Evaluated Based on Exams 0.488 0.243 0.285 0.416 0.754 Observations = 288,056
Notes: See the paper for further details on how each variable is defined. Student weights provided by PISA are used in panel B.