Embed Size (px)
Citation preview
`
Migration and Labour Profile of Gogunda Block
(Udaipur District, Rajasthan)
Shramik Sahayata Evam Sandarbha Kendra (Aajeevika Bureau Block Office)
Gogunda
September 2008
INTRODUCTION A brief on the District of Udaipur
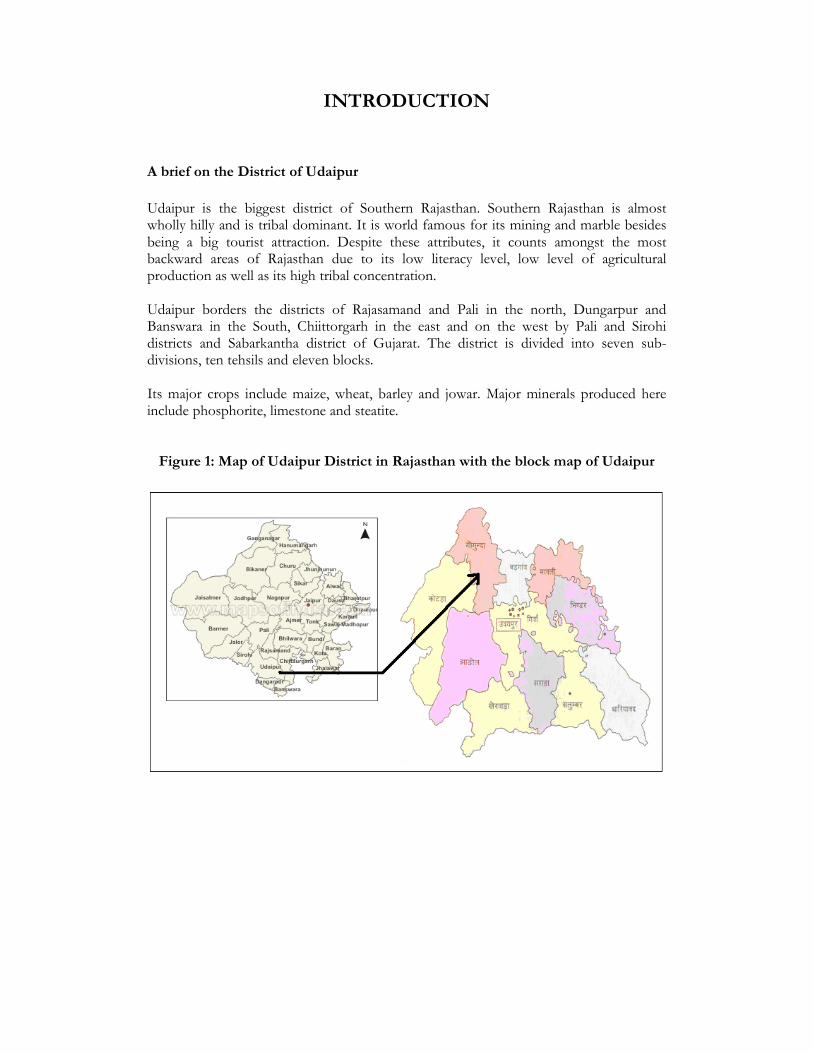
Udaipur is the biggest district of Southern Rajasthan. Southern Rajasthan is almost wholly hilly and is tribal dominant. It is world famous for its mining and marble besides being a big tourist attraction. Despite these attributes, it counts amongst the most backward areas of Rajasthan due to its low literacy level, low level of agricultural production as well as its high tribal concentration. Udaipur borders the districts of Rajasamand and Pali in the north, Dungarpur and Banswara in the South, Chiittorgarh in the east and on the west by Pali and Sirohi districts and Sabarkantha district of Gujarat. The district is divided into seven sub-divisions, ten tehsils and eleven blocks. Its major crops include maize, wheat, barley and jowar. Major minerals produced here include phosphorite, limestone and steatite. Figure 1: Map of Udaipur District in Rajasthan with the block map of Udaipur
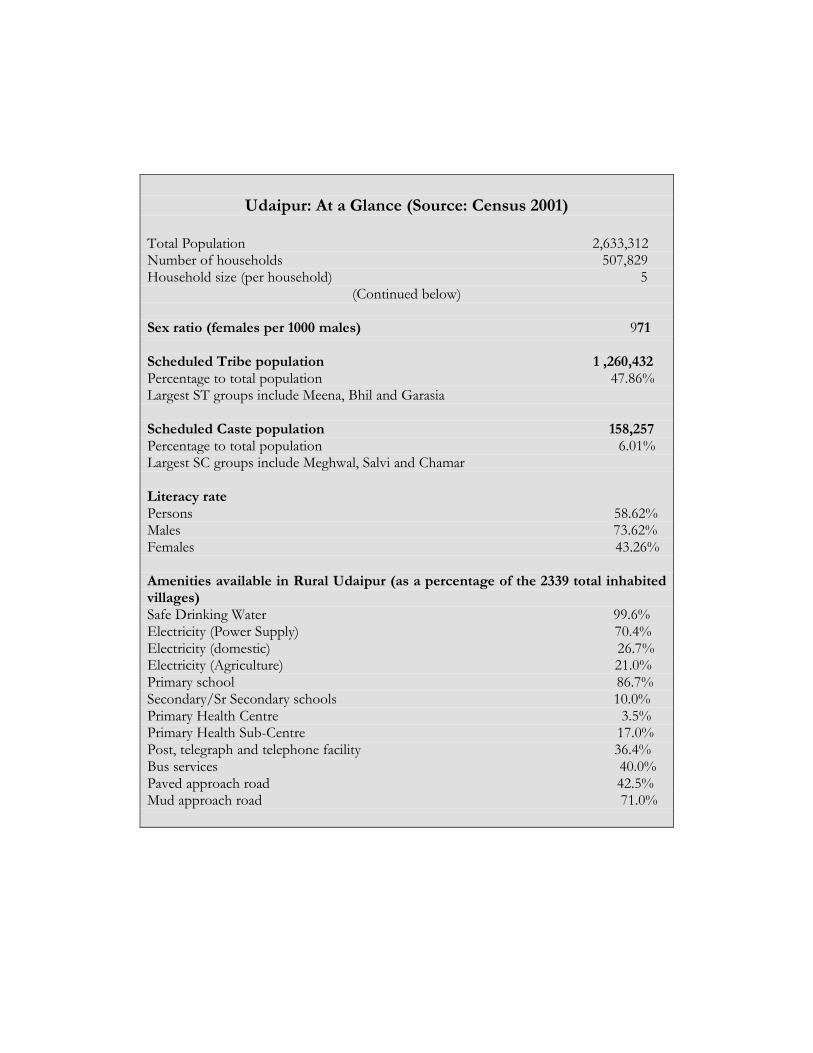
Udaipur: At a Glance (Source: Census 2001)
Total Population 2,633,312 Number of households 507,829 Household size (per household) 5
(Continued below) Sex ratio (females per 1000 males) 971 Scheduled Tribe population 1 ,260,432 Percentage to total population 47.86% Largest ST groups include Meena, Bhil and Garasia Scheduled Caste population 158,257 Percentage to total population 6.01% Largest SC groups include Meghwal, Salvi and Chamar Literacy rate Persons 58.62% Males 73.62% Females 43.26% Amenities available in Rural Udaipur (as a percentage of the 2339 total inhabited villages) Safe Drinking Water 99.6% Electricity (Power Supply) 70.4% Electricity (domestic) 26.7% Electricity (Agriculture) 21.0% Primary school 86.7% Secondary/Sr Secondary schools 10.0% Primary Health Centre 3.5% Primary Health Sub-Centre 17.0% Post, telegraph and telephone facility 36.4% Bus services 40.0% Paved approach road 42.5% Mud approach road 71.0%
A brief on the Block of Gogunda The Gogunda block of Udaipur is dominated by tribal population and is 35 kms. from the district headquarter. It is situated in the northwest of Udaipur city ( see right-hand side map in figure 1) on the state highway no. 76. Gogunda has a hilly and rocky terrain. Kotra, Jhadol, Badgaon and the Girwa Tehsils of Udaipur; the Kumbhalgarh Tehsil of Rajsamand district and the Sadri Tehsil of Pali district in the northwest direction surround it. There used to be forty panchayats and 128 revenue villages in Gogunda. To this, five panchayats of Kotra were added during reconsolidation, which increased the number of panchayats to forty-five (Panchayat map of Gogunda block in Annexure 2). According to the 2001 Census, total population of Gogunda Tehsil was 1,51,575 and the number of households was 30,133. Out of the total population, 44.66 percent people were in the Schedule Tribe (ST) category and 8.2 percent people in the Schedule Caste (SC) group. Gameti (Bhil) and Garasiya are the main tribes of Gogunda. Meghwal, Mongia and Kathori are the major Schedule Caste groups. Rajput, Jain, Brahmin and Prajapat are the other communities that constitute the population of Gogunda. A brief description of the Household survey by Aajeevika Bureau (AB) According to Aajeevika Bureau, persons for who the primary source of income is through migration and who sell their labour as a means to earn are known as migrant labour. 1 Not just limited to Gogunda, migration has become a regular and dominant source of income for households in South Rajasthan as a whole. This is due to the lack of natural resources, decreasing agriculture productivity and the lack of regular and sufficient employment opportunities at the local level. Aajeevika Bureau periodically carries out a survey of households in different panchayats. The objective of these surveys (referred to as AB survey from here on) is to determine the magnitude and characteristics of migration and labour flows from households in a panchayat. This data is then aggregated across panchayats to arrive at a block profile (See Annexure 3 for the tool used to collect the data). The survey collects information on variables such as number of migrants, their occupation and destination of work for each household apart from information such as other sources of income, caste and total adult population. The data for the survey is collected directly from the people in the various hamlets of the village as well as from the sarpanch and other leaders in the panchayat. The effort is to capture all households in a particular village and the number of households surveyed is crosschecked with the census data for that village in order to ensure full (or almost full)
1 For the purpose of these surveys, members of a family enumerated as local labour are those that do not migrate during the year. Migrants in a family are those that find work outside their own panchayat. Also the term ‘family’ and 'household’ have been used interchangeably in this report.

coverage (See Table 1 in Annexure 1). Once the information from the survey is analysed, it is presented to the villagers and a report is also given to the panchayat to inform and engage them on the issue of migration.
THE GOGUNDA HOUSEHOLD SURVEY ON MIGRATION AND LABOUR
The findings of the Gogunda survey illustrate that the migration from here is both diverse and on a large scale. It covers people of different castes and it takes them to a range of destinations as well as occupations in search of better livelihood opportunities. Scope of the survey Gogunda being the first block where Aajeevika Bureau began its operations, a number of data collection efforts on migration and labour have been made since 2004. Inevitably, Gogunda was where the household level tool (that is now the standard tool used to capture migration and labour profiles for all other blocks) was tested and finalised after iteration (See the this tool in Annexure 3). While more than 50% of the panchayats of Gogunda have been surveyed over the last few years, use of different tools for data collection have limited our present analysis to include only 14 panchayats of the block. The excluded data however has proven to be indispensable in informing our block office (3SK Gogunda) about migration patterns as well as in building a rapport with people at the village level. The survey for 11 of the 14 panchayats (included here) was conducted through 2006 while Padawali Khurd, Padawali Kalan and Madra were covered in 2007. These three are amongst the five panchayats that have recently been added to the administrative block of Gogunda. The data on the panchayats of Madra, Tirol, Nandeshma and Padawali Kalan however, have been excluded from the tables despite the fact that the standard tool on migration was used in them. This is because the households covered by the Aajeevika Bureau survey for these panchayats fall short of the census figures by more than 150 households per panchayat. Trends in these panchayats have been analysed and included later. The Shramik Sahayata Evam Sandarbha Kendra (3SK) which is the block office for Aajeevika Bureau (AB) at Gogunda has been responsible for all the data collection and the survey was carried out by it’s staff, members of Sangam Sansthan (AB’s partner organisation in Gogunda) as well as investigators from the panchayats itself. Findings and Analysis of the survey The ten panchayats of Gogunda that have been included in the present analysis (Annexure 1 contains the tabulation of the data collected) have a total of 7292 households as per AB survey.
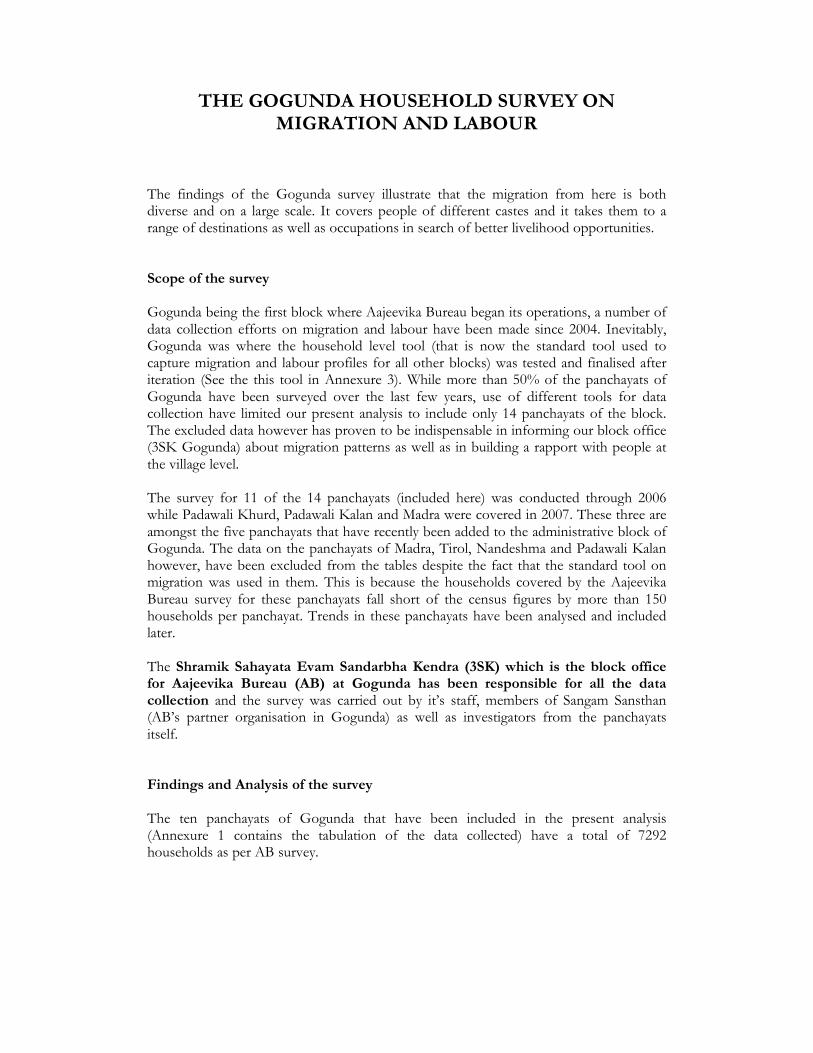
Census figures state that these panchayats had a total of 6967 households in 2001.2 Chart 1 illustrates this for each of the ten panchayats. In all subsequent analysis, the term “Total number of households” refers to the total number of households as per AB’s survey and not the census survey.
Chart 1: Number of Households in the survey
020040060080010001200
Gundali
Doondi
Singhara
Padawali Khurd
Karda
Kachhwa
Suwawaton Ka Gurha
Bokhara
Dhol
Paner
Panchayat Name
Num
ber
of H
ouse
hold
s
Number of Households(Census 2001)
Number of Households (ABSurvey)
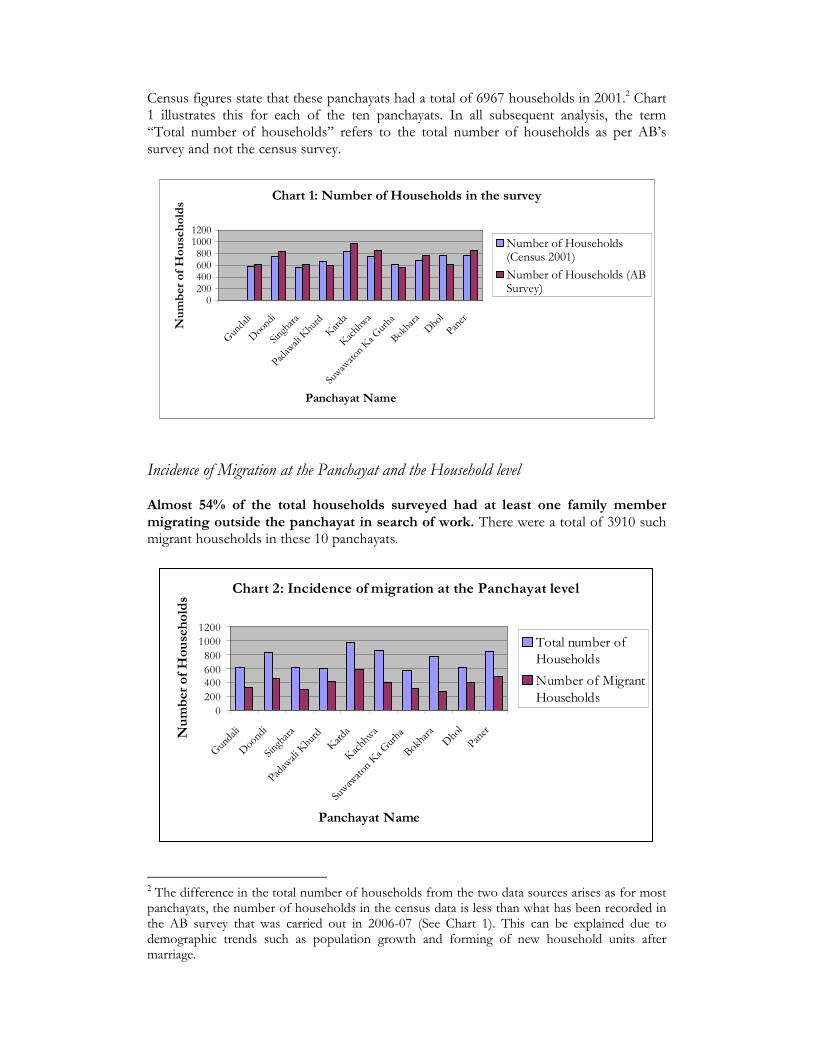
Incidence of Migration at the Panchayat and the Household level Almost 54% of the total households surveyed had at least one family member migrating outside the panchayat in search of work. There were a total of 3910 such migrant households in these 10 panchayats.
Chart 2: Incidence of migration at the Panchayat level
0
200
400600
800
1000
1200
Gundali
Doondi
Singhara
Padawali Khurd
Karda
Kachhwa
Suwawaton Ka Gurha
Bokhara
Dhol
Paner
Panchayat Name
Num
ber
of H
ouse
hold
s
Total number ofHouseholds
Number of Migrant
Households
2 The difference in the total number of households from the two data sources arises as for most panchayats, the number of households in the census data is less than what has been recorded in the AB survey that was carried out in 2006-07 (See Chart 1). This can be explained due to demographic trends such as population growth and forming of new household units after marriage.
Looking at individual panchayats, one finds that Padawali Khurd has the highest proportion of migrant households at 69% where as Bokhara has the lowest at 34% (See Chart 2). The largest number migrating from a panchayat has been from Karda panchayat where over 1000 people migrate out in search of work. The total number of migrants from these 10 panchayats was 5636. This implies that on an average 500-600 persons were migrating from each panchayat. Since the number of migrants (5636) is greater than the number of migrant households (3910), it is obvious that there exist a number of households where more than one family member is migrating out of the panchayat for work Apart from the Kathori and Mogia community in which entire families migrate, for all other communities it is only the male members that are migrating. This is indicated from the names of migrants in the survey forms.
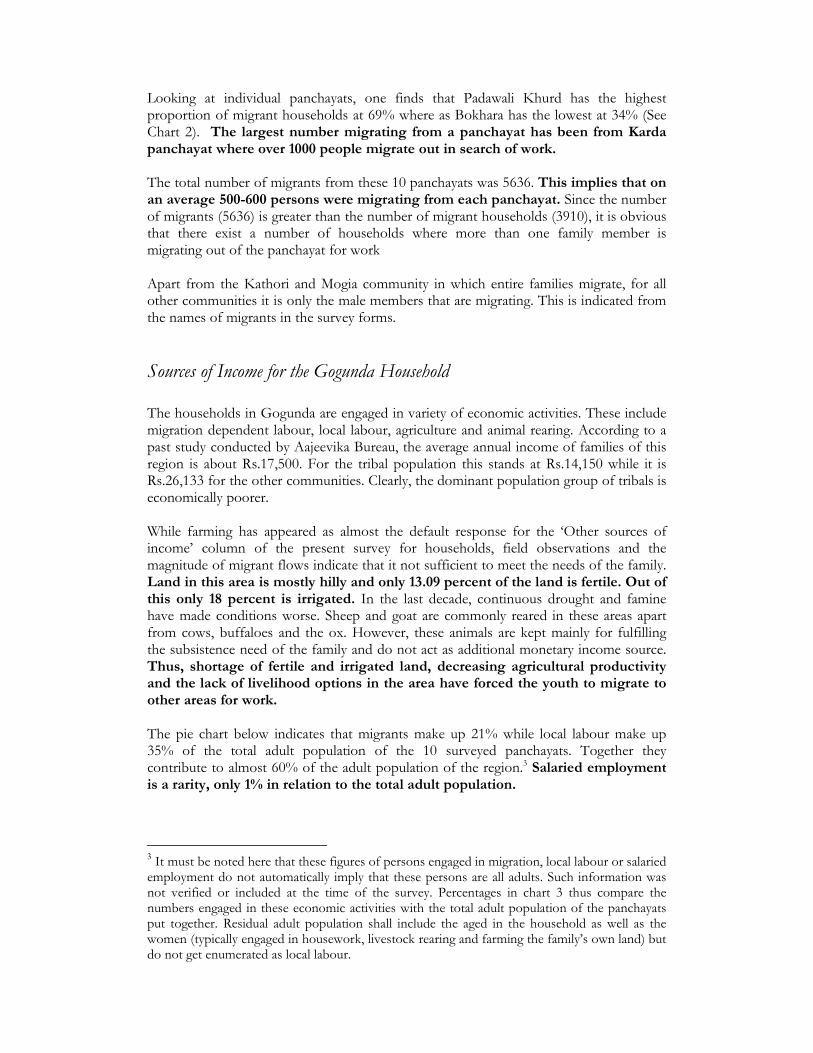
Sources of Income for the Gogunda Household The households in Gogunda are engaged in variety of economic activities. These include migration dependent labour, local labour, agriculture and animal rearing. According to a past study conducted by Aajeevika Bureau, the average annual income of families of this region is about Rs.17,500. For the tribal population this stands at Rs.14,150 while it is Rs.26,133 for the other communities. Clearly, the dominant population group of tribals is economically poorer. While farming has appeared as almost the default response for the ‘Other sources of income’ column of the present survey for households, field observations and the magnitude of migrant flows indicate that it not sufficient to meet the needs of the family. Land in this area is mostly hilly and only 13.09 percent of the land is fertile. Out of this only 18 percent is irrigated. In the last decade, continuous drought and famine have made conditions worse. Sheep and goat are commonly reared in these areas apart from cows, buffaloes and the ox. However, these animals are kept mainly for fulfilling the subsistence need of the family and do not act as additional monetary income source. Thus, shortage of fertile and irrigated land, decreasing agricultural productivity and the lack of livelihood options in the area have forced the youth to migrate to other areas for work. The pie chart below indicates that migrants make up 21% while local labour make up 35% of the total adult population of the 10 surveyed panchayats. Together they contribute to almost 60% of the adult population of the region.3 Salaried employment is a rarity, only 1% in relation to the total adult population.
3 It must be noted here that these figures of persons engaged in migration, local labour or salaried employment do not automatically imply that these persons are all adults. Such information was not verified or included at the time of the survey. Percentages in chart 3 thus compare the numbers engaged in these economic activities with the total adult population of the panchayats put together. Residual adult population shall include the aged in the household as well as the women (typically engaged in housework, livestock rearing and farming the family’s own land) but do not get enumerated as local labour.
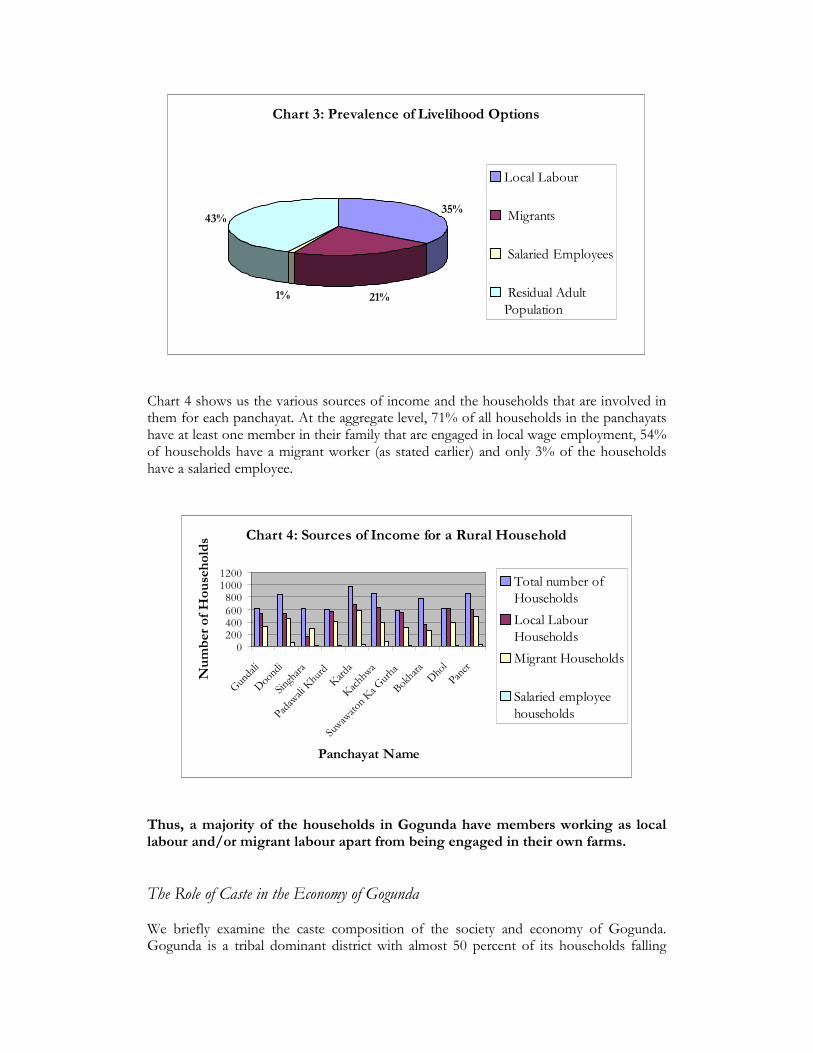
Chart 3: Prevalence of Livelihood Options
35%
21%1%
43%
Local Labour
Migrants
Salaried Employees
Residual Adult
Population
Chart 4 shows us the various sources of income and the households that are involved in them for each panchayat. At the aggregate level, 71% of all households in the panchayats have at least one member in their family that are engaged in local wage employment, 54% of households have a migrant worker (as stated earlier) and only 3% of the households have a salaried employee.
Chart 4: Sources of Income for a Rural Household
0200400600800
10001200
Gundali
Doondi
Singhara
Padawali Khurd
Karda
Kachhwa
Suwawaton Ka Gurha
BokharaDhol
Paner
Panchayat Name
Num
ber
of H
ouse
hold
s
Total number ofHouseholds
Local LabourHouseholds
Migrant Households
Salaried employee
households
Thus, a majority of the households in Gogunda have members working as local labour and/or migrant labour apart from being engaged in their own farms.
The Role of Caste in the Economy of Gogunda We briefly examine the caste composition of the society and economy of Gogunda. Gogunda is a tribal dominant district with almost 50 percent of its households falling
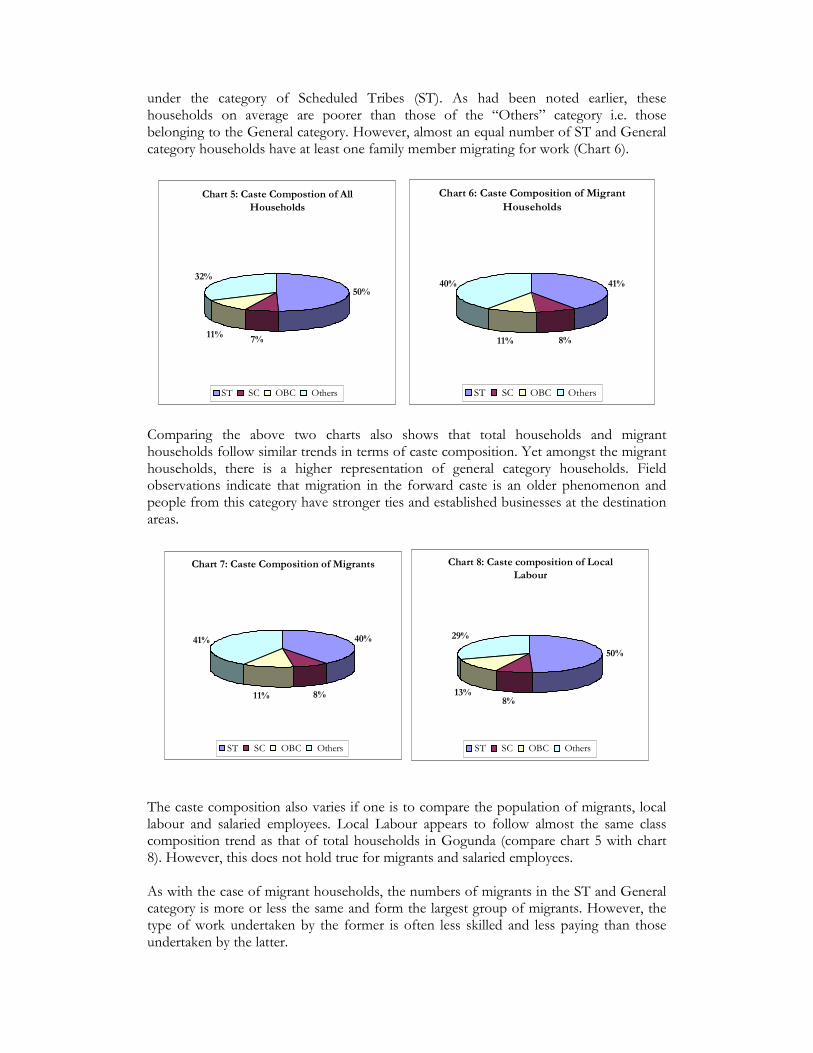
under the category of Scheduled Tribes (ST). As had been noted earlier, these households on average are poorer than those of the “Others” category i.e. those belonging to the General category. However, almost an equal number of ST and General category households have at least one family member migrating for work (Chart 6).
Chart 5: Caste Compostion of All
Households
50%
7%11%
32%
ST SC OBC Others
Chart 6: Caste Composition of Migrant
Households
41%
8%11%
40%
ST SC OBC Others
Comparing the above two charts also shows that total households and migrant households follow similar trends in terms of caste composition. Yet amongst the migrant households, there is a higher representation of general category households. Field observations indicate that migration in the forward caste is an older phenomenon and people from this category have stronger ties and established businesses at the destination areas.
Chart 7: Caste Composition of Migrants
40%
8%11%
41%
ST SC OBC Others
Chart 8: Caste composition of Local
Labour
50%
8%13%
29%
ST SC OBC Others
The caste composition also varies if one is to compare the population of migrants, local labour and salaried employees. Local Labour appears to follow almost the same class composition trend as that of total households in Gogunda (compare chart 5 with chart 8). However, this does not hold true for migrants and salaried employees. As with the case of migrant households, the numbers of migrants in the ST and General category is more or less the same and form the largest group of migrants. However, the type of work undertaken by the former is often less skilled and less paying than those undertaken by the latter.
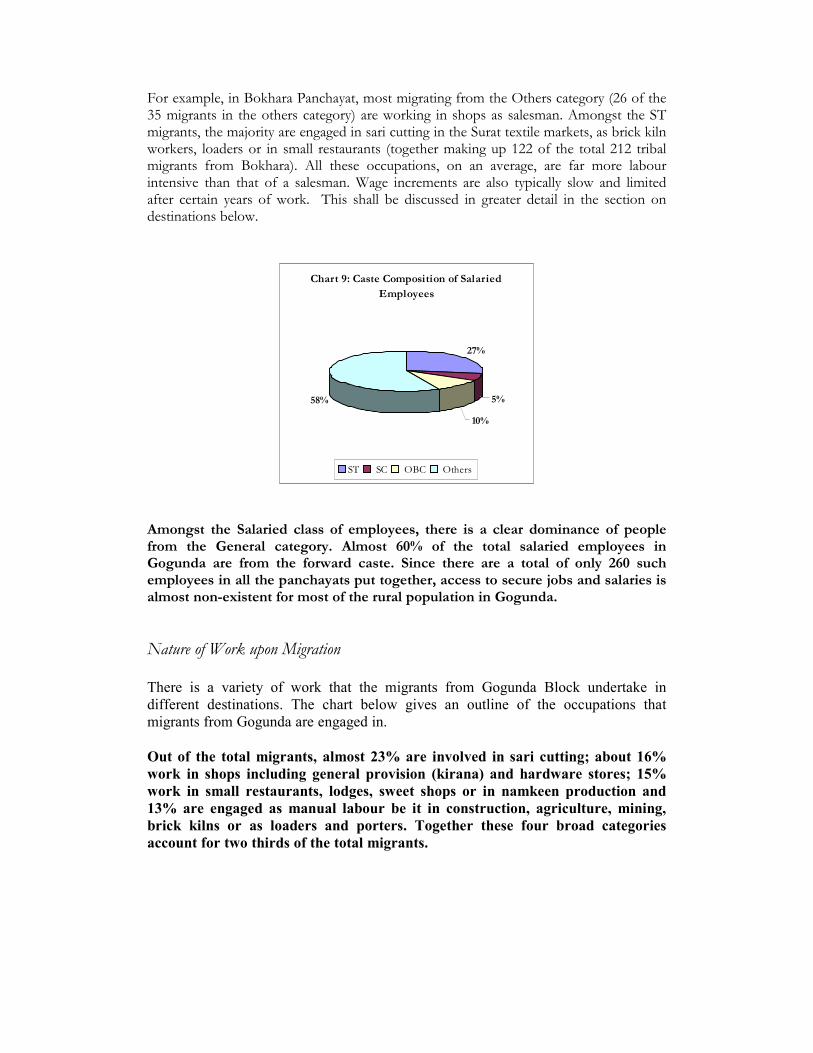
For example, in Bokhara Panchayat, most migrating from the Others category (26 of the 35 migrants in the others category) are working in shops as salesman. Amongst the ST migrants, the majority are engaged in sari cutting in the Surat textile markets, as brick kiln workers, loaders or in small restaurants (together making up 122 of the total 212 tribal migrants from Bokhara). All these occupations, on an average, are far more labour intensive than that of a salesman. Wage increments are also typically slow and limited after certain years of work. This shall be discussed in greater detail in the section on destinations below.
Chart 9: Caste Composition of Salaried
Employees
27%
5%
10%
58%
ST SC OBC Others
Amongst the Salaried class of employees, there is a clear dominance of people from the General category. Almost 60% of the total salaried employees in Gogunda are from the forward caste. Since there are a total of only 260 such employees in all the panchayats put together, access to secure jobs and salaries is almost non-existent for most of the rural population in Gogunda.
Nature of Work upon Migration There is a variety of work that the migrants from Gogunda Block undertake in
different destinations. The chart below gives an outline of the occupations that
migrants from Gogunda are engaged in.
Out of the total migrants, almost 23% are involved in sari cutting; about 16%
work in shops including general provision (kirana) and hardware stores; 15%
work in small restaurants, lodges, sweet shops or in namkeen production and
13% are engaged as manual labour be it in construction, agriculture, mining,
brick kilns or as loaders and porters. Together these four broad categories
account for two thirds of the total migrants.
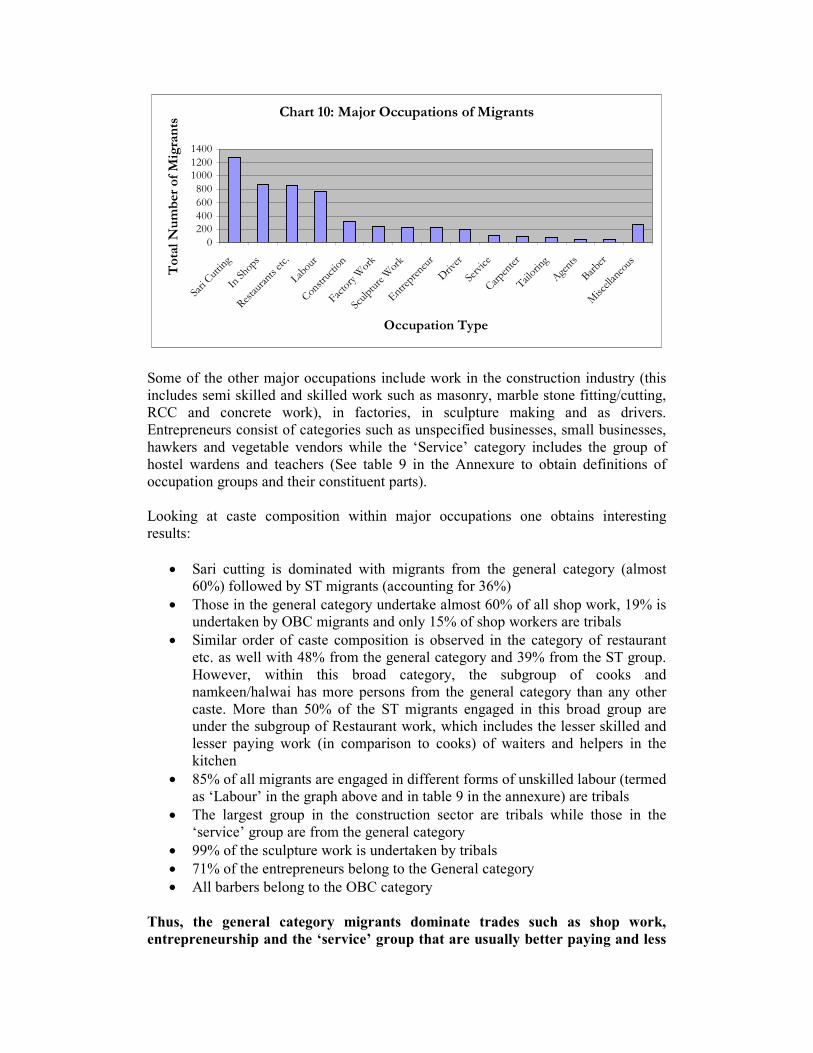
Chart 10: Major Occupations of Migrants
0200400600
800
10001200
1400
Sari Cutting
In Shops
Restaurants etc.
Labour
Construction
Factory W
ork
Sculpture W
ork
Entrepreneur
Driver
Service
Carpenter
Tailoring
Agents
Barber
Miscellaneous
Occupation Type
Total N
um
ber
of M
igra
nts
Some of the other major occupations include work in the construction industry (this
includes semi skilled and skilled work such as masonry, marble stone fitting/cutting,
RCC and concrete work), in factories, in sculpture making and as drivers.
Entrepreneurs consist of categories such as unspecified businesses, small businesses,
hawkers and vegetable vendors while the ‘Service’ category includes the group of
hostel wardens and teachers (See table 9 in the Annexure to obtain definitions of
occupation groups and their constituent parts).
Looking at caste composition within major occupations one obtains interesting
results:
• Sari cutting is dominated with migrants from the general category (almost
60%) followed by ST migrants (accounting for 36%)
• Those in the general category undertake almost 60% of all shop work, 19% is
undertaken by OBC migrants and only 15% of shop workers are tribals
• Similar order of caste composition is observed in the category of restaurant
etc. as well with 48% from the general category and 39% from the ST group.
However, within this broad category, the subgroup of cooks and
namkeen/halwai has more persons from the general category than any other
caste. More than 50% of the ST migrants engaged in this broad group are
under the subgroup of Restaurant work, which includes the lesser skilled and
lesser paying work (in comparison to cooks) of waiters and helpers in the
kitchen
• 85% of all migrants are engaged in different forms of unskilled labour (termed
as ‘Labour’ in the graph above and in table 9 in the annexure) are tribals
• The largest group in the construction sector are tribals while those in the
‘service’ group are from the general category
• 99% of the sculpture work is undertaken by tribals
• 71% of the entrepreneurs belong to the General category
• All barbers belong to the OBC category
Thus, the general category migrants dominate trades such as shop work,
entrepreneurship and the ‘service’ group that are usually better paying and less
laborious. The ST migrants, on the other hand, dominate the category of
unskilled or manual labour (in agriculture, construction, mining and brick kilns
or as loaders and porters), sculpture work and semi skilled work in the
construction industry (such as masonry, concrete work and marble/stone
fitting/polishing). These occupations typically involve lower wages, irregular or
seasonal employment and limited future prospects.
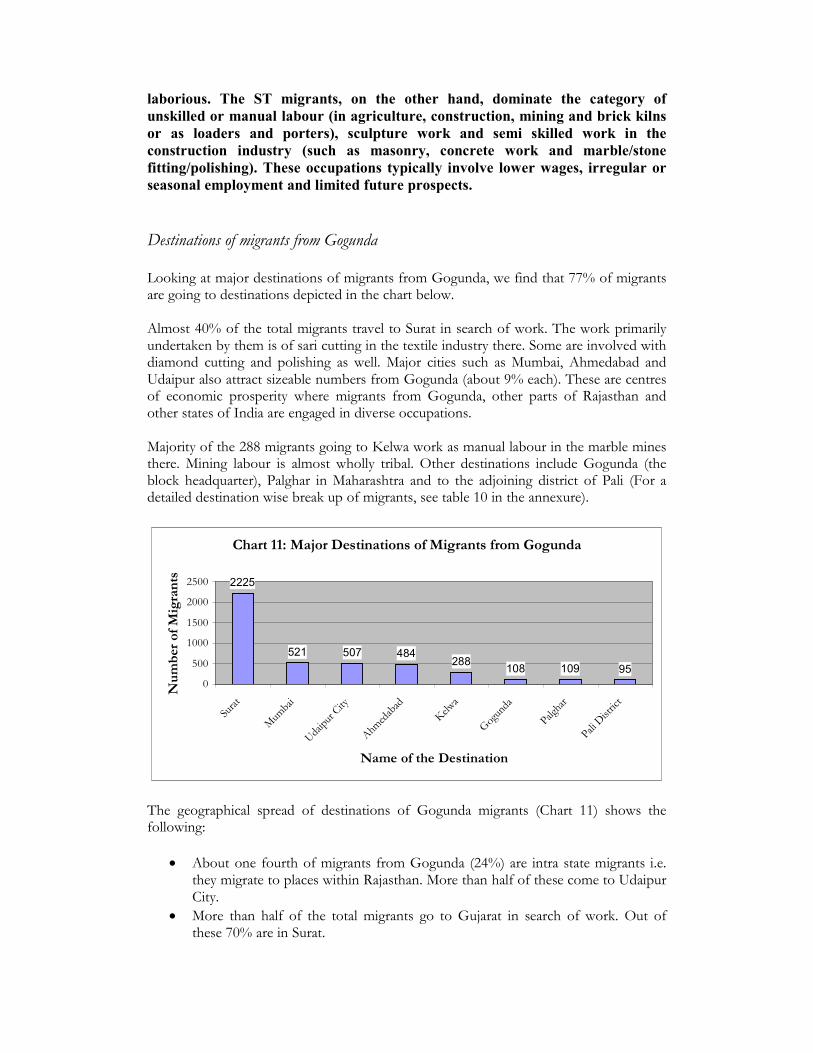
Destinations of migrants from Gogunda Looking at major destinations of migrants from Gogunda, we find that 77% of migrants are going to destinations depicted in the chart below. Almost 40% of the total migrants travel to Surat in search of work. The work primarily undertaken by them is of sari cutting in the textile industry there. Some are involved with diamond cutting and polishing as well. Major cities such as Mumbai, Ahmedabad and Udaipur also attract sizeable numbers from Gogunda (about 9% each). These are centres of economic prosperity where migrants from Gogunda, other parts of Rajasthan and other states of India are engaged in diverse occupations. Majority of the 288 migrants going to Kelwa work as manual labour in the marble mines there. Mining labour is almost wholly tribal. Other destinations include Gogunda (the block headquarter), Palghar in Maharashtra and to the adjoining district of Pali (For a detailed destination wise break up of migrants, see table 10 in the annexure).
Chart 11: Major Destinations of Migrants from Gogunda
2225
521 507 484288
108 109 95
0
500
1000
1500
2000
2500
Surat
Mumbai
Udaipur City
Ahmedabad
Kelwa
Gogunda
Palghar
Pali District
Name of the Destination
Num
ber
of M
igra
nts
The geographical spread of destinations of Gogunda migrants (Chart 11) shows the following:
• About one fourth of migrants from Gogunda (24%) are intra state migrants i.e. they migrate to places within Rajasthan. More than half of these come to Udaipur City.
• More than half of the total migrants go to Gujarat in search of work. Out of these 70% are in Surat.
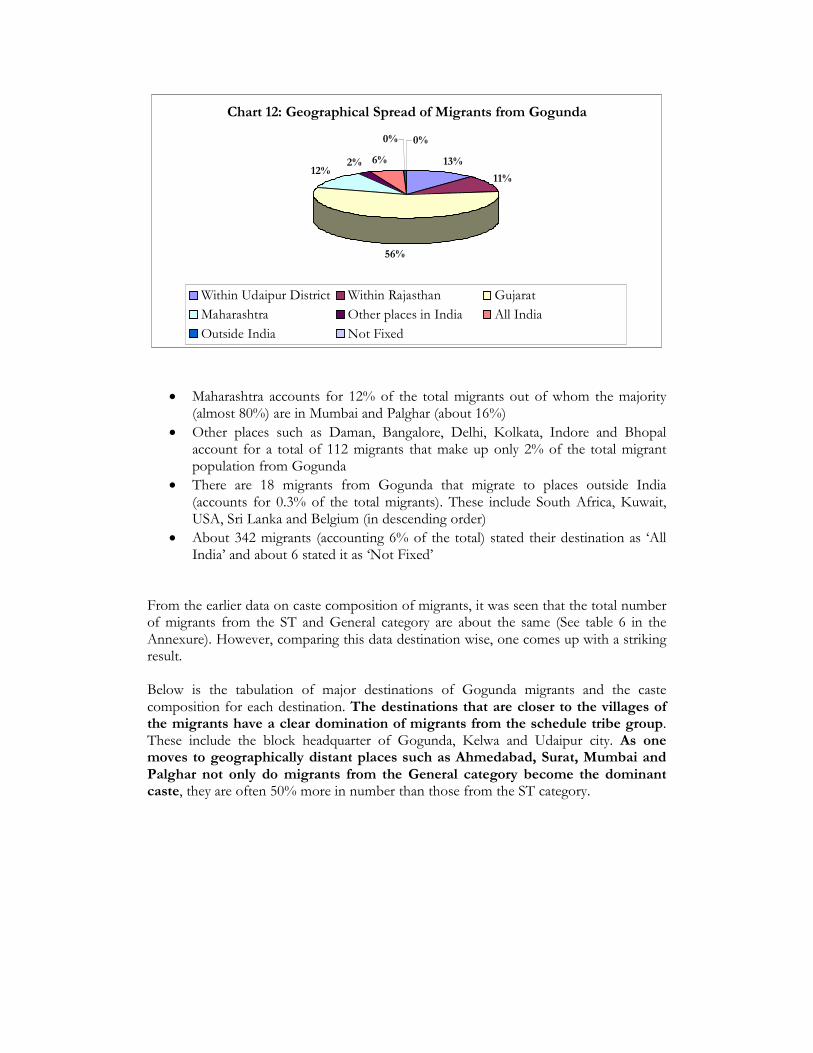
Chart 12: Geographical Spread of Migrants from Gogunda
13%
11%
56%
12%2% 6%
0% 0%
Within Udaipur District Within Rajasthan Gujarat
Maharashtra Other places in India All India
Outside India Not Fixed
• Maharashtra accounts for 12% of the total migrants out of whom the majority (almost 80%) are in Mumbai and Palghar (about 16%)
• Other places such as Daman, Bangalore, Delhi, Kolkata, Indore and Bhopal account for a total of 112 migrants that make up only 2% of the total migrant population from Gogunda
• There are 18 migrants from Gogunda that migrate to places outside India (accounts for 0.3% of the total migrants). These include South Africa, Kuwait, USA, Sri Lanka and Belgium (in descending order)
• About 342 migrants (accounting 6% of the total) stated their destination as ‘All India’ and about 6 stated it as ‘Not Fixed’
From the earlier data on caste composition of migrants, it was seen that the total number of migrants from the ST and General category are about the same (See table 6 in the Annexure). However, comparing this data destination wise, one comes up with a striking result. Below is the tabulation of major destinations of Gogunda migrants and the caste composition for each destination. The destinations that are closer to the villages of the migrants have a clear domination of migrants from the schedule tribe group. These include the block headquarter of Gogunda, Kelwa and Udaipur city. As one moves to geographically distant places such as Ahmedabad, Surat, Mumbai and Palghar not only do migrants from the General category become the dominant caste, they are often 50% more in number than those from the ST category.

Chart 13: Caste wise break up of migrants at Major Destinations
Destination ST SC OBC General Total
Gogunda 73 12 14 9 108
Kelwa 279 4 1 4 288
Udaipur City 215 55 78 159 507
Ahmedabad 145 70 61 208 484
Surat 639 175 253 1158 2225
Mumbai 116 64 66 275 521
Palghar 28 3 21 57 109
Such a tendency for tribals to remain closer to home could be an outcome of cultural and economic factors apart from others factors that may be coming into play - the skill level of tribals vis-à-vis the nature of work in the bigger towns (such as Mumbai) and the lack of established social networks in distant places. (See Table 11 in the Annexure to get a snapshot of the migration trends from Gogunda.)
A summary of our findings in Gogunda
• 54% of the households of Gogunda have at least one member migrating in search of work
• There are 500-600 migrants from every panchayat
• The migration is almost entirely by male members of the family
• Occupations in which migrants are engaged in vary from self-owned businesses to unskilled labour. Sari cutters in the textile industry, shop workers, cooks or helpers in restaurants/hotels, manual labour of different kind, factory workers and Sculptors make up most of the migrants. These occupations
• People engaged in salaried employment are few
• Migration in Gogunda is largely from rural to urban areas such as Surat, Mumbai, Udaipur and Ahmedabad. Other major destinations include Gogunda, Kelwa and Palghar in Maharashtra
• Variations in caste composition of migrants are observed in occupations as well as destinations
• The absence of any identity, payment irregularities, lack of skill or opportunity are the main obstacles faced by migrants here
ANNEXURE 1: Tables of the survey
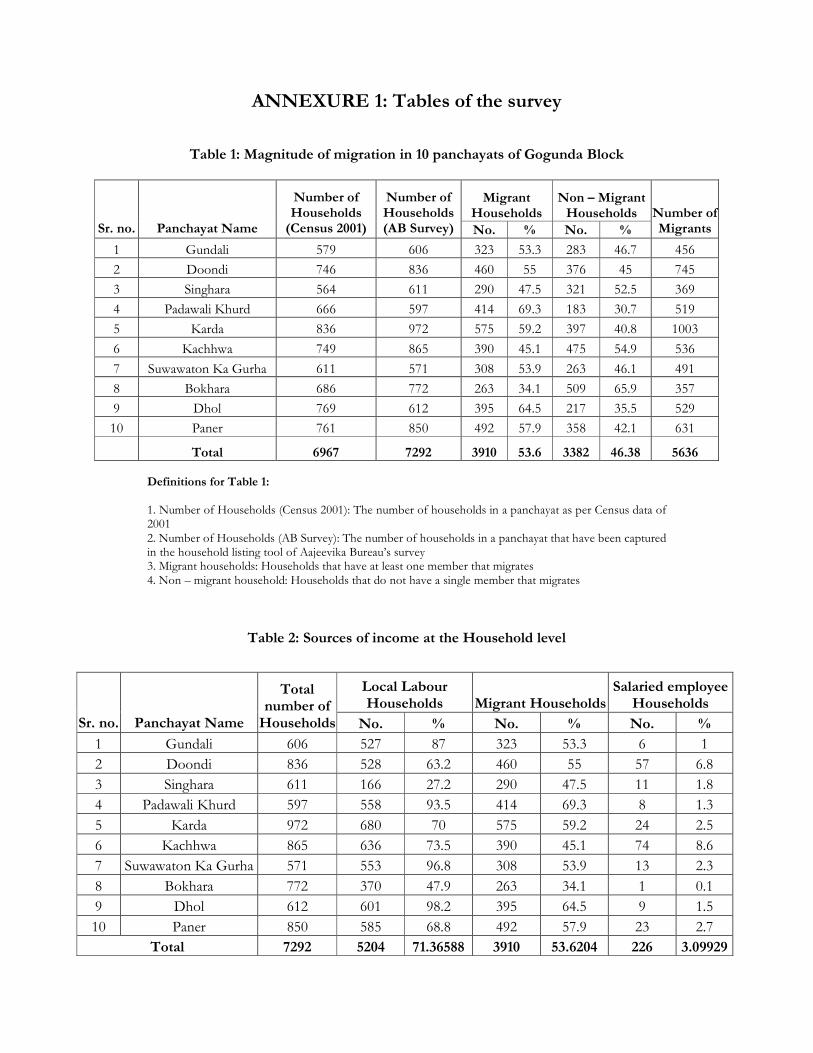
Table 1: Magnitude of migration in 10 panchayats of Gogunda Block
Migrant Households
Non – Migrant Households
Sr. no. Panchayat Name
Number of Households (Census 2001)
Number of Households (AB Survey) No. % No. %
Number of Migrants
1 Gundali 579 606 323 53.3 283 46.7 456
2 Doondi 746 836 460 55 376 45 745
3 Singhara 564 611 290 47.5 321 52.5 369
4 Padawali Khurd 666 597 414 69.3 183 30.7 519
5 Karda 836 972 575 59.2 397 40.8 1003
6 Kachhwa 749 865 390 45.1 475 54.9 536
7 Suwawaton Ka Gurha 611 571 308 53.9 263 46.1 491
8 Bokhara 686 772 263 34.1 509 65.9 357
9 Dhol 769 612 395 64.5 217 35.5 529
10 Paner 761 850 492 57.9 358 42.1 631
Total 6967 7292 3910 53.6 3382 46.38 5636 Definitions for Table 1: 1. Number of Households (Census 2001): The number of households in a panchayat as per Census data of 2001 2. Number of Households (AB Survey): The number of households in a panchayat that have been captured in the household listing tool of Aajeevika Bureau’s survey 3. Migrant households: Households that have at least one member that migrates 4. Non – migrant household: Households that do not have a single member that migrates
Table 2: Sources of income at the Household level
Local Labour Households Migrant Households
Salaried employee Households
Sr. no. Panchayat Name
Total number of Households No. % No. % No. %
1 Gundali 606 527 87 323 53.3 6 1
2 Doondi 836 528 63.2 460 55 57 6.8
3 Singhara 611 166 27.2 290 47.5 11 1.8
4 Padawali Khurd 597 558 93.5 414 69.3 8 1.3
5 Karda 972 680 70 575 59.2 24 2.5
6 Kachhwa 865 636 73.5 390 45.1 74 8.6
7 Suwawaton Ka Gurha 571 553 96.8 308 53.9 13 2.3
8 Bokhara 772 370 47.9 263 34.1 1 0.1
9 Dhol 612 601 98.2 395 64.5 9 1.5
10 Paner 850 585 68.8 492 57.9 23 2.7
Total 7292 5204 71.36588 3910 53.6204 226 3.09929
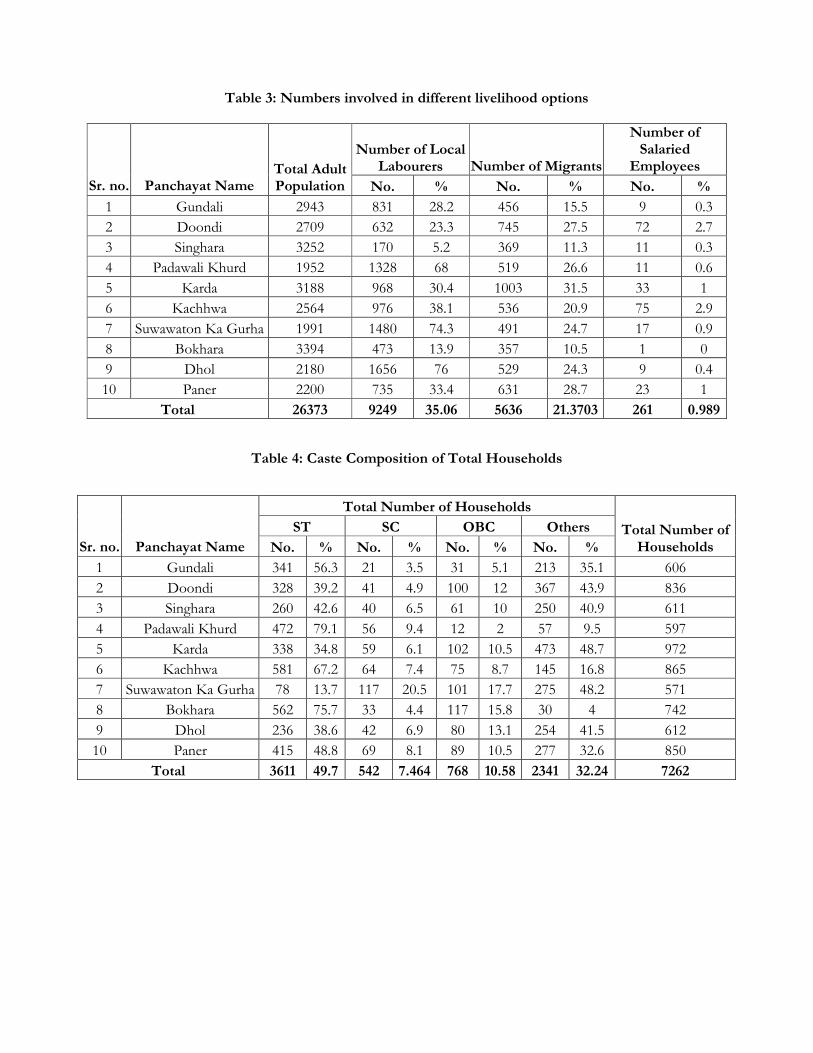
Table 3: Numbers involved in different livelihood options
Number of Local Labourers Number of Migrants
Number of Salaried
Employees
Sr. no. Panchayat Name Total Adult Population No. % No. % No. %
1 Gundali 2943 831 28.2 456 15.5 9 0.3
2 Doondi 2709 632 23.3 745 27.5 72 2.7
3 Singhara 3252 170 5.2 369 11.3 11 0.3
4 Padawali Khurd 1952 1328 68 519 26.6 11 0.6
5 Karda 3188 968 30.4 1003 31.5 33 1
6 Kachhwa 2564 976 38.1 536 20.9 75 2.9
7 Suwawaton Ka Gurha 1991 1480 74.3 491 24.7 17 0.9
8 Bokhara 3394 473 13.9 357 10.5 1 0
9 Dhol 2180 1656 76 529 24.3 9 0.4
10 Paner 2200 735 33.4 631 28.7 23 1
Total 26373 9249 35.06 5636 21.3703 261 0.989
Table 4: Caste Composition of Total Households
Total Number of Households
ST SC OBC Others
Sr. no. Panchayat Name No. % No. % No. % No. % Total Number of
Households
1 Gundali 341 56.3 21 3.5 31 5.1 213 35.1 606
2 Doondi 328 39.2 41 4.9 100 12 367 43.9 836
3 Singhara 260 42.6 40 6.5 61 10 250 40.9 611
4 Padawali Khurd 472 79.1 56 9.4 12 2 57 9.5 597
5 Karda 338 34.8 59 6.1 102 10.5 473 48.7 972
6 Kachhwa 581 67.2 64 7.4 75 8.7 145 16.8 865
7 Suwawaton Ka Gurha 78 13.7 117 20.5 101 17.7 275 48.2 571
8 Bokhara 562 75.7 33 4.4 117 15.8 30 4 742
9 Dhol 236 38.6 42 6.9 80 13.1 254 41.5 612
10 Paner 415 48.8 69 8.1 89 10.5 277 32.6 850
Total 3611 49.7 542 7.464 768 10.58 2341 32.24 7262
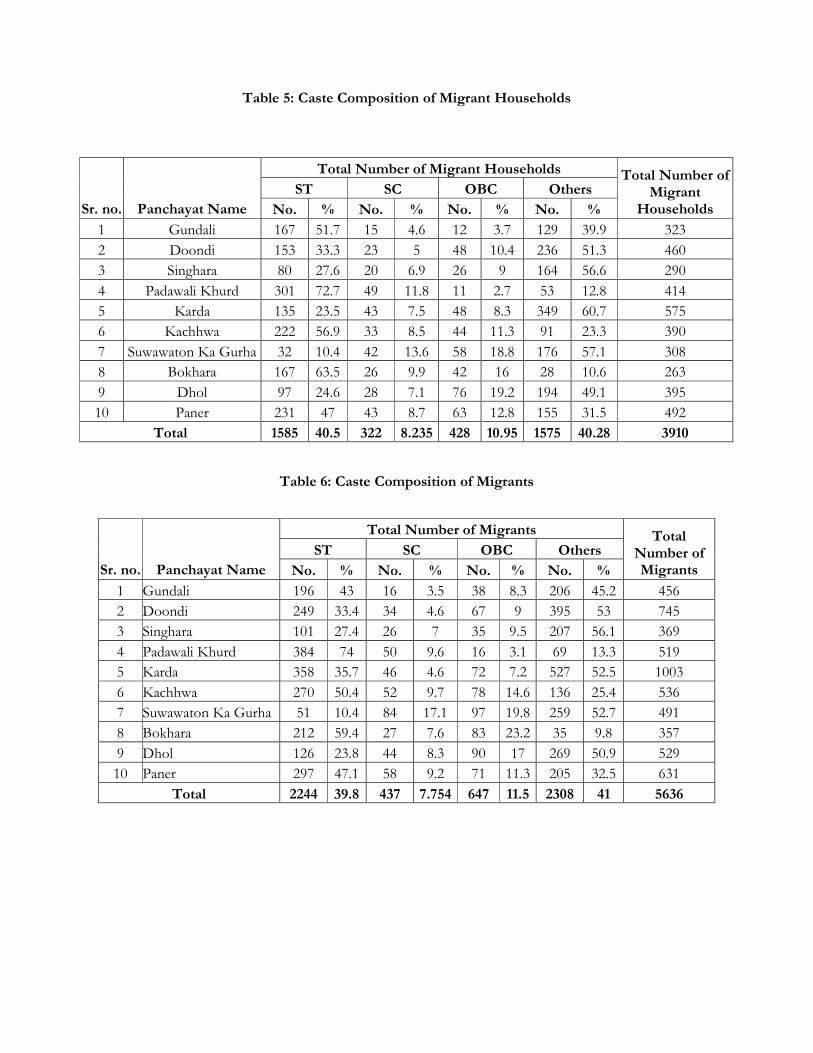
Table 5: Caste Composition of Migrant Households
Table 6: Caste Composition of Migrants
Total Number of Migrants
ST SC OBC Others
Sr. no. Panchayat Name No. % No. % No. % No. %
Total Number of Migrants
1 Gundali 196 43 16 3.5 38 8.3 206 45.2 456
2 Doondi 249 33.4 34 4.6 67 9 395 53 745
3 Singhara 101 27.4 26 7 35 9.5 207 56.1 369
4 Padawali Khurd 384 74 50 9.6 16 3.1 69 13.3 519
5 Karda 358 35.7 46 4.6 72 7.2 527 52.5 1003
6 Kachhwa 270 50.4 52 9.7 78 14.6 136 25.4 536
7 Suwawaton Ka Gurha 51 10.4 84 17.1 97 19.8 259 52.7 491
8 Bokhara 212 59.4 27 7.6 83 23.2 35 9.8 357
9 Dhol 126 23.8 44 8.3 90 17 269 50.9 529
10 Paner 297 47.1 58 9.2 71 11.3 205 32.5 631
Total 2244 39.8 437 7.754 647 11.5 2308 41 5636
Total Number of Migrant Households
ST SC OBC Others
Sr. no. Panchayat Name No. % No. % No. % No. %
Total Number of Migrant
Households
1 Gundali 167 51.7 15 4.6 12 3.7 129 39.9 323
2 Doondi 153 33.3 23 5 48 10.4 236 51.3 460
3 Singhara 80 27.6 20 6.9 26 9 164 56.6 290
4 Padawali Khurd 301 72.7 49 11.8 11 2.7 53 12.8 414
5 Karda 135 23.5 43 7.5 48 8.3 349 60.7 575
6 Kachhwa 222 56.9 33 8.5 44 11.3 91 23.3 390
7 Suwawaton Ka Gurha 32 10.4 42 13.6 58 18.8 176 57.1 308
8 Bokhara 167 63.5 26 9.9 42 16 28 10.6 263
9 Dhol 97 24.6 28 7.1 76 19.2 194 49.1 395
10 Paner 231 47 43 8.7 63 12.8 155 31.5 492
Total 1585 40.5 322 8.235 428 10.95 1575 40.28 3910
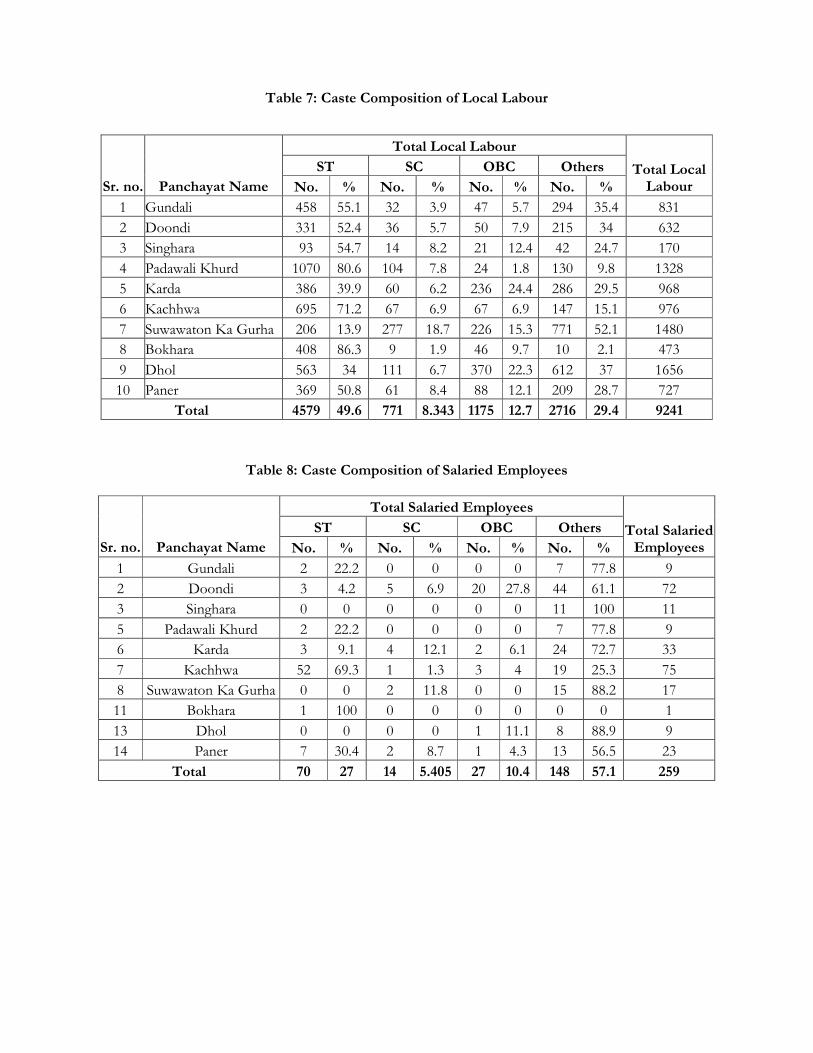
Table 7: Caste Composition of Local Labour
Total Local Labour
ST SC OBC Others
Sr. no. Panchayat Name No. % No. % No. % No. % Total Local
Labour
1 Gundali 458 55.1 32 3.9 47 5.7 294 35.4 831
2 Doondi 331 52.4 36 5.7 50 7.9 215 34 632
3 Singhara 93 54.7 14 8.2 21 12.4 42 24.7 170
4 Padawali Khurd 1070 80.6 104 7.8 24 1.8 130 9.8 1328
5 Karda 386 39.9 60 6.2 236 24.4 286 29.5 968
6 Kachhwa 695 71.2 67 6.9 67 6.9 147 15.1 976
7 Suwawaton Ka Gurha 206 13.9 277 18.7 226 15.3 771 52.1 1480
8 Bokhara 408 86.3 9 1.9 46 9.7 10 2.1 473
9 Dhol 563 34 111 6.7 370 22.3 612 37 1656
10 Paner 369 50.8 61 8.4 88 12.1 209 28.7 727
Total 4579 49.6 771 8.343 1175 12.7 2716 29.4 9241
Table 8: Caste Composition of Salaried Employees
Total Salaried Employees
ST SC OBC Others
Sr. no. Panchayat Name No. % No. % No. % No. % Total Salaried Employees
1 Gundali 2 22.2 0 0 0 0 7 77.8 9
2 Doondi 3 4.2 5 6.9 20 27.8 44 61.1 72
3 Singhara 0 0 0 0 0 0 11 100 11
5 Padawali Khurd 2 22.2 0 0 0 0 7 77.8 9
6 Karda 3 9.1 4 12.1 2 6.1 24 72.7 33
7 Kachhwa 52 69.3 1 1.3 3 4 19 25.3 75
8 Suwawaton Ka Gurha 0 0 2 11.8 0 0 15 88.2 17
11 Bokhara 1 100 0 0 0 0 0 0 1
13 Dhol 0 0 0 0 1 11.1 8 88.9 9
14 Paner 7 30.4 2 8.7 1 4.3 13 56.5 23
Total 70 27 14 5.405 27 10.4 148 57.1 259
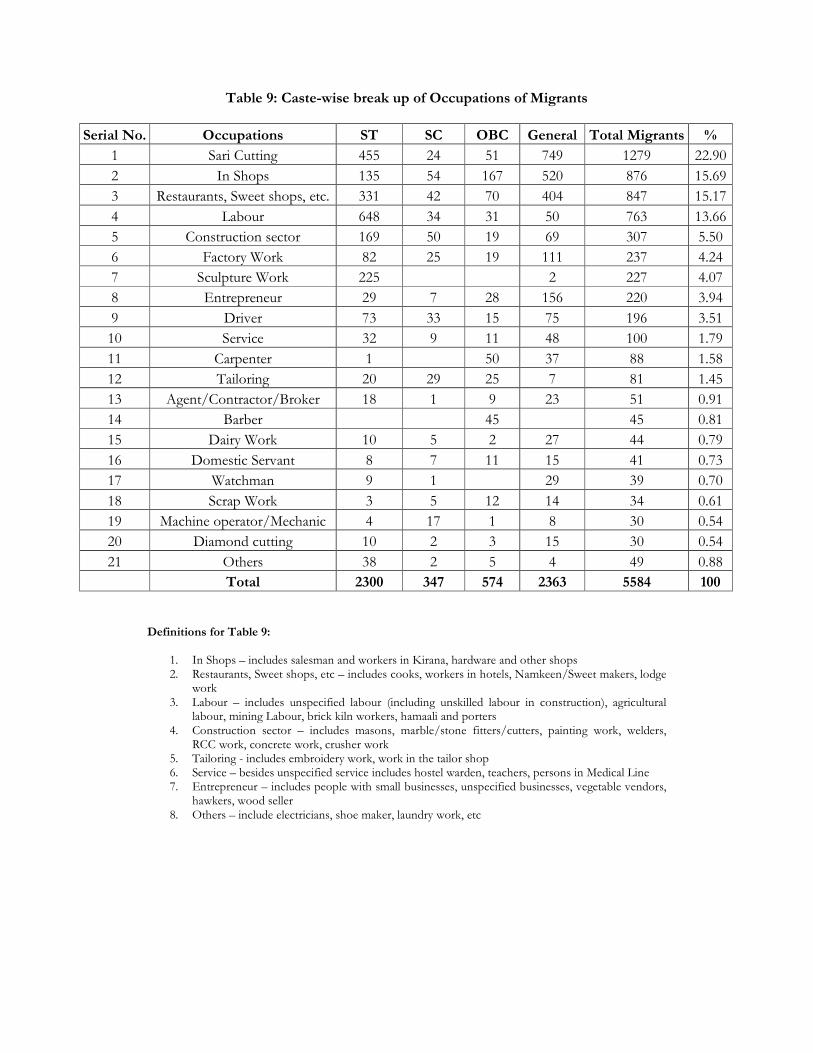
Table 9: Caste-wise break up of Occupations of Migrants
Serial No. Occupations ST SC OBC General Total Migrants %
1 Sari Cutting 455 24 51 749 1279 22.90
2 In Shops 135 54 167 520 876 15.69
3 Restaurants, Sweet shops, etc. 331 42 70 404 847 15.17
4 Labour 648 34 31 50 763 13.66
5 Construction sector 169 50 19 69 307 5.50
6 Factory Work 82 25 19 111 237 4.24
7 Sculpture Work 225 2 227 4.07
8 Entrepreneur 29 7 28 156 220 3.94
9 Driver 73 33 15 75 196 3.51
10 Service 32 9 11 48 100 1.79
11 Carpenter 1 50 37 88 1.58
12 Tailoring 20 29 25 7 81 1.45
13 Agent/Contractor/Broker 18 1 9 23 51 0.91
14 Barber 45 45 0.81
15 Dairy Work 10 5 2 27 44 0.79
16 Domestic Servant 8 7 11 15 41 0.73
17 Watchman 9 1 29 39 0.70
18 Scrap Work 3 5 12 14 34 0.61
19 Machine operator/Mechanic 4 17 1 8 30 0.54
20 Diamond cutting 10 2 3 15 30 0.54
21 Others 38 2 5 4 49 0.88
Total 2300 347 574 2363 5584 100
Definitions for Table 9:
1. In Shops – includes salesman and workers in Kirana, hardware and other shops 2. Restaurants, Sweet shops, etc – includes cooks, workers in hotels, Namkeen/Sweet makers, lodge
work 3. Labour – includes unspecified labour (including unskilled labour in construction), agricultural
labour, mining Labour, brick kiln workers, hamaali and porters 4. Construction sector – includes masons, marble/stone fitters/cutters, painting work, welders,
RCC work, concrete work, crusher work 5. Tailoring - includes embroidery work, work in the tailor shop 6. Service – besides unspecified service includes hostel warden, teachers, persons in Medical Line 7. Entrepreneur – includes people with small businesses, unspecified businesses, vegetable vendors,
hawkers, wood seller 8. Others – include electricians, shoe maker, laundry work, etc
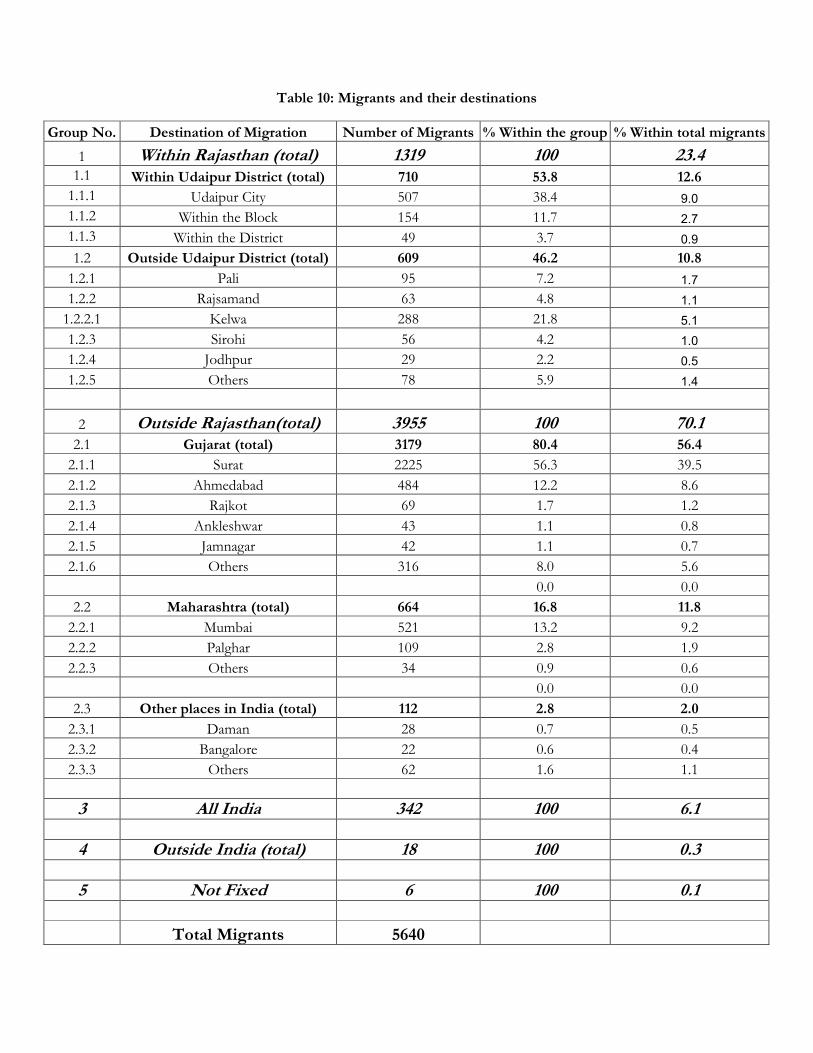
Table 10: Migrants and their destinations
Group No. Destination of Migration Number of Migrants % Within the group % Within total migrants
1 Within Rajasthan (total) 1319 100 23.4 1.1 Within Udaipur District (total) 710 53.8 12.6
1.1.1 Udaipur City 507 38.4 9.0
1.1.2 Within the Block 154 11.7 2.7
1.1.3 Within the District 49 3.7 0.9
1.2 Outside Udaipur District (total) 609 46.2 10.8
1.2.1 Pali 95 7.2 1.7
1.2.2 Rajsamand 63 4.8 1.1
1.2.2.1 Kelwa 288 21.8 5.1
1.2.3 Sirohi 56 4.2 1.0
1.2.4 Jodhpur 29 2.2 0.5
1.2.5 Others 78 5.9 1.4
2 Outside Rajasthan(total) 3955 100 70.1 2.1 Gujarat (total) 3179 80.4 56.4
2.1.1 Surat 2225 56.3 39.5
2.1.2 Ahmedabad 484 12.2 8.6
2.1.3 Rajkot 69 1.7 1.2
2.1.4 Ankleshwar 43 1.1 0.8
2.1.5 Jamnagar 42 1.1 0.7
2.1.6 Others 316 8.0 5.6
0.0 0.0
2.2 Maharashtra (total) 664 16.8 11.8
2.2.1 Mumbai 521 13.2 9.2
2.2.2 Palghar 109 2.8 1.9
2.2.3 Others 34 0.9 0.6
0.0 0.0
2.3 Other places in India (total) 112 2.8 2.0
2.3.1 Daman 28 0.7 0.5
2.3.2 Bangalore 22 0.6 0.4
2.3.3 Others 62 1.6 1.1
3 All India 342 100 6.1 4 Outside India (total) 18 100 0.3 5 Not Fixed 6 100 0.1
Total Migrants 5640
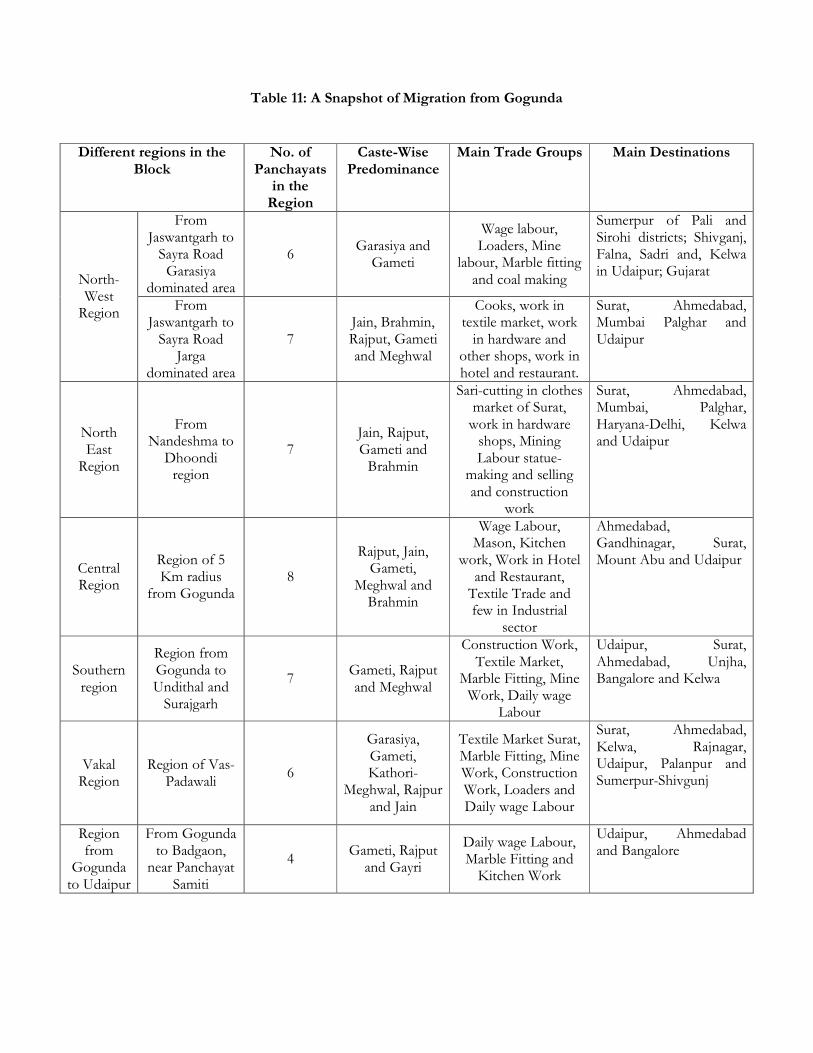
Table 11: A Snapshot of Migration from Gogunda
Different regions in the Block
No. of Panchayats
in the Region
Caste-Wise Predominance
Main Trade Groups Main Destinations
From Jaswantgarh to Sayra Road Garasiya
dominated area
6 Garasiya and
Gameti
Wage labour, Loaders, Mine
labour, Marble fitting and coal making
Sumerpur of Pali and Sirohi districts; Shivganj, Falna, Sadri and, Kelwa in Udaipur; Gujarat
North-West Region
From Jaswantgarh to Sayra Road
Jarga dominated area
7 Jain, Brahmin, Rajput, Gameti and Meghwal
Cooks, work in textile market, work in hardware and
other shops, work in hotel and restaurant.
Surat, Ahmedabad, Mumbai Palghar and Udaipur
North East
Region
From Nandeshma to
Dhoondi region
7 Jain, Rajput, Gameti and Brahmin
Sari-cutting in clothes market of Surat, work in hardware shops, Mining Labour statue-
making and selling and construction
work
Surat, Ahmedabad, Mumbai, Palghar, Haryana-Delhi, Kelwa and Udaipur
Central Region
Region of 5 Km radius
from Gogunda 8
Rajput, Jain, Gameti,
Meghwal and Brahmin
Wage Labour, Mason, Kitchen
work, Work in Hotel and Restaurant, Textile Trade and few in Industrial
sector
Ahmedabad, Gandhinagar, Surat, Mount Abu and Udaipur
Southern region
Region from Gogunda to Undithal and Surajgarh
7 Gameti, Rajput and Meghwal
Construction Work, Textile Market,
Marble Fitting, Mine Work, Daily wage
Labour
Udaipur, Surat, Ahmedabad, Unjha, Bangalore and Kelwa
Vakal Region
Region of Vas-Padawali
6
Garasiya, Gameti, Kathori-
Meghwal, Rajpur and Jain
Textile Market Surat, Marble Fitting, Mine Work, Construction Work, Loaders and Daily wage Labour
Surat, Ahmedabad, Kelwa, Rajnagar, Udaipur, Palanpur and Sumerpur-Shivgunj
Region from
Gogunda to Udaipur
From Gogunda to Badgaon,
near Panchayat Samiti
4 Gameti, Rajput
and Gayri
Daily wage Labour, Marble Fitting and Kitchen Work
Udaipur, Ahmedabad and Bangalore
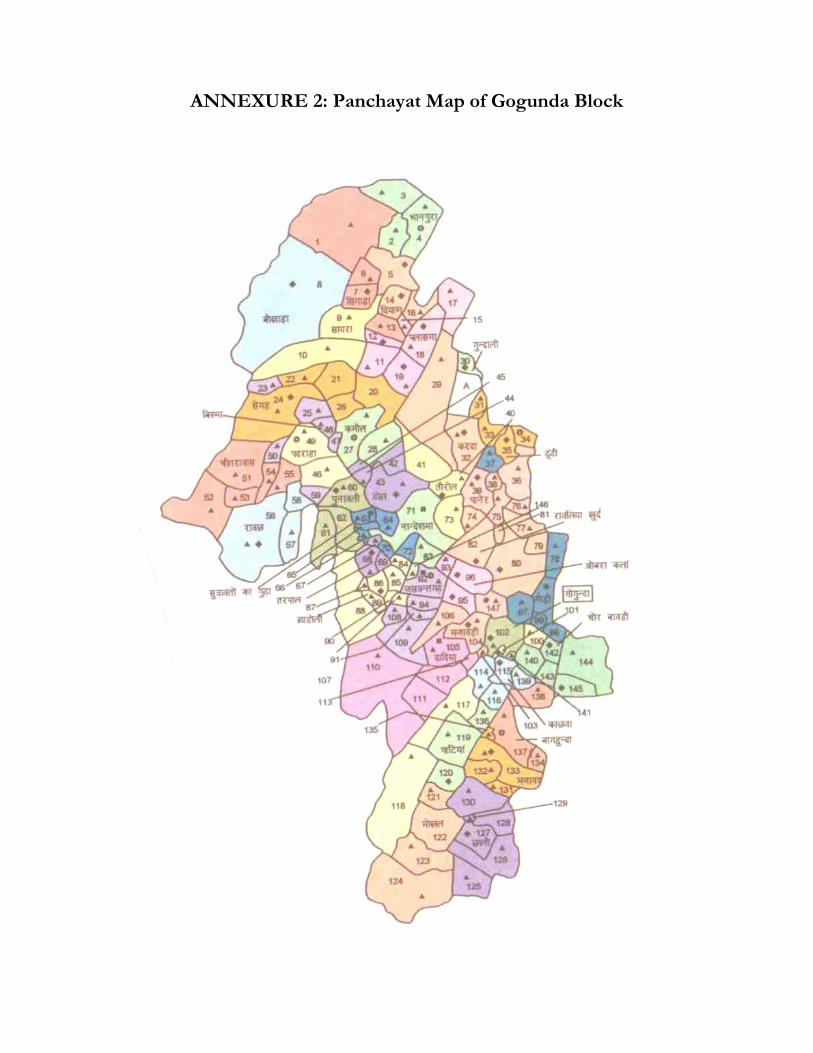
ANNEXURE 2: Panchayat Map of Gogunda Block

ANNEXURE 3: Household listing tool for AB’s Survey