Embed Size (px)
Citation preview

i
Migration and social mobilityThe life chances of Britain’s minority ethnic communities

ii
Migration and social mobility
This publication can be provided in alternativeformats, such as large print, Braille, audiotape andon disk. Please contact: CommunicationsDepartment, Joseph Rowntree Foundation,The Homestead, 40 Water End, York YO30 6WP.Tel: 01904 615905. Email: [email protected]
iii
Migration and social mobilityThe life chances of Britain’s minority ethnic communities
Lucinda Platt
iv
Migration and social mobility
First published in Great Britain in November 2005 by
The Policy Press
Fourth Floor, Beacon House
Queen’s Road
Bristol BS8 1QU
UK
Tel no +44 (0)117 331 4054
Fax no +44 (0)117 331 4093
Email [email protected]
www.policypress.org.uk
© University of Essex 2005
Published for the Joseph Rowntree Foundation by The Policy Press
ISBN 1 86134 822 3
British Library Cataloguing in Publication Data
A catalogue record for this book is available from the British Library.
Library of Congress Cataloging-in-Publication Data
A catalog record for this book has been requested.
Lucinda Platt is Lecturer in Sociology at the University of Essex.
All rights reserved: no part of this publication may be reproduced, stored in a retrieval system, or transmitted in any
form or by any means, electronic, mechanical, photocopying, recording or otherwise without the prior written
permission of the Publishers.
The Joseph Rowntree Foundation has supported this project as part of its programme of research and innovative
development projects, which it hopes will be of value to policy makers, practitioners and service users. The facts
presented and views expressed in this report are, however, those of the author and not necessarily those of the
Foundation.
The statements and opinions contained within this publication are solely those of the author and not of The University
of Bristol or The Policy Press. The University of Bristol and The Policy Press disclaim responsibility for any injury to
persons or property resulting from any material published in this publication.
The Policy Press works to counter discrimination on grounds of gender, race, disability, age and sexuality.
Cover design by Qube Design Associates, Bristol
Printed in Great Britain by Hobbs the Printers Ltd, Southampton
v
List of tables and figures viAcknowledgements viii
1 Introduction 1Background 1What can this study add? 3Data and methods 5
2 Origins and destinations: social mobility and the changing social structure of 8England and WalesPrevious findings 8The changing occupational structure 9Class transitions from origins to destinations 11Summary of ethnic groups’ social mobility 15
3 Explaining social class outcomes 18Achieving higher social class outcomes 19Interaction effects 27Examining all destinations 28What can religion add? 30
4 Conclusions 34
References 37Appendix 40
Contents••••••••••••••••••••••••••••••••••••••••••••••••••••••••••••••••••••••••••••••••••••••••••••••••••••••••••••••••••••••••••••••••••••••••••••••••••••••••••••••••••••••••••••••••••••••••••••••••
••••••••••••••••••••••••••••••••••••••••••••••••••••••••••••••••••••••••••••••••••••••••••••••••••••••••••••••••••••••••••••••••••••••••••••••••••••••••••••••••••••••••••••••••••••••••••••••••
••••••••••••••••••••••••••••••••••••••••••••••••••••••••••••••••••••••••••••••••••••••••••••••••••••••••••••••••••••••••••••••••••••••••••••••••••••••••••••••••••••••••••••••••••••••••••••••••
••••••••••••••••••••••••••••••••••••••••••••••••••••••••••••••••••••••••••••••••••••••••••••••••••••••••••••••••••••••••••••••••••••••••••••••••••••••••••••••••••••••••••••••••••••••••••••••••
••••••••••••••••••••••••••••••••••••••••••••••••••••••••••••••••••••••••••••••••••••••••••••••••••••••••••••••••••••••••••••••••••••••••••••••••••••••••••••••••••••••••••••••••••••••••••••••••
vi
Migration and social mobility
List of tables and figuresTables
1.1 Numbers from minority ethnic groups in the samples selected for study from the ONS LS 62.1 Percentages of each parental class (origins) of the two cohorts (row percentages) 92.2 Proportions of the two cohorts in different destination classes in 2001 (row percentages) 92.3 Change in occupational structure between 1971/81 and 2001 (row percentages) 102.4 Ethnic group distributions, pooled sample, 2001 112.5 Social class destinations 2001 according to social class origins 1971/81 (row percentages) 122.6 Social class destinations 2001 according to social class origins (row percentages): 12
white non-migrants2.7 Social class destinations 2001 according to social class origins (row percentages): Caribbeans 132.8 Social class destinations 2001 according to social class origins (row percentages): Indians 132.9 Social class destinations 2001 according to social class origins (row percentages): Pakistanis 132.10 Social class destinations 2001 according to social class origins (row percentages): white migrants 142.11 Upward and downward mobility by ethnic group and mobility implied by changing 16
class structure alone3.1 Relative risks of working class rather than professional/managerial class outcome according 29
to own characteristics and varying ethnic group coefficientA1 Logistic regressions of probability of professional/managerial destination in 2001, 41
controlling for individual and background characteristicsA2 Multinomial logistic regression of destinations at 2001 controlling for individual and 42
background variablesA3 The effects of religion on professional/managerial destination 2001, controlling for 43
relevant characteristicsA4 The effects of religion on professional/managerial destination 2001 among Indians, 44
controlling for relevant characteristics
Figures
1.1 The factors complicating measurement of mobility through use of comparison of cross-sections 42.1 The changing class distribution for the study sample compared with their parents, 10
1971/81 to 20012.2 Percentages from different ethnic groups ending up in particular class destinations, by 15
their class origins2.3 The composition of 2001 class positions according to parental social class origins, 16
by ethnic group3.1 Proportionate class gains or losses from individual to family class allocation in 2001 22
by ethnic group: men3.2 Proportionate class gains or losses from individual to family class allocation in 2001 23
by ethnic group: women3.3 The proportion from each group predicted to be in professional/managerial class 25
(95% confidence intervals given in brackets)3.4 The proportion from each class of origin predicted to be in professional/managerial class, 26
by sex

vii
List of tables and figures
3.5 The proportion from working-class origins from a selection of ethnic groups predicted 27to be in professional/managerial class, with alternative ethnic group effects (95%confidence intervals given in brackets)
3.6 Overlap between religion and ethnic group for certain groups and religions 303.7 Religious breakdown of Indian ethnic group 323.8 Predicted probabilities of professional/managerial class outcomes for Indians according to 33
their religion

viii
Migration and social mobility
I am grateful to the Office for National Statistics(ONS) for accepting my proposal to Beta Test theONS Longitudinal Study (ONS LS) 2001 Censusdata, on which this research is based. I am alsograteful to CeLSIUS and Julian Buxton inparticular, for facilitating my access to the ONSLS, for responding to queries and for checkinginnumerable lengthy output files. I would alsolike to thank Alec Ross, of ONS, who encouragedme to undertake the Beta Test and supported myapplication, and who has since cleared variousoutputs resulting from the research.
The Joseph Rowntree Foundation generouslysupported this research under their Censusprogramme. I am grateful to them and to AnneHarrop in particular for the interest she showedin the project. I would also like to thank all themembers of the advisory group who gave of theirtime to make invaluable comments andsuggestions: Bola Akinwale, David Blackaby,Anthony Heath, James Nazroo and Mike Savage.
Preliminary results from this research werepresented at the launch of the ONS LS inSeptember 2004. I am grateful to all participantsat that event for their comments and questions. Iwould also like to thank participants of a seminarat the University of Bath and colleagues at theUniversity of Essex, in particular Stephen Jenkins,for their comments.
The Policy Press have, once again, been apleasure to work with and I would like to thankall those involved in seeing this report through topublication.
Acknowledgements
1
Background
While Britain has always been a country ofimmigration and some of its minority grouppopulations have been here for an extremely longperiod, the current minority ethnic populations arelargely the result of immigration in the post-warperiod from former colonies or Commonwealthcountries (Solomos, 1989; Goulborne, 1998; Mason,2000). The experience of these immigrantpopulations and their children and grandchildrenhas been a mixed one, and the different groupsshow great diversity in terms of income,employment, educational achievement and lifechances (Modood et al, 1997; Platt, 2002; Mason,2003).
This diversity will be in part a consequence offactors associated with the processes of migration:the reason for migration; the different economic,social and human capital that the migrants broughtwith them; the stage of life and the point in time atwhich migration occurred and the opportunitiesavailable at that time. But it is also likely that thediversity has been shaped by the experience of thedifferent groups over time in Britain: the length oftime spent in Britain; the characteristics of the areasof settlement – and the possibilities forgeographical mobility within Britain; the experienceof racism, and responses to it; interaction with theeducation system and the labour market over time.When exploring the experience of the ‘second’(non-migrant) generation, this leads to aconsideration of whether different groups’ socialand economic origins – the situation of their parentsand what their parents brought with them in termsof economic resources and human capital(education/qualifications) – are crucial in explainingtheir outcomes and the diversity between groups.Or, conversely, are parental origins less importantthan distinct intersections of location, discriminationand even onward migration experienced by thedifferent populations within Britain?
There have been a number of explanations putforward to account both for differences betweengenerations of the same ethnic group in a particularcountry and for the long-term outcomes of differentethnic groups. It is argued that the migrantgeneration can be expected to differ from thesucceeding generation, born and brought up in thecountry of immigration, in a number of (possiblyconflicting) ways, within which the migrant’smigration history and own characteristics are givendifferent degrees of attention. Initially, lack ofnetworks and familiarity with the ‘host’ communitycan be expected to depress the occupationalachievement of the migrants, relative to their skillsand education. This may be exacerbated if themigration was forced rather than voluntary. In thismodel, assimilation will lead to the secondgeneration being much closer to their peers fromthe host community in educational andoccupational terms (Park, 1950; see also Gordon,1964; and Alba and Nee, 1997).
While at the institutional and analytical levelassimilation has been less fully endorsed in Britishaccounts, we have seen a related argument for the‘recovery’ of the underlying or latent class positionof the first generation in the second generation (forexample, Modood, 1997a; see also Heath andMcMahon (2005) for a consideration of theinternational salience of higher-class origins).Groups, such as Indians or Chinese, who (or someof who) had more highly skilled and highlyeducated origins and were more likely toexperience downward migration on arrival, wereseen as reasserting their backgrounds in the secondgeneration; while those whose class position onarrival in Britain showed greater continuity with aless skilled background were seen as continuing toremain at the less skilled end of the class spectrumin future generations. This argument has been usedin particular to explain the high levels ofachievement of Indians and African Asians insuccessive generations. Indeed, the separationbetween African Asians and Indians in the Fourth
1Introduction
2
Migration and mobility
National Survey of Ethnic Minorities was informedby, as well as reinforcing, such a perspective(Modood et al, 1997).
Daniel (1968) drew attention to the extent ofdownward mobility experienced by immigrantsfollowing their entry into Britain. The lack oftransparent congruence between qualifications andoccupational class (Heath and Ridge, 1983;Modood, 1997b) is also taken as some evidence ofdownward mobility in the migrant generation.Alternatively, Smith (1977) emphasised howmigrants employed in particular occupationalniches, such as Pakistanis employed in the textileindustry, may be accounted for by priorexperience. The role of geographical factors – theinfluence of area or region of initial settlement ofmigrants – has also been considered important inshaping or mediating outcomes for the secondgeneration (Galster et al, 1999; see also Dorsett,1998). Such areas of settlement are themselves notindependent of the period of migration,opportunities for employment in different areas,and the match between those opportunities andthe skills that the migrants bring with them. In sofar as location of initial settlement and subsequentgeographical mobility varies by migrant group, it islikely to result in systematic differences in theexperiences of different minority ethnic groups inthe longer term. Such evidence has contributed toan argument that the current occupational profilesof minority ethnic groups may owe much to theirpre-migration history.
Moreover, migrants are acknowledged as a selectedsample, who may have particular levels ofmotivation that caused them to migrate in the firstplace, but that may not be directly passed on totheir children. This could mean that the secondgeneration might be expected to fare less well thantheir parents in occupational terms, particularly ifthe children find that being born and bred in acountry does not exempt them from racism anddiscrimination. The poor health status of certainminority groups in Britain, has, on occasion beendiscussed in these terms (see, for example, Marmotet al, 1984; Nazroo, 1997).
A perspective that amalgamates aspects of both theassimilation thesis and the relevance of pre-migration history and background suggests that it iscrucial what migrant parents bring with them andwhat they transmit to their children in terms ofaspirations and determination to succeed in thecontext of and interacting with a specific social and
institutional (and often hostile) environment (see,for example, Modood, 2004). Such a perspective,without endorsing a beneficent assimilation process,nevertheless locates potential for relative successwithin the second generation, but links it toparticular, selected characteristics of the parents.Specifically, parental commitment to education andto achieving upward mobility through education isregarded as critical, and certain groups areidentified as especially likely to hold – or reveal –such a commitment (Archer and Francis,forthcoming). The problem with this position is thatcommitment to educational success is easier toexpress in the context of actual educationalsuccess, which may, in fact, be linked to non-ethnicgroup-specific factors. It could be that a group’ssense of educational achievement shapes theconstruction of internal group identity rather than apre-existing group-based commitment toeducational success driving the educationalachievement of successive generations.
While there is some support for all of thesearguments in the wider literature; in the Britishcontext, the complexity of the issue and practicalconstraints of measurement and investigation havetended to limit the possibilities for determiningtheir relative strength. Which account holds best forBritain’s ethnic minorities, for understanding theirrelative positions in the course of the transitionfrom “immigrant groups to new ethnic minorities”(Castles, 2000) will tend to shift with the way thefirst and second generations are defined, andaccording to which ethnic group is the principalfocus of interest.
Exploring patterns of intergenerational mobility, theway that parents’ and children’s occupational/classoutcomes relate to one another is one way ofgaining a more developed grasp of such questions;and therefore of understanding trends and policyimplications. However, while there is a vast body ofresearch into social mobility in Britain generally(see, for example, Goldthorpe et al, 1987; Marshallet al, 1997; Prandy 1998; Bottero and Prandy, 2000;Heath and Payne, 2000; Savage, 2000), and theway it is mediated by education specifically (forexample, Halsey et al, 1980), our understanding ofthe processes of social mobility as they differ byethnic group and the causes of such differences isextremely limited.
There are few British sources that can directly relateparents’ and children’s outcomes for minority ethnicgroups. (But see the discussion of Anthony Heath’s
3
work, below. Even here, however, cross-sectionaldata with retrospective reporting rather than trulylongitudinal data were used.) Therefore, for thepurpose of understanding change across time andbetween groups and developing inferences, ‘first’and ‘second’ generations tend to be constructedfrom cross-sections of minority groups at successivetime points (for example, Modood, 1997a;Robinson, 1990). Obviously in such cases, the ‘firstgeneration’ are not strictly speaking the parents ofthe ‘second generation’, and the probability that thetwo even approximate to migrant parents and theirBritish-born children will vary with ethnic group(and migration histories). If ethnic groups are stillforming and expanding, then the later time pointwill capture new migrants as well as the ‘secondgeneration’. If the group is subject to substantialreturn or onward migration, many of the potentialsecond generation from the first time point willhave been lost. Moreover, the point in their careerat which they are measured will contribute towhether upward mobility is observed or not, withthose who are younger being less likely to havereached their final class destination.
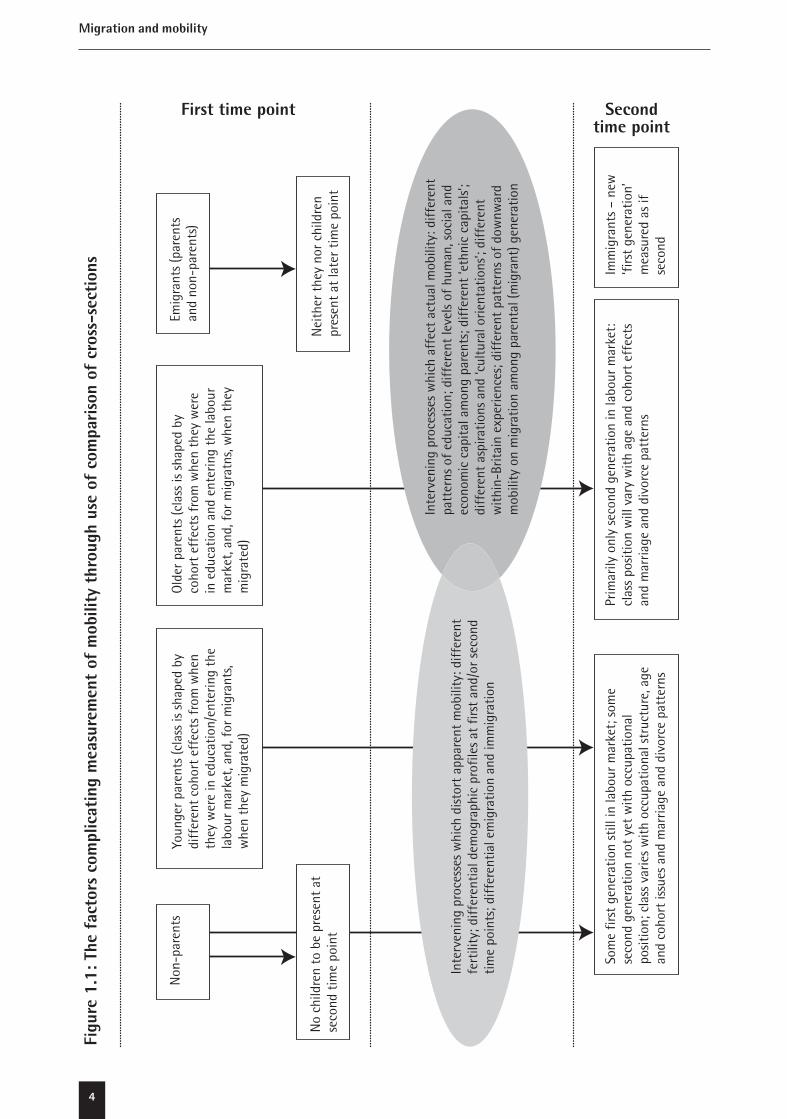
In addition, the stage at which ‘success’ is achievedmay vary by ethnic group: substantial investment ineducation may produce later returns. (Suchdifferences in the timing of educationalachievement can be observed, for example, in theYouth Cohort Study; see, for example, DfES, 2001.)While it is of inherent interest to observe thechanging profile of a group over time by examiningsucceeding cross-sections, it is more difficult tomake confident claims about processes involved inshaping those profiles. I have illustrated thesepoints about the complexity of comparing cross-sections in Figure 1.1 overleaf. The interveningprocesses in the oval to the right identify thosewhich are of inherent interest in studying socialmobility and which are, in theory, measurablethrough directly relating parents’ characteristics andtheir children’s outcomes as adults. Those in theoval to the left are factors that may distort apparentmobility patterns when mobility is inferred throughcomparison of cross-sections.
Work by Anthony Heath and collaborators has madeuse of some of the few available sources for thedirect measurement of social mobility betweenparents and children. In engaging directly withparent-to-child mobility by ethnic group usingcross-sectional sources with retrospective report ofparents’ (or, more commonly, father’s) occupation,he has illustrated, for example, both differences by
ethnic group and the international salience of‘service’ class origins (Heath and Ridge, 1983;Heath and McMahon, 2005). However, in theformer case, the relationship that was beingmeasured was that between the migrant’s parents’class and the migrant’s own occupational situationin Britain. Heath and Ridge (1983) thus showed thelevels of downward mobility relative to theirparents’ background that ethnic minorities faced inBritain. In the latter case, the respondents were amixture of migrants themselves and secondgeneration, but there was no distinction betweenwhether class of origin was being measured pre- orpost-migration (in most cases, it was in fact pre-migration). Thus, Heath and McMahon (2005)illustrated how migrants’ backgrounds wereimportant in their occupational attainment, but thatan ‘ethnic penalty’ nevertheless still prevailed.However, they could not take account of potentialinternational non-correspondence of classes nor ofwhat the processes of class mobility had beenfollowing migration. In both these importantarticles, as a result, the contribution of processesoperating within Britain could not be elucidated.
In summary, most of the ethnically differentiatedresearch has consisted of comparisons of cross-sections, and most of the direct research intointergenerational mobility has been non-ethnicallydifferentiated. And even those rare studies thathave measured mobility for different ethnic groupsdirectly are problematic in terms of comparison, asparental class may be measured pre-migration. Suchintergenerational mobility studies are therefore notdirectly comparable with most cross-sections orwith non-ethnically differentiated studies. A movein the direction of producing a study that filled thisgap was provided by Platt (2005). The researchdescribed and reported here pursued thatapproach, and substantially extended anddeveloped it.
What can this study add?
This Report makes an original contribution todiscussions of minority group experience in Britainand transitions between the immigrant and the‘second’ generations by observing and analysingactual parent-to-child social-class transitions byethnic group, where class is measured in Britain forboth parents and children. That is, it exploitsgenuinely longitudinal data to trackintergenerational transitions. It makes an innovativecontribution to the literature on minority ethnic
Introduction
4
Migration and mobility
Figu
re 1
.1: T
he f
acto
rs c
ompl
icat
ing
mea
sure
men
t of
mob
ility
thr
ough
use
of
com
pari
son
of c
ross
-sec
tion
s
Youn
ger
pare
nts
(cla
ss is
sha
ped
by
diff
eren
t co
hort
eff
ects
fro
m w
hen
they
wer
e in
edu
cati
on/e
nter
ing
the
labo
ur m
arke
t, an
d, f
or m
igra
nts,
whe
n th
ey m
igra
ted)
Som
e fi
rst
gene
rati
on s
till
in la
bour
mar
ket;
som
e se
cond
gen
erat
ion
not
yet
wit
h oc
cupa
tion
al
posi
tion
; cla
ss v
arie
s w
ith
occu
pati
onal
str
uctu
re, a
ge
and
coho
rt is
sues
and
mar
riage
and
div
orce
pat
tern
s
Prim
arily
onl
y se
cond
gen
erat
ion
in la
bour
mar
ket:
cl
ass
posi
tion
will
var
y w
ith
age
and
coho
rt e
ffec
ts
and
mar
riage
and
div
orce
pat
tern
s
Imm
igra
nts
– ne
w
‘firs
t ge
nera
tion
’ m
easu
red
as if
se
cond
Nei
ther
the
y no
r ch
ildre
n pr
esen
t at
late
r ti
me
poin
tN
o ch
ildre
n to
be
pres
ent
at
seco
nd t
ime
poin
t
Non
-par
ents
Emig
rant
s (p
aren
ts
and
non-
pare
nts)
Old
er p
aren
ts (c
lass
is s
hape
d by
co
hort
eff
ects
fro
m w
hen
they
wer
e in
edu
cati
on a
nd e
nter
ing
the
labo
ur
mar
ket,
and,
for
mig
ratn
s, w
hen
they
m
igra
ted)
Inte
rven
ing
proc
esse
s w
hich
aff
ect
actu
al m
obili
ty: d
iffe
rent
pa
tter
ns o
f ed
ucat
ion;
dif
fere
nt le
vels
of
hum
an, s
ocia
l and
ec
onom
ic c
apit
al a
mon
g pa
rent
s; d
iffe
rent
‘eth
nic
capi
tals
’; di
ffer
ent
aspi
rati
ons
and
‘cul
tura
l orie
ntat
ions
’; di
ffer
ent
wit
hin-
Brit
ain
expe
rienc
es; d
iffe
rent
pat
tern
s of
dow
nwar
d m
obili
ty o
n m
igra
tion
am
ong
pare
ntal
(mig
rant
) gen
erat
ion
Secondtime point
First time point
Inte
rven
ing
proc
esse
s w
hich
dis
tort
app
aren
t m
obili
ty: d
iffe
rent
fe
rtili
ty; d
iffe
rent
ial d
emog
raph
ic p
rofi
les
at f
irst
and/
or s
econ
d ti
me
poin
ts; d
iffe
rent
ial e
mig
rati
on a
nd im
mig
rati
on

5
group class distributions and outcomes bydemonstrating such direct parent-to-child classtransitions across the ‘first’ and ‘second’ generations,rather than inferring them from comparisons ofcross-sections from different periods.
It observes children growing up in England andWales of similar ages and thus comparableeducation and employment histories from differentethnic groups, with destinations measured at thesame point in time for all of them. They aretherefore suited to comparison of their patterns oforigins as they relate to their destinations, withoutthe complicating issues of period and cohorteffects, that is, without differential influence fromthe point in time at which characteristics aremeasured or from having an earlier rather than alater birth date.1 It shows the patterns of classmobility for a large sample of children of studymembers whose class is measured in 2001 andcompared with that of their parents measured in1971 or 1981, when they were at – or about tostart – school in England and Wales. It thereforeilluminates understanding of the relationshipbetween ethnicity and class origins withoutnecessitating any assumptions about theinternational comparability of classes.
It asks the fundamental questions:
• Do patterns of intergenerational social mobilityvary by ethnic group?
• If so, what are the relative roles of differentialclass background, migration effects and the‘ethnic penalty’ in explaining such differences?
• Are outcomes mediated by educationalachievement in the second generation?
Engaging with discussions around the importance ofreligion in shaping life chances, and takingadvantage of the new question on religion in the2001 Census in England and Wales, it also asks:
• Do patterns of intergenerational mobility vary byreligious affiliation?
• What can religion add to our understanding ofethnic group differences?
The Report offers a chance better to understandsome of the key issues facing research into ethnicgroup diversity, disadvantage and success.
Data and methods2
To explore these issues, this study uses the ONSLongitudinal Study. The ONS Longitudinal Study(henceforth the LS) is a one per cent sample of thepopulation of England and Wales that is followedover time. It was initially obtained by taking asample of the 1971 Census, based on those born onone of four birth dates (day and month).Information from samples taken at each subsequentCensus has been added to the study. Members arealso added to the study between Censuses bylinking information on births and immigrations usingthe same selection criteria. Data on events thatoccur to sample members – births of children tothem, infant deaths, deaths of spouses and cancerregistrations – are also added. No more informationis linked where study members’ records indicatethat they have died or left England and Wales(unless emigrants re-enter at a later date, in whichcase they are re-incorporated into the study).
The ONS Longitudinal Study has some keyadvantages when it comes to exploringintergenerational mobility and ethnicity, namely thesize of the study sample, which facilitates analysis byethnic group at relatively disaggregated levels, andthe longitudinal design of the study, which allowsintergenerational mobility to be tracked directly.
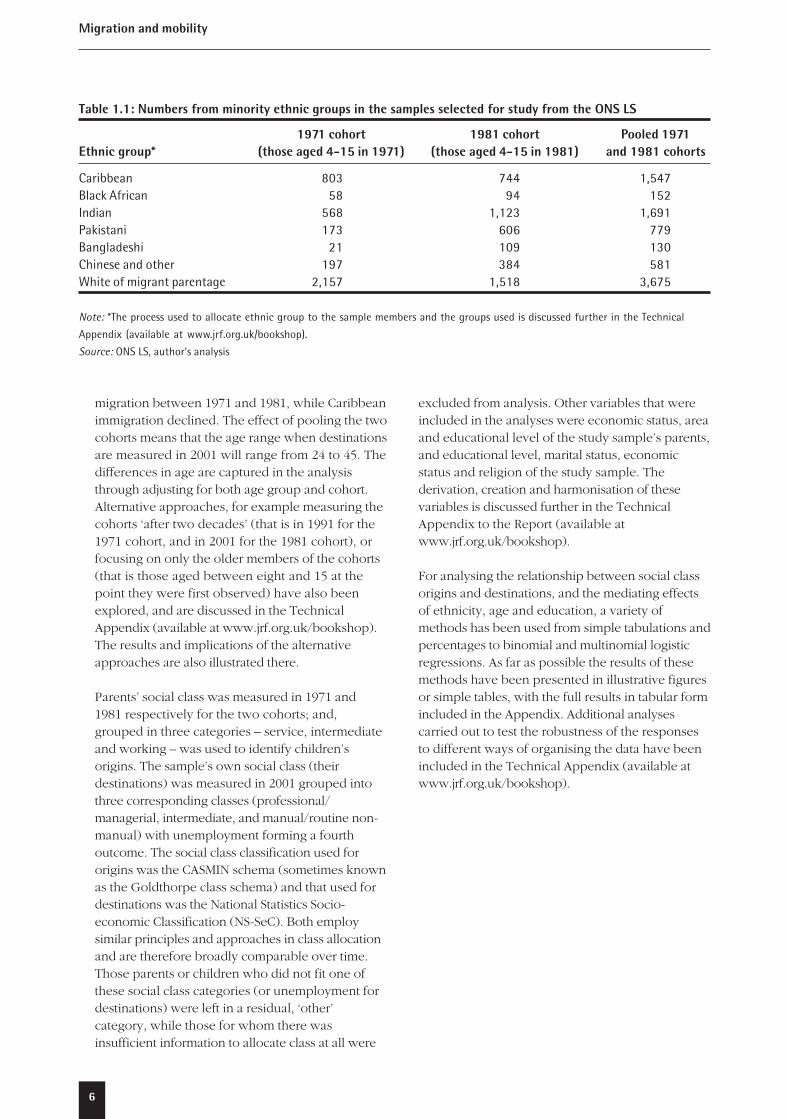
For this study, two cohorts of children agedbetween four and 15 at the point they wereobserved in the LS have been selected from boththe 1971 and the 1981 records in the LS. They arecalled the ‘1971 cohort’ and the ‘1981 cohort’,based on the point at which they were firstobserved in the LS for selection into this study.Their parents’ and household characteristics aremeasured at that point to give information abouttheir ‘origins’; and their own characteristics aremeasured in 2001 to given information about their‘destinations’. These two cohorts of children havebeen combined, or ‘pooled’, for the majority of theanalysis in this Report. Table 1.1 shows thenumbers in each of these two cohorts and in thepooled sample for the different minority ethnicgroups. The table illustrates how different groups’migration histories mean that the distributions ofminority groups are very different for the twocohorts. For example, Indians, Pakistanis andBangladeshis clearly experienced an increase in
1 For a further discussion of these issues see the TechnicalAppendix to this Report (available at www.jrf.org.uk/bookshop).
2 For a more detailed account of the methodological issues seethe Technical Appendix (available at www.jrf.org.uk/bookshop).
Introduction
6
Migration and mobility
migration between 1971 and 1981, while Caribbeanimmigration declined. The effect of pooling the twocohorts means that the age range when destinationsare measured in 2001 will range from 24 to 45. Thedifferences in age are captured in the analysisthrough adjusting for both age group and cohort.Alternative approaches, for example measuring thecohorts ‘after two decades’ (that is in 1991 for the1971 cohort, and in 2001 for the 1981 cohort), orfocusing on only the older members of the cohorts(that is those aged between eight and 15 at thepoint they were first observed) have also beenexplored, and are discussed in the TechnicalAppendix (available at www.jrf.org.uk/bookshop).The results and implications of the alternativeapproaches are also illustrated there.
Parents’ social class was measured in 1971 and1981 respectively for the two cohorts; and,grouped in three categories – service, intermediateand working – was used to identify children’sorigins. The sample’s own social class (theirdestinations) was measured in 2001 grouped intothree corresponding classes (professional/managerial, intermediate, and manual/routine non-manual) with unemployment forming a fourthoutcome. The social class classification used fororigins was the CASMIN schema (sometimes knownas the Goldthorpe class schema) and that used fordestinations was the National Statistics Socio-economic Classification (NS-SeC). Both employsimilar principles and approaches in class allocationand are therefore broadly comparable over time.Those parents or children who did not fit one ofthese social class categories (or unemployment fordestinations) were left in a residual, ‘other’category, while those for whom there wasinsufficient information to allocate class at all were
excluded from analysis. Other variables that wereincluded in the analyses were economic status, areaand educational level of the study sample’s parents,and educational level, marital status, economicstatus and religion of the study sample. Thederivation, creation and harmonisation of thesevariables is discussed further in the TechnicalAppendix to the Report (available atwww.jrf.org.uk/bookshop).
For analysing the relationship between social classorigins and destinations, and the mediating effectsof ethnicity, age and education, a variety ofmethods has been used from simple tabulations andpercentages to binomial and multinomial logisticregressions. As far as possible the results of thesemethods have been presented in illustrative figuresor simple tables, with the full results in tabular formincluded in the Appendix. Additional analysescarried out to test the robustness of the responsesto different ways of organising the data have beenincluded in the Technical Appendix (available atwww.jrf.org.uk/bookshop).
Table 1.1: Numbers from minority ethnic groups in the samples selected for study from the ONS LS
1971 cohort 1981 cohort Pooled 1971Ethnic group* (those aged 4-15 in 1971) (those aged 4-15 in 1981) and 1981 cohorts
Caribbean 803 744 1,547Black African 58 94 152Indian 568 1,123 1,691Pakistani 173 606 779Bangladeshi 21 109 130Chinese and other 197 384 581White of migrant parentage 2,157 1,518 3,675
Note: *The process used to allocate ethnic group to the sample members and the groups used is discussed further in the Technical
Appendix (available at www.jrf.org.uk/bookshop).
Source: ONS LS, author’s analysis
7
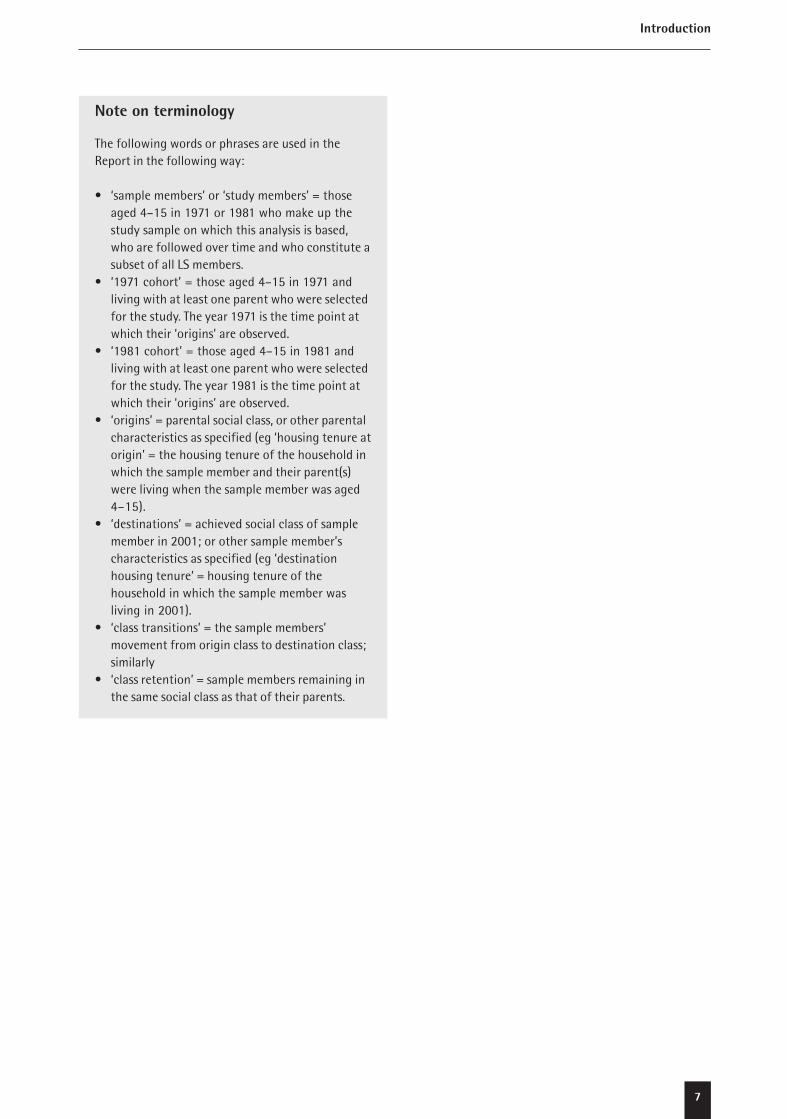
Note on terminology
The following words or phrases are used in theReport in the following way:
• ‘sample members’ or ‘study members’ = thoseaged 4–15 in 1971 or 1981 who make up thestudy sample on which this analysis is based,who are followed over time and who constitute asubset of all LS members.
• ‘1971 cohort’ = those aged 4–15 in 1971 andliving with at least one parent who were selectedfor the study. The year 1971 is the time point atwhich their ‘origins’ are observed.
• ‘1981 cohort’ = those aged 4–15 in 1981 andliving with at least one parent who were selectedfor the study. The year 1981 is the time point atwhich their ‘origins’ are observed.
• ‘origins’ = parental social class, or other parentalcharacteristics as specified (eg ‘housing tenure atorigin’ = the housing tenure of the household inwhich the sample member and their parent(s)were living when the sample member was aged4–15).
• ‘destinations’ = achieved social class of samplemember in 2001; or other sample member’scharacteristics as specified (eg ‘destinationhousing tenure’ = housing tenure of thehousehold in which the sample member wasliving in 2001).
• ‘class transitions’ = the sample members’movement from origin class to destination class;similarly
• ‘class retention’ = sample members remaining inthe same social class as that of their parents.
Introduction
8
Migration and mobility
Previous findings
There is a large body of work that has shown that,within Britain and beyond, there is substantialassociation between a parent’s and child’s socialclass and that this association has persisted evenwith the expansion of the middle class in the post-war period. The existence of ‘more room at thetop’ has opened up chances for upward mobilityfrom the working classes, but has also made iteasier for those from middle-class backgrounds toretain their advantaged class position (Goldthorpeet al, 1987; Erikson and Goldthorpe, 1993; see alsothe discussion in Aldridge, 2001). The relative oddsof ending up in the more privileged social classesthus remain firmly in favour of those with moreprivileged backgrounds, even though there is somesuggestion that this association between privilegedbackground and advantaged outcomes might begradually weakening (Heath and Payne, 2000).These differential life chances according to socialclass background are taken to indicate that Britain isa closed society, rather than a ‘meritocracy’ (Blair,2001; Aldridge, 2001). However, a society can beclosed on other levels than that of class; and levelsof intergenerational class stability among minoritygroups comparable to those of the majority can beread as indicative of greater openness withinsociety to ethnic minority achievement (Hout,1984). If the impact of origins on chances ofprofessional positions are the same across groups,this suggests that, while we may not be seeing ameritocracy, class does override ethnic differencesin outcome, implying lack of ethnic discriminationin occupations. However, if the impact of originsvaries between groups and is weaker for someminority groups than for the majority, this will tend
to suggest that class privilege is an insufficientbuffer against ethnically based discriminatoryprocesses.
This chapter describes, and explores possibleexplanations for, mobility patterns among thedifferent ethnic groups considered in this study. Itbuilds on the small body of research examiningintergenerational mobility by ethnic group (Heathand Ridge, 1983; Heath and McMahon, 2005; Platt,2005), but provides a new perspective andfindings, which are developed in the analysis whichfollows in Chapter 3. Heath and Ridge (1983) usedthe Oxford Mobility Study to compare father–sontransitions across English-born non-migrants and fourgroups of migrants, including a ‘non-white’ migrantgroup. They found that there was, for non-whitemigrants as a whole, a weaker association betweenorigins and destinations than for the British-born andfor the white migrant groups. Specifically, highersocial class origins abroad did not seem to becarried over into Britain. They concluded that ‘non-white’ migrants were disadvantaged in the Britishlabour market.
Heath and McMahon (2005) used pooled yearsfrom the General Household Survey to assess thecontribution of parent’s class, ethnicity andeducational qualifications to a series of classoutcomes. They concluded that patterns of accessto different class positions are distinct across ethnicgroups and are complex. At the same time thesalience of a background in the salariat in terms ofaccess to occupations in the salariat was found tobe generalised across ethnic groups. However,these studies focused on mobility regardless ofwhere origin class was measured – in fact it was
2Origins and destinations: socialmobility and the changing socialstructure of England and Wales
9
usually the class in the country of emigration. Theytherefore both assumed an internationalcomparability of class position and could not tell usabout the comparative intergenerational experienceof groups within Britain, where the specificoccupational structure (and the changes that takeplace within it) will impact on all groups – andmight be expected to do so in similar ways. Migrantgroups’ cultural capital, their expectations andcapabilities for particular occupational/classpositions prior to migration may be very importantin subsequent experience. However, to assume aninternational salience of class and measure acrossthe point of migration can only give us part of thepicture and does not explain if and how groupsrecover from downward mobility followingmigration. This Report aims to give the other sideof the picture, by exploring how what we knowabout the migrant generation following their arrivalin Britain translates into particular outcomes for thesecond generation.
Platt (2005) analysed mobility by ethnic groupwithin England and Wales, using an approach thatwas partly similar to that employed in this Report.However, that paper considered only one cohort,which limited the number of ethnic groups it waspossible to investigate, and analysed mobilitypatterns only up to 1991. Moreover, in itsdependence on aggregate data and a restrictedrange of variables, the paper was not able toextend the analysis into a consideration of factorsmediating transmission of origins and destinations,in the ways developed further in the next chapter.The conclusion of this earlier research using theONS Longitudinal Study (henceforth the LS) wasthat the relationship between origins anddestinations for women remains similar for minorityand majority ethnic groups, suggesting that classoperates in predictable ways across and withinethnicities for women. However, for men it seemedthat intergenerational class patterns were notcomparable across ethnic groups, suggesting thatfor men ethnic group effects override class originsin determining destinations. When the analysis wasrepeated for the 1981 cohort as part of this study,
the comparable class effects across ethnicitypreviously observed for women could no longer befound. Instead class effects seemed to vary withethnic group for both women and men, suggestingthat distinctive ethnic group relationships to classorigins effects persisted within the younger agegroup – and for women as well as for men.
The changing occupational structure
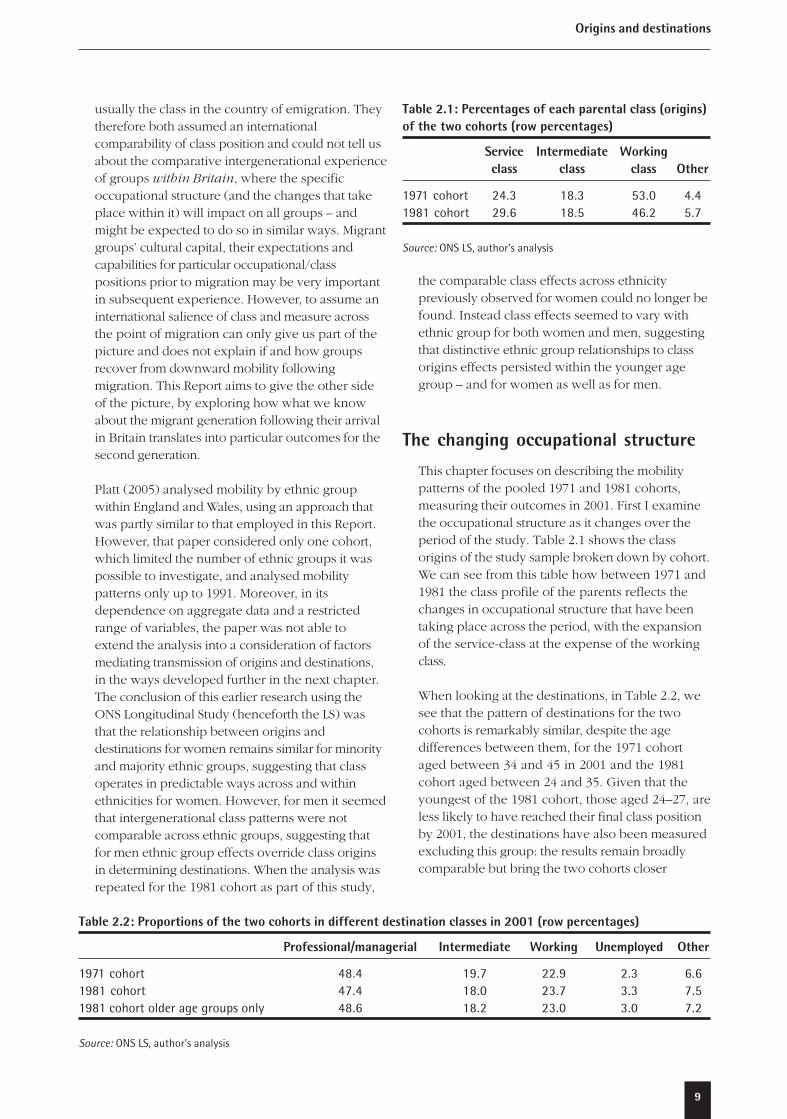
This chapter focuses on describing the mobilitypatterns of the pooled 1971 and 1981 cohorts,measuring their outcomes in 2001. First I examinethe occupational structure as it changes over theperiod of the study. Table 2.1 shows the classorigins of the study sample broken down by cohort.We can see from this table how between 1971 and1981 the class profile of the parents reflects thechanges in occupational structure that have beentaking place across the period, with the expansionof the service-class at the expense of the workingclass.
When looking at the destinations, in Table 2.2, wesee that the pattern of destinations for the twocohorts is remarkably similar, despite the agedifferences between them, for the 1971 cohortaged between 34 and 45 in 2001 and the 1981cohort aged between 24 and 35. Given that theyoungest of the 1981 cohort, those aged 24–27, areless likely to have reached their final class positionby 2001, the destinations have also been measuredexcluding this group: the results remain broadlycomparable but bring the two cohorts closer
Table 2.1: Percentages of each parental class (origins)of the two cohorts (row percentages)
Service Intermediate Workingclass class class Other
1971 cohort 24.3 18.3 53.0 4.41981 cohort 29.6 18.5 46.2 5.7
Source: ONS LS, author’s analysis
Table 2.2: Proportions of the two cohorts in different destination classes in 2001 (row percentages)
Professional/managerial Intermediate Working Unemployed Other
1971 cohort 48.4 19.7 22.9 2.3 6.61981 cohort 47.4 18.0 23.7 3.3 7.51981 cohort older age groups only 48.6 18.2 23.0 3.0 7.2
Source: ONS LS, author’s analysis
Origins and destinations
10
Migration and mobility
3 The differences are that the basis of the origin measures are parents only, which will restrict the age range, in addition to thefact that parents do not have an identical distribution to non-parents. For the destinations, the distribution is restricted to thosebetween the ages of 24 and 45. Moreover, for both origins and destinations, the class allocation has been hierarchical where theparents or respondents are part of a couple, rather than individual, that is, the higher class of the pair has been selected, whichbiases the class distribution upwards compared to an individualised occupational measure (see the Technical Appendix(available at www.jrf.org.uk/bookshop) for further discussion of the construction of the class variables). In addition, 13,863 studymembers who were aged 4–5 in 1971 are measured twice, since if present in 1981, they were aged 14–15 then.
together in their overall patterns of destinations, asmight be expected.
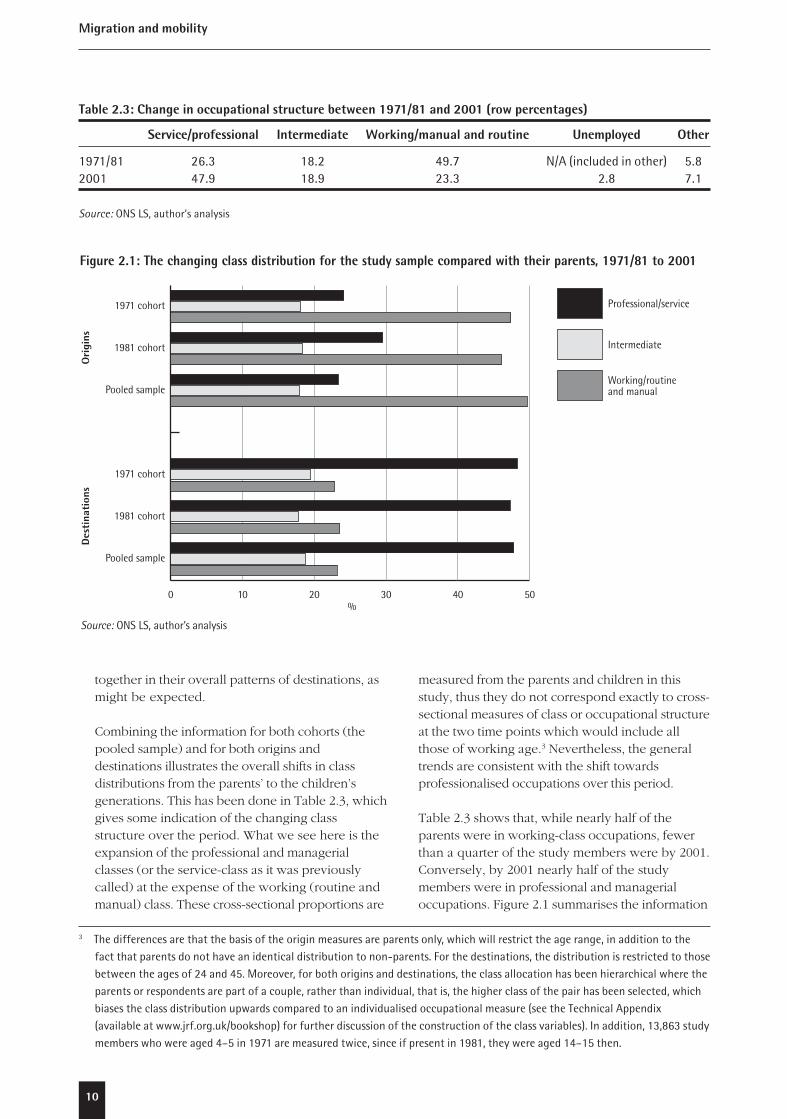
Combining the information for both cohorts (thepooled sample) and for both origins anddestinations illustrates the overall shifts in classdistributions from the parents’ to the children’sgenerations. This has been done in Table 2.3, whichgives some indication of the changing classstructure over the period. What we see here is theexpansion of the professional and managerialclasses (or the service-class as it was previouslycalled) at the expense of the working (routine andmanual) class. These cross-sectional proportions are
measured from the parents and children in thisstudy, thus they do not correspond exactly to cross-sectional measures of class or occupational structureat the two time points which would include allthose of working age.3 Nevertheless, the generaltrends are consistent with the shift towardsprofessionalised occupations over this period.
Table 2.3 shows that, while nearly half of theparents were in working-class occupations, fewerthan a quarter of the study members were by 2001.Conversely, by 2001 nearly half of the studymembers were in professional and managerialoccupations. Figure 2.1 summarises the information
Table 2.3: Change in occupational structure between 1971/81 and 2001 (row percentages)
Service/professional Intermediate Working/manual and routine Unemployed Other
1971/81 26.3 18.2 49.7 N/A (included in other) 5.82001 47.9 18.9 23.3 2.8 7.1
Source: ONS LS, author’s analysis
Figure 2.1: The changing class distribution for the study sample compared with their parents, 1971/81 to 2001
%
Des
tina
tion
sO
rigi
ns
Source: ONS LS, author’s analysis
0 10 20 30 40 50
Working/routine and manual
Intermediate
Professional/service
Pooled sample
1981 cohort
1971 cohort
Pooled sample
1981 cohort
1971 cohort

11
from the previous three tables in graphical form toillustrate the changing class structure between theparents’ and children’s generations of this study.
These structural changes in the class distributiondrive mobility rates for all groups to a greater orlesser extent. That is, they require that a certainproportion of those from working-class backgroundsmove up a class or two. Even if all the secondgeneration working class were from working-classbackgrounds, around half of those from working-class backgrounds would still have to have changedclass by 2001. This has led to the focus in much ofthe literature on relative mobility chances (forexample, Heath and Payne, 2000; although thereare some dissenters, such as Payne, 1992, andPayne and Roberts, 2002). Such a focus removesthe impact of the purely structural changes, andexplores instead the likelihood of achieving acertain class position for someone from a lowerclass compared to the chances for someone from ahigher class. Such research has shown that even ifthere is, in absolute terms, much upward mobilityfor those from working-class origins (as the classdistribution changes and there are simply fewerworking-class jobs), the relative chances of aprofessional class outcome for those from working-class origins may still be weak compared to thosefrom a service-class background.
Similarly, when examining minority ethnic groups itis worth examining both their absolute and theirrelative mobility chances. Particularly in view of theeffects of downward mobility after immigration,discussed above, a preponderance of working-classorigins is likely to lead to much upward mobility.Nevertheless, the amount of absolute mobility mayvary between groups with some apparently better
able than others to take advantage of the greater‘room at the top’ offered by the changingoccupational structure. Upward mobility forminority ethnic groups is likely to be driven, in partat least, by relative concentration among parents inthe reducing working class. Alternatively, if upwardmobility is not observed, it might lead to theformulation of notions of a residualised workingclass with an over-representation of minority ethnicgroups.
Class transitions from origins todestinations
Table 2.4 shows that the total pooled sample underconsideration amounts to 141,303, and also showsthe sizes of the ethnic groups that are the mainfocus in this Report and for which the mobilitypatterns are illustrated below. However, thenumber for whom both origin class and destinationclass information is available is a reduced set ofthese groups, the numbers being given in aseparate column of Table 2.4.
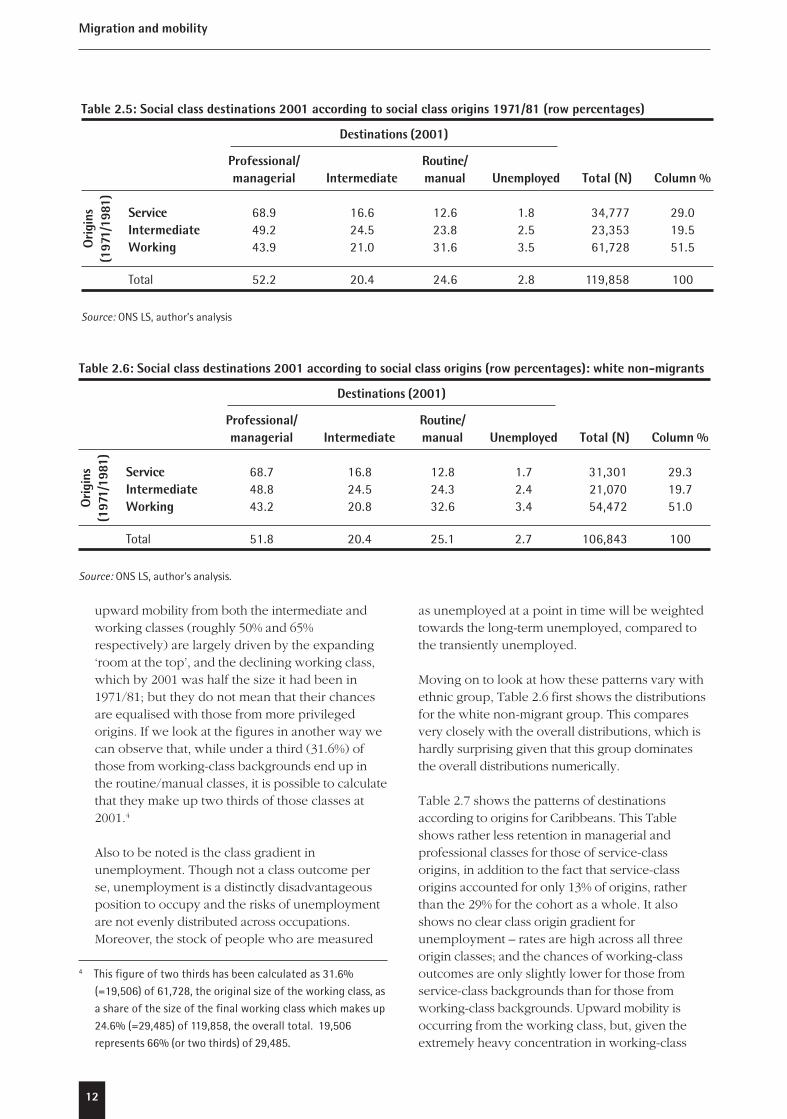
Table 2.5 shows transitions between origins anddestinations for the whole study sample. We cansee from this table the high levels of class retentionfor those from service-class backgrounds: 69% ofthem end up in the professional/managerial classes,whereas under 50% of the intermediate andworking class attain a professional/managerial classposition.
There are correspondingly small proportions ofthose from service-class origins who end up in theworking class (under 13%). The fairly high levels of
Table 2.4: Ethnic group distributions, pooled sample, 2001
Number for whom both origin andEthnic group Number – all % destination class available* %
White non-migrant 125,014 88.5 106,843 89.1Caribbean 1,547 1.1 1,069 0.9Indian 1,691 1.2 1,378 1.2Pakistani 779 0.6 608 0.5White migrant 3,675 2.6 2,867 2.4Other groups** (combined) 8,597 6.0 7,093 6.0Total 141,303 100 119,858 100
Notes: * Excluding those allocated to the residual ‘other’ class at either origin or destination.
** These groups are Bangladeshi, Chinese, other ethnic groups, and white where one parent was born abroad and one was born in the UK.
Source: ONS LS, author’s analysis
Origins and destinations
12
Migration and mobility
upward mobility from both the intermediate andworking classes (roughly 50% and 65%respectively) are largely driven by the expanding‘room at the top’, and the declining working class,which by 2001 was half the size it had been in1971/81; but they do not mean that their chancesare equalised with those from more privilegedorigins. If we look at the figures in another way wecan observe that, while under a third (31.6%) ofthose from working-class backgrounds end up inthe routine/manual classes, it is possible to calculatethat they make up two thirds of those classes at2001.4
Also to be noted is the class gradient inunemployment. Though not a class outcome perse, unemployment is a distinctly disadvantageousposition to occupy and the risks of unemploymentare not evenly distributed across occupations.Moreover, the stock of people who are measured
as unemployed at a point in time will be weightedtowards the long-term unemployed, compared tothe transiently unemployed.
Moving on to look at how these patterns vary withethnic group, Table 2.6 first shows the distributionsfor the white non-migrant group. This comparesvery closely with the overall distributions, which ishardly surprising given that this group dominatesthe overall distributions numerically.
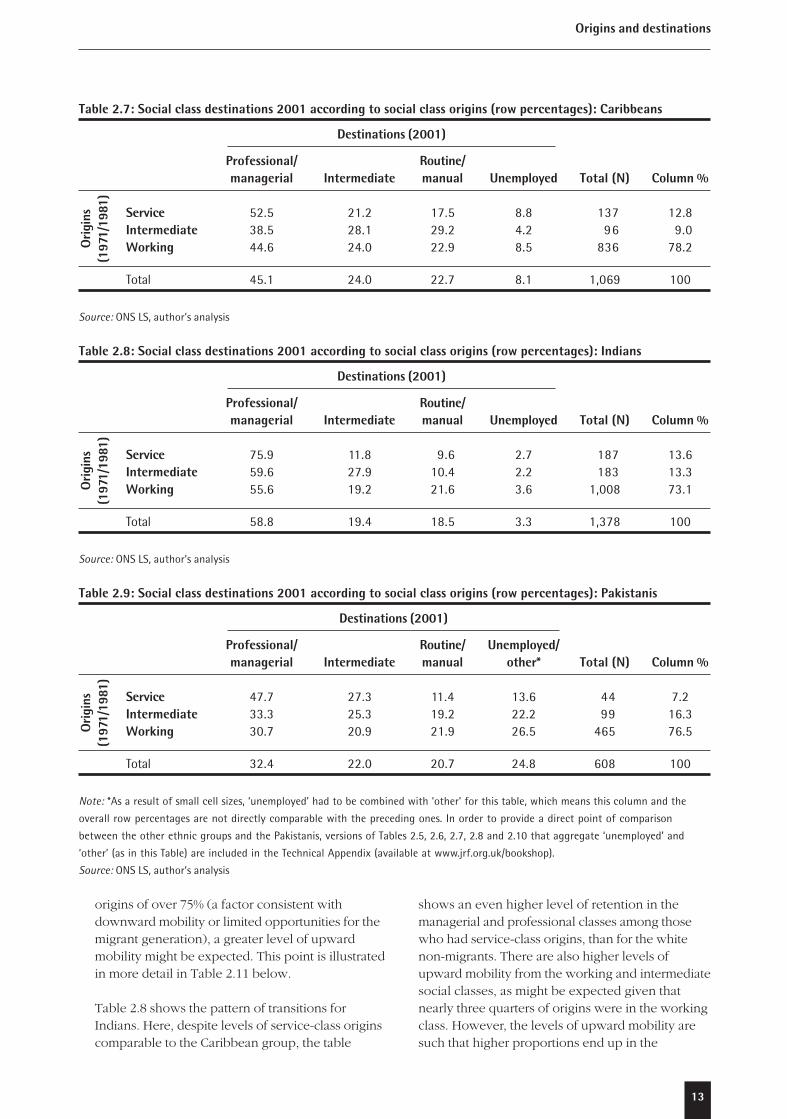
Table 2.7 shows the patterns of destinationsaccording to origins for Caribbeans. This Tableshows rather less retention in managerial andprofessional classes for those of service-classorigins, in addition to the fact that service-classorigins accounted for only 13% of origins, ratherthan the 29% for the cohort as a whole. It alsoshows no clear class origin gradient forunemployment – rates are high across all threeorigin classes; and the chances of working-classoutcomes are only slightly lower for those fromservice-class backgrounds than for those fromworking-class backgrounds. Upward mobility isoccurring from the working class, but, given theextremely heavy concentration in working-class
Table 2.5: Social class destinations 2001 according to social class origins 1971/81 (row percentages)
Destinations (2001)
Professional/ Routine/managerial Intermediate manual Unemployed Total (N) Column %
Service 68.9 16.6 12.6 1.8 34,777 29.0Intermediate 49.2 24.5 23.8 2.5 23,353 19.5Working 43.9 21.0 31.6 3.5 61,728 51.5
Total 52.2 20.4 24.6 2.8 119,858 100
Source: ONS LS, author’s analysis
Orig
ins
(197
1/19
81)
Table 2.6: Social class destinations 2001 according to social class origins (row percentages): white non-migrants
Destinations (2001)
Professional/ Routine/managerial Intermediate manual Unemployed Total (N) Column %
Service 68.7 16.8 12.8 1.7 31,301 29.3Intermediate 48.8 24.5 24.3 2.4 21,070 19.7Working 43.2 20.8 32.6 3.4 54,472 51.0
Total 51.8 20.4 25.1 2.7 106,843 100
Source: ONS LS, author’s analysis.
Orig
ins
(197
1/19
81)
4 This figure of two thirds has been calculated as 31.6%(=19,506) of 61,728, the original size of the working class, asa share of the size of the final working class which makes up24.6% (=29,485) of 119,858, the overall total. 19,506represents 66% (or two thirds) of 29,485.
13
origins of over 75% (a factor consistent withdownward mobility or limited opportunities for themigrant generation), a greater level of upwardmobility might be expected. This point is illustratedin more detail in Table 2.11 below.
Table 2.8 shows the pattern of transitions forIndians. Here, despite levels of service-class originscomparable to the Caribbean group, the table
shows an even higher level of retention in themanagerial and professional classes among thosewho had service-class origins, than for the whitenon-migrants. There are also higher levels ofupward mobility from the working and intermediatesocial classes, as might be expected given thatnearly three quarters of origins were in the workingclass. However, the levels of upward mobility aresuch that higher proportions end up in the
Table 2.7: Social class destinations 2001 according to social class origins (row percentages): Caribbeans
Destinations (2001)
Professional/ Routine/managerial Intermediate manual Unemployed Total (N) Column %
Service 52.5 21.2 17.5 8.8 137 12.8Intermediate 38.5 28.1 29.2 4.2 96 9.0Working 44.6 24.0 22.9 8.5 836 78.2
Total 45.1 24.0 22.7 8.1 1,069 100
Source: ONS LS, author’s analysis
Orig
ins
(197
1/19
81)
Table 2.8: Social class destinations 2001 according to social class origins (row percentages): Indians
Destinations (2001)
Professional/ Routine/managerial Intermediate manual Unemployed Total (N) Column %
Service 75.9 11.8 9.6 2.7 187 13.6Intermediate 59.6 27.9 10.4 2.2 183 13.3Working 55.6 19.2 21.6 3.6 1,008 73.1
Total 58.8 19.4 18.5 3.3 1,378 100
Source: ONS LS, author’s analysis
Orig
ins
(197
1/19
81)
Table 2.9: Social class destinations 2001 according to social class origins (row percentages): Pakistanis
Destinations (2001)
Professional/ Routine/ Unemployed/managerial Intermediate manual other* Total (N) Column %
Service 47.7 27.3 11.4 13.6 44 7.2Intermediate 33.3 25.3 19.2 22.2 99 16.3Working 30.7 20.9 21.9 26.5 465 76.5
Total 32.4 22.0 20.7 24.8 608 100
Note: *As a result of small cell sizes, ‘unemployed’ had to be combined with ‘other’ for this table, which means this column and the
overall row percentages are not directly comparable with the preceding ones. In order to provide a direct point of comparison
between the other ethnic groups and the Pakistanis, versions of Tables 2.5, 2.6, 2.7, 2.8 and 2.10 that aggregate ‘unemployed’ and
‘other’ (as in this Table) are included in the Technical Appendix (available at www.jrf.org.uk/bookshop).
Source: ONS LS, author’s analysis
Orig
ins
(197
1/19
81)
Origins and destinations
14
Migration and mobility
managerial professional classes in 2001 than fromthe white non-migrant group.
Table 2.9 shows Pakistanis’ origin to destinationtransitions. The pattern here is comparable to thatof the Caribbeans, but showing apparently evenless retention in the professional/managerial classesfor those from service-class origins, despite an evensmaller proportion starting off in the service-class.There is also – apparently – less upward mobilityfrom the routine and working classes, resulting inthe lowest proportions in the professional/managerial classes in 2001 of any of the groupsconsidered. However, the small numbers in thisgroup resulted in the need to aggregate the‘unemployed’ and ‘other’ categories to avoid smallcell sizes. This means that it is not directlycomparable with the preceding tables in that theproportions in the unemployed/other column arerelatively inflated and the proportions in the othercells correspondingly deflated.
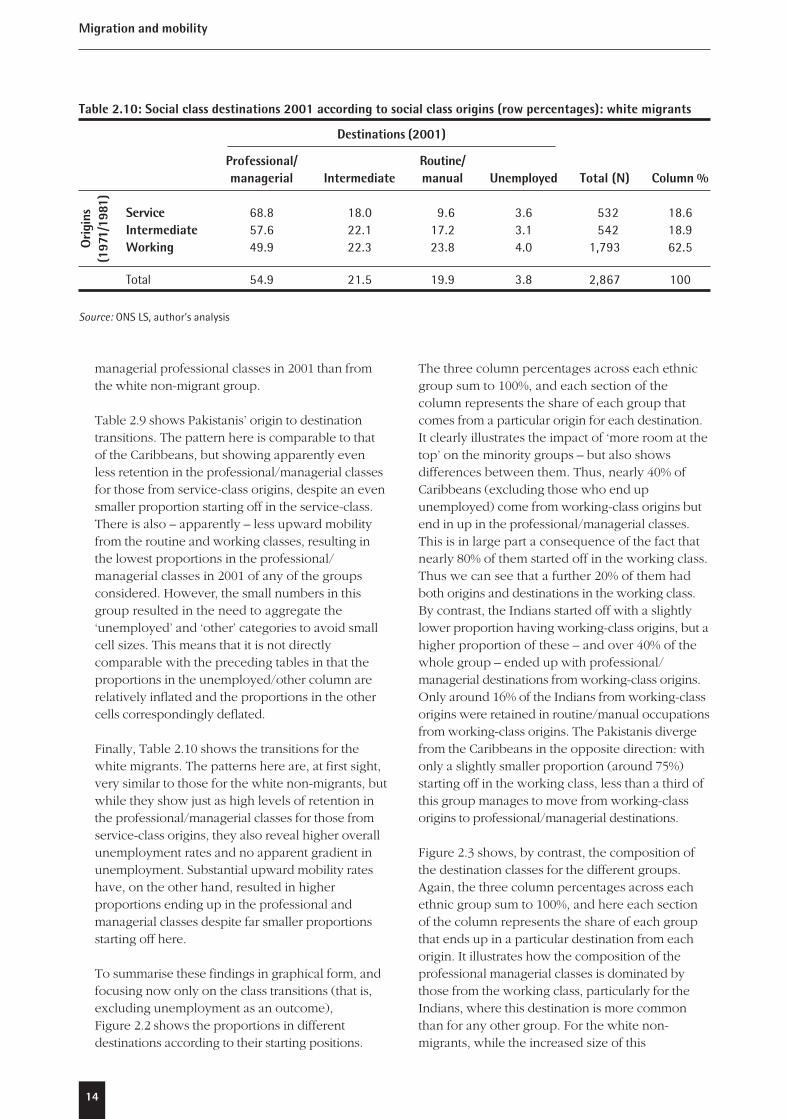
Finally, Table 2.10 shows the transitions for thewhite migrants. The patterns here are, at first sight,very similar to those for the white non-migrants, butwhile they show just as high levels of retention inthe professional/managerial classes for those fromservice-class origins, they also reveal higher overallunemployment rates and no apparent gradient inunemployment. Substantial upward mobility rateshave, on the other hand, resulted in higherproportions ending up in the professional andmanagerial classes despite far smaller proportionsstarting off here.
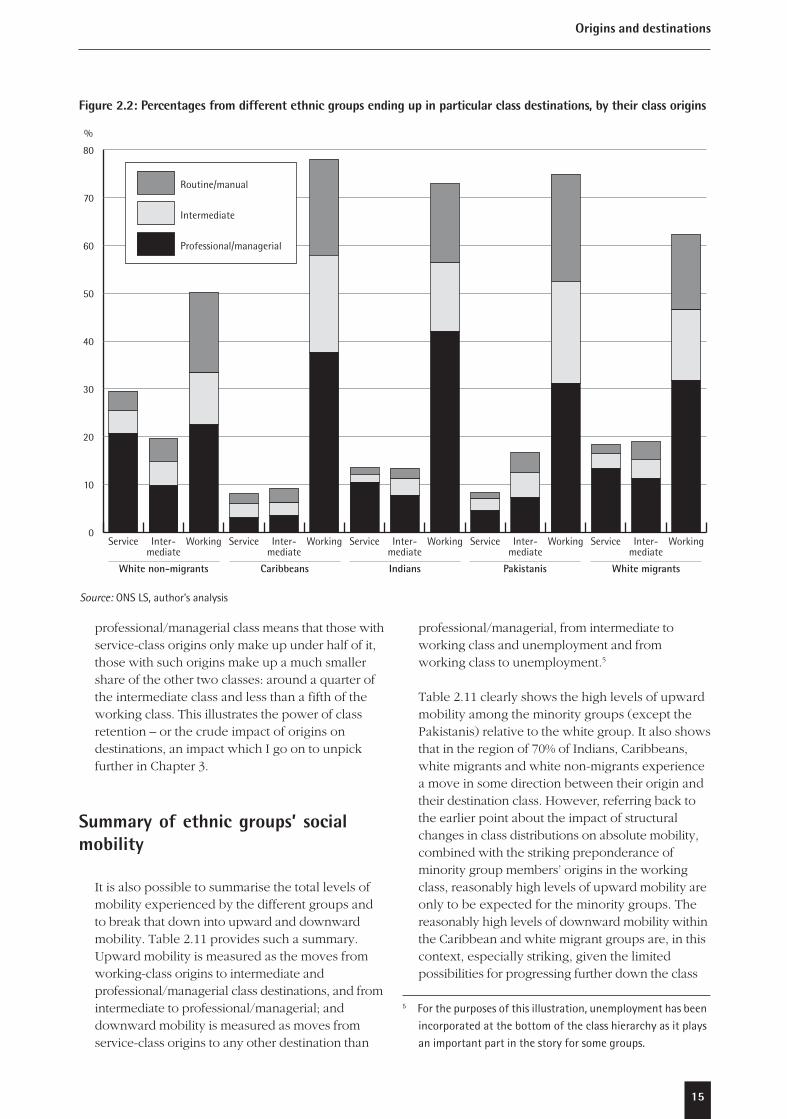
To summarise these findings in graphical form, andfocusing now only on the class transitions (that is,excluding unemployment as an outcome),Figure 2.2 shows the proportions in differentdestinations according to their starting positions.
The three column percentages across each ethnicgroup sum to 100%, and each section of thecolumn represents the share of each group thatcomes from a particular origin for each destination.It clearly illustrates the impact of ‘more room at thetop’ on the minority groups – but also showsdifferences between them. Thus, nearly 40% ofCaribbeans (excluding those who end upunemployed) come from working-class origins butend in up in the professional/managerial classes.This is in large part a consequence of the fact thatnearly 80% of them started off in the working class.Thus we can see that a further 20% of them hadboth origins and destinations in the working class.By contrast, the Indians started off with a slightlylower proportion having working-class origins, but ahigher proportion of these – and over 40% of thewhole group – ended up with professional/managerial destinations from working-class origins.Only around 16% of the Indians from working-classorigins were retained in routine/manual occupationsfrom working-class origins. The Pakistanis divergefrom the Caribbeans in the opposite direction: withonly a slightly smaller proportion (around 75%)starting off in the working class, less than a third ofthis group manages to move from working-classorigins to professional/managerial destinations.
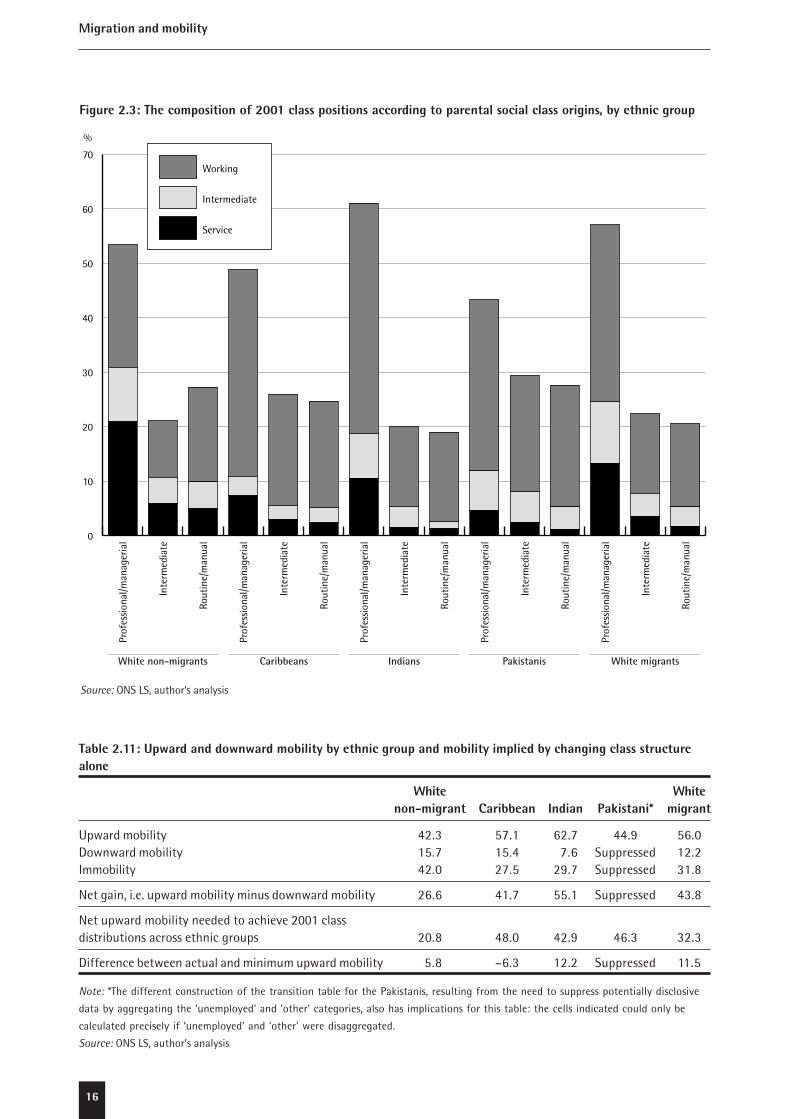
Figure 2.3 shows, by contrast, the composition ofthe destination classes for the different groups.Again, the three column percentages across eachethnic group sum to 100%, and here each sectionof the column represents the share of each groupthat ends up in a particular destination from eachorigin. It illustrates how the composition of theprofessional managerial classes is dominated bythose from the working class, particularly for theIndians, where this destination is more commonthan for any other group. For the white non-migrants, while the increased size of this
Table 2.10: Social class destinations 2001 according to social class origins (row percentages): white migrants
Destinations (2001)
Professional/ Routine/managerial Intermediate manual Unemployed Total (N) Column %
Service 68.8 18.0 9.6 3.6 532 18.6Intermediate 57.6 22.1 17.2 3.1 542 18.9Working 49.9 22.3 23.8 4.0 1,793 62.5
Total 54.9 21.5 19.9 3.8 2,867 100
Source: ONS LS, author’s analysis
Orig
ins
(197
1/19
81)
15
professional/managerial class means that those withservice-class origins only make up under half of it,those with such origins make up a much smallershare of the other two classes: around a quarter ofthe intermediate class and less than a fifth of theworking class. This illustrates the power of classretention – or the crude impact of origins ondestinations, an impact which I go on to unpickfurther in Chapter 3.
Summary of ethnic groups’ socialmobility
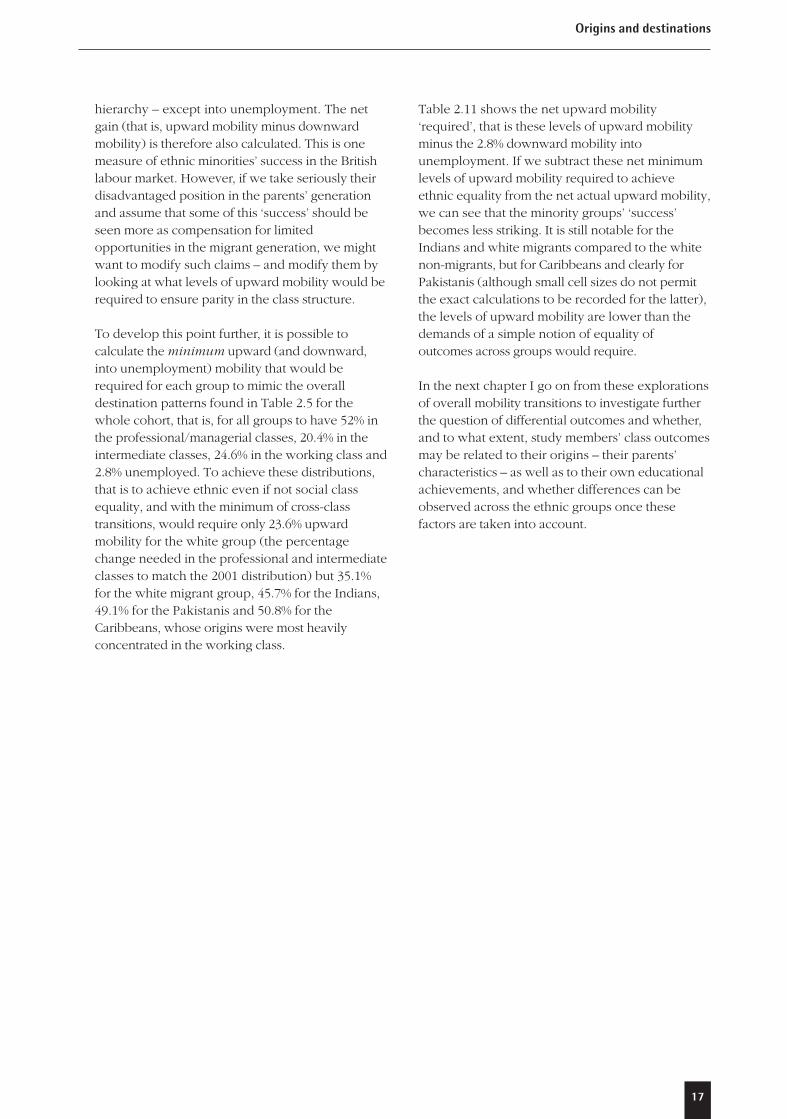
It is also possible to summarise the total levels ofmobility experienced by the different groups andto break that down into upward and downwardmobility. Table 2.11 provides such a summary.Upward mobility is measured as the moves fromworking-class origins to intermediate andprofessional/managerial class destinations, and fromintermediate to professional/managerial; anddownward mobility is measured as moves fromservice-class origins to any other destination than
professional/managerial, from intermediate toworking class and unemployment and fromworking class to unemployment.5
Table 2.11 clearly shows the high levels of upwardmobility among the minority groups (except thePakistanis) relative to the white group. It also showsthat in the region of 70% of Indians, Caribbeans,white migrants and white non-migrants experiencea move in some direction between their origin andtheir destination class. However, referring back tothe earlier point about the impact of structuralchanges in class distributions on absolute mobility,combined with the striking preponderance ofminority group members’ origins in the workingclass, reasonably high levels of upward mobility areonly to be expected for the minority groups. Thereasonably high levels of downward mobility withinthe Caribbean and white migrant groups are, in thiscontext, especially striking, given the limitedpossibilities for progressing further down the class
Figure 2.2: Percentages from different ethnic groups ending up in particular class destinations, by their class origins
White non-migrants
Source: ONS LS, author’s analysis
0
10
20
30
40
50
60
70
80
Routine/manual
Intermediate
Professional/managerial
WorkingInter-mediate
ServiceWorkingInter-mediate
ServiceWorkingInter-mediate
ServiceWorkingInter-mediate
ServiceWorkingInter-mediate
Service
Caribbeans Indians Pakistanis White migrants
%
5 For the purposes of this illustration, unemployment has beenincorporated at the bottom of the class hierarchy as it playsan important part in the story for some groups.
Origins and destinations
16
Migration and mobility
Figure 2.3: The composition of 2001 class positions according to parental social class origins, by ethnic group
White non-migrants
Source: ONS LS, author’s analysis
0
10
20
30
40
50
60
70Working
Intermediate
Service
Rout
ine/
man
ual
Inte
rmed
iate
Prof
essi
onal
/man
ager
ial
Rout
ine/
man
ual
Inte
rmed
iate
Prof
essi
onal
/man
ager
ial
Rout
ine/
man
ual
Inte
rmed
iate
Prof
essi
onal
/man
ager
ial
Rout
ine/
man
ual
Inte
rmed
iate
Prof
essi
onal
/man
ager
ial
Rout
ine/
man
ual
Inte
rmed
iate
Prof
essi
onal
/man
ager
ial
Caribbeans Indians Pakistanis White migrants
%
Table 2.11: Upward and downward mobility by ethnic group and mobility implied by changing class structurealone
White Whitenon-migrant Caribbean Indian Pakistani* migrant
Upward mobility 42.3 57.1 62.7 44.9 56.0Downward mobility 15.7 15.4 7.6 Suppressed 12.2Immobility 42.0 27.5 29.7 Suppressed 31.8
Net gain, i.e. upward mobility minus downward mobility 26.6 41.7 55.1 Suppressed 43.8
Net upward mobility needed to achieve 2001 classdistributions across ethnic groups 20.8 48.0 42.9 46.3 32.3
Difference between actual and minimum upward mobility 5.8 –6.3 12.2 Suppressed 11.5
Note: *The different construction of the transition table for the Pakistanis, resulting from the need to suppress potentially disclosive
data by aggregating the ‘unemployed’ and ‘other’ categories, also has implications for this table: the cells indicated could only be
calculated precisely if ‘unemployed’ and ‘other’ were disaggregated.
Source: ONS LS, author’s analysis
17
hierarchy – except into unemployment. The netgain (that is, upward mobility minus downwardmobility) is therefore also calculated. This is onemeasure of ethnic minorities’ success in the Britishlabour market. However, if we take seriously theirdisadvantaged position in the parents’ generationand assume that some of this ‘success’ should beseen more as compensation for limitedopportunities in the migrant generation, we mightwant to modify such claims – and modify them bylooking at what levels of upward mobility would berequired to ensure parity in the class structure.
To develop this point further, it is possible tocalculate the minimum upward (and downward,into unemployment) mobility that would berequired for each group to mimic the overalldestination patterns found in Table 2.5 for thewhole cohort, that is, for all groups to have 52% inthe professional/managerial classes, 20.4% in theintermediate classes, 24.6% in the working class and2.8% unemployed. To achieve these distributions,that is to achieve ethnic even if not social classequality, and with the minimum of cross-classtransitions, would require only 23.6% upwardmobility for the white group (the percentagechange needed in the professional and intermediateclasses to match the 2001 distribution) but 35.1%for the white migrant group, 45.7% for the Indians,49.1% for the Pakistanis and 50.8% for theCaribbeans, whose origins were most heavilyconcentrated in the working class.
Table 2.11 shows the net upward mobility‘required’, that is these levels of upward mobilityminus the 2.8% downward mobility intounemployment. If we subtract these net minimumlevels of upward mobility required to achieveethnic equality from the net actual upward mobility,we can see that the minority groups’ ‘success’becomes less striking. It is still notable for theIndians and white migrants compared to the whitenon-migrants, but for Caribbeans and clearly forPakistanis (although small cell sizes do not permitthe exact calculations to be recorded for the latter),the levels of upward mobility are lower than thedemands of a simple notion of equality ofoutcomes across groups would require.
In the next chapter I go on from these explorationsof overall mobility transitions to investigate furtherthe question of differential outcomes and whether,and to what extent, study members’ class outcomesmay be related to their origins – their parents’characteristics – as well as to their own educationalachievements, and whether differences can beobserved across the ethnic groups once thesefactors are taken into account.
Origins and destinations
18
Migration and mobility
In this chapter I consider the role of classbackground alongside other backgroundcharacteristics and the sample members’ owneducational achievement in contributing to thedistinctive patterns of intergenerational mobilityrevealed in the previous chapter. I also considerwhat religion can add to our understanding ofpatterns of social mobility. In doing this, thischapter raises the question of whether thedifferences by ethnic group can be ascribed to an‘ethnic’ effect per se or can be accounted for byvariations in other characteristics that are associatedwith different ethnic groups. In particular, thischapter explores the ability of educationalachievement to mediate first generation classdisadvantage and to account for the upwardmobility of minority ethnic groups.
The analysis and discussion builds on the moregeneral concern in the mobility literature with therelationships between origins, education anddestinations (see, for example, Halsey et al, 1980;Breen and Whelan, 1993; Goldthorpe, 1997; Breen,1998) and on the specific emphasis in Heath’swork in relation to understanding the role ofeducation in differential ethnic group outcomes(Cheng and Heath, 1993; Heath and McMahon,1997, 2005). It has been regularly observed thatlevels of educational achievement vary widelybetween ethnic groups (for example, Modood,1997b, 2003; National Statistics, 2004). While it doesnot diminish the importance of absolute differences inclass mobility between groups if education is found tohave a substantial role in explaining them, it doesclarify some of the processes and favour certainexplanatory accounts. It indicates that policy attentionmight be most valuably focused on the education –and educational experiences – of different groups toensure greater parity of outcomes. Heath andMcMahon (2005) found, moreover, that even wheneducation was taken into account in measuringmobility, an ethnic group effect (or ‘penalty’)remained for certain groups. It is instructive to explore
whether this is also shown with these data and thesomewhat different design and premises of this study.
Educational levels of parents have also been shownto be important in facilitating the upward mobilityor higher class retention of their children. Parentaleducational qualifications can also stand in for somesort of latent class position that may have beendisguised by downward occupational mobility forthe parents on migration. Parental education istherefore included alongside parental class and twoindicators of economic status in the household oforigin – car ownership and housing tenure – toinvestigate the ways in which parents’ capital(human and economic) is related to their children’soutcomes. As each parent’s educational level maybe independently important, both are includedseparately. This means that this variable alsoincludes the possibility that there is no co-residentfather/mother to have an educational level. Thus,these variables also incorporate family structure.The information on qualifications for 1971 and 1981is limited by the form of the question asked inthose censuses. The parental educational variablederived from these can only distinguish higherqualifications levels, which were held by only asmall minority of the population in this period (only9% of the sample mothers and 15% of the samplefathers had such qualifications). There is no way ofdistinguishing between those parents with noqualifications at all and those with some non-advanced qualifications. This is aside from theimportant issue of comparability of qualificationsacross minority groups, and the extent to whichvariation in the meaning or exchange value ofqualifications obtained in different countries ordifferent types of institution may influenceobserved patterns and relationships.
Area effects are also potentially important ininfluencing outcomes in the second generation.There are two issues here. First, there is the extentto which certain minority groups may beconcentrated in areas that suffer from processes of
3Explaining social class outcomes
19
deindustrialisation and the consequently morelimited employment opportunities. While it hasbeen argued that minority ethnic group membershave adapted relatively well to deindustrialisation(Iganski and Payne, 1999), it remains the case thatminority groups are still heavily concentrated insome of the most deprived areas with theconsequent impacts on life chances that have beenstressed in discussions of social exclusion. Thesecond way in which area may be important is thatconcentrations of the same ethnic group have beenargued to be potential resources. Ethnic groupconcentrations in particular areas, may, it is argued,enhance social capital, enable some pooling ofresources and capital and aid enterprise.
Borjas (1992) developed the concept of effective‘ethnic capital’ to encapsulate the possibilities thatgeographical proximity of people both from thesame ethnic group and from other minority ethnicgroups might bring. On the other hand, thedistinction within the social capital literaturebetween bridging and bonding social capital(Putnam, 2000), has highlighted the extent towhich the positive aspects of geographicalconcentrations may at the same time inhibit wideradvancement: the groups may bond, but not beable to build bridges to other social networks. Workby Dorsett (1998) in the British context has shownthat, while for some groups geographicalconcentration and concentration in disadvantagedareas can be seen to go hand in hand, thoseminority group members who are successful mayalso elect for geographical proximity. For example,some Indians have moved into particular Londonsuburbs where relative concentration can providethem with cultural resources, which areindependent of, or go alongside, their success. Thisoption of combining concentration and culturalresources with moves to relatively affluent areas islikely to be possible only within London, however.
The role of geography is, therefore, layered andcomplex. In this study, an attempt has been madeto capture some form of area effect through theuse of a variable summarising the level of minoritygroup concentration in the ward of origin. Thisvariable aggregates minority ethnic groups sincethe area group variable did not enable theindividual groups considered in this study – andtherefore ‘own’ group – to be distinguished.However, to the extent that areas with higherproportions from minority ethnic groups aredistinctive, this variable may reveal somethingabout area effects.
A final issue that is explored in this chapter is therole of religion – or rather, how it can modify ourunderstanding of ethnic group effects. When tryingto explain different outcomes according to ethnicgroup and, in particular, when focusing on the greatdisadvantage experienced by Pakistani andBangladeshi minority groups, some (for example,Modood, 1997c) have suggested that the reason anethnic penalty cannot be observed to operateconsistently across minority groups (there is plentyof evidence that it operates, as discussed in Chapter1), is because the ‘ethnic penalty’ is, rather, a‘religious penalty’. Islam is, by this explanation,seen as the principal object of discrimination, ratherthan any minority ethnicity; and differences inexperiences between groups are better understoodin relation to the histories and trajectories of ethno-religious groups than ‘simply’ in relation toethnicity. There are problems of interpretation inrelation to differentiating by religion (as much as ormore so than for ethnicity) in terms of the causalprocesses invoked and how they are associatedwith religious groups. Nevertheless, the inclusion ofa religion question in the 2001 Census gives thepossibility of exploring further how religiousaffiliation is associated with the patterning of socialmobility. This chapter therefore considers whatassociations religion has with particular patterns ofsocial class outcomes, and how including religion inthe analysis can refine our understanding of ethnicgroup processes.
Achieving higher social classoutcomes
Individuals’ chances of ending up in theprofessional or managerial class were calculatedholding an increasing succession of factors constant.The results of these nested models exploring theeffect of different factors on probabilities of class‘success’ can be found in Table A1 in the Appendix.The main results from them are summarised andillustrated here. The effects of origin class andminority group concentration in the ward in whichthey were living in 1971/81 were examined,alongside sex, age, cohort and partnership status ofthe sample member, as the starting point forlooking at the relationship between origins anddestinations (Model 1). Rather than testing how farethnic differences in achievement of social classposition might be mediated by origins, the order inwhich different characteristics were added in wasdesigned to identify general patterns of the impact
Explaining social class outcomes
20
Migration and mobility
of origins on destinations and then to explorewhether these were mediated by or differedaccording to ethnic group. Successively, origineconomic variables and parental qualifications wereincluded (Model 2), followed by the effect ofethnicity over and above these origins (Model 3),then the sample members’ own educationalqualifications (Model 4), and finally some indicatorsof respondent’s economic status (car ownership andhousing tenure) (Model 5). The economic statusvariables were included as the final stage with somecaution, as they are likely to be outcomes ofdestination class status rather than mediating orindependent effects. They are therefore notextensively discussed, but this final set of potentialcontributory factors is provided to consider whetherinfluencing the achievement of a successful classposition can be distinguished from the impliedeconomic gains of such a position.
When we just look at the effects of the first set ofvariables, we find a clear effect of origins ondestinations. Those from service-class origins werethree times as likely as their counterparts fromworking-class occupations to end up in aprofessional or managerial class, and those fromintermediate-class occupations were 28% morelikely. And this is the case when sex, age, cohort,marital (partnership) status and area composition atorigin were held constant. Sex had no significantindependent effect on chances of success, which isperhaps unsurprising given that the outcome classis based on a family class taking account of bothpartners’ occupations. Any sex difference would,therefore, effectively apply to only single men andwomen. Also, as a result of the way destinationclass is measured by taking the higher class of thetwo partners, it is unsurprising to find thatpartnership has a strong influence on probability ofending up in a professional/managerial occupation.It has also been suggested that potential to partneris, itself, an indication of latent characteristics thatmight make occupational success more obtainable– but such an explanation is unnecessary to explainthe effect demonstrated here.
Interestingly we find that, controlling for cohort,which is itself insignificant, it is the younger agegroups who are more likely to achieve aprofessional/managerial class position. Theimplication could be that it is the younger agegroups who are more likely to obtain thequalifications necessary to obtaining managerial andprofessional positions. This hypothesis is supportedby Model 4, where, controlling for education,
younger age groups become less likely to achieve aprofessional/managerial position.
The area variables show that any concentration ofminorities in the ward of origin greater than 0%makes a professional/managerial class outcomemore likely, although there is not any clear patternwith the increasing levels of concentration. Itsuggests that, instead of there being something inthe concentration of ethnic minorities, it is thewards with no minority group presence at all whichare distinct. Possibly such areas tended to be theleast economically dynamic and thus failed toattract any inward migration up to the early 1980s;or it is possible that they allowed less scope forupward mobility. While the exact size of theseeffects varies according to the range ofcharacteristics taken account of, the positive impactremains and even increases as other factors aretaken into account.
The second model, where parents’ qualificationsand origin household economic status are added in,shows that parental social class has an independenteffect from other parental characteristics –education and economic resources. Conversely,controlling for class, mother’s and father’squalifications both increase the chance of their childhaving a professional/managerial qualification, as dothe economic status variables. Including thesevariables reduces the impact of service-class origins– but does not remove it. Thus, while some of theadvantage of service-class origins clearly comesthrough the power of economic resources andperhaps through the educational support andmotivation provided by highly educated parents,there are other aspects to class advantage whichcannot be explained in this way. We can think,perhaps, of networks and the social or culturalcapital that more privileged origins may provideaccess to (Bourdieu, 1997).
Interestingly, while lacking a mother inhibitschances of professional/managerial classdestinations relative to having a mother with no orlower qualifications (as might be expected), lackinga father increases the chances of professional/managerial class destinations relative to having anunqualified (or at least not highly qualified) father.While the former result draws attention to theimportance of mothers in developing theirchildren’s skills and education, it is difficult to knowhow to account for this latter result. It may be thatin such fatherless households aspirations areparticularly high, or that they are distinctive in
21
terms of family structure (in ways that are notmeasured, such as number of siblings), whichrelatively facilitates upward mobility. An alternativeexplanation is that unqualified/ lower qualifiedfathers have a positively restricting effect that isabsent when they are not there. Moreover, bydefinition, we do not know the characteristics ofabsent fathers. They are likely to be a combinationof both the more and the less advantaged, and theirabsence may have less impact on the suppressingof successful outcomes than the advantages that atleast some of them offer in enabling successfuloutcomes. Even if non-resident, they maycontribute the benefits of their economic, social andhuman capital assets to their children.
Finally, once parents’ qualifications and economicstatus are taken into account the effect of cohort onprofession or managerial outcomes becomessignificant and is negative. This indicates that,controlling for age group, once the higher levels ofqualifications that might be seen in parents in 1981compared to those in 1971 are factored out, thosefrom the 1981 cohort are slightly less likely toachieve a service-class origin than their counterpartsfrom the decade earlier. That is, it suggests that the10 more years that the older cohort hasaccumulated constitutes a slight advantage in termsof class position, and one which is not outweighedby the potentially lower levels of educationalachievement that the older cohort might beexpected to have acquired with the general rise inlevels of qualifications over time.
It was only after establishing these patterns of therelationship between various characteristics of theparents and their children’s outcomes that ethnicgroup was examined in addition (Model 3). Here,whether there was any distinct impact of ethnicgroup once background had been taken intoaccount was being tested. This model was thusengaging with one of the recurrent claims in theliterature that differential ethnic group success inthe second generation can be linked to parents’characteristics and the availability of different‘capitals’. The absence of ethnic group effectswould not imply that life chances were the samefor all ethnic groups; but it would suggest that itwas parents’ achieved occupation on migration,combined with the resources (human and economiccapital) that the migrant generation brought withthem that determine the very different outcomeswe observe for the different groups today, and thatcommon processes post-migration might beassumed to operate in England and Wales. This
would indicate that a focus on class inequalitiesrather than ethnic group might be most appropriatefor preventing the transmission of disadvantage intosubsequent generations. What we find, instead, isthat all the minority groups except the Pakistanis(and the Bangladeshis – but the result for thatgroup is not statistically significant) have a higherprobability of professional/managerial outcomesthan can be explained by their origins (asimperfectly measured here) alone.
This is congruent with the very high proportionswith working-class origins shown in the precedingchapter that might make us anticipate greaterlevels of achievement from working-classbackgrounds. It would also support the idea,discussed in Chapter 1, that these groups may haveexperienced downward mobility on migration andthat this was not the experience of the Pakistanis(Daniel, 1968; Smith, 1977; Modood, 1997b).Nevertheless, it is interesting to find this effecteven when other factors relating to origins (parentalqualifications and economic status) have beenaccounted for. It might be expected that it wouldbe the differences in these parental resources thatwould determine different rates of achievementbetween the groups. Instead, we find that, evencontrolling for these background differences,Caribbeans have a 22% greater chance of endingup in the professional classes than otherwisecomparable white non-migrants; white migrantshave a 30% greater chance; and the other groupshave a greater chance of between 56% (Indians)and 75% (Black Africans).
The increased chances of ending up in aprofessional/managerial position (comparing likewith like) are perhaps not very surprising given thelow starting points and some anticipation offlexibility within the class structure. However, thedifferences between the groups are perhaps ofmore interest. How is it that Black Africans manageto overcome the effects of their origins more thanthe other groups? And, even more strikingly, whyshould it be that Pakistanis, even given theirworking-class concentration at origin, are less likelyto achieve professional/managerial positions thantheir white counterparts once their origins arecontrolled for? Comparable outcomes with thewhite group would indicate that theirpreponderance in the working class was related toa reasonably close match between theiroccupations on migration and their pre-migrationskills and class. Class processes within England andWales would then have taken over to impact on
Explaining social class outcomes
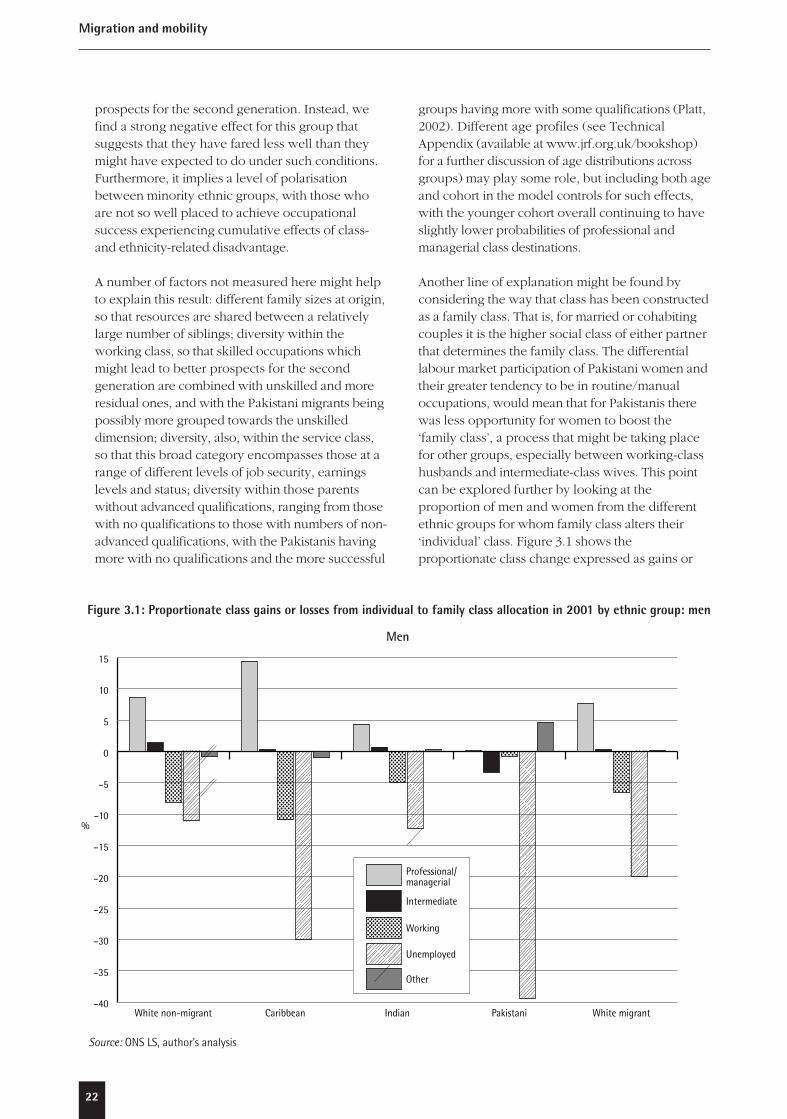
22
Migration and mobility
prospects for the second generation. Instead, wefind a strong negative effect for this group thatsuggests that they have fared less well than theymight have expected to do under such conditions.Furthermore, it implies a level of polarisationbetween minority ethnic groups, with those whoare not so well placed to achieve occupationalsuccess experiencing cumulative effects of class-and ethnicity-related disadvantage.
A number of factors not measured here might helpto explain this result: different family sizes at origin,so that resources are shared between a relativelylarge number of siblings; diversity within theworking class, so that skilled occupations whichmight lead to better prospects for the secondgeneration are combined with unskilled and moreresidual ones, and with the Pakistani migrants beingpossibly more grouped towards the unskilleddimension; diversity, also, within the service class,so that this broad category encompasses those at arange of different levels of job security, earningslevels and status; diversity within those parentswithout advanced qualifications, ranging from thosewith no qualifications to those with numbers of non-advanced qualifications, with the Pakistanis havingmore with no qualifications and the more successful
groups having more with some qualifications (Platt,2002). Different age profiles (see TechnicalAppendix (available at www.jrf.org.uk/bookshop)for a further discussion of age distributions acrossgroups) may play some role, but including both ageand cohort in the model controls for such effects,with the younger cohort overall continuing to haveslightly lower probabilities of professional andmanagerial class destinations.
Another line of explanation might be found byconsidering the way that class has been constructedas a family class. That is, for married or cohabitingcouples it is the higher social class of either partnerthat determines the family class. The differentiallabour market participation of Pakistani women andtheir greater tendency to be in routine/manualoccupations, would mean that for Pakistanis therewas less opportunity for women to boost the‘family class’, a process that might be taking placefor other groups, especially between working-classhusbands and intermediate-class wives. This pointcan be explored further by looking at theproportion of men and women from the differentethnic groups for whom family class alters their‘individual’ class. Figure 3.1 shows theproportionate class change expressed as gains or
Figure 3.1: Proportionate class gains or losses from individual to family class allocation in 2001 by ethnic group: men
Source: ONS LS, author’s analysis
–40
–35
–30
–25
–20
–15
–10
–5
0
5
10
15
Other
Unemployed
Working
Intermediate
Professional/managerial
White migrantPakistaniIndianCaribbeanWhite non-migrant
Men
%
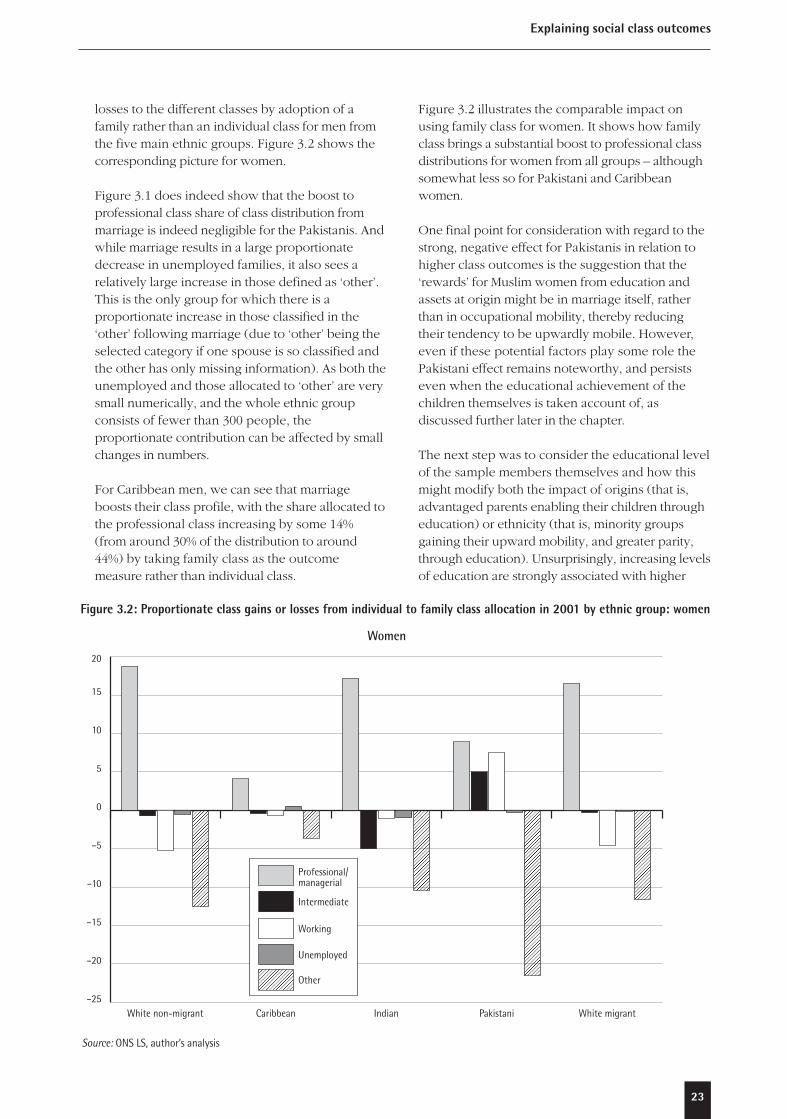
23
losses to the different classes by adoption of afamily rather than an individual class for men fromthe five main ethnic groups. Figure 3.2 shows thecorresponding picture for women.
Figure 3.1 does indeed show that the boost toprofessional class share of class distribution frommarriage is indeed negligible for the Pakistanis. Andwhile marriage results in a large proportionatedecrease in unemployed families, it also sees arelatively large increase in those defined as ‘other’.This is the only group for which there is aproportionate increase in those classified in the‘other’ following marriage (due to ‘other’ being theselected category if one spouse is so classified andthe other has only missing information). As both theunemployed and those allocated to ‘other’ are verysmall numerically, and the whole ethnic groupconsists of fewer than 300 people, theproportionate contribution can be affected by smallchanges in numbers.
For Caribbean men, we can see that marriageboosts their class profile, with the share allocated tothe professional class increasing by some 14%(from around 30% of the distribution to around44%) by taking family class as the outcomemeasure rather than individual class.
Figure 3.2 illustrates the comparable impact onusing family class for women. It shows how familyclass brings a substantial boost to professional classdistributions for women from all groups – althoughsomewhat less so for Pakistani and Caribbeanwomen.
One final point for consideration with regard to thestrong, negative effect for Pakistanis in relation tohigher class outcomes is the suggestion that the‘rewards’ for Muslim women from education andassets at origin might be in marriage itself, ratherthan in occupational mobility, thereby reducingtheir tendency to be upwardly mobile. However,even if these potential factors play some role thePakistani effect remains noteworthy, and persistseven when the educational achievement of thechildren themselves is taken account of, asdiscussed further later in the chapter.
The next step was to consider the educational levelof the sample members themselves and how thismight modify both the impact of origins (that is,advantaged parents enabling their children througheducation) or ethnicity (that is, minority groupsgaining their upward mobility, and greater parity,through education). Unsurprisingly, increasing levelsof education are strongly associated with higher
Figure 3.2: Proportionate class gains or losses from individual to family class allocation in 2001 by ethnic group: women
Source: ONS LS, author’s analysis
–25
–20
–15
–10
–5
0
5
10
15
20
Other
Unemployed
Working
Intermediate
Professional/managerial
White migrantPakistaniIndianCaribbeanWhite non-migrant
Women
Explaining social class outcomes
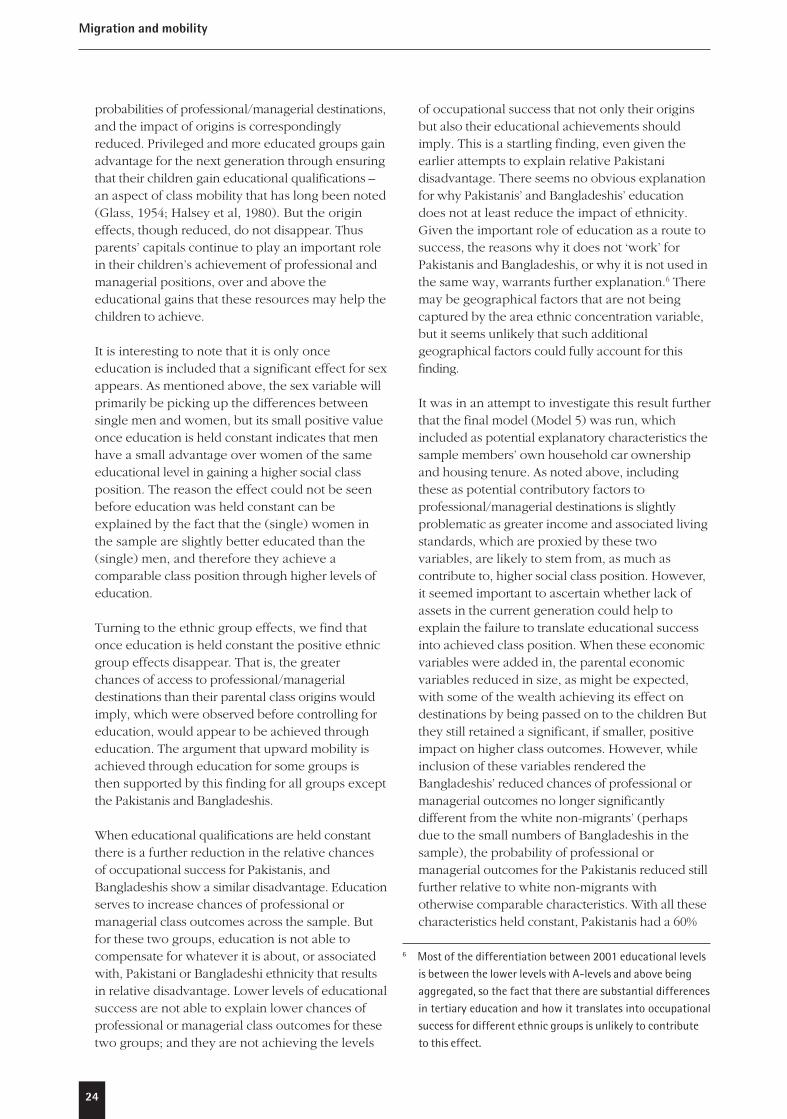
24
Migration and mobility
probabilities of professional/managerial destinations,and the impact of origins is correspondinglyreduced. Privileged and more educated groups gainadvantage for the next generation through ensuringthat their children gain educational qualifications –an aspect of class mobility that has long been noted(Glass, 1954; Halsey et al, 1980). But the origineffects, though reduced, do not disappear. Thusparents’ capitals continue to play an important rolein their children’s achievement of professional andmanagerial positions, over and above theeducational gains that these resources may help thechildren to achieve.
It is interesting to note that it is only onceeducation is included that a significant effect for sexappears. As mentioned above, the sex variable willprimarily be picking up the differences betweensingle men and women, but its small positive valueonce education is held constant indicates that menhave a small advantage over women of the sameeducational level in gaining a higher social classposition. The reason the effect could not be seenbefore education was held constant can beexplained by the fact that the (single) women inthe sample are slightly better educated than the(single) men, and therefore they achieve acomparable class position through higher levels ofeducation.
Turning to the ethnic group effects, we find thatonce education is held constant the positive ethnicgroup effects disappear. That is, the greaterchances of access to professional/managerialdestinations than their parental class origins wouldimply, which were observed before controlling foreducation, would appear to be achieved througheducation. The argument that upward mobility isachieved through education for some groups isthen supported by this finding for all groups exceptthe Pakistanis and Bangladeshis.
When educational qualifications are held constantthere is a further reduction in the relative chancesof occupational success for Pakistanis, andBangladeshis show a similar disadvantage. Educationserves to increase chances of professional ormanagerial class outcomes across the sample. Butfor these two groups, education is not able tocompensate for whatever it is about, or associatedwith, Pakistani or Bangladeshi ethnicity that resultsin relative disadvantage. Lower levels of educationalsuccess are not able to explain lower chances ofprofessional or managerial class outcomes for thesetwo groups; and they are not achieving the levels
of occupational success that not only their originsbut also their educational achievements shouldimply. This is a startling finding, even given theearlier attempts to explain relative Pakistanidisadvantage. There seems no obvious explanationfor why Pakistanis’ and Bangladeshis’ educationdoes not at least reduce the impact of ethnicity.Given the important role of education as a route tosuccess, the reasons why it does not ‘work’ forPakistanis and Bangladeshis, or why it is not used inthe same way, warrants further explanation.6 Theremay be geographical factors that are not beingcaptured by the area ethnic concentration variable,but it seems unlikely that such additionalgeographical factors could fully account for thisfinding.
It was in an attempt to investigate this result furtherthat the final model (Model 5) was run, whichincluded as potential explanatory characteristics thesample members’ own household car ownershipand housing tenure. As noted above, includingthese as potential contributory factors toprofessional/managerial destinations is slightlyproblematic as greater income and associated livingstandards, which are proxied by these twovariables, are likely to stem from, as much ascontribute to, higher social class position. However,it seemed important to ascertain whether lack ofassets in the current generation could help toexplain the failure to translate educational successinto achieved class position. When these economicvariables were added in, the parental economicvariables reduced in size, as might be expected,with some of the wealth achieving its effect ondestinations by being passed on to the children Butthey still retained a significant, if smaller, positiveimpact on higher class outcomes. However, whileinclusion of these variables rendered theBangladeshis’ reduced chances of professional ormanagerial outcomes no longer significantlydifferent from the white non-migrants’ (perhapsdue to the small numbers of Bangladeshis in thesample), the probability of professional ormanagerial outcomes for the Pakistanis reduced stillfurther relative to white non-migrants withotherwise comparable characteristics. With all thesecharacteristics held constant, Pakistanis had a 60%
6 Most of the differentiation between 2001 educational levelsis between the lower levels with A-levels and above beingaggregated, so the fact that there are substantial differencesin tertiary education and how it translates into occupationalsuccess for different ethnic groups is unlikely to contributeto this effect.

25
lower chance of professional or managerialoutcomes compared to their white non-migrantcounterparts. Pakistanis are clearly disadvantagedrelative to other groups in terms of achievement ofhigher class positions not only compared to thosewith similar origins, but also compared to those ofthe same educational level and with similareconomic assets.
Given that the inclusion of sample members’ owneconomic status variables did not help us tounderstand the Pakistani disadvantage, and giventhe problems of negative causation (identifiedearlier) from the inclusion of such variables in anattempt to account for social class outcomes, Theremainder of this chapter, with its furtherexploration of issues raised by the differences inclass outcomes and the contribution of differentfactors, will exclude these variables. The set ofcharacteristics that subsequent models will holdconstant when developing this analysis andexploring further the effect of ethnicity (andreligion) on outcomes, will, therefore, be: parents’social class and qualifications, household economicstatus at origin, area minority ethnic concentration,
cohort, and study members’ own age, marital status,sex, and highest educational qualifications.
Figure 3.3 shows the predicted probabilities ofbeing in the professional/managerial classes byethnic group estimated taking the above set ofcharacteristics into account, but based on the effectsassociated with group members’ actualcharacteristics. It shows the very low probability ofa ‘successful’ outcome for Pakistanis andBangladeshis, and the high probability for Indians,the mixed ‘Chinese and other’ group and the whitemigrants. The 95% confidence intervals shown onthe figure indicate that none of the predictedprobabilities for these particular minority groupsoverlap with those for the white non-migrantgroup, indicating genuine differences in chances.
If these then are the overall predicted chances forthe different groups, how much is determined bythe groups’ characteristics (for example, differentbackgrounds and different levels of educationalachievement) and how much is determined by an‘ethnicity effect’? After all, as Figure 3.4 shows, theprobabilities vary with class background, and we
Figure 3.3: The proportion from each group predicted to be in professional/managerial class (95% confidence intervals given in brackets)
Source: ONS LS, author’s analysis
0
0.1
0.2
0.3
0.4
0.5
0.6
Whitemigrant
Chineseand other
BangladeshiPakistaniIndianBlack AfricanCaribbeanWhitenon-migrant
0.48(0.48–0.48)
0.40(0.38–0.41)
0.52(0.48–0.56)
0.55(0.54–0.57)
0.31(0.29–0.32)
0.32(0.28–0.36)
0.55(0.53–0.57)
0.50(0.49–0.51)
Explaining social class outcomes
26
Migration and mobility
saw in Chapter 2 how class background varied bygroup.
One way of looking at this is to investigate whatthe predicted probabilities would be if the groupmembers retained their characteristics but wereattributed the ethnic group effect from a differentgroup. Figure 3.5, shows the predictions for men ofworking-class origins from a selection of groupsdependent upon having either the white non-migrant or the Pakistani ethnicity effect attributedto them. In the figure, the impact of being whitenon-migrant or Pakistani has been applied to themembers of a set of ethnic groups. Thus, the whitenon-migrants with the white non-migrant effect andthe Pakistanis with the Pakistani chances are theactual predicted probabilities of ending up inprofessional or managerial occupations for men ofworking-class origins from these two groups, 0.38and 0.24 respectively. The remaining predictionsare ‘what ifs’. Figure 3.5 shows that if all groups hadtheir own characteristics but the ethnic group effectof being white non-migrant, the Indian men fromworking-class backgrounds would come out aheadon the strength of their other characteristics.However, the Pakistanis would also do substantially(and, as the 95% confidence intervals show,significantly) better than their white non-migrantpeers from working-class backgrounds. They shouldclearly be achieving higher levels of occupational
success than they are, with all the implications thatfollow from that. In normalising Indian ‘success’ andPakistani ‘disadvantage’, research has tended tolook for particular characteristics (especiallybackground or educational qualifications) to explainthe big differences between their outcomes. Thisanalysis suggests, however, that it is not only oreven predominantly such characteristics, in so far asthey are successfully captured here, that are leadingto Pakistanis’ disadvantage. Instead we need to lookfurther than is possible in this study to shed morelight on this finding, including taking account ofmore aspects of potentially measurable variationbetween groups.
The following sections of this chapter develop theanalysis in a number of ways. First, I briefly explorewhether there are any interaction effects. That is, Iexamine whether the impact of certaincharacteristics is different for different sub-groups,for example, whether the impact of origins ondestinations is different for men than for women.Second, I consider all possible class outcomessimultaneously, rather than just achievement ofprofessional/managerial class compared to all otheroutcomes. And third, I investigate what religion canadd to our understanding of ethnic groupdifferences in social mobility.
Figure 3.4: The proportion from each class of origin predicted to be in professional/managerial class, by sex
0.7 0.69
0.460.44
0.390.37
Source: ONS LS, author’s analysis
0
0.1
0.2
0.3
0.4
0.5
0.6
0.7
0.8
Women
Men
Working-class backgroundIntermediate-class backgroundService-class background
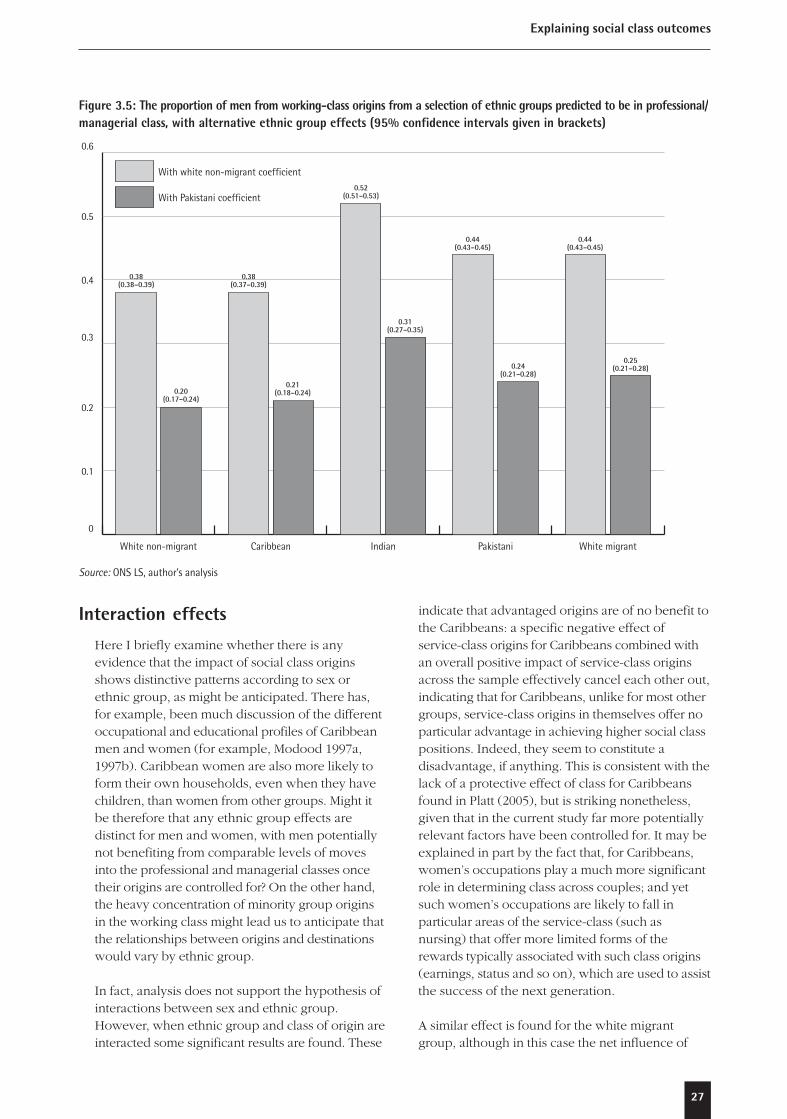
27
Interaction effects
Here I briefly examine whether there is anyevidence that the impact of social class originsshows distinctive patterns according to sex orethnic group, as might be anticipated. There has,for example, been much discussion of the differentoccupational and educational profiles of Caribbeanmen and women (for example, Modood 1997a,1997b). Caribbean women are also more likely toform their own households, even when they havechildren, than women from other groups. Might itbe therefore that any ethnic group effects aredistinct for men and women, with men potentiallynot benefiting from comparable levels of movesinto the professional and managerial classes oncetheir origins are controlled for? On the other hand,the heavy concentration of minority group originsin the working class might lead us to anticipate thatthe relationships between origins and destinationswould vary by ethnic group.
In fact, analysis does not support the hypothesis ofinteractions between sex and ethnic group.However, when ethnic group and class of origin areinteracted some significant results are found. These
indicate that advantaged origins are of no benefit tothe Caribbeans: a specific negative effect ofservice-class origins for Caribbeans combined withan overall positive impact of service-class originsacross the sample effectively cancel each other out,indicating that for Caribbeans, unlike for most othergroups, service-class origins in themselves offer noparticular advantage in achieving higher social classpositions. Indeed, they seem to constitute adisadvantage, if anything. This is consistent with thelack of a protective effect of class for Caribbeansfound in Platt (2005), but is striking nonetheless,given that in the current study far more potentiallyrelevant factors have been controlled for. It may beexplained in part by the fact that, for Caribbeans,women’s occupations play a much more significantrole in determining class across couples; and yetsuch women’s occupations are likely to fall inparticular areas of the service-class (such asnursing) that offer more limited forms of therewards typically associated with such class origins(earnings, status and so on), which are used to assistthe success of the next generation.
A similar effect is found for the white migrantgroup, although in this case the net influence of
Figure 3.5: The proportion of men from working-class origins from a selection of ethnic groups predicted to be in professional/managerial class, with alternative ethnic group effects (95% confidence intervals given in brackets)
Source: ONS LS, author’s analysis
0
0.1
0.2
0.3
0.4
0.5
0.6
With Pakistani coefficient
With white non-migrant coefficient
White migrantPakistaniIndianCaribbeanWhite non-migrant
0.31(0.27–0.35)
0.38(0.38–0.39)
0.20(0.17–0.24)
0.38(0.37–0.39)
0.21(0.18–0.24)
0.52(0.51–0.53)
0.44(0.43–0.45)
0.24(0.21–0.28)
0.44(0.43–0.45)
0.25(0.21–0.28)
Explaining social class outcomes
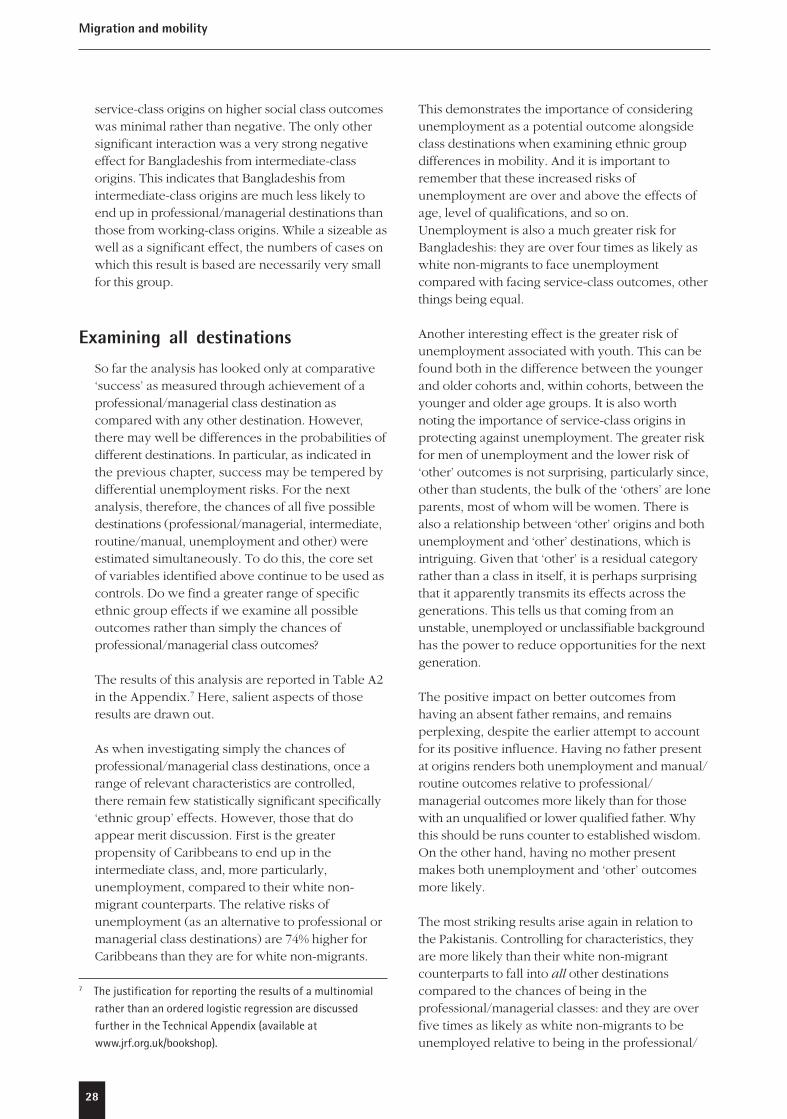
28
Migration and mobility
service-class origins on higher social class outcomeswas minimal rather than negative. The only othersignificant interaction was a very strong negativeeffect for Bangladeshis from intermediate-classorigins. This indicates that Bangladeshis fromintermediate-class origins are much less likely toend up in professional/managerial destinations thanthose from working-class origins. While a sizeable aswell as a significant effect, the numbers of cases onwhich this result is based are necessarily very smallfor this group.
Examining all destinations
So far the analysis has looked only at comparative‘success’ as measured through achievement of aprofessional/managerial class destination ascompared with any other destination. However,there may well be differences in the probabilities ofdifferent destinations. In particular, as indicated inthe previous chapter, success may be tempered bydifferential unemployment risks. For the nextanalysis, therefore, the chances of all five possibledestinations (professional/managerial, intermediate,routine/manual, unemployment and other) wereestimated simultaneously. To do this, the core setof variables identified above continue to be used ascontrols. Do we find a greater range of specificethnic group effects if we examine all possibleoutcomes rather than simply the chances ofprofessional/managerial class outcomes?
The results of this analysis are reported in Table A2in the Appendix.7 Here, salient aspects of thoseresults are drawn out.
As when investigating simply the chances ofprofessional/managerial class destinations, once arange of relevant characteristics are controlled,there remain few statistically significant specifically‘ethnic group’ effects. However, those that doappear merit discussion. First is the greaterpropensity of Caribbeans to end up in theintermediate class, and, more particularly,unemployment, compared to their white non-migrant counterparts. The relative risks ofunemployment (as an alternative to professional ormanagerial class destinations) are 74% higher forCaribbeans than they are for white non-migrants.
This demonstrates the importance of consideringunemployment as a potential outcome alongsideclass destinations when examining ethnic groupdifferences in mobility. And it is important toremember that these increased risks ofunemployment are over and above the effects ofage, level of qualifications, and so on.Unemployment is also a much greater risk forBangladeshis: they are over four times as likely aswhite non-migrants to face unemploymentcompared with facing service-class outcomes, otherthings being equal.
Another interesting effect is the greater risk ofunemployment associated with youth. This can befound both in the difference between the youngerand older cohorts and, within cohorts, between theyounger and older age groups. It is also worthnoting the importance of service-class origins inprotecting against unemployment. The greater riskfor men of unemployment and the lower risk of‘other’ outcomes is not surprising, particularly since,other than students, the bulk of the ‘others’ are loneparents, most of whom will be women. There isalso a relationship between ‘other’ origins and bothunemployment and ‘other’ destinations, which isintriguing. Given that ‘other’ is a residual categoryrather than a class in itself, it is perhaps surprisingthat it apparently transmits its effects across thegenerations. This tells us that coming from anunstable, unemployed or unclassifiable backgroundhas the power to reduce opportunities for the nextgeneration.
The positive impact on better outcomes fromhaving an absent father remains, and remainsperplexing, despite the earlier attempt to accountfor its positive influence. Having no father presentat origins renders both unemployment and manual/routine outcomes relative to professional/managerial outcomes more likely than for thosewith an unqualified or lower qualified father. Whythis should be runs counter to established wisdom.On the other hand, having no mother presentmakes both unemployment and ‘other’ outcomesmore likely.
The most striking results arise again in relation tothe Pakistanis. Controlling for characteristics, theyare more likely than their white non-migrantcounterparts to fall into all other destinationscompared to the chances of being in theprofessional/managerial classes: and they are overfive times as likely as white non-migrants to beunemployed relative to being in the professional/
7 The justification for reporting the results of a multinomialrather than an ordered logistic regression are discussedfurther in the Technical Appendix (available atwww.jrf.org.uk/bookshop).

29
managerial classes. As stressed above, this iscomparing those with similar origins, parentalcapital and qualifications levels. This would seem tobe evidence of a group-specific disadvantage that achanging class structure and weakening of class-based intergenerational privilege is unlikely toaffect.
Given that the characteristics of the differentgroups do in fact vary, it is instructive to ascertainwhat the importance of this effect is compared tothe group characteristics in determining the pooreroutcomes of Pakistanis overall. This can be done byapplying the impact of being in a particular groupto other groups, but otherwise retaining theindividuals’ characteristics, as was done for theprevious analysis and illustrated in Figure 3.5. Boththe white non-migrant and the Pakistani effects onchances of having routine/manual outcomesrelative to having professional/managerial outcomeswere applied to a number of groups.
The result of calculating such differential chancesare illustrated, in Table 3.1, for men from fourgroups and looking separately at those fromworking-class and service-class origins. This tableillustrates the impact of ethnicity on the relativerisks of ending up in the routine and manualclasses. The characteristics of the (male) membersof the different groups are retained and the chancesof this outcome associated with thosecharacteristics. But the two ethnic group effects areapplied in turn to produce the results in the first(white non-migrant) and second (Pakistani) parts ofthe table. Thus, the chances for white non-migrantsin the first half of the table and for Pakistanis in thesecond half of the table are their actual predictedrelative risks, while those for the other cells aretheir chances ‘as if’ they came from a differentgroup (similar to Figure 3.5, earlier). Risks above
one show an increased risk of the working-classoutcome and those below one show a reduced risk.From this we find that white non-migrants fromworking-class origins are only 82% as likely to endup in the working class as the professional /managerial class, and the risks for those fromservice-class origins (along with all the othercharacteristics that tend to go with such origins), are85% less likely to end up in the professional/managerial classes. If those from working classbackgrounds had the ‘Pakistani effect’, however,their risks of ending up in the working class wouldrise to being nearly 1.5:1.
What the first half of this table shows is thatPakistanis from both service- and working-classorigins would be expected to have a lowerconcentration in the working class than white non-migrants if they did not have an ethnic groupeffect. The relative risks for the Caribbeans and theBangladeshis show that this is not necessarily thecase for all ethnic groups: service-class originCaribbeans would have a higher risk of working-class destinations than whites on the basis of theircharacteristics, although working-class originCaribbeans would have a lower risk; andBangladeshi characteristics would mean greater risksof working-class destinations than whites for bothorigins, even if there was no separate ethnic groupeffect.
The second part of the table confirms this pictureby showing how the greater risks of working-classdestinations associated with the Pakistani ethnicgroup would affect men from all groups on thebasis of their other characteristics but as if theywere Pakistani. It reiterates the picture given inFigure 3.5. From this we can see that whites ofworking-class origin would actually have a greaterrisk of a working-class rather than a service-class
Table 3.1: Relative risks of working class rather than professional/managerial class outcome according to owncharacteristics and varying ethnic group coefficient
From working-class origin From service-class origin
For white non-migrants based on own coefficient 0.820 0.145For Pakistanis based on white non-migrant coefficient 0.577 0.104Caribbean based on white non-migrant coefficient 0.711 0.251Bangladeshis based on white non-migrant coefficient 0.828 0.188
For white non-migrants based on Pakistani coefficient 1.492 0.263For Pakistanis based on own coefficient 1.050 0.189Caribbeans based on Pakistani coefficient 1.292 0.456Bangladeshis based on Pakistani coefficient 1.506 0.341
Source: ONS LS, author’s analysis
Explaining social class outcomes
30
Migration and mobility
outcome if they had the Pakistani ethnic groupeffect, while the chances are about equal forPakistanis. Again, the Bangladeshi characteristicswould increase the risks of working-class outcomesrelative to white non-migrants: if they had the sameethnic group effect as Pakistanis their expectationsof working-class outcomes on the basis of theircharacteristics from either class origin would bevery different from the Pakistanis’ chances.
This distinction is important given the tendency togroup the Pakistanis and Bangladeshis together inboth published tables and discussion. A focus onchanging the characteristics (that is, increasingeducational levels) and reducing the links betweenorigins and destination more generally may beeffective in breaking the transmission ofdisadvantage for Bangladeshis, but it looks as if thePakistanis present specific group-based issues. Asmentioned previously, some of these may be to dowith geographical issues, the relevance of familystructure (although that is a comparable issue forBangladeshis) and the different meaning of some ofthe controls for different groups. For example,owner occupation at origin is not necessarily the
indicator of advantage for Pakistanis that it tends tobe for other groups (Phillips, 1997).
What can religion add?
Finally, this chapter explores whether religiousaffiliation makes a difference to social classoutcomes, and, if so, how this might add to ourunderstanding of differences within or betweengroups. Ethnicity per se may not haveoverwhelming explanatory power, but perhaps, ashas been posited by some commentators, religionmay be a more telling differentiator betweengroups, whether because it better captures thespecific histories and experiences of particulargroups, or because it is a greater source, as somehave argued, of group-targeted discrimination (see,for example, Modood, 1997c). First, the relationshipbetween religion and ethnicity was examinedsimply by identifying the levels of overlap betweenparticular religious affiliations and ethnic groups. AsFigure 3.6 shows, over 90% of Pakistanis andBangladeshis are Muslims, although around a thirdof Muslims are not from either of these groups.
Figure 3.6: Overlap between religion and ethnic group for certain groups and religions
92%
65.3%
35.3%
94.9%
36.1%
92.3%
70.3%72.3%
Source: ONS LS, author’s analysis
0
20
40
60
80
100
Whi
te n
on-m
igra
nts:
Chris
tian
Carib
bean
s: C
hris
tian
Hin
dus:
Indi
an
Indi
ans:
Hin
du
Sikh
s: In
dian
Indi
ans:
Sik
h
Mus
lims:
Pak
ista
nior
Ban
glad
eshi
Paki
stan
is a
ndBa
ngla
desh
is: M
uslim
31
Roughly a third of Indians are Sikh and a thirdHindu; the remainder includes Muslims (11%) andChristians (7%). But almost all Hindus and Sikhsclaim Indian as their ethnic group. Figure 3.6 alsogives the proportions affiliated to a Christiandenomination from both the Caribbean and thewhite non-migrant groups. In both cases just over70% are affiliated.
Moving on to look at the associations betweenreligion and patterns of origins and destinations, therole of religion in affecting professional/managerialclass outcomes compared to any other destination,was analysed controlling for the standard set offactors identified above. The results from thisanalysis are reported in Table A3 in the Appendixand are described and discussed here.
The inclusion of religion in addition to the controlvariables (but excluding ethnicity) showed asignificant contribution to model fit, and significanteffects were found for Hindu, Jewish, Muslim, Sikhand other religions, relative to being a Christian.Being Hindu or Jewish enhanced the probability ofa professional/managerial class outcome, otherthings being equal, while being Muslim, Sikh orfrom a religious group other than the main religionsmade such a destination less likely. I examined theeffects associated with religion as it varied by sexand found that the disadvantage associated withbeing Muslim was particularly pronounced forwomen, possibly lending support to the suggestionmade above that some Pakistani (and Bangladeshi)women may have different occupationaltrajectories, and for some marriage may representan alternative outcome to occupational success.
The number of significant differentiations betweenreligions indicate that religion is possibly a morestable (and meaningful?) indicator of identity thanthe ethnic group as normally measured (see, forexample, Jacobsen, 1997, 1998). Moreover, the factthat it was not compulsory to complete this onecensus question may mean that those who didrespond have a reasonably distinct sense of theirreligious identity. The religious differences alsoindicate diversity within groups: the Indian ethnicgroup is made up largely of both Sikhs and Hindus,but the two groups’ chances of achievingprofessional/managerial class outcomes arerespectively less than and greater than their whitecounterparts’, controlling for relevant factors. Thisgave us the net result of a non-significant effect forIndians when examining ethnic group effects ontheir own. Such differentiations indicate the way
that religion can refine our understanding ofethnicity, revealing within-group patterns andprocesses. The large positive effect for the Jewishgroup (which would usually be subsumed withinthe white ethnic group) is particularly striking.Holding a range of relevant characteristics constant,they have much greater chances of class successthan their Christian counterparts. Thus we canpotentially identify subsets of the classified ethnicgroups with distinctive pre-migration histories,within-England and Wales experiences anddifferential access to resources and different formsof ‘capital’, including ethnic capital (Borjas, 1992;Modood, 2004), where such subgroups havedistinctive religious affiliations.
Moreover, the results could also indicate the extentto which the controls do not cover all the relevantstructural and historical differences between groups.Indeed, by contrast with the way ethnic group hasbeen defined in this study, religion on its own doesnot account for distinctions between migrants andnon-migrants, at least in the shorter term, and timesince migration might also be important.
To look at the relationship between ethnic groupand religion, ethnic group was added back into themodel, but in addition to religion. With ethnicgroup included, both the positive effect of beingJewish and the negative effect of being affiliated tothe composite group of ‘other’ religions remainedcomparable to those when only religion wasincluded. This is not entirely surprising as theJewish effect and the ‘other religious group’ effectwill be distinguishing primarily within the whitenon-migrant group (although being Jewish mightalso be expected to differentiate within the whitemigrant group). Those belonging to other religionswill also be from a mixture of backgrounds, butpredominantly white ones. Why other religiousbackground should be associated with lowerchances of professional/managerial class attainment,even when controlling for ethnic group differencesas well as other relevant characteristics, remains anintriguing question. It may be best considered byexploring what other characteristics are alsoassociated with those affiliating to the range ofdifferent religions that make up this residualcategory (in order of size in England and Wales as awhole, Spiritualists, Pagans, Jain, Wicca, Rastafarian,Bahá’i and Zoroastrian). For example, we can notethat this residual category does appear toexperience above-average rates of sickness anddisability which could impact on their class position(ONS, 2004b).
Explaining social class outcomes
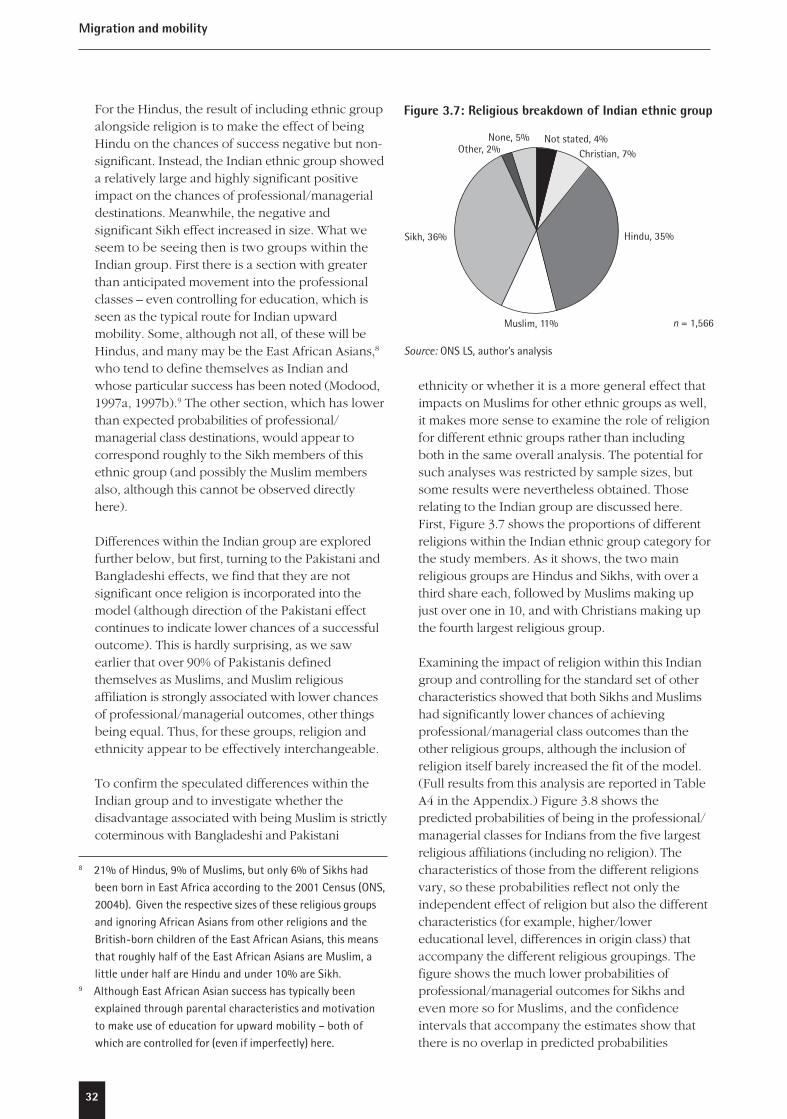
32
Migration and mobility
For the Hindus, the result of including ethnic groupalongside religion is to make the effect of beingHindu on the chances of success negative but non-significant. Instead, the Indian ethnic group showeda relatively large and highly significant positiveimpact on the chances of professional/managerialdestinations. Meanwhile, the negative andsignificant Sikh effect increased in size. What weseem to be seeing then is two groups within theIndian group. First there is a section with greaterthan anticipated movement into the professionalclasses – even controlling for education, which isseen as the typical route for Indian upwardmobility. Some, although not all, of these will beHindus, and many may be the East African Asians,8
who tend to define themselves as Indian andwhose particular success has been noted (Modood,1997a, 1997b).9 The other section, which has lowerthan expected probabilities of professional/managerial class destinations, would appear tocorrespond roughly to the Sikh members of thisethnic group (and possibly the Muslim membersalso, although this cannot be observed directlyhere).
Differences within the Indian group are exploredfurther below, but first, turning to the Pakistani andBangladeshi effects, we find that they are notsignificant once religion is incorporated into themodel (although direction of the Pakistani effectcontinues to indicate lower chances of a successfuloutcome). This is hardly surprising, as we sawearlier that over 90% of Pakistanis definedthemselves as Muslims, and Muslim religiousaffiliation is strongly associated with lower chancesof professional/managerial outcomes, other thingsbeing equal. Thus, for these groups, religion andethnicity appear to be effectively interchangeable.
To confirm the speculated differences within theIndian group and to investigate whether thedisadvantage associated with being Muslim is strictlycoterminous with Bangladeshi and Pakistani
ethnicity or whether it is a more general effect thatimpacts on Muslims for other ethnic groups as well,it makes more sense to examine the role of religionfor different ethnic groups rather than includingboth in the same overall analysis. The potential forsuch analyses was restricted by sample sizes, butsome results were nevertheless obtained. Thoserelating to the Indian group are discussed here.First, Figure 3.7 shows the proportions of differentreligions within the Indian ethnic group category forthe study members. As it shows, the two mainreligious groups are Hindus and Sikhs, with over athird share each, followed by Muslims making upjust over one in 10, and with Christians making upthe fourth largest religious group.
Examining the impact of religion within this Indiangroup and controlling for the standard set of othercharacteristics showed that both Sikhs and Muslimshad significantly lower chances of achievingprofessional/managerial class outcomes than theother religious groups, although the inclusion ofreligion itself barely increased the fit of the model.(Full results from this analysis are reported in TableA4 in the Appendix.) Figure 3.8 shows thepredicted probabilities of being in the professional/managerial classes for Indians from the five largestreligious affiliations (including no religion). Thecharacteristics of those from the different religionsvary, so these probabilities reflect not only theindependent effect of religion but also the differentcharacteristics (for example, higher/lowereducational level, differences in origin class) thataccompany the different religious groupings. Thefigure shows the much lower probabilities ofprofessional/managerial outcomes for Sikhs andeven more so for Muslims, and the confidenceintervals that accompany the estimates show thatthere is no overlap in predicted probabilities
Figure 3.7: Religious breakdown of Indian ethnic group
n = 1,566
Not stated, 4%Christian, 7%
Hindu, 35%
Muslim, 11%
Sikh, 36%
Other, 2%None, 5%
Source: ONS LS, author’s analysis
8 21% of Hindus, 9% of Muslims, but only 6% of Sikhs hadbeen born in East Africa according to the 2001 Census (ONS,2004b). Given the respective sizes of these religious groupsand ignoring African Asians from other religions and theBritish-born children of the East African Asians, this meansthat roughly half of the East African Asians are Muslim, alittle under half are Hindu and under 10% are Sikh.
9 Although East African Asian success has typically beenexplained through parental characteristics and motivationto make use of education for upward mobility – both ofwhich are controlled for (even if imperfectly) here.
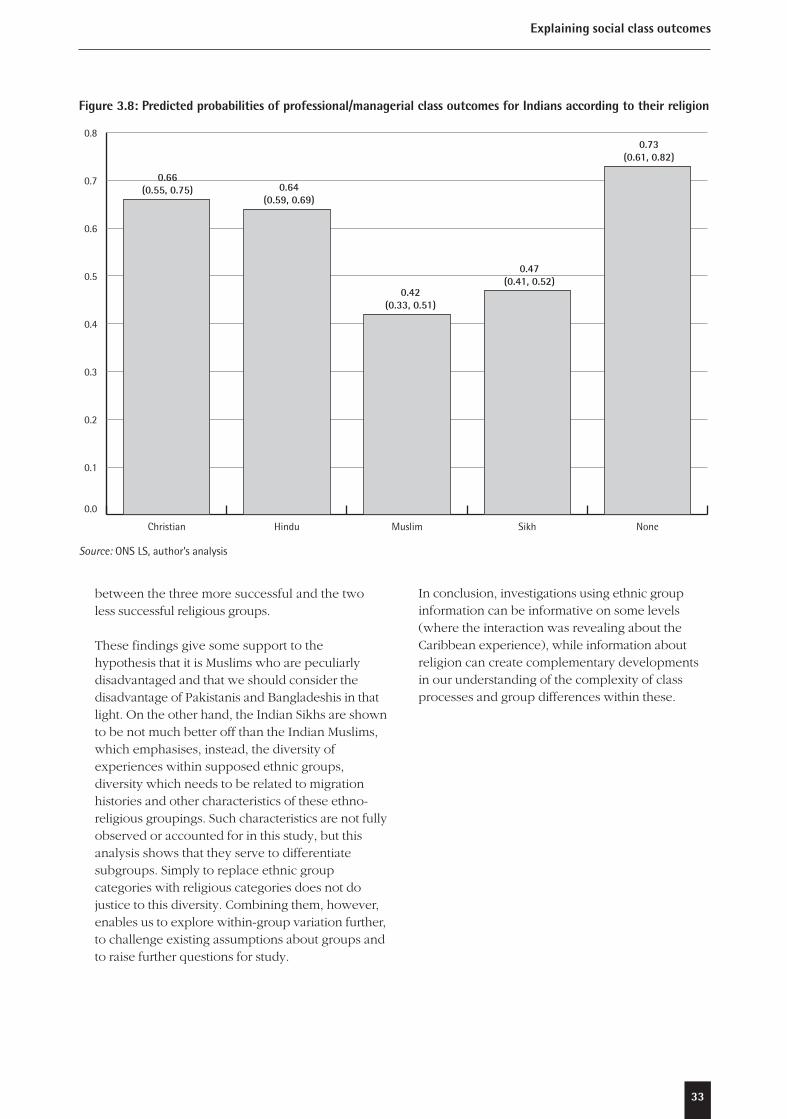
33
between the three more successful and the twoless successful religious groups.
These findings give some support to thehypothesis that it is Muslims who are peculiarlydisadvantaged and that we should consider thedisadvantage of Pakistanis and Bangladeshis in thatlight. On the other hand, the Indian Sikhs are shownto be not much better off than the Indian Muslims,which emphasises, instead, the diversity ofexperiences within supposed ethnic groups,diversity which needs to be related to migrationhistories and other characteristics of these ethno-religious groupings. Such characteristics are not fullyobserved or accounted for in this study, but thisanalysis shows that they serve to differentiatesubgroups. Simply to replace ethnic groupcategories with religious categories does not dojustice to this diversity. Combining them, however,enables us to explore within-group variation further,to challenge existing assumptions about groups andto raise further questions for study.
Figure 3.8: Predicted probabilities of professional/managerial class outcomes for Indians according to their religion
Source: ONS LS, author’s analysis
0.0
0.1
0.2
0.3
0.4
0.5
0.6
0.7
0.8
NoneSikhMuslimHinduChristian
0.73(0.61, 0.82)
0.47(0.41, 0.52)
0.42(0.33, 0.51)
0.64(0.59, 0.69)
0.66(0.55, 0.75)
In conclusion, investigations using ethnic groupinformation can be informative on some levels(where the interaction was revealing about theCaribbean experience), while information aboutreligion can create complementary developmentsin our understanding of the complexity of classprocesses and group differences within these.
Explaining social class outcomes
34
Migration and mobility
This Report began by asking about the relativeimportance of family origins and ethnic group forshaping children’s social class destinations. TheIntroduction pointed out that, in debates concerningequality of opportunity, the continuing relevance ofprivileged origins to ensuring better occupationaloutcomes for children has been seen as at variancewith such equality. On the other hand, it is regardedas important to respect parents’ right andcommitment to do the best for their children, andthis is likely to result in the perpetuation ofprivilege. Moreover, if we look at sub-groups in thepopulation, and particularly those which haveexperience of marginalisation, such as minorityethnic groups, their ability to draw on individual andgroup resources, to maintain any class oroccupational advantage they achieve, and totransmit such benefits to their children, is indicativeof greater openness of society in relation to ethnicdifference. Thus a society may reveal high levels ofstratification in class terms but, if such patterns aremimicked across different groups, that suggests thatracial inequality is less of an issue than classinequality. Conversely, the lack of ability to transmitclass privilege across generations within apotentially marginalised group indicates thesusceptibility of that group to discrimination andother specifically group-based processes.
The study therefore sought to discover firstwhether there was evidence that family originscontinued to be important for social classdestinations across the current generation as awhole and, second, whether the impact of theseorigins was replicated across minority groups.
In addition, given the substantial evidencediscussed relating to the impact of discrimination onmigrants’ occupational and residential experienceon arrival in Britain, apparent upward mobilitywithin minority groups between parents andchildren can potentially be viewed as compensationfor parental downward mobility on migration. Suchupward mobility is no less a success story for the
groups concerned, but can additionally suggest thatdownward mobility was experienced by theparents, and that society is becoming more open tothe group over time.
This, in turn, leads us to consider the processes bywhich such upward mobility is achieved.Mobilisation of alternative parental resources, suchas networks, parental education, and so on, is oneaspect; and the effective use of education, or ratherthe attainment of educational qualifications, isanother. Educational qualifications have been shownto be both a route to success (and upward mobility)for the working classes and also a means by whichprivileged classes maintain that privilege. Again,within minority groups, the use of education canreveal that particular ethnic group’s success; but canalso demonstrate the means by whichcompensation for previous (or on-going) patternsof discrimination are achieved, and can indicate theopenness of the education system to be utilised bythe group to advance its position. Moreover, therelative weight of educational qualifications acrossgroups in contributing to social class success can beevaluated. Unequal impact of qualifications can betaken to indicate that society is less open to somegroups and that ‘ethnicity’ outweighs moreobjective measures. On the other hand, while theapparently equalising effect of education cansuggest that ethnic inequality is not a major concernonce groups are competing in the labour market,the levels of education achieved may still beinfluenced by ethnic inequalities within theeducation system. Comparing ‘like with like’ interms of the relationship between social classoutcomes and education may not be thatmeaningful if some groups are not very ‘like’ othersin their levels of educational achievement.
It is in light of these general points about whatparticular relationships and findings mean – ormight mean – that we should consider the mainresults stemming from this Report.
4Conclusions
35
First (in Chapter 2), we saw that the patterns oftransition between parents’ social class andchildren’s were highly differentiated by ethnicgroup. In absolute terms some groups ended up ina better position than others – Indians did betterthan all other groups considered – and rates oftransition also varied widely, with patterns of higherclass retention, that is the ability of privilege tomaintain itself across generations, being stronger forsome groups (white non-migrants, Indians andwhite migrants) and weaker for others (Caribbeansand Pakistanis). This indicates that social classbackground does play a role in outcomes: classmatters. The extent to which ethnic group matters,that is, whether minority group transitions mimicthose of the majority, varies, however, with theparticular group. Ethnicity appears to be moresalient for Caribbeans and Pakistanis than for othergroups, indicating that racial inequality is to acertain extent particularised by group and cannotsimply be generalised across all those of non-UK-born parentage.
The impact of social class origins and the relativerole of ethnic group was further pursued inChapter 3. Here, other aspects of origins – parents’educational qualifications and economic status ofhousehold as well as parents’ social class – wereheld constant, and the analysis revealed that all hadindependent effects on the chances of ending up inthe highest aggregate social class (professional ormanagerial classes). These effects of origins onsocial class destinations remained, although reducedin size, when the children’s own educationalqualifications were taken into account. Thisindicates both that one of the ways that classadvantage is maintained is through more privilegedparents ensuring greater educational success fortheir children, and that, nevertheless, family originscontinue to have an impact on children’s success,over and above their educational achievement. Wecan only speculate about the precise processesinvolved, which are likely to include networks andthe acquisition of relevant cultural capital, as wellas, possibly, the differentials within apparentlycomparable qualifications (for example, degreesfrom old rather than ‘new’ universities). What isclear, however, is that in England and Wales, fortoday’s generation of 20- to 40-somethings, classorigins continue to matter. Does ethnic groupmatter too?
Reinforcing the picture from Chapter 2, whetherethnic group membership makes a differenceappears to depend on the ethnic group.
Caribbeans, Black Africans, Indians, Chinese andothers, and white migrants all obtained upwardmobility relative to white non-migrants, taking theirorigins into account. They had higher chances thantheir white non-migrant counterparts of ending upin the professional or managerial classes, whencomparing like with like. This indicates that theremay be some compensation going on for theeffects of parents’ downward mobility followingmigration, and that society may be relatively opento minority ethnic groups. Moreover, given that anumber of origin factors in addition to social classare taken account of, it suggests some absolutelevel of ‘success’ for these groups. However, thepicture for the Pakistanis is the reverse. They areless likely than their white counterparts to achievesuccess even when origins are taken account of,they are doing worse than a model of parity of classprocesses would suggest and thus, for this group,ethnicity far outweighs class in influencingoutcomes. This particular ethnic group effect is alsoincreased in magnitude when education is takenaccount of (and it also applies to the Bangladeshishere, too). Not only do class origins not work forthese groups, but neither do educationalqualifications (and that is setting aside the questionof equal treatment within the school system). Noteven higher levels of qualifications can bring themthe same occupational rewards as their whitecounterparts; whereas for other groups the route totheir greater levels of upward mobility is througheducation. Getting qualifications would, then, seeman effective means for achieving parity, forcompensating for past discrimination and forbuilding success for some groups; but for Pakistanisand Bangladeshis ethnic group effects outweighany such achievements. Particular ethnicities matter.
Chapter 3 also considered the full range of possiblesocial class destinations to examine whether ethnicgroup had an effect on other destinations inaddition to chances of being in the professional ormanagerial classes. It showed that Pakistanis andBangladeshis in particular, but also Caribbeans, hadincreased risks of unemployment compared withwhite non-migrants and comparing those withsimilar origins and educational levels. So even ifCaribbeans overall achieve some upward mobilityand do this through education, they are notprotected either by origins or by education fromincreased risks of unemployment. It would seemthen that this group may be able to achieve somelevel of parity within the class structure, but thatthey are kept in more marginal positions withinoccupations, making them more susceptible to
Conclusions
36
Migration and mobility
unemployment. When it comes to unemployment,ethnicity also matters for Caribbeans.
Moreover, the very strong relative risks ofunemployment for Bangladeshis and Pakistanisshow that these ethnic groups are not onlyinhibited in succeeding in relation to theirbackgrounds and education, but they also facemuch higher risks of being out of work. Again, thisstudy can only speculate about processes, whichmay include: effects of family composition,structure and size; effects of marriage – and post-marriage employment patterns for women; beinglocated in different parts of the aggregate classes(or education categories) used in the analysis; areaeffects not effectively controlled for by the areavariable; discrimination and the impact of racism;and factors associated with different migrationhistories, including more recent arrival (than somegroups) and thus less time to ‘catch up’. Butwhatever the routes to this greater disadvantage, itis clear that they combine to create a particularethnic group effect for these groups.
For the other ethnic groups, it would seem that,aside from any particular ethnic group effects in theachievement of particular levels of educationalqualifications themselves, they are not clearlydifferentiated from their white non-migrantcounterparts once education and origins are heldconstant. The same routes that are open to successfor the white non-migrants appear to be open tothem, as long as they are in a position to benefitfrom the education system. However, introducingreligion into the analysis reveals that these generalpatterns disguise levels of diversity within groups.Breaking down the Indian group according to thereligious affiliations of those who define themselvesas ‘Indian’ reveals very different chances of success.The Indian ‘success story’ is particularly driven bythe Hindus (and the Christians) who have highprobabilities of achieving professional or managerialclass outcomes, whereas the Sikhs and Muslims fareless well. The ability not only to gain educationalqualifications but also to use them to achievesuccess varies not only across but within groups.While this may lead us to be cautious in what weclaim for ‘ethnicity’ and what we attribute to it, itshould nevertheless not divert us from concern atthe very clear evidence of the inhibitions to socialclass success associated with particular ethnicgroups, notably Pakistanis and Bangladeshis.
37
Alba, R. and Nee, V. (1997) ‘Rethinking assimilationtheory for a new era of immigration’, InternationalMigration Review, vol 31, no 4, pp 826-74.
Aldridge, S. (2001) Social mobility: A discussionpaper, London: Cabinet Office, Performance andInnovation Unit, April.
Allison, P. (2002) Missing data, Thousand Oaks, CA:Sage Publications.
Archer, L. and Francis, B. (forthcoming) ‘Changingclasses? Exploring the role of social class within theidentities and achievement of British Chinesepupils’, Sociology.
Blackwell, L., Lynch, K., Smith, J. and Goldblatt, P.(2003) Longitudinal Study 1971-2001:Completeness of census linkage, London: HMSO.
Blair, T. (2001) ‘Speech on the Government’s agendafor the future’, 8 February, available atwww.pm.gov.uk/output/Page1579.asp
Borjas, G. (1992) ‘Ethnic capital and intergenerationalmobility’, Quarterly Journal of Economics, vol 107,no 1, pp 123-50.
Bottero, W. and Prandy, K. (2000) ‘Socialreproduction and mobility in Britain and Ireland inthe nineteenth and early twentieth centuries’,Sociology, vol 34, no 2, pp 265-81.
Bourdieu, P. (1997) ‘The forms of capital’ in A.H.Halsey, H. Lauder, P. Brown and A. Stuart Wells(eds) Education: Culture, economy, society,Oxford: Oxford University Press, pp 46-58.
Breen, R. (1998) ‘The persistence of class origininequalities among school leavers in the Republic ofIreland, 1984-1993’, British Journal of Sociology,vol 49, no 2, pp 275-98.
Breen, R. and Whelan, C. (1993) ‘From ascription toachievement? Origins, education and entry to thelabour force in the Republic of Ireland during thetwentieth century’, Acta Sociologica, vol 36, no 1,pp 3-17.
Castles, S. (2000) Ethnicity and globalization,London: Sage Publications.
Cheng, Y. and Heath, A. (1993) ‘Ethnic origins andclass destinations’, Oxford Review of Education, vol19, no 2, pp 141-65.
Daniel, W.W. (1968) Racial discrimination inEngland, Harmondsworth: Penguin.
DfES (Department for Education and Skills) (2001)Youth Cohort Study: The activities and experiencesof 21 year olds: England and Wales 2000, SFR 35/2001, 31 August.
Dorsett, R. (1998) Ethnic minorities in the innercity, Bristol: The Policy Press.
Erikson, R. and Goldthorpe, J.H. (1993) The constantflux: A study of class mobility in industrialsocieties, Oxford: Clarendon Press.
Galster, G.C., Metzger, K. and Waite, R. (1999)‘Neighbourhood opportunity structures andimmigrants’ socioeconomic advancement’, Journalof Housing Research, vol 10, no 1, pp 95-127.
Glass, D.V. (ed) (1954) Social mobility in Britain,London: Routledge and Kegan Paul.
Goldthorpe, J. (1997) ‘Problems of “meritocracy”’, inA.H. Halsey, H. Lauder, P. Brown and A. Stuart Wells(eds) Education: Culture, economy, society,Oxford: Oxford University Press, pp 663-82.
Goldthorpe, J.H. with Llewellyn, C. and Payne, C.(1987) Social mobility and class structure inmodern Britain (2nd edn), Oxford: ClarendonPress.
Gordon, M. (1964) Assimilation in American life:The role of race, religion and national origins,Oxford: Oxford University Press.
Goulbourne, H. (1998) Race relations in Britainsince 1945, Basingstoke: MacMillan.
Halsey, A.H., Heath, A.F. and Ridge, J.M. (1980)Origins and destinations: Family, class andeducation in modern Britain, Oxford: ClarendonPress.
References
38
Migration and mobility
Heath, A. and McMahon, D. (1997) ‘Education andoccupational attainments: The impact of ethnicorigins’, in V. Karn (ed) Ethnicity in the 1991Census: Volume four: Employment, education andhousing among the ethnic minority populations ofBritain, London: Office for National Statistics,pp 91-113.
Heath, A. and McMahon, D. (2005) ‘Social mobility ofethnic minorities’, in G.C. Loury, T. Modood andS.M. Teles (eds) Ethnicity, social mobility andpublic policy: Comparing the US and UK,Cambridge: Cambridge University Press, pp 393-413.
Heath, A. and Payne, C. (2000) ‘Social mobility’ inA.H. Halsey with J. Webb (eds) Twentieth centuryBritish social trends, Basingstoke: Macmillan,pp 254-78.
Heath, A. and Ridge, J. (1983) ‘Social mobility ofethnic minorities’, Journal of Biosocial ScienceSupplement, vol 8, pp 169-84.
Hout, M. (1984) ‘Occupational mobility of blackmen: 1962 to 1973’, American Sociological Review,vol 49, no 3, pp 308-22.
Iganski, P. and Payne, G. (1999) ‘Socio-economic re-structuring and employment’, British Journal ofSociology, vol 50, no 2, pp 195-215.
Jacobson, J. (1997) ‘Religion and ethnicity: dual andalternative sources of identity among young BritishPakistanis’, Ethnic and Racial Studies, vol 20, no 2,pp 238-56.
Jacobson, J. (1998) Islam in transition: Religion andidentity among British Pakistani youth, London:Routledge.
Mason, D. (2000) Race and ethnicity in modernBritain (2nd edn), Oxford: Oxford University Press.
Mason, D. (2003) Explaining ethnic differences:Changing patterns of disadvantage in Britain,Bristol: The Policy Press.
Marmot, M.G., Adelstein, A.M. and Bulusu, L. (1984)Immigrant mortality in England and Wales 1970-78: Causes of death by country of birth, London:HMSO.
Marshall, G., Swift, A. and Roberts, S. (1997) Againstthe odds? Social class and social justice inindustrial societies, Oxford: Clarendon Press.
Modood, T. (1997a) ‘Employment’, in T. Modood, R.Berthoud, J. Lakey, J. Nazroo, P. Smith, S. Virdee andS. Beishon (eds) Ethnic minorities in Britain:Diversity and disadvantage, London: Policy StudiesInstitute, pp 83-149.
Modood, T. (1997b) ‘Qualifications and Englishlanguage’, in T. Modood, R. Berthoud, J. Lakey, J.Nazroo, P. Smith, S. Virdee and S. Beishon (eds)Ethnic minorities in Britain: Diversity anddisadvantage, London: Policy Studies Institute,pp 60-82.
Modood, T. (1997c) ‘Culture and identity’ in T.Modood, R. Berthoud, J. Lakey, J. Nazroo, P. Smith,S. Virdee and S. Beishon (eds) Ethnic minorities inBritain: Diversity and disadvantage, London: PolicyStudies Institute, pp 290-338.
Modood, T. (2003) ‘Ethnic differentials in educationalperformance’, in D. Mason (ed) Explaining ethnicdifferences: Changing patterns of disadvantage inBritain, Bristol: The Policy Press, pp 53-68.
Modood, T. (2004) ‘Capitals, ethnic identity andeducational qualifications’, Cultural Trends, vol 13,no 2, pp 1-19.
Modood, T., Berthoud, R., Lakey, J., Nazroo, J.,Smith, P., Virdee, S. and Beishon, S. (eds) (1997)Ethnic minorities in Britain: Diversity anddisadvantage, London: Policy Studies Institute.
National Statistics (2004) Focus on ethnicity andidentity, London: Office for National Statistics/HMSO (www.statistics.gov.uk/downloads/theme_compendia/foe2004/Ethnicity.pdf).
Nazroo, J. (1997) ‘Health and health services’, in T.Modood, R. Berthoud, J. Lakey, J. Nazroo, P. Smith,S. Virdee and S. Beishon (eds), Ethnic minorities inBritain: Diversity and disadvantage, London: PolicyStudies Institute, pp 224-58.
ONS (Office for National Statistics) (2004a) Thenational statistics socio-economic classificationuser manual, London: HMSO/ONS.
ONS (2004b) Focus on religion, London: HMSO.Park, R.E. (1950) Race and culture, Glencoe, IL: FreePress.
Payne, G. (1992) ‘Competing views of contemporarysocial mobility and social divisions’, in R. Burrowsand C. Marsh (eds) Consumption and class,London: Macmillan.
Payne, G. and Roberts, J. (2002) ‘Opening andclosing the gates: recent developments in malesocial mobility in Britain’, Sociological ResearchOnline, vol 6, no 4, available atwww.socresonline.org.uk/6/4/payne.html
Phillips, D. (1997) ‘The housing position of ethnicminority group home owners’ in V. Karn (ed)Ethnicity in the 1991 Census: Volume four:Employment education and housing among theethnic minority populations of Britain, London:The Stationery Office, pp 170-88.
Platt, L. (2002) Parallel lives? Poverty among ethnicminority groups in Britain, London: Child PovertyAction Group.
39
Platt, L. (2005) ‘The intergenerational social mobilityof minority ethnic groups’, Sociology, vol 39, no 3,pp 445-61.
Prandy, K. (1998) ‘Class and continuity in socialreproduction’, Sociological Review, vol 46, no 2,pp 340-64.
Putnam, R.D. (2000) Bowling alone: The collapseand revival of American community, New York,NY: Simon & Schuster.
Robinson, V. (1990) ‘Roots to mobility: the socialmobility of Britain’s black population, 1971-87’,Ethnic and Racial Studies, vol 13, no 2, pp 274-86.
Savage, M. (2000) Class analysis and socialtransformation, Buckingham: Open UniversityPress.
Smith, D.J. (1977) Racial disadvantage in Britain:The PEP Report, Harmondsworth: Penguin.
Solomos, J. (1989) Race and racism incontemporary Britain, Basingstoke: Macmillan.
References

40
Migration and mobility
Appendix
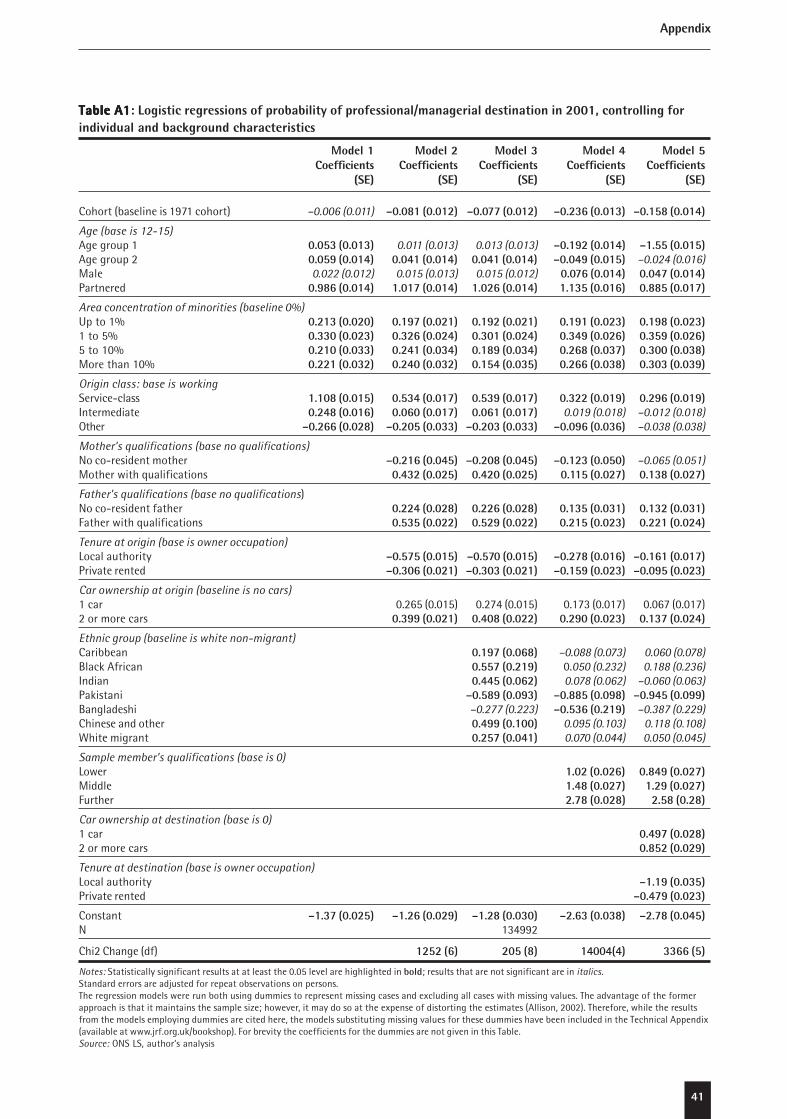
41
Table A1Table A1Table A1Table A1Table A1: Logistic regressions of probability of professional/managerial destination in 2001, controlling forindividual and background characteristics
Model 1 Model 2 Model 3 Model 4 Model 5Coefficients Coefficients Coefficients Coefficients Coefficients
(SE) (SE) (SE) (SE) (SE)
Cohort (baseline is 1971 cohort) –0.006 (0.011) –0.081 (0.012) –0.077 (0.012) –0.236 (0.013) –0.158 (0.014)
Age (base is 12-15)Age group 1 0.053 (0.013) 0.011 (0.013) 0.013 (0.013) –0.192 (0.014) –1.55 (0.015)Age group 2 0.059 (0.014) 0.041 (0.014) 0.041 (0.014) –0.049 (0.015) –0.024 (0.016)Male 0.022 (0.012) 0.015 (0.013) 0.015 (0.012) 0.076 (0.014) 0.047 (0.014)Partnered 0.986 (0.014) 1.017 (0.014) 1.026 (0.014) 1.135 (0.016) 0.885 (0.017)
Area concentration of minorities (baseline 0%)Up to 1% 0.213 (0.020) 0.197 (0.021) 0.192 (0.021) 0.191 (0.023) 0.198 (0.023)1 to 5% 0.330 (0.023) 0.326 (0.024) 0.301 (0.024) 0.349 (0.026) 0.359 (0.026)5 to 10% 0.210 (0.033) 0.241 (0.034) 0.189 (0.034) 0.268 (0.037) 0.300 (0.038)More than 10% 0.221 (0.032) 0.240 (0.032) 0.154 (0.035) 0.266 (0.038) 0.303 (0.039)
Origin class: base is workingService-class 1.108 (0.015) 0.534 (0.017) 0.539 (0.017) 0.322 (0.019) 0.296 (0.019)Intermediate 0.248 (0.016) 0.060 (0.017) 0.061 (0.017) 0.019 (0.018) –0.012 (0.018)Other –0.266 (0.028) –0.205 (0.033) –0.203 (0.033) –0.096 (0.036) –0.038 (0.038)
Mother’s qualifications (base no qualifications)No co-resident mother –0.216 (0.045) –0.208 (0.045) –0.123 (0.050) –0.065 (0.051)Mother with qualifications 0.432 (0.025) 0.420 (0.025) 0.115 (0.027) 0.138 (0.027)
Father’s qualifications (base no qualifications)No co-resident father 0.224 (0.028) 0.226 (0.028) 0.135 (0.031) 0.132 (0.031)Father with qualifications 0.535 (0.022) 0.529 (0.022) 0.215 (0.023) 0.221 (0.024)
Tenure at origin (base is owner occupation)Local authority –0.575 (0.015) –0.570 (0.015) –0.278 (0.016) –0.161 (0.017)Private rented –0.306 (0.021) –0.303 (0.021) –0.159 (0.023) –0.095 (0.023)
Car ownership at origin (baseline is no cars)1 car 0.265 (0.015) 0.274 (0.015) 0.173 (0.017) 0.067 (0.017)2 or more cars 0.399 (0.021) 0.408 (0.022) 0.290 (0.023) 0.137 (0.024)
Ethnic group (baseline is white non-migrant)Caribbean 0.197 (0.068) –0.088 (0.073) 0.060 (0.078)Black African 0.557 (0.219) 0.050 (0.232) 0.188 (0.236)Indian 0.445 (0.062) 0.078 (0.062) –0.060 (0.063)Pakistani –0.589 (0.093) –0.885 (0.098) –0.945 (0.099)Bangladeshi –0.277 (0.223) –0.536 (0.219) –0.387 (0.229)Chinese and other 0.499 (0.100) 0.095 (0.103) 0.118 (0.108)White migrant 0.257 (0.041) 0.070 (0.044) 0.050 (0.045)
Sample member’s qualifications (base is 0)Lower 1.02 (0.026) 0.849 (0.027)Middle 1.48 (0.027) 1.29 (0.027)Further 2.78 (0.028) 2.58 (0.28)
Car ownership at destination (base is 0)1 car 0.497 (0.028)2 or more cars 0.852 (0.029)
Tenure at destination (base is owner occupation)Local authority –1.19 (0.035)Private rented –0.479 (0.023)
Constant –1.37 (0.025) –1.26 (0.029) –1.28 (0.030) –2.63 (0.038) –2.78 (0.045)N 134992
Chi2 Change (df) 1252 (6) 205 (8) 14004(4) 3366 (5)
Notes: Statistically significant results at at least the 0.05 level are highlighted in bold; results that are not significant are in italics.Standard errors are adjusted for repeat observations on persons.The regression models were run both using dummies to represent missing cases and excluding all cases with missing values. The advantage of the formerapproach is that it maintains the sample size; however, it may do so at the expense of distorting the estimates (Allison, 2002). Therefore, while the resultsfrom the models employing dummies are cited here, the models substituting missing values for these dummies have been included in the Technical Appendix(available at www.jrf.org.uk/bookshop). For brevity the coefficients for the dummies are not given in this Table.Source: ONS LS, author’s analysis
Appendix

42
Migration and mobility
Table A2Table A2Table A2Table A2Table A2: Multinomial logistic regression of destinations at 2001 controlling for individual and backgroundvariables
Coefficient for Coefficient for Coefficient for Coefficient forintermediate manual/routine unemployment ‘other’
class (SE) (SE) class (SE) (SE)
Cohort (baseline is 1971 cohort) 0.063 (0.016) 0.374 (0.016) 0.495 (0.038) 0.319 (0.026)
Age (baseline is 12-15)Age group 1 0.097 (0.018) 0.279 (0.018) 0.308 (0.040) 0.194 (0.028)Age group 2 0.001 (0.019) 0.089 (0.019) 0.078 (0.044) 0.078 (0.030)Male –0.089 (0.017) 0.062 (0.017) 0.232 (0.038) –0.770 (0.028)Partnered –0.591 (0.020) –1.13 (0.019) –2.322 (0.042) –2.59 (0.036)
Area concentration of minorities (baseline is 0%)Up to 1% –0.170 (0.027) –0.203 (0.027) –0.128 (0.067) –0.236 (0.044)1 to 5% –0.255 (0.032) –0.436 (0.032) –0.304 (0.077) –0.391 (0.051)5 to 10% –0.164 (0.045) –0.426 (0.046) –0.044 (0.097) –0.204 (0.069)More than 10% –0.162 (0.046) –0.424 (0.046) –0.076 (0.096) –0.165 (0.068)
Class of origin (baseline is working class)Service-class –0.178 (0.023) –0.478 (0.024) –0.350 (0.057) –0.353 (0.040)Intermediate 0.129 (0.021) –0.149 (0.022) –0.141 (0.053) –0.100 (0.036)Other –0.064 (0.047) –0.066 (0.043) 0.400 (0.080) 0.476 (0.058)
Mother’s qualifications (base no qualifications)No co-resident mother 0.113 (0.062) 0.061 (0.060) 0.342 (0.107) 0.271 (0.083)Mother with qualifications –0.132 (0.033) –0.170 (0.038) –0.250 (0.086) 0.124 (0.057)
Father’s qualifications (base no qualifications)No co-resident father –0.016 (0.038) –0.228 (0.037) –0.141 (0.076) –0.220 (0.054)Father with qualifications –0.202 (0.029) –0.339 (0.033) 0.011 (0.074) –0.031 (0.052)
Tenure at origin (baseline is owner occupation)Local authority 0.098 (0.020) 0.377 (0.020) 0.492 (0.044) 0.482 (0.031)Private rented 0.111 (0.028) 0.205 (0.028) –0.210 (0.065) –0.186 (0.046)
Car ownership at origin (base is 0)1 car –0.011 (0.021) –0.245 (0.020) –0.481 (0.043) –0.362 (0.030)2 or more cars –0.013 (0.028) –0.492 (0.030) –0.663 (0.069) –0.554 (0.047)
Ethnic group (baseline is white non-migrant)Caribbean 0.185 (0.088) –0.163 (0.094) 0.556 (0.137) –0.089 (0.117)Black African 0.090 (0.276) –0.133 (0.299) 0.0457 (0.477) –0.818 (0.401)Indian 0.009 (0.078) –0.122 (0.082) 0.062 (0.161) –0.177 (0.128)Pakistani 0.777 (0.116) 0.598 (0.127) 1.674 (0.178) 1.545(0.145)Bangladeshi 0.361 (0.285) 0.412 (0.256) 1.491 (0.376) 0.712 (0.364)Chinese and other 0.024 (0.129) –0.367 (0.148) 0.295 (0.211) –0.045 (0.193)White migrant 0.029 (0.053) –0.195 (0.057) 0.052 (0.109) 0.063 (0.081)
Sample member’s qualifications (base is 0)Lower –0.425 (0.033) –1.121(0.029) –1.573 (0.055) –1.993 (0.040)Middle –0.761 (0.033) –1.695(0.030) –1.992 (0.059) –2.506 (0.043)Further –1.94 (0.035) –3.243(0.034) –3.000 (0.063) –3.588 (0.047)Constant 0.671 (0.047) 1.94 (0.045) 0.256 (0.092) 2.198(0.063)
N 134992Wald chi2 (df) 31499 (144)
Notes: Statistically significant results at at least the 0.05 level are highlighted in bold; results that are not significant are in italics.Standard errors are adjusted for repeat observations on persons.Interpretation: The four columns of results show, for each category of class, the probability, relative to the baseline category for each variable and controllingfor the other variables, of being in that class category rather than the professional/managerial class. For example, the coefficient for cohort in the firstcolumn shows that those in the 1981 cohort are slightly more likely than those in the 1971 cohort to fall into intermediate class destinations rather thanprofessional/managerial ones. This does not mean that in absolute terms more of the cohort ends up in the intermediate class than in the professional/managerial class. Rather it means simply that slightly more of them are likely to end up there than is the case for the older cohort, once relevantcharacteristics are controlled.Source: ONS LS, author’s analysis
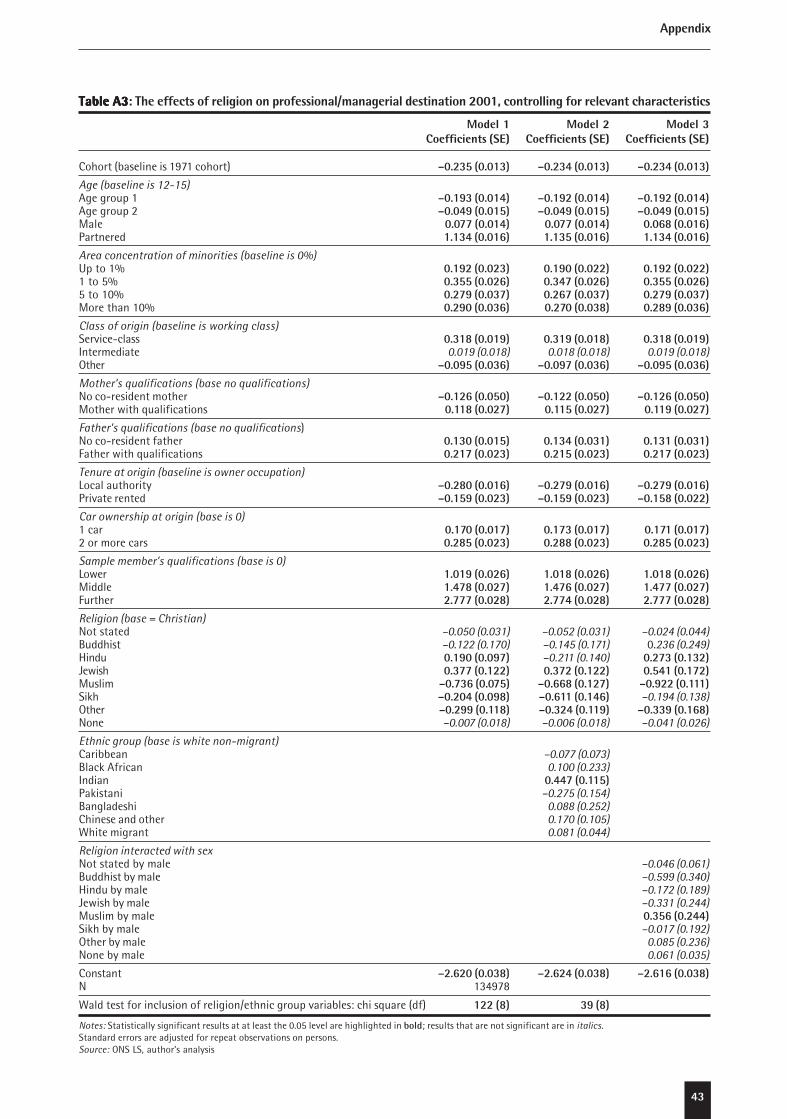
43
Table A3Table A3Table A3Table A3Table A3: The effects of religion on professional/managerial destination 2001, controlling for relevant characteristics
Model 1 Model 2 Model 3Coefficients (SE) Coefficients (SE) Coefficients (SE)
Cohort (baseline is 1971 cohort) –0.235 (0.013) –0.234 (0.013) –0.234 (0.013)
Age (baseline is 12-15)Age group 1 –0.193 (0.014) –0.192 (0.014) –0.192 (0.014)Age group 2 –0.049 (0.015) –0.049 (0.015) –0.049 (0.015)Male 0.077 (0.014) 0.077 (0.014) 0.068 (0.016)Partnered 1.134 (0.016) 1.135 (0.016) 1.134 (0.016)
Area concentration of minorities (baseline is 0%)Up to 1% 0.192 (0.023) 0.190 (0.022) 0.192 (0.022)1 to 5% 0.355 (0.026) 0.347 (0.026) 0.355 (0.026)5 to 10% 0.279 (0.037) 0.267 (0.037) 0.279 (0.037)More than 10% 0.290 (0.036) 0.270 (0.038) 0.289 (0.036)
Class of origin (baseline is working class)Service-class 0.318 (0.019) 0.319 (0.018) 0.318 (0.019)Intermediate 0.019 (0.018) 0.018 (0.018) 0.019 (0.018)Other –0.095 (0.036) –0.097 (0.036) –0.095 (0.036)
Mother’s qualifications (base no qualifications)No co-resident mother –0.126 (0.050) –0.122 (0.050) –0.126 (0.050)Mother with qualifications 0.118 (0.027) 0.115 (0.027) 0.119 (0.027)
Father’s qualifications (base no qualifications)No co-resident father 0.130 (0.015) 0.134 (0.031) 0.131 (0.031)Father with qualifications 0.217 (0.023) 0.215 (0.023) 0.217 (0.023)
Tenure at origin (baseline is owner occupation)Local authority –0.280 (0.016) –0.279 (0.016) –0.279 (0.016)Private rented –0.159 (0.023) –0.159 (0.023) –0.158 (0.022)
Car ownership at origin (base is 0)1 car 0.170 (0.017) 0.173 (0.017) 0.171 (0.017)2 or more cars 0.285 (0.023) 0.288 (0.023) 0.285 (0.023)
Sample member’s qualifications (base is 0)Lower 1.019 (0.026) 1.018 (0.026) 1.018 (0.026)Middle 1.478 (0.027) 1.476 (0.027) 1.477 (0.027)Further 2.777 (0.028) 2.774 (0.028) 2.777 (0.028)
Religion (base = Christian)Not stated –0.050 (0.031) –0.052 (0.031) –0.024 (0.044)Buddhist –0.122 (0.170) –0.145 (0.171) 0.236 (0.249)Hindu 0.190 (0.097) –0.211 (0.140) 0.273 (0.132)Jewish 0.377 (0.122) 0.372 (0.122) 0.541 (0.172)Muslim –0.736 (0.075) –0.668 (0.127) –0.922 (0.111)Sikh –0.204 (0.098) –0.611 (0.146) –0.194 (0.138)Other –0.299 (0.118) –0.324 (0.119) –0.339 (0.168)None –0.007 (0.018) –0.006 (0.018) –0.041 (0.026)
Ethnic group (base is white non-migrant)Caribbean –0.077 (0.073)Black African 0.100 (0.233)Indian 0.447 (0.115)Pakistani –0.275 (0.154)Bangladeshi 0.088 (0.252)Chinese and other 0.170 (0.105)White migrant 0.081 (0.044)
Religion interacted with sexNot stated by male –0.046 (0.061)Buddhist by male –0.599 (0.340)Hindu by male –0.172 (0.189)Jewish by male –0.331 (0.244)Muslim by male 0.356 (0.244)Sikh by male –0.017 (0.192)Other by male 0.085 (0.236)None by male 0.061 (0.035)
Constant –2.620 (0.038) –2.624 (0.038) –2.616 (0.038)N 134978
Wald test for inclusion of religion/ethnic group variables: chi square (df) 122 (8) 39 (8)
Notes: Statistically significant results at at least the 0.05 level are highlighted in bold; results that are not significant are in italics.Standard errors are adjusted for repeat observations on persons.Source: ONS LS, author’s analysis
Appendix
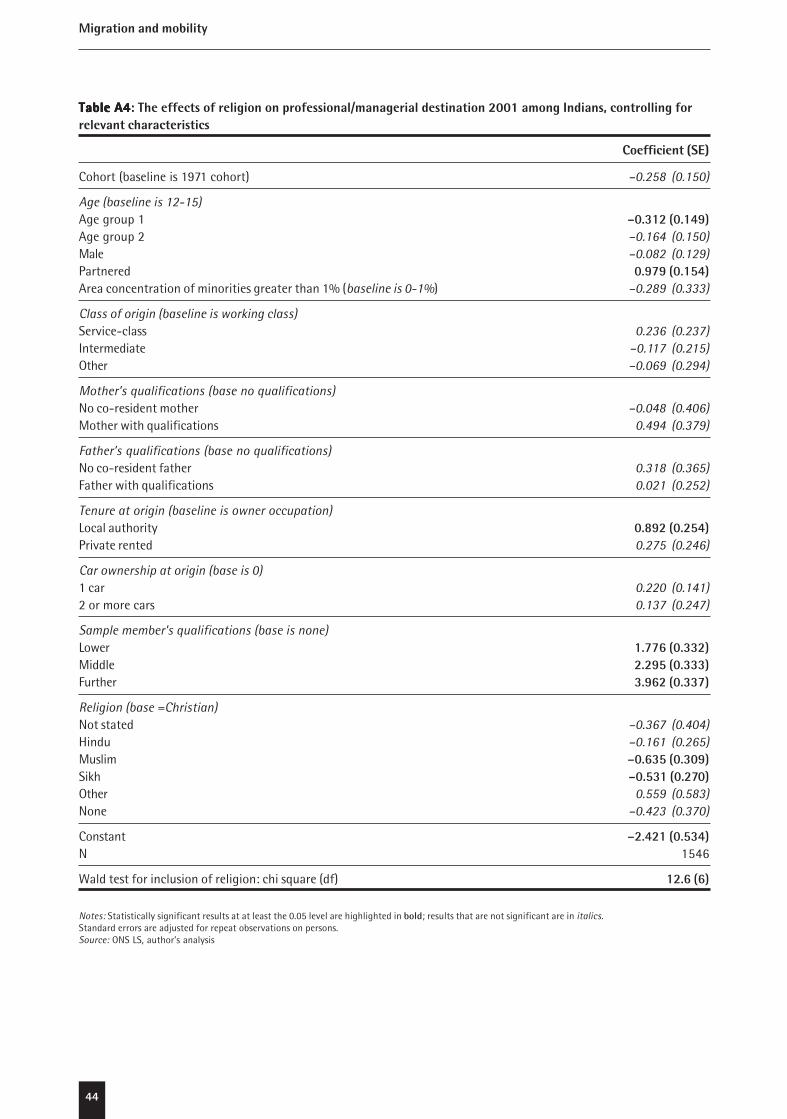
44
Migration and mobility
Table A4Table A4Table A4Table A4Table A4: The effects of religion on professional/managerial destination 2001 among Indians, controlling forrelevant characteristics
Coefficient (SE)
Cohort (baseline is 1971 cohort) –0.258 (0.150)
Age (baseline is 12-15)Age group 1 –0.312 (0.149)Age group 2 –0.164 (0.150)Male –0.082 (0.129)Partnered 0.979 (0.154)Area concentration of minorities greater than 1% (baseline is 0-1%) –0.289 (0.333)
Class of origin (baseline is working class)Service-class 0.236 (0.237)Intermediate –0.117 (0.215)Other –0.069 (0.294)
Mother’s qualifications (base no qualifications)No co-resident mother –0.048 (0.406)Mother with qualifications 0.494 (0.379)
Father’s qualifications (base no qualifications)No co-resident father 0.318 (0.365)Father with qualifications 0.021 (0.252)
Tenure at origin (baseline is owner occupation)Local authority 0.892 (0.254)Private rented 0.275 (0.246)
Car ownership at origin (base is 0)1 car 0.220 (0.141)2 or more cars 0.137 (0.247)
Sample member’s qualifications (base is none)Lower 1.776 (0.332)Middle 2.295 (0.333)Further 3.962 (0.337)
Religion (base =Christian)Not stated –0.367 (0.404)Hindu –0.161 (0.265)Muslim –0.635 (0.309)Sikh –0.531 (0.270)Other 0.559 (0.583)None –0.423 (0.370)
Constant –2.421 (0.534)N 1546
Wald test for inclusion of religion: chi square (df) 12.6 (6)
Notes: Statistically significant results at at least the 0.05 level are highlighted in bold; results that are not significant are in italics.Standard errors are adjusted for repeat observations on persons.Source: ONS LS, author’s analysis