Embed Size (px)
Citation preview
Migration of bisphenol A from polycarbonate plastic of different qualities Environmental project No. 1710, 2015
2 Migration of Bisphenol A from polycarbonate plastic of different qualities
[Series Title and year]
Title:
Migration of Bisphenol A from polycarbonate
plastic of different qualities
Editing:
Gitte Alsing Pedersen, DTU National Food Institute,
Søren Hvilsted, DTU Danish Polymer Centre, Department of
Chemical and Biochemical Engineering and
Jens Højslev Petersen, DTU National Food Institute
Technical University of Denmark
Published by:
The Danish Environmental Protection Agency
Strandgade 29
1401 Copenhagen K
Denmark
www.mst.dk/english
Year:
2015
ISBN no.
978-87-93352-24-7
Disclaimer:
When the occasion arises, the Danish Environmental Protection Agency will publish reports and papers concerning
research and development projects within the environmental sector, financed by study grants provided by the Danish
Environmental Protection Agency. It should be noted that such publications do not necessarily reflect the position or
opinion of the Danish Environmental Protection Agency.
However, publication does indicate that, in the opinion of the Danish Environmental Protection Agency, the content
represents an important contribution to the debate surrounding Danish environmental policy.
Sources must be acknowledged.
Migration of Bisphenol A from polycarbonate plastic of different qualities 3
Contents
Foreword .................................................................................................................. 5
Conclusion and Summary .......................................................................................... 6
Konklusion og sammenfatning .................................................................................. 9
1. Introduction ..................................................................................................... 12
Part 1: Literature review .......................................................................................... 13
2. Polycarbonate (PC) -stability and degradation .................................................. 14 2.1 Introduction .......................................................................................................................... 14 2.2 Photodegradation of PC and use of additives ...................................................................... 14 2.3 Mechanical performance of PC ............................................................................................ 15 2.4 Hydrothermal ageing of PC .................................................................................................. 15 2.5 Thermal stability of PC ......................................................................................................... 16 2.6 Blends of PC .......................................................................................................................... 16
3. Release of BPA from polycarbonate (PC) ........................................................... 17 3.1 Introduction .......................................................................................................................... 17 3.2 Different mechanisms behind the release of BPA from PC................................................. 17 3.3 Release of BPA into water..................................................................................................... 18 3.4 Effect of different parameters on BPA release ..................................................................... 18
Part 2: Experimental .............................................................................................. 21
4. Characterisation and testing of PC .................................................................... 22 4.1 Introduction ......................................................................................................................... 22 4.2 Materials............................................................................................................................... 23 4.3 Characterisation of materials .............................................................................................. 24
4.3.1 Fourier Transform infrared spectroscopy (FTIR) ............................................... 24 4.3.2 Molecular weight by size exclusion chromatography (SEC) ............................... 25 4.3.3 Glass transition temperature by differential scanning calorimetry (DSC) ......... 25 4.3.4 Thermal resistance by thermogravimetric analysis (TGA) ................................. 25 4.3.5 Liquid chromatography with mass spectrometric detection (LC-MS/MS) ........ 25
4.4 Extraction of PC and migration testing............................................................................... 26 4.4.1 Residual level of bisphenol A in samples ............................................................. 26 4.4.2 Release of BPA from samples to migration solutions .......................................... 26 4.4.3 Quality assurance .................................................................................................. 26
4.5 Hydrothermal effect on polycarbonate ............................................................................... 28
5. Results and discussion ..................................................................................... 29 5.1 Results of the characterisation ............................................................................................ 29
5.1.1 Identity of polymer materials by FTIR spectrometry .......................................... 29 5.1.2 Molecular weight by SEC analysis ........................................................................ 29 5.1.3 Glass transition temperature by DSC analysis .................................................... 29 5.1.4 Thermal resistance by TGA analysis .................................................................... 30 5.1.5 Residual level of bisphenol A in PC ...................................................................... 32
5.2 Release of bisphenol A from samples ................................................................................. 33 5.3 Influence of hydrothermal effect on release of BPA ........................................................... 34
4 Migration of Bisphenol A from polycarbonate plastic of different qualities
6. Conclusion on the experimental part ................................................................ 41
References .............................................................................................................. 43
7. Annex ............................................................................................................... 47
Migration of Bisphenol A from polycarbonate plastic of different qualities 5
Foreword
Bisphenol A (BPA) is included in the Danish Environmental Protection Agency’s List of Undesirable
Substances (LOUS) as it is i) included in the EU list of potential endocrine disrupting substances in
category 1, ii) classified for reproductive toxicity in category 2 and iii) the substance has political
focus.
Bisphenol A is used as a monomer in production of polycarbonate plastic (PC) for different
applications. Many studies have examined release of BPA from PC and especially the focus has been
on BPA release from food contact materials and consumer products to estimate the level of human
BPA exposure from these sources.
The present survey was decided by the Danish EPA with the aim to study the potential correlation
between quality and chemical composition of PC on release of BPA from the material.
The study was performed during September 2013 - December 2014 at the Technical University of
Denmark (DTU) by Gitte Alsing Pedersen, DTU National Food Institute and Søren Hvilsted DTU
Danish Polymer Centre, Department of Chemical and Biochemical Engineering. The final editing of
the report was made by Jens Højslev Petersen, DTU National Food Institute.
A focus group was formed representing producers of PC and PC consumer products as well as
Danish trade associations, the Danish Consumer Council and retailers of PC food contact materials
and consumer products. The aim of the focus group was to discuss and give comments to the project
plan and to the final project report.
6 Migration of Bisphenol A from polycarbonate plastic of different qualities
Conclusion and Summary
Polycarbonate (PC) is a thermoplastic used for several applications including consumer products
covering food contact materials, toys, and medical devices. The plastic is characterised by its good
physical properties such as transparency, high mechanical strength and good thermal stability.
Bisphenol A (BPA) is a monomer used in the production of PC and, as with all polymers, a certain
migration of the non-polymerised residual monomer can occur from the material over the lifetime
of the article or product. This has been shown by several studies. Other studies have examined the
stability and degradation of PC when exposed to different environmental conditions and chemical
agents showing that PC is sensitive to UV light, humidity, temperature variations, some additives
(e.g. TiO2) and non-intentionally added substances (impurities) which can all induce degradation of
the polymer.
This study covers a review of literature and available industry information regarding release of BPA
from PC and the parameters affecting this BPA release. Moreover in part two of the study, different
samples of PC was characterised and analysed in order to examine the potential correlation between
material specific parameters and the release of BPA.
A summary of the literature review, part 1 of the project, is given below:
The release of BPA from PC is explained by two different mechanisms: 1) Diffusion controlled
release of residual BPA and 2) hydrolysis/degradation of the polymer at the surface of the material
followed by an increase in BPA migration and in polymer surface area.
In general the diffusion rate of BPA in PC is very low. However, it is mentioned that small
differences seen in the glass transition temperature, Tg, in different PC qualities could be a way to
predict if the polymers have different BPA diffusion rates as Tg and diffusion rate has been shown to
inversely proportional in a given polymer.
Release of BPA from PC in contact with food simulants is positively correlated with temperature (T)
and time (t) of contact. At lower temp (e.g. 0 -70 °C) the BPA release is slow and controlled by the
diffusivity in the bulk of the dense polymer.
PC is sensitive to hydrothermal effects. Release of BPA originating from hydrolytic degradation of
the polymer is found to be positively correlated to an increase in pH (alkaline conditions).
Moreover, impurities and amines in the polymer will accelerate hydrolysis in combination with the
T and t. The long term release of BPA from PC is primarily due to degradation of the polymer
rather than diffusion. This seems to be the case especially at high temperature (~ 100 °C).
PC may be sensitive to environmental stress cracking, ESC, when exposed to alkaline chemical
agents and mechanical stress. The effect of general ageing of the material is not concluded in
literature.
PC is sensitive to UV light which makes the polymer degrade. The presence of chromophores as e.g.
dyes and pigments is found to increase the process of photodegradation. Also metallic
contaminants and other impurities (non-intentionally added substances, NIAS) of the commercial
Migration of Bisphenol A from polycarbonate plastic of different qualities 7
starting substances can accelerate the photodegradation process. To improve the UV properties of
the material, UV stabilisers are added.
It is concluded, from industry information, that only highly pure reagent grade chemicals, including
additives, should be used for all PC grades to reduce photodegradation and hydrothermal
degradation of the polymer.
From the experimental part of the project, part 2, the following was concluded:
The levels of residual BPA in the 12 polycarbonate samples included in the survey (8 samples of
food contact materials, 3 samples received from the plastics industry intended for either food
contact, medical applications or toys and one DVD sample) were 5-80 µg/g which is in accordance
with the residual BPA levels reported by others.
The migration from all of the samples into the food simulant water (exposed 1 hour at 100 °C) were
all within the same range and below 3.1 µg/dm2 corresponding to a level < 30 µg/kg simulant. All
samples were well below the specific migration limit (SML) of 600 µg/kg for food contact materials
(FCM). Again the results were comparable with the migration levels reported for PC used for FCM
in the literature.
No correlation was found between the level of residual BPA and the level of BPA migration into
water (1 hour at 100°C).
Five of the samples that have been subjected to the extreme exposure conditions (up to 14 days at
90 °C at alkaline conditions)) showed:
A much increased release of BPA compared to the migration results. The level of released
BPA differs significantly between the samples.
For three of the samples the accumulated amount of released BPA was much above the
residual level of BPA monomer indicating that a significant degradation of the polymer at
the material surface takes place due to hydrothermal effects.
Two samples (PC glass and DVD) had a very low BPA release indicating more
hydrothermally stable materials compared to the other samples tested. Unfortunately,
these differences between samples could not be explained by the techniques applied in this
study.
A remarkable and significant almost 20% decrease in both types of molecular weight Mw
and Mn) was seen for all the polymers tested. This was indicating a degradation of the PC
polymer in all samples. However no difference was seen in the polydispersities (Mw/Mn)
indicating that the degradation products are formed at the surface of the product and
removed from there into the test solution.
No significant change in Tg for samples after extreme exposure conditions into water at
high temperature and alkaline conditions.
Recording of infrared spectra (FTIR), measurements of Tg , Mw, and thermal degradation of the
samples showed no significant differences between the samples. Moreover the measured
parameters did not correlate well to the different levels of released BPA from the samples after
extreme exposure conditions. In conclusion the applied techniques were not adequate to predict the
level of BPA release from the given samples.
It is assumed that material composition parameters and process conditions such as listed below can
have a main influence on depolymerisation of PC.
8 Migration of Bisphenol A from polycarbonate plastic of different qualities
At meetings with industrial contacts during this project it was confirmed that to avoid
depolymerisation certain material composition parameters and process conditions should be taken
in consideration:
Use dry polymer material prior to injection molding of PC
Use adequate process conditions such as choice of correct temperature in the injection
molding process
Use of pure starting substances and additives in the production of PC
Furthermore special attention should be paid to amines, TiO2 and glass fibers used in PC as the
addition of such substances may increase the level of residual BPA and/or release of BPA due to
partial decomposition of the polymer. Sample PC3, analysed after hydrothermal exposure in this
study and containing the additive TiO2, showed the highest release of BPA.
No specific information was found about additives known to improve the hydrolytic stability of PC.
Migration of Bisphenol A from polycarbonate plastic of different qualities 9
Konklusion og sammenfatning
Polycarbonat (PC) er en termoplast der anvendes til flere applikationer, herunder
forbrugerprodukter, fødevarekontaktmaterialer, legetøj og medicinsk udstyr. Plasten er
kendetegnet ved sine gode fysiske egenskaber, såsom gennemsigtighed, høj mekanisk styrke og god
termisk stabilitet. Bisphenol A (BPA) er en monomer, som bruges i produktionen af PC, og som med
alle polymerer, kan en vis migration af den ikke-polymeriserede restmonomer forekomme fra
materialet i løbet af produktets levetid. Dette er blevet vist ved adskillige undersøgelser. Andre
undersøgelser omhandler stabiliteten og nedbrydning af PC, når den udsættes for forskellige
miljøforhold og kemiske stoffer. Dette viser, at PC'en er følsom over for UV-lys, fugtighed,
temperatursvingninger, nogle tilsætningsstoffer (f.eks TiO2) samt ikke bevidst tilsatte stoffer
(urenheder), som kan alle inducere nedbrydning af polymeren.
Denne undersøgelse omfatter en gennemgang af litteratur og tilgængelige oplysninger fra
industrien om frigivelse af BPA fra PC og de parametre, der påvirker denne BPA udgivelse. Desuden
blev forskellige prøver af PC karakteriseret og analyseret for at undersøge den potentielle
sammenhæng mellem materiale-specifikke parametre og afgivelsen af BPA.
Et resumé af litteraturgennemgangen, Del 1 af projektet, er angivet nedenfor:
Frigivelsen af BPA fra PC forklares ved to forskellige mekanismer: 1) Diffusionskontrolleret
frigivelse af restindhold af BPA i PC og 2) hydrolyse / nedbrydning af polymeren i overfladelaget
som giver anledning til et forøget overfladeareal, efterfulgt af en stigning i BPA afgivelsen.
Generelt er diffusionshastigheden af BPA i PC meget lav sammenlignet med i de fleste andre
almindelige plasttyper. Imidlertid er det nævnt, at de små forskelle i glasovergangstemperatur, Tg,
der kan ses i forskellige PC kvaliteter, kan være en måde at forudsige, om polymererne har
forskellige diffusionshastigheder for BPA. Tg og diffusionshastigheden har vist sig at være omvendt
proportionale i en given polymer.
Frigivelse af BPA fra PC i kontakt med fødevaresimulatorer er positivt korreleret med temperaturen
(T) og - kontakttiden (t). Ved lavere temperatur (op til 70 °C) er BPA frigivelsen langsom og
kontrolleret af diffusiviteten i den tætte polymermasse.
PC er følsom over for hydrotermiske påvirkninger. Frigivelsen af BPA, som stammer fra hydrolytisk
nedbrydning af polymeren i overfladen, findes at være positivt korreleret med en stigning i pH
(basiske betingelser). Desuden vil tilstedeværelsen af urenheder og aminer i polymeren fremskynde
hydrolysen i kombination med høj T og lang t. Set over en længere tidsperiode dominerer afgivelse
af BPA, som stammer fra PC nedbrydningen, i forhold til den diffusionsbetingede migration af
restmonomer. Dette synes især at være tilfældet ved høj temperatur (~ 100 °C).
PC kan være følsomme over for miljøbetinget spændingskorrosion, ESC, når de udsættes for basiske
stoffer og mekanisk stress. Litteraturen giver ikke et klart billede af aldringens betydning for PC.
PC er følsom overfor UV-lys, hvilket gør, at polymeren nedbrydes. Man har fundet, at
tilstedeværelsen af chromoforer såsom f.eks. farvestoffer og pigmenter øger fotonedbrydningen.
Også metalliske stoffer og andre urenheder (ikke bevidst tilsatte stoffer, NIAS) af kommercielle
10 Migration of Bisphenol A from polycarbonate plastic of different qualities
udgangsstoffer kan accelerere fotonedbrydningen. For at forbedre materialets modstandsdygtighed
kan UV-stabilisatorer tilsættes.
Ud fra informationer fra industrien kan det konkluderes, at for at reducere fotonedbrydning og
hydrotermisk nedbrydning af polymeren mest muligt, bør der anvendes meget rene udgangsstoffer,
herunder tilsætningsstoffer, ved fremstilling af PC til alle formål.
Fra den eksperimentelle del af projektet, Del 2, kunne følgende konkluderes:
Restmonomer-indholdet af BPA i de 12 polycarbonat prøver, der indgik i undersøgelsen (8
forskellige fødevarekontaktmaterialer, en enkelt DVD-prøve og 3 prøver fra plastindustrien bestemt
til kontakt til fødevarer, medicinske anvendelser eller legetøj) lå på 5-80 µg/g, hvilket er i
overensstemmelse med BPA niveauer rapporteret af andre.
Migrationen til fødevaresimulatoren vand fra samtlige prøver (efter eksponering 1 time ved 100 °C)
lå på et ensartet lavt niveau under 3,1 µg /dm2, svarende til under 30 µg/kg simulator. Migrationen
lå således langt under den specifikke migrationsgrænse på 600 µg/kg for kontakt med fødevarer.
Igen var resultaterne sammenlignelige med litteraturdata om migration fra PC, der anvendes til
fødevarekontaktmaterialer.
Der blev ikke fundet nogen korrelation mellem niveauet af BPA restmonomer og niveauet af BPA
migration til vand (1 time ved 100 °C).
Fem af prøverne blev udsat for ekstreme eksponeringsbetingelser (op til 14 dage ved 90 °C i basisk
vand). Resultaterne viste:
• En stærkt forøget afgivelse af BPA i forhold til hvad man så i migrationstesten. Niveauet af
frigjort BPA varierede betydeligt mellem prøverne.
• For tre af prøverne var den akkumulerede mængde frigjort BPA meget højere end hvad der kan
forklares med restmonomerindholdet. Dette indikerer, at der fandt en betydelig nedbrydning
af polymeren sted på materialeoverfladen på grund af hydrotermisk nedbrydning.
• At to prøver (PC glas og DVD’en) havde en meget lav BPA frigivelse, hvilket indikerer, at disse
materialer er mere hydrotermisk stabile materialer end de andre testede prøver. Disse
forskelle mellem prøverne kunne desværre ikke forklares ved anvendelse af de teknikker, der
blev brugt i denne undersøgelse.
• At der skete et bemærkelsesværdig og signifikant, næsten 20%, fald i begge typer af
molekylvægte (Mw og Mn) i alle de testede polymerer. Dette indikerer en nedbrydning af PC
polymer i alle prøver. Da der ingen forskel blev set i polydispersiteten (Mw/Mn), blev det
konkluderet, at de nedbrydningsprodukter der dannes på materialets overflade hurtigt opløses
i vandet.
• At der ikke skete nogen signifikant ændring i glasovergangstemperaturen, Tg på trods af disse
ændringer.
Optagelserne af infrarøde spektre (FTIR), målinger af glasovergangstemperaturen (Tg ), molvægte
(Mw/Mn) og den termiske nedbrydning af prøverne, viste ingen signifikante forskelle mellem
prøverne. Resultaterne af de målte parametre korrelerer dårligt med de forskellige niveauer af
frigivet BPA fra prøverne efter den ekstreme eksponering. Sammenfattende kan det konkluderes, at
de anvendte teknikker ikke var tilstrækkelige til at forudsige BPA frigivelsen fra de givne prøver.
Det antages, at følgende nedenfor anførte parametre for materialesammensætning og
procesbetingelser har en afgørende indflydelse på nedbrydningen af PC. På møder med industrielle
kontakter i løbet af projektet, blev det bekræftet, at man for at undgå depolymerisering, bør være
opmærksom på en række procestekniske forhold:
Migration of Bisphenol A from polycarbonate plastic of different qualities 11
• Brug tørre polymer materialer under produktionen (fx sprøjtestøbning af PC)
• Brug passende procesbetingelser, såsom valg af rette temperatur, i sprøjtestøbning proces
• Brug rene udgangsstoffer og additiver ved produktionen af PC
Desuden bør man være særligt opmærksom på brugen af additiver som aminer, TiO2 og glasfibre i
PC da tilstedeværelsen af disse stoffer kan øge frigivelse af BPA på grund af delvis nedbrydning af
polymeren. Netop prøve PC3, som indeholdt tilsætningsstoffet TiO2, havde en høj afgivelse af BPA
efter den ekstreme eksponering.
Der er ikke i projektet fundet specifikke oplysninger om additiver, der ved tilsætning til PC, kunne
forbedre den hydrolytiske stabilitet af polymeren.
12 Migration of Bisphenol A from polycarbonate plastic of different qualities
1. Introduction
Bisphenol A (BPA) is a high production volume chemical used as monomer in the production of
polycarbonate (PC) plastic as well as in PC blends, and in epoxy resins. PC is a thermoplastic used
for many different applications due to its good physical and chemical properties such as
transparency, high mechanical strength low moisture absorption and good thermal stability. Main
areas are within electronic applications and construction industry. In relation to consumer products
the material is used for food contact materials such as drinking bottles, glasses, water coolers, and
food containers and for toys and other consumer products, however only as a minor application.
Polymers of PC show migration of BPA due to residual levels of unreacted BPA monomers or
degradation of PC from the influence of environmental factors and aging of the polymer. This may
lead to human exposure of BPA from the use of food contact materials of PC in tableware and food
containers or from the use of others consumer products as e.g. toys. BPA is an endocrine active
substance and much focus is on its potential health risks. A tolerable daily intake (TDI) for BPA of
50µg/kg bw/day was set by EFSA in 2006 (EFSA, 2006). The legal specific migration limit (SML)
for food contact materials is 0.6 mg/kg food based on a TDI from 2003 which were 5 times lower
than the above TDI. Recently, a new preliminary 10 time lower TDI of 5 µg/kg bw/day was
recommended by EFSA (EFSA, 2014). Moreover, EU legislation, banning the use of BPA in PC baby
bottles came into force since 2011 (EU, 2011). For toys for children under 3 years and for toys
intended to be put in the mouth an EU migration limit of 0.1 mg/l in simulant is adopted (EU,
2014). Recently an exposure assessment on BPA from different sources including food and non-
food products was given by EFSA (EFSA, 2013). Food is estimated to be the main source of BPA
exposure in both children and adults (EFSA, 2013).
During the last decade several studies have been performed to examine and determine the
migration of BPA from PC in particular with materials and articles intended for contact with food.
From these studies several parameters seem to affect the migration of BPA from PC. Moreover
studies on stability versus sensitivity of the PC plastic in relation to different environmental impact
factors and composition of the plastic have been reported. It is the purpose of the given project to
review significant parts of the literature with focus on factors determining the migration and release
of BPA from PC and including different parameters affecting the stability and degradation of the
polymer. Information from industry is included in the review where possible. This review is given in
part 1 of the report. Moreover it is the purpose of the project to characterise and analyse different
samples of food contact materials and consumer products of PC with the aim to study and evaluate
the potential correlation between material quality of the PC and release of BPA. The analyses
program has been devised to provide physical and chemical characterisation of the samples. Release
of BPA were tested from the materials at different exposure conditions and including critical
factors, suggested by the review that may affect the BPA release. Results from characterisation
analysis and chemical testing of BPA release are presented and discussed in part 2 of the report.
Migration of Bisphenol A from polycarbonate plastic of different qualities 13
Part 1: Literature review
BPA has been subject to much research on migration and risk assessment due to suspected low dose
effect on endocrine disrupting properties and developmental neurotoxicology. Among other
applications BPA is used in the production of PC and many studies have examined release of BPA
from PC. Especially the focus has been on BPA release from food contact materials and consumer
products to estimate the level of human BPA exposure from these sources.
Special interest has been into the different parameters that may affect the BPA release. Residual
monomers of BPA in the polymer can give rise to diffusion controlled migration of BPA. This is
however, estimated to be low due to a low diffusion rate in PC. Several studies have reported that
the level of released BPA from food contact materials of PC can vary significantly between different
samples. This indicates that other factors, besides the level of residual BPA monomers, can
influence the release of BPA from PC. Different composition of the polymers may affect the stability
of the polymer and degradation of PC when exposed to different environmental conditions is
reported.
It is the aim of this literature review to examine the reported information on correlation between
polymer specific parameters and the release of BPA. The review covers scientific papers and reports
on PC. As the intention was also to include specific information on polymer composition industry
information was included in the review where possible.
14 Migration of Bisphenol A from polycarbonate plastic of different qualities
2. Polycarbonate (PC) -stability and degradation
2.1 Introduction
PC is a thermoplastic with good physical and mechanical properties including high durability and
high transparency (Huang et al., 2011; Diepens and Gijsman, 2009). However, PC is sensitive to UV
light, humidity and temperature variations which make the polymer degrade (Sharon et al., 2006;
Collin et al., 2012; Plast og Gummi Ståbi, 1992). In the given chapter the effect on polymer stability
and degradation of different substances in the polymer and different environmental conditions is
discussed.
2.2 Photodegradation of PC and use of additives
Various additives including a range of the following flame retardants: Potassium
perfluorobutylsulfonate, potassium diphenylsulfonesulfonate, sodium trichlorobenzene-sulfonate,
tetraphenyl resorcinol diphosphonate and tetraphenyl bisphenyl-A diphosphonate can be found in
PC and PC blends to improve the performance of the material (Levchik, 2006; Huang, 2011).
Phenolic substances, acting as chain terminators, as e.g. phenol (< 2%), tertiary butylphenol (<3%)
and cumylphenol are part of the polymer chain and aiming to regulate the molecular weight
(Piringer and Baner, 2008; Bayer 2013b).
To increase the lifetime of the polymer different kinds of stabilisers are added (Diepens and
Gijsman, 2010). Many factors can affect the photodegradation process and improve stabilization of
the polymer against UV photodegradation, e.g. UV absorbers which strongly absorb the UV light of
relevant wavelenghts can be used. There are different groups of UV absorbers where the most
important substances are mentioned to be hydroxybenzophenones, hydroxyphenyl benzotriazoles,
cyanoacrylates and hydroxyphenyl triazines (Diepens and Gijsman, 2010). In a study performed by
Diepens and Gijsman (2010) different types of stabilisers were added to bisphenol A to examine
their effect on the photodegradation rate. According to industry information, stabilisers are added
to a polymer in very small amounts of <1% (Bayer, 2013b). In general the degradation rate was
decreased by addition of small amounts of these substances in the above study (Diepens and
Gijsman, 2010). The best results were found by adding hydroxybenzophenones or hydroxyphenyl
triazines (Diepens and Gejsman, 2010). The given UV absorbers are used for technical/industrial
applications but are not allowed in polycarbonate grades for food contact or medical applications.
UV absorbers do mainly protect the bulk materials from UV degradation but are not very effective
in preventing surface degradation (Diepens and Gijsman, 2009). In order to protect against surface
degradation, application of protective coatings (e.g. by co-extrusion of a thin film containing of high
level of UV absorbers to the material or application of a varnish containing UV absorber) can be
done (Diepens and Gijsman, 2009). This is mainly done for long-life outdoor use applications in
constriction and automotive lighting. Another way to stabilize the material is by incorporation of
block polymers, as e.g polyarylates, into the polymer (Diepens and Gijsman, 2009). Recently
polyacrylate block copolymers prepared with isopthaloyl chloride, terephthaloyl chloride and
resorcinol has been introduced. The study shows that addition of resorcinol type block polymer gave
a better protection than blending the polymer with UV absorbers (Diepens and Gijsman, 2009).
Migration of Bisphenol A from polycarbonate plastic of different qualities 15
However, the addition of additives can also adversely affect the polymer stability (Sharon et al.,
2006; Zhou et al., 2007). The presence of chromophores as e.g. residual catalysts used for the
polymeriation or dyes and pigments can affect the thermal and photochemical stability of the
polymer and increases the process of photodegradation (Saron et al. 2006; Saron and Felisberti,
2009). Also metallic contaminants and other impurities (non-intentionally added substances,
NIAS) of the commercial starting substances can accelerate the photodegradation process (Sharon
et al., 2006. In conclusion, to avoid such degradation, only highly pure reagent grade chemicals as
e.g. dyes and pigments should be used in production of all PC grades (Bayer, 2013b). This should be
demonstrated by the safety datasheet or, in the case of FCM, the declaration of compliance from the
raw material suppliers.
Incorporation of the colorant Cu-phthalocyanine in PC was found to accelerate the
photodegradation of the polymer (Saron et al., 2006). This is explained by the possible mechanism
of an increased formation of free radicals being the starting point for a sequential photo-oxidation
reaction that leads to degradation of the polymer (Sharon et al., 2006). Additives, including TiO2
and glass fibres and potential other additives may increase the level of BPA presumably by partial
decomposition of the polymer chain (Bayer, 2013b). Specific quality parameters and purity of the
raw materials should be carefully checked before they are used in the PC production. In case, when
using PC blends and stabilisers in PC they must be neutral and hydrolytically stable (Bayer, 2013b).
2.3 Mechanical performance of PC
PC is highly notch sensitive and the surface of the polymer can easily be scratched (Zhou et al.,
2007). This susceptibility to crazing or cracking increases when exposed to different solvents (Jiang
anf Tjong, 1999). When the material is exposed at the same time to mechanical stress and different
agents and chemicals this may lead to the phenomenon called environmental stress cracking (ESC)
of the polymer (Kjellander et al., 2008) with the formation of voids and crazes starting at the
surface layer of the polymer (Al-Saidi et al., 2003). The ESC is defined as an essentially physical
process that does not involve any chemical degradation (Arnold, 1996). Experimental work has
shown that contact to diffusing chemical solvents (Al-Saidi et al. 2003) as well as to chemical agents
not absorbed into the polymer, as e.g. butter, cause the PCs to be less resistant to ESC under stress
(Kjellander et al., 2008). Moreover in one study it was reported that storing of the polycarbonate
samples for one year reduced their resistance to some chemicals (Kjellander et al., 2008). The
formation of voids and cracks may increase the surface area of the material dramatically with
potential migration from sub-surface layer of the material.
To improve the mechanical performance of some articles of PC, modifier or reinforcers (e.g. glass
fiber reinforcement) are added (Zhou et al., 2007; Jiang anf Tjong, 1999, Zweifel, 2001). However
the addition of such additives into PC can negatively affect the thermal stability of the polymer and
addition of glass fiber can result in higher melt viscosity and breakage of the fiber (Jiang and Tjong,
1999). Glass fibers are not added to PC grades intended for food contact and medical applications
according to industry information (Bayer, 2013b).
2.4 Hydrothermal ageing of PC
In dry conditions materials of PC is relatively stable to higher temperatures but in hot water (above
60 °C) the polymer is sensitive to hydrolysis (Plast and Gummi Ståbi, 1992). In the injection
molding process at the molders it is important to keep the granulate in a dry condition to avoid
decomposition of the polymer (Plastteknisk Handbok,1980; Bayer, 2013b). In contact with hot
water depolymerisation of the PC will take place and give rise to the formation of monomeric BPA
with potentially increased BPA migration according to an industry study by Mercea et al., 2009 and
according to Cao et al., 2008 a. Moreover PC has poor resistance in alkaline environments in
particular at high temperature (Jiang and Tjong, 1999) and in contact with strongly alkaline
16 Migration of Bisphenol A from polycarbonate plastic of different qualities
solutions hydrolysis is accelerated (George and Gaines, 1990). Several studies have reported that
contact with water at higher temperatures and alkaline conditions will increase the hydrolytic
depolymerisation of PC plastic (George and Gaines, 1990; Brede et al., 2003; Cao et al., 2008;
Mercea, 2009). Addition of a flame retardant (decabromodiphenyl ether) was found to increase the
hydrolytic depolymerisation of PC in a study by Huang et al., 2011; the substance is now prohibited
in electronic equipment (EU, 2011b). It should be emphasised that addition of additives as well as
impurities which catalyse degradation of PC should be avoided (Bayer, 2013b).
According to Factor (1996) hydrolysis of PC can be avoided by the following factors: Before the extrusion and injection molding process of the polymer into articles, the polycarbonate granules should be as free as possible of acidic or basic residues and dried to a water content of <0.05 %. Stabilisers used must itself be neutral and hydrolytically stable.
According to Plastteknisk Handbok (1980) addition of stabilisers can reduce the hydrothermal
ageing of PC (Plastteknisk Handbok, 1980).
Also hydrothermal effects on the structure of PC have been studied. If repeatedly exposed to hot
water above 70 °C the polymer becomes brittle after some time (Plastteknisk Handbok, 1980).
When PC is exposed to boiling water and cooled to room temperature the formation of
microcavities is seen in the polymer (George and Gaines, 1990). According to Branch, 2013, Tg is
inversely proportional to the diffusivity (and thereby the migration) of substances in a given
polymer. However as release of BPA from PC is only to some (or lesser) extent caused by diffusion
this might be of less relevance with PC. According to an industry study Tg has no influence on BPA
release as BPA migration is not driven by diffusion (Bayer, 2013).
2.5 Thermal stability of PC
According to one reference (Huang et al., 2011), reagent-grade PC having a narrow molecular
weight distribution as well as a high purity, exhibits better thermal properties than industrial grade
PC with a broad molecular weight distribution and a lower purity. Regarding molecular weight
distribution, this statement is in contrast to the basic knowledge that all technical PC qualities are
produced to high conversion by polycondensation, which will result in the most probable
polydispersity (Mw/Mn) that approaches 2 (Flory, 1953; Stevens, 1999). Also according to industry
information, the broadness of the molecular weight distribution of polycarbonate is determined by
the applied process conditions during the polycondensation reaction in the production (Bayer,
2013b).
As previously mentioned, to improve the mechanical performance of the polymer, modifiers or
reinforcers are added (Zhou et al., 2007; Jiang anf Tjong, 1999). However the addition of such
additives into PC can affect the thermal stability of the polymer and addition of glass fiber can result
in higher melt viscosity and breakage of the fiber (Jiang anf Tjong, 1999).
2.6 Blends of PC
Polycarbonates (PC) almost invariably based on bisphenol A that constitutes the majority of the
material, do not only appear as homopolymer materials but also various blends of PC with other
polymer materials exist. Blends are made to combine attractive characteristics of the constituting
polymers. For instance PC/polyester (poly(ethylene terephthalate) (PET) and poly(butylene
terephthalate) (PBT)) blends. Blends with styrenic copolymers like poly(acrylonitrile-co-butadiene-
co-styrene) (ABS) poly(styrene-block-butadiene-block-styrene) (SBS), and poly(styrene-co-
acrylonitrile) (SAN), as well as with polystyrene (PS) itself are known (Levchi, 2006). Also PC
blends with polypropylene (PP) exist. From all of these blends of PC, BPA migration may in
principle occur.
Migration of Bisphenol A from polycarbonate plastic of different qualities 17
3. Release of BPA from polycarbonate (PC)
3.1 Introduction
Due to the good physical and mechanical properties of PC plastic it is used in many different fields
of applications, including consumer products and food contact materials. Food contact applications,
medical applications and consumer products account for respectively 4 %, 3 % and 4 % of the total
PC production. Other important areas of use is optical media like DVD’s (21%), Houseware and
applicances (11%), automotive (12%), construction (17%) and electronics (20%) (PlasticEurope,
2010). When PC is brought into contact with food or others matrices, migration and/or release of
BPA from the polymer into the matrix can occur. In the given chapter a review of selected studies on
BPA migration/release is reported. The different mechanisms behind BPA release as well as the
influence of different parameters in the polymer and in the environment are discussed.
3.2 Different mechanisms behind the release of BPA from PC
The BPA release from PC is explained by two different processes:
(i) Diffusion controlled release of residual BPA monomer present in the polymer and
(ii) Hydrolysis and decomposition over time at the polymer surface (pH dependent)
(Mercea, 2008, Brandsch, 2008).
In many cases the term “migration” from polymers can be defined as a mass transfer solely due to
diffusion, which is governed by predictable physical processes taking place in the polymer network
(Piringer and Baner, 2008). However in this specific case where additional (uncontrolled) amounts
of the migrating species, BPA, is generated by hydrolysis/decomposition of the polymer itself,
“migration” become a term describing the total release of BPA. In most of the literature about PC no
distinction is made between the terms “migration”, “leaching” and “release”.
Hydrolysis takes place at the carbonate ester linkages in the PC backbone when the material is in
contact with an aqueous matrix. Results from kinetic migration studies on PC samples support the
hypothesis that hydrolysis at the surface is the main source of BPA release into an aqueous medium
whereas the diffusion controlled release of BPA plays a minor role in the overall release of BPA
from PC (Mercea, 2008). The diffusion rate of BPA is low and the chemical decomposition might
contribute more significantly to the release of BPA, particularly at high temperatures (~ 100°C)
(Brandsch, 2008). According to information from industry, differences in Tg of PC polymers are
marginal and have no influence on BPA migration (Bayer, 2013b). However, the diffusivity was
shown to be inversely proportional with the glass transition temperature, Tg, in a certain PC
polymer type (Brandsch, 2013).
The level of residual BPA in PC is reported to be in the range of 1 – 70 mg/kg polymer (Mercea,
2008; Mountfort et al., 1997; Ehlert et al., 2008). One value of 140 mg/kg was reported for a batch
of baby bottles but was found to be lower (26 mg/kg) in a second batch of the same brand
(Mountfort et al., 1997).
18 Migration of Bisphenol A from polycarbonate plastic of different qualities
According to Bayer there is not a great difference in BPA levels in food resins versus non-food resins
(Bayer, 2013b). However, addition of different substances and impurities as well as different
processing conditions might affect the residual level of BPA in the final material (Bayer, 2013b).
BPA migration was found to be only weakly correlated to the concentration of residual BPA in PC
resin (Mercea, 2008). In a study of eighteen different brands of polycarbonate baby bottles
produced from BPA (application not allowed in EU since 2011), migration of BPA was tested into
water at 100 °C in 1 minute followed by a cooling down period into a water bath at 20 °C until 37 °C
was reached (Ehlert et al., 2008). In the study no correlation was found between residual content of
BPA in the polymer material (1.4 - 35.3 mg/kg polymer) and the release of BPA. This was the same
conclusion in another study on 22 PC baby bottles by Mountfort et al. 1997. However, this might be
due to combination of a short test time and the low diffusion rate of BPA.
3.3 Release of BPA into water
A large number of studies have been made to quantify the level of BPA release from PC food contact
materials (Mountfort e al., 1997; Ehlert et al., 2007; Kubwabo et al., 2009; Maragou et al., 2008;
De Coensel et al., 2009; Santillana et al., 2011, Simoneau et al., 2011; Hoekstra and Simoneau,
2013) . Most of the studies were made by the use of food simulants and showed considerable
variation in the level of BPA release from different samples of PC. Release of BPA into water was
experimentally shown to increase with time and temperature (Le et al., 2008; Maragou et al., 2008;
Kubwabo et al., 2009; Coensel et al., 2009; Nam et al., 2010). The correlation between release of
BPA and time was corresponding to a second – degree polynomial (Migration = at2 + bt + c) for
each of five different samples of PC when testing with water at 1-6 days at 70 °C ((Cao and
Corriveau, 2008 a). The level of BPA varied between 32-55 g/L (at day 1) and 228-516 g/l (at day
6). According to the authors the variation between samples is likely due to different levels of
residual BPA in the samples (Cao and Corriveau, 2008a). However residual levels of BPA were not
determined in the given study and according to Mercea (2008) migration of BPA was found to be
only weakly correlated to the concentration of residual BPA in the PC. As part of the study the
migration rates (release of BPA per cm2 surface area and per hour) were determined to be in the
range of 1.84 – 4.83 ng cm-2 h-1 (average) for the five samples (Cao and Corriveau, 2008a). In
another study the release of BPA from PC into water was determined at a lower temperature (1 day
at room temperature) after filling the bottles with boiling water (Cao and Corriveau, 2008 b). In
this study the level of BPA released from the bottles were in a much lower the range of 1.7-4.1 g/L
(Cao and Corriveau, 2008) compared to the above level of 32-55 µg/l (day 1). In a study by Le at al.
2008 the rate of BPA release from new PC drinking bottles into water was found to increase by a
factor of 15-55 when exposed to boiling water compared to room temperature (Le et al., 2008). Also
in a study by Nam et al, 2010 the level of BPA migration rapidly increased from 6-month used baby
bottles when the temperature of water increased at temperatures above 80 °C (Nam et al., 2010).
Release of BPA into deionized water and tap water is reported from several other studies with the
highest concentration of 1 mg/l (10 days@65°C) (Hoekstra and Simoneau, 2013). In conclusion the
release of BPA into water is found to increase with increased time and temperature (Hoekstra and
Simoneau, 2013).
3.4 Effect of different parameters on BPA release
The release of BPA was found to increase with increased pH (Biedermann-Brem et al., 2008;
Hoekstra and Simoneau, 2013)) when testing the release of BPA into tap water at increased
temperature up to 100 °C. A BPA release up to 137 µg/l after boiling of pre-boiled tap water in PC
bottles for 5-10 minutes was reported (Biedermann-Brem et al., 2008). The high level of BPA is
explained by degradation of PC caused by high temperature and high pH of the water due to
degassing of carbon dioxide when boiling. The authors concluded that BPA is primarily released due
to degradation/hydrolysis of PC (rather than diffusion/migration) when the material is exposed to
water at high temperature and high pH (Biederman-Brem and Grob, 2008). The positive
Migration of Bisphenol A from polycarbonate plastic of different qualities 19
correlation to pH was also found in another study where the release of BPA into demineralized
water at 60 °C increased from 0.13 – 30 ug/dm2 with a shift in pH from 2.5 to 10.1 (Mercea, 2008).
Brede at al. found an increased migration of BPA from PC baby bottles after dishwashing at 70 °C
with detergent of pH 11.5-12 (Brede et al., 2003). Also small amount of acid is mentioned to catalyse
the hydrolysis and should therefore be avoided in the production process (Zweifel, 2001).
The migration of BPA from used polycarbonate animal cages (with visible worn) was found to be
significantly higher than from new ones when tested for BPA release into water at room
temperature (Howdeshell et al., 2003). It might be due to increased surface area of the worn
polymer and/or catalysed hydrolysis of the polymer to BPA after contact with animal alkaline
urine. Urea and other amines should be avoided since they can lead to drastic polymer degradation
(Bayer, 2013b). Increased BPA release was also seen from used PC baby bottles compared to new
ones (Cao et al., 2008b). However as new and old samples were not of the same production lot, it
may be difficult to generalise from the study.
In a review of several studies (Hoekstra and Simoneau, 2013) it is concluded that:
The release of BPA from PC is mainly affected by contact time, temperature and pH with a
positive correlation to the three parameters.
Residual alkaline detergent remaining on the surface of the PC bottles after dishwashing
may increase the release of BPA.
The effect of aging is difficult to estimate as reported studies on new and used bottles were
not made by the same production lot
The effect of different detergents for dishwashing and handwashing on the release of BPA from PC
baby bottles was studied by Maria et al., 2009. The authors found that for all but one detergent
tested, the release of BPA increased up to 500 times the control sample (not exposed to detergents)
(Maria et al., 2009). This was assumed to be due to degradation of the polymer. However, no
correlation could be found between the release of BPA and pH of the detergents (personal
communication to one of the authors, Bustos, 2009), so according to the authors more studies are
needed to better understand the mechanism. Santillana et al., 2013 concluded that the trademark of
PC baby bottles was an influential factor on the level of BPA releasing from PC polymer when
exposed to detergent aggression. This indicates that the production process varies between different
brands of the same product
The migration of volatile substances from new PC containers intended for microwave oven was
tested during microwave- and conventional heating for 1 h at 80 °C by total immersion into
isooctane, ethanol and water (Alin and Hakkarainen, 2012). During microwave heating the
migration of individual compounds was in most cases significantly larger than during conventional
heating. According to the authors, the increased migration can be explained by degradation caused
by microwave heating and/or food simulant interactions (Alin and Hakkarainen, 2012). No specific
information was given on the migration level of BPA from the tested PC materials. Contrary a study
by Ehlert et al., 2008 did not find any increase in BPA migration into water from 18 PC baby bottles
after 3 times repeated heating to 100 °C in a microwave oven. Also in another study by Coensel et al.
(2009) no significant difference was found between BPA migration after water bath and microwave
heating of PC baby bottles.
As was given above in chapter 2, various additives added to the polymer can significantly affect the
polymer stability (Sharon et al., 2006; Zhou et al., 2007). According to industry information,
additives and inappropriate processing conditions can have an effect on the BPA level presumably
by partial decomposition of the polymer chain (Bayer, 2013b). Addition of amines into the polymer
may lead to a significant increase in residual BPA content. Also addition of other additives including
20 Migration of Bisphenol A from polycarbonate plastic of different qualities
TiO2 and glass fibres, if not of a prober quality compatible with the PC polymer, may increase the
polymer decomposition and residual level of BPA (Bayer 2013b). Moreover, too high thermal stress
during the injection molding process may also increase the BPA level (Bayer, 2013b). Hence, the
recommendations from the suppliers regarding drying of raw material prior to the injection
molding and selection of proper processing conditions should be noted seriously.
Migration of Bisphenol A from polycarbonate plastic of different qualities 21
Part 2: Experimental
22 Migration of Bisphenol A from polycarbonate plastic of different qualities
4. Characterisation and testing of PC
4.1 Introduction
The aim of the experimental work was to study the potential correlation between quality of PC
plastic and the release of BPA from the materials by chemical and physical characterisation and
testing of the materials. Several studies have discussed the influence of different material
parameters on the release of BPA from PC as discussed in the previous chapter and as summarised
below.
The migration/release of BPA from PC is explained by two principally different mechanisms:
Firstly, by diffusion of residual BPA from inside the polymer and secondly by degradation of the
polymer surface due to photodegradation by UV light or due to hydrolysis when exposed to water at
higher temperatures in particular at alkaline conditions.
A positive correlation between residual level of BPA in PC and release of BPA from the materials has
been suggested by several studies. However, according to other studies (Mercea, 2008; Ehlerts et al,
2008) there is no or only a minor correlation. This might be explained by the fact that the diffusion
rate of BPA in the bulk of the PC material is very low compared to that of more soft plastics. In
general increasing diffusion and therefore also migration is positively correlated to temperature and
contact time.
It is assumed that the release of BPA from PC, when exposed to water, is primarily due to
degradation of the polymer with hydrolysis of carbonate ester linkages in the PC backbone rather
than diffusion of residual BPA, especially at high temperature (~ 100 °C).
Addition of some additives as well as contaminants and impurities in the polymer can accelerate the
photodegradation and hydrolysis of PC (Saron et al. 2006; Saron and Felisberti, 2009; Bayer,
2013b).
Use of dry and highly pure raw materials as well as addition of specific stabilisers can reduce
hydrolysis of PC (Bayer, 2013b)
Only a few studies included in this review have included both physical characterisation of the
materials and chemical testing of BPA. However, this is the prerequisite to fully study the potential
correlation between material specific parameters and the release of BPA.
In the second part of this project, samples of PC were analysed applying an experimental design
that allow the study of a potential correlation between selected material specific parameters and the
release of BPA at different environmental conditions. Twelve different materials of PC were
characterised with respect to molecular structure, the average molecular weight (Mw) and the
average number molecular weight (Mn), Tg, thermal resistance as well as residual level of BPA in the
polymers and moreover the release of BPA and hydrothermal stability was studied.
Migration of Bisphenol A from polycarbonate plastic of different qualities 23
4.2 Materials
Samples (n=12) were selected in order to represent a diversity of materials for food contact
applications and other applications. New and older materials were covered and included the
following samples:
Three test plates produced by industry to represent different qualities of polycarbonate.
All three materials are intended for applications of food contact, medical applications and
toys.
Two samples of PC drinking glasses
Five samples of PC baby bottles
One PC bowl and
One DVD sample.
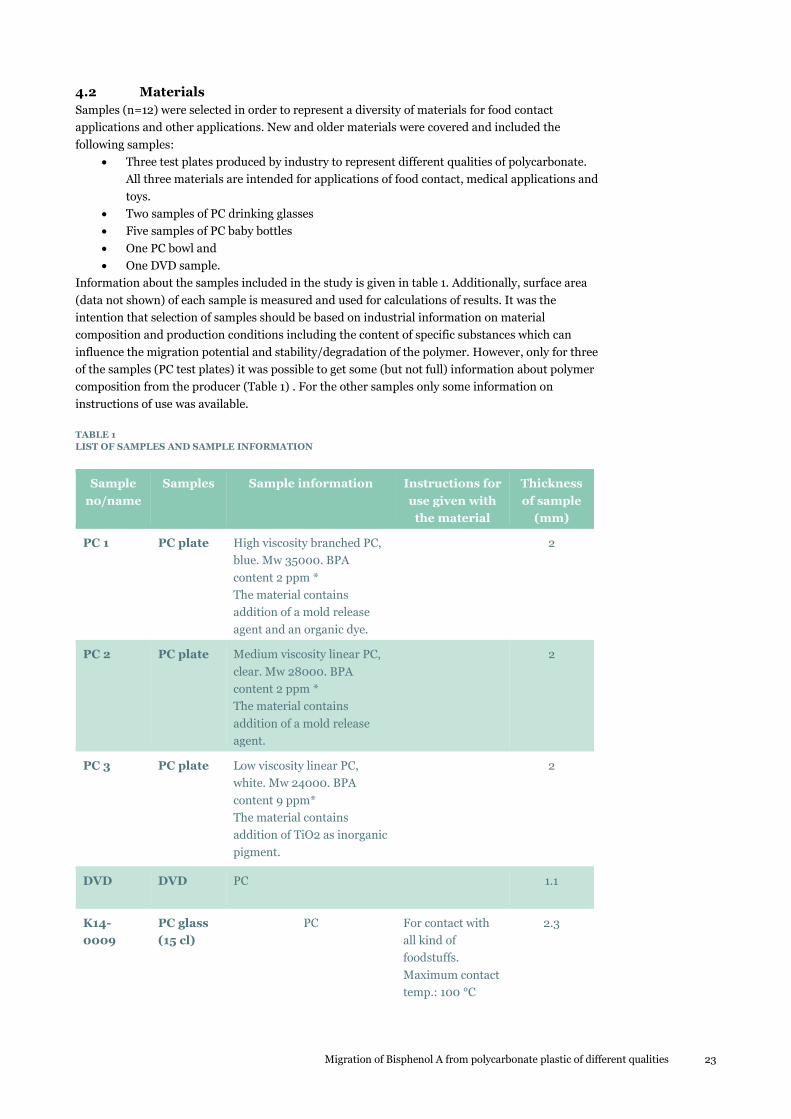
Information about the samples included in the study is given in table 1. Additionally, surface area
(data not shown) of each sample is measured and used for calculations of results. It was the
intention that selection of samples should be based on industrial information on material
composition and production conditions including the content of specific substances which can
influence the migration potential and stability/degradation of the polymer. However, only for three
of the samples (PC test plates) it was possible to get some (but not full) information about polymer
composition from the producer (Table 1) . For the other samples only some information on
instructions of use was available.
TABLE 1
LIST OF SAMPLES AND SAMPLE INFORMATION
Sample
no/name
Samples Sample information Instructions for
use given with
the material
Thickness
of sample
(mm)
PC 1 PC plate High viscosity branched PC,
blue. Mw 35000. BPA
content 2 ppm *
The material contains
addition of a mold release
agent and an organic dye.
2
PC 2 PC plate Medium viscosity linear PC,
clear. Mw 28000. BPA
content 2 ppm *
The material contains
addition of a mold release
agent.
2
PC 3 PC plate Low viscosity linear PC,
white. Mw 24000. BPA
content 9 ppm*
The material contains
addition of TiO2 as inorganic
pigment.
2
DVD DVD PC 1.1
K14-
0009
PC glass
(15 cl)
PC For contact with
all kind of
foodstuffs.
Maximum contact
temp.: 100 °C
2.3

24 Migration of Bisphenol A from polycarbonate plastic of different qualities
Sample
no/name
Samples Sample information Instructions for
use given with
the material
Thickness
of sample
(mm)
Maximum time of
contact: 2 hours.
K14-0010 PC glass
(40 cl)
PC For contact with
all kind of
foodstuffs.
Maximum contact
temp: 130 °C
Maximum time of
contact: no
restriction
1.8
OLD
samples:
2008-176 Baby
bottle
PC 1.2
2008-179 Baby
bottle
PC 1.0
2008-235 Baby
bottle
PC 0.9
2008-236 Baby
bottle
PC 1.0
2008-242 Baby
bottle
PC 1.2
1997-PC4 Bowl PC 2.6
*) Information given by the producer of the material.
The molecular weight was determined by GPC and polycarbonate calibration.
4.3 Characterisation of materials
A comprehensive analyses program has been performed on all the investigated samples in order to
complement the sparse available material information. This is especially important for the samples
without any product specifications except the basic knowledge that they presumably consist of
polycarbonate (PC). The analyses program has been devised to provide physical and chemical
comparative characterisation of the samples. Furthermore, the analyses program also aims to study
the potential correlation between these material parameters and release of BPA from the materials.
4.3.1 Fourier Transform infrared spectroscopy (FTIR)
Fourier Transform infrared spectroscopy (FTIR) is vibrational spectroscopy technique that records
the absorption of IR light by chemical bonds in all molecules incl. polymers. The technique is
suitable for verifying if the polymer really is polycarbonate and if specific additives or
decomposition products are present in high concentration. Since different bonds absorb IR light at
characteristic but different wavelengths FTIR spectroscopy is often referred to as fingerprint
spectroscopy. As a consequence pure compounds have characteristic and unique FTIR spectra. In
principle, all states of matter, gas-liquid-solid, can be analysed. Since light transmittance through a
sample is necessary (IR light should reach the detector) very thin film material or a sample finely
dispersed in a non-absorbing matrix normally needs to be prepared. With Attenuated Total
Migration of Bisphenol A from polycarbonate plastic of different qualities 25
Reflectance (ATR) however, a sample is forced in close contact with a reflecting surface and sample
preparation becomes very easy for polymers, thus non-dissolvable films or pellets can be analysed
directly. In this analytical effort a single small piece of each sample has been analysed on a Nicolet
iS50 equipped with a diamond crystal in a Horisontal ATR accessory. 32 Scans in the 4000-400 cm-
1 spectral range are recorded and co-added in 4 cm-1 resolution.
4.3.2 Molecular weight by size exclusion chromatography (SEC)
Size Exclusion Chromatography (SEC) formerly known as Gel Permeation Chromatography (GPC),
is an analytical technique that provides information on molecular weights (Mw and Mn) and
molecular weight distributions (Mw/Mn) of soluble polymers in tetrahydrofuran (THF). This
technique is used in order to measure the length of the polymer chains and if they are reduced
during the applied tests. The analysis is routinely performed on approx. 1 wt-% polymer carefully
filtered solutions in tetrahydrofuran (THF) that eludes on a HPLC type instrument equipped with
columns that separate after molecular size. The detection can be performed by various detectors:
Refractive Index (RI), UV, light scattering or viscometry. Data computation is based on polystyrene
(PS) calibration standards. Each sample has been analysed twice.
4.3.3 Glass transition temperature by differential scanning calorimetry (DSC)
Differential scanning calorimetry (DSC) enables determinations of the thermal transitions of
polymers and composite plastic materials. The technique is somehow complementary to the above
molecular weight determination as one would expect that shorter chains will lower Tg. DSC records
glass transition temperatures (Tg) for amorphous materials as PC. The Tg transition of PC is
extremely important for applications since around and above Tg PC starts to lose the form stability.
At the glass transition the amorphous state of a polymer suffers a transition from solid to liquid like
(or rubbery like). When the amorphous state is heated the kinetic energy of the molecules increases,
motion is restricted, however, to short-range vibrations and rotations around the polymer chain as
long as the polymer retains its glasslike structure. The significance of the glass transition
temperature is enormous since it is a fundamental characteristic that relates to polymer properties
and processing. Sample prerequisites for DSC are small amounts of solids (~5-10 mg). The applied
instrument is a TA Instruments Q1000 and a three cycle analysis involving heating from room
temperature to 250 oC, with subsequent immediate cooling to room temperature, and a final
heating to 250 oC has been exercised for each sample. The Tg computed during the second heating
cycle is reported to avoid any annealing effects.
4.3.4 Thermal resistance by thermogravimetric analysis (TGA) The thermal resistance/degradation, TGA, can be studied with equipment for thermogravimetric
analysis. TGA is normally employed in inert (N2) atmosphere. The analysis is performed by
carefully controlled heating in an oven while simultaneously recording the sample weight loss. The
sample (5-10 mg) is placed in a Pt cup that hangs in a tremendously sensitive balance (± 1 ng). The
weight loss information thus gained can often provide some compositional information of a sample
e.g. content of inorganic fillers since the organic constituents (polymers) will eventually more or less
degrade and disappear. In the present case the analyses were performed on a TA Instruments TGA
Q500 by heating the samples from room temperature to 800 oC at 20 oC/min.
4.3.5 Liquid chromatography with mass spectrometric detection (LC-MS/MS)
Residual BPA in the samples and in simulants were analysed using an accredited method (DTU
National Food Institute, 2013) using liquid chromatography tandem mass spectrometry, LC-
MS/MS (Acquity-Quattro Ultima, Waters, Milford, MA, USA). The instrument was operated in
electrospray-negative ionisation mode using multiple reactions monitoring (MRM). Identification
of BPA was performed by monitoring the transition reactions m/z 227> 212 and m/z 227> 133.
Quantification of BPA in the samples was performed by external standard calibration and with
addition of internal standard (IS) of BPA-d16 (from Sigma-Aldrich) into samples, standards and
blanks. The standards were prepared in the same solvent or food simulant used.

26 Migration of Bisphenol A from polycarbonate plastic of different qualities
4.4 Extraction of PC and migration testing
4.4.1 Residual level of bisphenol A in samples
Residual levels of BPA were determined in all samples in order to estimate the potential diffusion
controlled release of BPA from each sample. Subsamples (double determinations) of about 1 g of
each polymer were dissolved in 20 ml methylene chloride according to Biles et al. (1997). The
solutions were left at room temperature for 24 hours until complete dissolution of the polymers.
Precipitation of dissolved polymer was done by addition of 20 ml methanol (MeOH). The extracts
were centrifuged (4500 rpm in 10 min, 10 °C) and filtered. The level of BPA was determined in the
extracts by liquid chromatography mass spectrometry, LC-MS/MS after dilution of sample extracts
with MeOH and addition of internal standard (IS) of (BPA- d16). Quantification was done by the use
of external standard calibration in MeOH/methylene chloride with addition of IS of BPA- d16. The
level of BPA in the polymer samples was calculated as g/g polymer and in µg/dm2 sample.
4.4.2 Release of BPA from samples to migration solutions
The release of BPA from the samples was tested by exposure into hot water (a potential worst case
food in contact with PC) at selected worst case time and temperature conditions. Testing with water
at high temperature was assumed to represent worst case testing as PC is sensitive to hydrothermal
effects according to technical literature and results from several studies (Plast og Gummi Ståbi,
1992; Plastteknisk Handbok, 1980; Mercea et al., 2009; Cao et al., 2009). The testing was
performed in accordance with the regulation of EU 10/2011 for plastic food contact materials and
following relevant parts of the European standards for migration testing (CEN, 2004).
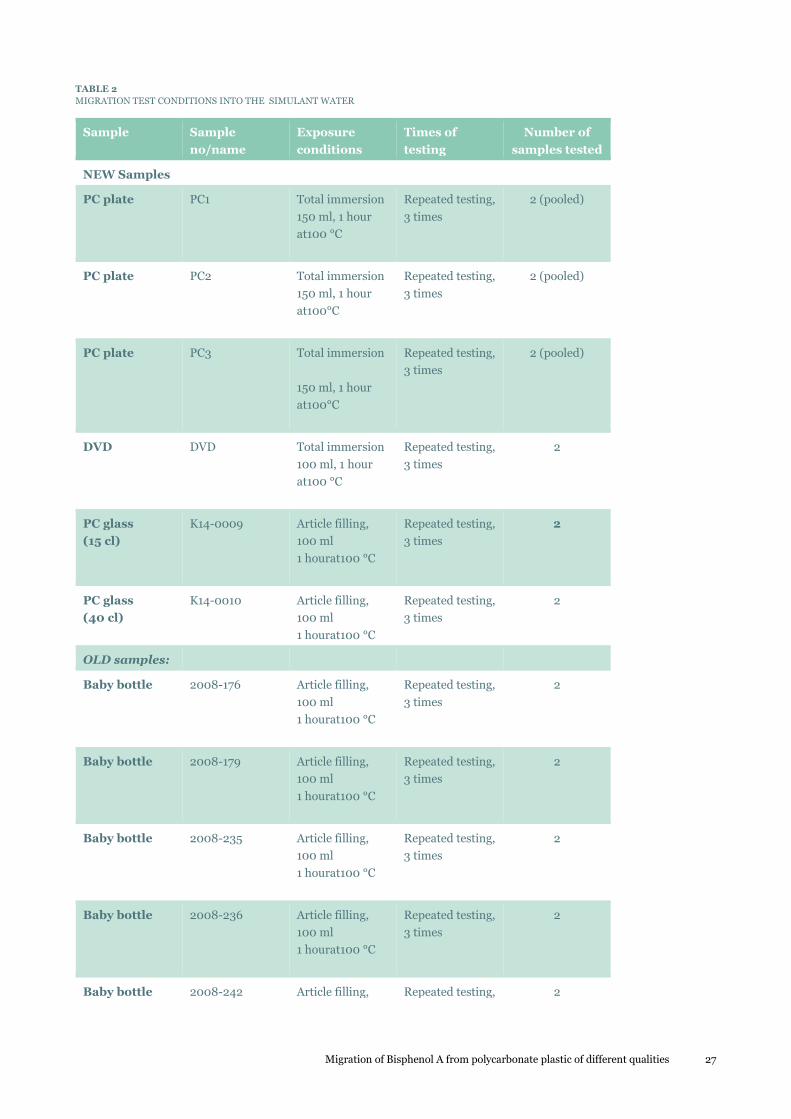
Baby bottles, drinking glasses and the bowl were filled with 100 ml water, preheated up to 100 °C in
a microwave oven and placed in a cupboard for the given test time. Samples of PC plates and the
DVD sample were tested by total immersion into 150 ml or 100 ml hot water respectively. The
samples were preheated up to 100 °C in a microwave oven and placed in the cupboard (100 °C) for
the given test duration. The migration test conditions are given in table 2. Samples were tested by 3
times repeated exposure and all samples were tested as double determinations (two samples). The
level of BPA was analysed by LC-MS/MS. Surface area of each sample was measured and the results
were calculated in g BPA/dm2 surface area of the sample.
4.4.3 Quality assurance
The National Food Institute is accredited by DANAK, according to ISO/IEC 17025: 2005 to do
migration testing and chemical analysis of FCM. Blanks were controlled in each analytical series
and samples were analysed as double determinations. Double determinations were performed to
ensure certainty of the tests. Recovery was controlled in each analytical series by repeated analysis
of an aqueous sample with known concentration of BPA (in house check sample). In sample extracts
of dissolved polymers, the recovery was controlled by spiking a known BPA concentration into
sample extracts of all the sample materials.
Limit of detection (LOD) for aqueous samples was 0.2 g/dm2
LOD for samples of dissolved polymer extracts was 0.6 g/g polymer
The recoveries of in house aqueous check sample (140 ng/ml) of BPA were 88-110 %
The recoveries in spiked sample extracts of dissolved polymers was 95-120 %
All calibration curves were linear with R >0.99
Migration of Bisphenol A from polycarbonate plastic of different qualities 27
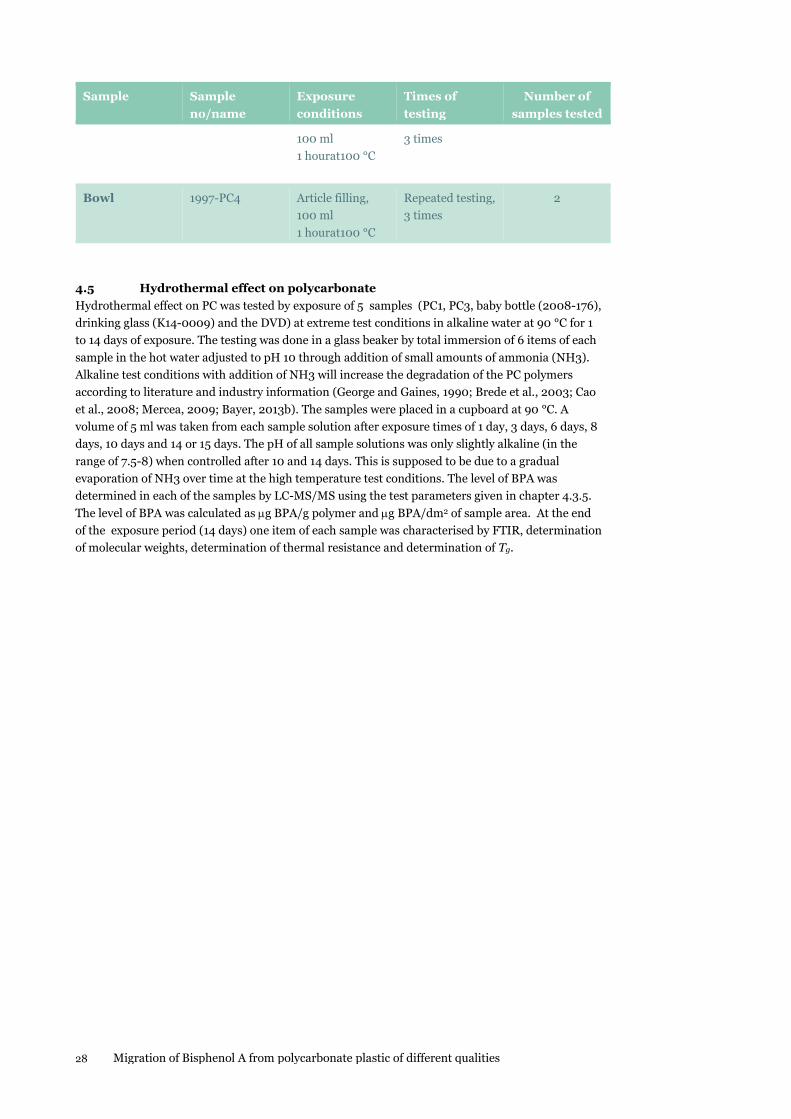
TABLE 2
MIGRATION TEST CONDITIONS INTO THE SIMULANT WATER
Sample Sample
no/name
Exposure
conditions
Times of
testing
Number of
samples tested
NEW Samples
PC plate PC1 Total immersion
150 ml, 1 hour
at100 °C
Repeated testing,
3 times
2 (pooled)
PC plate PC2 Total immersion
150 ml, 1 hour
at100°C
Repeated testing,
3 times
2 (pooled)
PC plate PC3 Total immersion
150 ml, 1 hour
at100°C
Repeated testing,
3 times
2 (pooled)
DVD DVD Total immersion
100 ml, 1 hour
at100 °C
Repeated testing,
3 times
2
PC glass
(15 cl)
K14-0009 Article filling,
100 ml
1 hourat100 °C
Repeated testing,
3 times
2
PC glass
(40 cl)
K14-0010 Article filling,
100 ml
1 hourat100 °C
Repeated testing,
3 times
2
OLD samples:
Baby bottle 2008-176 Article filling,
100 ml
1 hourat100 °C
Repeated testing,
3 times
2
Baby bottle 2008-179 Article filling,
100 ml
1 hourat100 °C
Repeated testing,
3 times
2
Baby bottle 2008-235 Article filling,
100 ml
1 hourat100 °C
Repeated testing,
3 times
2
Baby bottle 2008-236 Article filling,
100 ml
1 hourat100 °C
Repeated testing,
3 times
2
Baby bottle 2008-242 Article filling, Repeated testing, 2
28 Migration of Bisphenol A from polycarbonate plastic of different qualities
Sample Sample
no/name
Exposure
conditions
Times of
testing
Number of
samples tested
100 ml
1 hourat100 °C
3 times
Bowl 1997-PC4 Article filling,
100 ml
1 hourat100 °C
Repeated testing,
3 times
2
4.5 Hydrothermal effect on polycarbonate
Hydrothermal effect on PC was tested by exposure of 5 samples (PC1, PC3, baby bottle (2008-176),
drinking glass (K14-0009) and the DVD) at extreme test conditions in alkaline water at 90 °C for 1
to 14 days of exposure. The testing was done in a glass beaker by total immersion of 6 items of each
sample in the hot water adjusted to pH 10 through addition of small amounts of ammonia (NH3).
Alkaline test conditions with addition of NH3 will increase the degradation of the PC polymers
according to literature and industry information (George and Gaines, 1990; Brede et al., 2003; Cao
et al., 2008; Mercea, 2009; Bayer, 2013b). The samples were placed in a cupboard at 90 °C. A
volume of 5 ml was taken from each sample solution after exposure times of 1 day, 3 days, 6 days, 8
days, 10 days and 14 or 15 days. The pH of all sample solutions was only slightly alkaline (in the
range of 7.5-8) when controlled after 10 and 14 days. This is supposed to be due to a gradual
evaporation of NH3 over time at the high temperature test conditions. The level of BPA was
determined in each of the samples by LC-MS/MS using the test parameters given in chapter 4.3.5.
The level of BPA was calculated as g BPA/g polymer and g BPA/dm2 of sample area. At the end
of the exposure period (14 days) one item of each sample was characterised by FTIR, determination
of molecular weights, determination of thermal resistance and determination of Tg.
Migration of Bisphenol A from polycarbonate plastic of different qualities 29
5. Results and discussion
5.1 Results of the characterisation
5.1.1 Identity of polymer materials by FTIR spectrometry
The FTIR spectra appear all very identical showing that all samples were made from PC. Thus in
every FTIR spectrum the most significant absorption peaks for a bisphenol A based PC are
identified. These are the weak CH3 asymmetric and symmetric stretching vibration at 2968 cm-1, the
strong C=O stretching at 1769 cm-1, the strong p-substituted ring stretching at 1503 cm-1, the sharp
benzene bending at 1080 cm-1, the strong asymmetric O-C-O stretching at 1014 cm-1, and the strong
=CH out-of-plane deformation at 828 cm-1, and finally another strong p-substituted ring absorption
at 553 cm-1. In addition the i-propylidene structure shows weak bands at 1386 and 1364 cm-1
(Hummel, 1988). All spectra appear as true copies of each other, not even very careful inspection of
the spectra from the exposed samples show any new absorption peaks or a change in the intensity
pattern observed in the corresponding spectra of the non-exposed samples. The FTIR spectra of one
of the analysed samples (PC3) before and after hydrothermal exposure into water at 90 °C and
alkaline conditions in 14 days are shown in the Annex of the report.
5.1.2 Molecular weight by SEC analysis
The molecular weight information as determined by SEC is collected in table 3. The majority of
samples were produced from PC with polymer chains of approximately the same length (Mw. 40-
50.000). The extremes were PC1 with a higher molecular weight (Mw ca 60.000 Da) g and the DVD
with approximately half of this. The reproducibility was in all instances good. It should, however,
be stressed at this point that the reported molecular weights most likely are not the absolute values
(given with producer sample information in table 1) since in the present study the calculations are
based on PS standards. Nevertheless the values are comparable. All the samples except the DVD
have Mws in the 40,000-60,000 Da range with the associated Mns in 19,000 to 27,000 Da range.
This translates into polydispersities (Mw/Mn) from 1.9-2.5 that is normal for this kind of
condensation type polymers. All these numbers indicate PC materials with engineering properties
in a normal application range. The DVD has somehow lower both Mw (~30,000) and Mn (~15,000),
however the polydispersity (Mw/Mn) is at the same level as the other samples. The five samples that
have been subjected to the extreme exposure all show a remarkable and significant almost 20%
decrease in both types of molecular weight. Representative figures of SEC traces of one sample
(PC3) before and after hydrothermal exposure into water at 90 °C and alkaline conditions in 14 days
are shown in the Annex of the report. It is noted that the listed molecular weights for PC1, PC2, and
PC3 are different from the ones reported by the manufacturer due to our use of polystyrene
calibration standards that only result in relative molecular weights. These are, however, reliable for
comparison purposes.
5.1.3 Glass transition temperature by DSC analysis
The glass transition temperatures (Tg) of all the samples are collected in table 4. Again most
samples have approximately the same Tg sample PC1 and the DVD being the most deviating ones. It
is observed that the majority of the samples are in the range 146-154 oC, with the DVD having a
slightly lower Tg (=143 oC). The small variations in Tgs seem to scale somehow with the molecular
weights such that higher MW results in a slightly higher Tg.
On the other hand the results of the exposed samples only reveal a very minor lowering of Tg. The
exposed samples do not show any signs of degradation products since no effects of smaller
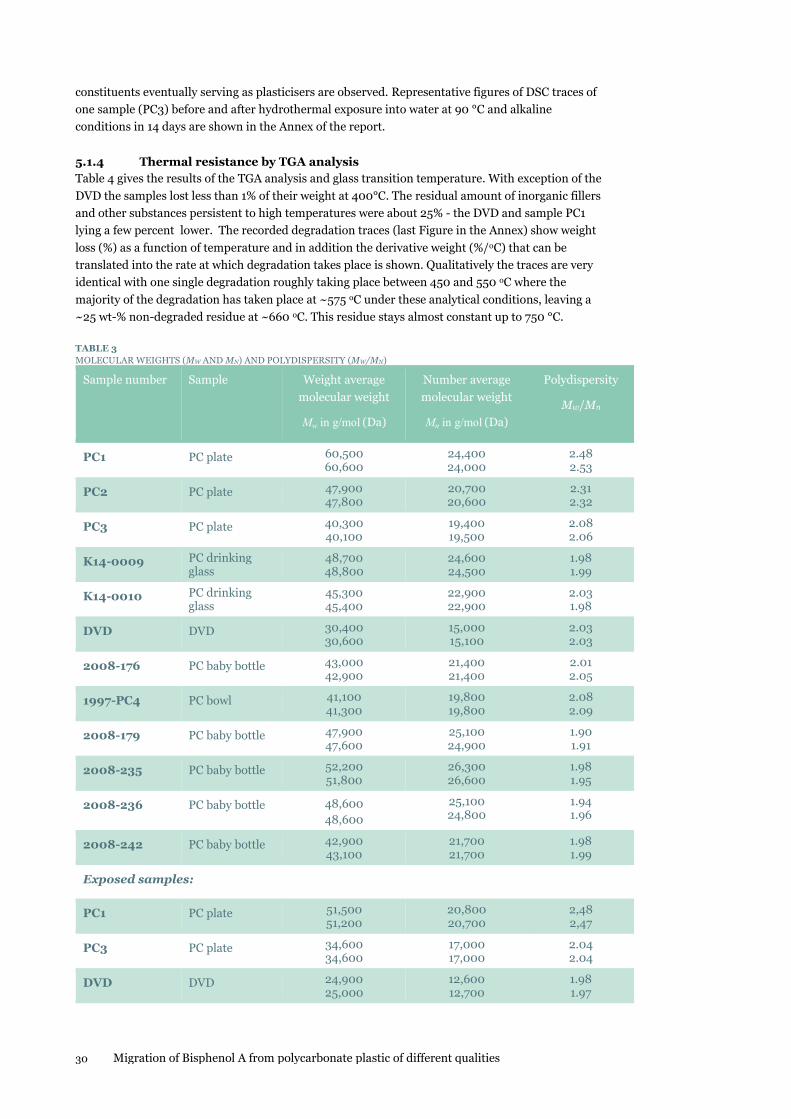
30 Migration of Bisphenol A from polycarbonate plastic of different qualities
constituents eventually serving as plasticisers are observed. Representative figures of DSC traces of
one sample (PC3) before and after hydrothermal exposure into water at 90 °C and alkaline
conditions in 14 days are shown in the Annex of the report.
5.1.4 Thermal resistance by TGA analysis
Table 4 gives the results of the TGA analysis and glass transition temperature. With exception of the
DVD the samples lost less than 1% of their weight at 400°C. The residual amount of inorganic fillers
and other substances persistent to high temperatures were about 25% - the DVD and sample PC1
lying a few percent lower. The recorded degradation traces (last Figure in the Annex) show weight
loss (%) as a function of temperature and in addition the derivative weight (%/oC) that can be
translated into the rate at which degradation takes place is shown. Qualitatively the traces are very
identical with one single degradation roughly taking place between 450 and 550 oC where the
majority of the degradation has taken place at ~575 oC under these analytical conditions, leaving a
~25 wt-% non-degraded residue at ~660 oC. This residue stays almost constant up to 750 °C.
TABLE 3
MOLECULAR WEIGHTS (MW AND MN) AND POLYDISPERSITY (MW/MN)
Sample number Sample Weight average
molecular weight
Mw in g/mol (Da)
Number average
molecular weight
Mn in g/mol (Da)
Polydispersity
Mw/Mn
PC1 PC plate 60,500 60,600
24,400 24,000
2.48 2.53
PC2 PC plate 47,900 47,800
20,700 20,600
2.31 2.32
PC3 PC plate 40,300 40,100
19,400 19,500
2.08 2.06
K14-0009 PC drinking glass
48,700 48,800
24,600 24,500
1.98 1.99
K14-0010 PC drinking glass
45,300 45,400
22,900 22,900
2.03 1.98
DVD DVD 30,400 30,600
15,000 15,100
2.03 2.03
2008-176 PC baby bottle 43,000 42,900
21,400 21,400
2.01 2.05
1997-PC4 PC bowl 41,100 41,300
19,800 19,800
2.08 2.09
2008-179 PC baby bottle 47,900 47,600
25,100 24,900
1.90 1.91
2008-235 PC baby bottle 52,200 51,800
26,300 26,600
1.98 1.95
2008-236 PC baby bottle 48,600
48,600
25,100 24,800
1.94 1.96
2008-242 PC baby bottle 42,900 43,100
21,700 21,700
1.98 1.99
Exposed samples:
PC1 PC plate 51,500 51,200
20,800 20,700
2,48 2,47
PC3 PC plate 34,600 34,600
17,000 17,000
2.04 2.04
DVD DVD 24,900 25,000
12,600 12,700
1.98 1.97
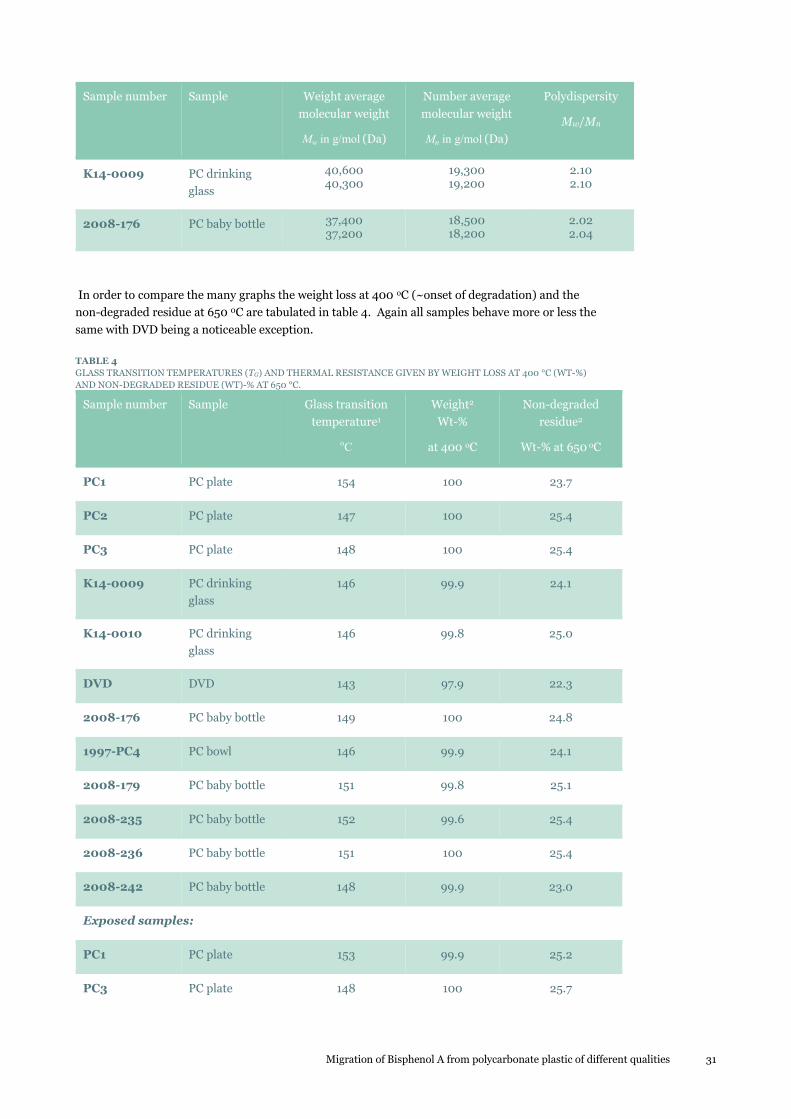
Migration of Bisphenol A from polycarbonate plastic of different qualities 31
Sample number Sample Weight average
molecular weight
Mw in g/mol (Da)
Number average
molecular weight
Mn in g/mol (Da)
Polydispersity
Mw/Mn
K14-0009 PC drinking
glass
40,600 40,300
19,300 19,200
2.10 2.10
2008-176 PC baby bottle 37,400 37,200
18,500 18,200
2.02 2.04
In order to compare the many graphs the weight loss at 400 oC (~onset of degradation) and the
non-degraded residue at 650 0C are tabulated in table 4. Again all samples behave more or less the
same with DVD being a noticeable exception.
TABLE 4
GLASS TRANSITION TEMPERATURES (TG) AND THERMAL RESISTANCE GIVEN BY WEIGHT LOSS AT 400 °C (WT-%)
AND NON-DEGRADED RESIDUE (WT)-% AT 650 °C.
Sample number Sample Glass transition
temperature1
oC
Weight2
Wt-%
at 400 oC
Non-degraded
residue2
Wt-% at 650 oC
PC1 PC plate 154 100 23.7
PC2 PC plate 147 100 25.4
PC3 PC plate 148 100 25.4
K14-0009 PC drinking
glass
146 99.9 24.1
K14-0010 PC drinking
glass
146 99.8 25.0
DVD DVD 143 97.9 22.3
2008-176 PC baby bottle 149 100 24.8
1997-PC4 PC bowl 146 99.9 24.1
2008-179 PC baby bottle 151 99.8 25.1
2008-235 PC baby bottle 152 99.6 25.4
2008-236 PC baby bottle 151 100 25.4
2008-242 PC baby bottle 148 99.9 23.0
Exposed samples:
PC1 PC plate 153 99.9 25.2
PC3 PC plate 148 100 25.7
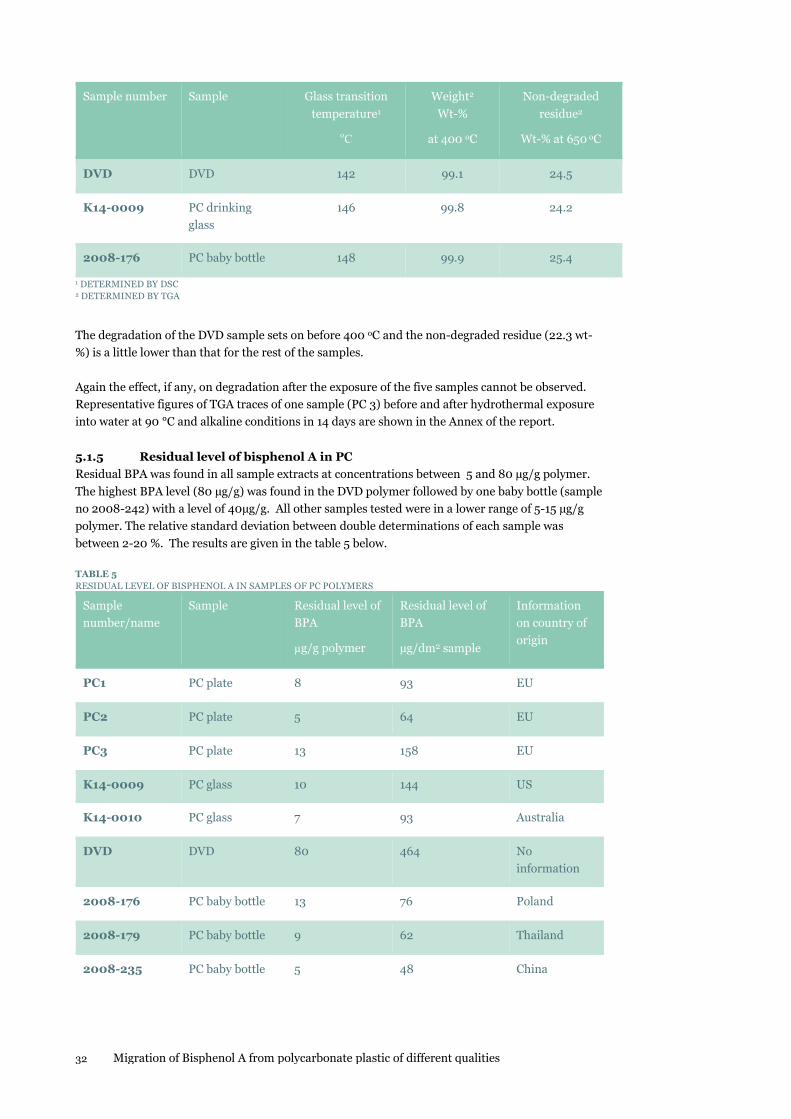
32 Migration of Bisphenol A from polycarbonate plastic of different qualities
Sample number Sample Glass transition
temperature1
oC
Weight2
Wt-%
at 400 oC
Non-degraded
residue2
Wt-% at 650 oC
DVD DVD 142 99.1 24.5
K14-0009 PC drinking
glass
146 99.8 24.2
2008-176 PC baby bottle 148 99.9 25.4
1 DETERMINED BY DSC 2 DETERMINED BY TGA
The degradation of the DVD sample sets on before 400 oC and the non-degraded residue (22.3 wt-
%) is a little lower than that for the rest of the samples.
Again the effect, if any, on degradation after the exposure of the five samples cannot be observed.
Representative figures of TGA traces of one sample (PC 3) before and after hydrothermal exposure
into water at 90 °C and alkaline conditions in 14 days are shown in the Annex of the report.
5.1.5 Residual level of bisphenol A in PC
Residual BPA was found in all sample extracts at concentrations between 5 and 80 µg/g polymer.
The highest BPA level (80 µg/g) was found in the DVD polymer followed by one baby bottle (sample
no 2008-242) with a level of 40µg/g. All other samples tested were in a lower range of 5-15 µg/g
polymer. The relative standard deviation between double determinations of each sample was
between 2-20 %. The results are given in the table 5 below.
TABLE 5
RESIDUAL LEVEL OF BISPHENOL A IN SAMPLES OF PC POLYMERS
Sample
number/name
Sample Residual level of
BPA
µg/g polymer
Residual level of
BPA
µg/dm2 sample
Information
on country of
origin
PC1 PC plate 8 93 EU
PC2 PC plate 5 64 EU
PC3 PC plate 13 158 EU
K14-0009 PC glass 10 144 US
K14-0010 PC glass 7 93 Australia
DVD DVD 80 464 No
information
2008-176 PC baby bottle 13 76 Poland
2008-179 PC baby bottle 9 62 Thailand
2008-235 PC baby bottle 5 48 China
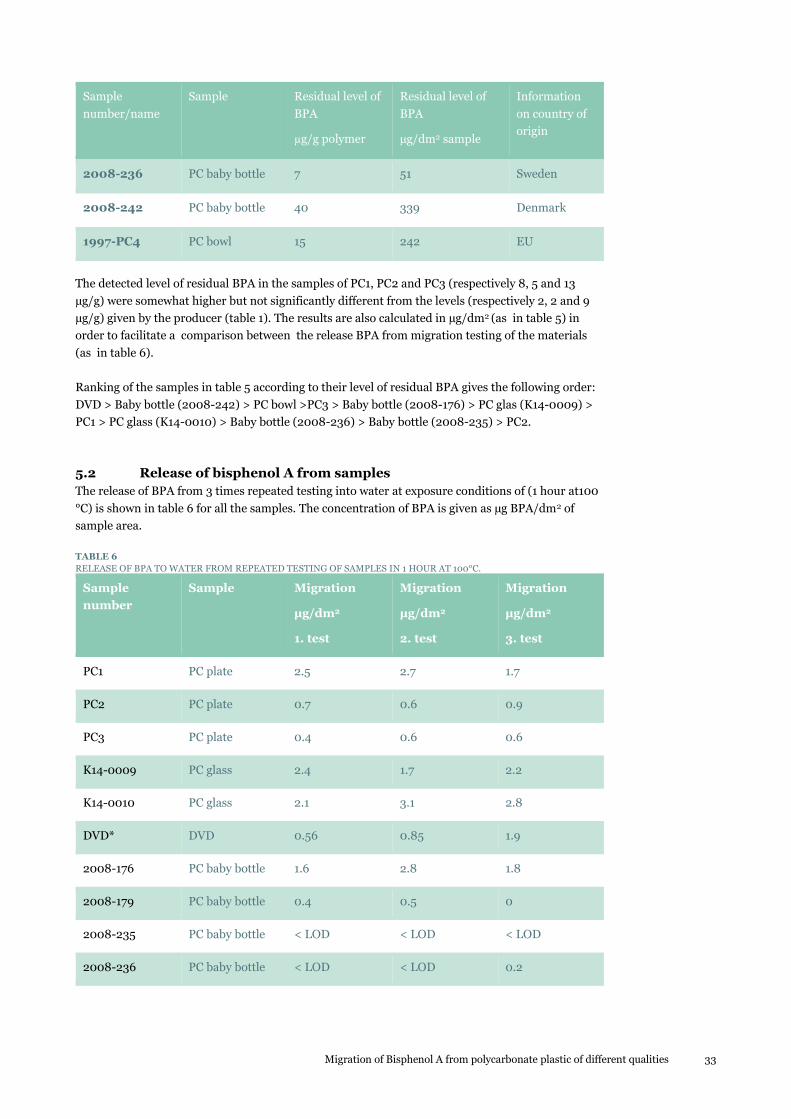
Migration of Bisphenol A from polycarbonate plastic of different qualities 33
Sample
number/name
Sample Residual level of
BPA
µg/g polymer
Residual level of
BPA
µg/dm2 sample
Information
on country of
origin
2008-236 PC baby bottle 7 51 Sweden
2008-242 PC baby bottle 40 339 Denmark
1997-PC4 PC bowl 15 242 EU
The detected level of residual BPA in the samples of PC1, PC2 and PC3 (respectively 8, 5 and 13
µg/g) were somewhat higher but not significantly different from the levels (respectively 2, 2 and 9
µg/g) given by the producer (table 1). The results are also calculated in µg/dm2 (as in table 5) in
order to facilitate a comparison between the release BPA from migration testing of the materials
(as in table 6).
Ranking of the samples in table 5 according to their level of residual BPA gives the following order:
DVD > Baby bottle (2008-242) > PC bowl >PC3 > Baby bottle (2008-176) > PC glas (K14-0009) >
PC1 > PC glass (K14-0010) > Baby bottle (2008-236) > Baby bottle (2008-235) > PC2.
5.2 Release of bisphenol A from samples
The release of BPA from 3 times repeated testing into water at exposure conditions of (1 hour at100
°C) is shown in table 6 for all the samples. The concentration of BPA is given as µg BPA/dm2 of
sample area.
TABLE 6
RELEASE OF BPA TO WATER FROM REPEATED TESTING OF SAMPLES IN 1 HOUR AT 100°C.
Sample
number
Sample Migration
µg/dm2
1. test
Migration
µg/dm2
2. test
Migration
µg/dm2
3. test
PC1 PC plate 2.5 2.7 1.7
PC2 PC plate 0.7 0.6 0.9
PC3 PC plate 0.4 0.6 0.6
K14-0009 PC glass 2.4 1.7 2.2
K14-0010 PC glass 2.1 3.1 2.8
DVD* DVD 0.56 0.85 1.9
2008-176 PC baby bottle 1.6 2.8 1.8
2008-179 PC baby bottle 0.4 0.5 0
2008-235 PC baby bottle < LOD < LOD < LOD
2008-236 PC baby bottle < LOD < LOD 0.2
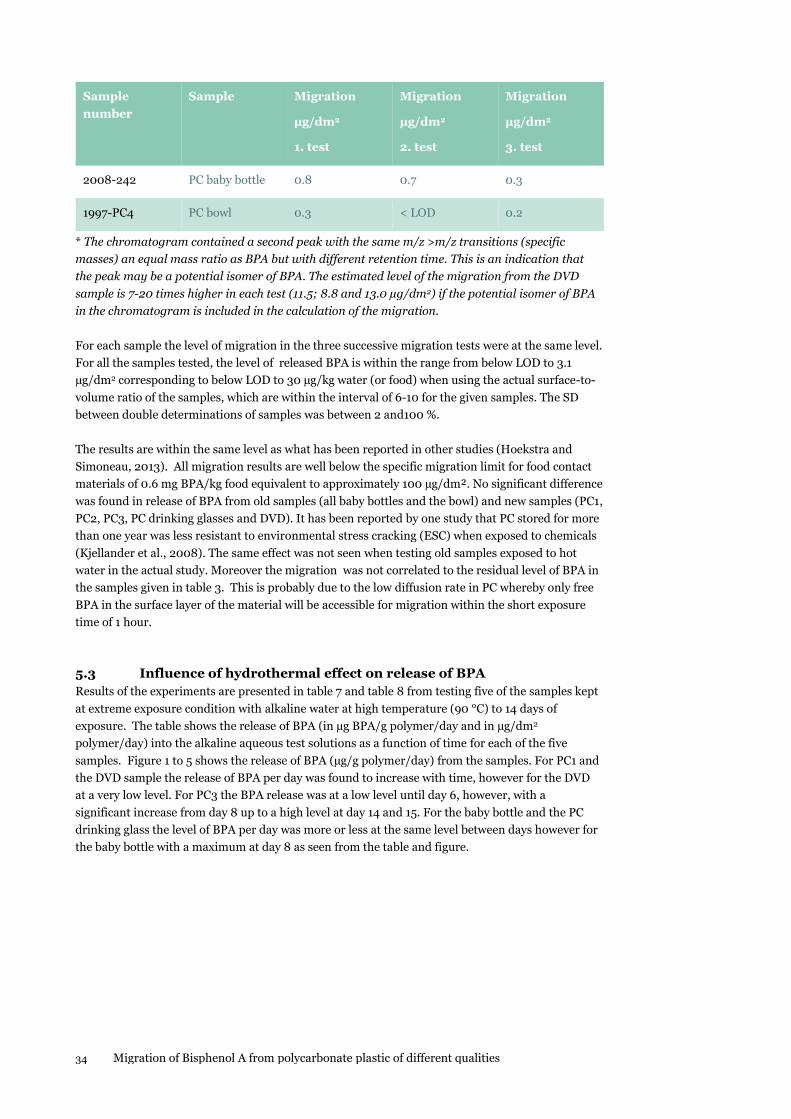
34 Migration of Bisphenol A from polycarbonate plastic of different qualities
Sample
number
Sample Migration
µg/dm2
1. test
Migration
µg/dm2
2. test
Migration
µg/dm2
3. test
2008-242 PC baby bottle 0.8 0.7 0.3
1997-PC4 PC bowl 0.3 < LOD 0.2
* The chromatogram contained a second peak with the same m/z >m/z transitions (specific
masses) an equal mass ratio as BPA but with different retention time. This is an indication that
the peak may be a potential isomer of BPA. The estimated level of the migration from the DVD
sample is 7-20 times higher in each test (11.5; 8.8 and 13.0 µg/dm2) if the potential isomer of BPA
in the chromatogram is included in the calculation of the migration.
For each sample the level of migration in the three successive migration tests were at the same level.
For all the samples tested, the level of released BPA is within the range from below LOD to 3.1
µg/dm2 corresponding to below LOD to 30 µg/kg water (or food) when using the actual surface-to-
volume ratio of the samples, which are within the interval of 6-10 for the given samples. The SD
between double determinations of samples was between 2 and100 %.
The results are within the same level as what has been reported in other studies (Hoekstra and
Simoneau, 2013). All migration results are well below the specific migration limit for food contact
materials of 0.6 mg BPA/kg food equivalent to approximately 100 µg/dm². No significant difference
was found in release of BPA from old samples (all baby bottles and the bowl) and new samples (PC1,
PC2, PC3, PC drinking glasses and DVD). It has been reported by one study that PC stored for more
than one year was less resistant to environmental stress cracking (ESC) when exposed to chemicals
(Kjellander et al., 2008). The same effect was not seen when testing old samples exposed to hot
water in the actual study. Moreover the migration was not correlated to the residual level of BPA in
the samples given in table 3. This is probably due to the low diffusion rate in PC whereby only free
BPA in the surface layer of the material will be accessible for migration within the short exposure
time of 1 hour.
5.3 Influence of hydrothermal effect on release of BPA
Results of the experiments are presented in table 7 and table 8 from testing five of the samples kept
at extreme exposure condition with alkaline water at high temperature (90 °C) to 14 days of
exposure. The table shows the release of BPA (in µg BPA/g polymer/day and in µg/dm2
polymer/day) into the alkaline aqueous test solutions as a function of time for each of the five
samples. Figure 1 to 5 shows the release of BPA (µg/g polymer/day) from the samples. For PC1 and
the DVD sample the release of BPA per day was found to increase with time, however for the DVD
at a very low level. For PC3 the BPA release was at a low level until day 6, however, with a
significant increase from day 8 up to a high level at day 14 and 15. For the baby bottle and the PC
drinking glass the level of BPA per day was more or less at the same level between days however for
the baby bottle with a maximum at day 8 as seen from the table and figure.
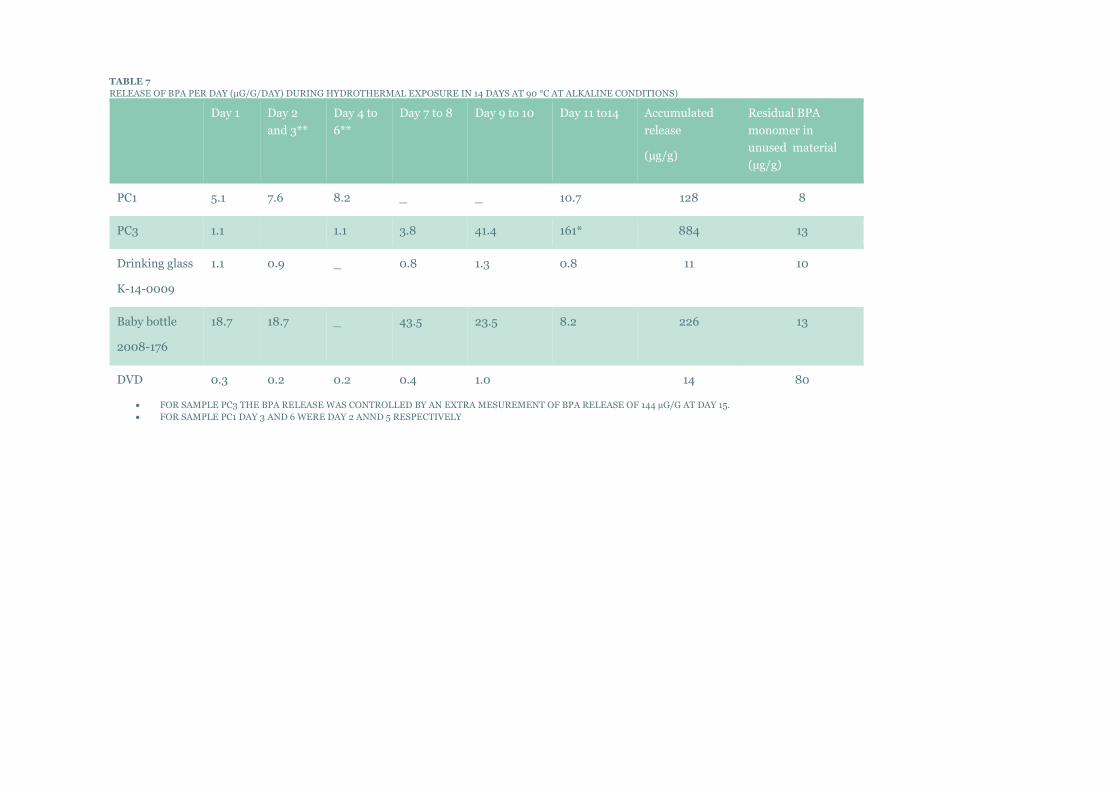
TABLE 7
RELEASE OF BPA PER DAY (µG/G/DAY) DURING HYDROTHERMAL EXPOSURE IN 14 DAYS AT 90 °C AT ALKALINE CONDITIONS)
Day 1 Day 2
and 3**
Day 4 to
6**
Day 7 to 8 Day 9 to 10 Day 11 to14 Accumulated
release
(µg/g)
Residual BPA
monomer in
unused material
(µg/g)
PC1 5.1 7.6 8.2 _ _ 10.7 128 8
PC3 1.1 1.1 3.8 41.4 161* 884 13
Drinking glass
K-14-0009
1.1
0.9 _ 0.8 1.3 0.8 11 10
Baby bottle
2008-176
18.7 18.7 _ 43.5 23.5 8.2 226 13
DVD 0.3 0.2 0.2 0.4 1.0 14 80
FOR SAMPLE PC3 THE BPA RELEASE WAS CONTROLLED BY AN EXTRA MESUREMENT OF BPA RELEASE OF 144 µG/G AT DAY 15.
FOR SAMPLE PC1 DAY 3 AND 6 WERE DAY 2 ANND 5 RESPECTIVELY
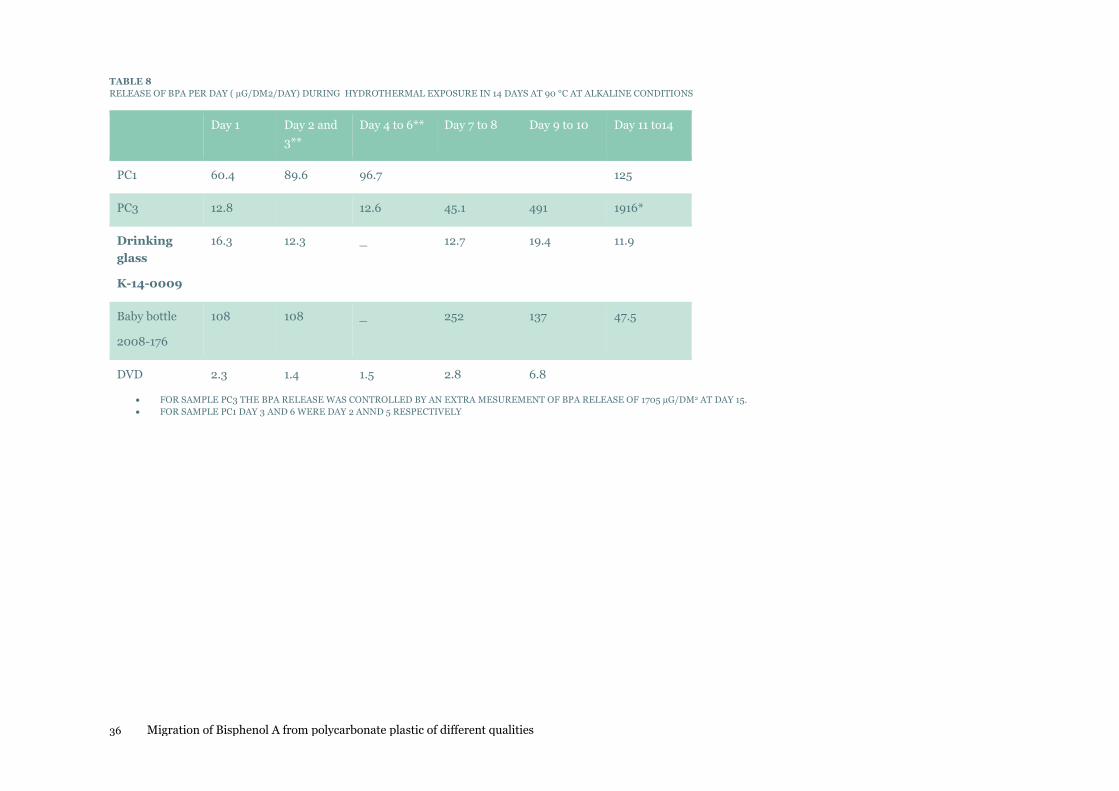
36 Migration of Bisphenol A from polycarbonate plastic of different qualities
TABLE 8
RELEASE OF BPA PER DAY ( µG/DM2/DAY) DURING HYDROTHERMAL EXPOSURE IN 14 DAYS AT 90 °C AT ALKALINE CONDITIONS
Day 1 Day 2 and
3**
Day 4 to 6** Day 7 to 8 Day 9 to 10 Day 11 to14
PC1 60.4 89.6 96.7 125
PC3 12.8 12.6 45.1 491 1916*
Drinking
glass
K-14-0009
16.3 12.3 _ 12.7 19.4 11.9
Baby bottle
2008-176
108 108 _ 252 137 47.5
DVD 2.3 1.4 1.5 2.8 6.8
FOR SAMPLE PC3 THE BPA RELEASE WAS CONTROLLED BY AN EXTRA MESUREMENT OF BPA RELEASE OF 1705 µG/DM2 AT DAY 15.
FOR SAMPLE PC1 DAY 3 AND 6 WERE DAY 2 ANND 5 RESPECTIVELY
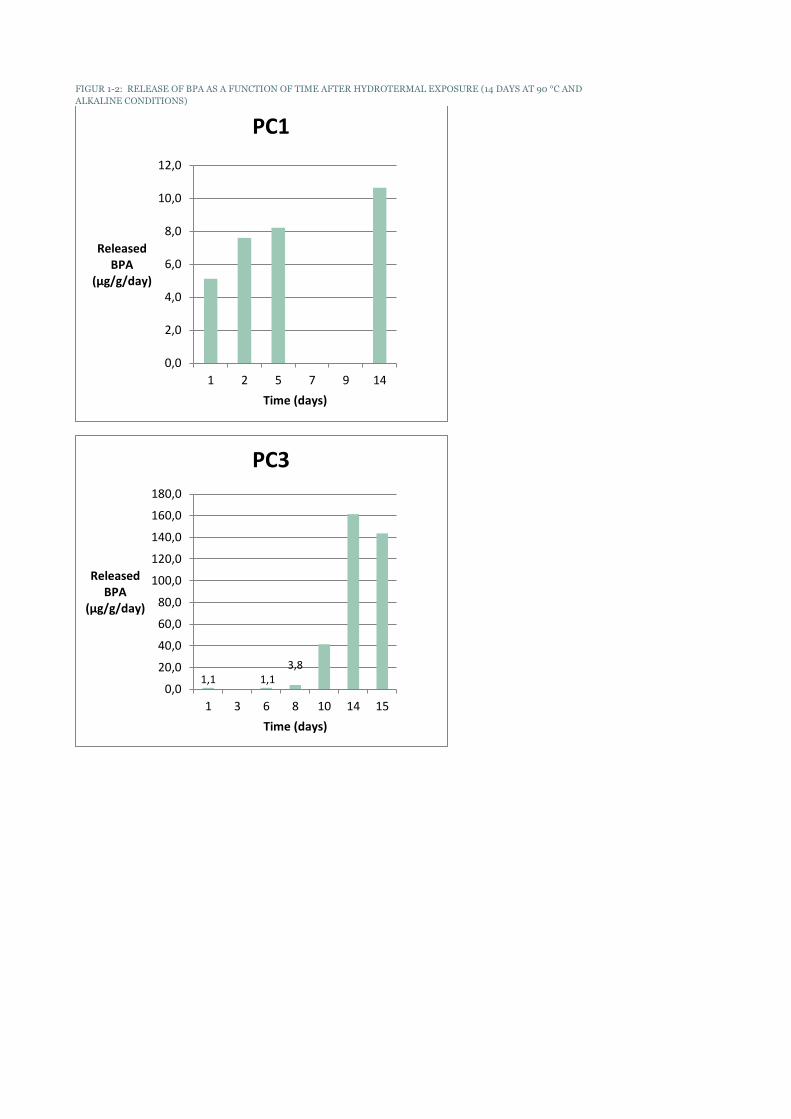
FIGUR 1-2: RELEASE OF BPA AS A FUNCTION OF TIME AFTER HYDROTERMAL EXPOSURE (14 DAYS AT 90 °C AND
ALKALINE CONDITIONS)
0,0
2,0
4,0
6,0
8,0
10,0
12,0
1 2 5 7 9 14
Released BPA
(µg/g/day)
Time (days)
PC1
1,1 1,1 3,8
0,0
20,0
40,0
60,0
80,0
100,0
120,0
140,0
160,0
180,0
1 3 6 8 10 14 15
Released BPA
(µg/g/day)
Time (days)
PC3
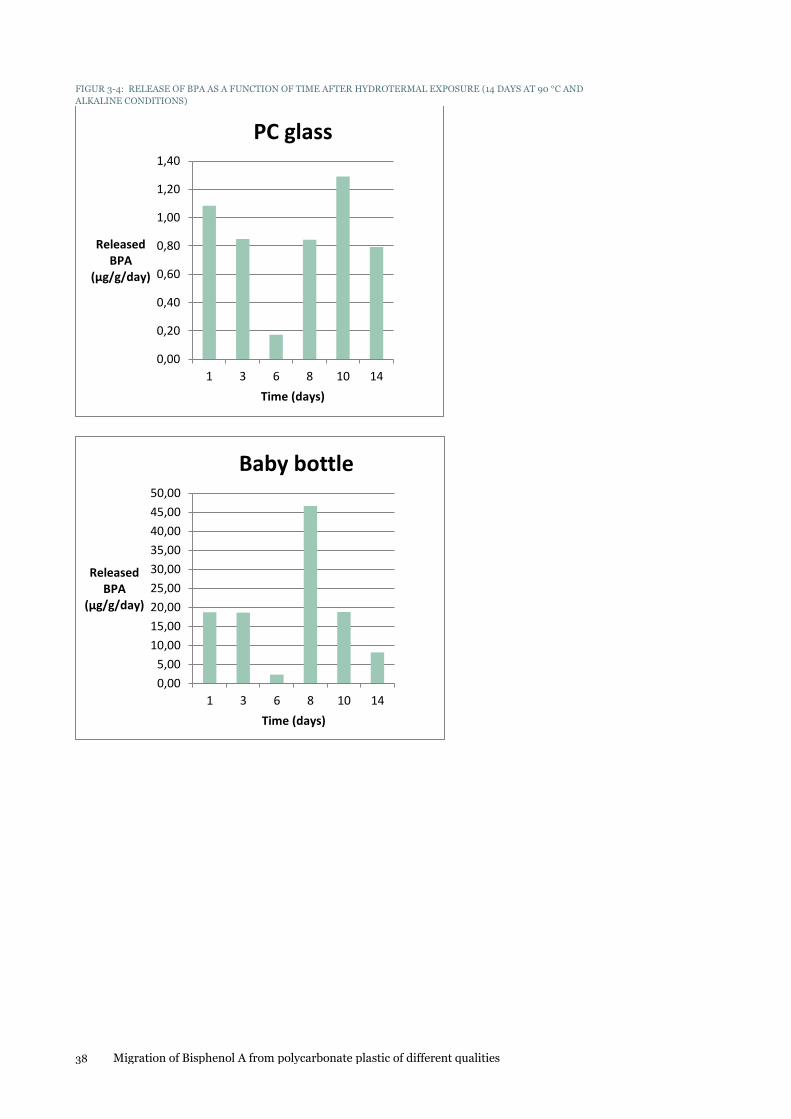
38 Migration of Bisphenol A from polycarbonate plastic of different qualities
FIGUR 3-4: RELEASE OF BPA AS A FUNCTION OF TIME AFTER HYDROTERMAL EXPOSURE (14 DAYS AT 90 °C AND
ALKALINE CONDITIONS)
0,00
0,20
0,40
0,60
0,80
1,00
1,20
1,40
1 3 6 8 10 14
Released BPA
(µg/g/day)
Time (days)
PC glass
0,00
5,00
10,00
15,00
20,00
25,00
30,00
35,00
40,00
45,00
50,00
1 3 6 8 10 14
Released BPA
(µg/g/day)
Time (days)
Baby bottle
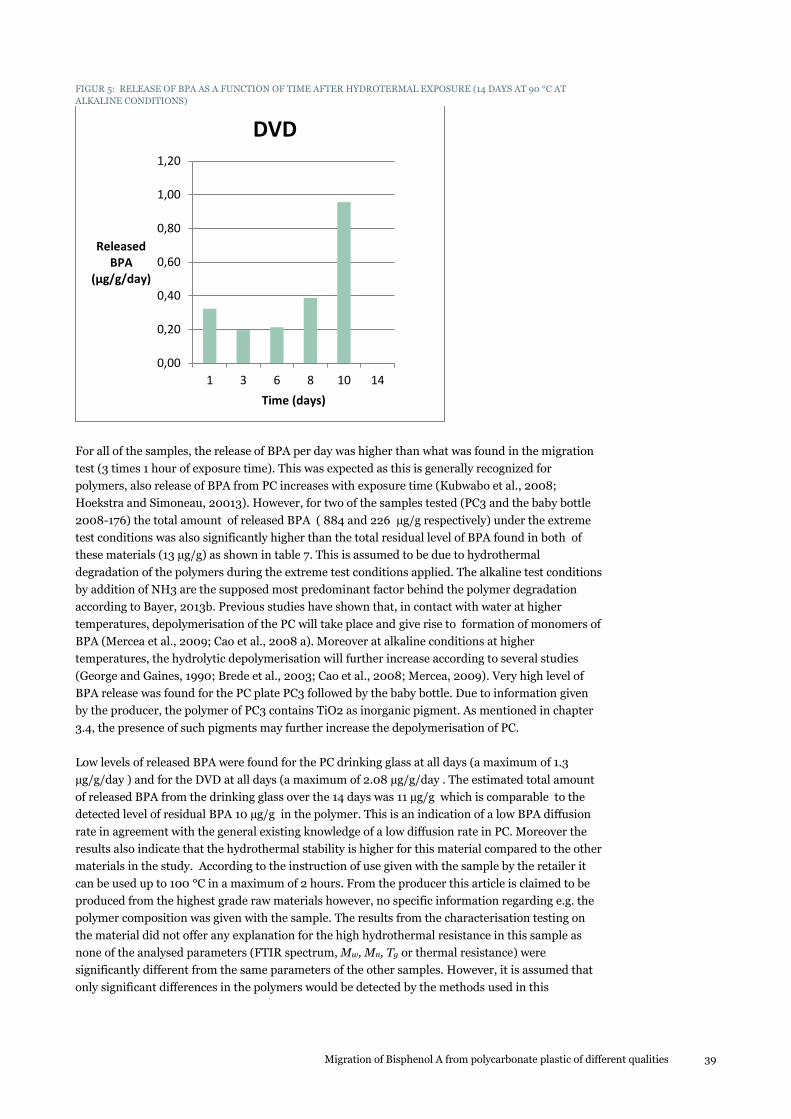
Migration of Bisphenol A from polycarbonate plastic of different qualities 39
FIGUR 5: RELEASE OF BPA AS A FUNCTION OF TIME AFTER HYDROTERMAL EXPOSURE (14 DAYS AT 90 °C AT
ALKALINE CONDITIONS)
For all of the samples, the release of BPA per day was higher than what was found in the migration
test (3 times 1 hour of exposure time). This was expected as this is generally recognized for
polymers, also release of BPA from PC increases with exposure time (Kubwabo et al., 2008;
Hoekstra and Simoneau, 20013). However, for two of the samples tested (PC3 and the baby bottle
2008-176) the total amount of released BPA ( 884 and 226 µg/g respectively) under the extreme
test conditions was also significantly higher than the total residual level of BPA found in both of
these materials (13 µg/g) as shown in table 7. This is assumed to be due to hydrothermal
degradation of the polymers during the extreme test conditions applied. The alkaline test conditions
by addition of NH3 are the supposed most predominant factor behind the polymer degradation
according to Bayer, 2013b. Previous studies have shown that, in contact with water at higher
temperatures, depolymerisation of the PC will take place and give rise to formation of monomers of
BPA (Mercea et al., 2009; Cao et al., 2008 a). Moreover at alkaline conditions at higher
temperatures, the hydrolytic depolymerisation will further increase according to several studies
(George and Gaines, 1990; Brede et al., 2003; Cao et al., 2008; Mercea, 2009). Very high level of
BPA release was found for the PC plate PC3 followed by the baby bottle. Due to information given
by the producer, the polymer of PC3 contains TiO2 as inorganic pigment. As mentioned in chapter
3.4, the presence of such pigments may further increase the depolymerisation of PC.
Low levels of released BPA were found for the PC drinking glass at all days (a maximum of 1.3
µg/g/day ) and for the DVD at all days (a maximum of 2.08 µg/g/day . The estimated total amount
of released BPA from the drinking glass over the 14 days was 11 µg/g which is comparable to the
detected level of residual BPA 10 µg/g in the polymer. This is an indication of a low BPA diffusion
rate in agreement with the general existing knowledge of a low diffusion rate in PC. Moreover the
results also indicate that the hydrothermal stability is higher for this material compared to the other
materials in the study. According to the instruction of use given with the sample by the retailer it
can be used up to 100 °C in a maximum of 2 hours. From the producer this article is claimed to be
produced from the highest grade raw materials however, no specific information regarding e.g. the
polymer composition was given with the sample. The results from the characterisation testing on
the material did not offer any explanation for the high hydrothermal resistance in this sample as
none of the analysed parameters (FTIR spectrum, Mw, Mn, Tg or thermal resistance) were
significantly different from the same parameters of the other samples. However, it is assumed that
only significant differences in the polymers would be detected by the methods used in this
0,00
0,20
0,40
0,60
0,80
1,00
1,20
1 3 6 8 10 14
Released BPA
(µg/g/day)
Time (days)
DVD
40 Migration of Bisphenol A from polycarbonate plastic of different qualities
study(Bayer, 2013b). The estimated total amount of released BPA from the DVD from 14 days of
testing was at a low level of 2.1 µg/g. The analysis by LC-MS/MS however revealed a second peak in
the LC-chromatogram eluting before BPA but with an equal mass ratio to BPA and with the same
m/z> m/z transitions. This may indicate the presence of an isomer of BPA in the DVD polymer.
According to literature BPA can exist as para/para (the common form) as well as ortho/para and
ortho/ortho isomers which are by-products in the industrial bisphenol A production (Pleshkova et
al. 1994). If this second peak is included in the calculation of released amount of BPA (as the sum of
isomers) a total release of BPA (isomers) is estimated to 10 µg/g within 14 days of test. This is at the
same level as was estimated for the PC drinking glass and significantly below the detected level of
residual BPA in the DVD polymer of 80 µg/g . This is an indication of a low BPA diffusion rate as
well as an indication of a material with a good hydrothermal stability. Again the polymer
characterisation does not offer any explanation for the high hydrothermal resistance in this sample
as the analysed parameters (FTIR spectrum, Tg or thermal resistance) were not significantly
different from the same parameters of samples with a higher level of released BPA. The level of Mw,
Mn for this sample was lower, however this is not assumed to correlate with high hydrothermal
resistance.
The characterisation of the materials after the exposure to the extreme environmental conditions
showed that the five samples all had a remarkable and significant almost 20% decrease in both
types of molecular weight (Mw and Mn) as seen from table 3. It is hypothesized that the exposure to
the extreme environmental conditions degrades the PC by lowering the molecular weights to the
same extent in all cases. However, the degradation seems to result in water soluble products (as
BPA) that can be removed from the sample surface into the aqueous test solution since the
remaining PC has the same polydispersity (Mw/Mn) as before the degradation, which implies no
accumulation of low molecular weight species that would have increased the polydispersity
significantly. In addition, no detectable effects are seen in FTIR, on Tg or on the thermal
degradation behavior. Thus we do not see any significant changes in the PC Tg after degradation.
Similarly we do not see any indication of hydrolytic degradation in our FTIR spectra as reported by
the same authors.
Ranking of the samples on the basis of the measured release of total BPA (µg/g polymer) (table 7)
gives the following order: PC3, baby bottle (2008-176) > PC1 > PC glass > DVD. The BPA release
per day for each of these samples is shown in figure 1 to 5. The very high hydrothermal resistance of
the PC glass, the DVD and also PC1 might be due to addition of some stabilisers as according to
literature (Plastteknisk Handbok, 1980; Factor, 1996) the addition of stabilisers can reduce the
hydrothermal ageing. Unfortunately there was no such information available on the chemical
composition of the samples and it was not possible within the given resources of the project to go
into identification of unknown substances in the given materials.
Migration of Bisphenol A from polycarbonate plastic of different qualities 41
6. Conclusion on the experimental part
For all samples the FTIR spectra appeared very identical and in every FTIR spectrum the most
significant absorption peaks for a bisphenol A based PC was identified.
The molecular weight values were comparable for all the samples except the DVD. Mws were in the
40,000-60,000 Da range with the associated Mns in 19,000 to 27,000 Da range. The
polydispersities (Mw/Mn) were from 1.9-2.5 which is normal for this kind of condensation type
polymers. The DVD has lower both Mw (~30,000) and Mn (~15,000).
Only small variations are seen with glass transition temperature, Tg, between the samples. Tgs seem
to scale somehow with the molecular weights such that higher MW results in a slightly higher Tg.
The levels of residual BPA in the samples were 5-80 µg/g which are in accordance with the residual
BPA levels reported by others.
The migration from all samples was within the same range and below 3.1 µg/dm2 corresponding to
< 30 µg/kg simulant, if the actual surface volume of each sample is used.
No correlation was found between the level of residual BPA and the level of BPA migration into
water (1 hour at 100°C).
The five samples that have been subjected to the extreme exposure conditions (up to 14 daysat90 °C
and pH 7.5-8)) showed:
An increase, and for three of the samples a significant increase, in the level of released BPA
compared to the migration results
The level of released BPA differs significantly between the samples
For three of the samples the total level of BPA was significantly above the residual level of
BPA indicating degradation of the polymers due to hydrothermal effect. The highest
release was seen from PC3, a TiO2 containing test sample from the industry.
Two samples (PC glass and DVD) had a very low level of BPA release indicating more
hydrothermal stable materials compared to the other samples tested
A remarkable and significant almost 20% decrease in both types of molecular weight Mw
and Mn) was seen for all the samples tested. However, no difference was seen in the
polydispersities (Mw/Mn) indicating that the degradation products are formed at the
surface of the product and removed from there into the test solution.
No correlation between Tg of the samples and the release of BPA
No significant change in Tg for samples after extreme exposure conditions into water at
high temperature.
Characterisation of samples by recorded FTIR spectra and measurements of Mw, Tg and
thermal degradation did not show significantly differences between samples. Moreover the
measured parameters did not correlate to the significant different levels of released BPA from
42 Migration of Bisphenol A from polycarbonate plastic of different qualities
the samples after extreme exposure conditions. In conclusion the applied techniques were not
adequate to predict the level of BPA release from the given samples. It is assumed that material
composition parameters and process conditions as given below have a main influence on the
stability of PC against depolymerisation:
Use of dry raw materials prior to injection molding of PC
Use of adequate process conditions such as correct temperature in the injection molding
process
Use of substances and additives of high purity in the production of PC
Special attention should be paid to amines, TiO2 and glass fibers in PC as the addition of
such substances may increase the level of residual BPA and/or release of BPA due to a
gradual decomposition of the polymer.
Migration of Bisphenol A from polycarbonate plastic of different qualities 43
References
Alin J. and M. Hakkarainen (2012). Migration from polycarbonate packaging to food simulants
during microwave heating. Polymer Degradation and Stability, 97, 1387-1395.
Al-Saidi L.F., Kell Mortensen, Kristoffer Almdal (2002). Environmental stress cracking resistance.
Behaviour of polycarbonate in different chemicals by determination of the time-dependence of
stress at constant strains. Polymer Degradation and Stability, 82, 451-461.
Arnold J.C. Environmental stress cracking initation in glassy polymers. TRIP 1996, 4 (12), 403-408.
Bayer, 2013 a. Bayer MaterialScience NAFTA - Products - Makroblend® polycarbonate/polyester
blend resin. http://www.bayermaterialsciencenafta.com/produtcs . August 2013.
Bayer, 2013 b. Private communication.
Biedermann-Brem and K. Grob (2008). Release of bisphenol A from polycarbonate baby bottles;
water hardness as the most relevant factor. Eur. Food res. Technol.,
Brandsch R., 2008. Personal communication. R. Brandsch, MDCTec Systems, Germany.
Brandsch R., 2013. Personal communication. R. Brandsch, MDCTec Systems, Germany.
Brede C., Fjeldal I., Skrevrak I, Herikstad H. (2003). Increased migration levels of bisphenol A
migration from polycarbonate baby bottles after dishwashing, boiling and brushing. Food. Addit
Contam. 20, 684-689
Cao X-L and J. Corrivaeu (2008 a). Migration of bisphenol A from polycarbonate baby and water
bottles into water under severe conditions. J. Agric Food Chem, 56, 6378-6381
Cao X-L, Corriveau J (2008 b) Determination of bisphanol A in water by isotope dilution headspace
solid phase microextraction and gas chromatography/mass spectrometry without derivatization. J.
AOAC Int, 91, 622-629.
CEN (2004). EN 13130: Guide to test methods for specific migration of substances from plastics to
food and food simulants and the determination of substances in plastics and the selection of
conditions of exposure to food simulants.
Collin S., P.-O. Bussiere, S. Therias, J.-M. Lambert. J. Perdereau, J.-L. Gardette (2012).
Physicochemical and mechanical impacts of photo-ageing on bisphenol A polycarbonate. Polymer
Degradation and Stability, 97, 2284-2293.
De Coencel N., F. David, P. Sandra (2009). Study on the migration of bisphenol A from baby bottles
by stir bar sorptive extraction-thermal desorption-capillary GC-MS. J. Sep. Sci., 32, 3829-3836.
Diepens M and P. Gijsman (2007). Photodegradation of bisphenol A polycarbonate. Polymer
Degradation and Stability, 92, 397-406.
44 Migration of Bisphenol A from polycarbonate plastic of different qualities
Diepens M. and P. Gijsman (2009). Photostabilizing of bisphenol A polycarbonate by using UV-
absorbers and self protective block copolymers based based on resorcinol poyarylate blocks.
Polymer Degradation and Stability, 94, 1808-1813.
Diepens M. and P. Gijsman (2010). Photodegradtion of bisphenol A polycarbonate with different
types of stabilizers. Polymer Degradation and Stability, 95, 811-817.
DTU National Food Institute (2013). FA 409.2: Determination of bisphenol A in food, water, food
simulants of oil and 50% ethanol and acetonitrile extracts by LC-MS/MS) using liquid
chromatography with mass specific detector, LC-MS/MS.
EFSA (2006). Opinion of the scientific panel on food additives, flavourings, processing aids and
materials in contact with food on a request from the Commision related to 2,2-bis(4-
hydroxyphenyl)propane (Bisphenol A). EFSA Journal (2006) 428, 1-75, 2006.
EFSA (2011). Scientific Opinion on polybrominated Diphenyl Ethers (PBDEs) in food. EFSA Panel
on contaminants in the food chain (CONTAM). EFSA Journal (2o11), 9 (5):2156, 4. August 2011
(page 19).
EFSA (2013). Draft Scientific Opinion on the risks to public health related to the presence of
bisphenol A (BPA) in foodstuffs –Part: exposure assessment. EFSA Panel on food contact materials,
enzymes, flavourings and processing aids. Draft for public consultation, 25 uli 2013.
EFSA (2014). Draft Scientific Opinion on the risks to public health related to the presence of
bisphenol A (BPA) in foodstuffs. EFSA Panel on food contact materials, enzymes, flavourings and
processing aids. Draft for public consultation, January 2014.
Ehlerts K.A., C.W.E. Beumer and M.C.E. Groot (2008). Migration af bisphenol A into water from
baby bottles during microwave heating. Food Additives and Contaminants, 25, 7, 904-910.
EU, 2011. Commission Regulation (EU) No 10/2011: Commission Regulation on plastic materials
and articles intended to come into contact with food, January 2011.
EU, 2011b Commission directive EU No 65/2011 of the European parliament and of the councilon
the restriction of the use of certain hazardous substances in electrical and electronic equipment.
June 2011
EU. 2014. Commission Directive (EU) 2014/81 amending Appendix C of Annex II to Directive (EU)
2009/48 of the European Parliament and of the Council on the safety of toys, as regards bisphenol
A, June 2014.
Factor A. (1996). Mechanisms of Thermal and Photodegradations of Bisphenol A Polycarbonate.
Advances in Chemistry, Vol. 249, p 59-76.
Flory, P. J., Principles of Polymer Chemistry, Cornell University Press, Ithaca, N.Y., 1953, Chaps. 3,
8, and 9.
Hoekstra E. J. and C. Simoneau (2013). Release of bisphenol A from polycarbonate – A review.
Critical review in food science and nutrition, 53, 386-402.
Howdeshell K.L., P. H. Peterman, B. M. Judy, J.A. Taylor, C. E. Orazio, R. L. Ruhlen, F. S. vom Saal
and W. V. Welshons (2003). Bisphenol A is released from used polycarbonate animal cages into
water at room temperature. Environmental Health Perspectives, 111, 9, 1180-87.
Migration of Bisphenol A from polycarbonate plastic of different qualities 45
Huang Y. S. Liu and Z. Pan (2011). Effects of plastic additives on depolymerisation of polycarbonate
in sub-critical water. Polymer Degradation and Stability, 96, 1405-1410.
Hummel, D.O. (1988). Hummel/Scholl, Atlas of Polymer and Plastics Analysis, Vol. .2, Part b/I
Text. VCH Publishers, New York. p 372.
Jiang W. and Tjong S.C. (1999). Thermal stability of polycarbonate composites reinforced with
potassium titanate whiskers: effect of coupling agent addition. Polymer Degradation and Stability,
66, 241-246.
Kubwabo C., I. Kosarac, B. Stewart, B. R. Gauthier, K. Lalonde and P.J. Lalonde (2009). Migration
of bisphenol A from plastic baby bottle, baby bottle liners and reusable polycarbonate drinking
bottles. Food Additives and Contaminants, 26, 6, 928-937.
Kjellenader C. K., T. B. Nielsen, A. Ghanbari-Siahkali, P. Kingshott , C. M. Hansen, K. Almdal (2008). ESC resistance of commercial grade polycarbonates during exposure to butter and related chemicals. Polymer Degradation and Stability 93, 1486–1495.
Le H. H, E. M. Carlson, J.P. Chua and S. M. Belcher (2008). Bisphenol A is released from
polycarbonate drinking bottles and mimics the neurotoxic actions of estrogen in developing
cerebellar neurons. Toxicology Letter, 176, 149-156.
Levchik, S. V., E. D. Weil (2006). Flame retardants in commercial use or in advanced development
in polycarbonates and polycarbonate blends. J. Fire Sciences, 24:137-151.
Maia J., J.M: Cruz, R. Sendon , J. Bustos, J.J. Sanchez, P. Paseiro (2009). Effect of detergents in
the release of bisphenol A from polycarbonate baby bottles. Food Research International, 42, 1410-
1414.
Maragou N.C., A. Makri, E.N. Lampi, N. S. Thomaidis and M. A. Koupparis (2008). Migration of
bisphenol A from polycarbonate bottles under real use conditions. Food Additives and
Contaminants, 25, 3, 373-383.
Mercea P. (2009). Physicochemical processes involved in migration of bisphenol A from
polycarbonate. Journal of Applied Polymer Science, 112, 579-593.
Mountfort K. A., J. Kelly, S. M. Jickells and L. Castle (1997). Investigations into the potential
degradation of polycarbonate baby bottles during sterilization with consequent release of bisphenol
A. Food Additives and Contaminants, 14, no 6-7 ,737-740
Nam S-H, Y-M Seo and M-G Kim (2010). Bisphenol A migration from polycarbonate baby bottles
with repeated use. Chemosphere, 79, 949-952.
Piringer O.G. and Baner A.L. (eds), 2008, Plastic packaging, 2. edition, Wiley-VCH Verlag GmbH &
Co. KGaA Weinheim, Tyskland. ISBN 978-3-527-31455-3.
Plastteknisk Handbok (1980). Perstorpboken. Maskinaktiebolaget Karlebo and Perstorp AB,
Stockholm, 3. udgave, ISBN 91-85026-28-X.
Pleshkova A. P., Marina N. Uspenskaya and S. V. Volkovitch (1994). The Ortho effects in the mass
spectra of ortho/para isomers of bisphenol A derivatives and related compounds. Organic mass
spectrometry, vol. 29, 26-29.
Plast og Gummi Ståbi (1992). Teknisk Forlag A/S, Denmark
46 Migration of Bisphenol A from polycarbonate plastic of different qualities
PlasticEurope (2010). http://www.bisphenol-a-europe.org/.Information provided by by
PlasticsEurope's PC/BPA-group.
Santillana M.I., E. Ruiz, M.T. Nieto, J. Bustos, J. Maia, R. Sendon and J.J. Sanchez ( 2011).
Migration of bisphenol A from polycarbonate baby bottles purchased at the Spanish market by
liquid chromatography and fluorescence detection. Food Additives and Contaminants, 28, 11, 10-
1618.
Saron C., Fabio Zulli, Marco Giordano, Maria Isabel Felisberti (2006). Influence of copper-
phthalocyanine on the photodegradation of polycarbonate. Polymer Degradation and Stability 91,
3301-3311.
Saron C. and M.I. Felisberti (2009). Influeencia de colorantes na degradacao termo-oxidative do
policarbonato. Revista Materia, 14, 3, 1028-1038. (Abstract in English).
Simoneau C., S. Vazacchi, V. Morkunas and L. van den Eede (2011). Comparison of migration from
polyethersulphone and polycarbonate baby bottles. Food Additives and Contaminants, 28, 12, 1763-
1768.
Stevens, M. P., Polymer Chemistry – An introduction, Oxford University Press, New York, 1999 3rd
Ed., Chap. 10.
Zhou W, Yang H. and Zhou J. (2007). The thermal degradation of bisphenol A polycarbonate
containing methylphenyl-silicone additive. J. Anal. Appl. Pyrolysis, 78, 413-418.
Zweifel, H. (2001). Plastics Additives Handbook, Hanser Gardner Publications, Ohio, USA, ISBN 1-
56990-295-X.
Migration of Bisphenol A from polycarbonate plastic of different qualities 47
7. Annex
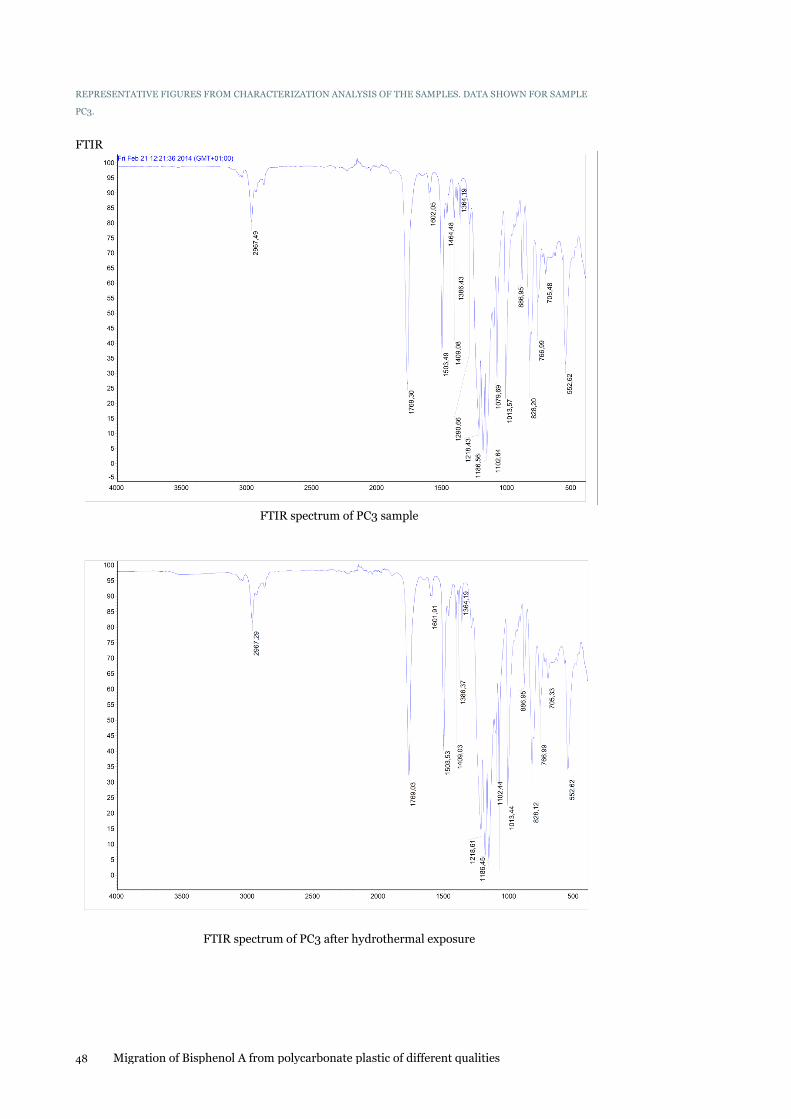
48 Migration of Bisphenol A from polycarbonate plastic of different qualities
REPRESENTATIVE FIGURES FROM CHARACTERIZATION ANALYSIS OF THE SAMPLES. DATA SHOWN FOR SAMPLE
PC3.
FTIR
FTIR spectrum of PC3 sample
FTIR spectrum of PC3 after hydrothermal exposure
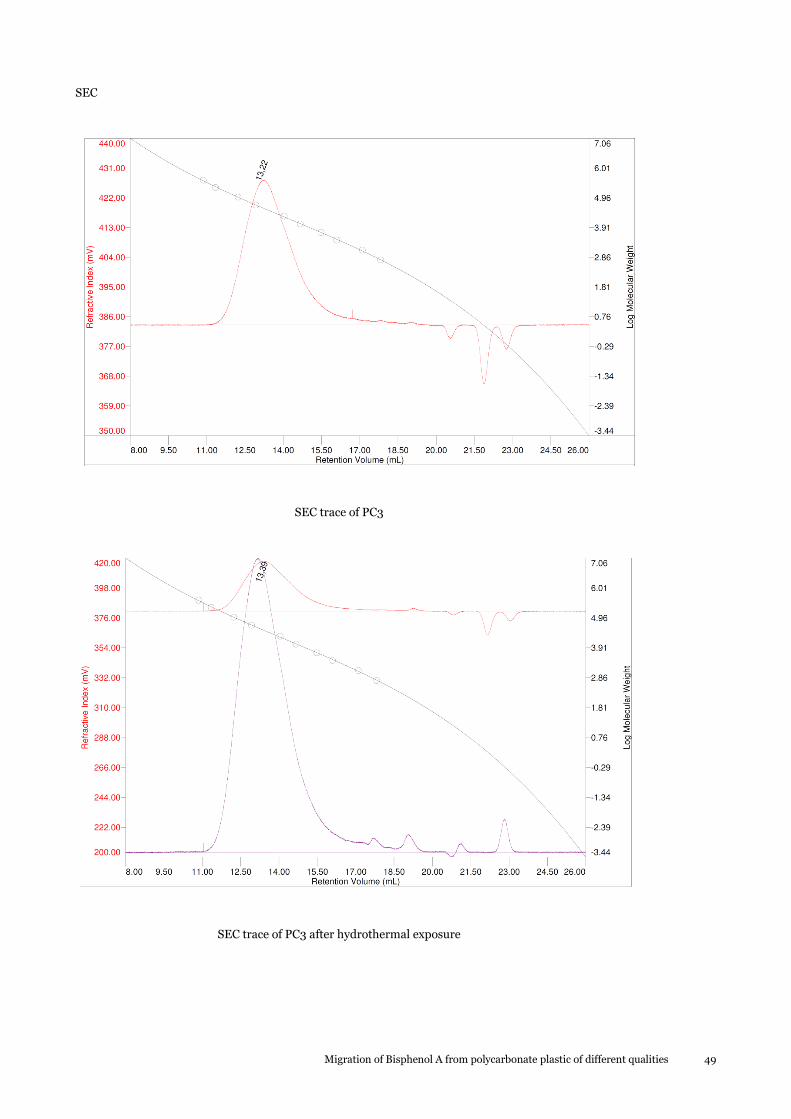
Migration of Bisphenol A from polycarbonate plastic of different qualities 49
SEC
SEC trace of PC3
SEC trace of PC3 after hydrothermal exposure
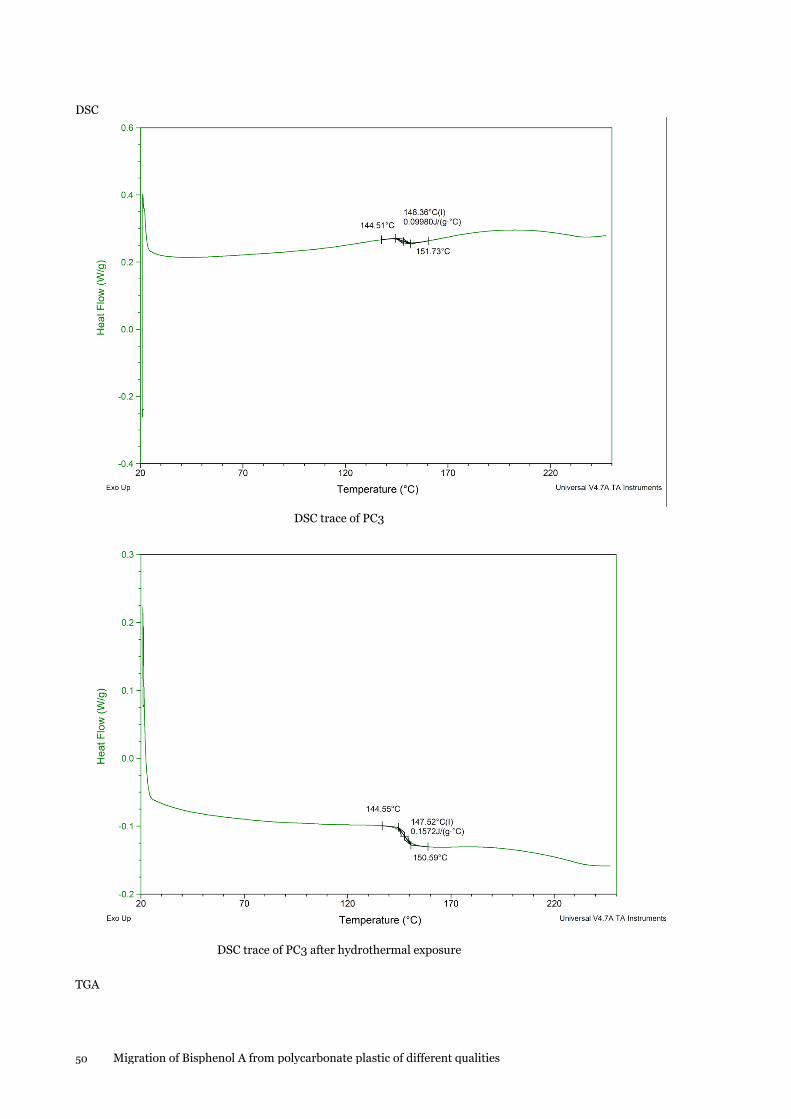
50 Migration of Bisphenol A from polycarbonate plastic of different qualities
DSC
DSC trace of PC3
DSC trace of PC3 after hydrothermal exposure
TGA
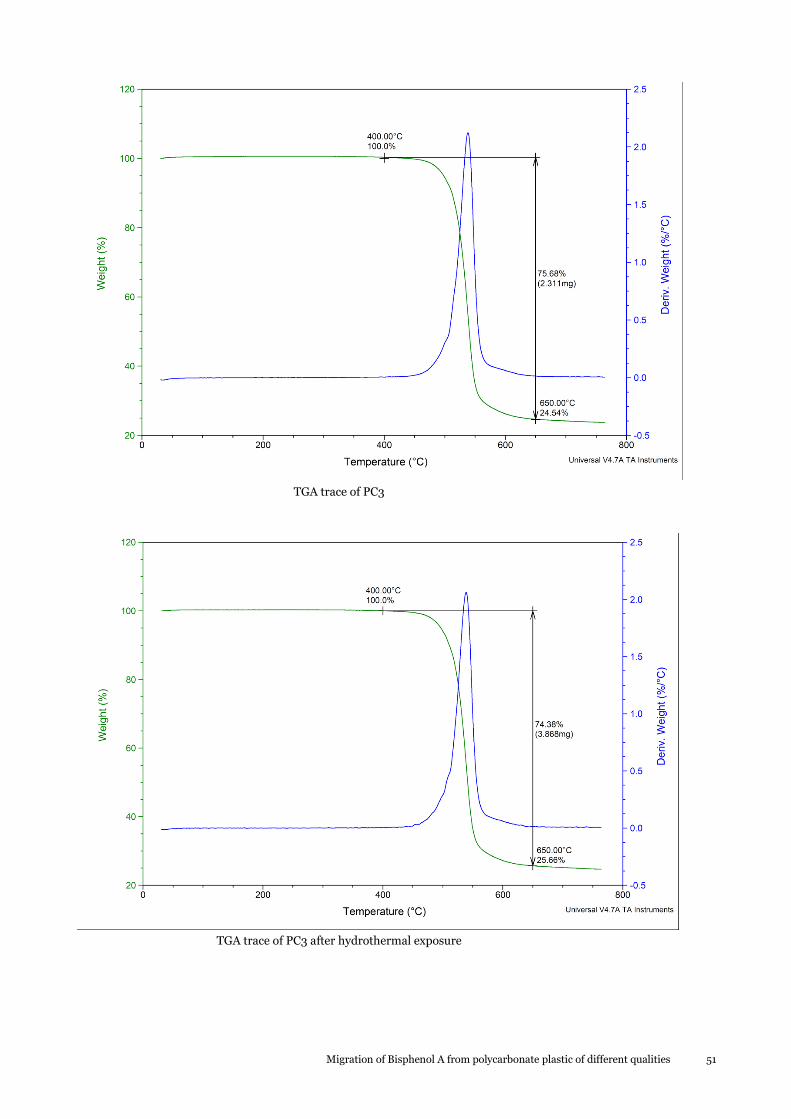
Migration of Bisphenol A from polycarbonate plastic of different qualities 51
TGA trace of PC3
TGA trace of PC3 after hydrothermal exposure
Strandgade 29
1401 Copenhagen K, Denmark
Tel.: (+45) 72 54 40 00
www.mst.dk
Migration of bisphenol A from polycarbonate plastic of different
qualities
Undersøgelsen omfatter en gennemgang af litteratur og tilgængelige oplysninger fra industrien om
frigivelse af bisphenol A fra polycarbonat og de parametre, der påvirker denne afgivelse. Desuden blev
forskellige prøver af polycarbonat karakteriseret og analyseret for at undersøge den potentielle
sammenhæng mellem materiale-specifikke parametre og afgivelsen af bisphenol A. Ud fra informationer
fra industrien kan det konkluderes, at for at reducere fotonedbrydning og hydrotermisk nedbrydning af
polymeren mest muligt, bør der anvendes meget rene udgangsstoffer, herunder tilsætningsstoffer, ved
fremstilling af polycarbonat til alle formål. Der er ikke i projektet fundet specifikke oplysninger om
additiver, der ved tilsætning til polycarbonat, kunne forbedre den hydrolytiske stabilitet af polymeren.
The study covers a review of literature and available industry information regarding release of bisphenol
A from polycarbonate and the parameters affecting this bisphenol A release. Moreover in part two of the
study, different samples of polycarbonate was characterised and analysed in order to examine the
potential correlation between material specific parameters and the release of bisphenol A. It is
concluded, from industry information, that only highly pure reagent grade chemicals, including
additives, should be used for all polycarbonate grades to reduce photodegradation and hydrothermal
degradation of the polymer. No specific information was found about additives known to improve the
hydrolytic stability of polycarbonate.


![Bisphenol A Diglycidyl Ether of Bisphenol A Method · PDF file4 of 18 Diglycidyl Ether of Bisphenol A13 synonyms: 2,2-bis[4-(glycidyloxy)phenyl]propane, 4,4′-isopropylidenediphenol](https://img.pdfslide.net/doc/110x75/5a76e9947f8b9a93088d7abf/bisphenol-a-diglycidyl-ether-of-bisphenol-a-method-4-of-18-diglycidyl-ether.jpg)