Embed Size (px)
Citation preview

MIGRATION OF LABOUR IN MALAYSIA

INTRODUCTIONDefinition of Migration : It refers to directed, regular, or
systematic movement of a group of objects, organisms, or people
Migration of Labour : Cross-border movement for purposes of employment. Migration involves the (more or less) permanent movement of individuals or groups across symbolic or political boundaries into new residential areas and communities.
Classification of Migrations: Internal or international and as voluntary or forced.
Migration in Islam : called as ‘Hijrah’ is the migration of the and his followers to the city of Medina. Hijrah can also signify striking off on a new path that allows one to become a better person. A person who has committed acts considered sinful might make the Hijrah to a life free of sin. Thus the Hijrah can be either a physical or spiritual migration.

HISTORICAL VIEW ON GLOBAL MIGRATION
Historical migration of human populations begins with the movement of Homo erectus out of Africa across Eurasia about a million years ago. Homo sapiens appear to have occupied all of Africa about 150,000 years ago, moved out of Africa 70,000 years ago, and had spread across Australia, Asia, and Europe by 40,000 years BCE.
Migration to the Americas took place 20,000 to 15,000 years ago, and by 2,000 years ago, most of the Pacific Islands were colonized. Almost 60 million European crossed the Atlantic in the period 1846-1940 to settle in the America.

MIGRATION IN MALAYSIA Historical background of Labour Force
- Dasar Pecah dan Perintah during British colonization:
a) Malay-agricultures
b)Chinese-mining
c) Indian-estate
- Industrial revolution era in Malaysia took place over agriculture in 1960 through New Economic Policy
Types of migration
a)Internal-urban-urban, urban-rural, rural-urban, rural-rural
b)inter state
c) International
- Migration of Malaysians to foreign countries - 785,000 (2010)
- Migration of foreign workers to our country - 1.8 million (2010)

REASONS FOR MIGRATION Voluntary
- Economic-country’s wealth, broader empire, rural-urban, less developed state t0 developed state
- Political-stability in Malaysia
- Social-similar culture like Indonesia
- Demography
- They have relatives in the migrant country
Forced
- British, Portugese and German colonization during 15th centuries
- Life pressure
- Political instability
- Wages very low
- Less job

Number and percentage distribution of population aged 1 year and over by migration status, Malaysia, 2007 (Source : Department of Statistics)
Migration status Number Percent
Total
Migrants
Internal state migrants
Inter-state migrants
International migrants
Non-migrants
26,043,870
434,510
220,940
142,760
70,810
25,609,360
100.0
1.7
50.8
32.9
16.3
98.3
STATISTICS ON MIGRANTS

Migration status Year
Total
Non-migrant
Migrant
2003 2007
100.0
96.4
3.6
100.0
98.3
1.7
Migrants
Internal state migrant
Inter-state migrant
International migrant
100.0
50.0
35.4
14.6
100.0
50.8
32.9
16.3
Number and percentage distribution of population aged 1 year and over by migration status, Malaysia, 2007 (Source : Department of Statistics)

Migration Direction
Total Male Female
Internal migrants
Urban-Urban
Urban-Rural
Rural-Urban
Rural-Rural
N0n-migrants
Urban
Rural
66.3
66.2
60.7
68.5
61.1
59.1
84.6
84.0
85.8
90.5
76.1
78.0
49.2
46.7
37.4
42.4
46.0
39.3
Labour Force Participation rates of internal migrants and non-migrants by migration direction (stratum) and sex, Malaysia, 2007 (Source : Department of Statistics)

Percentage distribution of employed internal migrants and non-migrants by employment status, Malaysia, 2007, (Source : Department of Statistics)
Employment Status Internal migrants
Non-migrants
Total
Employer
Employee
Own account worker
Unpaid family worker
100.0
1.9
21.1
70.8
6.2
100.0
3.5
13.5
64.8
18.2

Labour force participation rates of internal migrants and non-migrants by age group and sex, Malaysia, 2007
Age group Internal Migrants N0n-migrants
Total Male Female Total Male Female
Total
15-24
25-34
35-44
45-64
66.5
51.7
77.6
79.9
70.5
86.3
69.8
96.8
98.8
89.2
46.8
37.2
61.0
47.6
36.6
63.1
41.2
80.2
76.0
61.7
79.4
48.5
96.8
97.9
83.4
46.4
33.7
63.3
53.6
39.0

Percentage distribution of employed internal migrants and non-migrants by industry, Malaysia, 2007(Source : Department of Statistics)
Industry Internal migrants
Non-migrants
Total
Agriculture, hunting and forestry
Fishing
Mining and quarrying
Manufacturing
Electricity, gas and water supply
Construction
Wholesale and retail trade, repair of motor vehicles, motorcycle and personal household goods
Hotels and restaurants
Transport, storage and communication
Financial intermediation
Real estate, renting and business activities
Public administration and defense, compulsory social security
Education
Health and social work
Other community, social and personal activities
Private households with employed persons
Extra-territorial organisations and bodies
100.0
8.6
0.6
0.6
16-7
1.1
14.0
11.8
7.0
4.1
2.0
5.3
10.3
9.6
3.9
2.9
1.5
0.0
100.0
13.2
1.1
0.4
18.9
0.6
8.8
16.5
7.2
5.1
2.7
5.4
6.7
6.0
2.2
2.5
2.5
0.0

Percentage distribution of employed internal migrants and non-migrants by occupations, Malaysia, 2007 (Source : Department of Statistics)
Occupation Internal Migrants Non-migrants
Total
Legislators, senior officials and managers
Professionals
Technicians and associate professionals
Clerical workers
Service workers and shop and market sales workers
Skilled agricultural and fishery workers
Craft and related trades workers
Plant and machine-operators and assemblers
Elementary occupations
100.0
4.9
9.0
19.1
8.9
14.5
6.3
12.1
13.2
11.9
100.0
7.2
5.8
13.3
10.0
16.2
12.6
10.6
13.0
11.4

STATISTICS OF FOREIGN WORKER IN MALAYSIA
WARGANEGARA
SEKTORPEMBANTU
RUMAH PEMBINAAN PEMBUATAN PERKHIDMATAN PERLADANGANPERTANIA
NJUMLAH BESAR
INDONESIA 203,225 192,789 198,643 38,684 202,156 82,435 917,932BANGLADESH 18 61,303 170,332 27,002 30,599 18,112 307,366NEPAL 84 3,785 135,764 26,901 1,621 7,655 175,810MYANMAR 118 13,542 92,135 22,654 2,211 9,600 140,260INDIA 236 5,002 13,866 47,021 16,675 30,997 113,797VIETNAM 901 3,021 68,433 2,018 28 441 74,842FILIPINA 9,657 1,031 1,915 2,944 1,489 1,604 18,640PAKISTAN 11 5,922 2,217 1,593 1,244 12,002 22,989THAILAND 346 811 893 4,588 57 407 7,102CAMBODIA 9,166 92 2,353 218 137 125 12,091CHINA 15 1,303 935 6,592 36 13 8,894SRI LANKA 753 69 1,382 665 128 417 3,414LAOS 2 7 16 3 1 28 57UZBEKISTAN 0 0 0 4 0 0 4KAZAKHSTAN 1 0 0 0 0 0 1LAIN-LAIN 11 45 2 3 0 0 61
JUMLAH 224,544 288,722 688,886 180,890 256,382 163,836 1,803,260
Statistics PLKS by Citizenship and Sector, Feb 2010 (Source: Immigration Department)
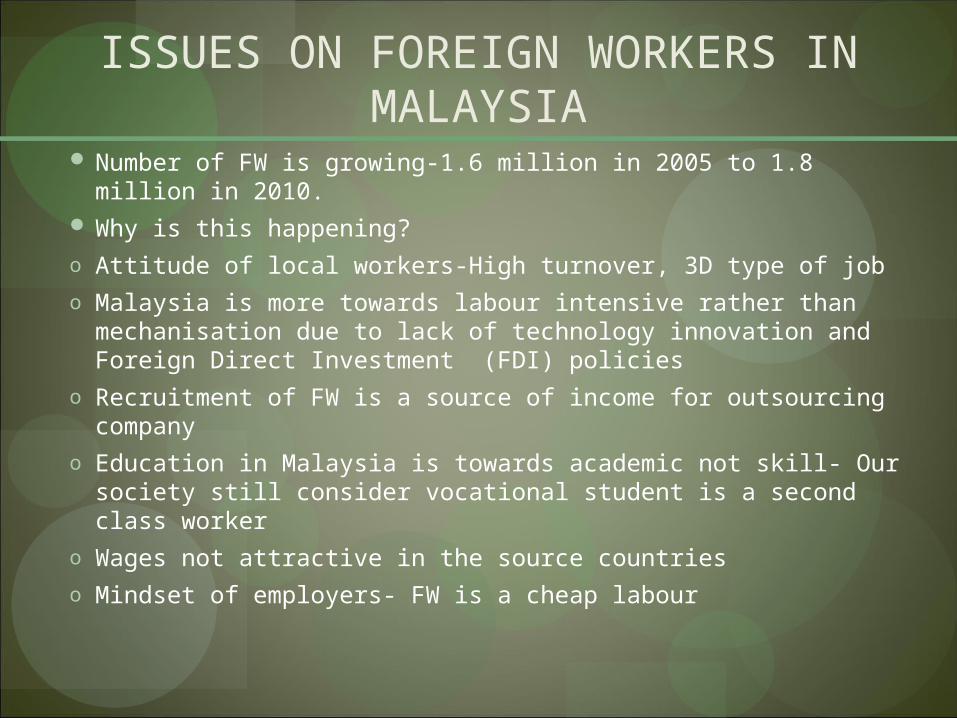
ISSUES ON FOREIGN WORKERS IN MALAYSIA
Number of FW is growing-1.6 million in 2005 to 1.8 million in 2010. Why is this happening?o Attitude of local workers-High turnover, 3D type of jobo Malaysia is more towards labour intensive rather than mechanisation
due to lack of technology innovation and Foreign Direct Investment (FDI) policies
o Recruitment of FW is a source of income for outsourcing companyo Education in Malaysia is towards academic not skill- Our society still
consider vocational student is a second class workero Wages not attractive in the source countrieso Mindset of employers- FW is a cheap labour

RECOMMENDATION AND CONCLUSION
10 years prediction on number of FW
-Data from union is needed
Change to mechanisation in plantation and construction sector
Cooperation from all parties to create a dynamic, committed, knowledgeable and competitive worker to face globalisation era. Have to change their mindset
Rebranding of post title – For example: driver to machine handler