Embed Size (px)
Citation preview
Centre for Research and Analysis of Migration
Department of Economics, University College London Drayton House, 30 Gordon Street, London WC1H 0AX
Discussion Paper Series
CDP No 12/11
Migration Paradigm Shifts and Transformation of Migrant Communities: The Case of Dutch Kiwis
Suzan van der Pas and Jacques Poot
Centre for Research and Analysis of Migration Department of Economics, Drayton House, 30 Gordon Street, London WC1H 0AX
Telephone Number: +44 (0)20 7679 5888 Facsimile Number: +44 (0)20 7679 1068
CReAM Discussion Paper No 12/11
Migration Paradigm Shifts and Transformation of
Migrant Communities: The Case of Dutch Kiwis
Suzan van der Pas* and Jacques Poot†
* VU University Medical Center, EMGO Institute – LASA
† National Institute of Demographic and Economic Analysis, University of Waikato
Non-Technical Abstract
This paper explores the dynamics of Dutch community change in New Zealand since 1950. The Netherlands has been the largest source country of migrants from continental Europe to New Zealand, but by 2006 40 percent of the Netherlands born were aged 65 or older. We find that there are three distinct cohorts of these migrants, each covering roughly 20 years of arrivals: a large cohort of post-war migrants (those who arrived in the 1950s and 1960s), and much smaller cohorts of skilled migrants (those who arrived in the 1970s and 1980s), and transnational professionals (those who arrived in the 1990s or more recently). Early migrants were mostly younger arrival, more religious, less educated and had more children than the subsequent cohorts. More recent migrants are increasingly highly qualified and in high-skill occupations. “Dutch Kiwis” are more geographically dispersed than other immigrants, and more recent arrivals are relatively more often located in rural areas. This transformation of the Dutch community in New Zealand can be linked to global and New Zealand/Netherlands specific changes that have conditioned the character and volume of the migrant flows and the dynamics of migrant community development.
Keywords: globalisation, push and pull factors of migration, ageing of migrant
communities, migrant integration, cohort analysis
JEL Classification: F22, J61, Z13
i
Migration Paradigm Shifts and Transformation of
Migrant Communities: The Case of Dutch Kiwis
Suzan van der Pas1
Jacques Poot2
Abstract
This paper explores the dynamics of Dutch community change in New Zealand since
1950. The Netherlands has been the largest source country of migrants from
continental Europe to New Zealand, but by 2006 40 percent of the Netherlands born
were aged 65 or older. We find that there are three distinct cohorts of these migrants,
each covering roughly 20 years of arrivals: a large cohort of post-war migrants (those
who arrived in the 1950s and 1960s), and much smaller cohorts of skilled migrants
(those who arrived in the 1970s and 1980s), and transnational professionals (those
who arrived in the 1990s or more recently). Early migrants were mostly younger on
arrival, more religious, less educated and had more children than the subsequent
cohorts. More recent migrants are increasingly highly qualified and in high-skill
occupations. “Dutch Kiwis” are more geographically dispersed than other immigrants,
and more recent arrivals are relatively more often located in rural areas. This
transformation of the Dutch community in New Zealand can be linked to global and
New Zealand/Netherlands specific changes that have conditioned the character and
volume of the migrant flows and the dynamics of migrant community development.
Keywords: globalisation, push and pull factors of migration, ageing of migrant
communities, migrant integration, cohort analysis
JEL Classification: F22, J61, Z13
3 June 2011
Acknowledgements This paper is part of the 2007-2012 Integration of Immigrants research programme funded by FRST
grant MAUX0605. We are grateful for comments on earlier versions of this paper from conference
participants at: 12th
International Metropolis Conference, 8-12 October 2007, Melbourne; New Zealand
Association of Gerontology Conference, 14-16 November 2007, Hamilton; National Dutch Forum
“Onze Hoe Wie”, 25 October 2008, Hamilton; and Population Association of New Zealand Conference,
31 August – 1 September 2009, Wellington. Annik Voelke provided research assistance over the
2007/08 summer.
1 VU University Medical Center, EMGO Institute – LASA, Van der Boechorststraat 7, 1081 BT
Amsterdam, The Netherlands. Email: [email protected] 2 National Institute of Demographic and Economic Analysis, University of Waikato, Private Bag 3105,
Hamilton 3240, New Zealand. Email: [email protected]
ii
Table of Contents
Abstract ......................................................................................................................... i
Acknowledgements ...................................................................................................................... i
Table of Contents ....................................................................................................................... ii
List of Figures ....................................................................................................................... ii
List of Tables ....................................................................................................................... ii
1. Introduction ....................................................................................................................... 1
2. The history of Dutch migration to New Zealand ............................................................... 3
3. Enumeration of the Dutch community ............................................................................ 10
4. Three cohorts: a typology ................................................................................................ 14
5. Conclusion ...................................................................................................................... 21
References ...................................................................................................................... 23
List of Figures
Figure 1. Dutch migration to New Zealand .......................................................................... 26
Figure 2. New Zealand student permits, work permits and permanent residence
issued to Dutch citizens, June years 1997/98–2006/07 ........................................ 27
Figure 3. The Netherlands-born population in New Zealand, 1874–2006 ........................... 28
Figure 4. The Netherlands-born population in New Zealand by age group, 1966-
2006... .................................................................................................................... 29
Figure 5. Dutch ethnicity by place of birth, 2006 ................................................................ 30
Figure 6. Dutch ethnicity and age by place of birth, 2006 ................................................... 31
Figure 7. New Zealand residents who can speak the Dutch language by age group,
1996, 2006 ............................................................................................................. 32
Figure 8. Age at arrival (% distribution) by arrival cohort: Dutch ethnicity and
other ethnicities ..................................................................................................... 33
Figure 9. Geographic dispersion of the Dutch ethnic group relative to other ethnic
groups by territorial authority by period of arrival ............................................... 34
List of Tables
Table 1. Dutch work permit holders who gained permanent residence .............................. 35
Table 2. Foreign-born population of New Zealand: the twenty largest country-of-
birth groups, 2006 and 1996-2006 growth ............................................................ 35
Table 3. Estimated number of New Zealand residents of Dutch ancestry .......................... 36
Table 4. New Zealand resident population who can speak the Dutch language,
1996, 2001, 2006 ................................................................................................... 36
Table 5. Social-demographic and personal characteristics of Dutch Kiwis versus
Other ethnicities by period of arrival .................................................................... 37
Table 6. Percentage distribution of total labour force by occupational groups:
Netherlands born, New Zealand born and born in other countries, 2006 ............. 37
Table 7. Percentage distribution of the total labour force by occupational groups,
period of arrival and ethnicity (Netherlands/Other), 2006 .................................... 38
1
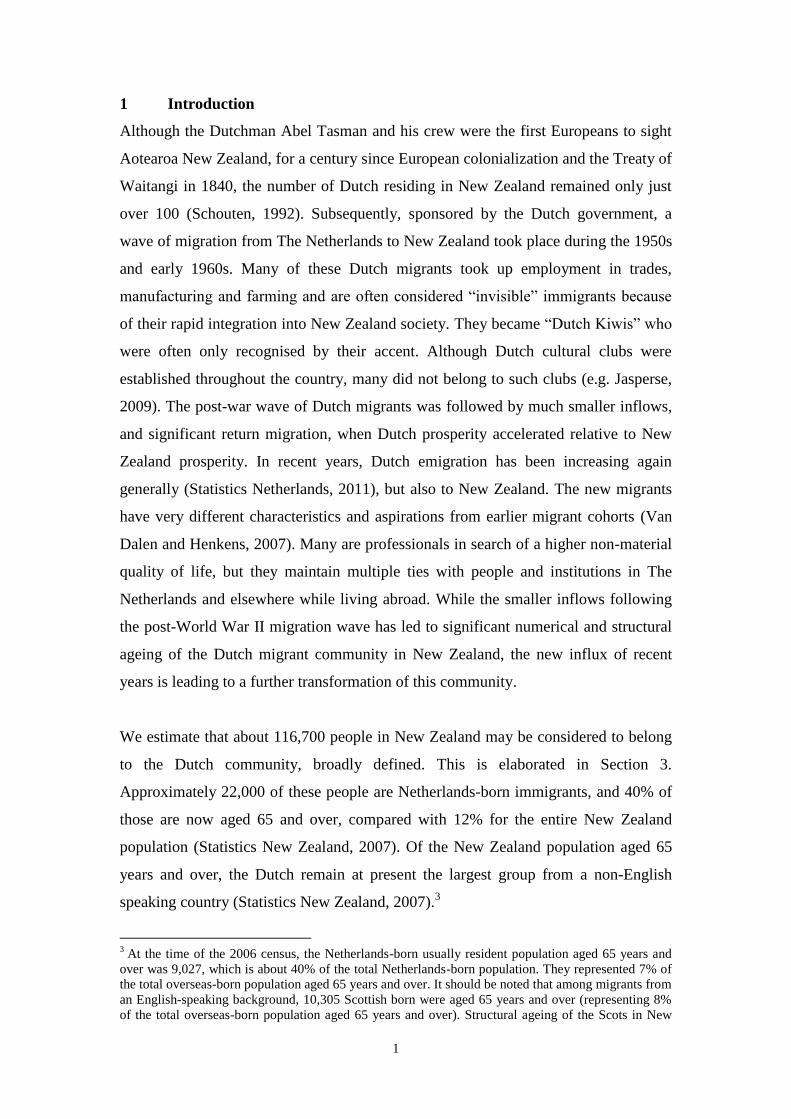
1 Introduction
Although the Dutchman Abel Tasman and his crew were the first Europeans to sight
Aotearoa New Zealand, for a century since European colonialization and the Treaty of
Waitangi in 1840, the number of Dutch residing in New Zealand remained only just
over 100 (Schouten, 1992). Subsequently, sponsored by the Dutch government, a
wave of migration from The Netherlands to New Zealand took place during the 1950s
and early 1960s. Many of these Dutch migrants took up employment in trades,
manufacturing and farming and are often considered “invisible” immigrants because
of their rapid integration into New Zealand society. They became “Dutch Kiwis” who
were often only recognised by their accent. Although Dutch cultural clubs were
established throughout the country, many did not belong to such clubs (e.g. Jasperse,
2009). The post-war wave of Dutch migrants was followed by much smaller inflows,
and significant return migration, when Dutch prosperity accelerated relative to New
Zealand prosperity. In recent years, Dutch emigration has been increasing again
generally (Statistics Netherlands, 2011), but also to New Zealand. The new migrants
have very different characteristics and aspirations from earlier migrant cohorts (Van
Dalen and Henkens, 2007). Many are professionals in search of a higher non-material
quality of life, but they maintain multiple ties with people and institutions in The
Netherlands and elsewhere while living abroad. While the smaller inflows following
the post-World War II migration wave has led to significant numerical and structural
ageing of the Dutch migrant community in New Zealand, the new influx of recent
years is leading to a further transformation of this community.
We estimate that about 116,700 people in New Zealand may be considered to belong
to the Dutch community, broadly defined. This is elaborated in Section 3.
Approximately 22,000 of these people are Netherlands-born immigrants, and 40% of
those are now aged 65 and over, compared with 12% for the entire New Zealand
population (Statistics New Zealand, 2007). Of the New Zealand population aged 65
years and over, the Dutch remain at present the largest group from a non-English
speaking country (Statistics New Zealand, 2007).3
3 At the time of the 2006 census, the Netherlands-born usually resident population aged 65 years and
over was 9,027, which is about 40% of the total Netherlands-born population. They represented 7% of
the total overseas-born population aged 65 years and over. It should be noted that among migrants from
an English-speaking background, 10,305 Scottish born were aged 65 years and over (representing 8%
of the total overseas-born population aged 65 years and over). Structural ageing of the Scots in New
2
This paper examines the dynamics of Dutch community change in New Zealand
during the last six decades. Van Dalen and Henkens (2007) focussed on the
emigrations intentions of the Dutch population and related this to various individual
characteristics of migrants and the institutional environment in The Netherlands.
Essentially, this paper complements this previous research by focussing on Dutch
migration from a specific host country perspective, namely from the perspective of
New Zealand.4
While much has already been written on Dutch immigrants in New Zealand (see for
example the bibliography by Stassen 2001), the literature takes predominantly a
qualitative or ethnographic perspective. Here we take a quantitative demographic and
socio-economic perspective. Prior research on the characteristics of Dutch immigrants
has commonly focussed on the distinctions between Dutch migrants and the New
Zealand-born population, effectively treating Dutch migrants as one homogenous
group. However, we find that there are three distinct cohorts of migrants from the
Netherlands to New Zealand, each covering roughly 20 years of arrivals: post-war
migrants (those who arrived in the 1950s and 1960s), skilled migrants (those who
arrived in the 1970s and 1980s), and transnational professionals (those who arrived in
the 1990s and 2000s). With the exception of two doctoral papers – de Bres (2004)
who compared the language maintenance of Dutch immigrants across different time
periods of arrival and Webster (2007) who compared the maintenance of Dutch
identity by six Dutch families – studies on Dutch migration have focused on either
Dutch migrants from one specific arrival period (particularly the 1950s: e.g., Schouten,
1992) or the total Dutch migrant community (Thomson, 1967; 1970). The migration
waves that we identify here allow us to link these arrival cohorts to major paradigm
shifts that have taken place in international migration globally since the end of World
Zealand is similar to that of the Dutch, with in both cases about 40 percent of the migrant population
being aged 65 and over. 4 It should be noted that while New Zealand was historically a popular destination of Dutch emigrants,
the country does not rank among the 10 most popular destinations in recent years. In 2009 they were
(in descending order): Germany, Belgium, Netherlands Antilles and Aruba, Spain, United States,
United Kingdom, France, Australia, Switzerland and Canada (Statistics Netherlands, 2010). Emigration
to Germany was estimated to have been in 2009 around 4,600; to Australia 1,000 and to New Zealand
200 (Statistics Netherlands 2010; NZ Department of Labour, unpublished). These numbers exclude
temporary migrants. With respect to New Zealand, we estimate the number of temporary migrants from
The Netherlands arriving on student or work permits to be around ten times the number of new Dutch
settlers.
3
War II (see e.g. Massey et al., 1998; Poot et al., 2008; Castles and Miller, 2009). We
can therefore describe the transformation of the Dutch community in New Zealand in
the context of these global changes.
The next section reviews the history of Dutch migration to New Zealand. Section 3
focuses on enumeration of the Dutch community in New Zealand, specifically with
respect to birthplace, ancestry, citizenship, ethnicity and language. Section 4 provides
a comparison of the social-demographic characteristics and outcomes of three distinct
arrival cohorts of Dutch migrants. The final section concludes and provides some
suggestions for further research.
2 The History of Dutch Migration to New Zealand
Most of the quarter-million people who left the Netherlands between 1846 and 1930
headed westwards, mainly to the United States (Hofstede, 1964:13). This industrial
period of emigration originated from the economic development of Europe and the
spread of industrialisation to former colonies in the New World (Hatton and
Williamson, 1994). Only a few Dutch settled in New Zealand before the middle of the
19th century. Some had professions associated with the sea, or were drawn to the
colony by the 1860s gold rushes (Schouten, 1992). In the 1874 census, only 127 of the
recorded 300,000 settlers were born in The Netherlands, of which 112 were men and
15 were women.
Even so, several of the early settlers of Dutch origin became nationally and
internationally well known New Zealanders. They include the landscape painter
Petrus van der Velden, and gold seeker and later Prime Minister Sir Julius Vogel, who
had a Dutch father (Schouten, 1992). Others, like Wellington‟s first rabbi Herman van
Staveren, made their mark at the community level. Gerrit van Asch arrived in
Christchurch in 1880 and set up the world‟s first fully government-funded school for
the deaf. Journalist Hedda Dyson came to New Zealand from the Dutch East Indies in
the late 1920s, and married a New Zealander. In 1932 she founded the New Zealand
Woman’s Weekly. And lastly, Dutch-born pianist Diny Soetermeer arrived in New
Zealand in 1939 to contribute to music in Wellington. Although there had also been
4
other new arrivals by the 1930s, there were still only 128 Dutch-born residents in
New Zealand at the end of World War II.
A small experiment with assisted migration started in 1939 when five Dutch
carpenters were recruited by the New Zealand Government, with the costs borne by
the Netherlands Government (Schouten, 1992: 49). From 1945 onwards, initially
small groups of migrants, both from the Netherlands and from the former Dutch East
Indies (now Indonesia) arrived in New Zealand (Priemus, 1997).5 These first groups
of arrivals impressed employers, setting the scene for much larger inflows.
In 1950 the New Zealand government approached the Netherlands government,
asking whether 2,000 skilled migrants could be recruited (Schouten, 1992: 56).
Particularly carpenters, skilled labourers, and farm and domestic workers were needed.
The need for workers was immediate and even before the immigration agreement was
signed in October 1950, 55 Dutch dairy workers had already been selected (Schouten,
1992: 56). New Zealand did initially have a preference for single migrants, who were
expected to assimilate faster.
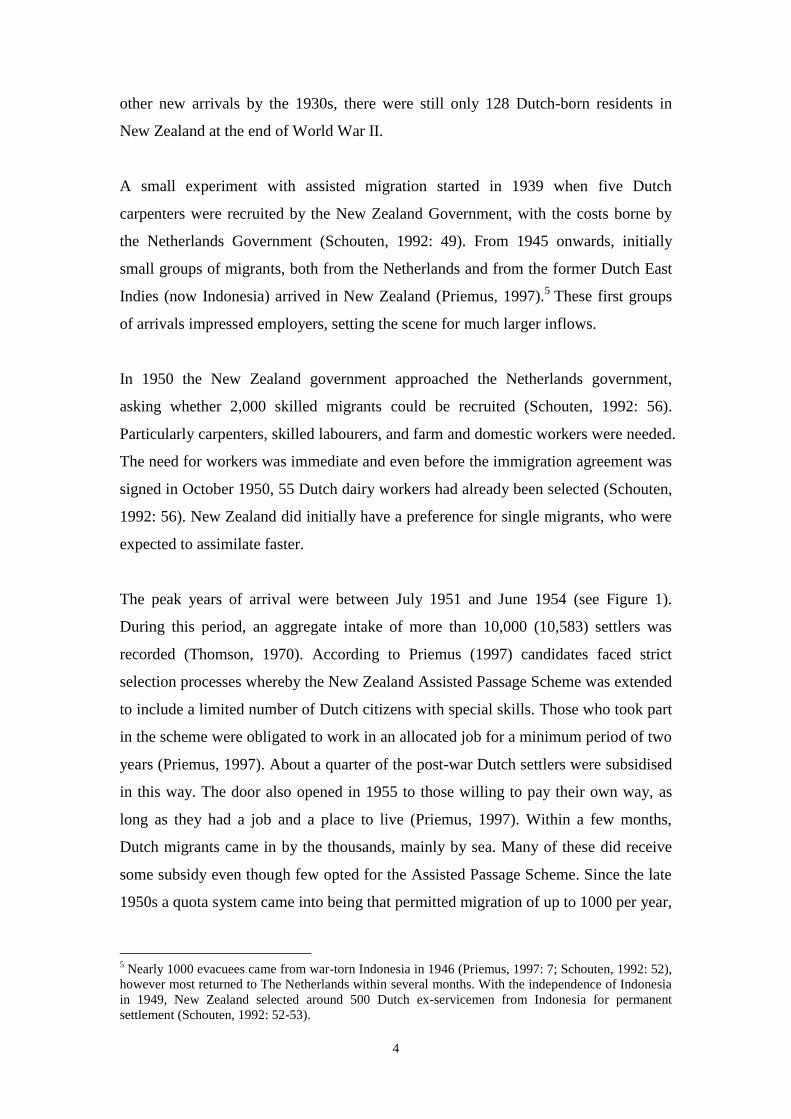
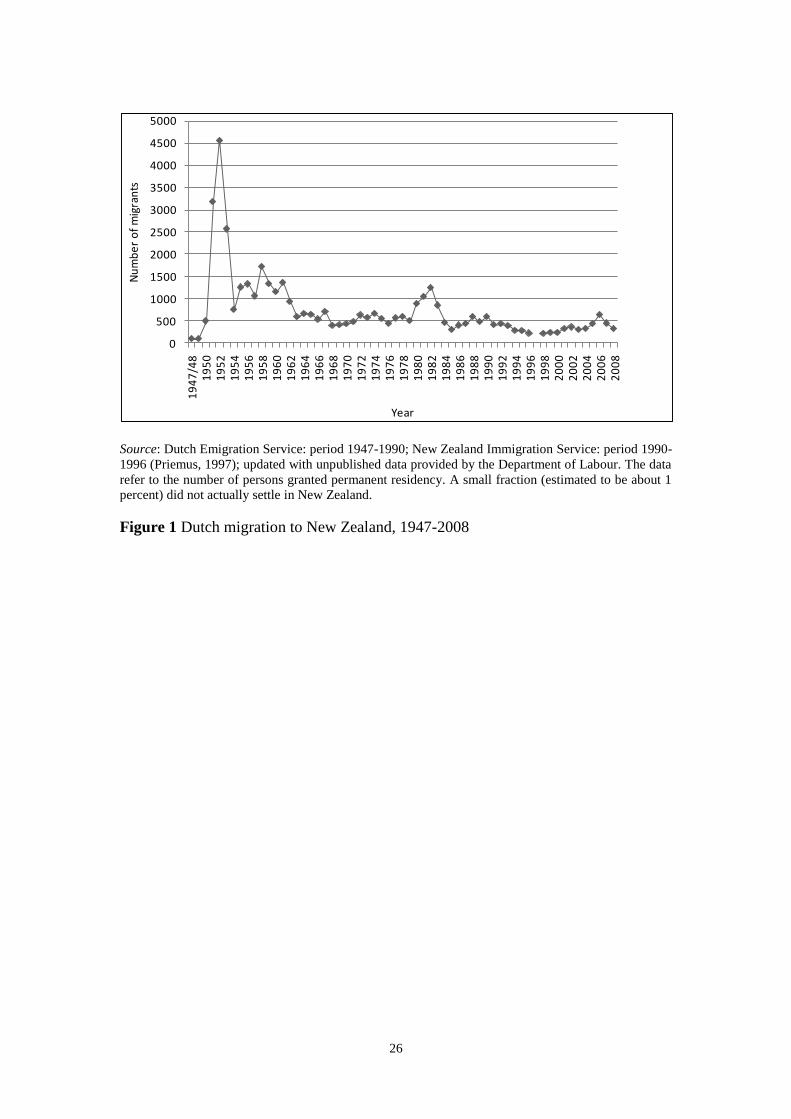
The peak years of arrival were between July 1951 and June 1954 (see Figure 1).
During this period, an aggregate intake of more than 10,000 (10,583) settlers was
recorded (Thomson, 1970). According to Priemus (1997) candidates faced strict
selection processes whereby the New Zealand Assisted Passage Scheme was extended
to include a limited number of Dutch citizens with special skills. Those who took part
in the scheme were obligated to work in an allocated job for a minimum period of two
years (Priemus, 1997). About a quarter of the post-war Dutch settlers were subsidised
in this way. The door also opened in 1955 to those willing to pay their own way, as
long as they had a job and a place to live (Priemus, 1997). Within a few months,
Dutch migrants came in by the thousands, mainly by sea. Many of these did receive
some subsidy even though few opted for the Assisted Passage Scheme. Since the late
1950s a quota system came into being that permitted migration of up to 1000 per year,
5 Nearly 1000 evacuees came from war-torn Indonesia in 1946 (Priemus, 1997: 7; Schouten, 1992: 52),
however most returned to The Netherlands within several months. With the independence of Indonesia
in 1949, New Zealand selected around 500 Dutch ex-servicemen from Indonesia for permanent
settlement (Schouten, 1992: 52-53).
5
with settlement guaranteed by the Dutch government. With the exception of 1981 and
1982, migration remained below 1000 per year since 1962.
Figure 1 about here
The period of post-industrial migration during the 1950s and 1960s became a global
phenomenon. The number and variety of countries sending and receiving migrants
increased (Massey et al., 1998:2). The primary motives driving Dutch migration in the
early 1950s were economic, political and also sociological factors which influenced
young Dutch people – shattered by war, the hunger winter of 1944, and the difficult
immediate post-war reconstruction period – to seek a new life elsewhere (Thomson,
1970).6
In general terms, and considering the whole of the modern migration era since the late
1800s, the international migrants of the late nineteenth and early twentieth century
can be characterized as Europeans crossing the oceans in search of a better life,
exchanging industrializing regions intensive in labour for industrializing regions
intensive in land (Hatton and Williamson, 1994). This however, changed, with the
development of restrictive admission policies of the destination countries, particularly
since the Depression. These policies increasingly conditioned the character and
volume of migration, creating different classes of migrants based on different
selection criteria. Such migrants then occupy different positions in the socio-
economic structure of the receiving society (Massey et al., 1998). The recruitment of
Dutch migrants to the New World countries of Australia, Canada and New Zealand
was by no means a signal of a global freeing up of border controls, but instead a
fortuitous happenstance of a country considering itself to be "overpopulated" (with a
population of 10 million in 1950, as compared with 16.7 million at present) and the
concurrent presence of other countries keen to industrialise but short of the required
labour.
In the New Zealand case, between 1951 and 1968, 28,366 immigrants born in Dutch
territories arrived in New Zealand, and 23,879 settled according to Thomson (1970).
6 By 1948, one in three Dutch citizens considered to emigrate from the Netherlands (Priemus, 1997: 8).
6
Almost half of all migrants from outside the Commonwealth were Dutch, making
them by far the biggest single group of non-British immigrants to New Zealand at that
time. In terms of the policy objectives at the time, Dutch migration to New Zealand
during the 1950s and early 1960s may be considered to have been highly successful,
with the vast majority of arrivals integrating very well into New Zealand society (e.g.
Thomson, 1967). However, this came at the cost of a significant loss of Dutch culture
and identity among the settlers (e.g. Priemus, 1997).
The annual number of migrants dropped sharply below the annual quota of 1000 by
1963 and even further to around 400 by 1968. Since then and throughout the 1970s,
the flow of migrants from the Netherlands did not cease altogether, but remained
around 500 per year. The reasons for the end of the postwar Dutch migration wave
were predominantly economic: the Dutch economy was doing very well in the 1960s
and at the same time the “golden weather” of New Zealand postwar development was
coming to an end (Gould, 1982). Another explanation for the decrease in Dutch
migration in this period was that the Dutch government ceased to actively promote
emigration, as unemployment and shortage of housing were no longer problems and
the Netherlands was in fact starting to recruit immigrants, particularly so-called "guest
workers", to fill a growing shortage of workers (Priemus, 1997).
During the early 1980s the number of migrants increased again, and exceeded 1000 in
1981 and 1982, partly due to a recession in the Netherlands, growing environmental
concerns and also influenced by the threats of the Cold War associated with the 1979
Islamic Revolution in Iran, the Nicaraguan Revolution, and Soviet intervention in
Afghanistan. Economic motives no longer dominated the decision to migrate. Surveys
at that time showed that the early 1980s migrants tended to be middle class, highly
educated and leaving the prosperous Netherlands predominantly for environmental
and lifestyle reasons (Kruiter, 1981: 100). Subsequently, another temporary increase
in emigration in the late 1980s was consistent with this trend and likely to have been
influenced by concerns in Europe about the 1986 Chernobyl nuclear power plant
disaster and New Zealand‟s nuclear free policy.

7
A new era of immigration policy emerged in the early 1990s when a points-based
selection system was introduced by the National Government elected in 1990. The
new system emphasised the recruitment of skilled workers and entrepreneurs. In
contrast, family-related migration played a dominant role previously. In 1992, Queen
Beatrix of the Netherlands visited New Zealand to commemorate the 350th
birthday of
Abel Tasman‟s voyage. Unfortunately, shortly after this visit, due to budget cuts by
the Dutch government and the fact that the agreed quota had not been met for many
years, the migration agreement between The Netherlands and New Zealand was
terminated in March 1992 (Trouw, 1992). Following this, Dutch migrants were no
longer a „special group‟ in terms of applying for settlement in New Zealand.
Applicants had to satisfy exactly the same criteria as everyone else. Various
modifications to the selection criteria and the desired target flows of new residency
approvals were introduced subsequently.7 These events together shaped the number
of arrivals which after a modest peak of 599 in 1990 dropped to less than 300 per
annum by 1994. Nonetheless, since the turn of the millennium the annual number has
exceeded 300 in every year and reached a peak of 641 by 2005/06. At that time The
Netherlands had once again become a country characterized by net emigration, but
not because of economic malaise but because of concerns regarding criminality,
negative attitudes of the population, congestion, pollution and increasing cultural
diversity (e.g., van Dalen and Henkens, 2007).
A major change in international migration in recent decades has been the growing
complexity in migration patterns and the shift from permanent settlement to
temporary migration for work, study or even transnational commuting between
residences by professional workers and some retired people (e.g. Poot et al. 2008).
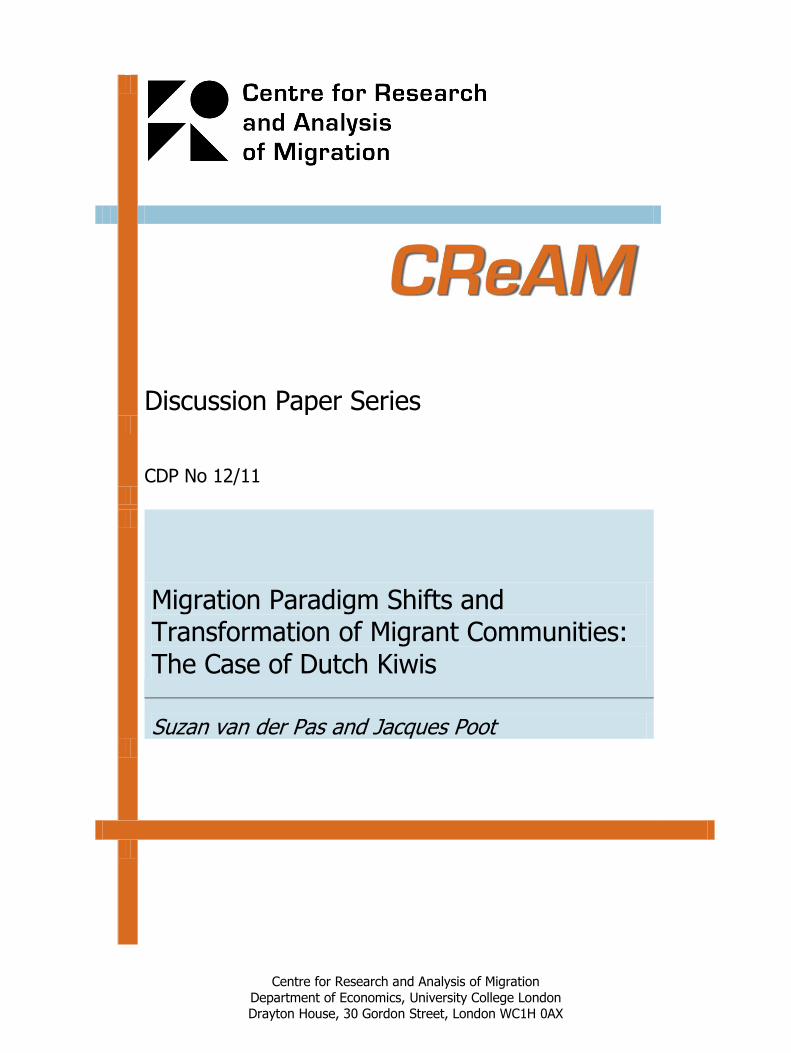
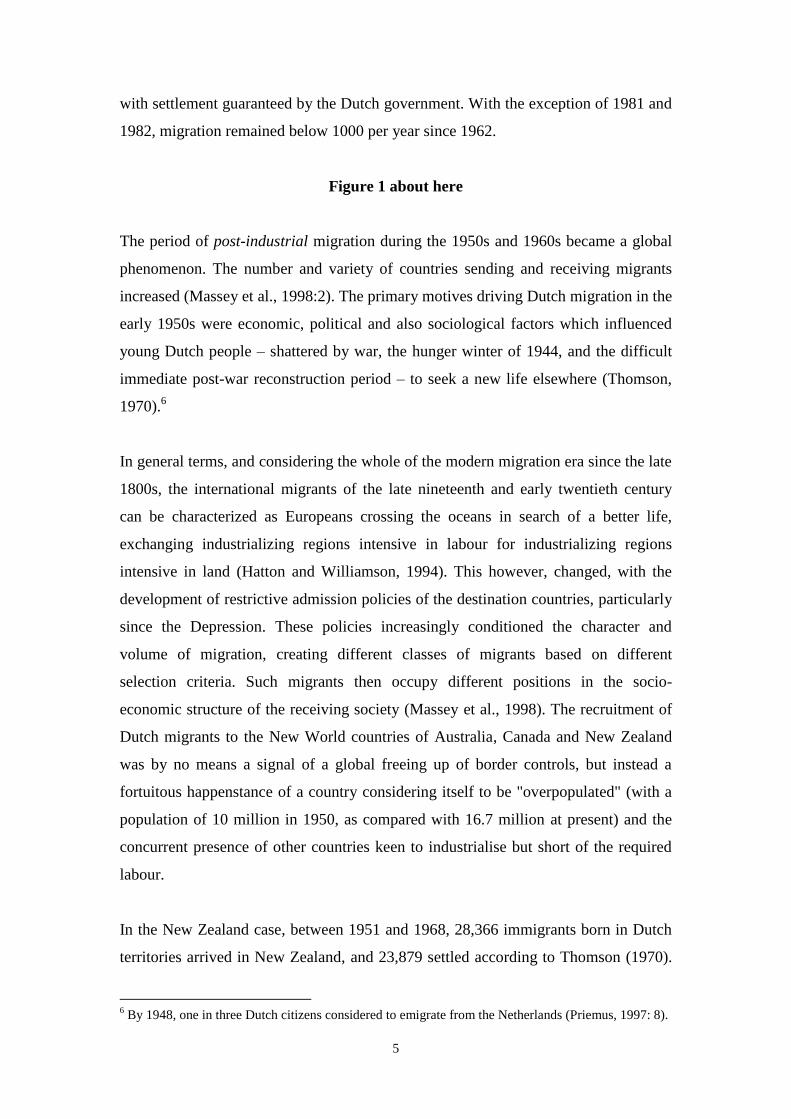
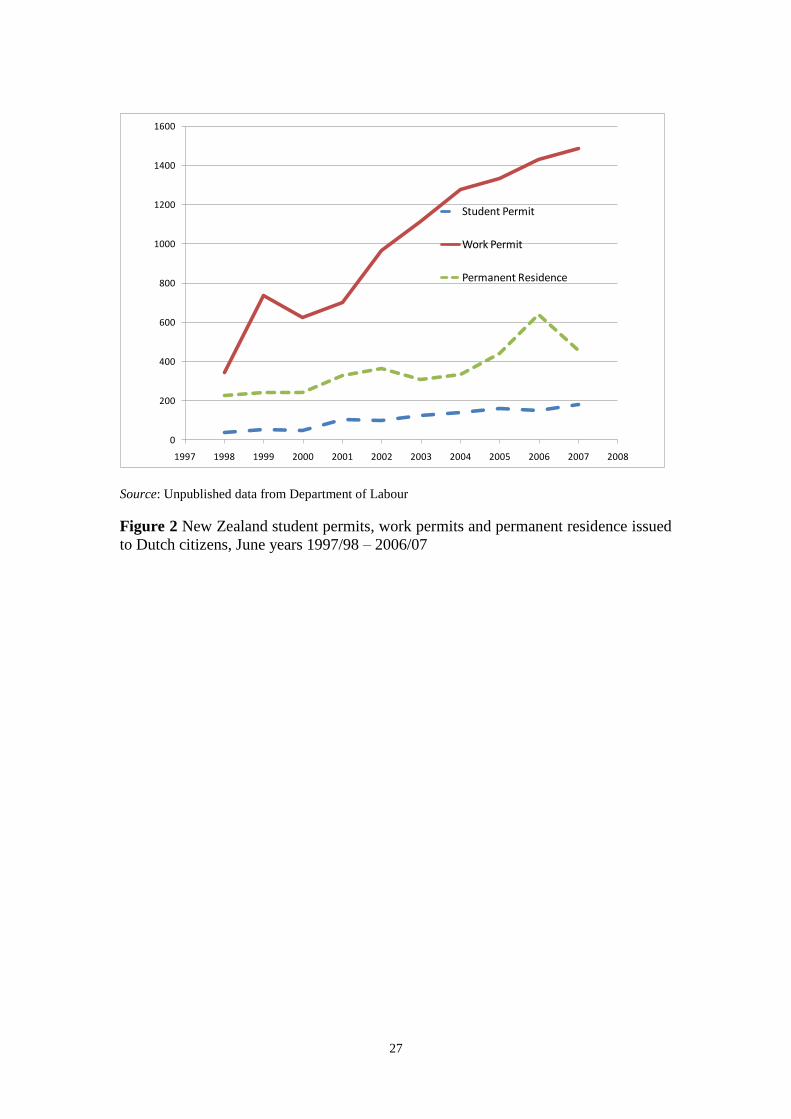
Dutch migration to New Zealand is no exception. Figure 2 shows the number of
people of Dutch nationality issued a student permit and compares that with the
number issued a work permit, and those granted permanent residence. It is clear that
while the number of Dutch coming to study in New Zealand is small (less than 200
per year), those issued a work permit exceed those granted permanent residence for
every year since 1997/98. By 2006/07, when nearly 1500 work permits were issued to
Dutch nationals, work permits issued exceeded permanent residence granted by as
7 The changes in immigration policy between 1986 and 2007 are summarised in for example Merwood
(2008).
8
much as threefold. The decrease that can be seen in 2006/2007 for permanent
residence was probably influenced by positive economic situation in the Netherlands
at that time and a decrease in interest to migrate in general. Lower labour mobility
during the global economic recession is likely to have contributed to lower emigration
since 2008 (not shown in the graph, but see e.g. Papademetriou et al. 2010). However
the number coming on temporary permits has continued to increase.
Figure 2 about here
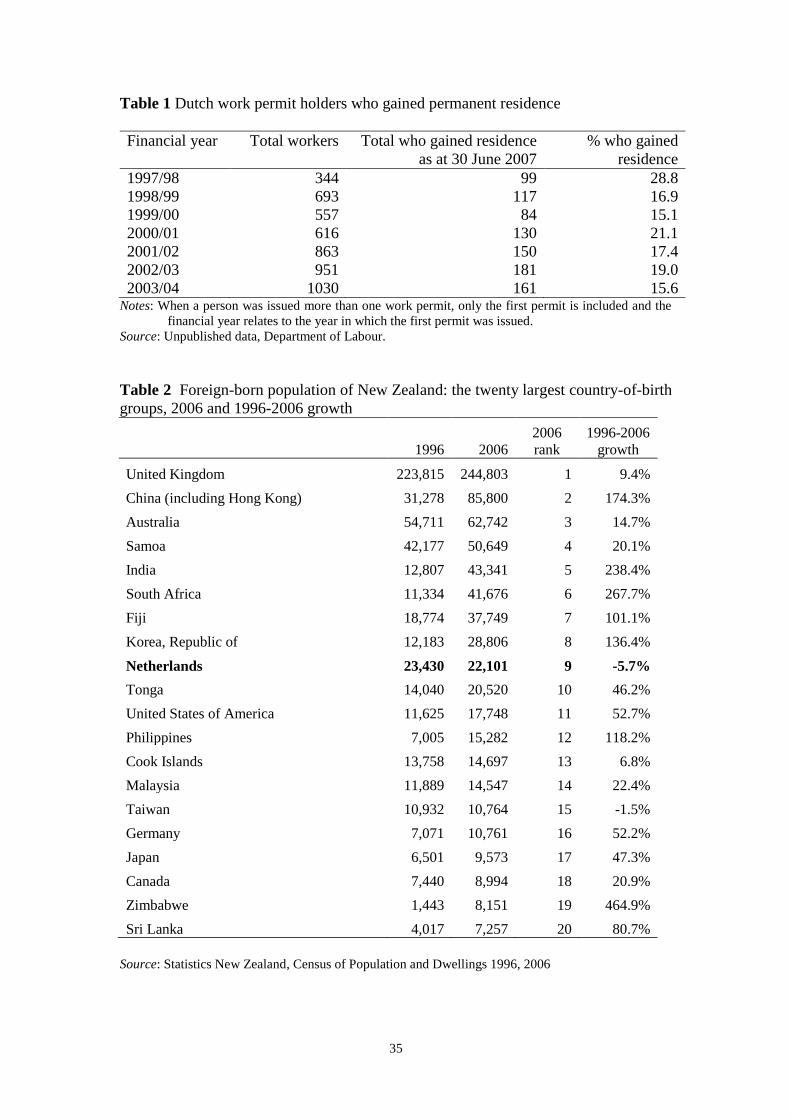
Of course, a temporary stay in New Zealand may be the prelude to permanent
settlement. Table 1 shows the proportion of Dutch nationals who were issued a work
permit between June year 1997/98 and 2003/04, who subsequently obtained
permanent residence by June 2007. This varied between 28.8% for those arriving in
1997/98 and 15.1% of those arriving in 1999/00. On average it appears that more than
one in six Dutch temporary workers subsequently settles in New Zealand.
Table 1 about here
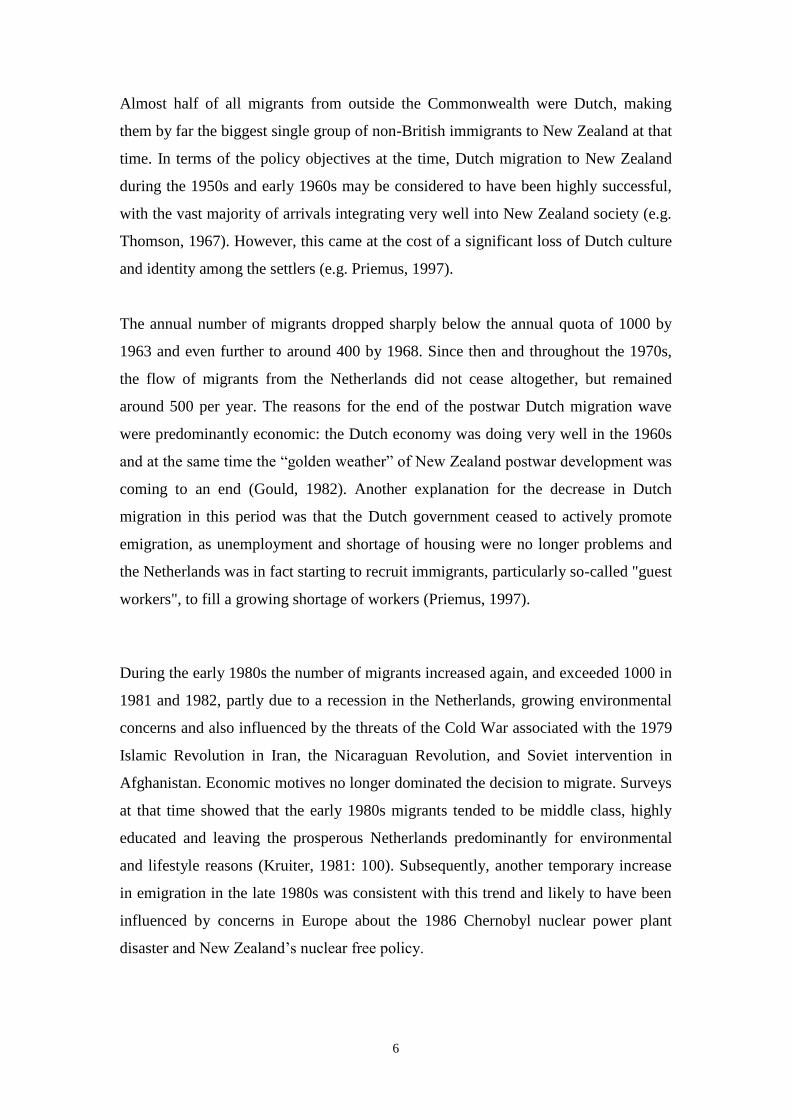
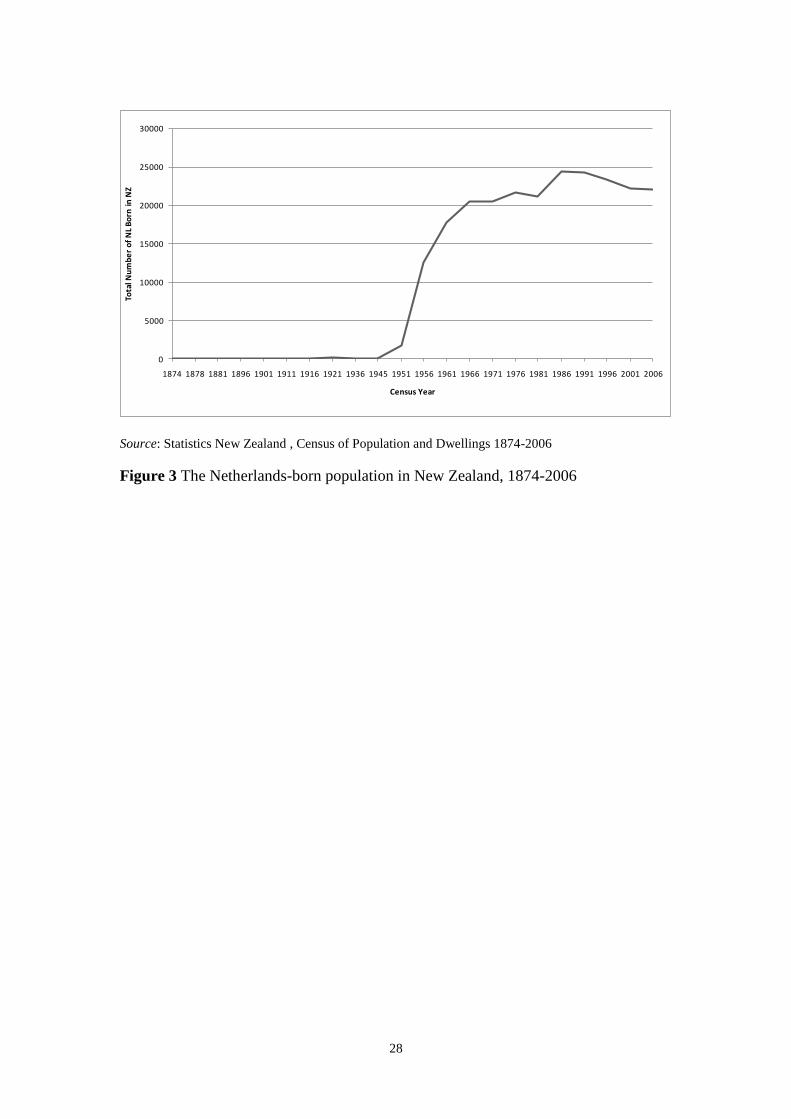
The number of Netherlands born in New Zealand at any point in time is the
cumulative outcome of successive year by year immigration flows, the return
migration of some and in more recent years the increasing mortality of the migrants
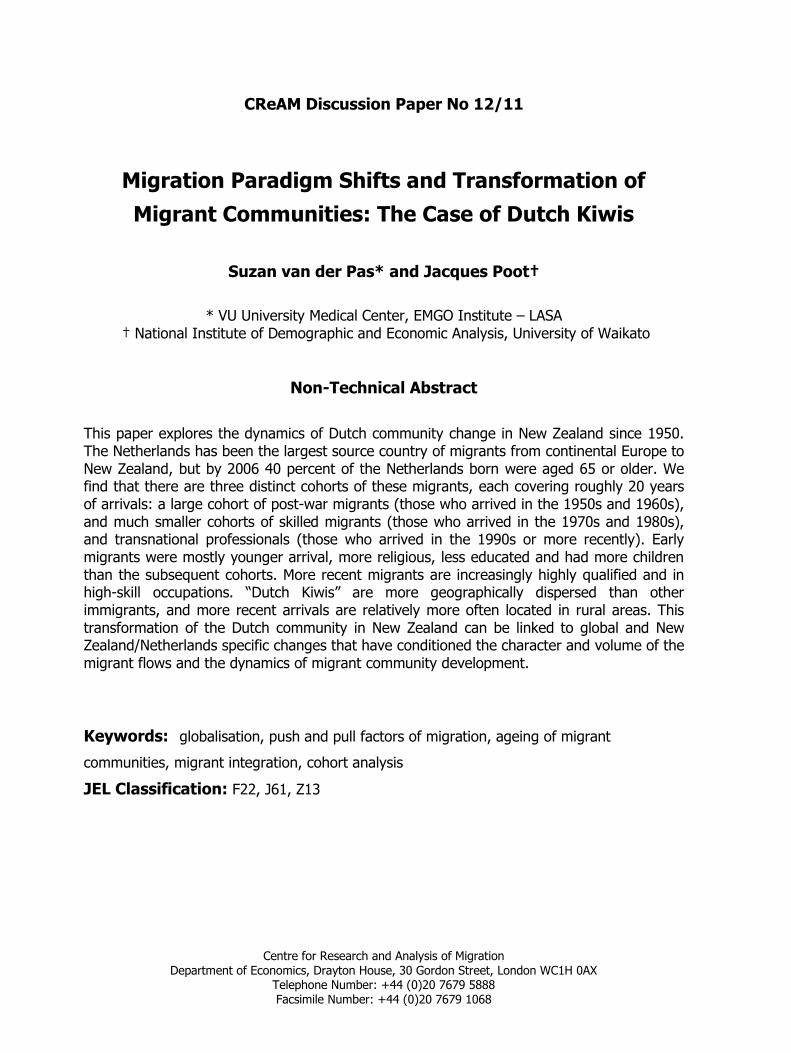
who came in the 1950s migration wave. Figure 3 shows the number of Netherlands-
born population in New Zealand, as recorded by the censuses since 1874.8 The
dramatic increase during the 1950s is very clear, followed by a levelling off during
the 1970s and another period of growth during the early 1980s up to a peak of 24,486.
Subsequently, the number has been slowly decreasing to 22,101 in 2006. Three
quarters of the 2006 Netherlands-born population had been living in New Zealand for
more than 20 years, and 84% for more than 10 years. However, after those from the
United Kingdom, the Dutch are still the largest group of migrants from North-
Western Europe.
Figure 3 about here
8 Those born in the former Dutch Colonies are not included in this figure.
9
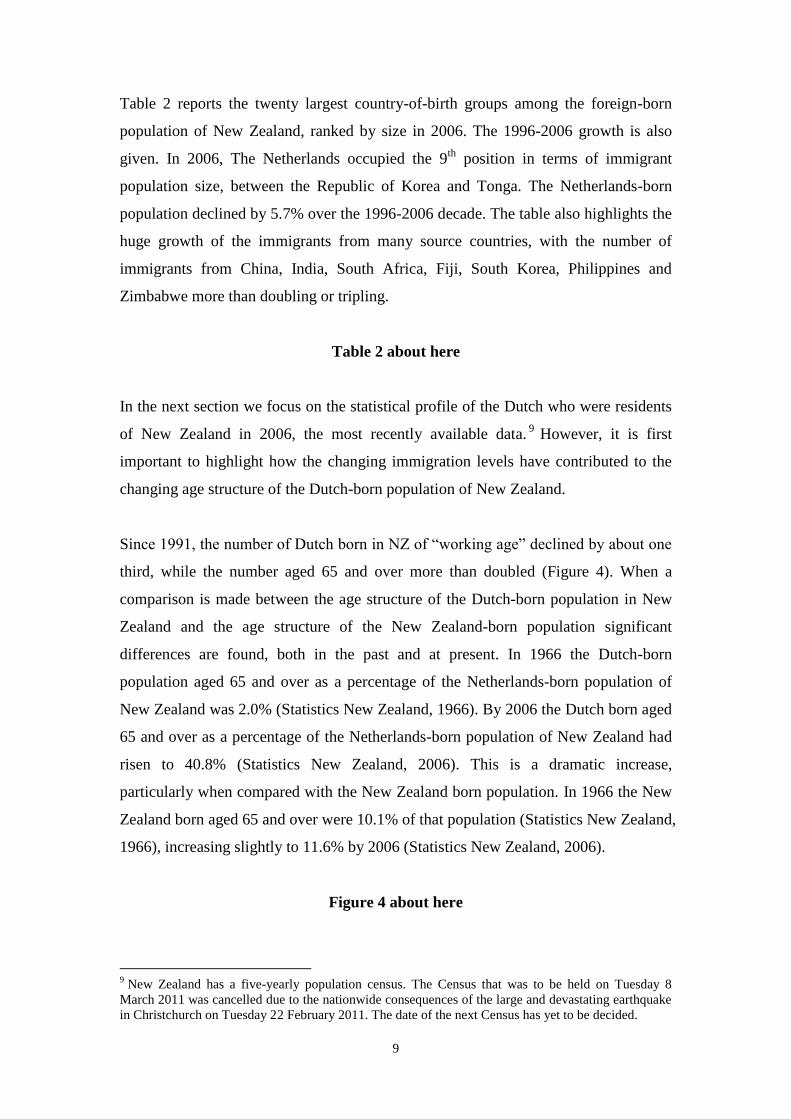
Table 2 reports the twenty largest country-of-birth groups among the foreign-born
population of New Zealand, ranked by size in 2006. The 1996-2006 growth is also
given. In 2006, The Netherlands occupied the 9th
position in terms of immigrant
population size, between the Republic of Korea and Tonga. The Netherlands-born
population declined by 5.7% over the 1996-2006 decade. The table also highlights the
huge growth of the immigrants from many source countries, with the number of
immigrants from China, India, South Africa, Fiji, South Korea, Philippines and
Zimbabwe more than doubling or tripling.
Table 2 about here
In the next section we focus on the statistical profile of the Dutch who were residents
of New Zealand in 2006, the most recently available data.9 However, it is first
important to highlight how the changing immigration levels have contributed to the
changing age structure of the Dutch-born population of New Zealand.
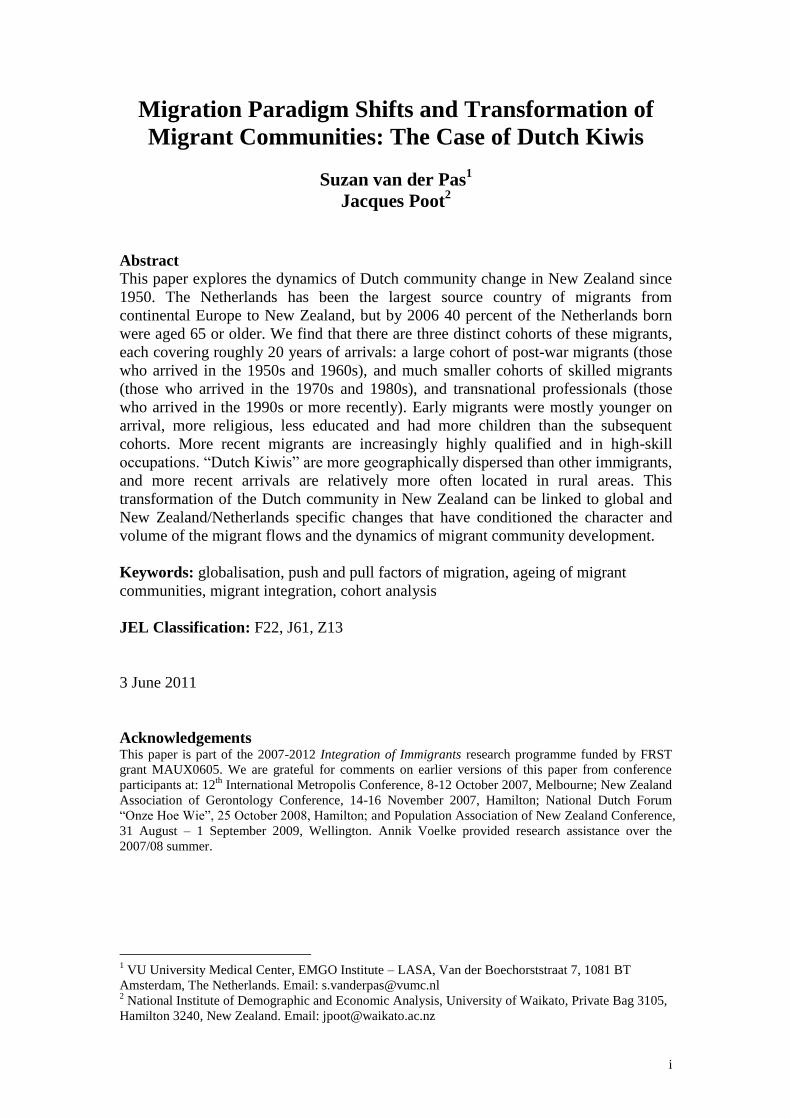
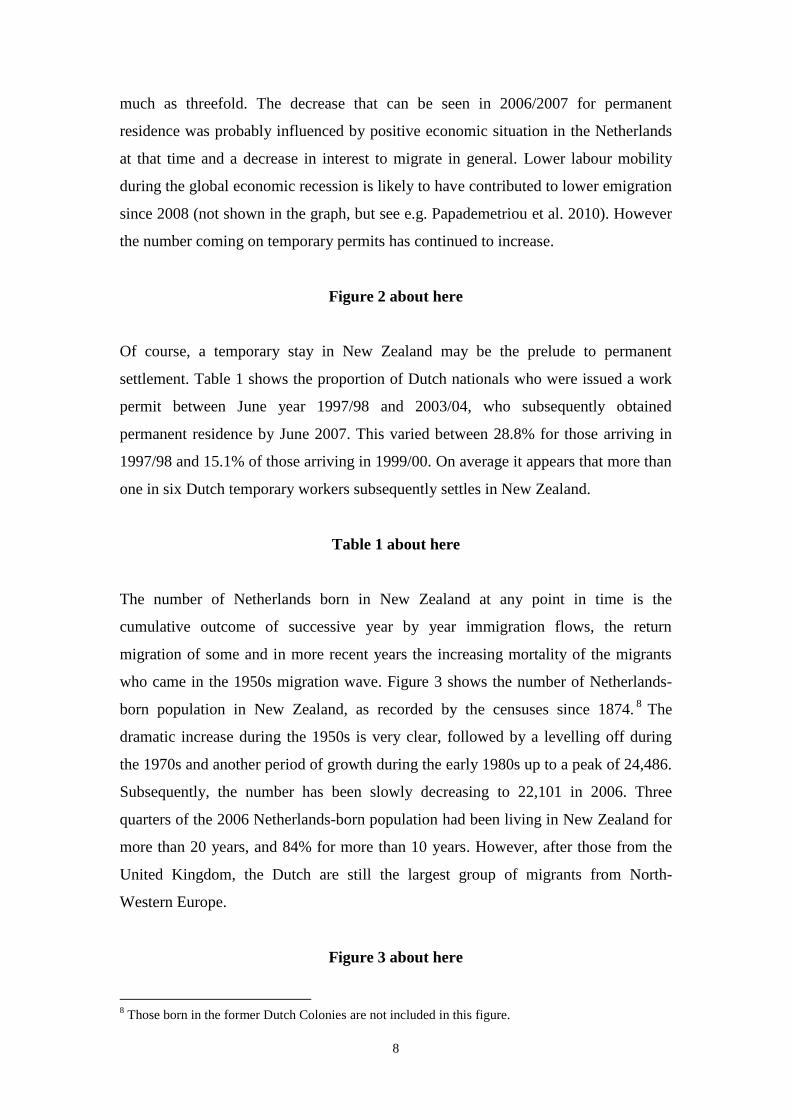
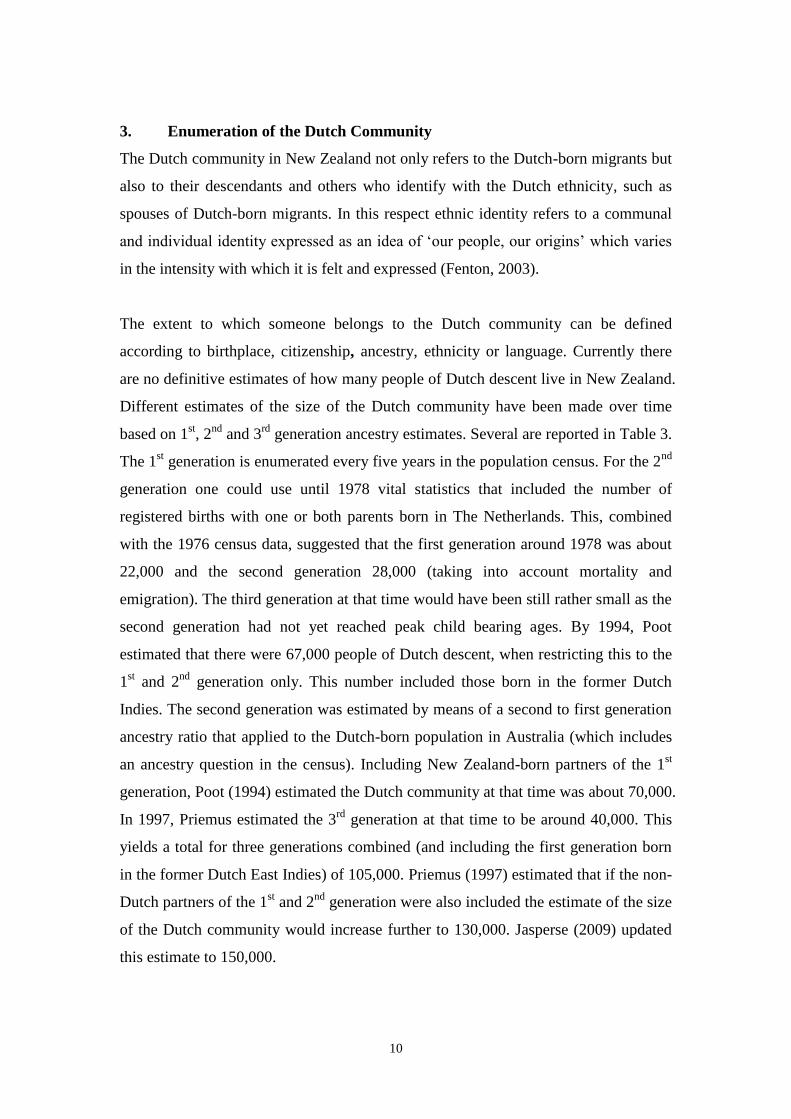
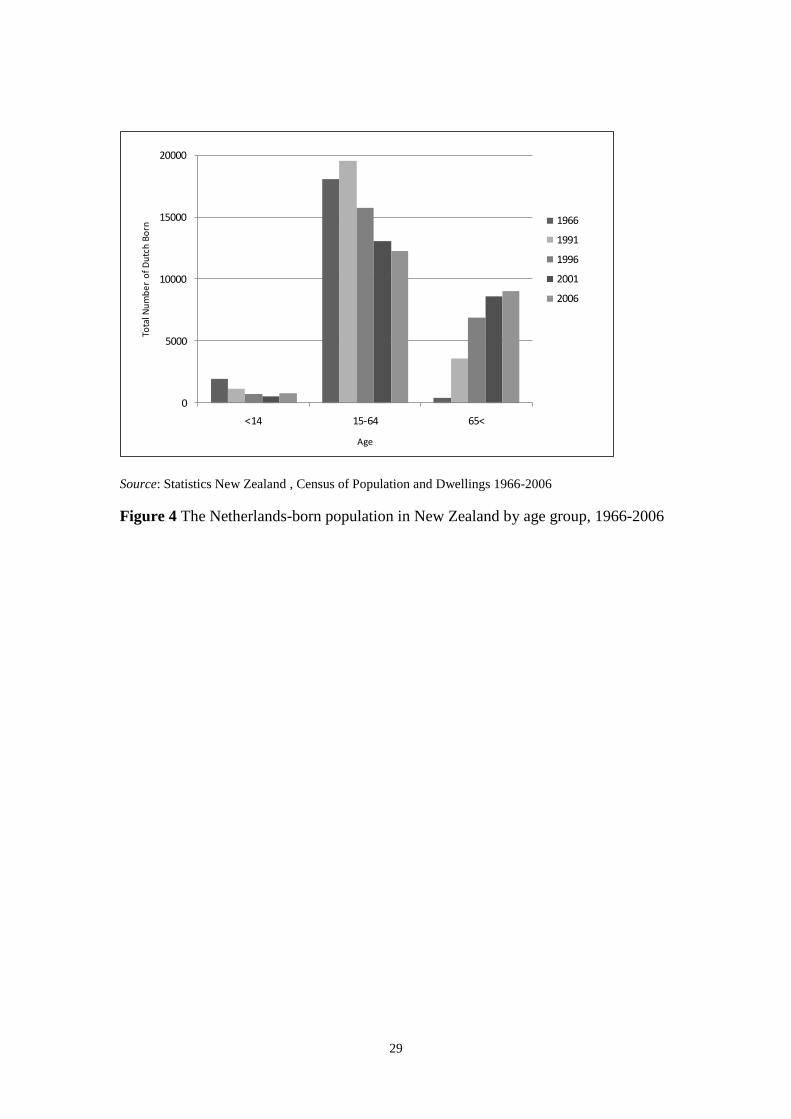
Since 1991, the number of Dutch born in NZ of “working age” declined by about one
third, while the number aged 65 and over more than doubled (Figure 4). When a
comparison is made between the age structure of the Dutch-born population in New
Zealand and the age structure of the New Zealand-born population significant
differences are found, both in the past and at present. In 1966 the Dutch-born
population aged 65 and over as a percentage of the Netherlands-born population of
New Zealand was 2.0% (Statistics New Zealand, 1966). By 2006 the Dutch born aged
65 and over as a percentage of the Netherlands-born population of New Zealand had
risen to 40.8% (Statistics New Zealand, 2006). This is a dramatic increase,
particularly when compared with the New Zealand born population. In 1966 the New
Zealand born aged 65 and over were 10.1% of that population (Statistics New Zealand,
1966), increasing slightly to 11.6% by 2006 (Statistics New Zealand, 2006).
Figure 4 about here
9 New Zealand has a five-yearly population census. The Census that was to be held on Tuesday 8
March 2011 was cancelled due to the nationwide consequences of the large and devastating earthquake
in Christchurch on Tuesday 22 February 2011. The date of the next Census has yet to be decided.
10
3. Enumeration of the Dutch Community
The Dutch community in New Zealand not only refers to the Dutch-born migrants but
also to their descendants and others who identify with the Dutch ethnicity, such as
spouses of Dutch-born migrants. In this respect ethnic identity refers to a communal
and individual identity expressed as an idea of „our people, our origins‟ which varies
in the intensity with which it is felt and expressed (Fenton, 2003).
The extent to which someone belongs to the Dutch community can be defined
according to birthplace, citizenship, ancestry, ethnicity or language. Currently there
are no definitive estimates of how many people of Dutch descent live in New Zealand.
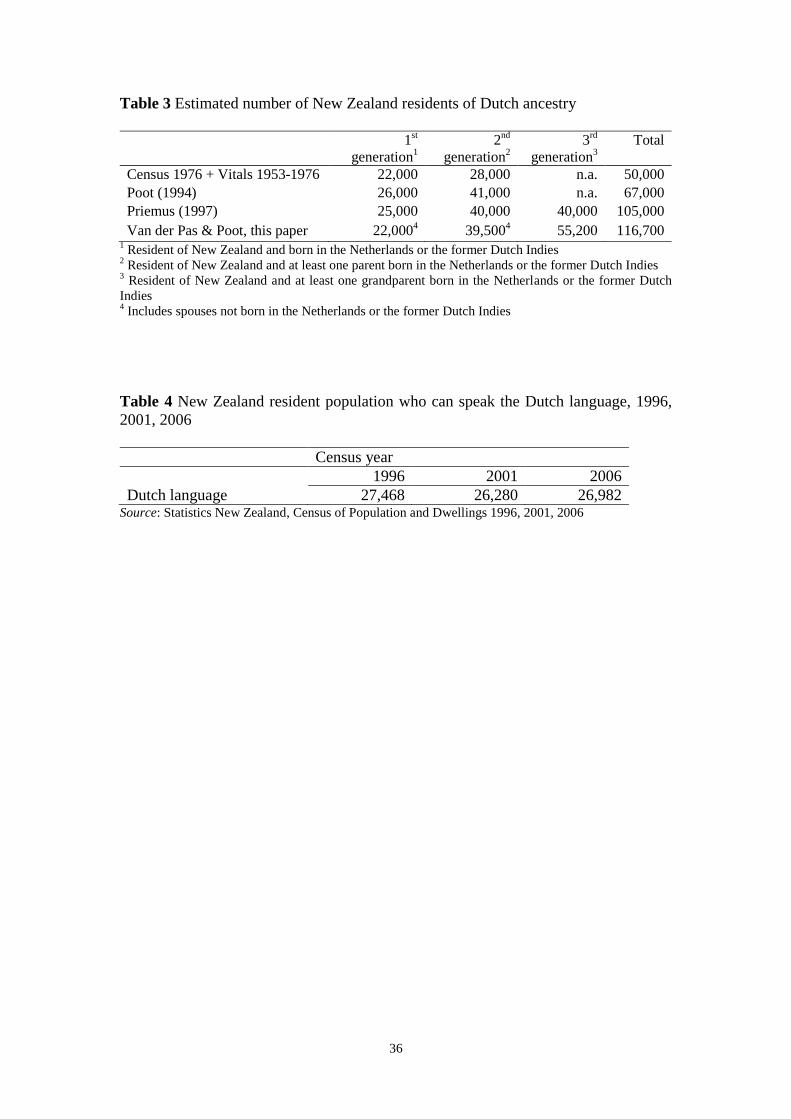
Different estimates of the size of the Dutch community have been made over time
based on 1st, 2
nd and 3
rd generation ancestry estimates. Several are reported in Table 3.
The 1st generation is enumerated every five years in the population census. For the 2
nd
generation one could use until 1978 vital statistics that included the number of
registered births with one or both parents born in The Netherlands. This, combined
with the 1976 census data, suggested that the first generation around 1978 was about
22,000 and the second generation 28,000 (taking into account mortality and
emigration). The third generation at that time would have been still rather small as the
second generation had not yet reached peak child bearing ages. By 1994, Poot
estimated that there were 67,000 people of Dutch descent, when restricting this to the
1st and 2
nd generation only. This number included those born in the former Dutch
Indies. The second generation was estimated by means of a second to first generation
ancestry ratio that applied to the Dutch-born population in Australia (which includes
an ancestry question in the census). Including New Zealand-born partners of the 1st
generation, Poot (1994) estimated the Dutch community at that time was about 70,000.
In 1997, Priemus estimated the 3rd
generation at that time to be around 40,000. This
yields a total for three generations combined (and including the first generation born
in the former Dutch East Indies) of 105,000. Priemus (1997) estimated that if the non-
Dutch partners of the 1st and 2
nd generation were also included the estimate of the size
of the Dutch community would increase further to 130,000. Jasperse (2009) updated
this estimate to 150,000.
11
However, these estimates do not take emigration into account. According to Priemus
(1997) of the 41,000 who immigrated between 1945 and 1997, about 25,000 were
living in New Zealand in 1997, and around 3,000 were deceased. This would suggest
that around one third re-migrated, which coincides with other studies. If we update the
estimate made by Priemus, account for emigration and deaths since the 2006 census
and include an extra 30% for non-Dutch partners of the 1st and 2
nd generation, we
obtain a current estimate of 116,700. This would mean that about 2.7% of the New
Zealand population belongs to the Dutch community. It should be noted that the 3rd
generation is now complete, with the 4th
generation emerging.
Table 3 about here
Being part of the Dutch community can also be defined by means of citizenship.
Unfortunately there are no data available on citizenship in the New Zealand Census.
The Australian Census shows that around 75% of Netherlands-born residents have the
Australian citizenship (Australia Bureau of Statistics, 2009-10). As in most countries,
naturalisation is voluntary in Australia. However, migrants are actively encouraged to
apply for citizenship, which gives them the right to vote, apply for public office, and
hold an Australian passport (Australia Bureau of Statistics, 2009-10).
Under the assimilation programme of the New Zealand Government in the 1950s,
Dutch immigrants were initially also encouraged to become naturalised (Schouten,
1992). However, resistance developed towards the provisions in New Zealand‟s
naturalisation law at the time whereby naturalised citizens could become stateless
under certain circumstances and therefore were in a sense relegated to be second-class
New Zealanders (Schouten, 1992). In the 1970s when around 20,000 Netherlands-
born residents qualified to become New Zealand citizens, there were 13,600
Netherlands-born residents on the register of aliens (Schouten, 1992: 76). This
suggests that, in contrast to Australia, Netherlands-born residents in New Zealand
have retained their Dutch citizenship to a much larger extent.
Schouten noted that “Dutch descent does not necessarily mean Dutch identity” (1992:
257). At the time of the 2006 census there were close to 29,000 people in New
Zealand who identified themselves with the Dutch ethnicity (Statistics New Zealand,
12
2006). There was a small rise of 1,134 in people identifying with Dutch ethnicity
between 2001 and 2006.10
Interestingly, in the census of 1996 almost 48,000
identified themselves with the Dutch ethnicity. In that census the question on ethnicity
included „Dutch‟ as a separate box that could be ticked. Since then, the form design
has been changed and „Dutch‟ is only mentioned as an example that respondents can
write in a box for „Other ethnic groups‟.11
In the Australian Census a self-reported
ancestry question is included whereby people are asked to consider their ancestry
back as far as two generations (Australian Bureau of Statistics, 2007). In 2006, the
number of Australian people who reported Dutch ancestry was four times the Dutch-
born population (Australian Bureau of Statistics, 2007).12
If we use that ratio to the
2006 census data, we would expect about 88,000 people in New Zealand to
acknowledge Dutch ancestry.
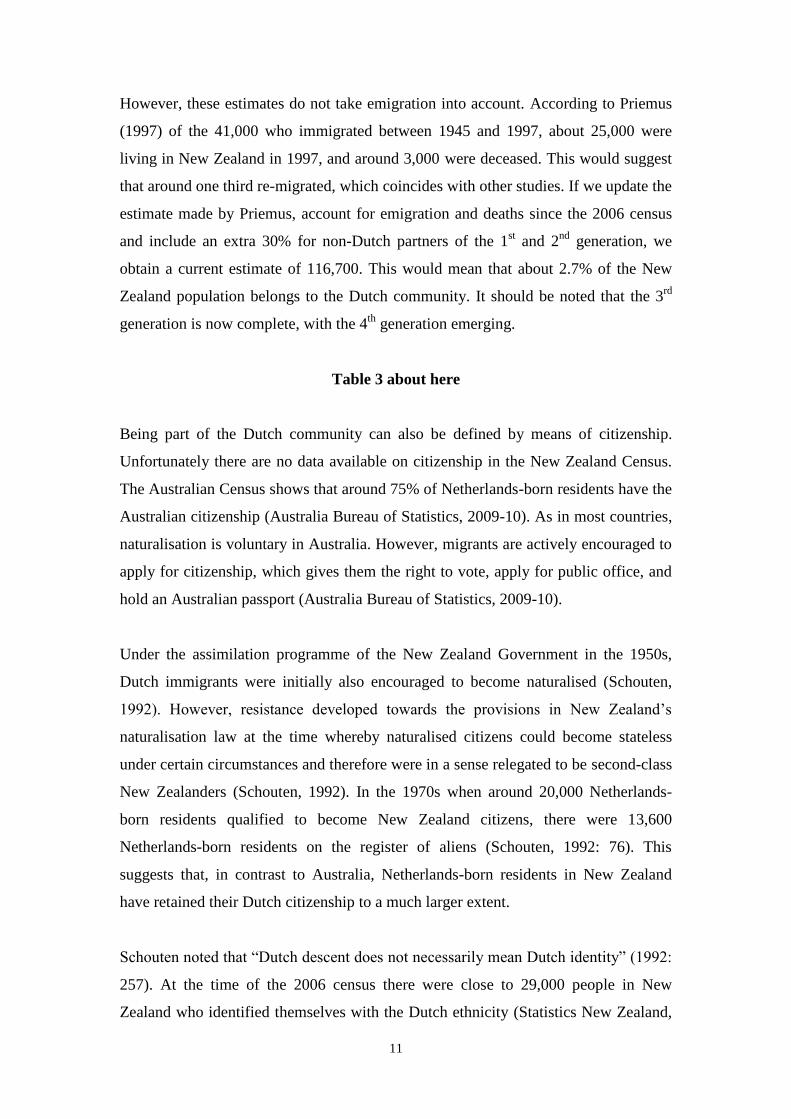
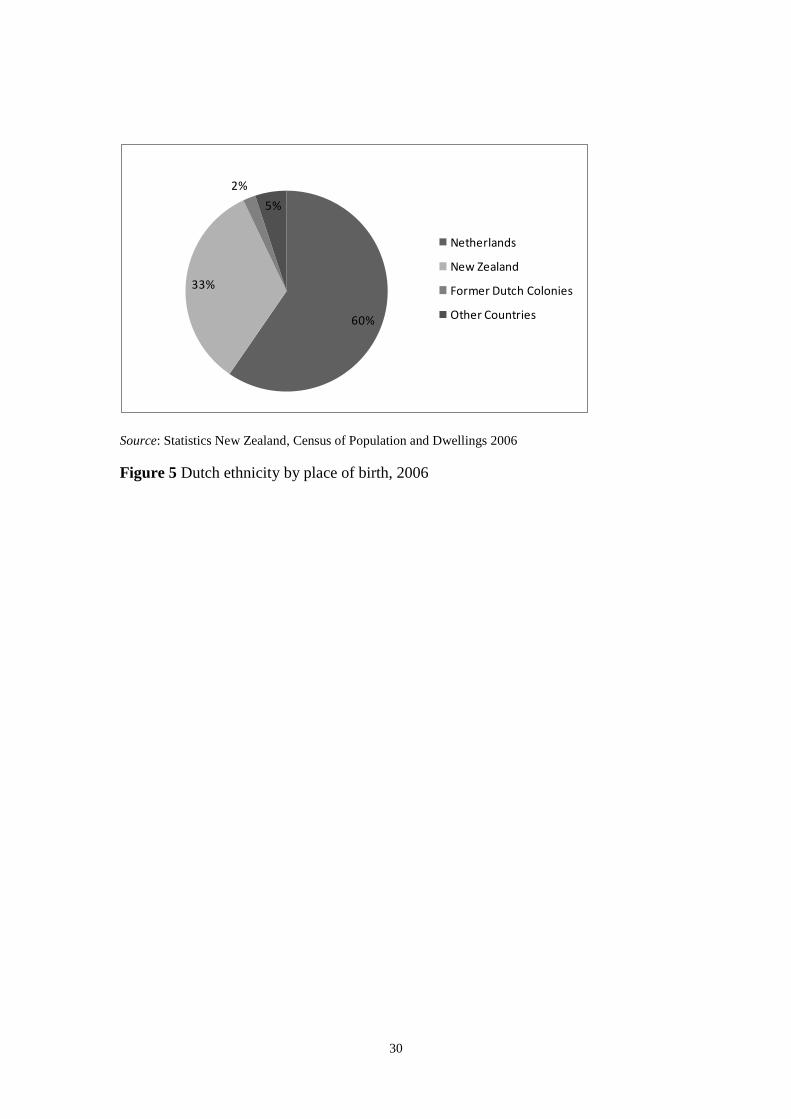
Looking at the relationship between identifying with the Dutch ethnicity and
birthplace, the 2006 Census shows that 60% of those acknowledging Dutch ethnicity
were born in the Netherlands; while 33% were born in New Zealand, 2% in the
Former Dutch Colonies and 5% in Other Countries (Figure 5).
Figure 5 about here
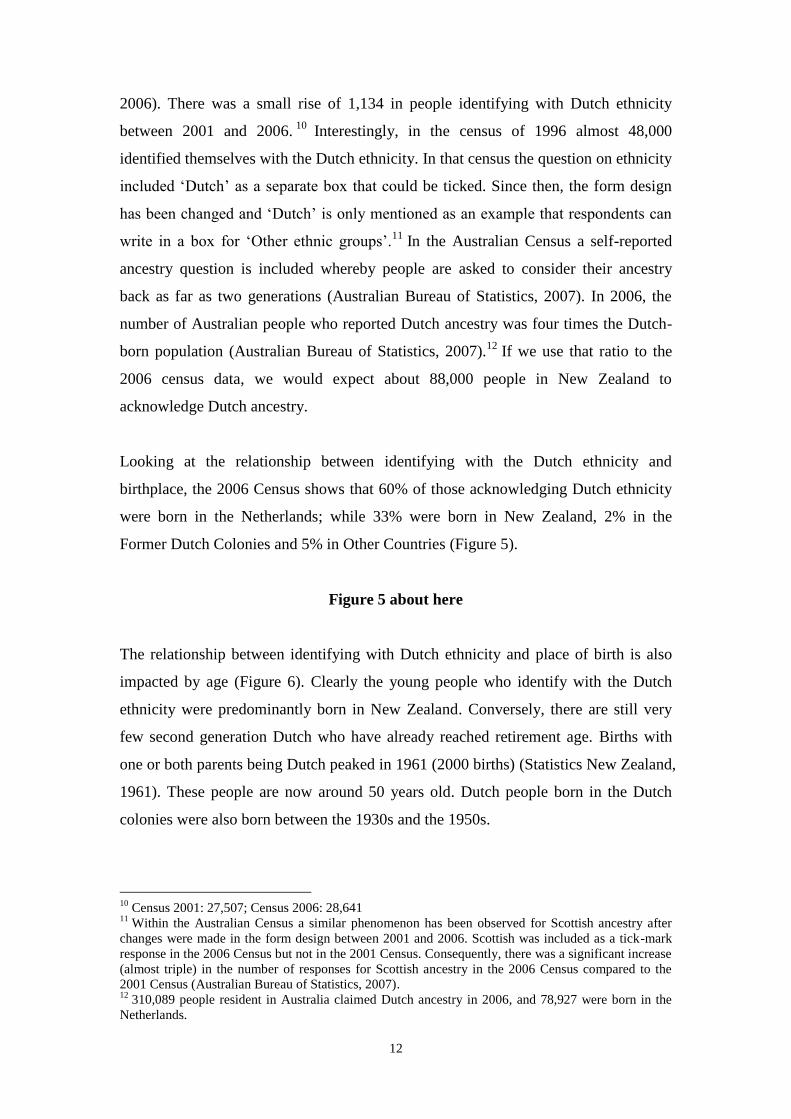
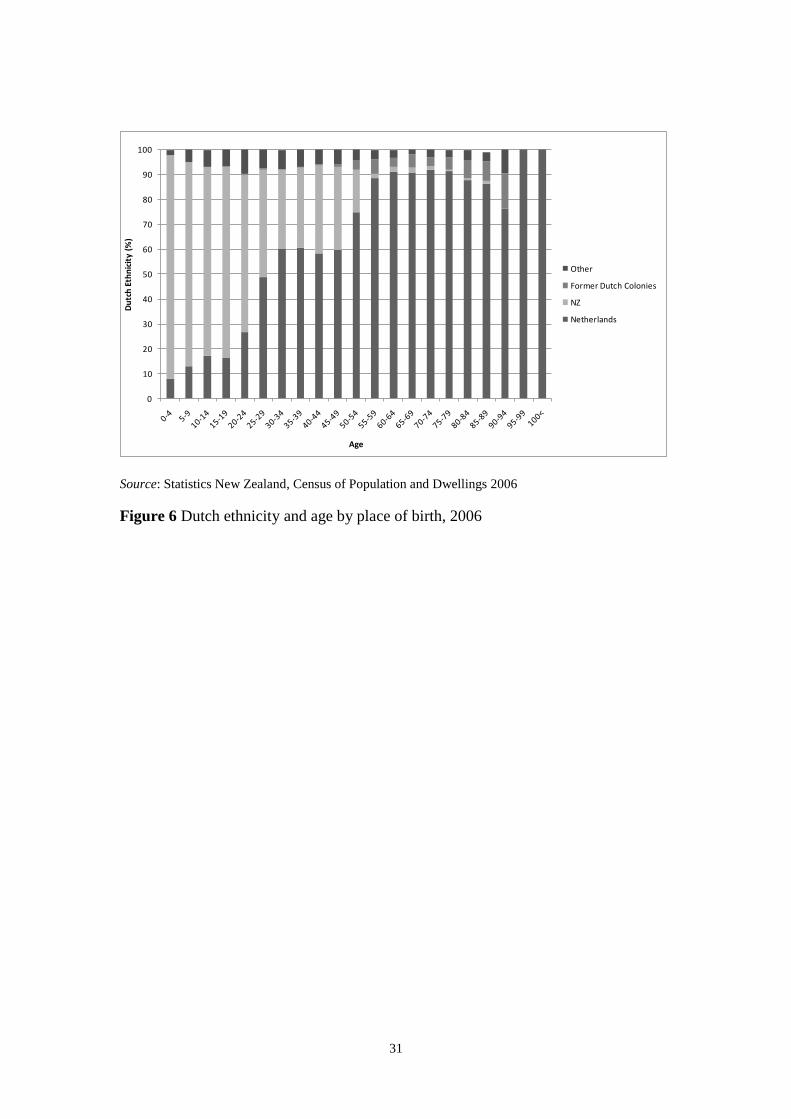
The relationship between identifying with Dutch ethnicity and place of birth is also
impacted by age (Figure 6). Clearly the young people who identify with the Dutch
ethnicity were predominantly born in New Zealand. Conversely, there are still very
few second generation Dutch who have already reached retirement age. Births with
one or both parents being Dutch peaked in 1961 (2000 births) (Statistics New Zealand,
1961). These people are now around 50 years old. Dutch people born in the Dutch
colonies were also born between the 1930s and the 1950s.
10
Census 2001: 27,507; Census 2006: 28,641 11
Within the Australian Census a similar phenomenon has been observed for Scottish ancestry after
changes were made in the form design between 2001 and 2006. Scottish was included as a tick-mark
response in the 2006 Census but not in the 2001 Census. Consequently, there was a significant increase
(almost triple) in the number of responses for Scottish ancestry in the 2006 Census compared to the
2001 Census (Australian Bureau of Statistics, 2007). 12
310,089 people resident in Australia claimed Dutch ancestry in 2006, and 78,927 were born in the
Netherlands.
13
Figure 6 about here
Alongside birthplace and ethnic identity, language also plays an important part in
identifying with and giving meaning to descent and culture of a community. In this
respect language has been found to be one of the most common ways in which
ethnicity is mobilised as a way to protect and advance a culture (Fenton, 2003).
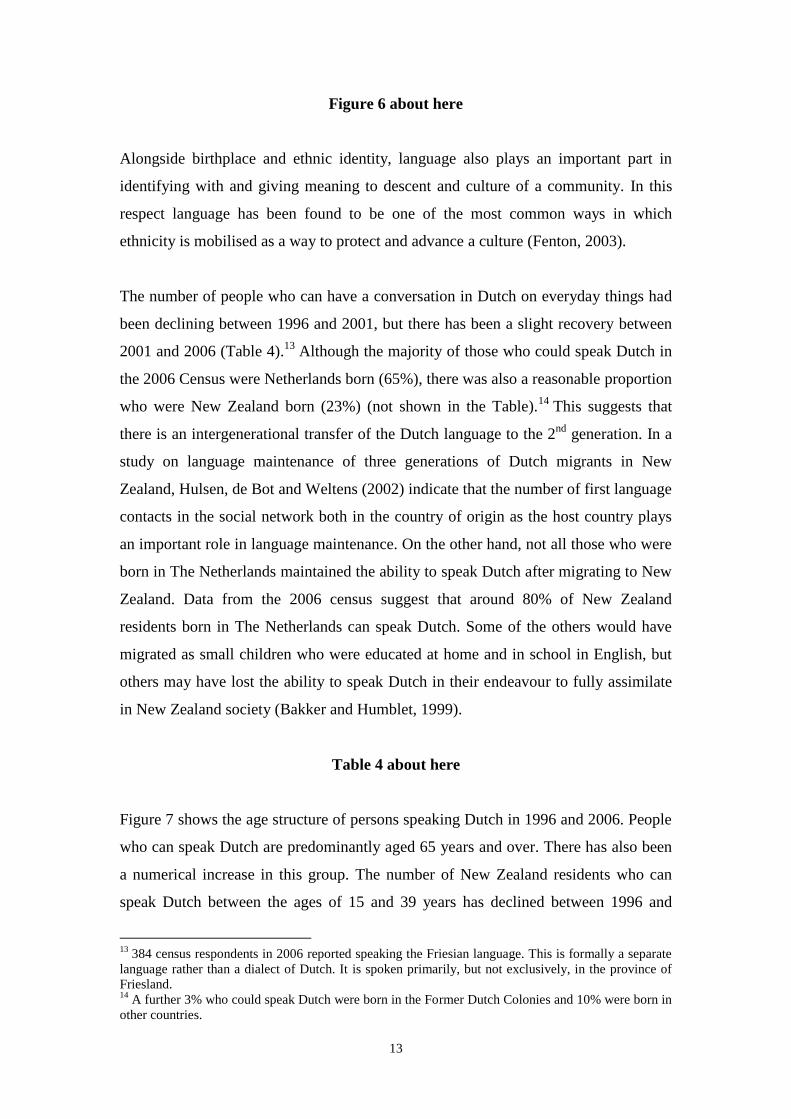
The number of people who can have a conversation in Dutch on everyday things had
been declining between 1996 and 2001, but there has been a slight recovery between
2001 and 2006 (Table 4).13
Although the majority of those who could speak Dutch in
the 2006 Census were Netherlands born (65%), there was also a reasonable proportion
who were New Zealand born (23%) (not shown in the Table).14
This suggests that
there is an intergenerational transfer of the Dutch language to the 2nd
generation. In a
study on language maintenance of three generations of Dutch migrants in New
Zealand, Hulsen, de Bot and Weltens (2002) indicate that the number of first language
contacts in the social network both in the country of origin as the host country plays
an important role in language maintenance. On the other hand, not all those who were
born in The Netherlands maintained the ability to speak Dutch after migrating to New
Zealand. Data from the 2006 census suggest that around 80% of New Zealand
residents born in The Netherlands can speak Dutch. Some of the others would have
migrated as small children who were educated at home and in school in English, but
others may have lost the ability to speak Dutch in their endeavour to fully assimilate
in New Zealand society (Bakker and Humblet, 1999).
Table 4 about here
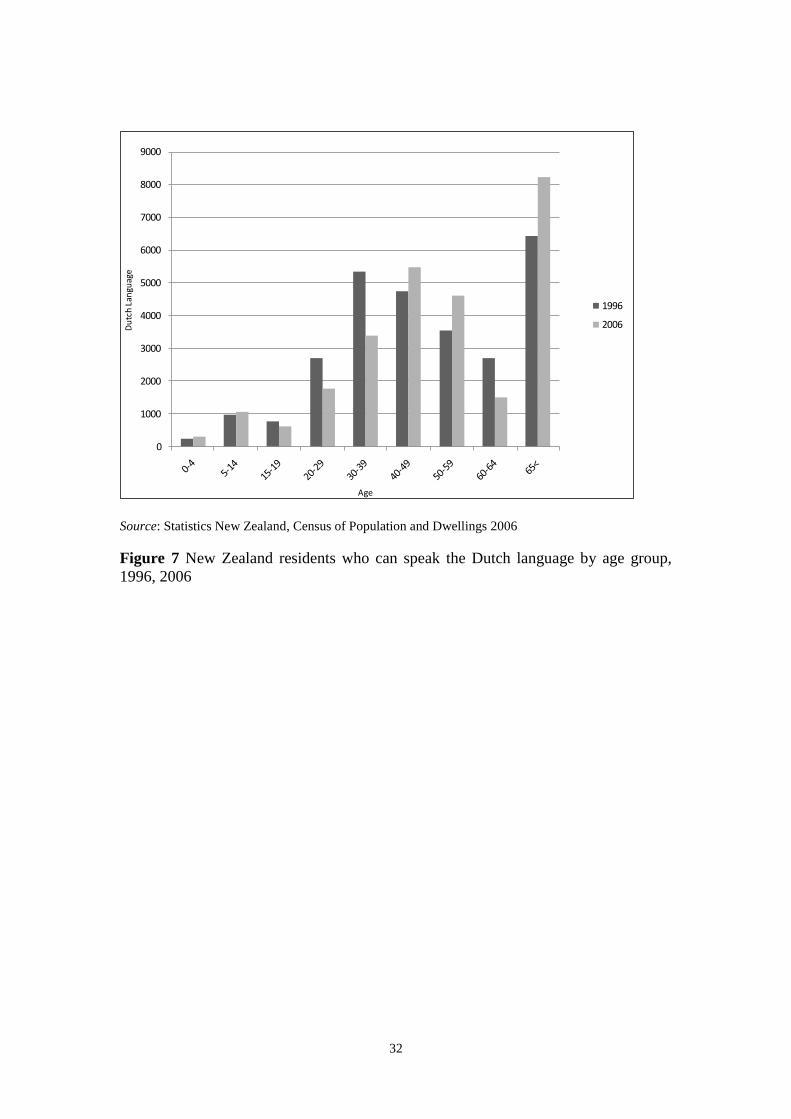
Figure 7 shows the age structure of persons speaking Dutch in 1996 and 2006. People
who can speak Dutch are predominantly aged 65 years and over. There has also been
a numerical increase in this group. The number of New Zealand residents who can
speak Dutch between the ages of 15 and 39 years has declined between 1996 and
13
384 census respondents in 2006 reported speaking the Friesian language. This is formally a separate
language rather than a dialect of Dutch. It is spoken primarily, but not exclusively, in the province of
Friesland. 14
A further 3% who could speak Dutch were born in the Former Dutch Colonies and 10% were born in
other countries.
14
2006, but among the 0-14 year olds there was an increase, reflecting net migration
from The Netherlands over this period.
Furthermore, in 1996 the second-largest Dutch-speaking age group was 30-39 years,
but this shifted to the 40-49 years group by 2006. These are clearly the same people
(cohort), who aged ten years between 1996 and 2006. The cohort effect is also clear
from comparing the 40-49 year olds in 1996 with the 50-59 year olds in 2006. These
age groups are not much affected by migration or mortality.
Figure 7 about here
4. Three Cohorts: A Typology
The dynamics of “Dutch Kiwi” community development since the 1950s can be
explored through the examination of three very distinct cohorts, each covering
roughly 20 years of arrivals: post-war migrants (those who arrived in the 1950s and
1960s), skilled migrants (those who arrived in the 1970s and 1980s), and transnational
professionals (those who arrived in the 1990s or more recently). This will be
demonstrated in what follows by means of a description of the social-demographic
characteristics and outcomes of the three different cohorts, focussing on: age at arrival,
number of children, religion, education, income, occupation, level of urbanisation and
geographical distribution.
Dutch Kiwis are defined in this context as those born outside New Zealand who
declared Dutch ethnicity in the 2006 census. For simplicity, and due to constraints in
deriving census tabulations, the benchmark for those who identify with the Dutch
ethnicity is all other ethnicities combined. Due to the years in which censuses were
held and the most recent census being 2006, the cohorts are formally defined by year
of first arrival in New Zealand 1947-1966, 1967-1986 and 1987-2006. The
differences and similarities that are discussed between the arrival cohorts can be
attributed to age, period and cohort effects. However, disentangling such effects
formally goes beyond the scope of this paper.
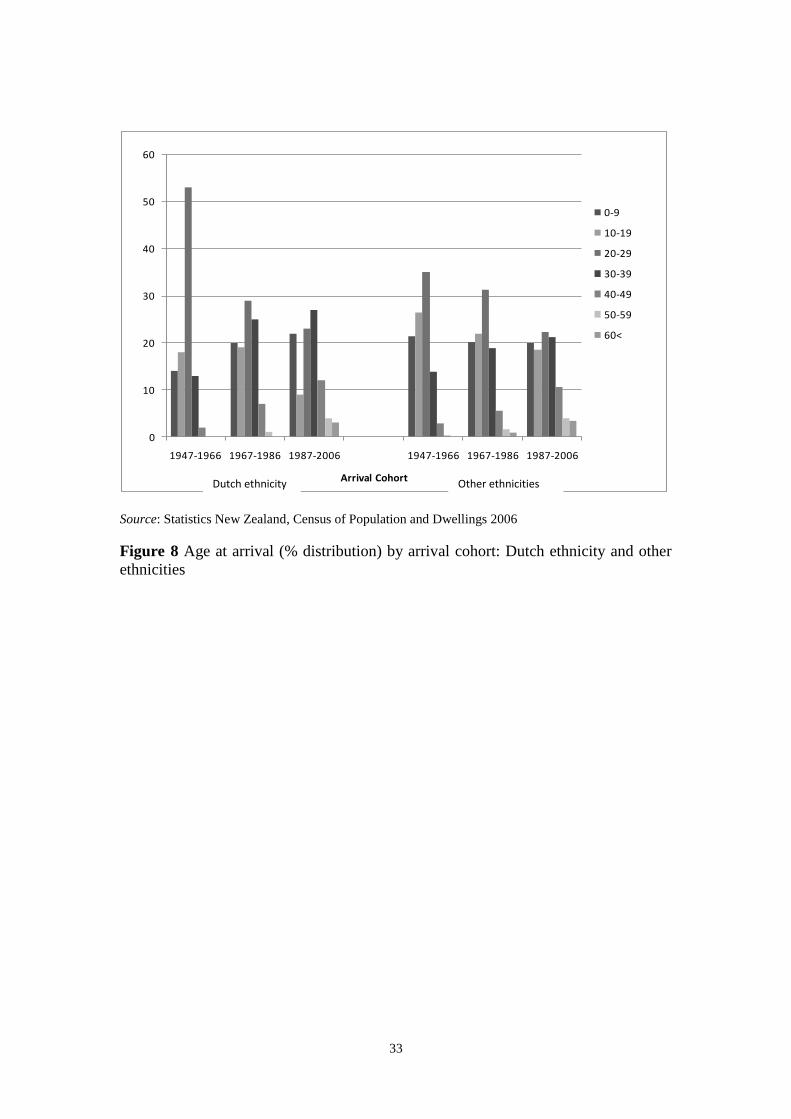
The total number of migrants with Dutch ethnicity, arriving between 1947 and 1966,
counted in the 2006 census is 7,971 (see Table 5). This compares with 5,127 arriving
15
between 1967 and 1986. Of both cohorts, all are of course adults by 2006. Of those
arriving between 1987 and 2006, a total of 5,166, 16 percent are aged between 0 and
14. The first cohort of Dutch migrants was predominantly between 20-29 years old
when they arrived in New Zealand (Figure 8). This is not surprising considering that
the ordinances of the Assisted Passage Scheme targeted assistance to single persons
who were in this age range. Dutch migrants were predominantly single on arrival,
often marrying a Dutch partner soon after arrival, or marrying New Zealanders
(Thomson, 1970).15
Most of these 1947-1966 arrivals, surviving until now, are aged in
their 70s and 80s. Comparing the 1947-1966 cohort of Dutch migrants with migrants
of other ethnic groups clearly shows that Dutch immigration was considerably more
selective of age than other immigration. More recent cohorts of Dutch migrants are on
average older on arrival and therefore more likely to arrive as families with young
children. This finding is confirmed by Van Dalen and Henkens (2008:20) who found
that between 1960 and 2006 the number of Dutch emigrants aged 30-49 years was
larger in comparison to those aged 20-29 years, and this therefore suggests that a rise
in the average age at the time of migration has taken place. For the most recent arrival
cohort, 1987-2006, there is also a noticeable difference in the age distribution. Among
the Dutch immigrants, teenagers are clearly underrepresented. This is not the case
among migrants of other ethnicities. The mean age in 2006 of those in the 1947-1966
arrival cohort of Dutch migrants was 70.5, compared with a mean age of 65.7 for this
arrival cohort of other ethnicities (see Table 5). The mean age in 2006 of the “skilled
migrant cohort” (arriving 1967-1986) is about 50, the same for Dutch and other
ethnicities. The „transnational professionals” are younger, with an average age of 35.1
among the Dutch and 32.5 among the other ethnicities.
Table 5 about here
Figure 8 about here
Only a small percentage (6.1%) of the 1947-1966 cohort of women, the post-war
migrants, have remained childless (see Table 5). For the skilled migrants of the 1970s
15
According to Thomson (1970) 25.6% of Dutch males and 45% of Dutch females married in the
twelve month period preceding migration, or within a year after arrival. By 1964, 25.3% Dutch males
and 8.3% of Dutch females married New Zealanders or other persons of British birth (Thomson, 1970).
16
and 1980s this percentage is higher (17.0%) and for the more recent migrants even
higher still (37.8%), although for this last group we need to take into account that
child bearing has not yet been completed. For all three cohorts, childlessness is more
prevalent among migrant women of other ethnicities. Conversely, post-war Dutch
migrant women are clearly characterised by having large families with more than a
third having four or more children in comparison to only one-fifth of migrant women
from other ethnicities. The transnational professionals (arriving 1987-2006) also have
larger families than migrants of other ethnicities. However, the cohort of Dutch
skilled migrants (arriving 1967-1986) have smaller families, reflected in only 13.4%
of women having four or more children, compared with 15.9% among the other
ethnicities.
The fact that the post-war Dutch migrants had larger families may reflect their
religious background in that almost 40% of post-war Dutch migrants were Catholic.
(to save space, data on religion are not shown in Table 5, except the percentage with
no religion). Most of the post-war Dutch migrants were born and brought up in a
sectarian society and often their migration to New Zealand was supported by church-
run immigration organisations (Schouten, 1992: 161). Interestingly, among the
religious groups, the percentage of Catholics declined across the arrival cohorts from
38% to 20% while the Protestant faith remained stable at around 15%. The results
suggest that the secularisation of the Dutch society (which is stronger than in New
Zealand) has been exported through this post-war migrant cohort. However, the
secularisation of Dutch society can also clearly been seen by the sharp increase in the
proportion of people with no religion across the arrival cohorts (Table 5). The Dutch
migrants have always been more secular than other ethnicities, but among the latter
the percentage who do not proclaim to have a religion increased from 20.3% for the
1947-1966 arrival cohort to 27.3% for the 1987-2006 cohort, compared with 22.7%
and 46.8% respectively for the Dutch Kiwis.
Looking at the educational level of the three cohorts, the 2006 census data show that
each successive arrival cohort is much better educated (Table 5). Moreover, even in
the first cohort, about one third had post-school education. Interestingly, the
percentage with a tertiary qualification among Dutch post-war migrants was lower
than among other ethnicities, but this reversed for the skilled migrant and
17
transnational migrant cohorts. When comparing the educational level of Dutch
migrants in New Zealand and Australia in the 1970s, Kruiter (1981) showed that at
that time Dutch migrants in New Zealand were on average higher educated than
Dutch migrants in Australia.
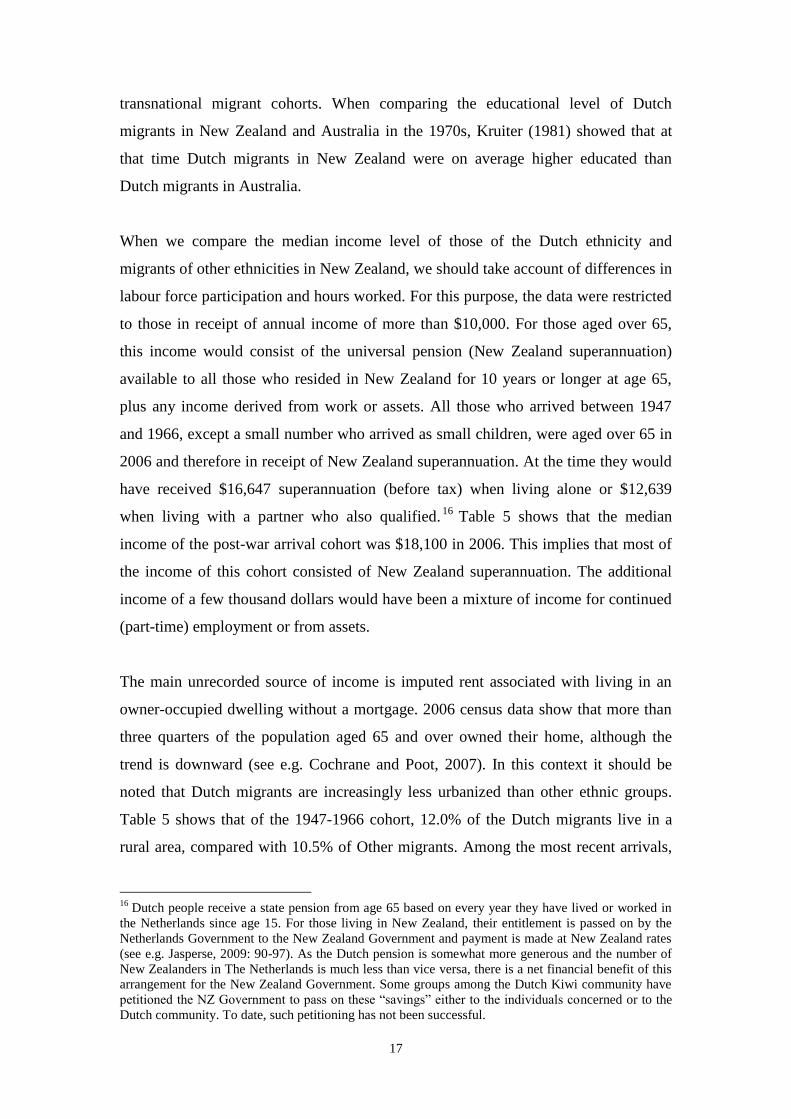
When we compare the median income level of those of the Dutch ethnicity and
migrants of other ethnicities in New Zealand, we should take account of differences in
labour force participation and hours worked. For this purpose, the data were restricted
to those in receipt of annual income of more than $10,000. For those aged over 65,
this income would consist of the universal pension (New Zealand superannuation)
available to all those who resided in New Zealand for 10 years or longer at age 65,
plus any income derived from work or assets. All those who arrived between 1947
and 1966, except a small number who arrived as small children, were aged over 65 in
2006 and therefore in receipt of New Zealand superannuation. At the time they would
have received $16,647 superannuation (before tax) when living alone or $12,639
when living with a partner who also qualified.16
Table 5 shows that the median
income of the post-war arrival cohort was $18,100 in 2006. This implies that most of
the income of this cohort consisted of New Zealand superannuation. The additional
income of a few thousand dollars would have been a mixture of income for continued
(part-time) employment or from assets.
The main unrecorded source of income is imputed rent associated with living in an
owner-occupied dwelling without a mortgage. 2006 census data show that more than
three quarters of the population aged 65 and over owned their home, although the
trend is downward (see e.g. Cochrane and Poot, 2007). In this context it should be
noted that Dutch migrants are increasingly less urbanized than other ethnic groups.
Table 5 shows that of the 1947-1966 cohort, 12.0% of the Dutch migrants live in a
rural area, compared with 10.5% of Other migrants. Among the most recent arrivals,
16
Dutch people receive a state pension from age 65 based on every year they have lived or worked in
the Netherlands since age 15. For those living in New Zealand, their entitlement is passed on by the
Netherlands Government to the New Zealand Government and payment is made at New Zealand rates
(see e.g. Jasperse, 2009: 90-97). As the Dutch pension is somewhat more generous and the number of
New Zealanders in The Netherlands is much less than vice versa, there is a net financial benefit of this
arrangement for the New Zealand Government. Some groups among the Dutch Kiwi community have
petitioned the NZ Government to pass on these “savings” either to the individuals concerned or to the
Dutch community. To date, such petitioning has not been successful.
18
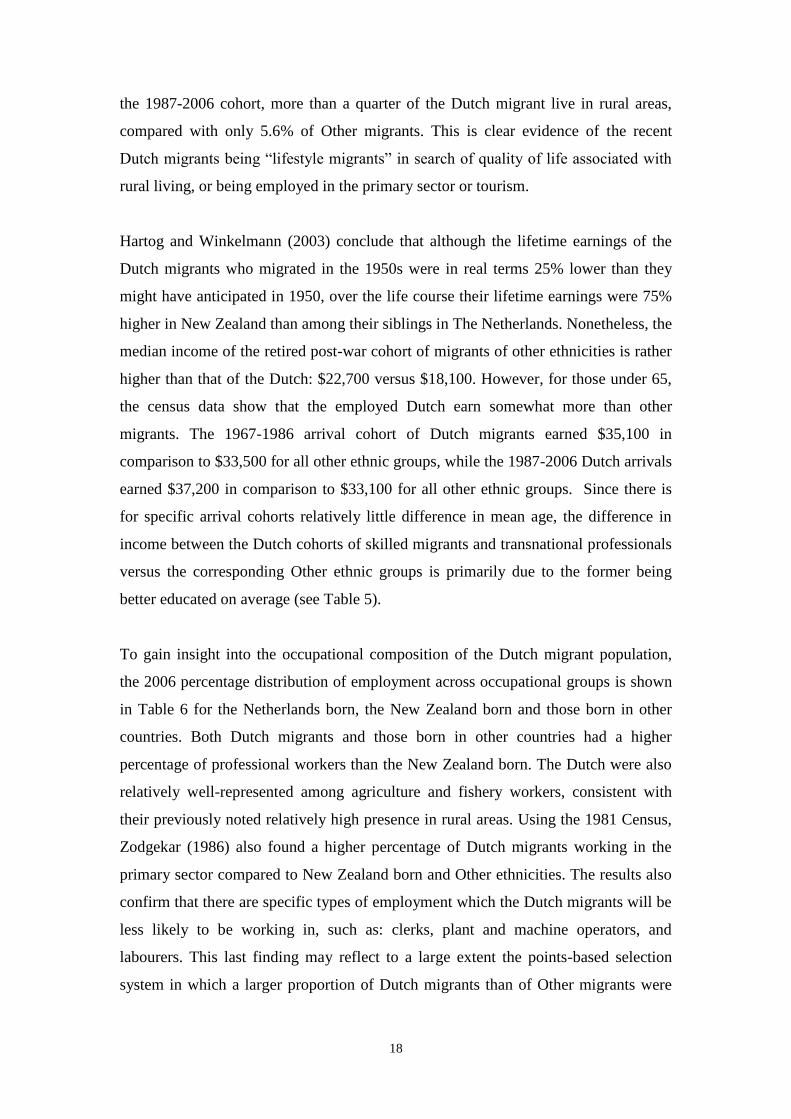
the 1987-2006 cohort, more than a quarter of the Dutch migrant live in rural areas,
compared with only 5.6% of Other migrants. This is clear evidence of the recent
Dutch migrants being “lifestyle migrants” in search of quality of life associated with
rural living, or being employed in the primary sector or tourism.
Hartog and Winkelmann (2003) conclude that although the lifetime earnings of the
Dutch migrants who migrated in the 1950s were in real terms 25% lower than they
might have anticipated in 1950, over the life course their lifetime earnings were 75%
higher in New Zealand than among their siblings in The Netherlands. Nonetheless, the
median income of the retired post-war cohort of migrants of other ethnicities is rather
higher than that of the Dutch: $22,700 versus $18,100. However, for those under 65,
the census data show that the employed Dutch earn somewhat more than other
migrants. The 1967-1986 arrival cohort of Dutch migrants earned $35,100 in
comparison to $33,500 for all other ethnic groups, while the 1987-2006 Dutch arrivals
earned $37,200 in comparison to $33,100 for all other ethnic groups. Since there is
for specific arrival cohorts relatively little difference in mean age, the difference in
income between the Dutch cohorts of skilled migrants and transnational professionals
versus the corresponding Other ethnic groups is primarily due to the former being
better educated on average (see Table 5).
To gain insight into the occupational composition of the Dutch migrant population,
the 2006 percentage distribution of employment across occupational groups is shown
in Table 6 for the Netherlands born, the New Zealand born and those born in other
countries. Both Dutch migrants and those born in other countries had a higher
percentage of professional workers than the New Zealand born. The Dutch were also
relatively well-represented among agriculture and fishery workers, consistent with
their previously noted relatively high presence in rural areas. Using the 1981 Census,
Zodgekar (1986) also found a higher percentage of Dutch migrants working in the
primary sector compared to New Zealand born and Other ethnicities. The results also
confirm that there are specific types of employment which the Dutch migrants will be
less likely to be working in, such as: clerks, plant and machine operators, and
labourers. This last finding may reflect to a large extent the points-based selection
system in which a larger proportion of Dutch migrants than of Other migrants were
19
recruited as skilled workers and entrepreneurs, with fewer being admitted under
family reunion rules that tend to be the admission criteria for low skilled migrants.
Table 6 about here
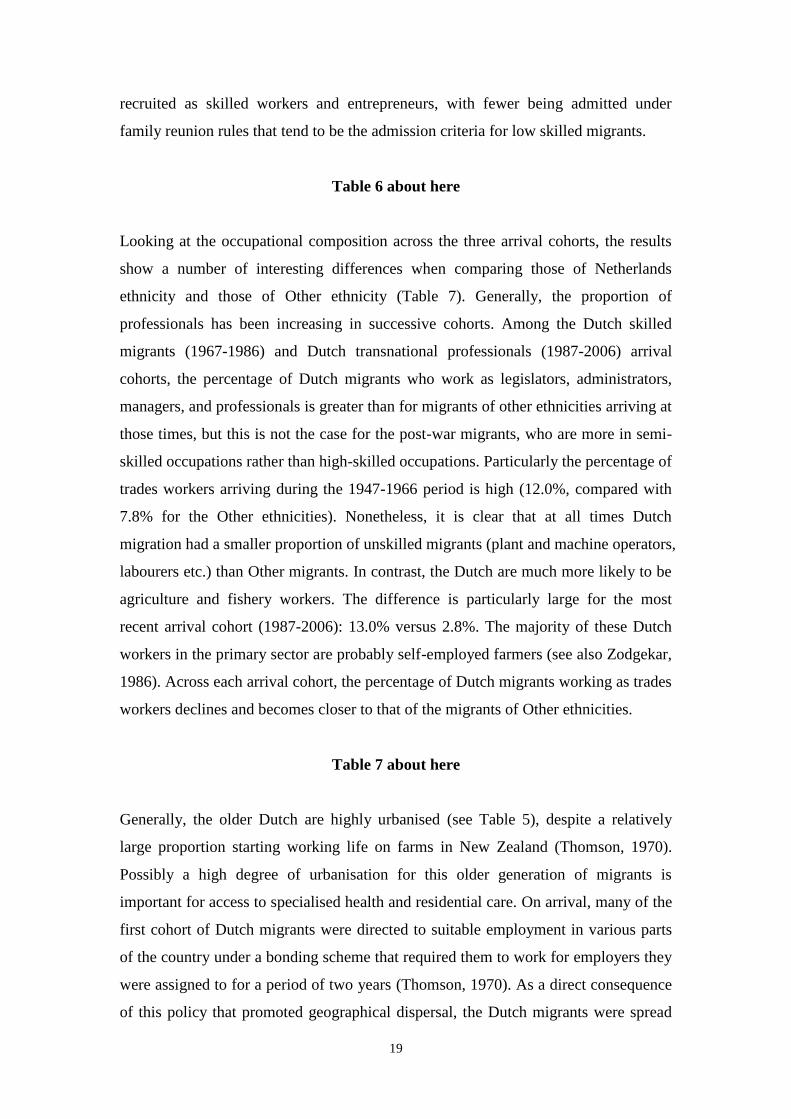
Looking at the occupational composition across the three arrival cohorts, the results
show a number of interesting differences when comparing those of Netherlands
ethnicity and those of Other ethnicity (Table 7). Generally, the proportion of
professionals has been increasing in successive cohorts. Among the Dutch skilled
migrants (1967-1986) and Dutch transnational professionals (1987-2006) arrival
cohorts, the percentage of Dutch migrants who work as legislators, administrators,
managers, and professionals is greater than for migrants of other ethnicities arriving at
those times, but this is not the case for the post-war migrants, who are more in semi-
skilled occupations rather than high-skilled occupations. Particularly the percentage of
trades workers arriving during the 1947-1966 period is high (12.0%, compared with
7.8% for the Other ethnicities). Nonetheless, it is clear that at all times Dutch
migration had a smaller proportion of unskilled migrants (plant and machine operators,
labourers etc.) than Other migrants. In contrast, the Dutch are much more likely to be
agriculture and fishery workers. The difference is particularly large for the most
recent arrival cohort (1987-2006): 13.0% versus 2.8%. The majority of these Dutch
workers in the primary sector are probably self-employed farmers (see also Zodgekar,
1986). Across each arrival cohort, the percentage of Dutch migrants working as trades
workers declines and becomes closer to that of the migrants of Other ethnicities.
Table 7 about here
Generally, the older Dutch are highly urbanised (see Table 5), despite a relatively
large proportion starting working life on farms in New Zealand (Thomson, 1970).
Possibly a high degree of urbanisation for this older generation of migrants is
important for access to specialised health and residential care. On arrival, many of the
first cohort of Dutch migrants were directed to suitable employment in various parts
of the country under a bonding scheme that required them to work for employers they
were assigned to for a period of two years (Thomson, 1970). As a direct consequence
of this policy that promoted geographical dispersal, the Dutch migrants were spread
20
throughout the country in a pattern similar to the distribution of the total population.
Moreover, the residential stability of Dutch migrants was high. In 1964 almost half of
the Dutch migrants had not moved from the place they had settled on arrival, and the
other half had lived in only two or three localities (Thomson, 1970). As noted earlier,
the more recent cohorts more often live in rural areas, coinciding with their life-style
motives for leaving their country of origin (Kruiter, 1981; van Dalen and Henkens,
2008).
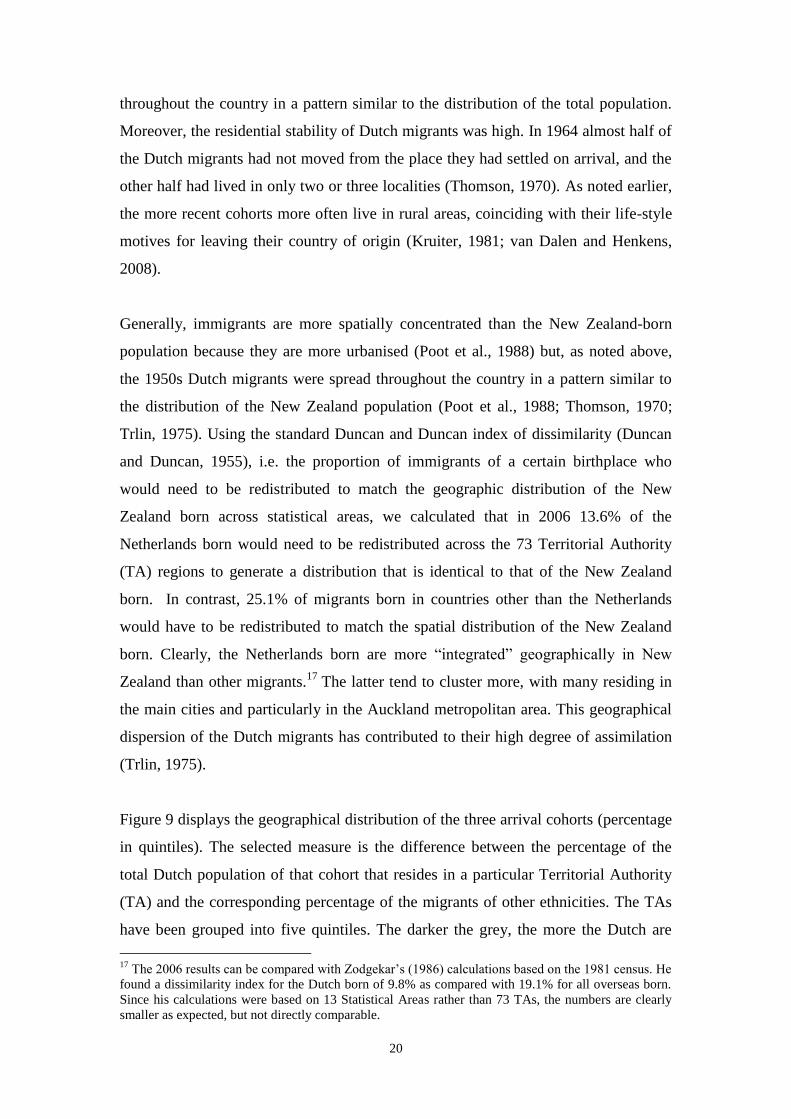
Generally, immigrants are more spatially concentrated than the New Zealand-born
population because they are more urbanised (Poot et al., 1988) but, as noted above,
the 1950s Dutch migrants were spread throughout the country in a pattern similar to
the distribution of the New Zealand population (Poot et al., 1988; Thomson, 1970;
Trlin, 1975). Using the standard Duncan and Duncan index of dissimilarity (Duncan
and Duncan, 1955), i.e. the proportion of immigrants of a certain birthplace who
would need to be redistributed to match the geographic distribution of the New
Zealand born across statistical areas, we calculated that in 2006 13.6% of the
Netherlands born would need to be redistributed across the 73 Territorial Authority
(TA) regions to generate a distribution that is identical to that of the New Zealand
born. In contrast, 25.1% of migrants born in countries other than the Netherlands
would have to be redistributed to match the spatial distribution of the New Zealand
born. Clearly, the Netherlands born are more “integrated” geographically in New
Zealand than other migrants.17
The latter tend to cluster more, with many residing in
the main cities and particularly in the Auckland metropolitan area. This geographical
dispersion of the Dutch migrants has contributed to their high degree of assimilation
(Trlin, 1975).
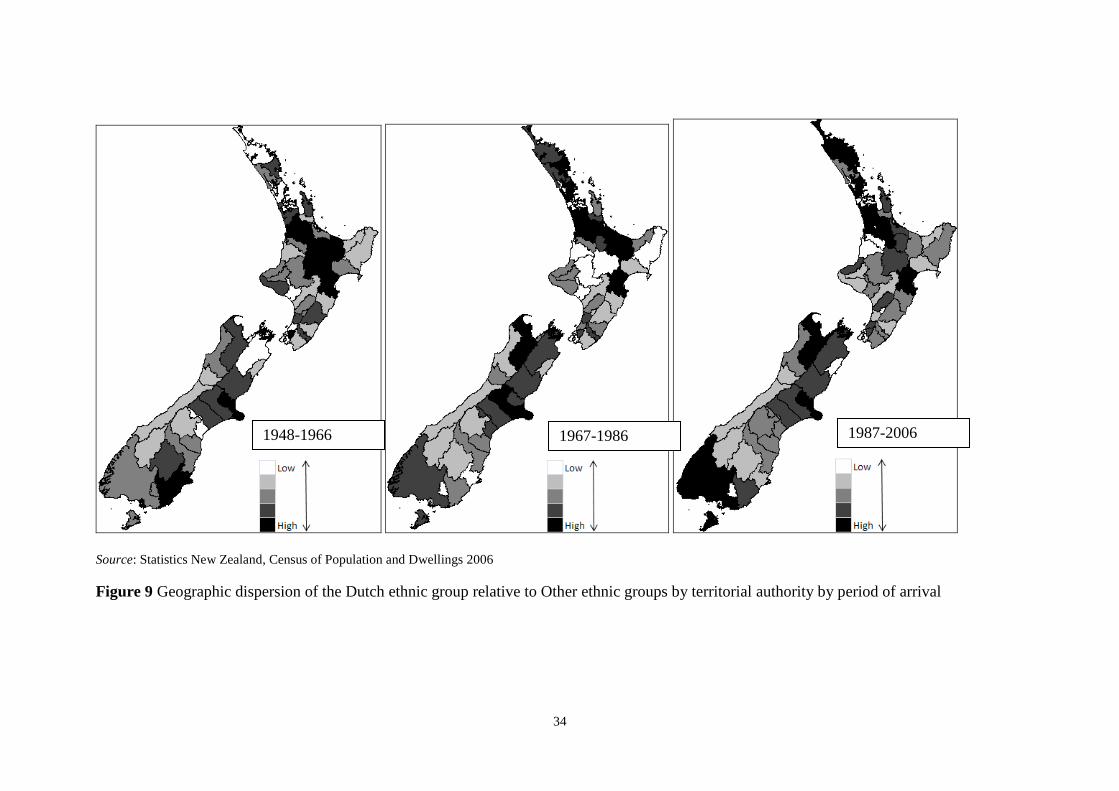
Figure 9 displays the geographical distribution of the three arrival cohorts (percentage
in quintiles). The selected measure is the difference between the percentage of the
total Dutch population of that cohort that resides in a particular Territorial Authority
(TA) and the corresponding percentage of the migrants of other ethnicities. The TAs
have been grouped into five quintiles. The darker the grey, the more the Dutch are
17
The 2006 results can be compared with Zodgekar‟s (1986) calculations based on the 1981 census. He
found a dissimilarity index for the Dutch born of 9.8% as compared with 19.1% for all overseas born.
Since his calculations were based on 13 Statistical Areas rather than 73 TAs, the numbers are clearly
smaller as expected, but not directly comparable.
21
present in a TA relative to other migrants. The relative concentration in 2006 of the
post-war migrants in Dunedin, Christchurch, South Auckland, Waikato and Hawke‟s
Bay is clear. Particularly locations with ports were noted by Thomson (1970) as
having a higher proportion of the post-war settlers. In contrast, the transnational
professionals (Dutch migrants arriving between 1987-2006) are disproportionally
located in Southland, Christchurch, Nelson, Hawke‟s Bay, the Waikato, South
Auckland and Northland. According to Thomson (1970) particularly the Auckland
and Northland area gained an increase in population after World War II due to farm
and forest development with Dutch farm labourers seizing opportunities for
ownership of dairy farms. Interestingly, it has been suggested that the larger
concentrations of Dutch migrants in the Nelson area are due to the publicity issued to
potential migrants (Thomson, 1970). The increasing attractiveness of Northland and
Southland to the recent Dutch migrants coincides with tourism and primary sector
developments in these areas. Finally, there is also some stability in the patterns, which
is interesting given the initial post-war policy of planned dispersal and bonded
employment.
Figure 9 about here
5. Conclusion
This paper set out to explore the dynamics of Dutch community change in New
Zealand during the last half century, taking a quantitative demographic and socio-
economic perspective that utilises secondary data sources in New Zealand.
There is has been a slow decline in the number of Dutch-born residents in New
Zealand, predominantly due to ageing. However, given the post-war migrants
reaching high ages, the decline is likely to accelerate in the years to come, unless
immigration from The Netherlands increases substantially. Clearly, the Dutch
community is undergoing a pronounced age-structural transition and, with 40% aged
over 65, the Dutch are among the most aged migrant communities in New Zealand.
This finding illustrates the age structural changes which are taking place within
certain migrant communities after the large migration waves which took place after
World War II to settler countries such as New Zealand, Australia and Canada. The
22
Dutch-born migrants of Australia are currently also ageing rapidly (e.g., Velthuis,
2005) and the same is undoubtedly true in Canada. An example of another migrant
group within New Zealand which shows similar age structural changes are the
Scottish migrants (Brooking and Coleman, 2003).
Our study clearly shows that there are different profiles of the post-war migrants
(1947-66), skilled migrants (1967-86) and professional transnational migrants (since
1987) with the first cohort (the post-war migrants) mostly younger on arrival, more
religious, less educated and having more children than the subsequent cohorts. In
contrast with the long-run trend in both host and sending societies, the most recent
cohorts of Dutch migrants in New Zealand are less urbanised. The surviving post-war
Dutch migrants are now at late retirement ages, with New Zealand Superannuation the
main source of income. The most recent migrants are the best qualified, with more
than half having a post-school qualification. This is reflected in earnings of those still
in employment which are higher than those of comparable New Zealand born.
Until recently little attention has been given to the ageing of immigrant groups. Most
of the Dutch migrants are now in the seventies and eighties. Their rapid assimilation
into New Zealand society appears to have made them “invisible” both in terms of
being migrants and also in terms of their status as an increasingly ageing community.
Clearly there is a lack of representative data, with research often based on very small
samples, such as Pegge‟s (2006) study of 18 recent migrants and Webster‟s (2007)
study of 6 Dutch migrant families. Specific research topics such as health care needs
of the ageing Dutch New Zealanders and the acculturation of the 2nd
and 3rd
generation warrant larger scale quantitative research.
23
References
Australian Bureau of Statistics (2009-10). Yearbook Australia 2009-10. Canberra:
Australian Bureau of Statistics.
Bakker, G. E. and Humblet, S. A. (1999). The Best of Both Worlds? – Het Beste van
Beide Werelden? Auckland: Stiching Internationalisering Nederlandse Taal en
Cultuur, Department of Germanic Languages, University of Auckland.
Brooking, T. and Coleman, J. (2003). The Heather and the Fern: Scottish Migration
and New Zealand Settlement. Dunedin: Otago University Press.
de Bres, J. (2004). Intergenerational attitudes towards Dutch language maintenance
across three periods of arrival in New Zealand. Victoria University of
Wellington Working Papers in Linguistics, 16: 1-20.
Castles, S. and Miller M.J. (2009). The Age of Migration: International Population
Movements in the Modern World, 4th
edition. The Guilford Press.
Cochrane, W. and Poot, J. (2007). Homeownership and the New Zealand Labour
Market. In: P.S. Morrison (ed) Labour, Employment and Work in New
Zealand 2006 - Proceedings of the Twelfth Conference. Victoria University of
Wellington, pp. 416-426.
Duncan, O.D. and Duncan, B. (1955). Residential distribution and occupational
stratification. American Journal of Sociology, 60(5): 493-503.
Fenton, S. (2003). Ethnicity. Polity Press UK.
Gould, J. (1980). The Rake’s Progress? The New Zealand Economy Since 1945.
Auckland: Hodder and Stoughton.
Hartog, J. and Winkelmann, R. (2003). Comparing migrants to non-migrants: The
case of Dutch migration to New Zealand. Journal of Population Economics,
16: 683-705.
Hatton, T.J. and Williamson, J.G. (1994). What drove the mass migrations from
Europe in the Late Nineteenth Century? Population and Development Review,
20: 533-559.
Hofstede, B.P. (1964). Thwarted exodus: Post war overseas migration from the
Netherlands. Den Haag: Martinus Nijhoff.
Hulsen, M., de Bot, K. and Weltens, B. (2002). “Between two worlds”. Social
networks, language shift and language processing in three generations of
Dutch migrants in New Zealand. International Journal of the Sociology of
Language, 153: 27-52.
Jasperse, J.A. (ed.) (2009). Dutch Forum "Onze HoeWie" Proceedings. Wellington:
South Pacific Publishing Consultancy.
Kruiter, H. (1981). [Pack up and Go: Research into the Characteristics and Motives of
Emigrants to Australia, Canada and New Zealand] Inpakken en wegwezen?
Een onderzoek naar kenmerken en motieven van emigranten naar Australie,
Canada en Nieuw Zeeland. The Hague: Ministerie van Sociale Zaken.
Massey, D.S., Arango, J., Hugo, G., Kouaouci, A., Pellegrino, A. and Taylor, J.E.
(1998). Worlds in Motion: Understanding International Migration at the End
of the Millennium. Oxford: Clarendon Press.
Merwood, P. (2008). Migration Trends 2006/07. Wellington: Department of Labour.
Papademetriou, D.G., Sumption, M. and Terrazas A. with C. Burkert, S. Loyal and R.
Ferrero-Turrión (2010). Migration and Immigrants Two Years after the
Financial Collapse: Where Do We Stand? Washington DC: Migration Policy
Institute.
24
Pegge, B. (2006). The invisible Dutch: A pilot study evaluating Dutch migrants’ path
to New Zealand from 1996 to 2006. Christchurch: National Centre for
Research on Europe, University of Canterbury.
Poot, J. (1994). A note on the Dutch in New Zealand. Wellington: New Zealand
Netherlands Foundation.
Poot, J., Nana, G., and Philpott, B. (1988). International Migration and the New
Zealand economy. Wellington: Victoria University Press.
Poot, J., Waldorf, B. and van Wissen, L. (eds) (2008). Migration and Human Capital.
Cheltenham UK: Edward Elgar.
Priemus, B. (1997). [To the other side of the World] Naar de Andere Kant van de
Wereld. Masters Dissertation Political Science, University of Amsterdam.
Schouten, H. (1992). Tasman’s Legacy. The New Zealand – Dutch Connection.
Wellington: New Zealand Netherlands Foundation.
Stassen, M.L. (2001). A Select Annotated Bibliography on the Immigration of the
Dutch to New Zealand 1900-2000. Unpublished dissertation. Victoria
University of Wellington.
Statistics Netherlands (2010). Belgium and Germany most popular destinations for
emigrants. Webmagazine, 30 March 2010. Retrieved March 10, 2011 from
http://www.cbs.nl/en-GB/menu/themas
/bevolking/publicaties/artikelen/archief/2010/2010-3080-wm.htm
Statistics Netherlands (2011). Record number of immigrants in 2010. Statistics
Netherlands press release, PB11-007.
Statistics New Zealand (1961). New Zealand Census of Populations and Dwellings.
Wellington: Statistics New Zealand.
Statistics New Zealand (1966). New Zealand Census of Populations and Dwellings.
Wellington: Statistics New Zealand.
Statistics New Zealand (2006). New Zealand Census of Populations and Dwellings.
Wellington: Statistics New Zealand.
Statistics New Zealand. (2007). New Zealand’s 65+ Population: A Statistical Volume.
Wellington: Statistics New Zealand.
Tap, R. (1997). Een Mengelmoes: Aging in a Dutch Community. Unpublished
Dissertation, University of Auckland.
Thomson, K.W. (1967). Dutch migrants in the economy of New Zealand. New
Zealand Geographer, 23: 95-105.
Thomson, K.W. (1970). The Dutch. In: K. W. Thomson and A. D. Trlin (eds),
Immigrants in New Zealand. Palmerston North: Massey University, pp. 152-
167.
Trlin, A. D. (1975). Dutch immigrants in Auckland: A factorial ecology. New Zealand
Geographer, 31, 124-141.
Trouw (1992). {The Netherlands cancels migration agreement with New Zealand}
Nederland zegt emigratieverdrag met Nieuw Zeeland op. Retrieved October 8,
2010, from http://www.trouw.nl/krantenarchief/1992/04/24 /2708620/
Nederland_zegt_emigratieverdrag_met_Nieuw-Zeeland_op.html
van Dalen, H. and Henkens, K. (2007). Longing for the good life: understanding
emigration from a high income country. Population and Development Review
33: 37-65.
van Dalen, H. and Henkens, K. (2008). [Leaving The Netherlands: Emigration at the
beginning of the 21st Century] Weg uit Nederland: Emigratie aan het Begin
van de 21e Eeuw. NIDI Rapport no 75. Amsterdam: KNAW Press.
25
Velthuis, K. (2005) The Dutch in NSW – A Thematic History. Johnstone Centre
Report 201. Albury NSW: Charles Sturt University.
Webster, K.L. (2007). The maintenance of group identity through social networks in
the Bay of Plenty Dutch community. Unpublished Thesis, University of
Waikato.
Zodgekar, A. V. (1986). Immigrants in the 1981 Census. In: A. D. Trlin and Spoonley,
P., New Zealand and International Migration. Department of Sociology,
Massey University, pp 40-57.
26
0
500
1000
1500
2000
2500
3000
3500
4000
4500
5000
19
47
/48
19
50
19
52
19
54
19
56
19
58
19
60
19
62
19
64
19
66
19
68
19
70
19
72
19
74
19
76
19
78
19
80
19
82
19
84
19
86
19
88
19
90
19
92
19
94
19
96
19
98
20
00
20
02
20
04
20
06
20
08
Nu
mb
er
of
mig
ran
ts
Year
Source: Dutch Emigration Service: period 1947-1990; New Zealand Immigration Service: period 1990-
1996 (Priemus, 1997); updated with unpublished data provided by the Department of Labour. The data
refer to the number of persons granted permanent residency. A small fraction (estimated to be about 1
percent) did not actually settle in New Zealand.
Figure 1 Dutch migration to New Zealand, 1947-2008
27
0
200
400
600
800
1000
1200
1400
1600
1997 1998 1999 2000 2001 2002 2003 2004 2005 2006 2007 2008
Student Permit
Work Permit
Permanent Residence
Source: Unpublished data from Department of Labour
Figure 2 New Zealand student permits, work permits and permanent residence issued
to Dutch citizens, June years 1997/98 – 2006/07
28
0
5000
10000
15000
20000
25000
30000
1874 1878 1881 1896 1901 1911 1916 1921 1936 1945 1951 1956 1961 1966 1971 1976 1981 1986 1991 1996 2001 2006
Tota
l Nu
mb
er
of
NL
Bo
rn i
n N
Z
Census Year
Source: Statistics New Zealand , Census of Population and Dwellings 1874-2006
Figure 3 The Netherlands-born population in New Zealand, 1874-2006
29
0
5000
10000
15000
20000
<14 15-64 65<
Tota
l Nu
mb
er
of
Du
tch
Bo
rn
Age
1966
1991
1996
2001
2006
Source: Statistics New Zealand , Census of Population and Dwellings 1966-2006
Figure 4 The Netherlands-born population in New Zealand by age group, 1966-2006
30
60%
33%
2%
5%
Netherlands
New Zealand
Former Dutch Colonies
Other Countries
Source: Statistics New Zealand, Census of Population and Dwellings 2006
Figure 5 Dutch ethnicity by place of birth, 2006
31
0
10
20
30
40
50
60
70
80
90
100
Du
tch
Eth
nic
ity
(%)
Age
Other
Former Dutch Colonies
NZ
Netherlands
Source: Statistics New Zealand, Census of Population and Dwellings 2006
Figure 6 Dutch ethnicity and age by place of birth, 2006
32
0
1000
2000
3000
4000
5000
6000
7000
8000
9000
Du
tch
Lan
guag
e
Age
1996
2006
Source: Statistics New Zealand, Census of Population and Dwellings 2006
Figure 7 New Zealand residents who can speak the Dutch language by age group,
1996, 2006
33
0
10
20
30
40
50
60
1947-1966 1967-1986 1987-2006 1947-1966 1967-1986 1987-2006
Arrival Cohort
0-9
10-19
20-29
30-39
40-49
50-59
60<
Source: Statistics New Zealand, Census of Population and Dwellings 2006
Figure 8 Age at arrival (% distribution) by arrival cohort: Dutch ethnicity and other
ethnicities
Dutch ethnicity Other ethnicities
34
Source: Statistics New Zealand, Census of Population and Dwellings 2006
Figure 9 Geographic dispersion of the Dutch ethnic group relative to Other ethnic groups by territorial authority by period of arrival
1948-1966 1967-1986 1987-2006
35
Table 1 Dutch work permit holders who gained permanent residence
Financial year Total workers Total who gained residence
as at 30 June 2007
% who gained
residence
1997/98 344 99 28.8
1998/99 693 117 16.9
1999/00 557 84 15.1
2000/01 616 130 21.1
2001/02 863 150 17.4
2002/03 951 181 19.0
2003/04 1030 161 15.6 Notes: When a person was issued more than one work permit, only the first permit is included and the
financial year relates to the year in which the first permit was issued.
Source: Unpublished data, Department of Labour.
Table 2 Foreign-born population of New Zealand: the twenty largest country-of-birth
groups, 2006 and 1996-2006 growth
1996 2006 2006
rank 1996-2006
growth
United Kingdom 223,815 244,803 1 9.4%
China (including Hong Kong) 31,278 85,800 2 174.3%
Australia 54,711 62,742 3 14.7%
Samoa 42,177 50,649 4 20.1%
India 12,807 43,341 5 238.4%
South Africa 11,334 41,676 6 267.7%
Fiji 18,774 37,749 7 101.1%
Korea, Republic of 12,183 28,806 8 136.4%
Netherlands 23,430 22,101 9 -5.7%
Tonga 14,040 20,520 10 46.2%
United States of America 11,625 17,748 11 52.7%
Philippines 7,005 15,282 12 118.2%
Cook Islands 13,758 14,697 13 6.8%
Malaysia 11,889 14,547 14 22.4%
Taiwan 10,932 10,764 15 -1.5%
Germany 7,071 10,761 16 52.2%
Japan 6,501 9,573 17 47.3%
Canada 7,440 8,994 18 20.9%
Zimbabwe 1,443 8,151 19 464.9%
Sri Lanka 4,017 7,257 20 80.7%
Source: Statistics New Zealand, Census of Population and Dwellings 1996, 2006
36
Table 3 Estimated number of New Zealand residents of Dutch ancestry
1st
generation1
2nd
generation2
3rd
generation3
Total
Census 1976 + Vitals 1953-1976 22,000 28,000 n.a. 50,000
Poot (1994) 26,000 41,000 n.a. 67,000
Priemus (1997) 25,000 40,000 40,000 105,000
Van der Pas & Poot, this paper 22,0004 39,500
4 55,200 116,700 1 Resident of New Zealand and born in the Netherlands or the former Dutch Indies
2 Resident of New Zealand and at least one parent born in the Netherlands or the former Dutch Indies
3 Resident of New Zealand and at least one grandparent born in the Netherlands or the former Dutch
Indies 4 Includes spouses not born in the Netherlands or the former Dutch Indies
Table 4 New Zealand resident population who can speak the Dutch language, 1996,
2001, 2006
Census year
1996 2001 2006
Dutch language 27,468 26,280 26,982 Source: Statistics New Zealand, Census of Population and Dwellings 1996, 2001, 2006
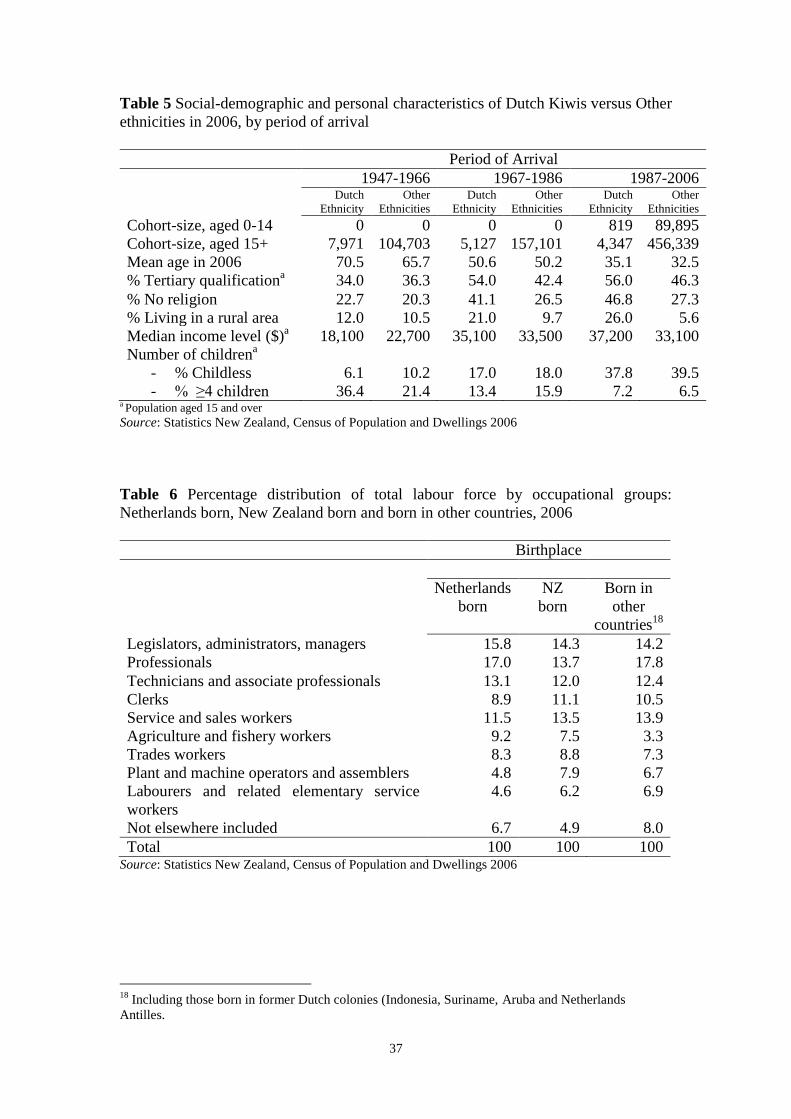
37
Table 5 Social-demographic and personal characteristics of Dutch Kiwis versus Other
ethnicities in 2006, by period of arrival
Period of Arrival
1947-1966 1967-1986 1987-2006
Dutch
Ethnicity
Other
Ethnicities
Dutch
Ethnicity
Other
Ethnicities
Dutch
Ethnicity
Other
Ethnicities
Cohort-size, aged 0-14 0 0 0 0 819 89,895
Cohort-size, aged 15+ 7,971 104,703 5,127 157,101 4,347 456,339
Mean age in 2006 70.5 65.7 50.6 50.2 35.1 32.5
% Tertiary qualificationa 34.0 36.3 54.0 42.4 56.0 46.3
% No religion 22.7 20.3 41.1 26.5 46.8 27.3
% Living in a rural area 12.0 10.5 21.0 9.7 26.0 5.6
Median income level ($)a 18,100 22,700 35,100 33,500 37,200 33,100
Number of childrena
- % Childless
- % ≥4 children
6.1
36.4
10.2
21.4
17.0
13.4
18.0
15.9
37.8
7.2
39.5
6.5 a Population aged 15 and over
Source: Statistics New Zealand, Census of Population and Dwellings 2006
Table 6 Percentage distribution of total labour force by occupational groups:
Netherlands born, New Zealand born and born in other countries, 2006
Birthplace
Netherlands
born
NZ
born
Born in
other
countries18
Legislators, administrators, managers 15.8 14.3 14.2
Professionals 17.0 13.7 17.8
Technicians and associate professionals 13.1 12.0 12.4
Clerks 8.9 11.1 10.5
Service and sales workers 11.5 13.5 13.9
Agriculture and fishery workers 9.2 7.5 3.3
Trades workers 8.3 8.8 7.3
Plant and machine operators and assemblers 4.8 7.9 6.7
Labourers and related elementary service
workers
4.6 6.2 6.9
Not elsewhere included 6.7 4.9 8.0
Total 100 100 100 Source: Statistics New Zealand, Census of Population and Dwellings 2006
18
Including those born in former Dutch colonies (Indonesia, Suriname, Aruba and Netherlands
Antilles.
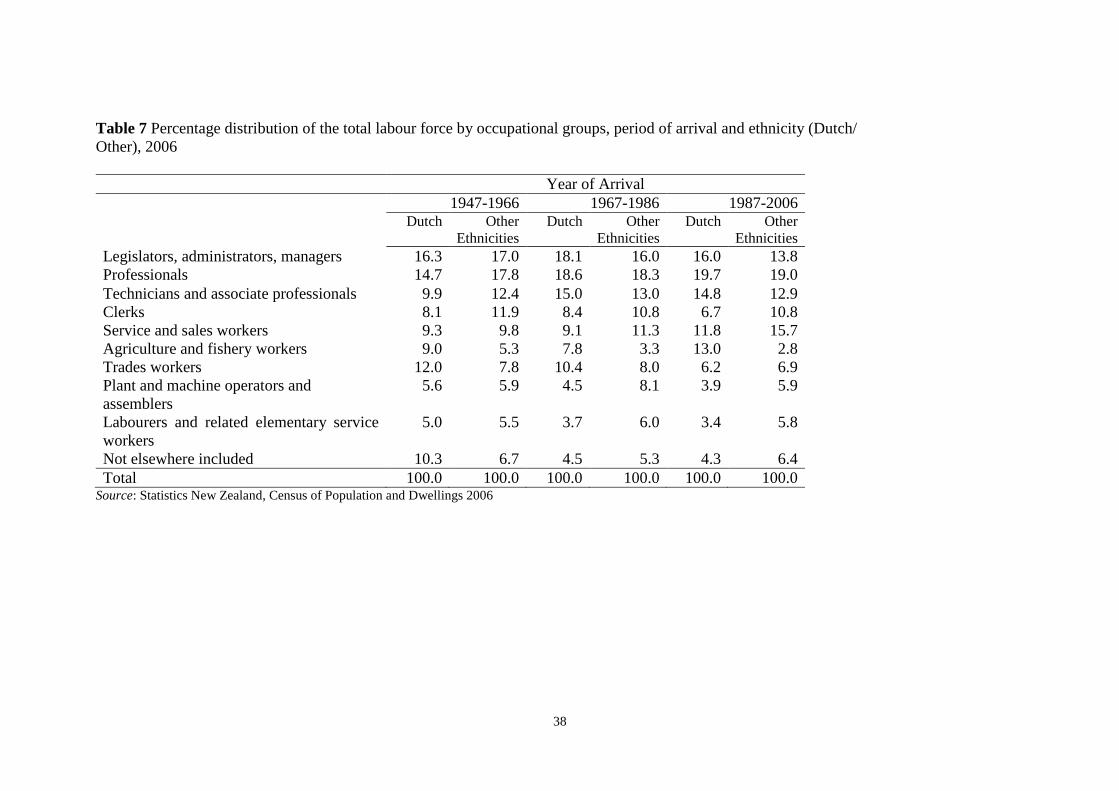
38
Table 7 Percentage distribution of the total labour force by occupational groups, period of arrival and ethnicity (Dutch/
Other), 2006
Year of Arrival
1947-1966 1967-1986 1987-2006
Dutch Other Ethnicities
Dutch Other Ethnicities
Dutch Other Ethnicities
Legislators, administrators, managers 16.3 17.0 18.1 16.0 16.0 13.8
Professionals 14.7 17.8 18.6 18.3 19.7 19.0
Technicians and associate professionals 9.9 12.4 15.0 13.0 14.8 12.9
Clerks 8.1 11.9 8.4 10.8 6.7 10.8
Service and sales workers 9.3 9.8 9.1 11.3 11.8 15.7
Agriculture and fishery workers 9.0 5.3 7.8 3.3 13.0 2.8
Trades workers 12.0 7.8 10.4 8.0 6.2 6.9
Plant and machine operators and
assemblers
5.6 5.9 4.5 8.1 3.9 5.9
Labourers and related elementary service
workers
5.0 5.5 3.7 6.0 3.4 5.8
Not elsewhere included 10.3 6.7 4.5 5.3 4.3 6.4
Total 100.0 100.0 100.0 100.0 100.0 100.0 Source: Statistics New Zealand, Census of Population and Dwellings 2006
![Patents, Paradigm Shifts, and Progress in Biomedical Science · 2004] Patents, Paradigm Shifts, and Progress 663 framework—what Kuhn calls a scientific paradigm—comprises “normal](https://img.pdfslide.net/doc/110x75/5eb7ffac2f5b8957b72caa8d/patents-paradigm-shifts-and-progress-in-biomedical-science-2004-patents-paradigm.jpg)