Embed Size (px)
Citation preview
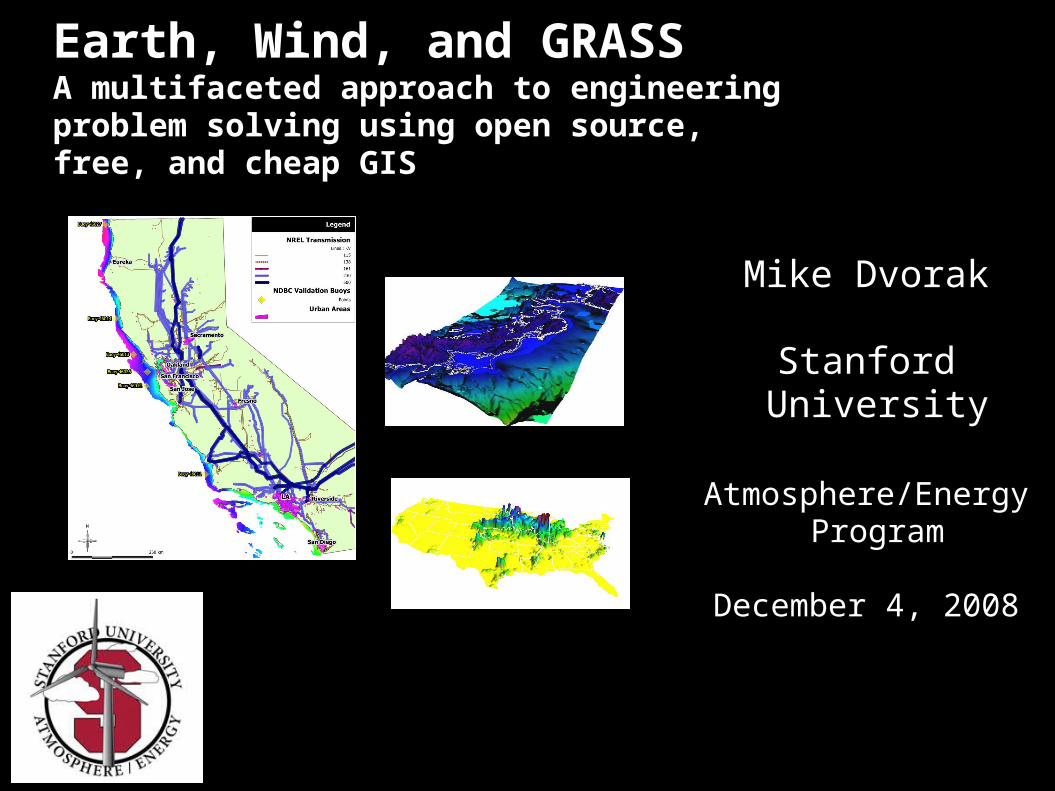
Mike Dvorak
Stanford University
Atmosphere/Energy Program
December 4, 2008
Earth, Wind, and GRASSA multifaceted approach to engineeringproblem solving using open source, free, and cheap GIS

Outline
Brief overview of open source GIS GRASS QGIS PostGIS
Two examples Building a high performance wind energy
resource database Automatically calculating rising sea level port
protection

Brief disclaimerabout me
I am not a GIS professional, but rather a (mostly) self taught GIS hacker of sorts who has since 2001 tried to exist primarily on open source software.
When possible, all of my research has been done with open source software.
Intro to open source GIS tech
Example 1: Wind Energy Analysis
Example 2: Sea level rise port protection
Summary of experience
Content

Dec 4, 2008Dec 4, 2008 Mike Dvorak
GRASS GIS http://grass.itc.it/
Geographic Resources Analysis Support System Developed by the US Army Corps Now GNU Public License Used mainly for raster data types Runs on Mac OSX, Linux, and Windows (Cygwin)
Can do pretty much everything that ArcGIS can do...but might drive you crazy trying to figure it out

Dec 4, 2008Dec 4, 2008 Mike Dvorak
GRASS GIS
Vector engine recently rewritten (5.7/6.0)
New GIS manager (more ArcGIS like) for 6.x
Large incremental improvements from version to version
Wide array of import/export formats (shp, kml, gml, dbf, ascii, etc...) make it pretty useful
Dec 4, 2008Dec 4, 2008 Mike Dvorak
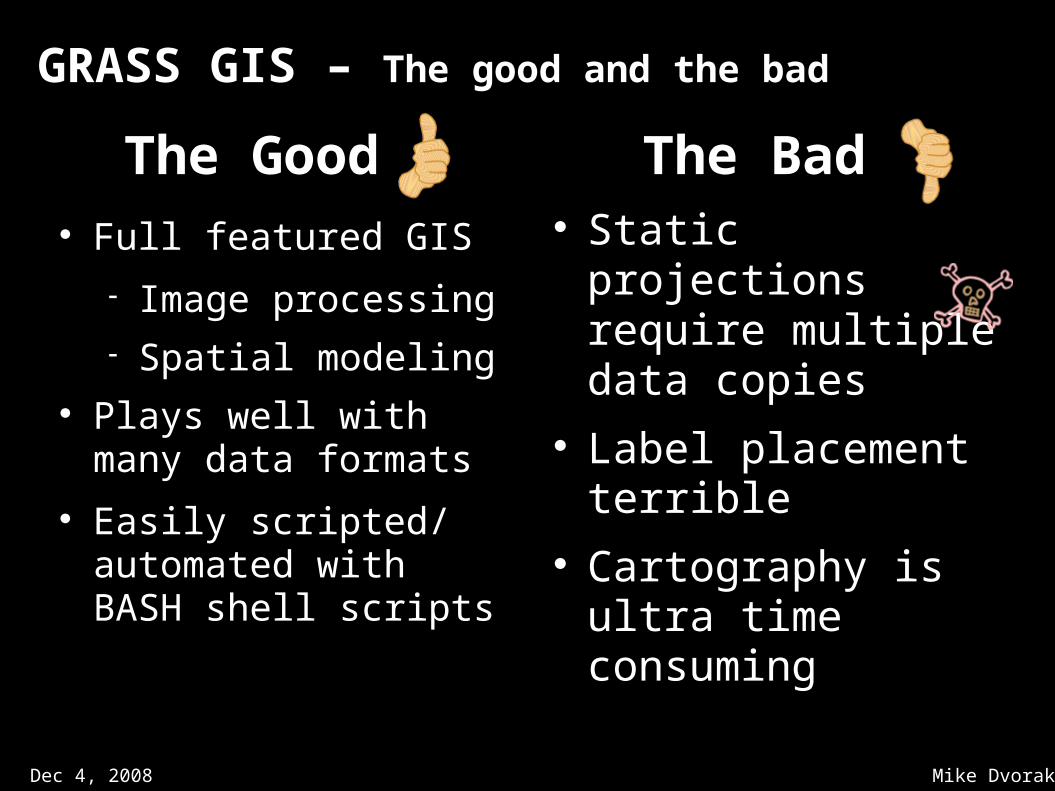
GRASS GIS – The good and the bad
Full featured GIS
Image processing Spatial modeling
Plays well with many data formats
Easily scripted/ automated with BASH shell scripts
Static projections require multiple data copies
Label placement terrible
Cartography is ultra time consuming
The Good The Bad

Dec 4, 2008Dec 4, 2008 Mike Dvorak

Dec 4, 2008Dec 4, 2008 Mike Dvorak
Cartography in GRASS
Postscript command mini-language
Tedious but results are impressive
Postscript output

3D Capabilities with NVIZ
My Alaska Honeymoonby Bicycle
Red is our bike route

Dec 4, 2008Dec 4, 2008 Mike Dvorak
Quantum GIS (QGIS) http://qgis.org
GNU General Public License
Runs on Windows, Linux, and Mac OSX
Installs easily
Dec 4, 2008Dec 4, 2008 Mike Dvorak
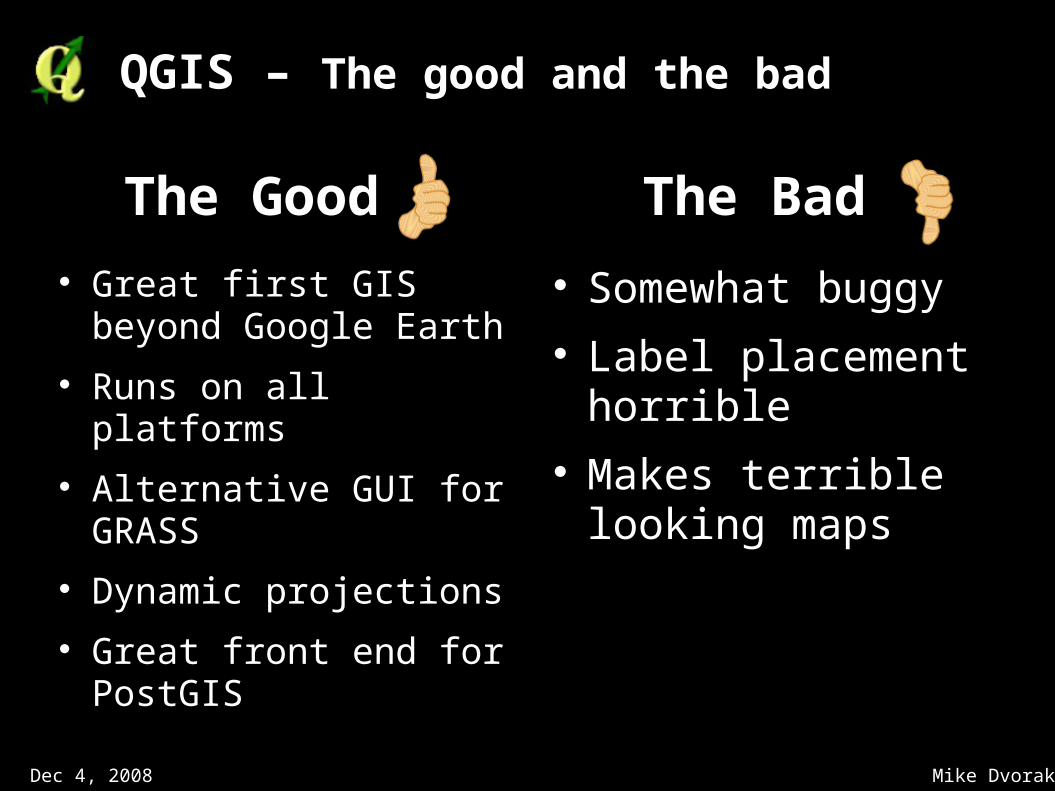
QGIS – The good and the bad
Great first GIS beyond Google Earth
Runs on all platforms Alternative GUI for
GRASS Dynamic projections Great front end for
PostGIS
Somewhat buggy Label placement
horrible Makes terrible
looking maps
The Good The Bad

Dec 4, 2008Dec 4, 2008 Mike Dvorak
PostGIS http://postgis.org
Spatial extension for open source database management system PostgreSQL
Implements OpenGIS “Simple Features Specification for SQL”
Similar to ESRI SDE or Oracle Spatial extension
BEST PART: Can enable non-spatial client software spatially through SQL

Dec 4, 2008Dec 4, 2008 Mike Dvorak
PostGIS – Some SQL examples
INSERT INTO geotable ( the_geom, the_name )VALUES ( GeomFromText('POINT(-126.4 45.32)', 312), 'A Place');
SELECT distance_sphere(geom, geomfromtext('POINT(-122.23 38.210)', 33000))FROM horizwindgeomWHERE x=51 and y=52;
Returns (in meters): distance_sphere ------------------ 117757.816114555(1 row)

Intro to open source GIS tech
Example 1: Wind Energy Analysis
Example 2: Sea level rise port protection
Summary of experience
Content

Wind Power Problem Statement
Use a weather model to accurately predict the average wind resource off the California coast
Validate the model with offshorebuoys
Image source: NOAA NDBC
80 m Wind Speed (m/s)
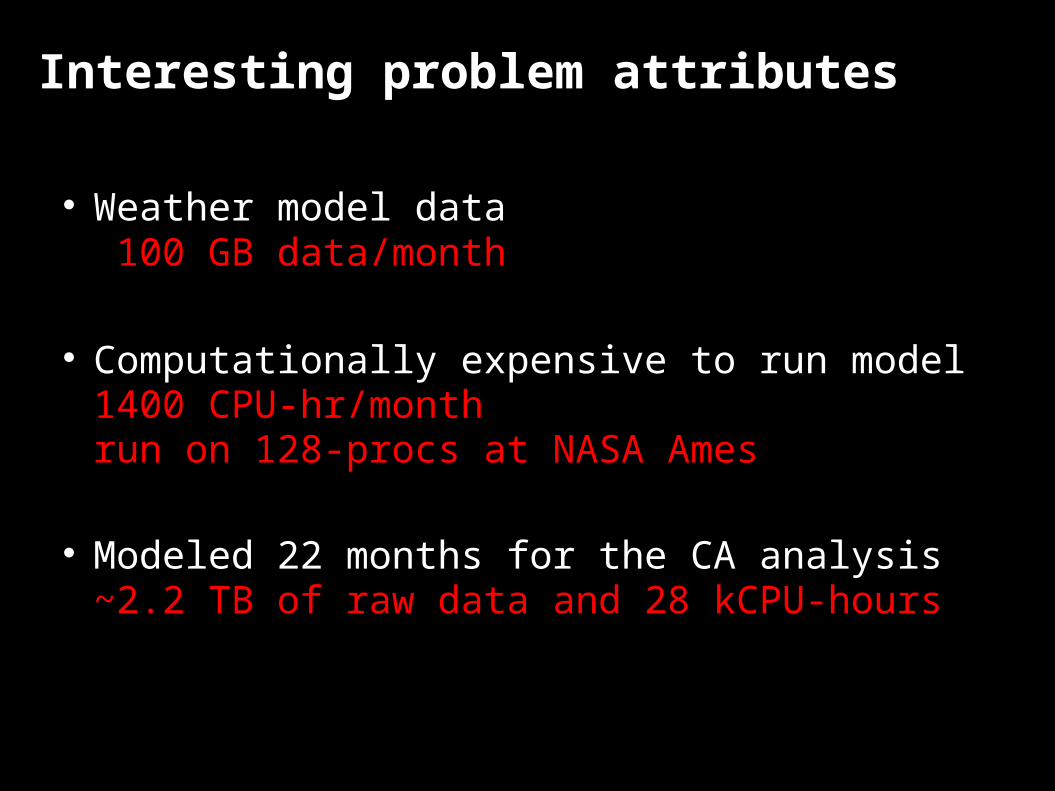
Interesting problem attributes
Weather model data 100 GB data/month
Computationally expensive to run model1400 CPU-hr/monthrun on 128-procs at NASA Ames
Modeled 22 months for the CA analysis~2.2 TB of raw data and 28 kCPU-hours

Complete Wind Analysis Algorithm
Post process data to extract
wind speed and direction
Run the weather model
Archive unneededdata
Convert the binary data to
NetCDF
Use Manifoldto create maps
Use GRASS tocreate rasters
Create a masked DB domain for
problem specific analysis
Load the DB with gridded
wind data

Open/Cheap GIS Components
Postgresql + PostGIS(and QGIS)
GRASS GIS
Manifold
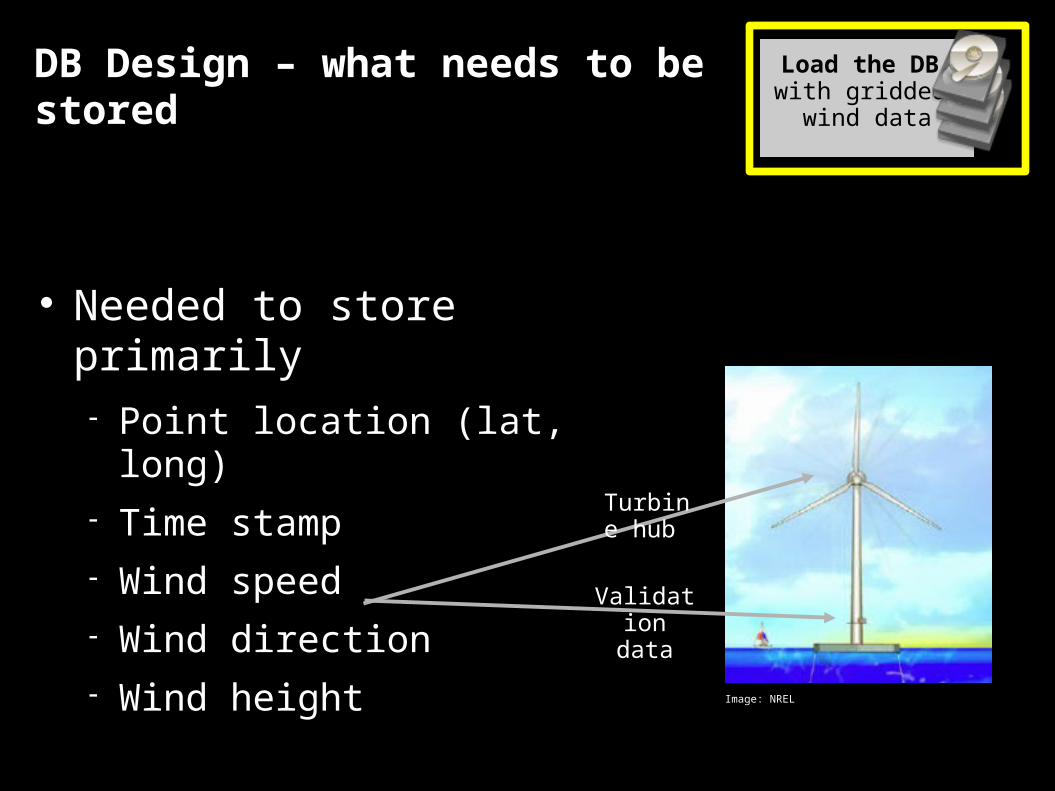
DB Design – what needs to be stored
Load the DB with gridded
wind data
Needed to store primarily Point location (lat, long) Time stamp Wind speed Wind direction Wind height
Turbine hub
Validation data
Image: NREL

Design/redesign was critical for performance
Load the DB with gridded
wind data
Deigned a DB schema Model/buoy domain (small) Grid locations (medium) Wind speed/direction (huge)
Note only on PostGIS is only one field in entire database....but the functionality is huge!

Indexing is crucial for performance
Load the DB with gridded
wind data
365 day DB has 105 million records Indexes needed to be build on:

Distributed design increased performance/functionality
Load the DB with gridded
wind data
Java program to insert directly into PostGIS DB from remote machine
Flexibility of PostGIS allows remote uploads from NASA
Java/Postgres
Remote raw model data on super-computer (large)
PostGIS wind DB
PostGIS wind DB
PostGIS wind DB
inversion.stanford.edu windstore.stanford.edu fujita.stanford.edu

Making the DB perform for any give problem
Create a masked DB domain for
problem specific analysis
45 km resolution
15 km
5 km
5 km resolution
1.67 km resolution
Loading/processing all domain grid points was super slow!
Needed to:1. Partition domain tables2. Create masks for specific
problems

Masking Create a masked DB domain for
problem specific analysis
Used Java+PostGIS to create “domain masks”
E.g. Wind speeds over shallow water (0-200 m)

Examples of masking Create a masked DB domain for
problem specific analysis
Student wanted to study wind potential in the Bay Area
Used Google Earth for coordinates
Created masked database/custom script for student to query data

Quick word about GRASS + Manifold
Avg 80 m wind speed
(m/s)

Collaboration potential – geostats example
Only 3 lines of simple Python code!
Able to give collob. access to 25 GB spatial wind database
Accessible from anywhere on the Internet
Image: Alex Boucher, Stanford

Intro to open source GIS tech
Example 1: Wind Energy Analysis
Example 2: Sea level rise port protection
Summary of experience
Content

Protecting Ports Against Sea Level Rise
On going Stanford research in the Center for Integrated Facility Engineering (CIFE) Martin Fischer (CEE), Ben Schwegler (Disney) CEE 124/224A – on going
Image credit: New Orleans City Business

Sea Level Rise – Problem Statement
Needed to estimate 1st order costs of protecting largest 100 ports from 1 meter of sea level rise.
Design criteria Max dike height above water: 3 meters Max depth of wall: 12 meters Max radius of protection: ~15 km

Sea Level Rise – Google Earth+ Not Cutting It
Prior work tried to digitize sea walls by hand drawing lines
Technique biased Did not take into
account bathymetry
Hand drawn
Constraint based

Is is possible to automate GRASS to build the ports?
Had the raster data Univ. of Maryland 1'
Land Cover Classification
GEBCO 1' global bathymetry
Prior experience said yes...
Few weeks later and a 150 line BASH script, GRASS automatically made the port protection!

Sea Level Rise – Two Example Ports
All GRASS results easily exported to Google Earth via KML
Intro to open source GIS tech
Example 1: Wind Energy Analysis
Example 2: Sea level rise port protection
Summary of experience
Content
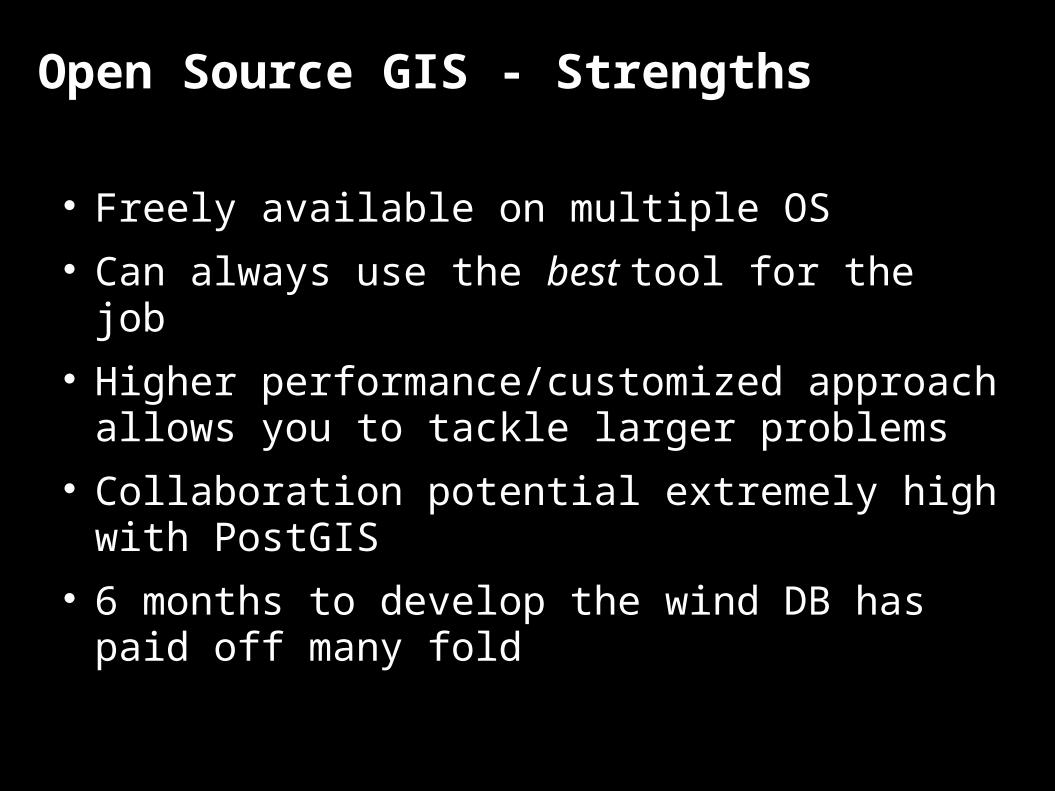
Open Source GIS - Strengths
Freely available on multiple OS Can always use the best tool for the job Higher performance/customized approach
allows you to tackle larger problems Collaboration potential extremely high
with PostGIS 6 months to develop the wind DB has
paid off many fold

Open Source GIS – Weaknesses
On the fly project Support can be lacking No raster format for Post GIS GPS support is awful (hardware problems) No one software does it all Vector editing can be tedious


Using GPS to Mark Areas
+ #!/bin/bash+
+ #!&*^@$! + =
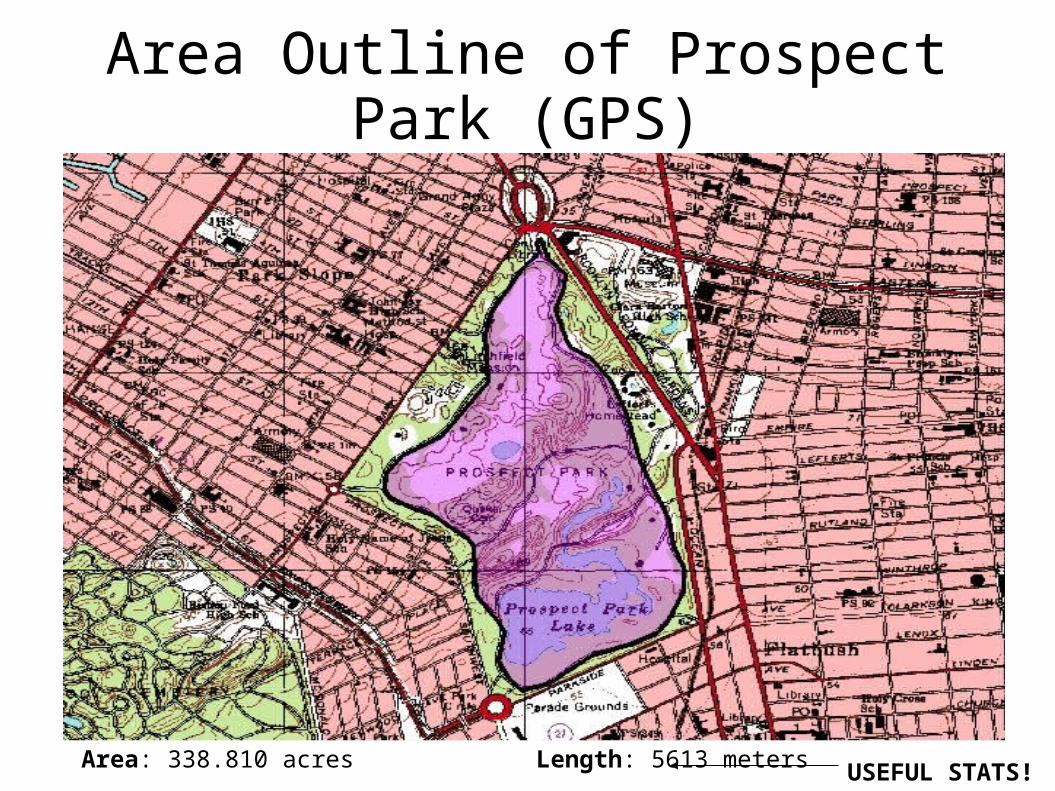
Area Outline of Prospect Park (GPS)
Area: 338.810 acres Length: 5613 meters USEFUL STATS!

Recommend Reading