Embed Size (px)
Citation preview
MikesBikes-Intro Players Manual (for version 6.67.5.2 and later)
i
Contents
Introduction and Overview 1
What is MikesBikes-Intro?............................................................................... 1 Getting Started with MikesBikes ...................................................................... 1 Two Versions of MikesBikes............................................................................. 2 Company Overview........................................................................................ 5 Strategic Planning.......................................................................................... 6 Developing a Product Strategy ........................................................................ 7 Key Steps For Making Your First Decision.......................................................... 8 Testing My Decisions...................................................................................... 8
Market Analysis 9
History ......................................................................................................... 9 Segment Overview .......................................................................................10 Consumer Preferences...................................................................................11 Distribution Overview....................................................................................12 Distribution Costs In MikesBikes-Intro .............................................................13 Media Overview............................................................................................13 Promotion Overview......................................................................................14
Implementation 17
Decision Screen Overview..............................................................................17 Product Marketing Decisions ..........................................................................17 Firm Marketing Decisions...............................................................................19 Operations Management Decisions..................................................................20 Financial Management Decisions.....................................................................22
Evaluation 25
Evaluation Overview .....................................................................................25 Forecasting Current Decisions ........................................................................27
Glossary 28
Reports .......................................................................................................28 Key terms of the Industry Benchmark Report ...................................................29 Key Terms on the Income Statement ..............................................................30 Key Terms Explained.....................................................................................36
Index 38

1
IN THIS CHAPTER
What is MikesBikes-Intro? ......................................... 1 Company Overview................................................... 5
What is MikesBikes-Intro?
MikesBikes-Intro (MB-I) is an Online Business Simulation that will give you the opportunity to run your own company, managing all the key functional areas of a Firm. It is used as an interactive tool to enhance the integration and learning of the basic concepts of business in a real life context: the Bicycle Manufacturing Industry.
You will get hands on experience at making critical price, marketing, operations, product development, and financial decisions.
Your team will take over an existing Bike Company starting as Brand Managers, but the Company President has announced their intention to retire in 3 years time. Your team has been selected as their successor so over the next few years will be gradually given more control over the company, eventually becoming the Executive Officers.
As the Managers of your MikesBikes Firm, the primary goal for your company is to enrich its shareholders (owners) by providing a return on their investment in your company. The measurement of this total return to shareholders is known as Shareholder Value (SHV), so the success of your company is measured by the amount of Shareholder Value you can create in comparison to your competitors.
There are two versions for students: Single-Player and Multi-Player. Both versions
simulate the management decisions of a company in the bicycle industry and require you to make key marketing, operations, product development and finance decisions. In both cases the goal is the same: to maximize Shareholder Value.
Getting Started with
MikesBikes
1 Go to the Smartsims website, www.smartsims.com, and login at the top right using the login details provided to you by your Instructor. This will take you through to your Course Page. If you do not know these details you can request
them through our website.
2 If your course requires you to make payment for use of the simulation you will be prompted to click on "I need to register" link”. Follow the on-screen instructions to register and make payment (credit card or check). If payment has been made by your Institution you will be taken directly to your Course Page.
C H A P T E R 1
Introduction and Overview
Introduction and Overview 2
3 Click on the "Downloads" menu item at the left of your Course Page to access the Software download link. Once downloaded, double click on the file to launch the installer for the game. Follow the install instructions to install the Single and Multi-Player.
4 We recommend that you view the screenshot presentation available to you on your Course Page for more on the basics of navigating the game, making decisions, and processing decisions.
5 Then start by opening the Single-Player (practice) version to run through up to 10 years (decision periods) to familiarize yourself with MikesBikes. When you first open the Single-Player you will need to enter a registration key to enable the full version.
6 If you click your way through the menu tree items on the left-hand side, you will see the various reports and decision areas available to you so work your way down. You will note that some menu tree items can be expanded by clicking the (+) symbol. When viewing the report menus, click on the drop-down menu at the top of your screen will allow you to view further reports.
7 In the Single-Player (practice) version you can process your own decisions
(rollover) at any time once you have entered decisions, this will display your results immediately. You can continue to roll forward through the years or rollback to edit decisions.
Once your Instructor has advised Smartsims that the Multi-Player simulation is ready to start, the Smartsims Support Team will email you with your personal Multi-Player login details. When you are ready to access your Multi-Player firm, double click on the Multi-Player icon and you will be prompted to enter your
personal login details. Once open, you will be able to view your firm, and enter decisions. When you enter a decision, ensure that you click "Apply" before exiting the screen and this will save the decision on our servers.
Two Versions of MikesBikes
There are two version of MikesBikes that will be used in your course, a Single-Player and a Multi-Player version. The MikesBikes Single-Player is a practice version where your challenge is to achieve the highest shareholder value that you can
within 10 years (decision periods). You will then move onto the MikesBikes Multi-Player to compete against other teams within your course. Again the main performance measure is to maximize shareholder value. The combined actions of all of the firms in the market affect the performance of the whole industry.
MikesBikes-Intro Single-Player:
The Single-Player version allows students to become familiar with the simulation, interface, and how individual decisions have an effect over their performance.
� One competitor firm, in the form of a computer robot. You will start from a
weaker market position and should give you a challenging competitive experience for up to 10 years (rollovers).

Introduction and Overview 3
� You are able to roll forward into the next decision period/year, or roll back as
you wish in order to test and change your decisions. When you roll forward, the software will process your decisions and take you to the next year of trading. Decisions and results can be saved to your computer for access at a later time.
MikesBikes-Intro Multi-Player
In the Multi-Player version, you will compete against other student teams within a 4 to 7 Firm Industry competing for the highest Shareholder Value.
� The Multi-Player requires an Internet connection to be open before logging in.
Your decisions are updated immediately and saved on our servers. This allows you to login to make decisions for your firm from anywhere where you have a computer with access to the Internet.
� All members can login to view their Firm, results, reports, and make decisions
at any time. However we recommend that you select one team member to enter your final decisions to avoid confusion.
� Moving from one year (decision period) to the next is done by automatic
rollover on preset dates set by your Instructor. Before each of these scheduled times your team needs to have all decisions for the upcoming year entered into the Multi-Player version. At the decision deadline time the simulation will be processed (rollover) and the decisions you have saved at that point will be automatically processed.

Introduction and Overview 4
� MikesBikes Multi-Player version can also be used in Offline Mode (Offline button
at top of screen) for making practice decisions. You will be able to roll forward and roll back as you wish to give you an indication how your decisions may result (see full explanation below for more details on how this feature works).
Important note:
Multi-Player has an offline mode which allows you to try out different decision options and strategies before you commit yourself.
To download a copy of your firm's data, choose "Play offline" from the File menu. After downloading, you will be prompted to save this data on your computer.
In offline mode, your competitors use only their default decisions. So don't read too much into the results.
offline data files can be copied and emailed between team members. This helps you to share ideas, and also allows a team member who cannot use Multi-Player online (eg because of firewall proxy issues) to participate.
After using offline mode, your team's agreed decisions need to be re-entered in online mode. You may find it helpful to export or print the current decisions report(s) when in offline mode first. To re-enter your decisions, Disconnect from offline mode, Login to online mode, then re-enter all your decisions. Double-check
by comparing the current decisions report(s) against the ones you exported or printed in offline mode.
Introduction and Overview 5
Shareholder Value (SHV): Performance Measure of MikesBikes
As the Managers of your MikesBikes Firm, the primary goal for your company is to enrich its shareholders (owners) by providing a return on their investment in your company. The measurement of this total return to shareholders is known as Shareholder Value (SHV), so the success of your company is measured by the amount of SHV you can create in comparison to your competitors.
SHV is a measure of the current Share Price (which is the market value of one share in your company) plus the value of all past dividends paid, including interest
accumulated on these past dividends (if you never pay dividends then SHV is the same as Share Price). It is the value to an investor over time of owning a single share in your firm.
Your Share Price is driven by:
� Profitability and Earnings Per Share (EPS)
E.g. Firm A has 2 million shares issued and made $1 million profit, EPS = $0.50
E.g. Firm B has 20 million shares issued and made $10 million profit, EPS = $0.50
E.g. Firm C has 2 million shares issued and made $2 million profit, EPS = $1.00
� Debt to Equity (D/E) Ratio
A higher D/E ratio means higher risk which results in a lower share price
Earnings Per Share (EPS) is calculated using your Net Earnings (Profit) divided by total Outstanding Shares; so to increase your Share Price (and SHV) you must focus on increasing Profit. SHV is a long-term performance measure so continued increases in profits will result in larger increases in SHV.
Company Overview
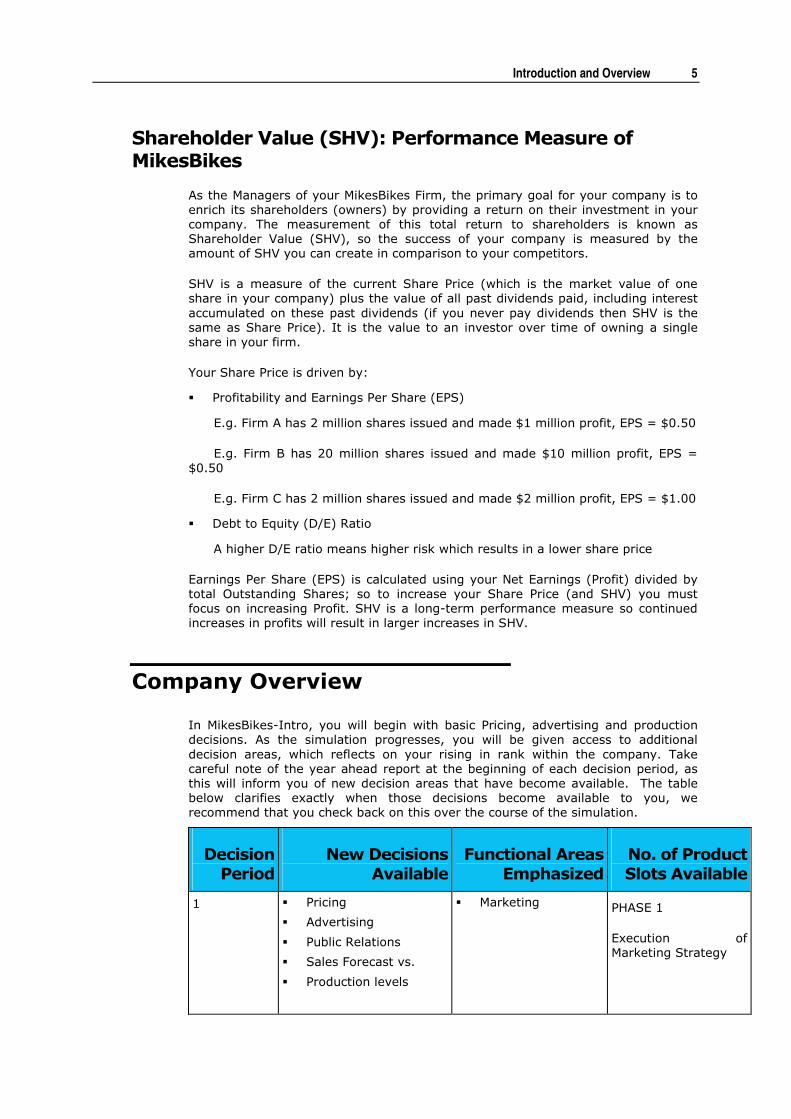
In MikesBikes-Intro, you will begin with basic Pricing, advertising and production decisions. As the simulation progresses, you will be given access to additional
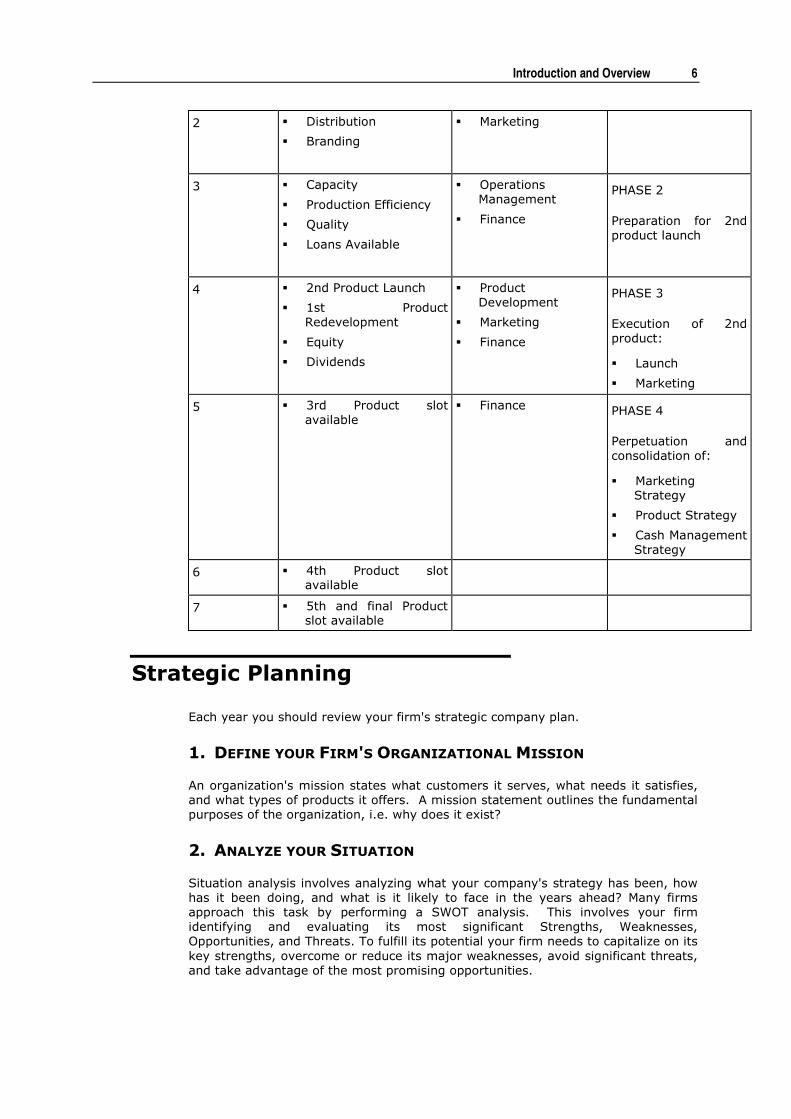
decision areas, which reflects on your rising in rank within the company. Take careful note of the year ahead report at the beginning of each decision period, as this will inform you of new decision areas that have become available. The table below clarifies exactly when those decisions become available to you, we recommend that you check back on this over the course of the simulation.
Decision
Period
New Decisions
Available
Functional Areas
Emphasized
No. of Product
Slots Available
1 � Pricing
� Advertising
� Public Relations
� Sales Forecast vs.
� Production levels
� Marketing PHASE 1
Execution of Marketing Strategy
Introduction and Overview 6
2 � Distribution
� Branding
� Marketing
3 � Capacity
� Production Efficiency
� Quality
� Loans Available
� Operations Management
� Finance
PHASE 2
Preparation for 2nd product launch
4 � 2nd Product Launch
� 1st Product Redevelopment
� Equity
� Dividends
� Product Development
� Marketing
� Finance
PHASE 3
Execution of 2nd product:
� Launch
� Marketing
5 � 3rd Product slot available
� Finance PHASE 4
Perpetuation and consolidation of:
� Marketing Strategy
� Product Strategy
� Cash Management Strategy
6 � 4th Product slot available
7 � 5th and final Product slot available
Strategic Planning
Each year you should review your firm's strategic company plan.
1. DEFINE YOUR FIRM'S ORGANIZATIONAL MISSION
An organization's mission states what customers it serves, what needs it satisfies, and what types of products it offers. A mission statement outlines the fundamental purposes of the organization, i.e. why does it exist?
2. ANALYZE YOUR SITUATION
Situation analysis involves analyzing what your company's strategy has been, how has it been doing, and what is it likely to face in the years ahead? Many firms approach this task by performing a SWOT analysis. This involves your firm identifying and evaluating its most significant Strengths, Weaknesses, Opportunities, and Threats. To fulfill its potential your firm needs to capitalize on its
key strengths, overcome or reduce its major weaknesses, avoid significant threats, and take advantage of the most promising opportunities.
Introduction and Overview 7
3. SET YOUR FIRM'S ORGANIZATIONAL OBJECTIVES
An objective is simply a desired outcome. Your firm needs to create a set of objectives that combined will allow your firm to fulfill its mission. Effective planning begins with a set of objectives that are to be achieved by carrying out plans. To be
worthwhile and workable, objectives should be: clear and specific, stated in writing, ambitious but realistic, consistent with one another, able to be measured, and tied to a particular time period.
For example; a weak objective would be to increase our product quality rating, a workable version would be to increase our product quality by 20% within three years.
4. SET YOUR FIRM'S STRATEGIES AND TACTICS TO ACHIEVE THESE OBJECTIVES
In business a strategy is a broad plan of action by which an organization intends to reach its objectives to fulfill its mission. A tactic is a means by which a strategy is
implemented. For each of your company's objectives you need to come up with possible strategies to achieve them. You then need to write tactics for each of the functional areas of your firm to implement those strategies. For example, your objective might be to increase sales revenue by 20% over the next three years. You then might formulate three strategies, a general price increase of 10% for all of your products, an increase in marketing budgets, a new product launch. Each functional area will then need a series of tactics to implement each year for the
next three years. For example in year one your marketing tactics might be to implement the 10% price rise and to increase TV advertising expenditure by 20%.
Developing a Product Strategy
The company President has given you complete freedom to manage your firm's product. However they have recommended that you choose to initially implement one of three product strategies:
A) HIGH PRICE, LOWER VOLUME
Increase your price by up to 10% (i.e. $550-$605) and increase your Product Promotion expenditure by $500,000-$1,000,000.
B) MEDIUM PRICE, MEDIUM VOLUME
Change your price by less than 1% (i.e. $545-$555), and increase your Product Promotion expenditure by $250,000-$500,000.
C) LOW PRICE, HIGHER VOLUME
Decrease your price by up to 5% (i.e. $522-$550) and increase your Product Promotion expenditure by $0-$250,000.

Introduction and Overview 8
Key Steps For Making Your
First Decision
� Ensure that you have renamed your company. You can only rename your firm
this year. You can do this by clicking on the 'Change Name' tree item and entering your new name in the box provided.
� Read the Market Research reports.
� Decide which product strategy to implement.
� Go to the 'Pricing and Promotion' screen for your current bike and make your
decisions. Click on the expand (+) icon for the 'Product Marketing' tree item, then expand the 'Adv1' tree item.
� Go to the 'Production Planner' screen and decide on your output of bikes for this year. Click on the expand (+) icon for the 'Operations Management' tree item.
� Double-check that your decisions have been entered correctly.
Remember, the ultimate objective of MikesBikes is to maximize shareholder value. Your contribution to this objective this year is to ensure that your current product is appropriately positioned in the marketplace.
Testing My Decisions
Forecasting
In a typical MB-I year you will review your previous year's performance by reading the Industry Reports and Firm results reports, and formulate a set of decisions based on this data. You will then enter your decisions in each screen and review
your Forecast Results reports. If you are not satisfied with your forecast results then you repeat the process of planning your decision set and forecasting sales.
We recommend that you focus on accurate forecasting. There are numerous reports available to aid in forecasting and to compare your actual performance to your previous forecasts.
9
IN THIS CHAPTER
History.................................................................... 9 Segment Overview ................................................... 10 Distribution Overview................................................ 12
Media Overview........................................................ 13 Promotion Overview.................................................. 14
History
The section below gives you an overview about the history of your MikesBikes firm
and the industry that it competes in.
The Industry
MikesBikes-Intro models a bicycle industry in a western capitalist economy with a population of approximately 15 million people. Consumers in this markets have high discretionary income, and will freely buy any bicycle that suits their individual needs.
There are three segments within this market: the low cost Youth Bike segment, the mid-range Mountain Bike segment and the high cost Road Bike segment. Importers were originally supplying all three segments, but in order to protect local
manufacturers, the government has regulated the market and restricted the importing of bicycles and bicycle components from other countries, now leaving all three segments available to the local manufacturers. Due to the very competitive nature of the previous free market economy, all local manufacturers were only able to produce a single product in the Mountain Bike segment. As such at this stage the other two segments do not have any products servicing them.
Your Firm
Having recently completed a Business qualification you have been hired by your company as the Advertising Manager (Brand Manager) and to oversee their single
product. Once you have proven yourself you will be promoted to Vice President of Sales & Marketing and be given control of Production, Finance and Product Development. You will then be groomed to be appointed the Company President (CEO) and be responsible for overseeing the planning, implementation and evaluation of your firm's strategic company plans.
C H A P T E R 2
Market Analysis
Market Analysis 10
The company itself is one of the leading firms in the mountain bicycle industry, and is currently operated by an existing management team responsible to it's many shareholders who have recently invested in your Firm post-government intervention providing the company with much needed capital (cash). Market research has
shown that consumers are dissatisfied with the existing products in the maturing Mountain segment and that there are now no products in the other segments. Your firm's design team is developing several new possible bike designs that will be made available to you in the coming years ahead. Using your experience gained as Brand Manager you will be in a position to determine either possible modifications to your existing product and/or investment into new products to fill the other empty markets.
Segment Overview
The market can be broken into three key market segments. The segments have
been given the names:
� Road
� Mountain
� Youth
At the beginning of MikesBikes, your firm and your competitors start with a single Mountain product, the two other segments are empty.
The Mountain Bike Segment
A consumer in this segment is typically a young person, focused on fitness and the outdoors. He or she wants a bike that will go anywhere and everywhere, and then come back. Often he/she will forego luxury features in favor of a sturdy, high
performance bike. The people who buy these bikes tend to be prepared to pay more for the right bike.
The Road Bike Segment
Those who view cycling primarily as a competitive activity dominate the Road Bike segment, with the typical racer owning at least two bikes. Products must be light, fast, and technically at the leading edge. Road bike consumers are not as sensitive to price as the other segments and some will pay up to $2,500 retail for the right bike. These consumers seldom take the advice of a sales assistant and are generally not influenced by advertising when making their purchase.
The Youth Bike Segment
The potential Youth segment for bikes is very large. The advantage of the Youth
segment is that an average youth will go through 2.1 bikes between the ages of 4 and 15 years. The primary requirements of such purchasers are usually seen through their parents' eyes - the bike has to be durable, but also relatively inexpensive while having the best image on the block.
It is important to note that demand for a product is determined by many factors in addition to the product's attributes. These include pricing, quality, advertising, and distribution.
Market Analysis 11
Consumer Preferences
Consumers are not necessarily limited to a single market, a large proportion will be purchasing multiple bikes but for each segment consumers have specific preferences. When you meet your customers needs you will maximize your sales by
growing the potential market size as well as taking sales from your competitors.
Product attributes differentiate products within each segment, these are Style/Design specifications and Technical specifications. Consumers require specific Design/Style and Technical specifications based on how they wish to use each bike, for example Road bike customers have high technical requirements in comparison to how the bike looks, where as those purchasing a Youth bike are looking for a product that will stand out from the rest.
When the Product Development decisions are made available you will have the option of selecting a new product from the three available product segments; Mountain, Youth, or Road. Each has preset Design/Style and Technical specifications that allow your product entrance into the market but are not the ideal preferences. If you wish to increase your products specifications to match your consumers preferences you must modify your existing product especially in
segments with high competition.
Your original Mountain bike has not been modified for a number of years and currently does not meet consumer preferences, by modifying an existing product you retain the historic knowledge of the product (carry-over effect of Advertising, Public Relations, and Branding) but increase demand through increasing Style/Design and/or Technical specifications. You may also want to combine this with a modification in production costs to increase your gross margins (pre-
advertising profit).
Market Research Information
Demand for a product is determined by many factors in addition to the product's attributes. These include pricing, quality, advertising, and distribution. From historic data available these other factors are more significant in increasing consumer demand than high product specifications.
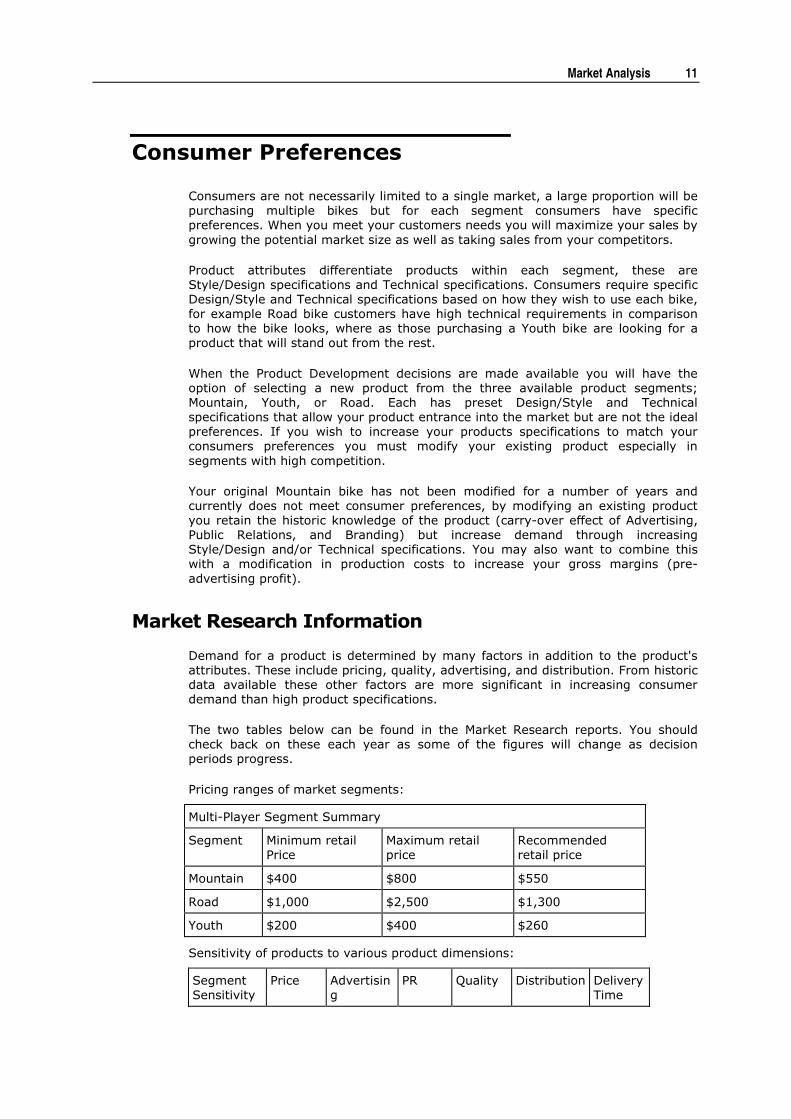
The two tables below can be found in the Market Research reports. You should check back on these each year as some of the figures will change as decision periods progress.
Pricing ranges of market segments:
Multi-Player Segment Summary
Segment Minimum retail Price
Maximum retail price
Recommended retail price
Mountain $400 $800 $550
Road $1,000 $2,500 $1,300
Youth $200 $400 $260
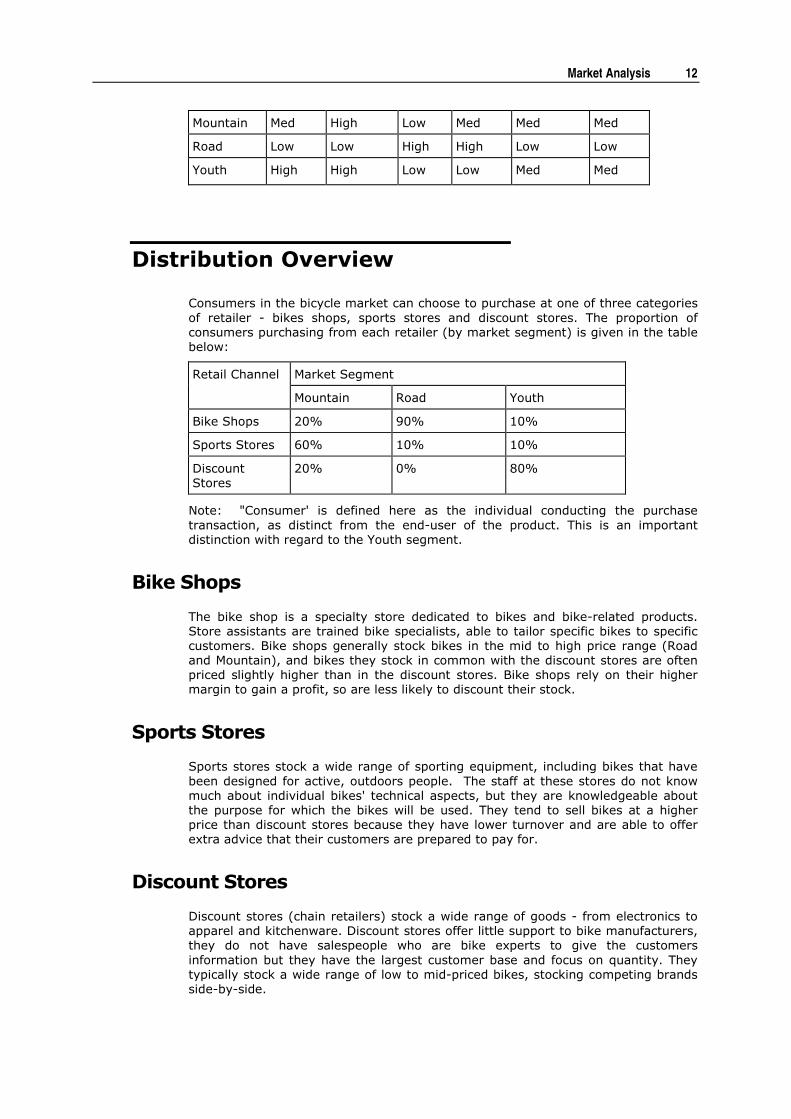
Sensitivity of products to various product dimensions:
Segment Sensitivity
Price Advertising
PR Quality Distribution Delivery Time
Market Analysis 12
Mountain Med High Low Med Med Med
Road Low Low High High Low Low
Youth High High Low Low Med Med
Distribution Overview
Consumers in the bicycle market can choose to purchase at one of three categories
of retailer - bikes shops, sports stores and discount stores. The proportion of consumers purchasing from each retailer (by market segment) is given in the table below:
Market Segment Retail Channel
Mountain Road Youth
Bike Shops 20% 90% 10%
Sports Stores 60% 10% 10%
Discount Stores
20% 0% 80%
Note: "Consumer' is defined here as the individual conducting the purchase
transaction, as distinct from the end-user of the product. This is an important distinction with regard to the Youth segment.
Bike Shops
The bike shop is a specialty store dedicated to bikes and bike-related products. Store assistants are trained bike specialists, able to tailor specific bikes to specific customers. Bike shops generally stock bikes in the mid to high price range (Road and Mountain), and bikes they stock in common with the discount stores are often priced slightly higher than in the discount stores. Bike shops rely on their higher margin to gain a profit, so are less likely to discount their stock.
Sports Stores
Sports stores stock a wide range of sporting equipment, including bikes that have
been designed for active, outdoors people. The staff at these stores do not know much about individual bikes' technical aspects, but they are knowledgeable about the purpose for which the bikes will be used. They tend to sell bikes at a higher price than discount stores because they have lower turnover and are able to offer extra advice that their customers are prepared to pay for.
Discount Stores
Discount stores (chain retailers) stock a wide range of goods - from electronics to apparel and kitchenware. Discount stores offer little support to bike manufacturers, they do not have salespeople who are bike experts to give the customers
information but they have the largest customer base and focus on quantity. They typically stock a wide range of low to mid-priced bikes, stocking competing brands side-by-side.
Market Analysis 13
Distribution Costs In
MikesBikes-Intro
Distribution (place) relates to the ability of the firm to make products accessible to its target segments. This is achieved through distribution channels - in this case through retail outlets.
The number of stores in the channel that decide to stock your products will depend on the retail price, margin, unit sales history, and extra support offered. You must specify what margin and what extra support (eg, in terms of special promotions and discounts) you are going to offer the retailers in each channel. Note that the retailer margin decision refers to the percentage of the retail price that the retailer keeps. So a percentage of 60% means that they keep 60% of the sales revenue and give
you the remaining 40%.
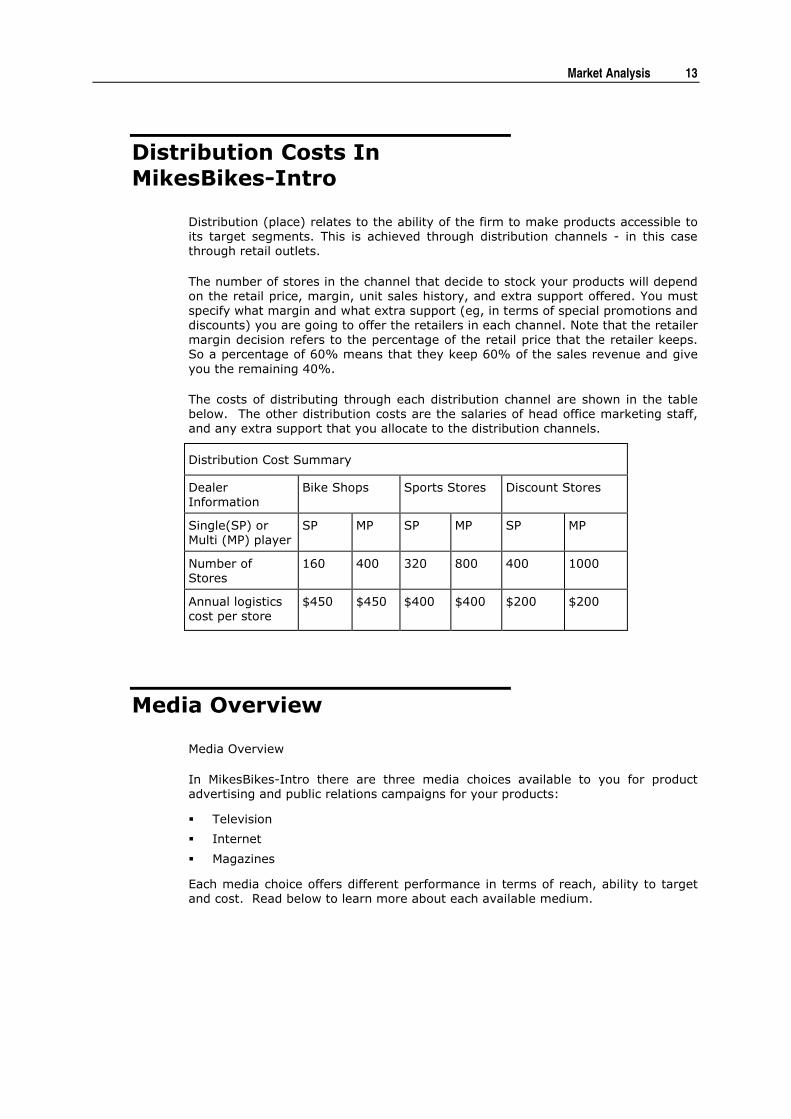
The costs of distributing through each distribution channel are shown in the table below. The other distribution costs are the salaries of head office marketing staff, and any extra support that you allocate to the distribution channels.
Distribution Cost Summary
Dealer Information
Bike Shops Sports Stores Discount Stores
Single(SP) or Multi (MP) player
SP MP SP MP SP MP
Number of Stores
160 400 320 800 400 1000
Annual logistics cost per store
$450 $450 $400 $400 $200 $200
Media Overview
Media Overview
In MikesBikes-Intro there are three media choices available to you for product advertising and public relations campaigns for your products:
� Television
� Internet
� Magazines
Each media choice offers different performance in terms of reach, ability to target and cost. Read below to learn more about each available medium.

Market Analysis 14
Television
Television is the most effective method of reaching a large audience. This is reflected in the fact that virtually every household has a television and that over 85% of all people watch television at least once a day. Adult bike riders tend to lead physically active lives, which lead them to have less time for television watching than the younger consumer. TV advertising is expensive, and a
substantial budget is required to get effective results.
Internet
The Internet can reach a relatively large mass audience with a single exposure and
at a relatively low cost. It is important to note that the viewing of Internet advertisements is from predominantly a younger to middle aged audience. Internet advertising involves developing your company’s website, pay per click advertising on popular bike review sites, and Sponsored Ad Words on major search engines etc.
Magazines
Magazines can reach a national market at relatively low cost per reader.
In the MikesBikes market there are a variety of magazines catering to bike consumers ranging from specialist racing bike magazine through general outdoor
adventure magazines to very general leisure magazines. Younger consumers are less interested in these magazines, but the adult age groups can be reached very effectively through magazine advertising.
Media Viewing Habits
Market research performed on behalf of the media companies has resulted in table below showing estimates of media viewing habits for each segment for each media type.
Market Segment Media Type
Mountain Road Youth
Television (TV)
50% 10% 80%
Internet 10% 10% 0%
Magazines 60% 80% 30%
Note: These figures do not total 100% as consumers view multiple media types.
Promotion Overview
In MikesBikes, there are three types of promotion available to you:
� Corporate Brand Advertising
� Product Advertising
� Product Public Relations (PR)
Market Analysis 15
Corporate Brand Awareness, Product Awareness and the influence of product Public Relations (PR) are determined by your current decisions as well as a percentage carryover effect from the previous periods budget. In MikesBikes Corporate Brand Advertising also increases the effectiveness of Product Advertising and results in
increased Product Awareness. This is especially cost effective when your firm has multiple products in the market.
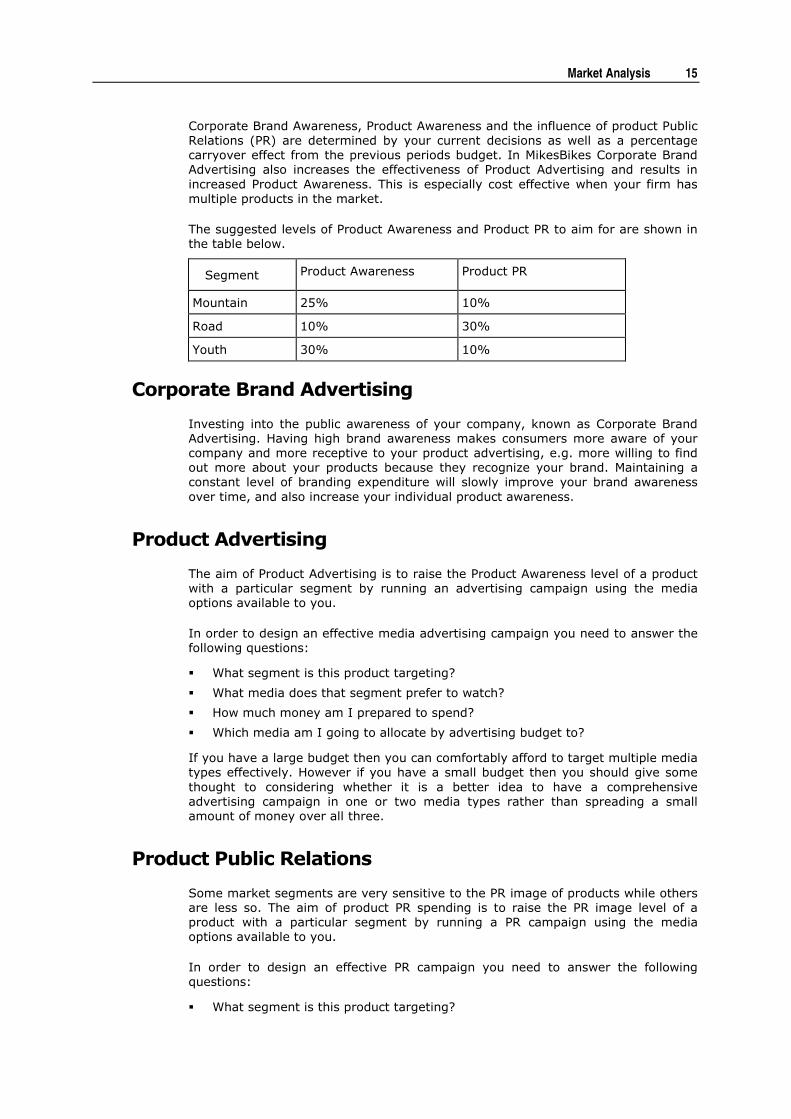
The suggested levels of Product Awareness and Product PR to aim for are shown in the table below.
Segment Product Awareness Product PR
Mountain 25% 10%
Road 10% 30%
Youth 30% 10%
Corporate Brand Advertising
Investing into the public awareness of your company, known as Corporate Brand Advertising. Having high brand awareness makes consumers more aware of your company and more receptive to your product advertising, e.g. more willing to find out more about your products because they recognize your brand. Maintaining a constant level of branding expenditure will slowly improve your brand awareness
over time, and also increase your individual product awareness.
Product Advertising
The aim of Product Advertising is to raise the Product Awareness level of a product with a particular segment by running an advertising campaign using the media options available to you.
In order to design an effective media advertising campaign you need to answer the following questions:
� What segment is this product targeting?
� What media does that segment prefer to watch?
� How much money am I prepared to spend?
� Which media am I going to allocate by advertising budget to?
If you have a large budget then you can comfortably afford to target multiple media types effectively. However if you have a small budget then you should give some
thought to considering whether it is a better idea to have a comprehensive advertising campaign in one or two media types rather than spreading a small amount of money over all three.
Product Public Relations
Some market segments are very sensitive to the PR image of products while others are less so. The aim of product PR spending is to raise the PR image level of a product with a particular segment by running a PR campaign using the media options available to you.
In order to design an effective PR campaign you need to answer the following questions:
� What segment is this product targeting?
Market Analysis 16
� What media types does that segment prefer?
� How much money am I prepared to spend?
� Which media am I going to allocate by PR budget to?
As with Product Advertising, if you do not have the budget to invest effectively in all
media types then focus the funds you have in the media types that will target the majority of your consumers.
Offline Mode
You should also test in Offline Mode to give an indication of your expected results. (File Menu-->Play offline). Offline mode allows you to take a copy of your current
market scenario, make decisions for your firm, and manually roll the game forward and back between decision periods. (Note: Offline Mode does not factor in your current competitors’ decisions, only their past decisions.)
Offline mode allows you to test decisions and strategies to see the results they will likely yield. You should pay close attention to your forecasted sales and planned production, and whether they are suitable decisions for your firm.
Once you are ready to enter decisions into Online Mode, take a copy of the Current
Decisions and/or Previous Decisions Report, disconnect then re-connect to enter these.

17
IN THIS CHAPTER
Decision Screen Overview.......................................... 17 Product Marketing Decisions ...................................... 17 Firm Marketing Decisions........................................... 19
Operations Management Decisions.............................. 20 Financial Management Decisions................................. 22
Decision Screen Overview
There are four categories of decisions that you are required to make in MB-I:
� Product Marketing: The marketing mix for each of your products, including design, price and promotion.
� Firm Marketing: The branding budget and distribution strategy for your firm.
� Operations Management: The capacity and quality strategy of your firm, plus how many of each of your products to produce.
� Financial Management: Decisions about how to finance your firm, such as whether you want to increase debt or equity.
In the rest of this chapter we will describe these decisions in more detail.
Product Marketing Decisions
When you select the Product Marketing menu item you are given access to a series of reports about the performance of your product(s). See the Evaluation chapter for more information about reports.
Expanding the Product Marketing menu item gives you access to your product slots. You start MikesBikes with a single existing product, but as the simulation
progresses you will be given access to empty product slots to allow you to launch new products.
Existing Product - Pricing
The Product Pricing tab screen is used to enter retail pricing and sales forecasts decisions for your firm's selected product for the coming year.
This is the decision screen where enter decisions to implement your pricing strategy for your product from your strategic company plan.
C H A P T E R 3
Implementation
Implementation 18
Retail Price
The Retail Price is the price that you recommend to your retailers that they sell your product for. Your pricing changes should be aligned to your current strategy and coordinated with other decisions such as Advertising, PR, Production, Capacity, and Quality (e.g. high cost/low volume, low cost/high volume, medium cost/medium volume). Pricing is one of the more influential decisions on sales and
profit, changes to price should be very well thought through.
Forecast Sales Units
The second decision you need to make is to forecast how many units you think you
will sell this year for both profit forecasting and to make accurate production decisions. If it is an existing product, then you can find out how many units you sold last year by clicking on the Reports tab, your sales units decision should be made on the previous years sales in combination with an estimate on the positive or negative change for the coming year (e.g. an increase of $X in Advertising and/or PR should result in a X positive effect on sales).
Advertising
The Product Advertising tab screen is used to enter the advertising media budgets for your firm's selected product for the coming year.
For each media type you need to determine how much money you are prepared to spend to raise your product's awareness. Make sure you read the Market Research menu item or the Market Overview chapter in this manual before deciding on your budgets.
Public Relations
The Product Public Relations tab screen is used to enter the public relations media budgets for your firm's selected product for the coming year.
For each media type you need to determine how much money you are prepared to spend to improve your product's PR image. Make sure you read the Market
Research menu item or the Market Overview chapter in this manual before deciding on your budgets.
Existing Product Development
You have three choices:
� Keep the current design
� Update the product by changing it to a new design
� Abandon the product
Keeping the current design means doing nothing this year. You will continue to sell last year's model for another year.
Changing the product by updating it with a new design allows you to select a new improved design from the list of available projects.
Implementation 19
Abandoning the product means that you no longer want to sell this product any longer and it will be withdrawn from the market and any existing inventory will be dumped at cost. Deciding which choice to make should be part of product strategy that you set in your strategic company plan.
Modifying an Existing Product
You have three available designs to choose from:
� Increase in Specifications (Style and Technology); or
� Decrease in Manufacturing Costs; or
� Both
Each design has an associated Cost to develop, Unit Cost, Specifications (Style Value & Technical Value), and SCU (how many standard factory capacity units are required to make 1 of these bikes).
New Product - Empty Product Slot
For empty product slots you have two choices:
� Launch a new product
� Do nothing this year (the product slot will still be available to you the following year if you wish to use it then).
The launch a new product screen requires you to make up to two decisions.
Segment Selector
The Segment Selector box at the top left of the screen is used to select the
segment that you would like to see designs displayed for. If you would like all available designs displayed, select "All".
Selecting and Available Design
The Available Designs box lists all the designs that you can launch a new product with. Select the design you wish to launch and push the apply button. You will be offered one potential design for each market segment. Choosing which project to implement should be clear from your marketing objectives in your strategic company plan.
Firm Marketing Decisions
When you select the Firm Marketing menu item you are given access to a series of reports about the performance of your product(s). See the Evaluation chapter for more information about reports.
Expanding the Firm Marketing menu item gives you access to your Distribution and Branding decision screen.
Implementation 20
Distribution
The Distribution tab decision screen is used to enter your retailer margin and sales promotion support budgets for each retail channel.
The number of stores in each channel that decide to stock your products will depend on the retail price, margin, unit sales history, and sales promotion support offered.
Sales Promotion Support (Extra Support)
Extra Support is funding a promotion campaign to encourage retailers to stock and promote your bikes. Extra support is useful for achieving a short term boost in
distribution coverage.
Retailer Margin
The Retailer Margin indicates the percentage of a product's retail selling price that the retailer receives as commission for selling that product. The number of retailers that choose to stock your product is partly due to the absolute amount of money that they gain from selling your product.
Branding
The Branding tab decision screen is used to enter your branding budget for increasing the awareness of your firm's corporate brand in the market.
In MikesBikes Corporate Brand Advertising contributes to the effect of any other product advertising that is carried out. Your choice is to determine how large your
corporate brand-advertising budget should be.
Operations Management
Decisions
When you select the Operations Management menu item you are given access to a
series of reports about the performance of your factory. See the Evaluation chapter for more information about reports.
Expanding the Operations Management menu item gives you access to your Capacity Planner /Quality and Production Planner decision screens.
Capacity Planner
The Capacity Planner tab decision screen is used to enter your desired level of capacity and production efficiency budget for the coming year.
Implementation 21
SCU (Standard Capacity Units)
Factory capacity is measured in Standard Capacity Units (SCU). The theoretical capacity of a factory (in SCU) is calculated from the plant (machine) capacity and the number and effectiveness of the workers.
For example, the standard RC_Rockhopper design requires 0.5 SCU to produce one bike. Then if 500 SCU were available for production then the maximum output of
this design would be 500 SCU/0.5 SCU per unit = 1000 bikes (assuming zero idle time and wastage-see below). The column on the right indicates your firm's production capacity (in SCU) for the previous year.
Keep in mind that too much capacity relative to production/sales demand will result in greater idle time (an inefficient use of resources causing higher average manufacturing costs per bike). Also note that the maximum capacity you are able to buy is set at the maximum amount of available cash you have for this year
before spending anything on any of your other budgets (decisions).
Capacity
The Capacity decision is used to enter your total factory capacity target for the coming year in terms of Standard Capacity Units (SCU). This will in turn determine the maximum number of bikes that can be produced in your factory.
Keep in mind that too much capacity relative to production/sales demand will result in greater idle time (an inefficient use of resources causing higher average manufacturing costs per bike), while also too little capacity will limit the number of sales you can make.
Capacity decisions should be made to accommodation your current entered sales forecasts and production decisions.
Wastage
Effective capacity will prove to be less than your plant capacity because of various wastage factors (such as rework, setup time, raw material stockout, and machine downtime). A factory efficiency of about 70%-80% is very good. You can see your wastage in the Capacity Decision screen graph.
Efficiency Expenditure
The Efficiency decision is used to enter the amount to be spent on reducing wastage during production. Wastage relates to time spent on activities such as setting up and maintenance of machines. In turn these activities act as a constraint on production by absorbing a proportion (%) of the factory's available capacity.
Quality
The Quality tab decision screen is used to enter your quality improvement budget
for increasing the quality of your firm's products over the coming year.
Quality refers to the satisfaction experienced by customers from a product and is an important determinant of customer demand. It is measured in MikesBikes in terms of the Quality Index which can be tracked on the Market Summary report.
Implementation 22
Increasing the size of your factory involves an increased quality budget to maintain your existing quality level. Before heavily investing in quality, consider your product strategy as some segments are heavily sensitive to quality while others are not (if you are planning to be a discount specialist then a large quality budget may be an
unnecessary expense, while if you are focusing on high end products they must be produced to a high quality).
Production Planner
The Production Planner decision screen is used to enter your desired level of production for each of your products for the coming year.
The Production Planner decision screen is used to specify the number of bikes that you intend to produce during the coming year.
The top of the screen repeats the capacity allocation pie graph from the Capacity Planner screen. This shows the relative proportion of your current factory capacity
that will be spent on the actual production of bikes as well as the wastage and idle time.
In the product allocation section you are required to set a planned production order quantity for each of your products. Production decisions should be made to accommodation your current entered sales forecasts. The Units for sale column adds that number to your existing inventory to tell you the maximum number of bikes you can sell each product this year. The forecast sales column shows you
what the forecast sales targets are for each product.
Therefore you need to go through the following process:
How many new bikes do you want to manufacture for each product? To do this you need to take into account your existing inventory, how accurate you think the sales forecast is, and how much safety stock you are prepared to have in your warehouse. See the reports tab to view your existing inventory and last years sales.
Check whether you have enough capacity to make the quantity of bikes that you want to make? If you do not, you either need to decided to increase capacity, or to prioritize your products and reduce the planned production quantities of the lower priority products.
Financial Management
Decisions
When you select the Financial Management menu item you are given access to a series of reports about the current financial position of your firm. See the Evaluation chapter for more information about reports.
Expanding the Financial Management menu item gives you access to your Loans, Equity and Dividend decision screens.
Implementation 23
Debt
The debt decision screen is used take out loans to raise cash by increasing your level of long-term debt. Loans are used to raise additional capital (cash) to finance expenditure (such as product development or marketing campaigns). Alternatively, this can be achieved through a new share issue (equity). A firm needs to decide what proportion (and/or type) of debt and equity to use when financing its business
projects.
Either choose "Raise" or "Repay" in the debt decision screen, depending on whether you want to increase or decrease your amount of long-term debt. As you adjust the level of debt you are raising/repaying, you will see the following figures in the decision screen change:
� Total Debt
This is the total amount of debt your firm owes to the bank.
� D/E Ratio
This is your firm's debt to equity ratio. The D/E ratio is included in the share price
calculation and is a measure of risk. The higher the DE ratio, then the higher the relative debt levels of the firm and the higher a risk it is to investors so the less value a share has.
� Interest Rate
This is the annual interest rate the bank will charge your firm for the loan.
� Annual Interest
This is the amount of interest you can expect to pay the bank after a year of trading.
Equity
The Equity decision screen is used to issue or repurchase shares (equity) in your firm. As you issue or repurchase shares, you will see the following figures in the
decision screen change:
� Book Equity
Book equity is based on the issue price of the shares, and is the dollar figure in the balance sheet.
� Market Equity
Your market equity is the market value of your currently issued shares, e.g. if you have 1 million shares and a share price of $8, then your market equity is $8m.
� # Shares
This is the number of shares your firm has issued.
� D/E Ratio
This is your firm's debt to equity ratio. The D/E ratio is included in the share price calculation and has a measure of risk. The higher the DE ratio, then the higher the
relative debt levels of the firm and the higher a risk it is to investors so the less value a share has.
Implementation 24
ISSUING SHARES
You can issue shares to raise more capital (cash) by selecting the issue button and entering the amount of capital you wish to raise, or by moving the slider to a desired position. The maximum amount of capital you can raise in a year is 50% of
your market equity, so you can increase the number of outstanding shares by up to 50%.
The negative effect of issuing shares (with all other variables held constant) is a reduction in the value of your Share Price and Shareholder Value (SHV).
REPURCHASING SHARES
You can repurchase shares to increase the equity owned by the company rather
than the public and therefore increase the demand for your shares. Selecting the repurchase button allows you to enter a dollar value of shares to repurchase, or you can move the slider into the desired position. Note that the maximum value of shares that you can buy back in a year is 10% of your market equity.
The effect of repurchasing shares (with all other variables held constant) is an increase in your Share Price and Shareholder Value (SHV).
Dividends
The Dividend Decision screen is used to issue dividends to shareholders. A dividend is a payment by a company to its shareholders once they are profitable to make a
return on their investment. The decision entered is the amount paid per share that has been issued by your company, for example a 50c dividend paid within a company that has 1,800,000 shares will cost your company $900,000. To pay a dividend, enter the amount (cents per share) that you want to pay, or move the slider into the desired position. The Total Dividend ($) shown is the amount you will be paying in dividends.
Dividends have a positive effect on your Shareholder Value (SHV). MikesBikes
restricts the maximum size of the dividend payment that you are allowed to make based on your average earnings per share to stop you accidentally bankrupting your firm.
25
IN THIS CHAPTER
Evaluation Overview ................................................. 25
Evaluation Overview
As stated earlier the management process consists of formulating a strategic plan, implementing it and evaluating its performance as shown in the figure below.
In simple terms the purpose of evaluation is to measure how far you have progressed towards meeting your firm's strategic objectives. Through evaluation you can observe what decisions and strategies have worked well, and which have not. Evaluating your current position will allow you go into the planning stage able to review your objectives and strategies in an informed manner.
The aim of this chapter is to guide you through the types of information and reports
available to you in MB-I and to aid you with evaluating your performance.
Major Reports Available
In MikesBikes there are nine major report menu items that evaluate the performance of the whole firm. Underneath each item are the sub-reports that are also available to you.
There are main summary reports that should be your priority to view after each rollover to view key performance indicators:
C H A P T E R 4
Evaluation

Evaluation 26
The Year Ahead Report
An overview of the new decisions available to you with advice on moving ahead this year.
The Market Research Report
Found under the Market Research menu and contains Key market research information about the MikesBikes Industry.
The Industry Benchmark Report
Found under the Industry Reports menu containing a comprehensive comparison of your firm's performance in all areas versus its competitor(s).
Under the Firm Results menu there are a number three key reports providing a summary of your firm's financial performance over the previous year. These are:
� Income Statement
� Cashflow Statement
Under the Product Marketing menu there are two key reports about the market performance of your products:
� Market Summary (summary of the performance of all your products in comparison to your competitors)
� Products - Sales, Margin, Production (The income, costs, and profit of each of your product)
The Financial Management Overview Report
Found under the Financial Management menu provides a summary of the information about your current cash position and whether you have the financial resources to implement your current decisions.
The Overview of Firm Marketing Reports
Found under the Firm Marketing menu and provides a summary on your firm's distributions and branding performance.
The Factory Report
Found under the Operations Management menu is a summary on your factory capacity levels, efficiency, quality, and inventory levels.
Forecast Results Reports Overview
Found under the Forecast Results menu providing Pro-forma financial results forecasting your firm's performance for the coming year based on your current
sales forecasts.
Evaluation 27
In a typical year you will review your previous year's performance by reading the Industry Reports and Firm results reports. Decisions need to be based on strategy as well as evaluation of this strategy using all of the reports available to you.
Found under the Forecast Results menu providing Pro-forma financial results
forecasting your firm's performance for the coming year based on your current sales forecasts.
These are critical in your decision making process. They provide accurate estimates on your performance in the next period, as well as ensuring you do not spend more than your cash on hand allows. We advise you check these reports after making any new decision. Once decisions have been entered you can review your Forecast Results reports which are immediately updated as you make changes, if you are not
satisfied with your forecast results then you can repeat the process of planning your decision set and forecasting sales.
Forecasting Current Decisions
In a typical year you will review your previous year's performance by reading the Industry Reports and Firm results reports. Your Current Decisions need to be based on strategy as well as evaluation of this strategy using all of the reports available to
you.
Pro Forma Reports
The Pro Forma reports are critical in your decision making process. They provide
accurate estimates on your performance in the next period, as well as ensuring you do not spend more than your cash on hand allows. We advise you check these reports after making any new decision. Once decisions have been entered you can review your Forecast Results reports which are immediately updated as you make changes, if you are not satisfied with your forecast results then you can repeat the process of planning your decision set and forecasting sales.
We recommend that you focus on accurate forecasting. There are numerous reports available to aid in forecasting and to compare your actual performance to your previous forecasts.
Offline Mode
You should also test in Offline Mode to give an indication of your expected results (Offline button at top of screen). Offline mode allows you to take a copy of your
current market scenario, make decisions for your firm, and manually roll the game forward and back between decision periods. (Note: Offline Mode does not factor in your current competitors’ decisions, only their past decisions).
Offline mode allows you to test decisions and strategies to see the results they will likely yield. You should pay close attention to your forecasted sales and planned production, and whether they are suitable decisions for your firm.
28
Reports
The Year Ahead Report
When you select the Year Ahead tree item you are given access to a series of two reports:
� The Year Ahead. A brief overview of changes in the scenario this year, and some advice.
� Strategic Company Planning. A reminder of the key steps involved.
Both of these reports are self-explanatory and you should be able to interpret them without any difficulty.
Market Research Reports
The Market Research Reports give you detailed information about the preferences and shopping habits of each market segment, and all the costs associated with the scenario.
� Market Information
� Distribution Summary
� Other Information
Industry Reports
When you select the Industry Overview tree item you are given access to a series of industry level reports:
� Industry Reports Overview. A memo summarizing the reports available.
� Industry Benchmark Report. A summary of all firms' key financial reports so that you can benchmark yourself against your competitors.
� Multi-firm Shareholder Values. A line graph of all firms' shareholder values over time.
� Multi-firm Profit. A line graph of all firms' profit (net income) over time.
� Multi-firm Wholesale Sales Revenue. A line graph of all firms' wholesale sales revenue over time.
� Multi-firm Manufacturing Capacity. A line graph of all firms' manufacturing capacity levels over time.
� Market Share. A pie chart of market share percentages for each firm based on retail sales revenue for the entire MB-I market.
� Segment Sales in Units. A line graph of total units of bikes sold in each market segment. This allows you to see changes in total demand for each segment.
C H A P T E R 5
Glossary
Glossary 29
Key terms of the Industry
Benchmark Report
Financial Results
There are three key variables that you need to understand from this section, share price, shareholder value and investor PR index.
Your share price is the current market price of one share in your firm; the main drivers of share price are your average earnings per share (EPS) and your D/E
ratio. If you want to improve your share price then you need to keep improving your EPS and to keep your D/E ratio below 1.0.
Shareholder value is a measure of how much value a shareholder has received from owning one share of your company from the moment you took over running your firm. So shareholder value is the current share price, plus the accumulated dividends that you have paid with 10% compounded interest.
Investor PR Index is a value (from 0 to 1) based on Investor Relations spending in
comparison to your competitors.
Customer Satisfaction
Most of the fields here should be self-explanatory. However you need to be aware that the Distribution Channel support figures includes both your extra support (sales promotion support) spending and the annual support cost of supporting all of the retailers that currently stock your products. Distribution Summary report details what those annual costs are.
So every firm that has at least one store stocking its products will be spending at least a couple of hundred dollars. To see what their sales promotion budgets are,
view the Multi-firm Retailer Margins and Extra Support report under Firm Marketing.
Internal Results
The main purpose of this section of the report is so that you can compare your production efficiency strategy with your competitors. Make sure you compare your wastage results, and number of products, the lower the production efficiency budget and the higher the number of products (more setup time) then the worse a firm's wastage value will be.
Innovation and Learning
Monitor how much your competitor(s) are spending on product development, it means that they are either making their products cheaper to produce, more attractive to the market or both. If you let a competitor get a significant production
cost advantage over you then they will easily win any price wars involving that product.
Glossary 30
Firm Results
When you select the Firm Results tree item you are given access to a series of firm level financial performance reports:
� Firm Reports Overview. A memo summarizing your firm's key financial results and the reports available.
� Income Statement, This Year Versus Last Year. A comparison of your actual
results for this year versus last year. You may or may not have achieved your forecast result, but this report will tell you whether your actual results have improved on last year. Note that this report is unavailable in the first year of MikesBikes.
� Income Statement, Actual Versus Forecast. This report compares your actual
results versus your forecast result. The purpose of this report is to review the accuracy of your forecasting so that you can evaluate and improve your forecasting technique.
� Income Statement. Your income statement, showing how much profit (net income) your firm made last year.
� Balance Sheet. Your balance sheet for the previous financial year. A balance sheet is the financial statement that reports your firm's financial condition.
� Cashflow Statement. Your cash flow statement, showing how much cash your firm received and spent last year.
� Last Year's Decisions. A report detailing the decisions that you entered last year.
� Cost of Goods Manufactured and Gross Margin Report. The Cost of Goods
Manufactured reports shows the average manufacturing cost of each of your product(s), and the Gross Margin report shows each product(s) gross margin calculation.
� Factory Overhead Allocation Rates. Information for accounting majors, showing how your factory's overheads were divided between your product(s).
� Income Statement History. A table providing a history of your income statements since you took control of your firm.
� Balance Sheet History. A table providing a history of your balance sheets since you took control of your firm.
� Emergency Equity Injection History. A table recording any emergency equity
injections or withdrawals that your course instructor has made to your firm. You should be able to interpret most of these financial reports unaided (or by referring to your textbook) but examples of the Income Statement, Income Statement Actual vs. Forecast and Balance Sheet reports follow below.
Key Terms on the Income
Statement
Sales Revenue
Sales revenue is the amount of money that you received for the bikes that your firm sold this year, i.e. wholesale price multiplied by the quantity sold.
Glossary 31
Cost of Goods Sold (COGS)
Cost of goods sold is the amount of money that it cost you to produce the bikes that your firm sold this year. For a more detailed calculation breakdown, see the COGM and Gross Margin report.
Gross Margin
Gross Margin (gross profit), is how much your firm earned this year by making bikes and selling them. It excludes all other costs of operating your firm, except the manufacturing costs of the bikes you sold, e.g. it does not include advertising.
There are three things that you can do to increase your gross margins in MB-I:
� Increase your prices
� Reduce your retailer margins
� Use product development to reduce the manufacturing cost of your product(s).
Operating Expenses (Other Expenses)
Operating Expenses are all of the other costs involved in operating your firm. This includes selling and distribution expenses, production management expenses, administration expenses and financial expenses.
Net Income or Net Loss
Net income or net loss is your firm's revenue minus its COGS, operating expenses and tax.
Dividing your net income/loss by the number of shares that your firm has issued
will give you your firm's earnings per share (EPS), which is the major contributor to your share price. The higher your EPS gets the higher your share price will rise and vice versa.
Income Statement Actual Vs. Forecast
This report is a comparison of your actual results for the current period against your forecast result. The purpose of this report is to review the accuracy of your forecasting so that you can evaluate and improve your forecasting technique.
The key components of this report (Sales, Expenses etc.) are explained in detail above under the Income Statement Report discussion. The purpose of the
discussion below is to clarify what data is used for each of the columns.
Pro Forma Results (Forecast Result)
Your forecast sales revenue is based on the sales forecasts that you entered for
each of your products last year.
Expenses with an asterisk (*) were estimated from your previous years result, but all of the other numbers were drawn from the decisions that you entered.
Glossary 32
Actual Results
Your actual result is obviously the results that you actually achieved. If your actual sales revenue is significantly different than your forecast then you should:
� Check the Product Marketing overview report to check what the actual sales were for each of your product(s).
� Review the Market Summary report to see what impact competitors' actions had on your sales.
� Review your forecasting technique, to see whether with hindsight there were some obvious signals that you missed.
Variance
Is a simple percentage of how much different your actual is compared to you forecast, e.g. (26)% means that it is 26% less than your forecast.
Balance Sheet
A balance sheet is the financial statement that reports your firm's financial condition. It is composed of three major accounts: assets, liabilities and stockholder's equity (owner's equity). It is called a balance sheet because it shows a balance between two figures: the company's assets on the one hand, and its liabilities plus owner's equity on the other.
The three major concepts you need to understand are: assets, liabilities and stockholder's equity (owner's equity).
Assets
Assets are economic resources owned by your firm. Current assets are items that can be converted into cash (i.e. sold) in less than a year, e.g. your inventory and any cash you have in your bank account. Non-current assets (or Fixed Assets) are items that would take longer to sell, and in MB-I this is your plant capacity (factory).
Liabilities
Liabilities are what your firm owes to others. Current liabilities are payments due in less than a year, e.g. in MB-I this is your overdraft (if you have one) and any tax
that you need to pay. Non-current liabilities (long-term liabilities) are payments not due for a year or longer, e.g. in MB-I this is any outstanding loans that your firm still has to repay.
Stockholder's Equity (Owners Equity)
The value of things that your firm owns (assets) minus the amount of money you owe to others is called stockholders' equity. In MB-I stockholders' equity is made up of two things, share capital, which is the money that stockholders paid your firm to buy shares in it and retained earnings, which is profits that your firm has reinvested back into itself.
Glossary 33
Financial Management Reports
When you select the Financial Management tree item you are given access to a series of two reports:
� Financial Management Overview. A memo outlining whether or not you have enough funds (cash) to implement your current planned decisions.
� Pro Forma Funds Available. A more detailed analysis of your funding situation.
� Pro Forma Cash Flow Report. A pro forma analysis of your firm's likely cash flows next year.
It's important that you understand how to tell whether you have enough money or not, so we will examine the Pro Forma Funds Available report in more detail below.
Note that this report has been prepared for non-accounting majors, if you are an accounting major you should ignore it and use the Pro Forma Cashflow report under Forecast Results.
Pro Forma Funds Available
This report gives you an estimate of whether or not you have enough cash to cover
the cost of the decisions that you have made for next year.
Strictly speaking this is not a true accounting report, and can be best described as a "back of an envelope" calculation for non-accounting majors. If you are an accounting major, or have a solid understanding of financial accounting then review the Pro forma cash flow report, as it is a more accurate representation of your likely cash position next year.
There are two results that can occur in this report; it will either show "Funds
Remaining" or a "Funds Shortage". If the report shows "Funds Remaining" then that means that you have more than enough cash to implement your decisions regardless of whether or not you sell any bikes next year. If the report shows a "Funds Shortage", then that means that you do not have enough cash reserves to fund your decisions without taking into account any cash you earn next year.
Most years you should never show a "Funds Shortage" when you are running your firm in a healthy state. So our advice is to reduce your expenditure and/or raise
additional funds through either taking out loans, or shares, or selling capacity. However if you are trying to implement a riskier strategy then the only requirement of MikesBikes is that you have sufficient funds to cover your financial obligations (e.g. overdraft, loan repayments, dividends etc.), capacity purchases and any product development expenses. You can then use the Pro Forma Cashflow statement to see whether you will then have sufficient operating cashflows to cover
your other decisions.
Product Marketing Reports
When you select the Product Marketing tree item you are given access to a series of
reports:
� Product Marketing Overview. A memo outlining a summary of the key financial results of your product(s).
� Market Summary. A market research report giving a detailed side by side comparison of all of the products in the market.
� Products - Sales, Margin, Production. A table summarizing the financial performance of all of your active product(s).
Glossary 34
� Multi-firm Product Unit Sales. A line graph showing the unit sales history of all firms' products.
� Multi-firm Product Prices. A line graph showing the pricing history of all firms' products.
� Multi-firm Product Awareness. A line graph showing the product awareness (due to advertising) history of all firms' products.
� Multi-firm Product Unit PR Influence. A line graph showing the "PR influence" rating history of all firms' products.
You should be able to interpret most of these reports unaided (or with the help of your team) but an example of the Market Summary report follows below.
Market Summary
The Market Summary report is a market research report giving a side-by-side comparison of all of the products currently being sold in the market.
There are eight key pieces of information on this report.
Sales
Sales is simply how many units did this product sell last year.
Retail Price
Retail price is the recommended retail price that each firm set for their product(s). You need to remember that the wholesale price is the retail price minus the retailer margin, so it is possible that a cheaper product than yours might have a higher wholesale price if that firm has lower retailer margins.
Awareness
Awareness is a measure of how many consumers in that segment are aware of your product due to your corporate brand advertising and product advertising. An awareness rating of 0.50 means that 50% of the consumers in that segment are
aware of your product. When trying to raise the awareness level of your product(s), you need to pay attention to making sure that you are targeting your budgets to the media types that the particular segment watches the most.
Public Relations (PR)
PR is a measure of how many consumers in that segment have a "good" public relations image of your product due to your PR expenditure. When consumers read bike magazines you want them to see your product being reviewed and talked about and that is what your PR budgets are for. A PR rating of 0.40 means that 40% of the consumers in that segment have heard some good PR about your
product.
Distribution
The distribution rating is a measure of how much distribution coverage your product has. A distribution rating of 0.65 means that 65% of consumers in that segment will find your product in a store they regularly shop at.
Glossary 35
The only way to improve your distribution rating is to convince more stores to stock your bikes.
Quality
The quality rating is a measure of how many units of your product are returned under warranty. If approximately 2% of your sales are returned under warranty then your rating will be approximately 0.50, but if you can reduce it to
approximately 0.3% of your sales being returned under warranty then your quality rating will rise to 0.90. In MikesBikes the only control you have over quality is how much money you allocate to your quality improvement budget each year.
Delivery
Delivery is a measure of how often your retailers run out of stock of your bikes. A delivery performance rating of 1.0 means that your factory never stocks out of bikes, however if your factory stocks out of bikes this year, then next year your delivery performance rating will fall. The lower your delivery performance rating, the less likely that retailers will want to stock your bikes. However be careful, as
some segments are more sensitive than others to stocking out. Read the Product Marketing Overview to see which if any of your product(s) stocked out this year, it's shown as "Est. Lost Sales".
Product Specs
The "product specs" rating is a measure of how close your product is to the segment's ideal dimensions for "tech" and "style". A rating of 1.0 means that your product is 100% what the segments wants, a rating of less than 1.0 means that it is not. As MikesBikes progresses you will be offered numerous product development projects that will improve the product spec ratings of your products, if your product
spec ratings are lower than your competitors it means that they are spending more money on product development than you are.
Firm Marketing Reports
When you select the Firm Marketing tree item you are given access to a series of reports:
� Firm Marketing Overview. A memo outlining a summary of the key financial results of your distribution strategy.
� Multi-firm Product Distribution Levels. A line graph showing the distribution coverage history of all firms' products.
� Multi-firm Brand Awareness. A line graph showing corporate brand awareness history for all firms.
� Multi-firm Retailer Margin and Extra Support. A table comparing all firm's retailer margins and sales promotion support budgets.
The purpose of these reports is to evaluate the effectiveness of your distribution
and branding strategies. The reports are relatively simple and you should be able to interpret them unaided (or with the help of your team).
Operations Management Reports
When you select the Operations Management tree item you are given access to a series of reports:

Glossary 36
� Operations Management Overview. A memo outlining the key inventory level information of all of your product(s).
� Factory Report. A table summarizing last year's capacity/quality decisions and their effects on your factory.
� Multi-firm Product Quality Ratings. A line graph comparing all firms' quality ratings over time.
� Multi-firm Product Delivery Performance. A line graph comparing all firms' delivery performance over time.
� Product Inventory Line Chart. A line graph showing the inventory levels of each of your products before this year's orders were placed.
The purpose of these reports is to evaluate the effectiveness of your capacity, quality and inventory management strategies. The reports are relatively simple and you should be able to interpret them unaided (or with the help of your team).
Forecast Results
When you select the Forecast Results tree item you are given access to a series of
pro forma firm level financial performance reports for next year:
� Forecast Results Reports Overview. A memo summarizing the forecast key financial results for your firm and the reports available.
� Pro Forma Funds Available. A report detailing whether you will have enough funds to implement your current decisions.
� Pro Forma Income Statement. A comparison of your forecast income statement versus your current income statement.
� Pro Forma Gross Margin Report. A table showing the forecast gross margins for each of your products if your sales forecasts are accurate.
� Pro Forma Cost of Goods Manufactured Report. An estimate of your COGM report if your sales forecasts are accurate.
� Pro Forma Cashflow Statement. An estimate of your cash flow statement,
showing how much cash your firm will spend and receive next year if your sales forecasts are accurate.
� Current Decisions. A report detailing the decisions that you have entered for this year.
The purpose of these reports is to evaluate the likely financial results of the decisions that you have entered for this year. Remember that it assumes that your
sales forecasts are 100% accurate.
If you have any problems interpreting these reports then remember to refer to the Firm Results and Financial Management sections above, as the reports are very similar.
Key Terms Explained
Shareholder Value Definition
The success of a firm in MikesBikes-Intro is measured in terms of its Shareholder Value (SHV). This is defined as:
Shareholder Value (SHV) = Market Share Price + Accumulated Dividends
Where:
Glossary 37
Market Share Price = function (Earnings per share, Debt to Equity ratio)
You determine your firm's dividend payments, but market share price is determined by a function of two components:
Earnings per Share (EPS)
Earnings per share (EPS) is calculated by taking the net profit of your firm and dividing it by the number of shares currently issued. For example, if your net profit
is $2m and you have 1m shares, then your EPS is $2 per share.
Increasing earnings per share causes your firm's share price to rise because the profit being earned per share is increasing which increases the value to investors. For example, owning 100 shares in a firm with $2m net profit and 1m shares is worth more than in a firm with $2m and 2m shares, because 100/1m is greater than 100/2m meaning that as an investor you own a greater share of the profits.
Debt to Equity Ratio (D/E Ratio)
The DE ratio measures the amount of debt (outstanding loans, overdraft and taxes) your firm has relative to its equity (shareholder funds). In essence, the DE ratio
refers to the proportion of the firm's total assets that can be claimed by debtors and shareholders. For example with a DE ratio of 0.5 and $3m assets, then $1m is owed to debtors and shareholders own $2m.
The DE ratio is included in the share price calculation has a measure of risk. The higher the DE ratio, then the higher the relative debt levels of the firm and the higher a risk it is to investors so the less value a share has. You can increase your DE ratio by using your overdraft and/or getting loans, and you can reduce it by
repaying debt.
38
A
Advertising • 14
B
Bike Stores • 12 Brand Advertising • 14
C
Capacity • 20
D
Debt to Equity Ratio • 28 Decision Schedule • 5 Discount Stores • 12 Dividends • 22 Download • 1
E
Earnings Per Share • 28 Equity • 22
F
Forecasting • 5, 28
H
History of Industry/Firm • 1
I
Investor Relations • 22 Issuing Shares • 22
L
Loans • 22
M
Magazines • 12 Market Research • 10 Mountain Bike Segment • 10 Multi-Player • 1
O
Offline Mode • 5
P
Planning • 5 Pro Forma Reports • 25 Product Development • 17 Production • 20 Public Relations • 14
Q
Quality • 20
R
Registration • 1 Repurchasing Shares • 22, 28 Road Bike Segment • 10
S
Shareholder Value (SHV) • 5 Single-Player • 1 Sports Stores • 12 Standard Capacity Units (SCU) • 20 Strategy • 5
T
Television • 13
Y
Youth Bike Segment • 10
Index