Embed Size (px)
Citation preview
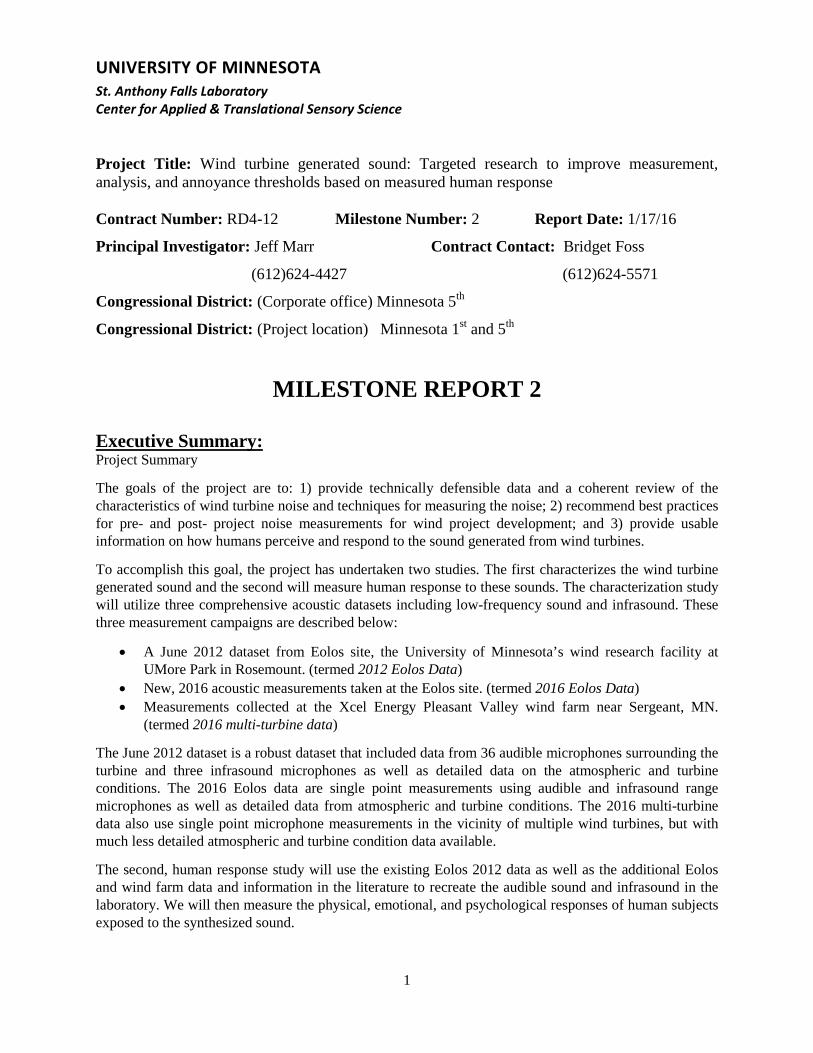
UNIVERSITY OF MINNESOTA St. Anthony Falls Laboratory Center for Applied & Translational Sensory Science Project Title: Wind turbine generated sound: Targeted research to improve measurement, analysis, and annoyance thresholds based on measured human response Contract Number: RD4-12 Milestone Number: 2 Report Date: 1/17/16
Principal Investigator: Jeff Marr Contract Contact: Bridget Foss
(612)624-4427 (612)624-5571
Congressional District: (Corporate office) Minnesota 5th
Congressional District: (Project location) Minnesota 1st and 5th
MILESTONE REPORT 2
Executive Summary: Project Summary
The goals of the project are to: 1) provide technically defensible data and a coherent review of the characteristics of wind turbine noise and techniques for measuring the noise; 2) recommend best practices for pre- and post- project noise measurements for wind project development; and 3) provide usable information on how humans perceive and respond to the sound generated from wind turbines.
To accomplish this goal, the project has undertaken two studies. The first characterizes the wind turbine generated sound and the second will measure human response to these sounds. The characterization study will utilize three comprehensive acoustic datasets including low-frequency sound and infrasound. These three measurement campaigns are described below:
• A June 2012 dataset from Eolos site, the University of Minnesota’s wind research facility at UMore Park in Rosemount. (termed 2012 Eolos Data)
• New, 2016 acoustic measurements taken at the Eolos site. (termed 2016 Eolos Data) • Measurements collected at the Xcel Energy Pleasant Valley wind farm near Sergeant, MN.
(termed 2016 multi-turbine data)
The June 2012 dataset is a robust dataset that included data from 36 audible microphones surrounding the turbine and three infrasound microphones as well as detailed data on the atmospheric and turbine conditions. The 2016 Eolos data are single point measurements using audible and infrasound range microphones as well as detailed data from atmospheric and turbine conditions. The 2016 multi-turbine data also use single point microphone measurements in the vicinity of multiple wind turbines, but with much less detailed atmospheric and turbine condition data available.
The second, human response study will use the existing Eolos 2012 data as well as the additional Eolos and wind farm data and information in the literature to recreate the audible sound and infrasound in the laboratory. We will then measure the physical, emotional, and psychological responses of human subjects exposed to the synthesized sound.
1
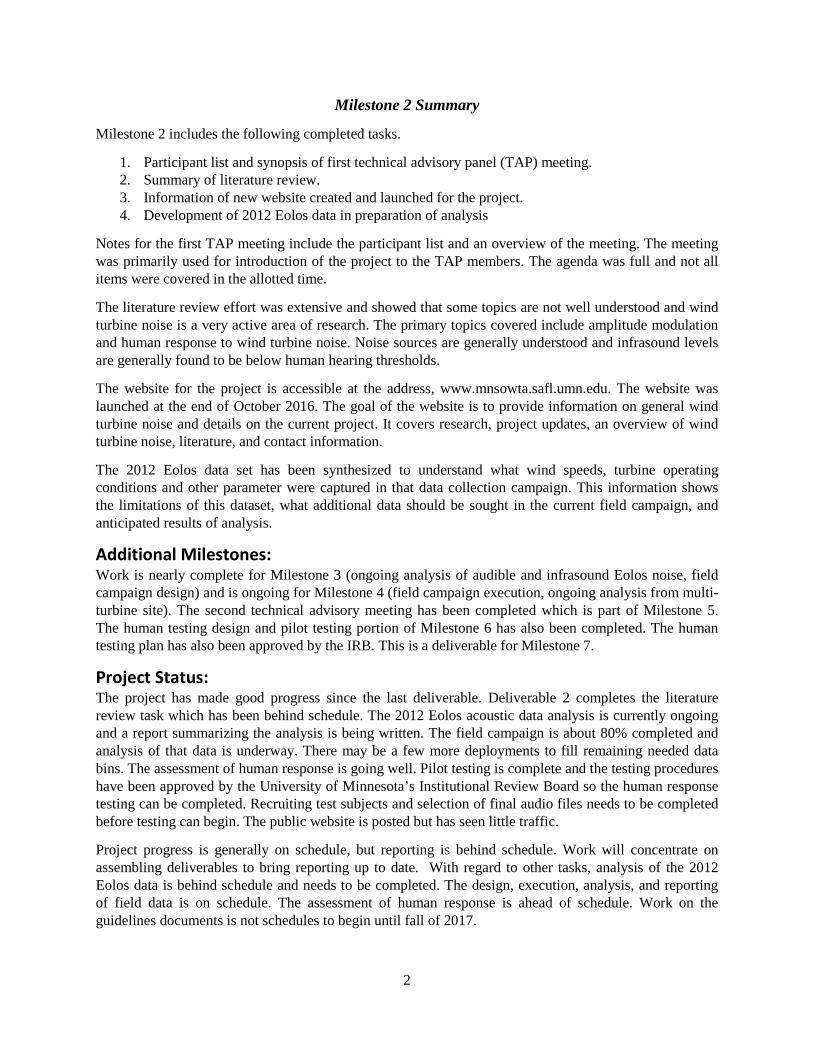
Milestone 2 Summary
Milestone 2 includes the following completed tasks.
1. Participant list and synopsis of first technical advisory panel (TAP) meeting. 2. Summary of literature review. 3. Information of new website created and launched for the project. 4. Development of 2012 Eolos data in preparation of analysis
Notes for the first TAP meeting include the participant list and an overview of the meeting. The meeting was primarily used for introduction of the project to the TAP members. The agenda was full and not all items were covered in the allotted time.
The literature review effort was extensive and showed that some topics are not well understood and wind turbine noise is a very active area of research. The primary topics covered include amplitude modulation and human response to wind turbine noise. Noise sources are generally understood and infrasound levels are generally found to be below human hearing thresholds.
The website for the project is accessible at the address, www.mnsowta.safl.umn.edu. The website was launched at the end of October 2016. The goal of the website is to provide information on general wind turbine noise and details on the current project. It covers research, project updates, an overview of wind turbine noise, literature, and contact information.
The 2012 Eolos data set has been synthesized to understand what wind speeds, turbine operating conditions and other parameter were captured in that data collection campaign. This information shows the limitations of this dataset, what additional data should be sought in the current field campaign, and anticipated results of analysis.
Additional Milestones: Work is nearly complete for Milestone 3 (ongoing analysis of audible and infrasound Eolos noise, field campaign design) and is ongoing for Milestone 4 (field campaign execution, ongoing analysis from multi-turbine site). The second technical advisory meeting has been completed which is part of Milestone 5. The human testing design and pilot testing portion of Milestone 6 has also been completed. The human testing plan has also been approved by the IRB. This is a deliverable for Milestone 7.
Project Status: The project has made good progress since the last deliverable. Deliverable 2 completes the literature review task which has been behind schedule. The 2012 Eolos acoustic data analysis is currently ongoing and a report summarizing the analysis is being written. The field campaign is about 80% completed and analysis of that data is underway. There may be a few more deployments to fill remaining needed data bins. The assessment of human response is going well. Pilot testing is complete and the testing procedures have been approved by the University of Minnesota’s Institutional Review Board so the human response testing can be completed. Recruiting test subjects and selection of final audio files needs to be completed before testing can begin. The public website is posted but has seen little traffic.
Project progress is generally on schedule, but reporting is behind schedule. Work will concentrate on assembling deliverables to bring reporting up to date. With regard to other tasks, analysis of the 2012 Eolos data is behind schedule and needs to be completed. The design, execution, analysis, and reporting of field data is on schedule. The assessment of human response is ahead of schedule. Work on the guidelines documents is not schedules to begin until fall of 2017.
2

LEGAL NOTICE
THIS REPORT WAS PREPARED AS A RESULT OF WORK SPONSORED BY THE RENEWABLE DEVELOPMENT FUND AS MANAGED BY XCEL ENERGY. IT DOES NOT NECESSARILY REPRESENT THE VIEWS OF XCEL ENERGY, ITS EMPLOYEES, OR THE RENEWABLE DEVELOPMENT FUND ADVISORY GROUP. XCEL ENERGY, ITS EMPLOYEES, CONTRACTORS, AND SUBCONTRACTORS MAKE NO WARRANTY, EXPRESS OR IMPLIED, AND ASSUME NO LEGAL LIABILITY FOR THE INFORMATION IN THIS REPORT; NOR DOES XCEL ENERGY, ITS EMPLOYEES OR THE RENEWABLE DEVELOPMENT FUND ADVISORY GROUP REPRESENT THAT THE USE OF THIS INFORMATION WILL NOT INFRINGE UPON PRIVATELY OWNED RIGHTS. THIS REPORT HAS NOT BEEN APPROVED OR DISAPPROVED BY NSP NOR HAS NSP PASSED UPON THE ACCURACY OR ADEQUACY OF THE INFORMATION IN THIS REPORT.
Project funding provided by customers of Xcel Energy through a grant from the Renewable Development Fund.
3
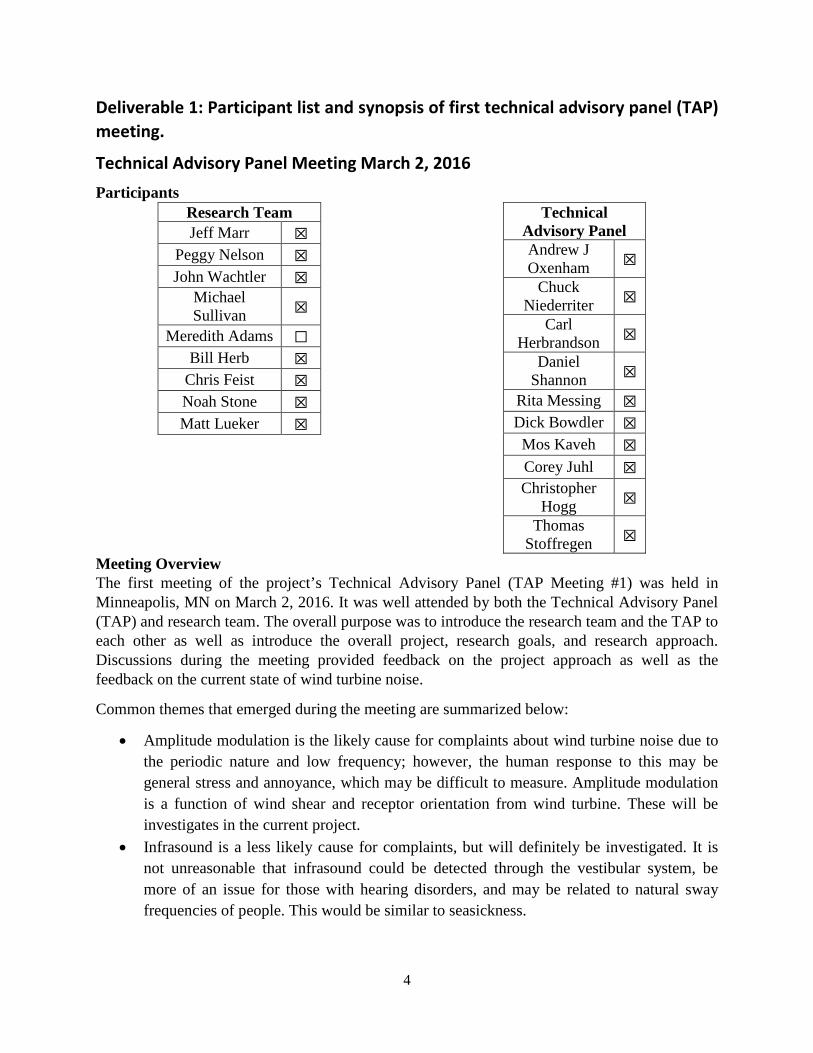
Deliverable 1: Participant list and synopsis of first technical advisory panel (TAP) meeting.
Technical Advisory Panel Meeting March 2, 2016 Participants
Research Team Jeff Marr ☒
Peggy Nelson ☒ John Wachtler ☒
Michael Sullivan ☒
Meredith Adams ☐ Bill Herb ☒
Chris Feist ☒ Noah Stone ☒ Matt Lueker ☒
Technical Advisory Panel Andrew J Oxenham ☒
Chuck Niederriter ☒
Carl Herbrandson ☒
Daniel Shannon ☒
Rita Messing ☒ Dick Bowdler ☒ Mos Kaveh ☒ Corey Juhl ☒ Christopher
Hogg ☒
Thomas Stoffregen ☒
Meeting Overview The first meeting of the project’s Technical Advisory Panel (TAP Meeting #1) was held in Minneapolis, MN on March 2, 2016. It was well attended by both the Technical Advisory Panel (TAP) and research team. The overall purpose was to introduce the research team and the TAP to each other as well as introduce the overall project, research goals, and research approach. Discussions during the meeting provided feedback on the project approach as well as the feedback on the current state of wind turbine noise.
Common themes that emerged during the meeting are summarized below:
• Amplitude modulation is the likely cause for complaints about wind turbine noise due to the periodic nature and low frequency; however, the human response to this may be general stress and annoyance, which may be difficult to measure. Amplitude modulation is a function of wind shear and receptor orientation from wind turbine. These will be investigates in the current project.
• Infrasound is a less likely cause for complaints, but will definitely be investigated. It is not unreasonable that infrasound could be detected through the vestibular system, be more of an issue for those with hearing disorders, and may be related to natural sway frequencies of people. This would be similar to seasickness.
4

• Human response testing was the most widely topic discussed at the meeting. The general consensus was that study participants should not link the study to wind turbine noise. A variety of measurements of participants will be collected during testing including sensing thresholds, body sway/rhythm, and potentially other body movement tracking. The generated noise stimuli for human response will include amplitude modulation, infrasound, masked and unmasked.
• A citizens group concerned about wind turbine noise is in contact with Minnesota state agencies and they are aware of project. State of Minnesota agencies may host a separate meeting to engage further in this issue.
• Major project deliverables of this project are guidelines for measuring/analyzing wind turbine noise and guidelines for human response. The latter deliverable is less clear and will focus on providing information to regulators and policy makers. The overall research goal is updating policy.
• TAP Meeting #2 will be scheduled for fall of 2016.
5
Deliverable 2: Summary of literature review
Wind Turbine Generated Noise Summary of Literature Review
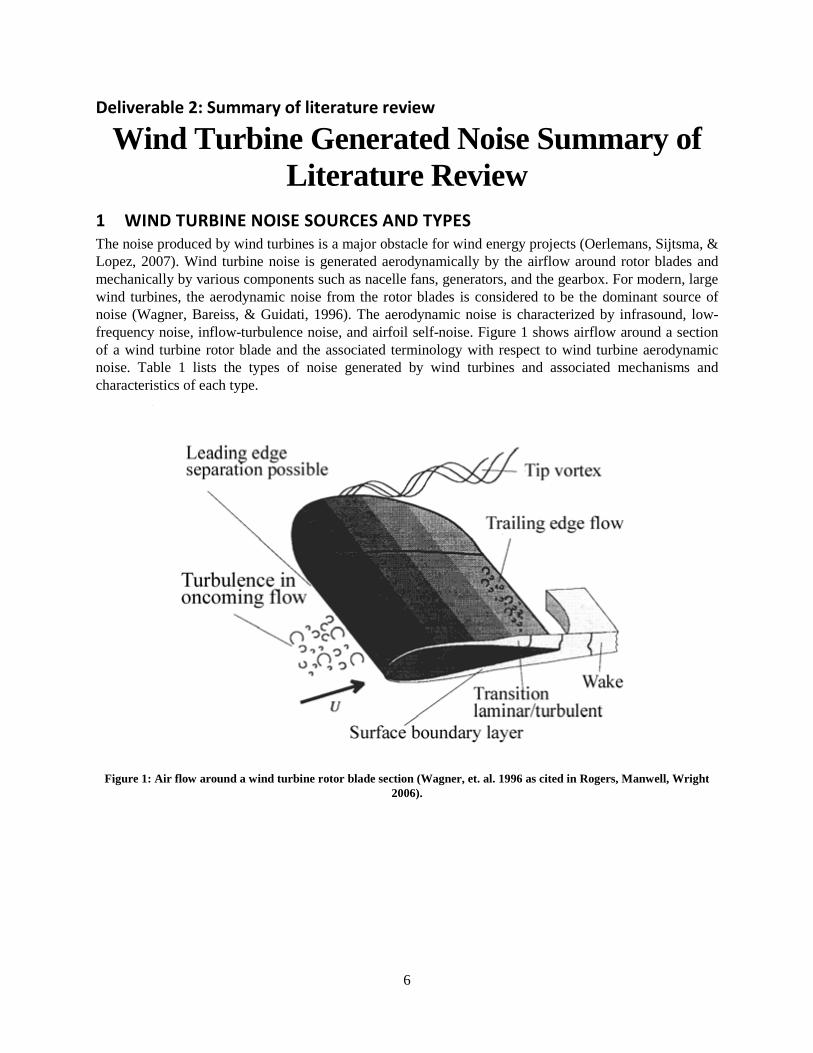
1 WIND TURBINE NOISE SOURCES AND TYPES The noise produced by wind turbines is a major obstacle for wind energy projects (Oerlemans, Sijtsma, & Lopez, 2007). Wind turbine noise is generated aerodynamically by the airflow around rotor blades and mechanically by various components such as nacelle fans, generators, and the gearbox. For modern, large wind turbines, the aerodynamic noise from the rotor blades is considered to be the dominant source of noise (Wagner, Bareiss, & Guidati, 1996). The aerodynamic noise is characterized by infrasound, low-frequency noise, inflow-turbulence noise, and airfoil self-noise. Figure 1 shows airflow around a section of a wind turbine rotor blade and the associated terminology with respect to wind turbine aerodynamic noise. Table 1 lists the types of noise generated by wind turbines and associated mechanisms and characteristics of each type.
Figure 1: Air flow around a wind turbine rotor blade section (Wagner, et. al. 1996 as cited in Rogers, Manwell, Wright
2006).
6
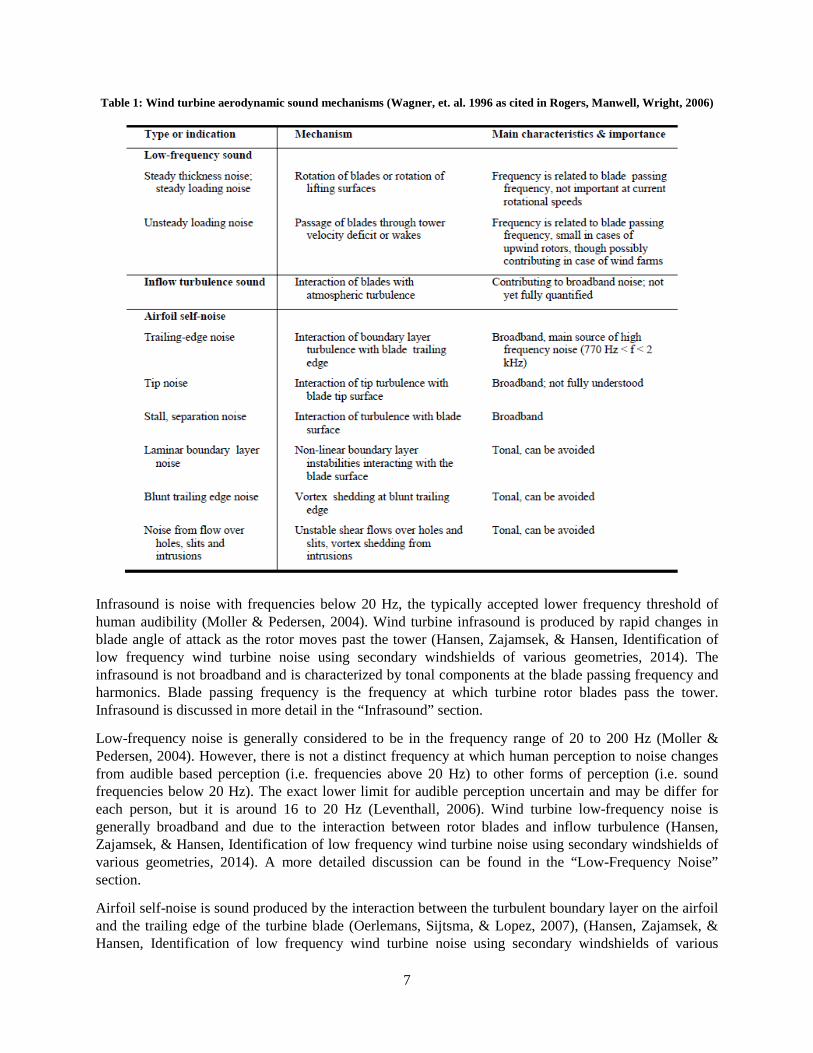
Table 1: Wind turbine aerodynamic sound mechanisms (Wagner, et. al. 1996 as cited in Rogers, Manwell, Wright, 2006)
Infrasound is noise with frequencies below 20 Hz, the typically accepted lower frequency threshold of human audibility (Moller & Pedersen, 2004). Wind turbine infrasound is produced by rapid changes in blade angle of attack as the rotor moves past the tower (Hansen, Zajamsek, & Hansen, Identification of low frequency wind turbine noise using secondary windshields of various geometries, 2014). The infrasound is not broadband and is characterized by tonal components at the blade passing frequency and harmonics. Blade passing frequency is the frequency at which turbine rotor blades pass the tower. Infrasound is discussed in more detail in the “Infrasound” section.
Low-frequency noise is generally considered to be in the frequency range of 20 to 200 Hz (Moller & Pedersen, 2004). However, there is not a distinct frequency at which human perception to noise changes from audible based perception (i.e. frequencies above 20 Hz) to other forms of perception (i.e. sound frequencies below 20 Hz). The exact lower limit for audible perception uncertain and may be differ for each person, but it is around 16 to 20 Hz (Leventhall, 2006). Wind turbine low-frequency noise is generally broadband and due to the interaction between rotor blades and inflow turbulence (Hansen, Zajamsek, & Hansen, Identification of low frequency wind turbine noise using secondary windshields of various geometries, 2014). A more detailed discussion can be found in the “Low-Frequency Noise” section.
Airfoil self-noise is sound produced by the interaction between the turbulent boundary layer on the airfoil and the trailing edge of the turbine blade (Oerlemans, Sijtsma, & Lopez, 2007), (Hansen, Zajamsek, & Hansen, Identification of low frequency wind turbine noise using secondary windshields of various
7
geometries, 2014). This noise source is commonly referred to as trailing edge noise. Trailing edge noise is generally considered to be the dominant noise source at higher frequencies, from 400 to 1000 Hz, and is broadband in nature (Hansen, Zajamsek, & Hansen, Identification of low frequency wind turbine noise using secondary windshields of various geometries, 2014).
Wind turbines produce aerodynamic noise with sound levels fluctuating periodically at the blade passing frequency depending on observer orientation and distance from the turbine(s). This cyclic noise has been termed amplitude modulation (AM) and is due to the directivity of the noise source as well as convective amplification (Oerlemans, Sijtsma, & Lopez, 2007). This type of AM is referred to as normal amplitude modulation or NAM and is predominantly a near-field effect (Cand, Bullmore, Smith, Von-Hunerbein, & Davis, 2012). Amplitude modulation is described in more detail in the section “Amplitude Modulation.”
In addition to amplitude modulation, wind turbine noise is known to have rapidly changing (impulsive) sound levels. These that are possibly due to turbulent inflow noise changes due to gusts of wind, dynamic blade stall noise due to unsteady flow, blade vortex interaction noise, interference patterns from multiple turbines, atmospheric refraction and frequency dependent attenuation, and the interaction between blades and airflow around the tower (Laratro, Arjomandi, Kelso, & Cazzolato, 2014).
Background noise has a large influence on the ability to hear an operating wind turbine. If the background noise is at the same or greater noise level than the wind turbine, the turbine noise may be lost and indiscernible. Wind turbine noise depends on the wind speed in the rotor swept area, whereas background noise depends on wind speed near the ground at the observer’s location. Increasing wind speed causes the background noise to increase rapidly; however, wind turbine noise increases at a slower rate with wind speed (Rogers, Manwell, & Wright, 2006). This commonly causes turbine noise to be more of a problem at lower wind speeds or high levels of wind shear.
2 PROPAGATION AND DIRECTIVITY The level of wind turbine noise at a given observer location is affected by the propagation and directivity of the noise. Wind turbine noise has directivity, which is noise level varying with the direction of the observer with respect to the turbine orientation. Directivity can be quantified by a directivity index in decibels or a dimensionless value Q (Friman, 2011). A method for calculating the directivity index is outlined in IEC 61400-11. Cross wind sound levels are lower than upwind and downwind levels (Friman, 2011), (Okada, Yoshihisa, Higashi, & Nishimura, 2015). The sound level difference due to directivity is also dependent on noise frequency.
Propagation describes how noise is attenuated over distance, and is a second factor that influences how perceptible wind turbine noise is at a given location. Sound propagation is affected by noise source characteristics, air absorption, ground effects such as reflection and vegetation, obstructions and terrain, and weather conditions (Rogers, Manwell, & Wright, 2006). Assuming spherical propagation and an unobstructed path, sound will in general decrease by 6 dB for every doubling of distance (Rogers, Manwell, & Wright, 2006). Lower frequencies will attenuate less quickly than higher frequencies and thus propagate further (Vér & Beranek, 2006).
Temperature and wind also affect the way sound propagates. (Larsson & Ohlund, Amplitude modulation of sound from wind turbines under various meteorological conditions, 2014). If temperatures are higher at ground level, common during daylight hours, sound waves curve upward. If there is a temperature inversion, i.e. lower temperatures at ground level which is common at night, the sound is refracted downward and repeatedly reflects off the ground as it propagates. This is visually represented in Figure 2. Theses refractions of sound will create shadow zones (RSG et al, 2016). Shadow zones are areas where
8
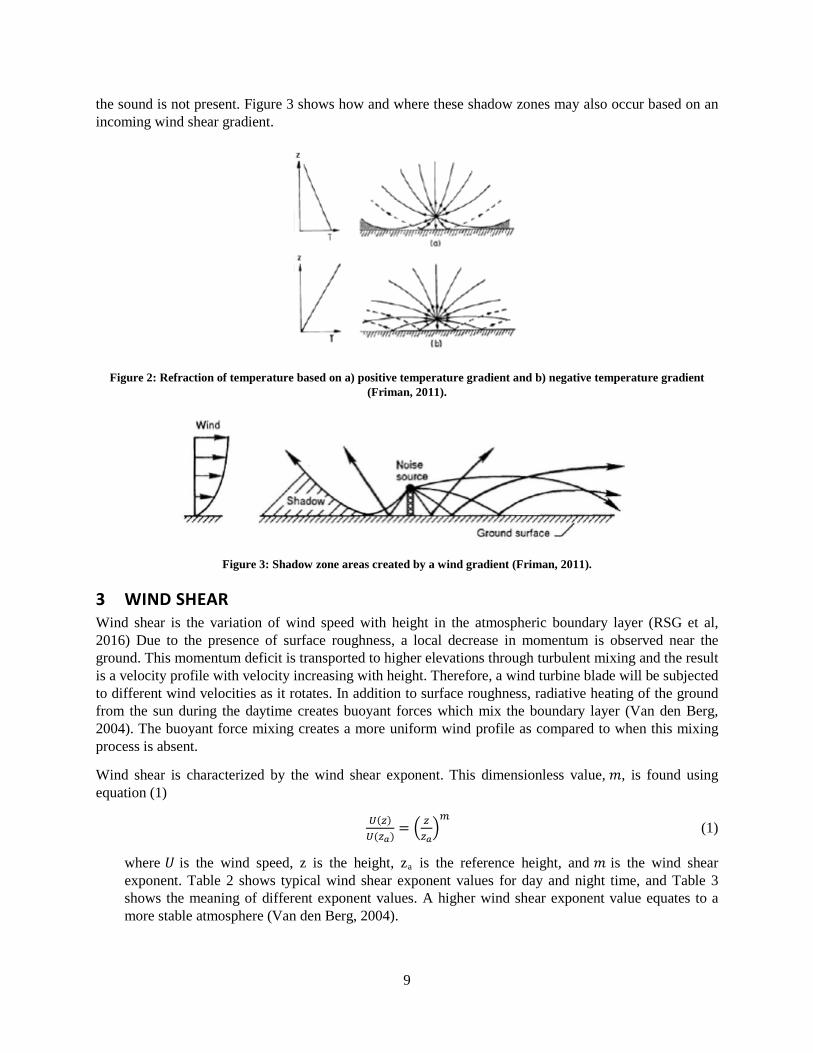
the sound is not present. Figure 3 shows how and where these shadow zones may also occur based on an incoming wind shear gradient.
Figure 2: Refraction of temperature based on a) positive temperature gradient and b) negative temperature gradient
(Friman, 2011).
Figure 3: Shadow zone areas created by a wind gradient (Friman, 2011).
3 WIND SHEAR Wind shear is the variation of wind speed with height in the atmospheric boundary layer (RSG et al, 2016) Due to the presence of surface roughness, a local decrease in momentum is observed near the ground. This momentum deficit is transported to higher elevations through turbulent mixing and the result is a velocity profile with velocity increasing with height. Therefore, a wind turbine blade will be subjected to different wind velocities as it rotates. In addition to surface roughness, radiative heating of the ground from the sun during the daytime creates buoyant forces which mix the boundary layer (Van den Berg, 2004). The buoyant force mixing creates a more uniform wind profile as compared to when this mixing process is absent.
Wind shear is characterized by the wind shear exponent. This dimensionless value, 𝑚𝑚, is found using equation (1)
𝑈𝑈(𝑧𝑧)𝑈𝑈(𝑧𝑧𝑎𝑎)
= � 𝑧𝑧𝑧𝑧𝑎𝑎�𝑚𝑚
(1)
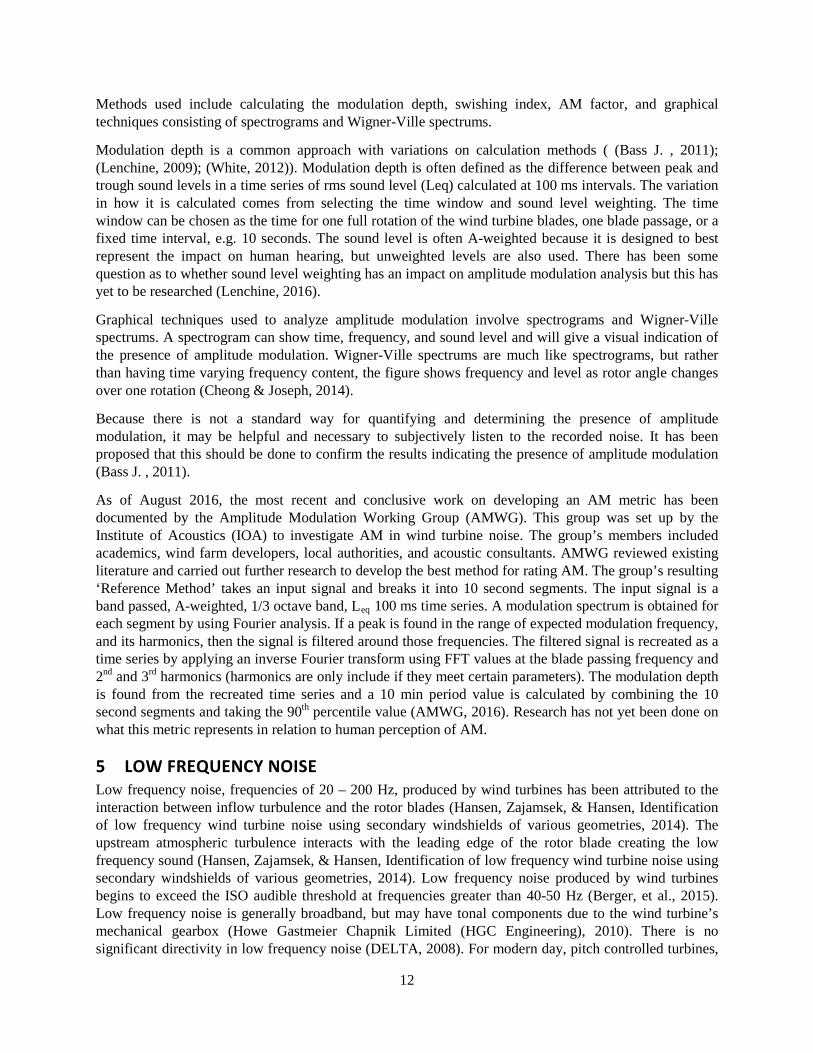
where 𝑈𝑈 is the wind speed, z is the height, za is the reference height, and 𝑚𝑚 is the wind shear exponent. Table 2 shows typical wind shear exponent values for day and night time, and Table 3 shows the meaning of different exponent values. A higher wind shear exponent value equates to a more stable atmosphere (Van den Berg, 2004).
9
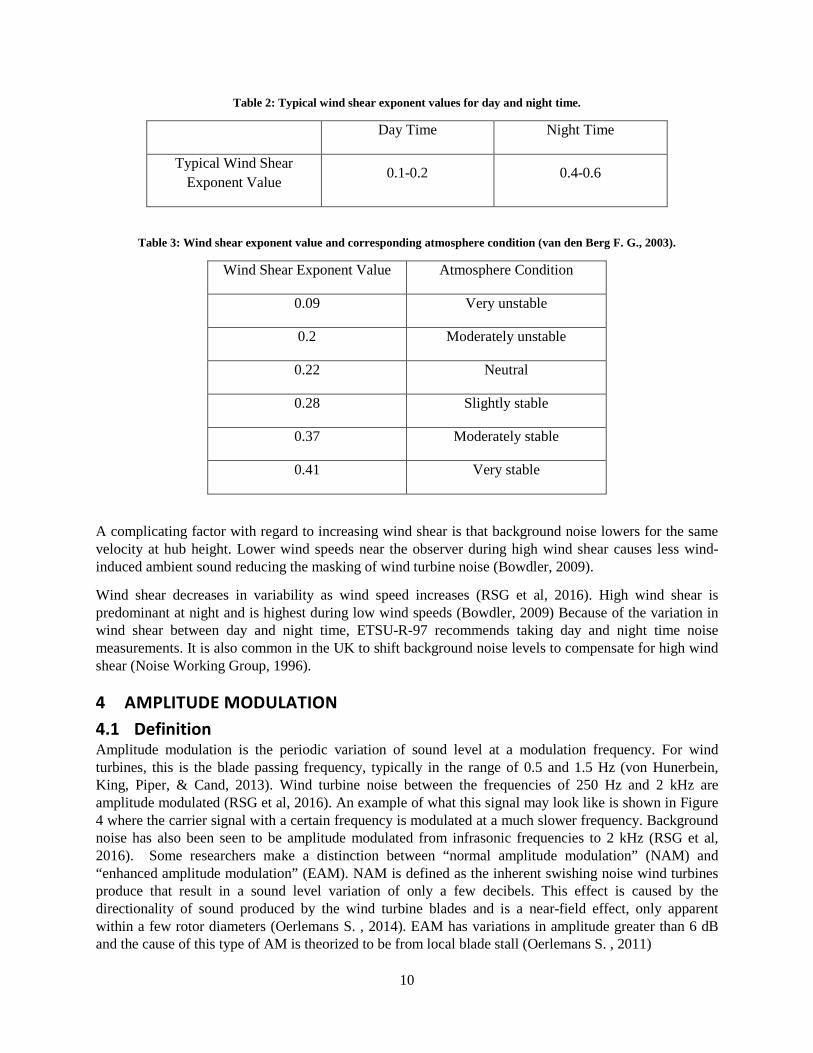
Table 2: Typical wind shear exponent values for day and night time.
Day Time Night Time
Typical Wind Shear Exponent Value 0.1-0.2 0.4-0.6
Table 3: Wind shear exponent value and corresponding atmosphere condition (van den Berg F. G., 2003).
Wind Shear Exponent Value Atmosphere Condition
0.09 Very unstable
0.2 Moderately unstable
0.22 Neutral
0.28 Slightly stable
0.37 Moderately stable
0.41 Very stable
A complicating factor with regard to increasing wind shear is that background noise lowers for the same velocity at hub height. Lower wind speeds near the observer during high wind shear causes less wind-induced ambient sound reducing the masking of wind turbine noise (Bowdler, 2009).
Wind shear decreases in variability as wind speed increases (RSG et al, 2016). High wind shear is predominant at night and is highest during low wind speeds (Bowdler, 2009) Because of the variation in wind shear between day and night time, ETSU-R-97 recommends taking day and night time noise measurements. It is also common in the UK to shift background noise levels to compensate for high wind shear (Noise Working Group, 1996).
4 AMPLITUDE MODULATION 4.1 Definition Amplitude modulation is the periodic variation of sound level at a modulation frequency. For wind turbines, this is the blade passing frequency, typically in the range of 0.5 and 1.5 Hz (von Hunerbein, King, Piper, & Cand, 2013). Wind turbine noise between the frequencies of 250 Hz and 2 kHz are amplitude modulated (RSG et al, 2016). An example of what this signal may look like is shown in Figure 4 where the carrier signal with a certain frequency is modulated at a much slower frequency. Background noise has also been seen to be amplitude modulated from infrasonic frequencies to 2 kHz (RSG et al, 2016). Some researchers make a distinction between “normal amplitude modulation” (NAM) and “enhanced amplitude modulation” (EAM). NAM is defined as the inherent swishing noise wind turbines produce that result in a sound level variation of only a few decibels. This effect is caused by the directionality of sound produced by the wind turbine blades and is a near-field effect, only apparent within a few rotor diameters (Oerlemans S. , 2014). EAM has variations in amplitude greater than 6 dB and the cause of this type of AM is theorized to be from local blade stall (Oerlemans S. , 2011)
10
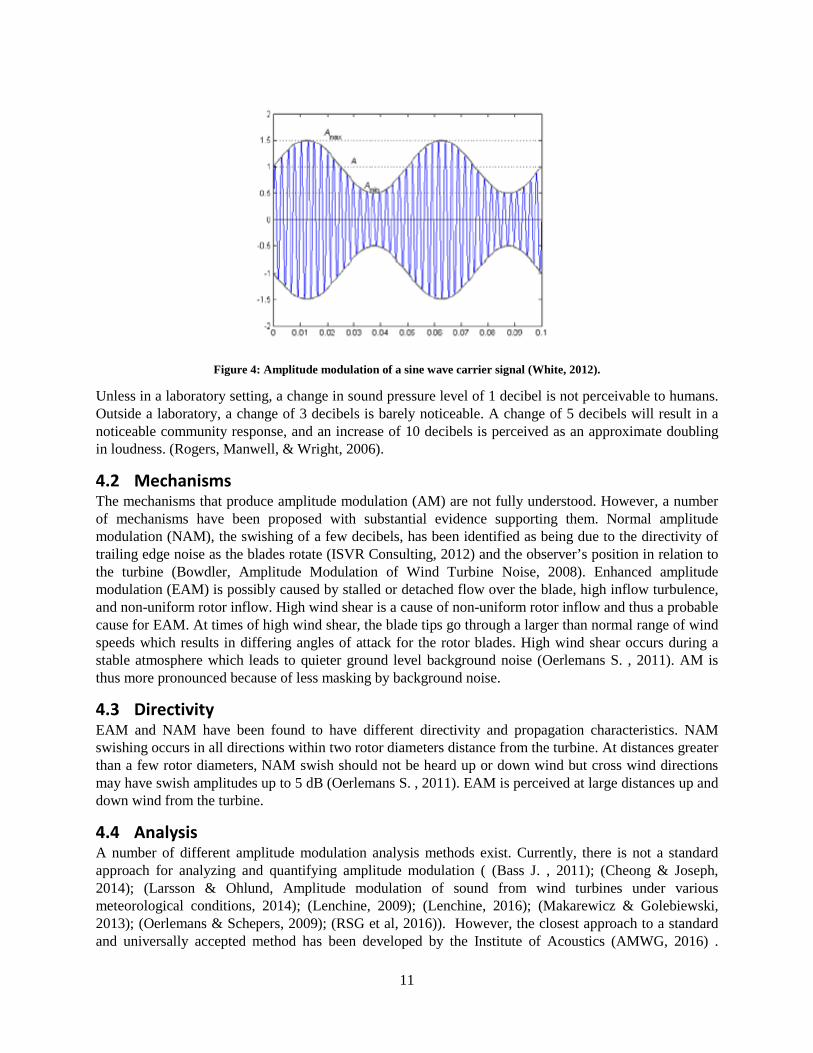
Figure 4: Amplitude modulation of a sine wave carrier signal (White, 2012).
Unless in a laboratory setting, a change in sound pressure level of 1 decibel is not perceivable to humans. Outside a laboratory, a change of 3 decibels is barely noticeable. A change of 5 decibels will result in a noticeable community response, and an increase of 10 decibels is perceived as an approximate doubling in loudness. (Rogers, Manwell, & Wright, 2006).
4.2 Mechanisms The mechanisms that produce amplitude modulation (AM) are not fully understood. However, a number of mechanisms have been proposed with substantial evidence supporting them. Normal amplitude modulation (NAM), the swishing of a few decibels, has been identified as being due to the directivity of trailing edge noise as the blades rotate (ISVR Consulting, 2012) and the observer’s position in relation to the turbine (Bowdler, Amplitude Modulation of Wind Turbine Noise, 2008). Enhanced amplitude modulation (EAM) is possibly caused by stalled or detached flow over the blade, high inflow turbulence, and non-uniform rotor inflow. High wind shear is a cause of non-uniform rotor inflow and thus a probable cause for EAM. At times of high wind shear, the blade tips go through a larger than normal range of wind speeds which results in differing angles of attack for the rotor blades. High wind shear occurs during a stable atmosphere which leads to quieter ground level background noise (Oerlemans S. , 2011). AM is thus more pronounced because of less masking by background noise.
4.3 Directivity EAM and NAM have been found to have different directivity and propagation characteristics. NAM swishing occurs in all directions within two rotor diameters distance from the turbine. At distances greater than a few rotor diameters, NAM swish should not be heard up or down wind but cross wind directions may have swish amplitudes up to 5 dB (Oerlemans S. , 2011). EAM is perceived at large distances up and down wind from the turbine.
4.4 Analysis A number of different amplitude modulation analysis methods exist. Currently, there is not a standard approach for analyzing and quantifying amplitude modulation ( (Bass J. , 2011); (Cheong & Joseph, 2014); (Larsson & Ohlund, Amplitude modulation of sound from wind turbines under various meteorological conditions, 2014); (Lenchine, 2009); (Lenchine, 2016); (Makarewicz & Golebiewski, 2013); (Oerlemans & Schepers, 2009); (RSG et al, 2016)). However, the closest approach to a standard and universally accepted method has been developed by the Institute of Acoustics (AMWG, 2016) .
11
Methods used include calculating the modulation depth, swishing index, AM factor, and graphical techniques consisting of spectrograms and Wigner-Ville spectrums.
Modulation depth is a common approach with variations on calculation methods ( (Bass J. , 2011); (Lenchine, 2009); (White, 2012)). Modulation depth is often defined as the difference between peak and trough sound levels in a time series of rms sound level (Leq) calculated at 100 ms intervals. The variation in how it is calculated comes from selecting the time window and sound level weighting. The time window can be chosen as the time for one full rotation of the wind turbine blades, one blade passage, or a fixed time interval, e.g. 10 seconds. The sound level is often A-weighted because it is designed to best represent the impact on human hearing, but unweighted levels are also used. There has been some question as to whether sound level weighting has an impact on amplitude modulation analysis but this has yet to be researched (Lenchine, 2016).
Graphical techniques used to analyze amplitude modulation involve spectrograms and Wigner-Ville spectrums. A spectrogram can show time, frequency, and sound level and will give a visual indication of the presence of amplitude modulation. Wigner-Ville spectrums are much like spectrograms, but rather than having time varying frequency content, the figure shows frequency and level as rotor angle changes over one rotation (Cheong & Joseph, 2014).
Because there is not a standard way for quantifying and determining the presence of amplitude modulation, it may be helpful and necessary to subjectively listen to the recorded noise. It has been proposed that this should be done to confirm the results indicating the presence of amplitude modulation (Bass J. , 2011).
As of August 2016, the most recent and conclusive work on developing an AM metric has been documented by the Amplitude Modulation Working Group (AMWG). This group was set up by the Institute of Acoustics (IOA) to investigate AM in wind turbine noise. The group’s members included academics, wind farm developers, local authorities, and acoustic consultants. AMWG reviewed existing literature and carried out further research to develop the best method for rating AM. The group’s resulting ‘Reference Method’ takes an input signal and breaks it into 10 second segments. The input signal is a band passed, A-weighted, 1/3 octave band, Leq 100 ms time series. A modulation spectrum is obtained for each segment by using Fourier analysis. If a peak is found in the range of expected modulation frequency, and its harmonics, then the signal is filtered around those frequencies. The filtered signal is recreated as a time series by applying an inverse Fourier transform using FFT values at the blade passing frequency and 2nd and 3rd harmonics (harmonics are only include if they meet certain parameters). The modulation depth is found from the recreated time series and a 10 min period value is calculated by combining the 10 second segments and taking the 90th percentile value (AMWG, 2016). Research has not yet been done on what this metric represents in relation to human perception of AM.
5 LOW FREQUENCY NOISE Low frequency noise, frequencies of 20 – 200 Hz, produced by wind turbines has been attributed to the interaction between inflow turbulence and the rotor blades (Hansen, Zajamsek, & Hansen, Identification of low frequency wind turbine noise using secondary windshields of various geometries, 2014). The upstream atmospheric turbulence interacts with the leading edge of the rotor blade creating the low frequency sound (Hansen, Zajamsek, & Hansen, Identification of low frequency wind turbine noise using secondary windshields of various geometries, 2014). Low frequency noise produced by wind turbines begins to exceed the ISO audible threshold at frequencies greater than 40-50 Hz (Berger, et al., 2015). Low frequency noise is generally broadband, but may have tonal components due to the wind turbine’s mechanical gearbox (Howe Gastmeier Chapnik Limited (HGC Engineering), 2010). There is no significant directivity in low frequency noise (DELTA, 2008). For modern day, pitch controlled turbines,
12
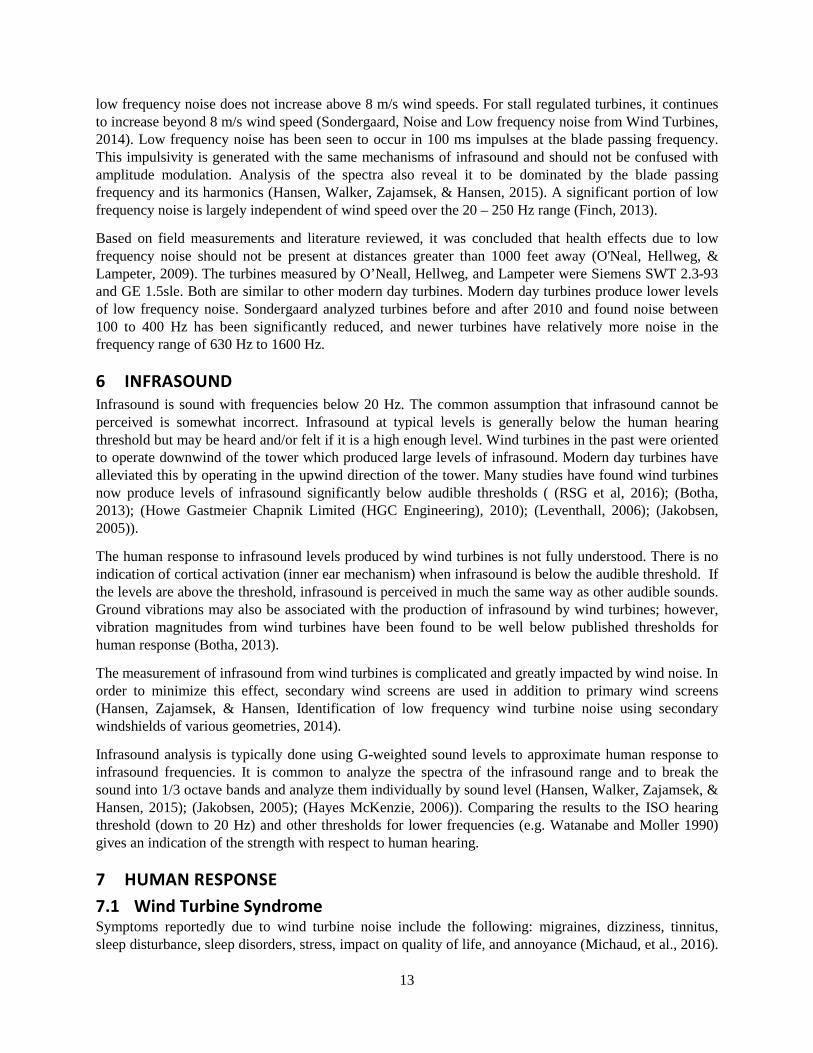
low frequency noise does not increase above 8 m/s wind speeds. For stall regulated turbines, it continues to increase beyond 8 m/s wind speed (Sondergaard, Noise and Low frequency noise from Wind Turbines, 2014). Low frequency noise has been seen to occur in 100 ms impulses at the blade passing frequency. This impulsivity is generated with the same mechanisms of infrasound and should not be confused with amplitude modulation. Analysis of the spectra also reveal it to be dominated by the blade passing frequency and its harmonics (Hansen, Walker, Zajamsek, & Hansen, 2015). A significant portion of low frequency noise is largely independent of wind speed over the 20 – 250 Hz range (Finch, 2013).
Based on field measurements and literature reviewed, it was concluded that health effects due to low frequency noise should not be present at distances greater than 1000 feet away (O'Neal, Hellweg, & Lampeter, 2009). The turbines measured by O’Neall, Hellweg, and Lampeter were Siemens SWT 2.3-93 and GE 1.5sle. Both are similar to other modern day turbines. Modern day turbines produce lower levels of low frequency noise. Sondergaard analyzed turbines before and after 2010 and found noise between 100 to 400 Hz has been significantly reduced, and newer turbines have relatively more noise in the frequency range of 630 Hz to 1600 Hz.
6 INFRASOUND Infrasound is sound with frequencies below 20 Hz. The common assumption that infrasound cannot be perceived is somewhat incorrect. Infrasound at typical levels is generally below the human hearing threshold but may be heard and/or felt if it is a high enough level. Wind turbines in the past were oriented to operate downwind of the tower which produced large levels of infrasound. Modern day turbines have alleviated this by operating in the upwind direction of the tower. Many studies have found wind turbines now produce levels of infrasound significantly below audible thresholds ( (RSG et al, 2016); (Botha, 2013); (Howe Gastmeier Chapnik Limited (HGC Engineering), 2010); (Leventhall, 2006); (Jakobsen, 2005)).
The human response to infrasound levels produced by wind turbines is not fully understood. There is no indication of cortical activation (inner ear mechanism) when infrasound is below the audible threshold. If the levels are above the threshold, infrasound is perceived in much the same way as other audible sounds. Ground vibrations may also be associated with the production of infrasound by wind turbines; however, vibration magnitudes from wind turbines have been found to be well below published thresholds for human response (Botha, 2013).
The measurement of infrasound from wind turbines is complicated and greatly impacted by wind noise. In order to minimize this effect, secondary wind screens are used in addition to primary wind screens (Hansen, Zajamsek, & Hansen, Identification of low frequency wind turbine noise using secondary windshields of various geometries, 2014).
Infrasound analysis is typically done using G-weighted sound levels to approximate human response to infrasound frequencies. It is common to analyze the spectra of the infrasound range and to break the sound into 1/3 octave bands and analyze them individually by sound level (Hansen, Walker, Zajamsek, & Hansen, 2015); (Jakobsen, 2005); (Hayes McKenzie, 2006)). Comparing the results to the ISO hearing threshold (down to 20 Hz) and other thresholds for lower frequencies (e.g. Watanabe and Moller 1990) gives an indication of the strength with respect to human hearing.
7 HUMAN RESPONSE 7.1 Wind Turbine Syndrome Symptoms reportedly due to wind turbine noise include the following: migraines, dizziness, tinnitus, sleep disturbance, sleep disorders, stress, impact on quality of life, and annoyance (Michaud, et al., 2016).
13
This group of symptoms has been termed “wind turbine syndrome” (Pierpont, 2009). Symptoms are often self-reported and lacking evidence from epidemiological studies to support the claims about health effects other than annoyance (Michaud, et al., 2016). The relationship between self-reported sleep disruption and turbine noise has been found to be statistically significant (Bolin, Bluhm, Eriksson, & Nilsson, 2011). It is important to note that annoyance has the possibility of inducing unwanted health effects. Annoyance due to wind turbines has been linked to not only the noise produced, but also the visual aspect of them. In fact, evidence shows that the visual intrusion is more strongly related to annoyance than the noise produced (Knopper, et al., 2014). This find was supported when a survey of 1238 people found participants reporting ‘highly annoyed’ by visual aspects of the wind turbine more than any other feature, even at higher noise levels. Annoyance was also found to be higher outdoors, during the summer, and at evening and nighttime (Michaud, et al., 2016). Another factor in annoyance is whether or not the nearby resident is benefiting economically. Annoyance decreases with economic benefit (Knopper, et al., 2014).
As with any noise source, it is expected that a certain percentage of the population will be annoyed. Health Canada proposed a 45 dBA limit at resident’s based on a target limit of only 6.5% of people being highly annoyed (Howe Gastmeier Chapnik Limited (HGC Engineering), 2010). They also found a correlation between seeing a turbine and annoyance from it. Few studies have investigated the percentage of complaints surrounding wind farms. One study looked at the complaint rate for residents living within 610 m from the perimeter of a wind farm for 5 mid-western United States locations. The complaint rate among residents was found to be 4% (Hessler & Hessler, 2011). This is a similar rate to one in Northern England where 5% of households within 1000m of a wind turbine complained about noise (Jakobsen, 2005). A Canadian report looking into noise complaints at wind farms in Alberta, Canada found the time during construction of the wind farm was more common for complaints to occur. They also found wind power receives fewer complaints than other power generation methods such as gas and oil (Thibault, 2013).
7.2 Response to Amplitude Modulation Few experiments have investigated the effect amplitude modulation of wind turbine noise on annoyance and health. In a test of 30 subjects between 20 – 30 years old with normal hearing, annoyance was found to increase with not only the overall A-weighted sound level but also modulation depth (Lee, Kim, Choi, & Lee, 2011). Amplitude modulation is the main reported cause for annoyance (Bolin, Bluhm, Eriksson, & Nilsson, 2011).
7.3 Response to Low Frequency and Infrasound Scientific evidence shows current low frequency and infrasound sound levels produced by wind turbines do not directly impact human health. (Howe Gastmeier Chapnik Limited (HGC Engineering), 2010). If low frequency noise and/or infrasound is modulated, subjects have been seen to not be able to relax (Inagaki, Li, & Nishi, 2015), indicating a disturbance. Infrasound near wind turbines does not exceed hearing thresholds (McCunney, et al., 2014), but there has been concern over the potential perception of it even when it is occurring at a level below the audible threshold. A chest resonance vibration may occur between 50 to 80 Hz when levels are above 80 dB (Leventhall, 2006). Other non-audible perceptions of low frequency and infrasound noises occur at levels above the hearing threshold. These responses include ‘soft vibrations’ of the lumbar, buttocks, thigh and calf areas, as well as a feeling of pressure in the upper chest and throat (Moller & Pedersen, 2004). There is no indication of cortical activation (inner ear mechanism) when infrasound is below the audible threshold. If it is above the threshold, it is perceived in much the same way as other audible sounds (Berger, et al., 2015). Although the inner ear appears to not be stimulated by inaudible levels, Outer Hair Cells (OHC) can be, which may cause unfamiliar sensations (Salt & Hullar, 2010). A-weighting is commonly used because it is scaled to reflect human hearing;
14
however, there is some concern as this may underestimate the lower frequency noise (Salt & Hullar, 2010).
7.4 Hearing Thresholds ISO 226:2003. Hearing thresholds are based on average values. The standard deviation for hearing thresholds at low frequencies is 5 to 6 dB (Howe Gastmeier Chapnik Limited (HGC Engineering), 2010). Watanabe and Moller (1990) came up with a modified hearing threshold that is commonly used. They determined the hearing threshold for noise down to 4 Hz, thus extending the ISO threshold, which goes down to 20 Hz (Watanabe & Moller, 1990). The standard hearing thresholds cover a majority of the population, but some may be less or more sensitive. Threshold measurements have been made as low as 4 Hz in an acoustic chamber and 1.5 Hz using headphones (Leventhall, 2007).
8 WIND TURBINE NOISE MEASUREMENT INSTRUMENTATION Instrumentation for wind turbine noise may vary depending on the purpose for recording. Sound level meters are commonly used, often in monitoring applications. These devices do much of the initial data processing required and output commonly used readable values such as A-weighted 1/3 octave band sound pressure levels. Microphones are also used in combination with a windscreen. A primary wind screen is used to reduce wind noise and a secondary wind screen is used in addition to allow for more accurate low frequency and infrasound recording (Novak, Sjostrom, Ule, Bard, & Sandberg, 2014). The International Electrotechnical Commission (IEC) specifies two classes of sound level meters. Class 1 is used in research and law enforcement applications because it has a wider frequency range and tighter tolerance than the lower cost Class 2 option.
9 STANDARDS AND REGULATIONS There is an international standard for measuring sound power level for utility scale turbines. Noise level regulation in the United States varies depending on the local governing agency. Not all areas have regulations for wind turbine noise. Some countries in Europe have established national wind turbine noise guidelines. These guidelines often use the required measurements in IEC 61400.
The International Electrotechnical Commission IEC 61400-11 Standard: Wind turbine generator systems Part 11: Acoustic noise measurement techniques are the internationally accepted standard for measuring noise from utility scale wind turbines (International Electrotechnical Commission, 2012). This ensures noise measurements are consistent and able to be compared to one another. This standard specifies the instrumentation to be used for sound and wind measurements, locations and measurements to be made, and data reporting requirements. Measurements of broadband sound, 1/3 octave band levels, and tonality are required. The standard also outlines optional measurements to be taken. These include directivity, infrasound, low frequency noise, and impulsivity.
ETSU-R-97 is another popular document for the basis for many regulations. The document outlines a framework for measuring wind turbine noise as well as suggested noise limits for communities (Noise Working Group, 1996). They specify that noise levels should be relative to background noise except for low noise environments. For both day and night time, the turbine noise should not exceed 5 dbA above the background noise. In low noise environments, the day and night time limits will be different. For daytime, the LA90, 10 minute level should be limited to 35-40 dBA depending on number of homes nearby and the duration of the noise. The night time limit for wind turbine noise is 43 dBA.
Minnesota has different noise limits depending on the area's classification (Jarret Smith, Claflin, & Kuskie, 2015). There are three different classifications. Noise Area Classification (NAC) 1 includes areas such as residential housing, camping, and hotel areas. NAC 2 includes retail, public transit, and
15
recreational activity areas. NAC 3 includes manufacturing plants, amusement parks, and agricultural activities. NAC 1 has the most strict noise limits and NAC 3 has the least strict. The following table outlines Minnesota's noise limits based on NAC.
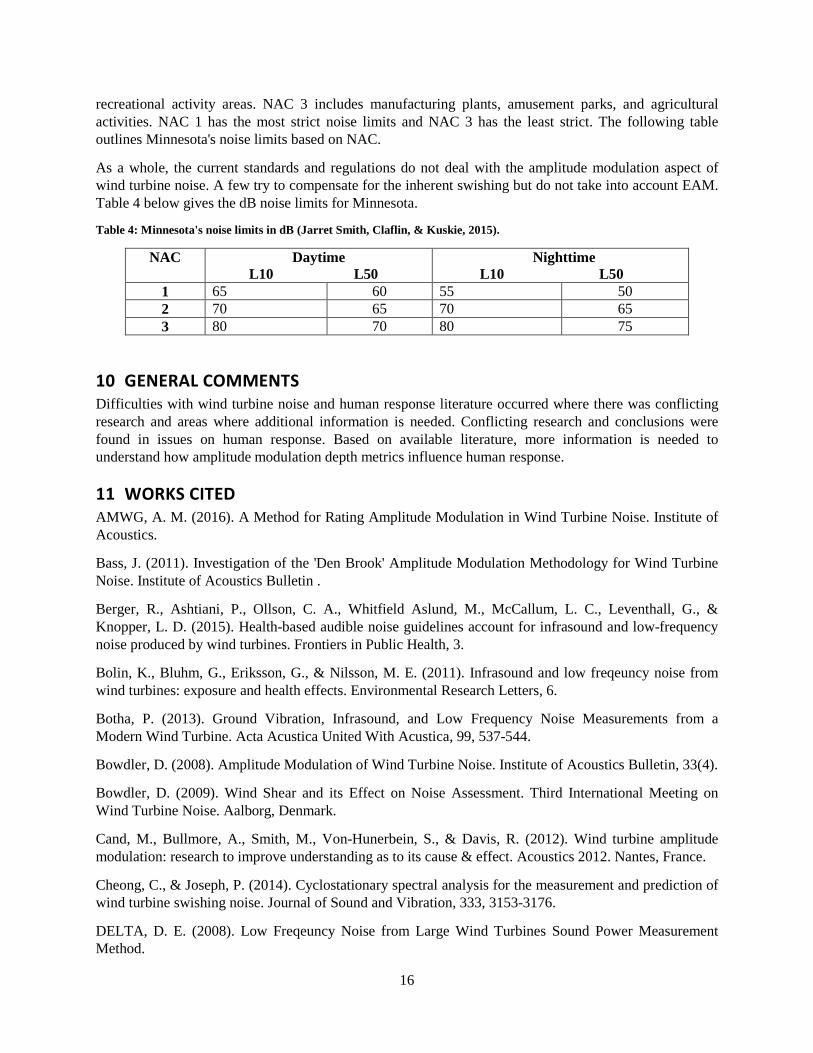
As a whole, the current standards and regulations do not deal with the amplitude modulation aspect of wind turbine noise. A few try to compensate for the inherent swishing but do not take into account EAM. Table 4 below gives the dB noise limits for Minnesota.
Table 4: Minnesota's noise limits in dB (Jarret Smith, Claflin, & Kuskie, 2015).
NAC Daytime L10 L50
Nighttime L10 L50
1 65 60 55 50 2 70 65 70 65 3 80 70 80 75
10 GENERAL COMMENTS Difficulties with wind turbine noise and human response literature occurred where there was conflicting research and areas where additional information is needed. Conflicting research and conclusions were found in issues on human response. Based on available literature, more information is needed to understand how amplitude modulation depth metrics influence human response.
11 WORKS CITED AMWG, A. M. (2016). A Method for Rating Amplitude Modulation in Wind Turbine Noise. Institute of Acoustics.
Bass, J. (2011). Investigation of the 'Den Brook' Amplitude Modulation Methodology for Wind Turbine Noise. Institute of Acoustics Bulletin .
Berger, R., Ashtiani, P., Ollson, C. A., Whitfield Aslund, M., McCallum, L. C., Leventhall, G., & Knopper, L. D. (2015). Health-based audible noise guidelines account for infrasound and low-frequency noise produced by wind turbines. Frontiers in Public Health, 3.
Bolin, K., Bluhm, G., Eriksson, G., & Nilsson, M. E. (2011). Infrasound and low freqeuncy noise from wind turbines: exposure and health effects. Environmental Research Letters, 6.
Botha, P. (2013). Ground Vibration, Infrasound, and Low Frequency Noise Measurements from a Modern Wind Turbine. Acta Acustica United With Acustica, 99, 537-544.
Bowdler, D. (2008). Amplitude Modulation of Wind Turbine Noise. Institute of Acoustics Bulletin, 33(4).
Bowdler, D. (2009). Wind Shear and its Effect on Noise Assessment. Third International Meeting on Wind Turbine Noise. Aalborg, Denmark.
Cand, M., Bullmore, A., Smith, M., Von-Hunerbein, S., & Davis, R. (2012). Wind turbine amplitude modulation: research to improve understanding as to its cause & effect. Acoustics 2012. Nantes, France.
Cheong, C., & Joseph, P. (2014). Cyclostationary spectral analysis for the measurement and prediction of wind turbine swishing noise. Journal of Sound and Vibration, 333, 3153-3176.
DELTA, D. E. (2008). Low Freqeuncy Noise from Large Wind Turbines Sound Power Measurement Method.
16
Finch, J. (2013). Characterization and Impact of Low Frequency Wind Turbine Noise Emmissions.
Friman, M. (2011). Directivity of sound from wind turbines. KTH , Department of Aeronautical and Vehicle Engineering. Stockholm: The Marcus Wallenberg Laboratory for Sound and Vibration Research.
Hansen, K., Walker, B., Zajamsek, B., & Hansen, C. (2015). Perception and annoyance of low frequency noise versus infrasound in the context of wind turbine noise. Sixth International Meeting on Wind Turbine Noise. Glasgow.
Hansen, K., Zajamsek, B., & Hansen, C. (2014). Identification of low frequency wind turbine noise using secondary windshields of various geometries. Noise Control Engineering Journal.
Hayes McKenzie. (2006). The Measurement of Low Frequency Noise at Three UK Wind Farms. Department of Trade & Industry.
Hessler, D., & Hessler, G. (2011). Recommended noise level design goals and limits at residential receptors for wind turbine developments in the United States. Noise Control Engineering, 59, 94-104.
Howe Gastmeier Chapnik Limited (HGC Engineering). (2010). Low Frequency Noise and Infrasound Associated with Wind Turbine Generator Systems A Literature Review. Toronto: Ontario Ministry of the Environment.
Inagaki, T., Li, Y., & Nishi, Y. (2015). Analysis of aerodynamic sound noise generated by a large-scaled wind turbine and its physiological evaluation. International Journal of Environmental Science and Technology, 1933-1944.
International Electrotechnical Commission. (2012). IEC 61400-11 Wind Turbine Generator Systems—Part 11: Acoustic Noise Measurement Techniques.
ISVR Consulting. (2012). Work Package A2 (WPA2) - Fundamental Research into Possible Causes of Amplitude Modulation. RenewableUK.
Jakobsen, J. (2005). Infrasound emission from wind turbines. Journal of Low Frequency Noise Vibration, 145-155.
Jarret Smith, A., Claflin, A., & Kuskie, M. (2015). A Guide to Noise Control in Minnesota. Saint Paul: Minnesota Pollution Control Agency.
Knopper, L. D., Ollson, C. A., McCallum, L. C., Whitfield Asulnd, M. L., Berger, R. G., Souweine, K., & McDaniel, M. (2014). Wind turbines and human health. Frontiers in Public Health, 2.
Laratro, A., Arjomandi, M., Kelso, R., & Cazzolato, B. (2014). A discussion of wind turbine interaction and stall contributions to wind farm noise. Journal of Wind Engineering and Industrial Aerodynamics, 127, 1-10.
Larsson, C., & Ohlund, O. (2014). Amplitude modulation of sound from wind turbines under various meteorological conditions. Journal of Acoustical Society of America, 135(1), 67-73.
Lee, S., Kim, K., Choi, W., & Lee, S. (2011). Annoyance caused by amplitude modulation of wind turbine noise. Noise Control Engineering Journal, 59(1), 39-46.
Lenchine, V. V. (2009). Amplitude modulation in wind turbine noise. Australian Acoustical Society Acoustics 2009: Research to Consulting. Adelaide, Australia.
17
Lenchine, V. V. (2016). Assessment of amplitude modulation in environmental noise measurements. Applied Acoustics, 104, 152-157.
Leventhall, G. (2006). Infrasound From Wind Turbines - Fact, Fiction or Deception. Canadian Acoustics, 34(2), 29-34.
Leventhall, G. (2007). What is infrasound? Progress in Biophysics and Molecular Biology, 93, 130-137.
Makarewicz, R., & Golebiewski, R. (2013). Amplitude modulation of wind turbine noise. Cornell University.
McCunney, R., Mundt, K., Colby, D., Dobie, R., Kaliski, K., & Blais, M. (2014). Wind Turbines and Health A Critical Review of the Scientific Literature. Journal of Occupational and Environmental Medicine, 56(11).
Michaud, D. S., Feder, K., Kieth, S. E., Voicescu, S. A., Marro, L., Than, J., . . . van den Berg, F. (2016). Exposure to wind turbine noise: Perceptual response and reported health effects. Journal of Accoustical Society of America, 139(3), 1443-1454.
Moller, H., & Pedersen, C. S. (2004). Hearing at low and infrasonic frequencies. Noise and Health, 6(23), 37-57.
Noise Working Group. (1996). ETSU-R-97 The Assessment & Rating of Noise from Wind Farms.
Novak, C., Sjostrom, A., Ule, H., Bard, D., & Sandberg, G. (2014). An investigation of Different Secondary Noise Wind Screen Designs for Wind Turbine Noise Applications. inter.noise. Melbourne, Australia.
Oerlemans, S. (2011). An explanation for enhanced modulation of wind turbine noise. RenewableUK.
Oerlemans, S. (2014). Effect of wind shear on amplitude modulation of wind turbine noise. International Journal of Aeroacoustics, 751-728.
Oerlemans, S., & Schepers, J. G. (2009). Prediction of wind turbine noise and validation against experiment. National Aerospace Laboratory NLR. RenewableUK.
Oerlemans, S., Sijtsma, P., & Lopez, B. M. (2007). Location and quantification of noise sources on a wind turbine. Journal of sound and vibration, 869-883.
Okada, Y., Yoshihisa, K., Higashi, K., & Nishimura, N. (2015). Radiation characteristics of noise generated from a wind turbine. Acoustics Science and Technology, 36(5), 419-427.
O'Neal, R. D., Hellweg, R. D., & Lampeter, R. M. (2009). A Study of Low Frequency Noise and Infrasound from Wind Turbines. Epsilon Associates, Inc.
Pierpont, N. (2009). Wind Turbine Syndrome: A Report on a Natural Experiment. K-Selected Books.
Rogers, A. L., Manwell, J. F., & Wright, S. (2006). Wind Turbine Acoustic Noise. Renewable Energy REsearch Laboratory Department of Mechanical and Industrial Engineering University of Massachusetts at Amherst.
RSG et al. (2016). Massachusetts Study on Wind Turbine Acoustics. Massachusetts Clean Energy Center and Massachusetts Department of Environmental Protection.
18
Salt, A. N., & Hullar, T. E. (2010). Responses of the ear to low frequency sounds, infrasound and wind turbines. Hearing Research.
Sondergaard, B. (2014). Noise and Low frequency noise from Wind Turbines. Inter-noise. Melbourne, Australia.
Thibault, B. (2013). Survey of Complaints Received by Relevant Authorities Regarding Operating Wind Energy in Alberta. Calgary, Alberta, Canada: Pembina Institute.
Van den Berg, G. P. (2004). Effects of the wind profile at night on wind turbine sound. Journal of sound and vibration, 955-970.
Vér, I. L., & Beranek, L. L. (2006). Noise and Vibration Control Engineering: Principles and Applications, Second Edition (2nd ed.). Hoboken, New Jersey: John Wiley & Sons.
von Hunerbein, S., King, A., Piper, B., & Cand, M. (2013). Wind Turbine Amplitude Modulation: Research to Improve Understanding as to its cause & Effect. Acoustics Research Centre, University of Salford. Renewable UK.
Wagner, S., Bareiss, R., & Guidati, G. (1996). Wind turbine noise. Springer.
Watanabe, T., & Moller, H. (1990). Low Frequency Hearing Thresholds in Pressure Field and in Free Field. Journal of Low Frequency Noise Vibration and Active Control, 9(3), 106-115.
White, P. (2012). Wind Turbine Amplitude Modulation: Research to Improve Understanding as to its Cause & Effect. Renewable UK.
19

Deliverable 3: Project website
The website for the project is now online and accessible at the following address.
mnsowta.safl.umn.edu
The website was under construction until the end of October 2016 when it was officially launched. At this point, the website is considered public and is kept up to date as the project moves forward. The website is structured into the following six tabs.
Home
• Includes an overview of the project, project goals as defined in the approved RDF plan, identification of funding, and the project team.
Research
• The “Research” tab is further broken into “Equipment,” “Plan,” and “Project Sites.” These pages describe the equipment used for measuring wind turbine acoustics and calibrating equipment, the general research plan, and the generalized locations of wind turbine noise measurements.
Project Updates
• Blog style updates written by the research team to keep interested parties informed of the project.
Wind Turbine Noise
• A brief introduction to wind turbine related noise generation, infrasound, low-frequency, and amplitude modulation. These pages provide basic information on wind turbine noise and terminology used in the project.
Literature
• The “Literature” page is a list of a few reports and studies the research team found helpful as a good starting point to understanding wind turbine work and previous work.
Contact Us.
• The “Contact Us” form is a way for people to ask questions and leave comments for the research team.
Ongoing work with the website includes updating the Project Updates as needed, monitoring and responding to website inquiries, and potentially implementing some website analytics to monitor website traffic.
20
Deliverable 4: 2012 Eolos data set summary This document summarizes the available turbine noise data taken at the Eolos site in June 2012 by UTRC (United Technologies Research Center).
Instrumentation Summary A combination of microphones and accelerometers totaling 75 data channels were sampled at 32 kHz. The following bulleted list summarizes the microphone and accelerometer measurement sensors. Table 1 provides a more detailed list of the data channels collected.
• 36 Brüel and Kjær Type 4958 ¼” Microphones (10 Hz to 20 kHz), 10o apart on a ~100 meter radius circle around the turbine tower
• 3 infrasound Brüel and Kjær Type 4193 infrasound microphones (0.07 Hz – 20 kHz), mounted on a 10 meter diameter circle around the 60o microphone
• 10 additional microphones mounted at various locations in the turbine nacelle • 19 accelerometers mounted at various locations on the turbine and tower
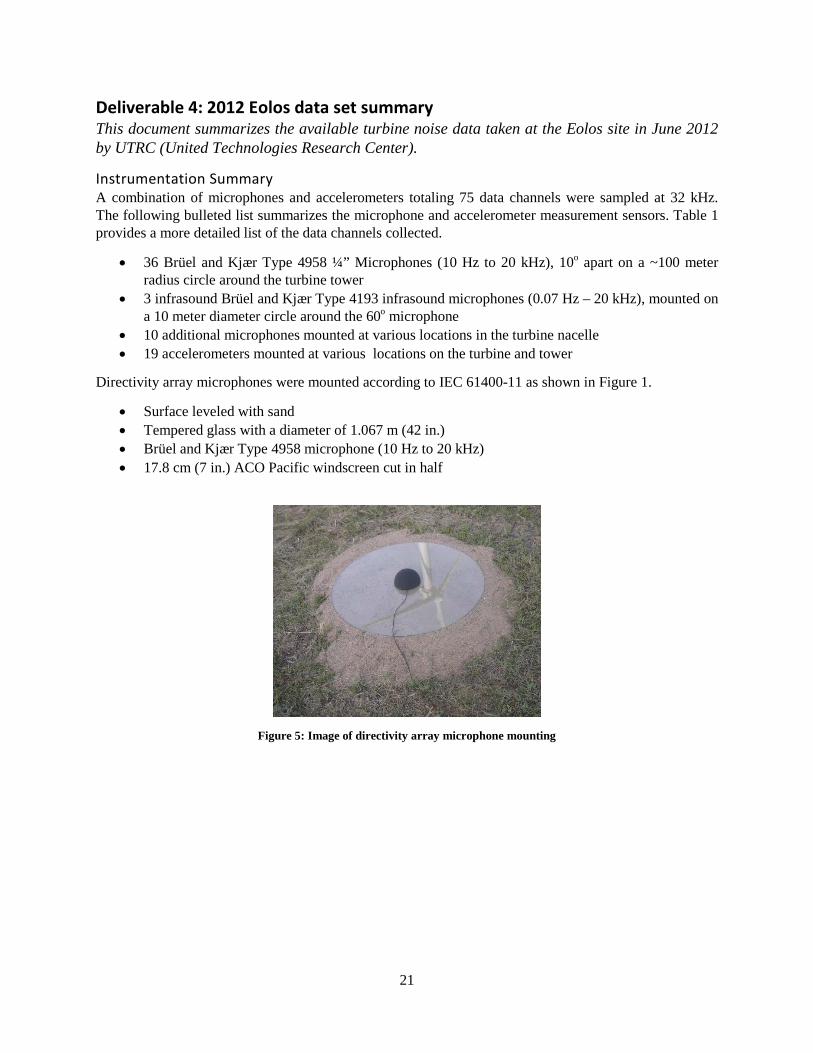
Directivity array microphones were mounted according to IEC 61400-11 as shown in Figure 1.
• Surface leveled with sand • Tempered glass with a diameter of 1.067 m (42 in.) • Brüel and Kjær Type 4958 microphone (10 Hz to 20 kHz) • 17.8 cm (7 in.) ACO Pacific windscreen cut in half
Figure 5: Image of directivity array microphone mounting
21

Table 5: 2012 Directivity Array Data System Channel List
Channel # Sensor Type Description 1 Timing Signal TTL every 5 seconds at base of tower 2 GCU Fan Mic. Behind GCU fan center body, 3 in. B&K wind screen 3 Wind Speed Met tower 10 m height wind speed (m/s)
4 Wind Direction Met tower 10 m height wind direction (deg) CW from north
5 to 40 10o to 350o Mic Directivity array microphone every 10o around turbine
41 Infra1 Infrasound Microphone B&K Type 4193 #1, high pass filter = 0.1 Hz
42 Infra2 Infrasound Microphone B&K Type 4193 #2, high pass filter = 0.1 Hz
43 Infra3 Infrasound Microphone B&K Type 4193 #3, high pass filter = 0.1 Hz
44 Laser Tachometer One pulse per revolution, aligned with center of a blade
45 Magnetic Pickup 48 pulses per revolution from hub bolts
46 N-S Seismic Accel. Orientated North-South at spill deck, high pass filter = 0.1 Hz
47 E-W Seismic Accel. Orientated East-West at spill deck, high pass filter = 0.1 Hz
48, 49,50 Main Shaft Accel. X, Y, Z Accel. on main shaft near hub
51, 52, 53 GB Brake Accel. X, Y, Z Accel. on gearbox aligned with starboard brake
54, 55, 56 GB Side Mount Accel. X, Y, Z Accel. on port gearbox mount
57, 58, 59 Generator Accel. X, Y, Z Accel. on generator near the gearbox
60, 61, 62 Tower Side Mount Accel. X, Y, Z Accel. on port tower mount - rotated 180o on Z axis
63, 64, 65 GB Main Shaft Accel. X, Y, Z Accel. Mounted on gearbox above main shaft
66 Aft Port Mic. Ambient microphone in the aft port region, Type 4165
67 Nacelle Door Mic. Ambient microphone near the nacelle door, Type 4165
68 Aft Starboard Mic. Ambient microphone in the aft starboard region, Type 4939
69 Forward Port Mic. Ambient microphone in the forward port region, Type 4939
70 Generator Outlet Mic. Microphone in generator outlet tube, Type 4165, 1/2" bullet
71 Generator Inlet Mic. Microphone at generator inlet filter, Type 4939, 1/4" bullet
72 GB Oil Fan Mic. Microphone near gearbox oil cooler fan, Type 4165, 1/2" bullet, intermittent cable breaks
73 Forward Starboard Mic. Ambient microphone in the forward starboard region, Type 4939
74 Scoop Fan Mic. Microphone at the exit of scoop fan #1, Type 4165, 1/2" bullet
75 Middle Port Mic. Ambient microphone in the middle port region, Type 4165
22
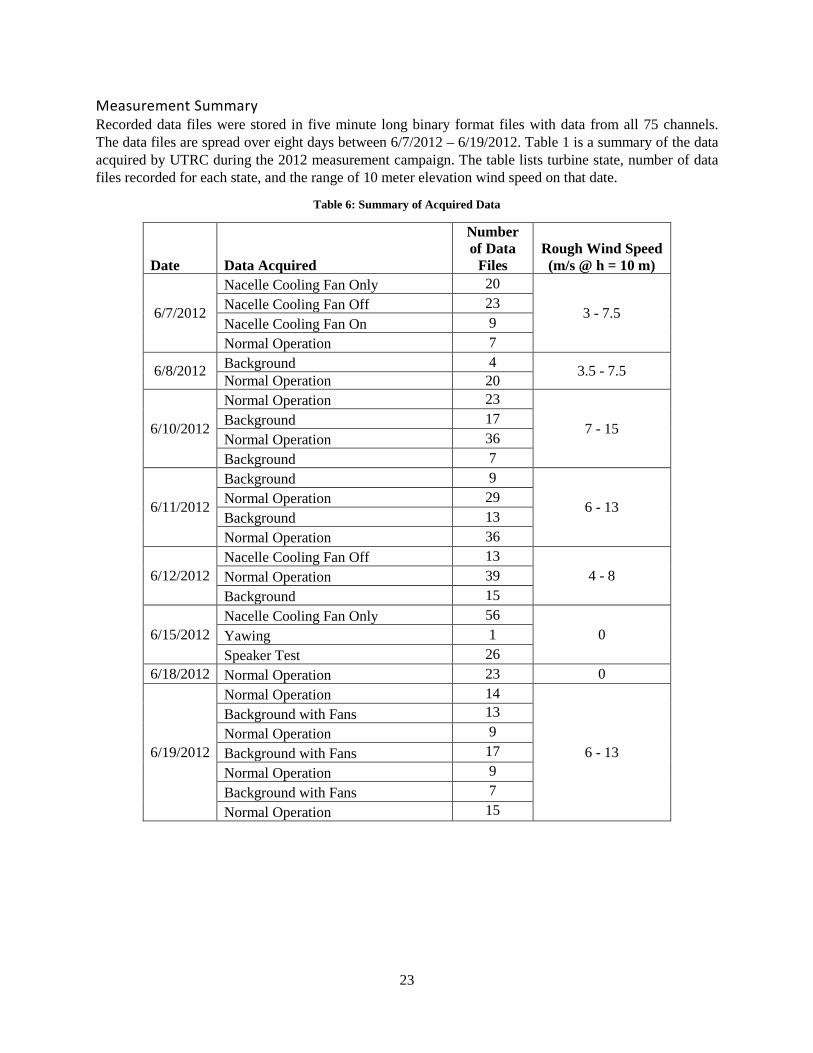
Measurement Summary Recorded data files were stored in five minute long binary format files with data from all 75 channels. The data files are spread over eight days between 6/7/2012 – 6/19/2012. Table 1 is a summary of the data acquired by UTRC during the 2012 measurement campaign. The table lists turbine state, number of data files recorded for each state, and the range of 10 meter elevation wind speed on that date.
Table 6: Summary of Acquired Data
Date Data Acquired
Number of Data
Files Rough Wind Speed (m/s @ h = 10 m)
6/7/2012
Nacelle Cooling Fan Only 20
3 - 7.5 Nacelle Cooling Fan Off 23 Nacelle Cooling Fan On 9 Normal Operation 7
6/8/2012 Background 4 3.5 - 7.5 Normal Operation 20
6/10/2012
Normal Operation 23
7 - 15 Background 17 Normal Operation 36 Background 7
6/11/2012
Background 9
6 - 13 Normal Operation 29 Background 13 Normal Operation 36
6/12/2012 Nacelle Cooling Fan Off 13
4 - 8 Normal Operation 39 Background 15
6/15/2012 Nacelle Cooling Fan Only 56
0 Yawing 1 Speaker Test 26
6/18/2012 Normal Operation 23 0
6/19/2012
Normal Operation 14
6 - 13
Background with Fans 13 Normal Operation 9 Background with Fans 17 Normal Operation 9 Background with Fans 7 Normal Operation 15
23