Embed Size (px)
Citation preview
Centre for Urban Research and Land Development
May 22, 2018
T H E O P I N I O N S E X P R E S S E D I N T H I S R E S E A R C H R E P O R T A R E T H O S E O F T H E A U T H O R O N L Y A N D D O N O T
R E P R E S E N T O P I N I O N S A N D V I E W S O F E I T H E R C U R O R R Y E R S O N U N I V E R S I T Y .
Millennials in the Greater Toronto and Hamilton
Area:
A Generation Stuck in Apartments?
2
Report Prepared by:
Diana Petramala, MASenior Researcher
Frank Clayton, Ph.D. Senior Research Fellow
with research assistance from:
Alex ButlerAmanda MackaayAlison Quigg Eileen Quigg
Acknowledgments
This document has been prepared by Diana Petramala collaboratively with Frank Clayton at the Centre for Urban Research and Land Development (CUR). Financial support for the research was provided by the Ontario Real Estate Association (OREA).
3
Table of Contents
Executive Summary.. . . . . . . . . . . . . . . . . . . . . . . . . . . . . . . . . . . . . . . . . . . . . . . . . . . . . . . . . . .4
Introduction.. . . . . . . . . . . . . . . . . . . . . . . . . . . . . . . . . . . . . . . . . . . . . . . . . . . . . . . . . . . . . . . . . . . . . .5
Core bound.. . . . . . . . . . . . . . . . . . . . . . . . . . . . . . . . . . . . . . . . . . . . . . . . . . . . . . . . . . . . . . . . . . . . . . . .6Millennials drove demand for condos in downtown Toronto over the last decade.
Stuck in place. . . . . . . . . . . . . . . . . . . . . . . . . . . . . . . . . . . . . . . . . . . . . . . . . . . . . . . . . . . . . . . . . . . . .7High housing costs have impeded housing mobility among Millennials
Millennials little different than the rest. . . . . . . . . . . . . . . . . . . . . . . . . .8 Generational differences are most evident when cohorts are in their 20’s. These differences dissipate as individuals age and start wanting similar things, like children and homeownership.
Moving up the income ladder. . . . . . . . . . . . . . . . . . . . . . . . . . . . . . . . . . . . . . . . . . . . .9 Precarious employment affects those under 30. However, job prospects are likely to improve as Millen-nials head into their 30’s.
Living with parents pays off. . . . . . . . . . . . . . . . . . . . . . . . . . . . . . . . . . . . . . . . . . . .10Millennials appear to have had more asset growth and less debt growth than other cohorts.
To rent or to own.. . . . . . . . . . . . . . . . . . . . . . . . . . . . . . . . . . . . . . . . . . . . . . . . . . . . . . . . . . . . .11Homeownership rates among Millennials are no different than past generations, suggesting they are likely to continue to want to own.
Downsizing no panacea.. . . . . . . . . . . . . . . . . . . . . . . . . . . . . . . . . . . . . . . . . . . . . . . . . . . .11Boomers unlikely to free up ground-related accommodation in the housing market for Millennials.
Aging into the suburbs. . . . . . . . . . . . . . . . . . . . . . . . . . . . . . . . . . . . . . . . . . . . . . . . . . . . . .12Households prioritize space and housing affordability over amenities as they age. Millennials are un-likely to prove different.
Conclusion.. . . . . . . . . . . . . . . . . . . . . . . . . . . . . . . . . . . . . . . . . . . . . . . . . . . . . . . . . . . . . . . . . . . . . . . .13The aging of Millennials will lead to an increase in the number of net new households formed each year over the next decade. Concerns over housing affordability could push this pool of talent out of the province.
4
E x e c u t i v e S u m m a ry
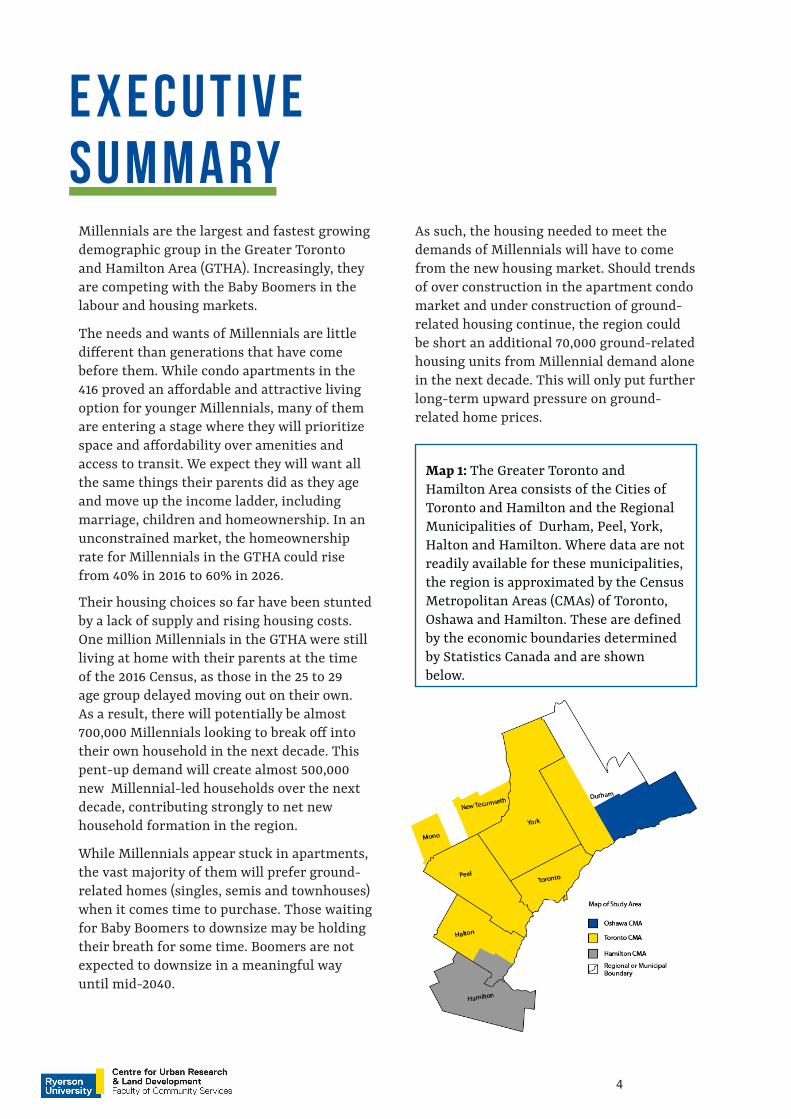
Millennials are the largest and fastest growing demographic group in the Greater Toronto and Hamilton Area (GTHA). Increasingly, they are competing with the Baby Boomers in the labour and housing markets.
The needs and wants of Millennials are little different than generations that have come before them. While condo apartments in the 416 proved an affordable and attractive living option for younger Millennials, many of them are entering a stage where they will prioritize space and affordability over amenities and access to transit. We expect they will want all the same things their parents did as they age and move up the income ladder, including marriage, children and homeownership. In an unconstrained market, the homeownership rate for Millennials in the GTHA could rise from 40% in 2016 to 60% in 2026.
Their housing choices so far have been stunted by a lack of supply and rising housing costs. One million Millennials in the GTHA were still living at home with their parents at the time of the 2016 Census, as those in the 25 to 29 age group delayed moving out on their own. As a result, there will potentially be almost 700,000 Millennials looking to break off into their own household in the next decade. This pent-up demand will create almost 500,000 new Millennial-led households over the next decade, contributing strongly to net new household formation in the region.
While Millennials appear stuck in apartments, the vast majority of them will prefer ground-related homes (singles, semis and townhouses) when it comes time to purchase. Those waiting for Baby Boomers to downsize may be holding their breath for some time. Boomers are not expected to downsize in a meaningful way until mid-2040.
As such, the housing needed to meet the demands of Millennials will have to come from the new housing market. Should trends of over construction in the apartment condo market and under construction of ground-related housing continue, the region could be short an additional 70,000 ground-related housing units from Millennial demand alone in the next decade. This will only put further long-term upward pressure on ground-related home prices.
Map 1: The Greater Toronto and Hamilton Area consists of the Cities of Toronto and Hamilton and the Regional Municipalities of Durham, Peel, York, Halton and Hamilton. Where data are not readily available for these municipalities, the region is approximated by the Census Metropolitan Areas (CMAs) of Toronto, Oshawa and Hamilton. These are defined by the economic boundaries determined by Statistics Canada and are shown below.
5
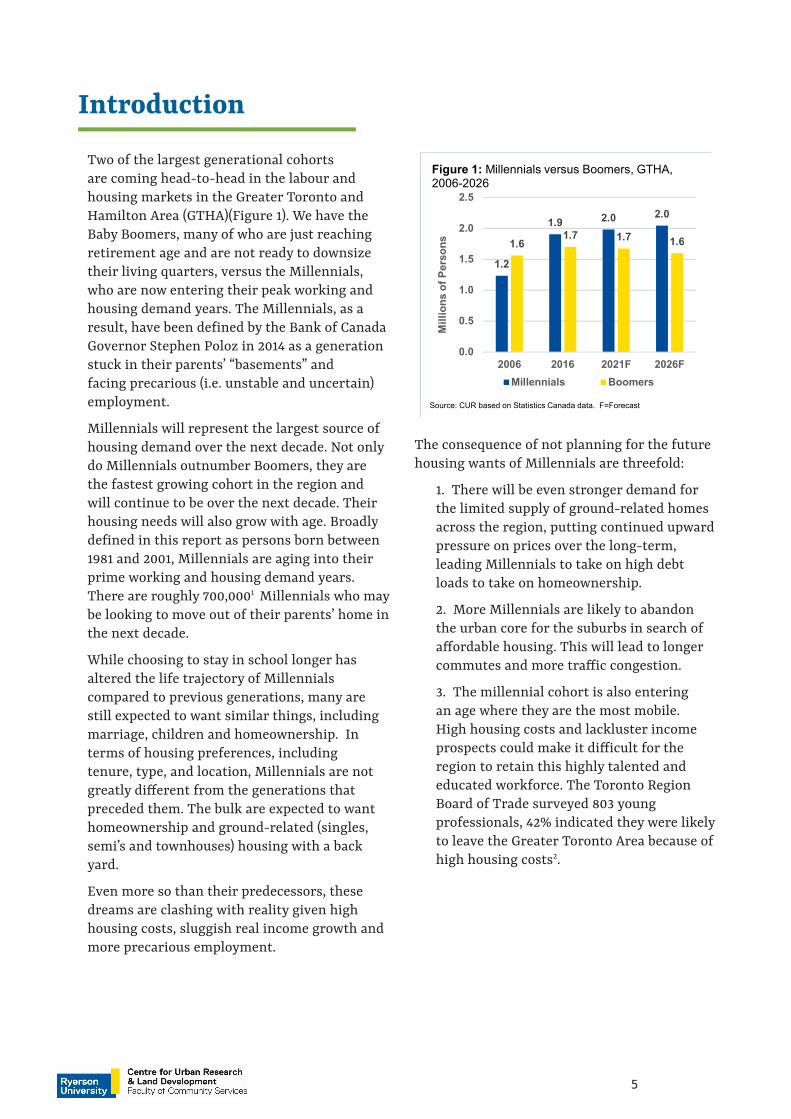
Two of the largest generational cohorts are coming head-to-head in the labour and housing markets in the Greater Toronto and Hamilton Area (GTHA)(Figure 1). We have the Baby Boomers, many of who are just reaching retirement age and are not ready to downsize their living quarters, versus the Millennials, who are now entering their peak working and housing demand years. The Millennials, as a result, have been defined by the Bank of Canada Governor Stephen Poloz in 2014 as a generation stuck in their parents’ “basements” and facing precarious (i.e. unstable and uncertain) employment.
Millennials will represent the largest source of housing demand over the next decade. Not only do Millennials outnumber Boomers, they are the fastest growing cohort in the region and will continue to be over the next decade. Their housing needs will also grow with age. Broadly defined in this report as persons born between 1981 and 2001, Millennials are aging into their prime working and housing demand years. There are roughly 700,0001 Millennials who may be looking to move out of their parents’ home in the next decade.
While choosing to stay in school longer has altered the life trajectory of Millennials compared to previous generations, many are still expected to want similar things, including marriage, children and homeownership. In terms of housing preferences, including tenure, type, and location, Millennials are not greatly different from the generations that preceded them. The bulk are expected to want homeownership and ground-related (singles, semi’s and townhouses) housing with a back yard.
Even more so than their predecessors, these dreams are clashing with reality given high housing costs, sluggish real income growth and more precarious employment.
Introduction
The consequence of not planning for the future housing wants of Millennials are threefold:
1. There will be even stronger demand for the limited supply of ground-related homes across the region, putting continued upward pressure on prices over the long-term, leading Millennials to take on high debt loads to take on homeownership.
2. More Millennials are likely to abandon the urban core for the suburbs in search of affordable housing. This will lead to longer commutes and more traffic congestion.
3. The millennial cohort is also entering an age where they are the most mobile. High housing costs and lackluster income prospects could make it difficult for the region to retain this highly talented and educated workforce. The Toronto Region Board of Trade surveyed 803 young professionals, 42% indicated they were likely to leave the Greater Toronto Area because of high housing costs2.
1.2
1.9 2.0 2.0
1.61.7 1.7 1.6
0.0
0.5
1.0
1.5
2.0
2.5
2006 2016 2021F 2026F
Mill
ions
of P
erso
ns
Millennials Boomers
Source: CUR based on Statistics Canada data. F=Forecast
Figure 1: Millennials versus Boomers, GTHA,2006-2026

6
The Millennials have been the fastest growing cohort in the GTHA since 2006. Immigration has been a major contributor to this growth, with 32% of Millennials immigrating from outside of Canada at some point in the last 30 years (Figure 2). Robust immigration could attract a further 200,000 or more Millennials to the region over the next decade. More recently, the economic downturn in oil-dependent economies has also pushed more Canadian Millennials to the region in the last two years in search of better economic prospects.
Figure 3 shows that the fastest growth in the Millennial population has occurred in the City of Toronto. Millennials have helped to drive what planner Marcus Moos coined “youthification” of urban centers3, the attraction of younger individuals to denser downtown locations.
The reasons for being core-bound are both demographic and economic:
•There is still a large number of Millennials in post-secondary education, which is heavily concentrated in the City of Toronto. The average age of Millennials is currently 26, with the population evenly divided below and above this age. As a result, almost half of Millennials are at an age where they can be expected to be in school.
•They want to be employed in and located near high skilled jobs. Millennials in the GTHA are the most educated across Canada. Almost 80% of the Millennial labour force in the region has a post secondary education, compared to only 68% in the rest of Canada. Almost half the jobs in the area are in the City of Toronto, which also accounts for an even higher percentage of jobs filled by graduates of a bachelor’s program or higher. 35% of the working Millennial population in Toronto has a business administration or science, technology, engineering and mathematical (STEM) related degree (Figure 4).
•Location decisions are also age-based. The growth in the Millennial population in the City of Toronto largely reflects the sheer size of the
Core-bound
0.0
0.1
0.2
0.3
0.4
0.5
0.6
0 -14 15 -24
25-34
35-44
45-54
55 -64
65andover
Mill
ions
of P
erso
ns
Immigrated more than 5 years agoImmigrated in last 5 years
Source: CUR based on Statistics Canada data.
Figure 2: Immigration by Age Group, GTHA, 2016
0
2
4
6
8
1010
0,00
0 of
Per
sons
2006 2016Source: CUR based on Statistics Canada Census data
Figure 3: Millennial Population by Municipality, 2006 and 2016
No Postsecondary
24%
STEM16%
Business and Administration
19%
Social and Behavioural
Sciences11%
Legal Professions
1%
Health Care6%
Education and
Teaching3%
Trades, Services, Natural
Resources, and
Conservation12%
Source: CUR based on Statistics Canada data
Figure 4: Employment by Field of Study, GTHA, 2016
7
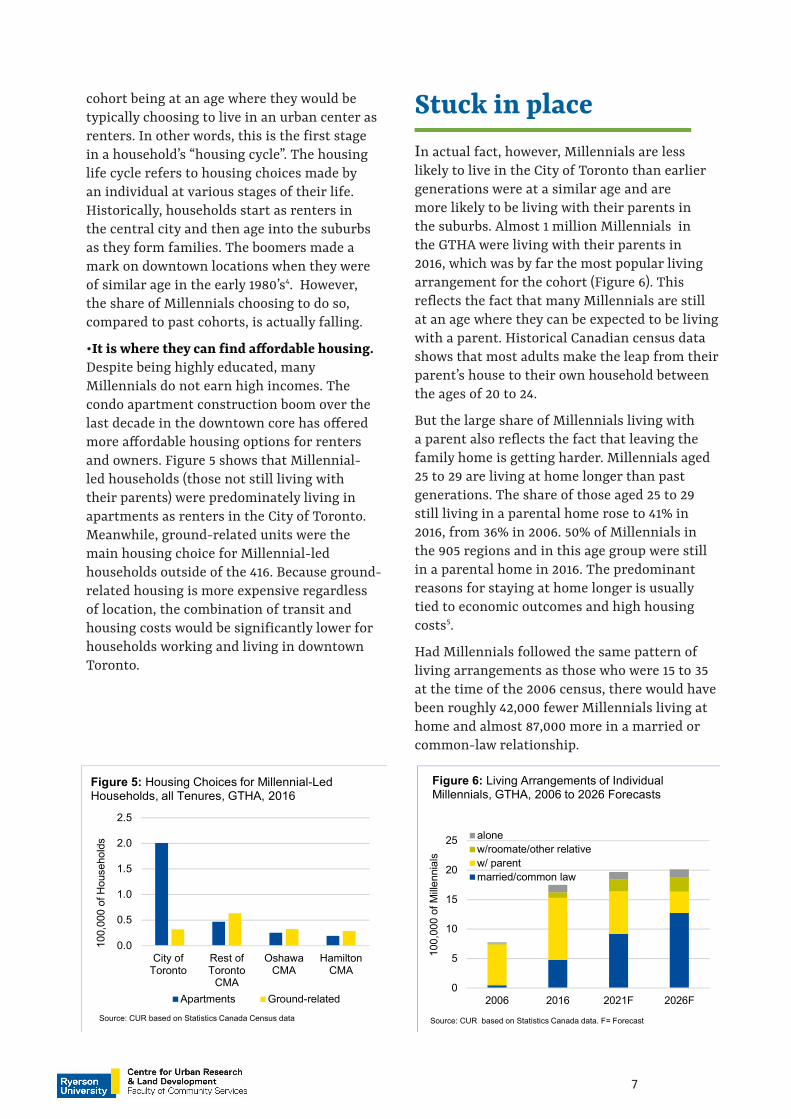
cohort being at an age where they would be typically choosing to live in an urban center as renters. In other words, this is the first stage in a household’s “housing cycle”. The housing life cycle refers to housing choices made by an individual at various stages of their life. Historically, households start as renters in the central city and then age into the suburbs as they form families. The boomers made a mark on downtown locations when they were of similar age in the early 1980’s4. However, the share of Millennials choosing to do so, compared to past cohorts, is actually falling.
•It is where they can find affordable housing. Despite being highly educated, many Millennials do not earn high incomes. The condo apartment construction boom over the last decade in the downtown core has offered more affordable housing options for renters and owners. Figure 5 shows that Millennial-led households (those not still living with their parents) were predominately living in apartments as renters in the City of Toronto. Meanwhile, ground-related units were the main housing choice for Millennial-led households outside of the 416. Because ground-related housing is more expensive regardless of location, the combination of transit and housing costs would be significantly lower for households working and living in downtown Toronto.
In actual fact, however, Millennials are less likely to live in the City of Toronto than earlier generations were at a similar age and are more likely to be living with their parents in the suburbs. Almost 1 million Millennials in the GTHA were living with their parents in 2016, which was by far the most popular living arrangement for the cohort (Figure 6). This reflects the fact that many Millennials are still at an age where they can be expected to be living with a parent. Historical Canadian census data shows that most adults make the leap from their parent’s house to their own household between the ages of 20 to 24.
But the large share of Millennials living with a parent also reflects the fact that leaving the family home is getting harder. Millennials aged 25 to 29 are living at home longer than past generations. The share of those aged 25 to 29 still living in a parental home rose to 41% in 2016, from 36% in 2006. 50% of Millennials in the 905 regions and in this age group were still in a parental home in 2016. The predominant reasons for staying at home longer is usually tied to economic outcomes and high housing costs5.
Had Millennials followed the same pattern of living arrangements as those who were 15 to 35 at the time of the 2006 census, there would have been roughly 42,000 fewer Millennials living at home and almost 87,000 more in a married or common-law relationship.
Stuck in place
0.0
0.5
1.0
1.5
2.0
2.5
City ofToronto
Rest ofToronto
CMA
OshawaCMA
HamiltonCMA
100,
000
of H
ouse
hold
s
Apartments Ground-related
Source: CUR based on Statistics Canada Census data
Figure 5: Housing Choices for Millennial-Led Households, all Tenures, GTHA, 2016
0
5
10
15
20
25
2006 2016 2021F 2026F
100,
000
of M
illenn
ials
alonew/roomate/other relativew/ parentmarried/common law
Source: CUR based on Statistics Canada data. F= Forecast
Figure 6: Living Arrangements of Individual Millennials, GTHA, 2006 to 2026 Forecasts
8
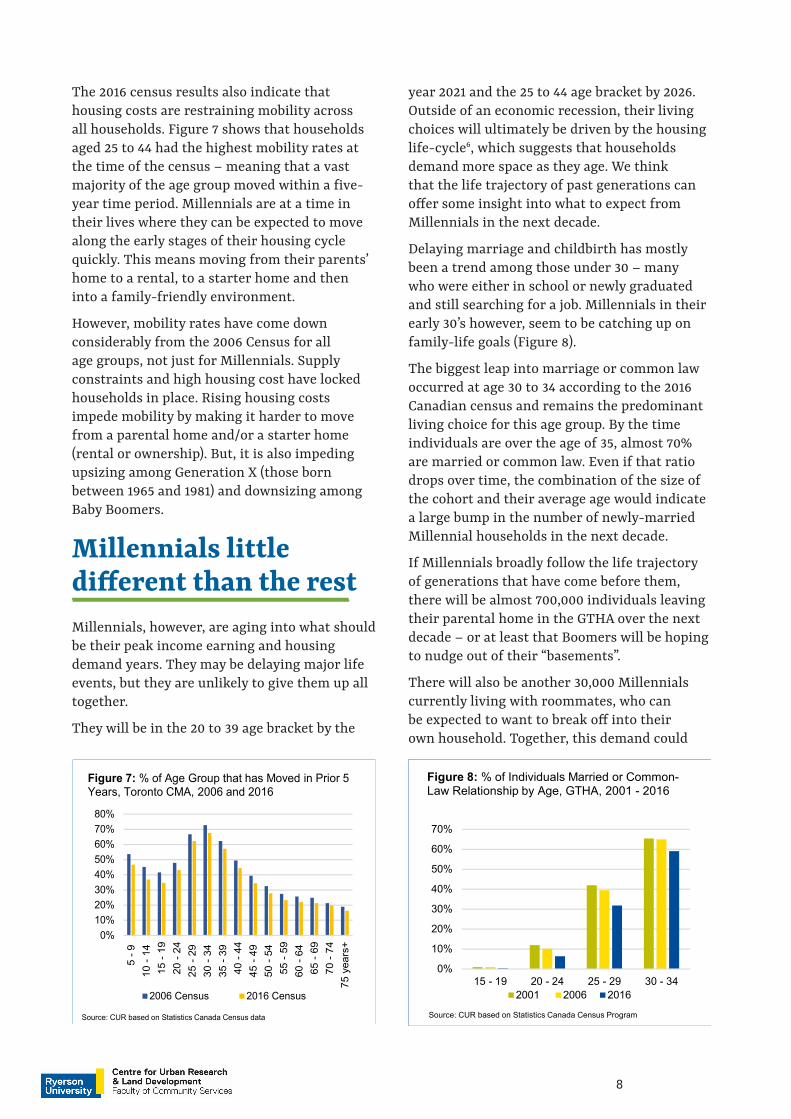
The 2016 census results also indicate that housing costs are restraining mobility across all households. Figure 7 shows that households aged 25 to 44 had the highest mobility rates at the time of the census – meaning that a vast majority of the age group moved within a five-year time period. Millennials are at a time in their lives where they can be expected to move along the early stages of their housing cycle quickly. This means moving from their parents’ home to a rental, to a starter home and then into a family-friendly environment.
However, mobility rates have come down considerably from the 2006 Census for all age groups, not just for Millennials. Supply constraints and high housing cost have locked households in place. Rising housing costs impede mobility by making it harder to move from a parental home and/or a starter home (rental or ownership). But, it is also impeding upsizing among Generation X (those born between 1965 and 1981) and downsizing among Baby Boomers.
year 2021 and the 25 to 44 age bracket by 2026. Outside of an economic recession, their living choices will ultimately be driven by the housing life-cycle6, which suggests that households demand more space as they age. We think that the life trajectory of past generations can offer some insight into what to expect from Millennials in the next decade.
Delaying marriage and childbirth has mostly been a trend among those under 30 – many who were either in school or newly graduated and still searching for a job. Millennials in their early 30’s however, seem to be catching up on family-life goals (Figure 8).
The biggest leap into marriage or common law occurred at age 30 to 34 according to the 2016 Canadian census and remains the predominant living choice for this age group. By the time individuals are over the age of 35, almost 70% are married or common law. Even if that ratio drops over time, the combination of the size of the cohort and their average age would indicate a large bump in the number of newly-married Millennial households in the next decade.
If Millennials broadly follow the life trajectory of generations that have come before them, there will be almost 700,000 individuals leaving their parental home in the GTHA over the next decade – or at least that Boomers will be hoping to nudge out of their “basements”.
There will also be another 30,000 Millennials currently living with roommates, who can be expected to want to break off into their own household. Together, this demand could
Millennials little different than the rest Millennials, however, are aging into what should be their peak income earning and housing demand years. They may be delaying major life events, but they are unlikely to give them up all together.
They will be in the 20 to 39 age bracket by the
0%10%20%30%40%50%60%70%80%
5 -
9 1
0 - 1
4 1
5 - 1
9 2
0 - 2
4 2
5 - 2
9 3
0 - 3
4 3
5 - 3
9 4
0 - 4
4 4
5 - 4
9 5
0 - 5
4 5
5 - 5
9 6
0 - 6
4 6
5 - 6
9 7
0 - 7
4 7
5 ye
ars+
2006 Census 2016 Census
Source: CUR based on Statistics Canada Census data
Figure 7: % of Age Group that has Moved in Prior 5 Years, Toronto CMA, 2006 and 2016
0%
10%
20%
30%
40%
50%
60%
70%
15 - 19 20 - 24 25 - 29 30 - 342001 2006 2016
Source: CUR based on Statistics Canada Census Program
Figure 8: % of Individuals Married or Common-Law Relationship by Age, GTHA, 2001 - 2016
9
translate into 500,000 new Millennial-led households over the next decade.
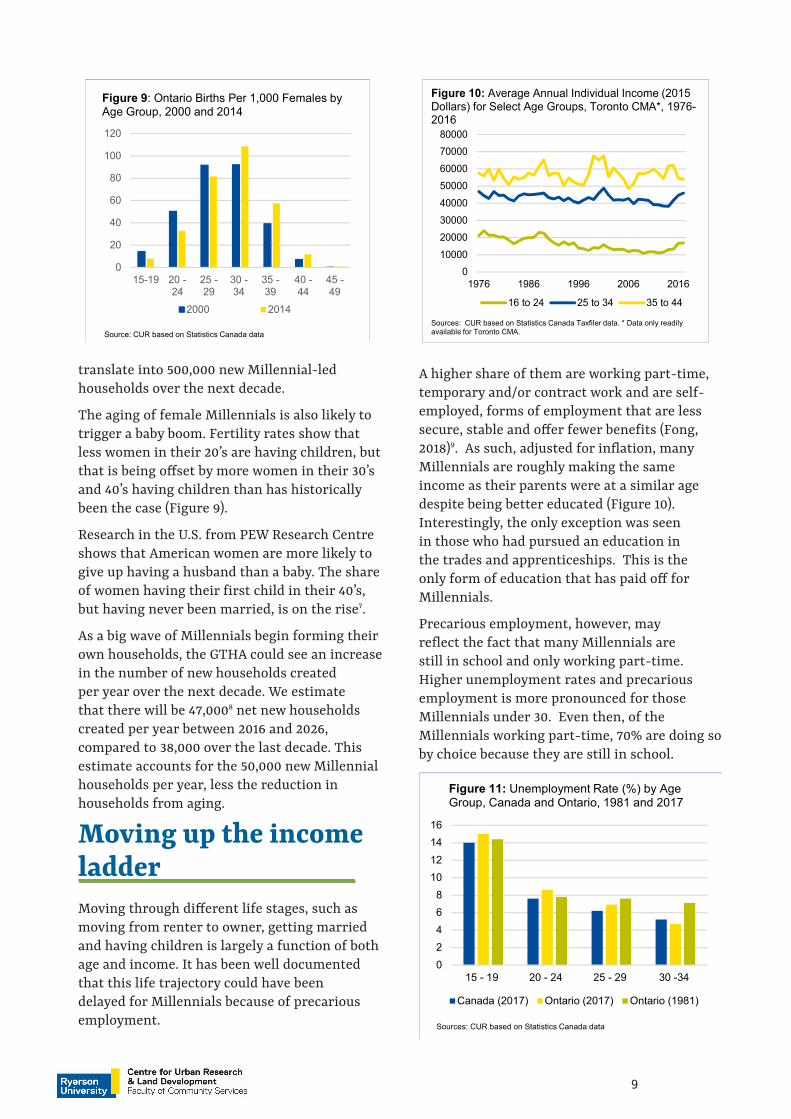
The aging of female Millennials is also likely to trigger a baby boom. Fertility rates show that less women in their 20’s are having children, but that is being offset by more women in their 30’s and 40’s having children than has historically been the case (Figure 9).
Research in the U.S. from PEW Research Centre shows that American women are more likely to give up having a husband than a baby. The share of women having their first child in their 40’s, but having never been married, is on the rise7.
As a big wave of Millennials begin forming their own households, the GTHA could see an increase in the number of new households created per year over the next decade. We estimate that there will be 47,0008 net new households created per year between 2016 and 2026, compared to 38,000 over the last decade. This estimate accounts for the 50,000 new Millennial households per year, less the reduction in households from aging.
A higher share of them are working part-time, temporary and/or contract work and are self-employed, forms of employment that are less secure, stable and offer fewer benefits (Fong, 2018)9. As such, adjusted for inflation, many Millennials are roughly making the same income as their parents were at a similar age despite being better educated (Figure 10). Interestingly, the only exception was seen in those who had pursued an education in the trades and apprenticeships. This is the only form of education that has paid off for Millennials.
Precarious employment, however, may reflect the fact that many Millennials are still in school and only working part-time. Higher unemployment rates and precarious employment is more pronounced for those Millennials under 30. Even then, of the Millennials working part-time, 70% are doing so by choice because they are still in school.
Moving up the income ladderMoving through different life stages, such as moving from renter to owner, getting married and having children is largely a function of both age and income. It has been well documented that this life trajectory could have been delayed for Millennials because of precarious employment.
01000020000300004000050000600007000080000
1976 1986 1996 2006 2016
16 to 24 25 to 34 35 to 44
Sources: CUR based on Statistics Canada Taxfiler data. * Data only readily available for Toronto CMA.
Figure 10: Average Annual Individual Income (2015 Dollars) for Select Age Groups, Toronto CMA*, 1976-2016
0
20
40
60
80
100
120
15-19 20 -24
25 -29
30 -34
35 -39
40 -44
45 -49
2000 2014
Source: CUR based on Statistics Canada data
Figure 9: Ontario Births Per 1,000 Females by Age Group, 2000 and 2014
02468
10121416
15 - 19 20 - 24 25 - 29 30 -34
Canada (2017) Ontario (2017) Ontario (1981)
Sources: CUR based on Statistics Canada data
Figure 11: Unemployment Rate (%) by Age Group, Canada and Ontario, 1981 and 2017
1 0
The employment situation can be expected to improve once these Millennials enter their 30s (Figure 11), assuming the Ontario economy can maintain its current momentum. A low unemployment rate indicates that job prospects for Ontarians over the age of 30 are better than those faced by the Boomers at a similar age (in 1981) and relative to Millennials across Canada.
The average age of Boomers is now 65, the age of retirement. Millennials may find some relief in the labour market and more upward mobility as Boomers start retiring over the next decade.
Figure 10 (page 9) also shows that while there has been little variability in income for age groups across time, individuals do move into higher income brackets with age. Historically, an individual moving from their early 20’s to late 20’s can expect a $30,000 bump in income. An individual moving from their late 30’s into their early 40’s can expect a $10,000 bump. As such, the average individual income of Millennials is expected to rise to $50,000 (in 2015 dollars) by 2026, from just $32,00010 in 2016. A dual income earning household has the potential to earn an annual average income of over $100,000 per year. Millennials are unlikely to surpass the income their parents were making at the same age, but they can at least expect to be making a similar amount, once adjusted for inflation.
Living with parents pays off
Additionally, financial help from their parents is likely helping many Millennials prepare for homeownership. Results from Statistics Canada’s Household Financial Security Survey in 2016 shows that while the Boomers in Ontario11 may be feeling the financial strain of having their adult children still living at home, it appears to be benefiting the Millennials.
Not only have many Boomers been carrying the cost of living for their adult children, they are also preparing to gift their children with an early inheritance to help them buy a home. A recent Sotheby’s report on 2017 Generational Trends in metropolitan housing markets found
that 35% of Boomer households in the Greater Toronto Area (GTA) surveyed planned to give or already have given their children around $50,000 as a down payment for a home as an early inheritance12 - the price they are willing to pay to get their children out of their homes!
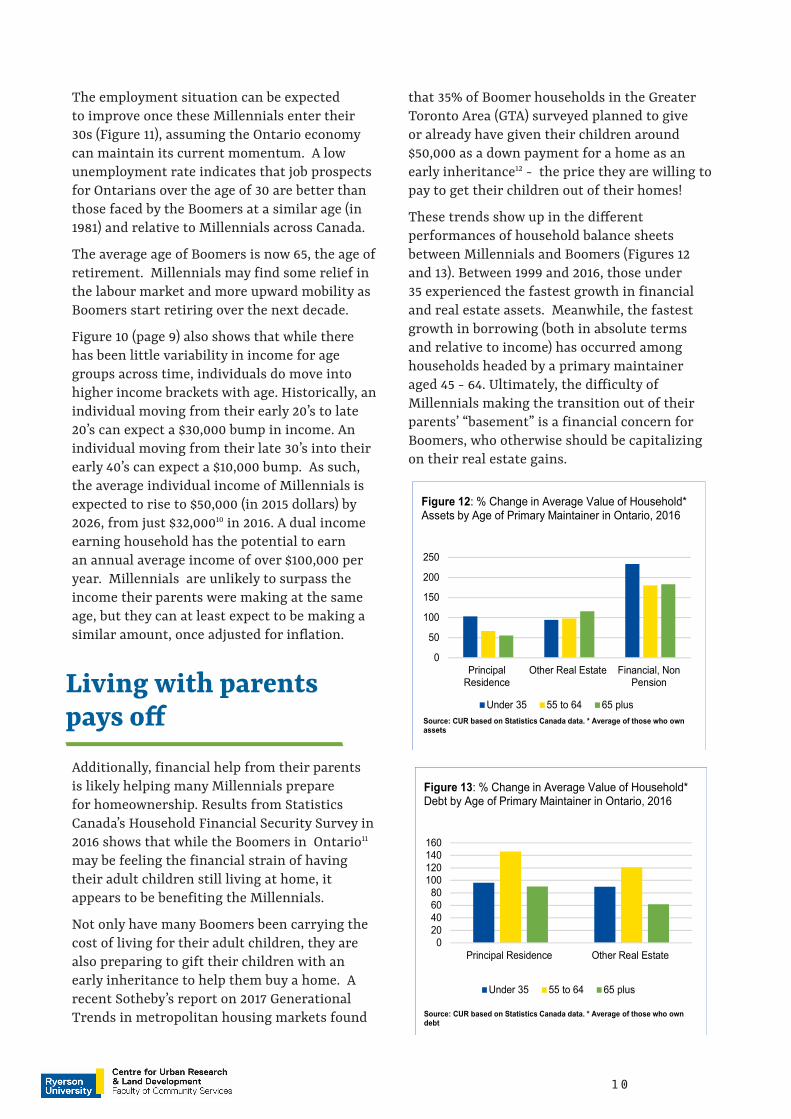
These trends show up in the different performances of household balance sheets between Millennials and Boomers (Figures 12 and 13). Between 1999 and 2016, those under 35 experienced the fastest growth in financial and real estate assets. Meanwhile, the fastest growth in borrowing (both in absolute terms and relative to income) has occurred among households headed by a primary maintainer aged 45 - 64. Ultimately, the difficulty of Millennials making the transition out of their parents’ “basement” is a financial concern for Boomers, who otherwise should be capitalizing on their real estate gains.
0
50
100
150
200
250
PrincipalResidence
Other Real Estate Financial, NonPension
Under 35 55 to 64 65 plus
Figure 12: % Change in Average Value of Household* Assets by Age of Primary Maintainer in Ontario, 2016
Source: CUR based on Statistics Canada data. * Average of those who own assets
020406080
100120140160
Principal Residence Other Real Estate
Under 35 55 to 64 65 plus
Figure 13: % Change in Average Value of Household* Debt by Age of Primary Maintainer in Ontario, 2016
Source: CUR based on Statistics Canada data. * Average of those who own debt

1 1
To rent or to own Millennials in the GTHA are moving into a stage of their lives where owning has historically been the top tenure choice. The average homeownership for Millennials in the CMAs was just 40% in 2016, which is equivalent to the homeownership rate for those who were of as similar age group 30 years ago (Figure 14). Should Millennials continue to put as much weight on homeownership as their parents did, Figure 14 also shows that homeownership rates may rise to almost 60% as they age into the 25 to 44 age bracket by 2026. Millennials will also be moving into an income bracket where homeownership is more likely. The 2016 Census showed that the average household income for homeowners across the GTA was near $100,000. The average income for renters was $60,000.
Millennials are indicating the desire to own. The 2018 RBC Homebuyers Survey showed that 58% of Millennials surveyed in Canada were interested in buying in the next two years, compared to just 47% in 2016. While homebuying intentions by age reflect the Canada-wide survey, the final regional results indicate that households in Ontario were more optimistic about buying in the next two years than the rest of Canada13 .
Homeownership rates do not change widely over generations at similar points in their life-cycle, outside of an economic recession. So, while high housing costs may mean Millennials will have to save a little longer for a down payment,
Downsizing no panaceaIn retrospect, it is not hard to see why condo construction ramped up in the region over the last decade. Millennials, in their younger stages of life, are demanding them. The 2016 census data showed that while majority of Millennial households who own still live in ground-related housing, they are more likely to be living in apartments and condos than those of a similar age over the last three decades (Figure 15).
The shift into apartments may be due to affordability challenges in the single-detached market, more so than by choice. The purchase of an averaged priced single-detached home required an average annual household income of 6 times the average individual income for Millennials, at mortgage rates as of May 14th, 2018. The average condo still requires an income of over $100,000, but is more palatable for a dual-income earning Millennial household.
However, The majority of home buying Millennials continue to indicate a preference for ground-related housing. A 2017 study by CUR highlighted that only 23% of potential homebuyers surveyed by the Toronto Real Estate Board indicated a preference for condos. A Genworth survey of actual homebuyers showed
the majority of them are still likely to become homeowners in the next decade. Of the 500,000 new Millennial households expected over the next decade, roughly 350,000 can be expected to become homeowners based on the above analysis.
0%20%40%60%80%
100%
Osh
awa
Toro
nto
Ham
ilton
Osh
awa
Toro
nto
Ham
ilton
Osh
awa
Toro
nto
Ham
ilton
Osh
awa
Toro
nto
Ham
ilton
All Ages 15-24 25-39 40-491986 2016
Figure 14: Homeownership Rates (%) by Select Age Groups in the CMAs, 1986 and 2016
Sources: CUR based on Statistics Canada data* The age group 25 to 39 due to availability of data from the 1986 Census
0%10%20%30%40%50%60%70%80%90%
2006 2016Owners Renters
Figure 15: % of Households Aged 25 to 34 Living in Ground-Related Housing, GTHA, 2006 and 2016
Source: CUR based on Statistics Canada data

1 2
Aging into the suburbs
that 65% of Millennials buying in the City of Toronto purchased a ground-related home, while 90% of Millennials in the rest of Ontario purchased a ground-related home14.
Available stock of ground-related housing is limited and those waiting for Boomers to downsize may be holding their breath for some time. While Millennials outnumber Boomers in terms of population, there are still far more Boomer-led households (Figure 16). While they have reached the age of retirement, most Boomers are unlikely to downsize anytime soon. Not only will the debt they are still carrying lock them in place, households between the age of 65 and 85 are much less likely to move than younger households (Figure 7 on page 5).
The Ontario Government reported that downsizing among Boomers may not free up the housing stock until the years between mid-2040 to 2050. The analysis points out that households do not downsize into apartments until the age of 85. 15 As such, housing supply for Millennials is going to have to come from the new home market, which is currently mainly supporting apartment development.
Between 2006 and 2016, there was slightly more ground-related homes (204,000) built than apartments (188,000) (Figure 17) in the region. However, the scale has tipped towards apartment construction more recently. If current trends continue, there will be more apartment completions than ground-related housing in the next decade.
Apartments were certainly needed to meet the demands of young Millennials over the
0.00.10.20.30.40.50.60.7
Milli
ons
of H
ouse
hold
s
2016 2026FSource: CUR based on Statistics Canada data. F=Forecast
Figure 16: Households by Age Group, GTHA, 2016 and 2026 Forecast
0
1
2
3
4
1990 1999 2008 2017
10,0
00 o
f Uni
ts
Singles and Semis ApartmentsRow Houses
Figure 17: Residential Completions in the GTHA, 1990 to 2017
Source: CUR based on CMHC data.
0%
10%
20%
30%
40%
50%
15 -24 25 -34
35 -44
45 -54
55 -64 65 andover
2001 2016
Figure 18: The % of Commuters Walking, Biking or Taking Public Transit by Age Group,GTHA, 2001 and 2016
Source: CUR based on Statistics Canada data
last decade. But, should these construction trends continue as the cohort ages, we will have roughly a 70,00016 deficit in the number of ground-related housing units required to meet Millennial demand over the next ten years and a likely apartment surplus.
The locational choices of Millennials will also change as they age and expand their family size. The appeal of the City of Toronto to Millennials is likely to fade as they age and begin to prioritize affordable housing and space over proximity to work and amenities. In the Canadian context, the propensity to commute further and via car does change with age, income and family status (Figure 18).
According to the National Realtors’ Association
1 3
Generational Trends Survey in the U.S, this trend has already taken hold in U.S. cities, where Millennials are opting for the suburbs in search of affordable housing near friends and family, thus putting less emphasis on amenities and transit options and more on affordability and being close to family17. However, the average cost of a 2,500 square foot home in most U.S. suburbs may make any Toronto, Oshawa and Hamilton resident, suburban or urban, envious.
The 905 regions still offer a range of housing options that remain favourable and affordable to Millennials. However, if new supply doesn’t shift in favour of ground-related housing, the additional housing demands from this cohort will inevitably put additional upward pressure on home prices.
ConclusionThe aging of Millennials in the GTHA will contribute to growth in household formation and housing demand in the next decade. There could potentially be over 50,000 new millennial
households created per year as they start leaving their parents’ home or break off from their roommates. This could contribute to the creation of 47,000 net new households of all age groups per year in the GTHA between 2006 and 2016, compared to just 38,000 created between 2006 and 2016.
As Millennials move into the suburbs, absent of efficient public transit, they are likely to shift from being heavy transit users to relying on cars, which will add to congestion.
Ontario is home to the highest educated Millennials in the country. But they are also at the age where they are the most mobile. In fact, on net, the province loses individuals between the age of 25 and 44 to other provinces in search of more affordable housing and jobs. Retaining this talent and attracting them to the major city centres will require offering them better job prospects and more housing choice, especially lower density housing.
14
Endnotes1 The share of Millennials living at home in their 30’s is expected to fall to 5%. This figure assumes Millennials continue to delay breaking off into their own household.
2 Gill Patrick and Jeff Parker (2018). “Housing Policy Playbook. 2018 Provincial Election,” Toronto Board of Trade, [Online]. Available: https://www.bot.com/Portals/0/Agenda%20For%20Growth_Housing%20Policy%20Playbook_FINAL_HR.pdf3 Richard Florida (2018). “Is Your Neighbourhood Changing? It might be Youthification, Not Gentrification” [Online]. Available: https://www.citylab.com/equity/2015/02/is-your-neighborhood-changing-it-might-be-youthification-not-gentrification/385193/[February 2018].4 Pierre Fillion and Jill L. Grant, The Millennial City. Trends, Implications, and Prospects for Urban Planning and Policy (New York: Routledge, 2018), Chapter 2, 18.5 Marcus Moos, ““Generationed” Space: Societal restructuring and young adults’ changing residential location patterns,” The Canadian Geographer (2014). 58(1), 12. 6 Dowell Myers ,” Peak Millennials: Three reinforcing cycles that amplify the rise and fall of urban concentration by millennials,” Housing Policy Debate, 26(6), 2016, 929.7 Gretchen Livingstone, (2018). “They are Waiting Longer, but U.S. Women Today are More Likely to have Children than A Decade Ago” [Online]. Available: http://www.pewsocialtrends.org/2018/01/18/theyre-waiting-longer-but-u-s-women-today-more-likely-to-have-children-than-a-decade-ago/ [January 2018].8 This estimate assumes Statistics Canada’s medium scenario population projections for Ontario and then assumes headship rates remain constant from 2016 levels. Headship rates by age do not change substantially over time. 9 Francis Fong (2018). “Navigating Precarious Employment in Canada. Who is Really at Risk?,” Chartered Professional Accounts of Ontario.10 Based on household taxfiler information for Toronto. It is a weighted average of income for two age brackets, those 15 to 24 and those 25 to 34.11 Data not readily available at the CMA level. 12 “Sotheby’s 2017 Generational Trends Report,”[Online]. Available: https://sothebysrealty.ca/insightblog/2017/12/05/2017-generational-trends-report/ [December 2017].13 RBC 2018 Homebuyer’s Survey (2018): “Confidence Boost: Canadians Reveal Highest Purchase Intent in 8 Years,” [Online]. Available: http://www.rbc.com/newsroom/news/2018/20180403-home-ownership.html14 Frank Clayton (2017), “Overriding Preferences for Ground Related Housing for GTA Millennials and Other Prospective Buyers,” Centre for Urban Research and land Development. September 26, 2017, 5 and 11.15 Places to Grow Act (2017). “Discussion Paper :Proposed Methodology for Land Needs Assessment for the Greater Golden Horseshoe,” [Online]. Available: https://www.placestogrow.ca/index.php?option=com_content&task=view&id=434&Itemid=31 [December 2017], 51.16 Based on 70% of Millennial households becoming homeowners and 80% of homeowners choosing to live in a ground-related housing unit.17 “National Real Estate Association Homebuyer and Seller Generational Trends Report,”(2018), 30. [Online]. Available: https://www.nar.realtor/research-and-statistics/research-reports/home-buyer-and-seller-generational-trends [March, 2018].
15
REFERENCESClayton, Frank (2017), “Overriding Preferences for Ground Related Housing for GTA Millennials and Other Prospective Buyers,” Centre for Urban Research and land Development, September 26, 2017.
Fillion. Pierre and Jill L. Grant, The Millennial City. Trends, Implications, and Prospects for Urban Planning and Policy. New York: Routledge, 2018.
Florida, Richard (2018). “Is Your Neighbourhood Changing? It might be Youthification, Not Gentrification” [Online]. https://www.citylab.com/equity/2015/02/is-your-neighborhood-changing-it-might-be-youthification-not-gentrification/385193/. [February 2018].
Fong, Francis (2018). “Navigating Precarious Employment in Canada. Who is Really at Risk?,” Chartered Professional Accounts of Ontario.
Gill, Patrick and Parker, Jeff (2018). “Housing Policy Playbook. 2018 Provincial Election,” Toronto Board of Trade, [Online]. https://www.bot.com/Portals/0/Agenda%20For%20Growth_Housing%20Policy%20Playbook_FINAL_HR.pdf
Livingstone, Gretchen (2018). “They are Waiting Longer, but U.S. Women Today are More Likely to have Children than A Decade Ago” [Online]. http://www.pewsocialtrends.org/2018/01/18/theyre-waiting-longer-but-u-s-women-today-more-likely-to-have-children-than-a-decade-ago/. [January 2018].
Moss, Marcus, ““Generationed” Space: Societal restructuring and young adults’ changing residential location patterns,” The Canadian Geographer (2014). 58(1), 11-33.
Myers, D,” Peak Millennials: Three reinforcing cycles that amplify the rise and fall of urban concentration by millennials,” Housing Policy Debate, 26(6), 2016, 928 to 947.
“National Real Estate Association Homebuyer and Seller Generational Trends Report,”(2018). [Online]. https://www.nar.realtor/research-and-statistics/research-reports/home-buyer-and-seller-generational-trends. [March, 2018].
Places to Grow Act (2017). “Discussion Paper: Proposed Methodology for Land Needs Assessment for the Greater Golden Horseshoe,” [Online]. https://www.placestogrow.ca/index.php?option=com_content&task=view&id=434&Itemid=3. [December 2017].
Powell, Naomi (2018). “Want to buy a Toronto condo? You now need an annual income of at least $100,000,” Financial Post [Online]. http://business.financialpost.com/real-estate/want-to-buy-a-toronto-condo-you-now-need-an-annual-income-of-at-least-100000. [April 11,2018].
RBC 2018 Homebuyers Survey (2018). “Confidence Boost: Canadians Reveal Highest Home Purchase Intent in 8 Years,” [Online]. http://www.rbc.com/newsroom/news/2018/20180403-home-ownership.html.
“Sotheby’s 2017 Generational Trends Report,”[Online]. https://sothebysrealty.ca/insightblog/2017/12/05/2017-generational-trends-report/. [December 2017].