Embed Size (px)
Citation preview

Millennium Gloucester Hotel and Conference 21 – 23 June 2006
Residential Monitoring to Decrease Energy Use and Carbon Emissions in Europe
Aníbal de AlmeidaISR-University of Coimbra
Objective of the projectObjective of the project
• Contribute to an increased understanding of the energy consumption in the EU-25+2 households for the different types of equipment, including the consumers’ behaviour and comfort levels;
• To identify demand trends;• Evaluation of the potential electricity savings that can already be
implemented by existing means, like the use of very efficient appliances or the elimination/mitigation of standby consumption;
• Analysis of market transformation for different types of equipment;• Policy recommendations for each type of equipment.
Results of the ProjectResults of the Project
• Updated European database on residential consumption, including Central and Eastern European countries;
• Innovative methodologies to combine the use of selective monitoring with wider-scale surveying;
• A user-friendly software tool to evaluate the energy performance of households;
• A set of policy recommendations for each type of equipment, which can lead to a successful market transformation and to provide cost-effective energy and carbon savings
• Dissemination tools and materials
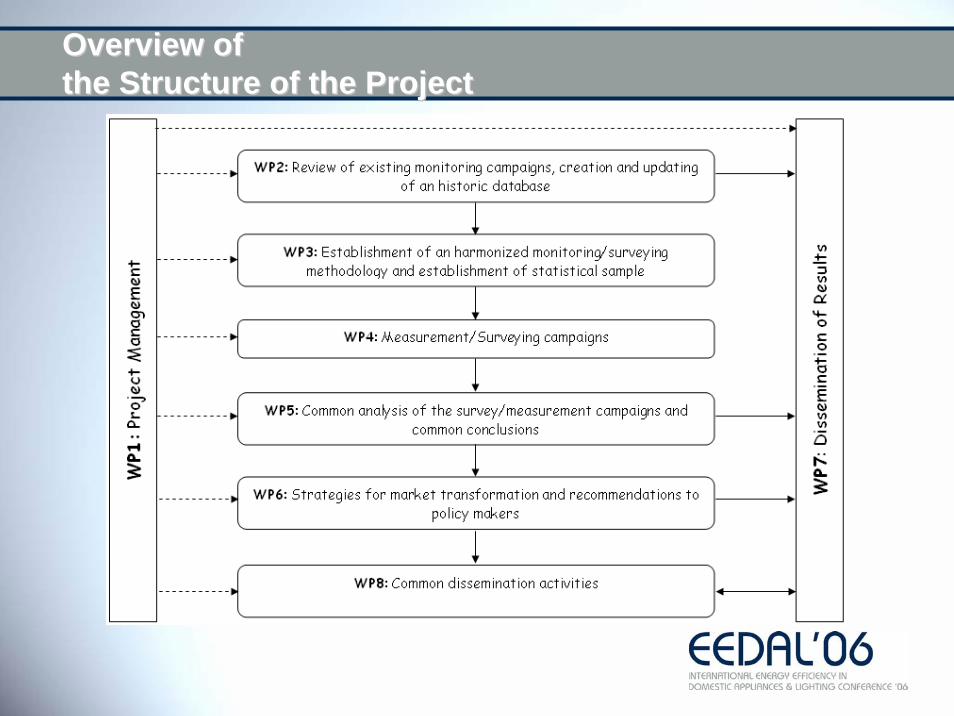
Overview of Overview of the Structure of the Projectthe Structure of the Project
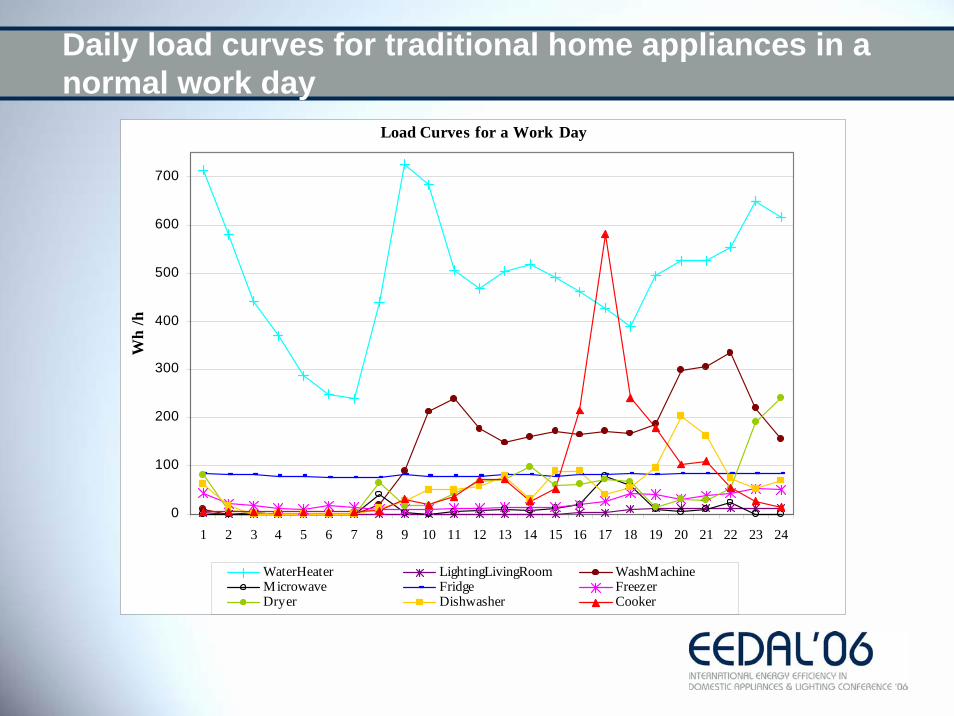
Daily load curves for traditional home appliances in a normal work day
Load Curves for a Work Day
0
100
200
300
400
500
600
700
1 2 3 4 5 6 7 8 9 10 11 12 13 14 15 16 17 18 19 20 21 22 23 24
Wh
/h
WaterHeater LightingLivingRoom WashMachineMicrowave Fridge FreezerDryer Dishwasher Cooker

Daily load curves for traditional home appliances in the weekend
Load Curves for a Weekend
0
100
200
300
400
500
600
700
800
900
1 2 3 4 5 6 7 8 9 10 11 12 13 14 15 16 17 18 19 20 21 22 23 24
Wh
/h
WaterHeater LightingLivingRoom WashMachineMicrowave Fridge FreezerDryer Dishwasher Cooker

Estimated residential electricity consumption in each Estimated residential electricity consumption in each country of the study, 2005country of the study, 2005
02000400060008000
1000012000140001600018000
Portugal
France
Germany
Denmark
Norway
Bulgaria
Czech R
epublic
Greece
Romania
Belgium
Hun
gary
Italy
kWh/
hous
ehol
d/ye
ar
Average in OECD Europe
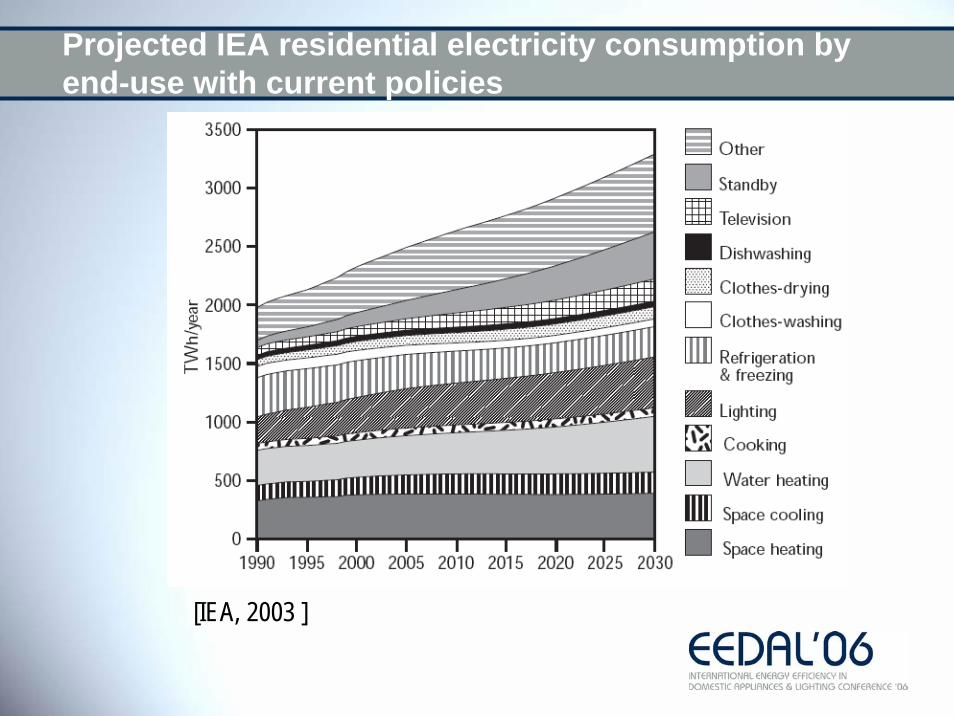
Projected IEA residential electricity consumption by end-use with current policies
[IEA, 2003 ]
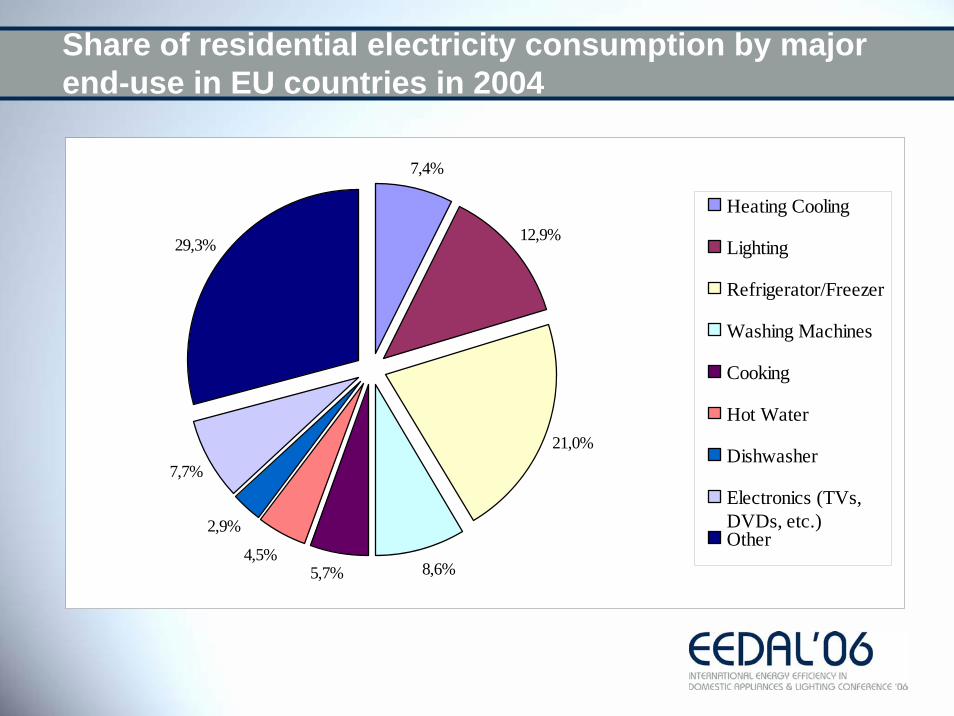
Share of residential electricity consumption by major end-use in EU countries in 2004
7,4%
12,9%
21,0%
8,6%5,7%4,5%
2,9%
7,7%
29,3%
Heating Cooling
Lighting
Refrigerator/Freezer
Washing Machines
Cooking
Hot Water
Dishwasher
Electronics (TVs,DVDs, etc.)Other
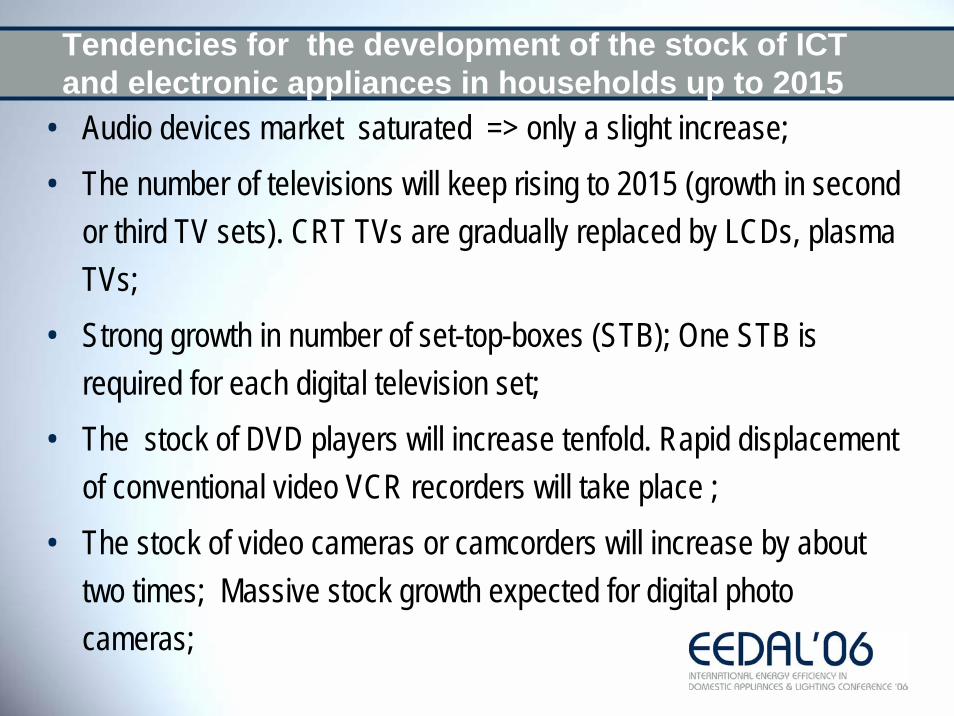
Tendencies for the development of the stock of ICT and electronic appliances in households up to 2015
• Audio devices market saturated => only a slight increase;• The number of televisions will keep rising to 2015 (growth in second
or third TV sets). CRT TVs are gradually replaced by LCDs, plasma TVs;
• Strong growth in number of set-top-boxes (STB); One STB is required for each digital television set;
• The stock of DVD players will increase tenfold. Rapid displacement of conventional video VCR recorders will take place ;
• The stock of video cameras or camcorders will increase by about two times; Massive stock growth expected for digital photo cameras;
Tendencies for the development of the stock of ICT and electronic appliances in households up to 2015
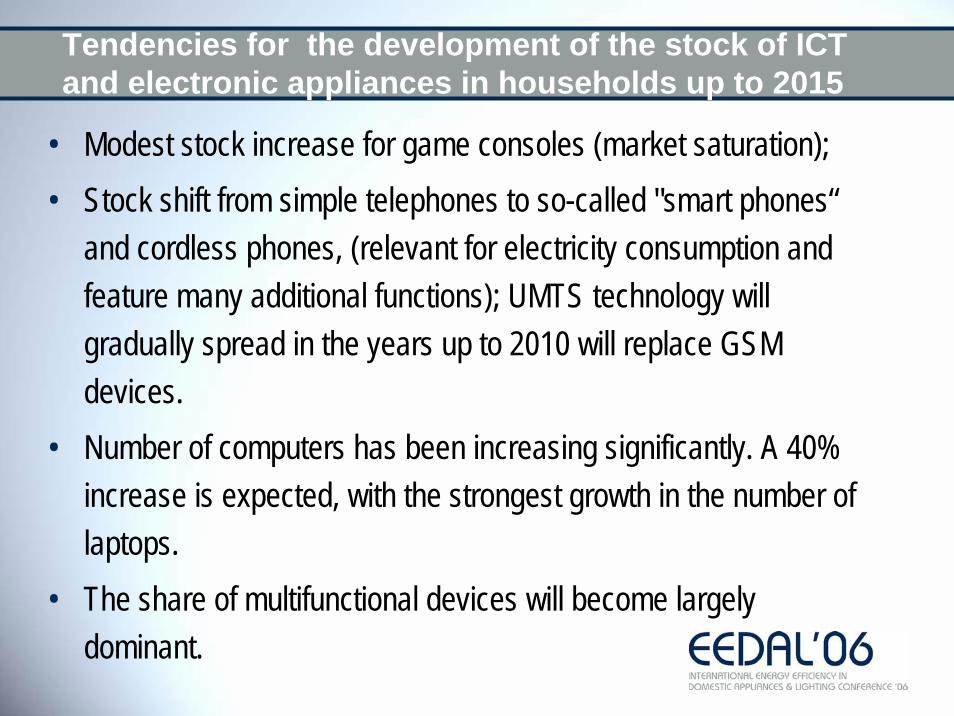
• Modest stock increase for game consoles (market saturation);• Stock shift from simple telephones to so-called "smart phones“
and cordless phones, (relevant for electricity consumption and feature many additional functions); UMTS technology will gradually spread in the years up to 2010 will replace GSM devices.
• Number of computers has been increasing significantly. A 40% increase is expected, with the strongest growth in the number oflaptops.
• The share of multifunctional devices will become largely dominant.
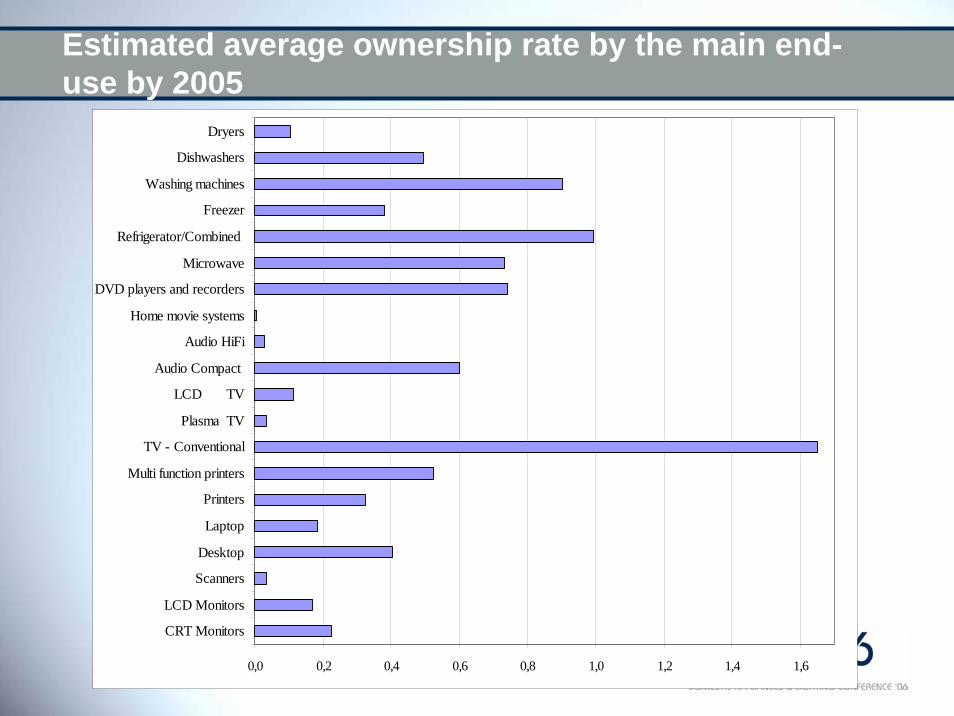
Estimated average ownership rate by the main end-use by 2005
0,0 0,2 0,4 0,6 0,8 1,0 1,2 1,4 1,6
CRT Monitors
LCD Monitors
Scanners
Desktop
Laptop
Printers
Multi function printers
TV - Conventional
Plasma TV
LCD TV
Audio Compact
Audio HiFi
Home movie systems
DVD players and recorders
Microwave
Refrigerator/Combined
Freezer
Washing machines
Dishwashers
Dryers
Definition of stand by consumption
• IEC 62301: “House electrical appliances – Measurement of standby power”, published in June 2005, and its European on going transcription EN 62301.
• Specifies methods of measurement of electrical power consumptionin standby mode. It is applicable to mains powered electrical household appliances and to mains powered parts of appliances that use other fuels such as gas or oil
– The standby mode is the lowest power consumption mode which cannot be switched off (influenced) by the user.
– The standby power is the average power in standby mode.
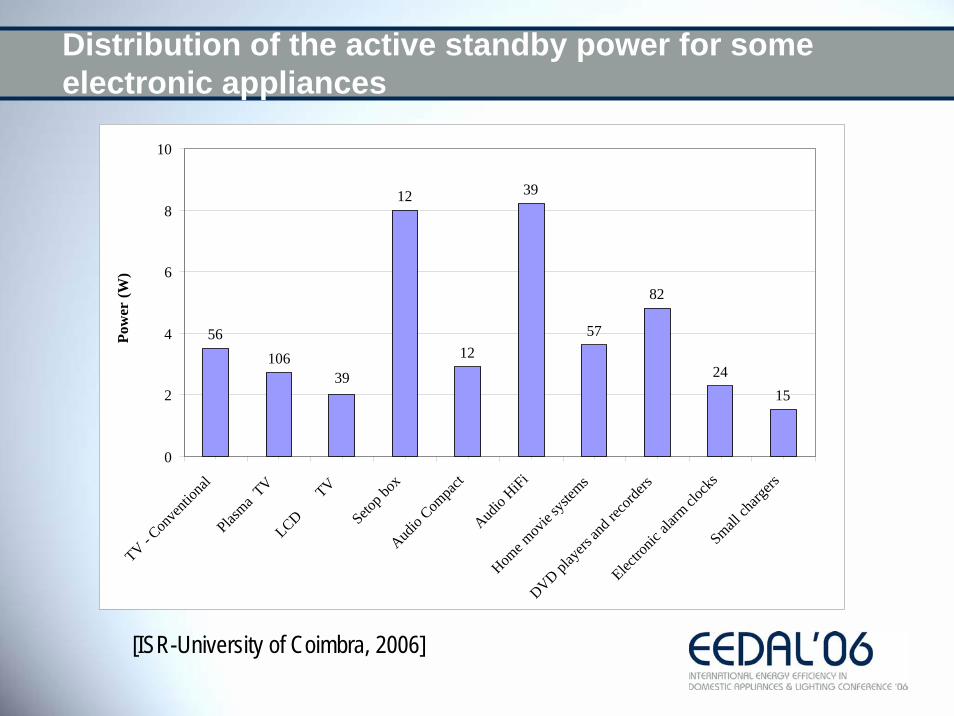
Distribution of the active standby power for some electronic appliances
82
24
57
39
12
39106
56
15
12
0
2
4
6
8
10
TV - Con
venti
onal
Plasma
TVLCD
TV
Setop b
oxAud
io Com
pact
Audio
HiFi
Home m
ovie
system
s
DVD play
ers an
d reco
rders
Electro
nic al
arm cl
ocks
Small ch
argers
Pow
er (W
)
[ISR-University of Coimbra, 2006]

Power consumption of desktop PCs, for each operating mode
[ISR-University of Coimbra, 2006]
Desktops
0
50
100
150
200
On Mode Active Standby Hibernate Off Mode
W
Average

Power consumption of Laptops, for each operating mode, and for the power supply
[ISR-University of Coimbra, 2006]
Laptops
020406080
100120
On Mode ActiveStandby
Hibernate Off Mode Power Supply
W
Average

Power Consumption for each mode of operation of some electronic loads
On Active Standby * Off Mode **Min Av Max Min Av Max Min Av Max
TV - Conventional 32,2 83,9 185,0 0,5 3,5 12,0 0,0 1,5 6,6Plasma TV 102,7 252,8 450,0 0,0 2,7 6,0 0,6 2,0 4,3LCD TV 31,6 130,0 421,0 0,0 2,0 18,1 0,0 1,3 8,4Setop box 17,0 20,0 8,0 9,0Audio Compact 16,6 0,2 2,9 13,3Audio HiFi 4,0 14,3 40,6 0,2 8,2 37,6 0,5 2,5 5,3Home movie systems 8,9 28,4 150,5 0,0 3,6 12,6Game/playstation consoles 40,0 5,2DVD players and recorders 4,2 17,0 73,4 0,0 4,8 32,4 0,0 1,5 8,5Electronic alarm clocks 0,9 2,6 5,0 0,8 2,3 4,8
Small chargers 1,6 4,0 6,8 0,3 1,5 3,0
* When the LED is still on, i.e. it is possible to use the remote to switch on. ** Technological stand-by, when the device is totally switched off (i.e. the power button is off)
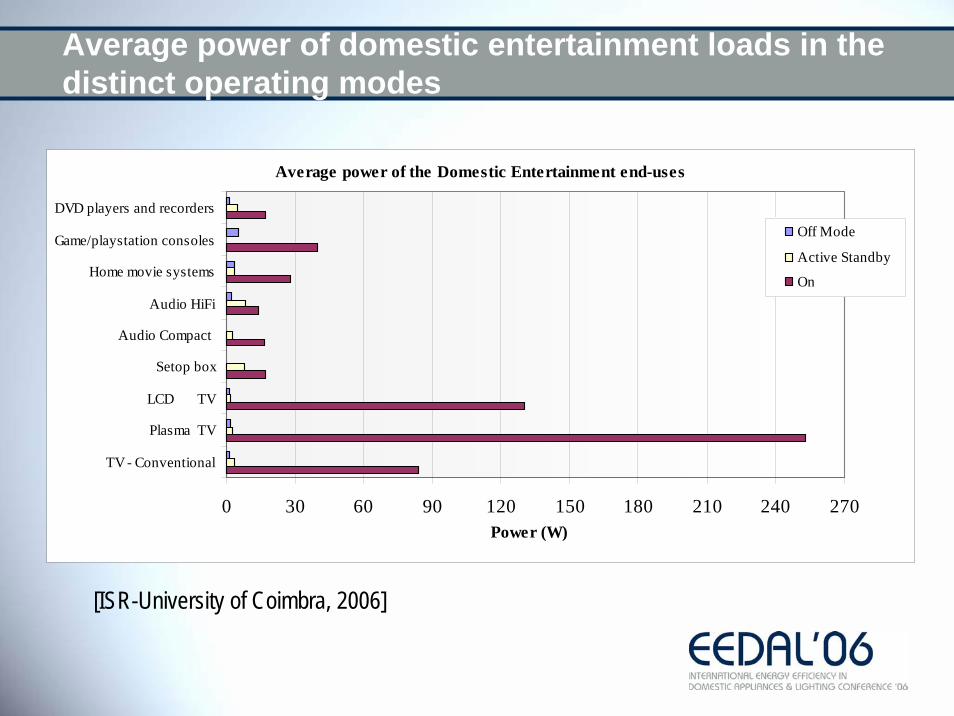
Average power of domestic entertainment loads in the distinct operating modes
[ISR-University of Coimbra, 2006]
Average power of the Domestic Entertainment end-uses
0 30 60 90 120 150 180 210 240 270
TV - Conventional
Plasma TV
LCD TV
Setop box
Audio Compact
Audio HiFi
Home movie systems
Game/playstation consoles
DVD players and recorders
Power (W)
Off Mode
Active Standby
On

Average Stand by power of domestic entertainment loads
[ISR-University of Coimbra, 2006]
Standby power of the Domestic Entertainment end-uses
0 2 4 6 8 10
TV - Conventional
Plasma TV
LCD TV
Setop box
Audio Compact
Audio HiFi
Home movie systems
Game/playstation consoles
DVD players and recorders
Power (W)
Off Mode
Active Standby
• Plasma TVs seem to be particularly energy intensive in normal operation. The variation of the normal operation consumption canrange from 100W to 450W.
• LCDs have a power consumption in normal operation of about 130 W (about half of plasmas) and the standby consumption in on average 2 W.
• The On consumption mode of home cinema systems with DVD players range from 9W to 150 W, depending on the brand and on the model. The Stand-by consumption mode can range from 0W to 24 W and the Off mode can range from 0W to 13 W.
Current situation: new domestic entertainment loads and other loads
Current situation: new domestic entertainment loads
• The stand by consumption of HiFi systems and setop boxes is high (8-9W), being the highest values in the list of end-uses;
• DVD players and recorders (with hardisk), have high standby consumption and stay in the stand by mode many hours per day.
• Setop boxes are predicted to replace conventional forms of satellite receiver. Typically a Setop box consumes 20W in the on-mode and 9W on the Standby mode (in which they spend 80% of the time).
Current situation: other electronic loads
• There is a large number of small electronic appliances in the home with external power supplies (mobile phones, laptops, cordless phones, etc) , which are usually left on the socket.
• It is estimated that these devices stay in the standby mode during 8600 hours. The average power input of these loads in the stand by mode can vary from 0,8W to 4,8W.
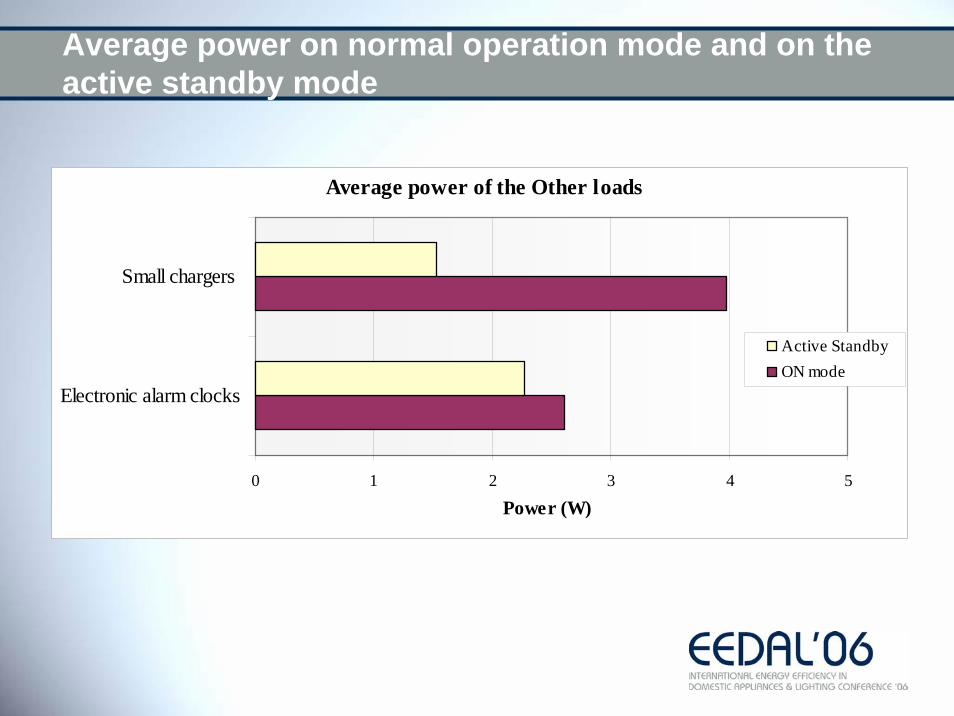
Average power on normal operation mode and on the active standby mode
Average power of the Other loads
0 1 2 3 4 5
Electronic alarm clocks
Small chargers
Power (W)
Active StandbyON mode
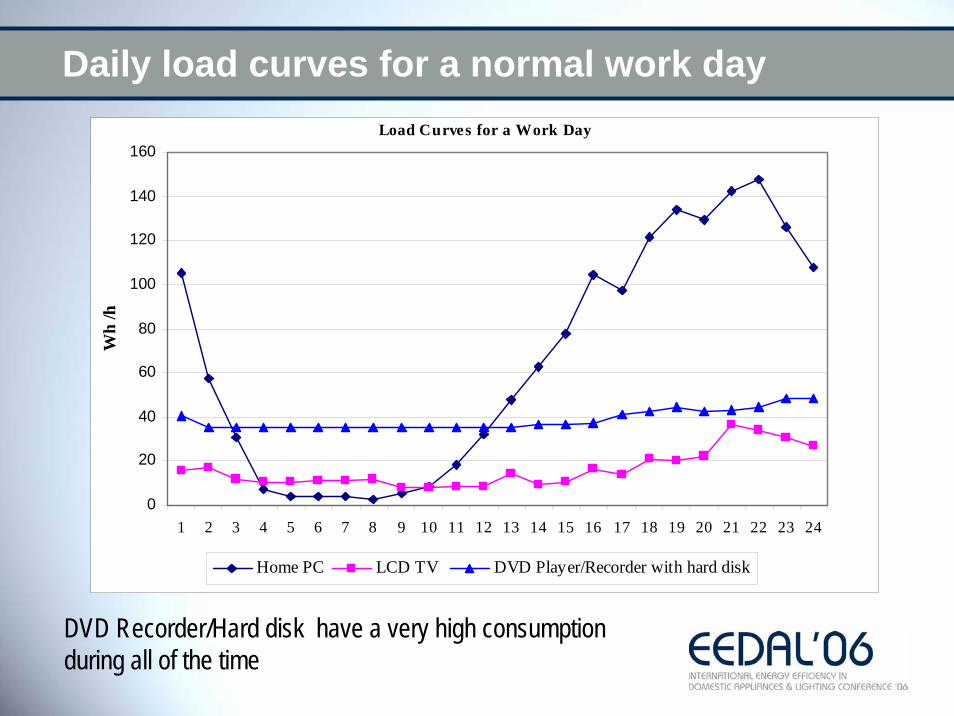
Daily load curves for a normal work dayLoad Curves for a Work Day
0
20
40
60
80
100
120
140
160
1 2 3 4 5 6 7 8 9 10 11 12 13 14 15 16 17 18 19 20 21 22 23 24
Wh
/h
Home PC LCD TV DVD Player/Recorder with hard disk
DVD Recorder/Hard disk have a very high consumption during all of the time
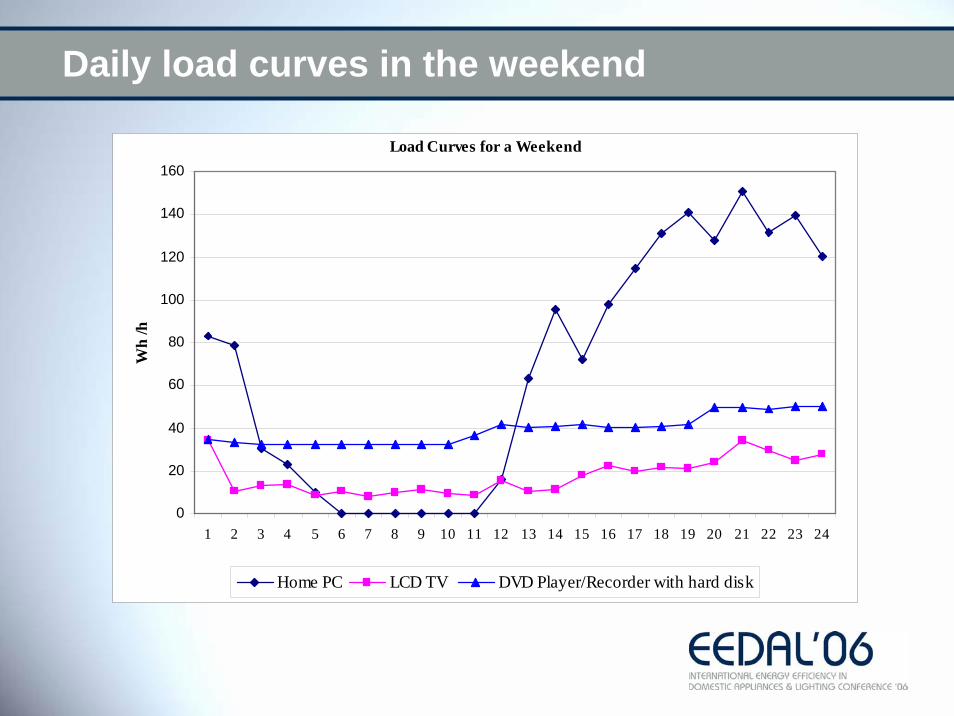
Daily load curves in the weekend
Load Curves for a Weekend
0
20
40
60
80
100
120
140
160
1 2 3 4 5 6 7 8 9 10 11 12 13 14 15 16 17 18 19 20 21 22 23 24
Wh
/h
Home PC LCD TV DVD Player/Recorder with hard disk

Conclusions
• availability of high quality data - essential condition for the definition of policy recommendations to influence through a combination of measures the energy efficiency of the equipment to be sold in the EU-25+2 in the next decade, as well as to influence the user behaviour in the selection and operation of that equipment
• electronic loads - key contributor to the power demand; a wide range of performance levels in the models available in the market exists.
• Available technology associated with responsible consumer behaviour, can dramatically reduce wasteful consumption of electronic loads.


![Expo historiaa yea yea [autoguardado]](https://img.pdfslide.net/doc/110x75/5595b9bd1a28ab35678b46a9/expo-historiaa-yea-yea-autoguardado.jpg)