Embed Size (px)
Citation preview
ANNUAL GENERAL MEETING10 OCTOBER 2013
1
MILTON CORPORATION LIMITED AN AUSTRALIAN LISTED INVESTMENT COMPANY
SINCE 1958
MILTON CORPORATION LIMITED AN AUSTRALIAN LISTED INVESTMENT COMPANY SINCE 1958
For
per
sona
l use
onl
y

DISCLAIMER
Milton Corporation Limited (“Milton”) has prepared this presentation.
The presentation (including views expressed by Milton’s directors) is made in good faith however, Milton does not warrant or represent that it is free from errors or omissions.
This presentation is intended as general information only and those to whom this presentation is made should seek independent financial advice that takes into account their financial circumstances when making an investment decision.
MILTON CORPORATION LIMITED AN AUSTRALIAN LISTED INVESTMENT COMPANY SINCE 1958 2
For
per
sona
l use
onl
y

NON EXECUTIVE DIRECTORS
• MR ROBERT MILLNER, Chairman
• MR JOHN CHURCH
• MR GRAEME CRAMPTON
• MR KEVIN ELEY
• DR IAN POLLARD
MILTON CORPORATION LIMITED AN AUSTRALIAN LISTED INVESTMENT COMPANY SINCE 1958 3
For
per
sona
l use
onl
y

EXECUTIVES
• MR FRANK GOOCH, Managing Director
• MR NISHANTHA SENEVIRATNE, Secretary
AUDITOR – MOORE STEPHENS SYDNEY
• MR JOE SHANNON, Partner
MILTON CORPORATION LIMITED AN AUSTRALIAN LISTED INVESTMENT COMPANY SINCE 1958 4
For
per
sona
l use
onl
y

OBJECTIVES
MILTON CORPORATION LIMITED AN AUSTRALIAN LISTED INVESTMENT COMPANY SINCE 1958
ü Diversified portfolio Investment portfolio $2.2 billionCash $0.1 billionOther assets $0.1 billion
ü Growing income stream Ordinary income 2013 $117.2 millionOrdinary income 2012 $112.2 millionSpecial invest inc. 2013 $ 2.7 million
ü Pay fully franked dividends 2013 2012Interim 39 38Final 43 40Total 82 78 Up 5.1%Special 2.5 -
ü Capital growth in the value of the shareholders’ investment
2013 2012NTA $19.45 $16.42Share price $18.40 $15.21
5
For
per
sona
l use
onl
y

INVESTMENT PORTFOLIO
Banks34%
Diversified financials
5%Materials
9%Consumer staples
10%
Commercial services
5%
Insurance5%
Energy7%
Telecommunication3%
Other shares22%
MILTON CORPORATION LIMITED AN AUSTRALIAN LISTED INVESTMENT COMPANY SINCE 1958 6
For
per
sona
l use
onl
y

OBJECTIVES
MILTON CORPORATION LIMITED AN AUSTRALIAN LISTED INVESTMENT COMPANY SINCE 1958
ü Diversified portfolio Investment portfolio $2.2 billionCash $0.1 billionOther assets $0.1 billion
ü Growing income stream Ordinary income 2013 $117.2 millionOrdinary income 2012 $112.3 millionSpecial invest inc. 2013 $ 2.7 million
ü Pay fully franked dividends 2013 2012Interim 39 38Final 43 40Total 82 78 Up 5.1%Special 2.5 -
ü Capital growth in the value of the shareholders’ investment
2013 2012NTA $19.45 $16.42Share price $18.40 $15.21
7
For
per
sona
l use
onl
y

OBJECTIVES
MILTON CORPORATION LIMITED AN AUSTRALIAN LISTED INVESTMENT COMPANY SINCE 1958
ü Diversified portfolio Investment portfolio $2.2 billionCash $0.1 billionOther assets $0.1 billion
ü Growing income stream Ordinary income 2013 $117.2 millionOrdinary income 2012 $112.3 millionSpecial invest inc. 2013 $ 2.7 million
ü Pay fully franked dividends 2013 2012Interim 39 38Final 43 40Total 82 78 Up 5.1%Special 2.5 -
ü Capital growth in the value of the shareholders’ investment
2013 2012NTA $19.45 $16.42Share price $18.40 $15.21Discount 5.4% 7.4%
8
For
per
sona
l use
onl
y

MILTON CORPORATION LIMITEDAN AUSTRALIAN LISTED INVESTMENT COMPANY SINCE 1958
82%
84%
86%
88%
90%
92%
94%
96%
98%
100%
0
20
40
60
80
100
120
Pay
out r
atio
Div
iden
ds $
mill
ion
Total Ordinary Dividend (LHS)Total Special dividendOrdinary dividend payout ratio (RHS)
MILTON DIVIDEND AND PAYOUT RATIO HISTORY
9
For
per
sona
l use
onl
y

MILTON CORPORATION LIMITED AN AUSTRALIAN LISTED INVESTMENT COMPANY SINCE 1958
DIVIDEND HISTORY
10
$0
$1,000
$2,000
$3,000
$4,000
$5,000
$6,000
Ordinary dividend Special dividend
All dividends fully franked since franking was introduced in 1987
For
per
sona
l use
onl
y

OBJECTIVES
MILTON CORPORATION LIMITED AN AUSTRALIAN LISTED INVESTMENT COMPANY SINCE 1958
ü Diversified portfolio Investment portfolio $2.2 billionCash $0.1 billionOther assets $0.1 billion
ü Growing income stream Ordinary income 2013 $117.2 millionOrdinary income 2012 $112.3 millionSpecial invest inc. 2013 $ 2.7 million
ü Pay fully franked dividends 2013 2012Interim 39 38Final 43 40Total 82 78 Up 5.1%Special 2.5 -
ü Capital growth in the value of the shareholders’ investment
2013 2012NTA $19.45 $16.42Share price $18.40 $15.21Discount 5.4% 7.4%
11
For
per
sona
l use
onl
y

SHARE PRICE v NTA
12
-
5.00
10.00
15.00
20.00
25.00
30.00
NTA
Share price
Premium Discount
MILTON CORPORATION LIMITED AN AUSTRALIAN LISTED INVESTMENT COMPANY SINCE 1958
For
per
sona
l use
onl
y

-15.0%
-10.0%
-5.0%
0.0%
5.0%
10.0%
15.0%
Discount increasing post GFC
Discount reducing
MILTON CORPORATION LIMITED AN AUSTRALIAN LISTED INVESTMENT COMPANY SINCE 1958
PREMIUM / (DISCOUNT)
13
For
per
sona
l use
onl
y
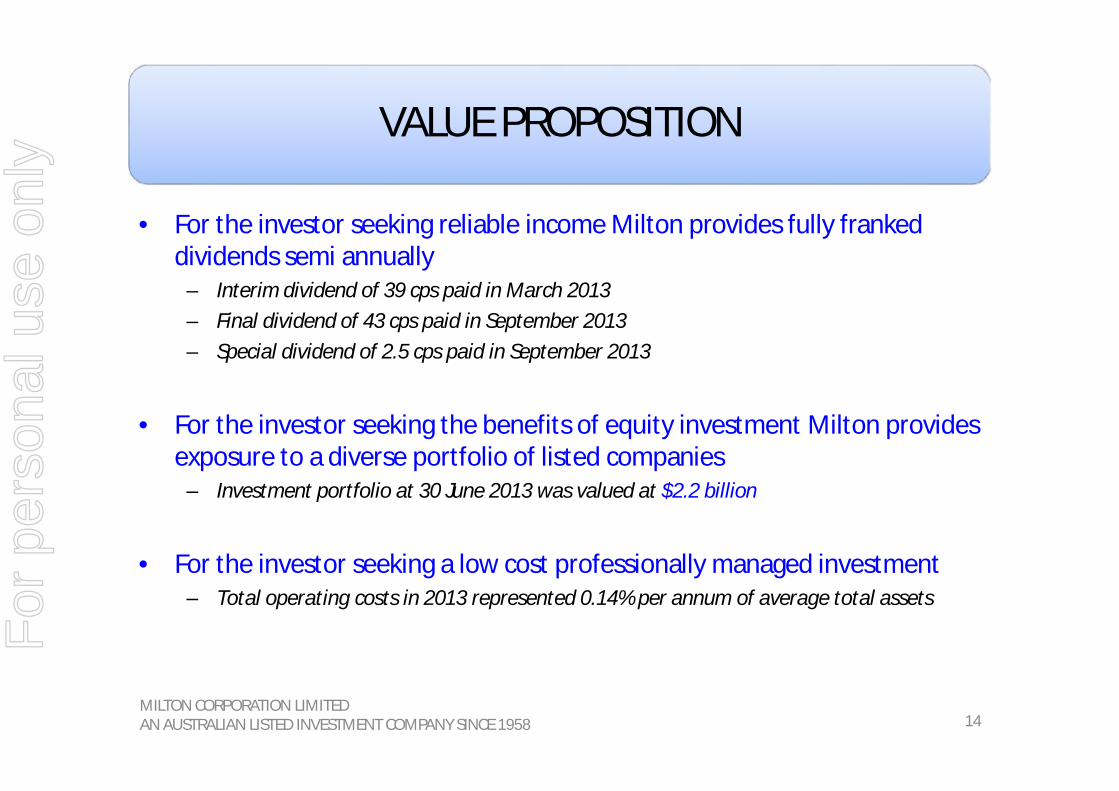
VALUE PROPOSITION
• For the investor seeking reliable income Milton provides fully franked dividends semi annually
– Interim dividend of 39 cps paid in March 2013– Final dividend of 43 cps paid in September 2013– Special dividend of 2.5 cps paid in September 2013
• For the investor seeking the benefits of equity investment Milton provides exposure to a diverse portfolio of listed companies
– Investment portfolio at 30 June 2013 was valued at $2.2 billion
• For the investor seeking a low cost professionally managed investment – Total operating costs in 2013 represented 0.14% per annum of average total assets
MILTON CORPORATION LIMITED AN AUSTRALIAN LISTED INVESTMENT COMPANY SINCE 1958 14
For
per
sona
l use
onl
y

MOVEMENT IN INVESTMENTS
MILTON CORPORATION LIMITED AN AUSTRALIAN LISTED INVESTMENT COMPANY SINCE 1958
Balance at 30 June 2012 1,825.3
Investments from company acquisition in February 13 10.7
Purchases 33.4
Disposals (18.1)
Revaluation of investments due to market movements 351.2
Balance at 30 June 2013 2,202.5
Total Portfolio Return (TPR) 23.6%
Accumulation return of the All Ordinaries Index 20.7%
15
For
per
sona
l use
onl
y

OUTLOOK
• Underlying operating profit for 3 months to 30 September 13 ahead of that of 2012
• Interim dividend of 39 cps should at least be maintained
MILTON CORPORATION LIMITED AN AUSTRALIAN LISTED INVESTMENT COMPANY SINCE 1958 16
For
per
sona
l use
onl
y

FRANK GOOCH
MANAGING DIRECTOR
MILTON CORPORATION LIMITED AN AUSTRALIAN LISTED INVESTMENT COMPANY SINCE 1958 17
For
per
sona
l use
onl
y

UNDERLYING PROFIT
2013$ million
2012$ million
Ordinary investment income 105.8 100.9
Net liquidity income 5.6 7.2
JV profits 5.0 3.7
Other income 0.7 0.5
Ordinary income from operations 117.1 112.3
Operating expenses (3.2) (3.2)
Tax expense (5.5) (6.4)
Underlying profit 108.4 102.7
MILTON CORPORATION LIMITED AN AUSTRALIAN LISTED INVESTMENT COMPANY SINCE 1958 18
For
per
sona
l use
onl
y

MILTON CORPORATION LIMITED AN AUSTRALIAN LISTED INVESTMENT COMPANY SINCE 1958 19
For
per
sona
l use
onl
y

UNDERLYING PROFIT
2013$ million
2012$ million
Ordinary investment income 105.8 100.9
Net liquidity income 5.6 7.2
JV profits 5.0 3.7
Other income 0.7 0.5
Ordinary income from operations 117.1 112.3
Operating expenses (3.2) (3.2)
Tax expense (5.5) (6.4)
Underlying profit 108.4 102.7
MILTON CORPORATION LIMITED AN AUSTRALIAN LISTED INVESTMENT COMPANY SINCE 1958 20
For
per
sona
l use
onl
y

0%
1%
2%
3%
4%
5%
6%
7%
8%
9%
-30% -20% -10% 0% 10% 20% 30% 40% 50%
Yiel
d
Revaluation
High yield
Low yield
MILTON CORPORATION LIMITED AN AUSTRALIAN LISTED INVESTMENT COMPANY SINCE 1958 21
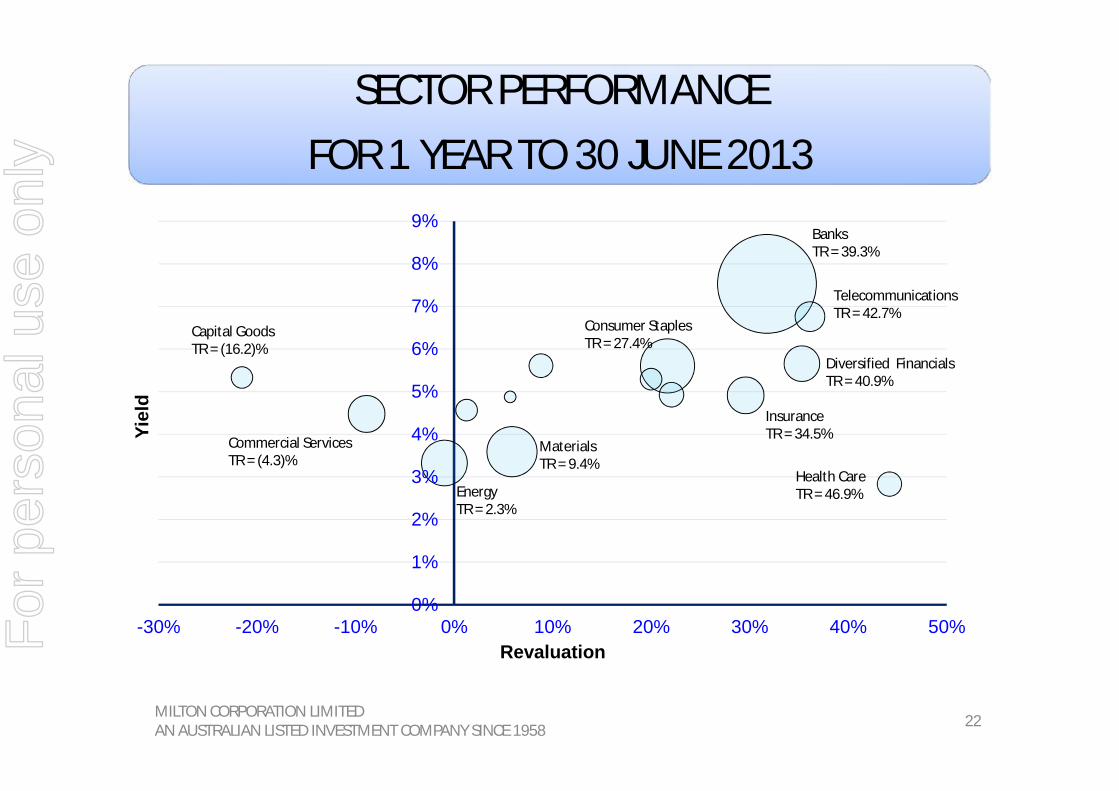
SECTOR PERFORMANCEFOR 1 YEAR TO 30 JUNE 2013
For
per
sona
l use
onl
y
0%
1%
2%
3%
4%
5%
6%
7%
8%
9%
-30% -20% -10% 0% 10% 20% 30% 40% 50%
Yiel
d
Revaluation
Banks TR = 39.3%
TelecommunicationsTR = 42.7%
Diversified FinancialsTR = 40.9%
InsuranceTR = 34.5%
Health CareTR = 46.9%
Capital GoodsTR = (16.2)%
Commercial ServicesTR = (4.3)%
MaterialsTR = 9.4%
EnergyTR = 2.3%
Consumer StaplesTR = 27.4%
MILTON CORPORATION LIMITED AN AUSTRALIAN LISTED INVESTMENT COMPANY SINCE 1958 22
SECTOR PERFORMANCEFOR 1 YEAR TO 30 JUNE 2013
For
per
sona
l use
onl
y

0%
1%
2%
3%
4%
5%
6%
7%
8%
9%
-30% -20% -10% 0% 10% 20% 30% 40% 50%
Yiel
d
Revaluation
Banks Value $845millionRevaluation 32%Yield 7%
MILTON CORPORATION LIMITED AN AUSTRALIAN LISTED INVESTMENT COMPANY SINCE 1958 23
SECTOR PERFORMANCEFOR 1 YEAR TO 30 JUNE 2013
For
per
sona
l use
onl
y

0%
1%
2%
3%
4%
5%
6%
7%
8%
9%
-30% -20% -10% 0% 10% 20% 30% 40% 50%
Yiel
d
Revaluation
TelecomsValue $76millionRevaluation 36%Yield 7%
MILTON CORPORATION LIMITED AN AUSTRALIAN LISTED INVESTMENT COMPANY SINCE 1958 24
SECTOR PERFORMANCEFOR 1 YEAR TO 30 JUNE 2013
For
per
sona
l use
onl
y

0%
1%
2%
3%
4%
5%
6%
7%
8%
9%
-30% -20% -10% 0% 10% 20% 30% 40% 50%
Yiel
d
Revaluation
Diversified Fins.Value $110millionRevaluation 35%Yield 5.6%
MILTON CORPORATION LIMITED AN AUSTRALIAN LISTED INVESTMENT COMPANY SINCE 1958 25
SECTOR PERFORMANCEFOR 1 YEAR TO 30 JUNE 2013
For
per
sona
l use
onl
y

0%
1%
2%
3%
4%
5%
6%
7%
8%
9%
-30% -20% -10% 0% 10% 20% 30% 40% 50%
Yiel
d
Revaluation
HealthcareValue $51millionRevaluation 44%Yield 3%
MILTON CORPORATION LIMITED AN AUSTRALIAN LISTED INVESTMENT COMPANY SINCE 1958 26
SECTOR PERFORMANCEFOR 1 YEAR TO 30 JUNE 2013
For
per
sona
l use
onl
y

0%
1%
2%
3%
4%
5%
6%
7%
8%
9%
-30% -20% -10% 0% 10% 20% 30% 40% 50%
Yiel
d
Revaluation
MaterialsValue $217millionRevaluation 5.8%Yield 3.6%
MILTON CORPORATION LIMITED AN AUSTRALIAN LISTED INVESTMENT COMPANY SINCE 1958 27
SECTOR PERFORMANCEFOR 1 YEAR TO 30 JUNE 2013
For
per
sona
l use
onl
y

0%
1%
2%
3%
4%
5%
6%
7%
8%
9%
-30% -20% -10% 0% 10% 20% 30% 40% 50%
Yiel
d
Revaluation
Capital GoodsValue $40millionRevaluation (21.6%)Yield 5.4%
MILTON CORPORATION LIMITED AN AUSTRALIAN LISTED INVESTMENT COMPANY SINCE 1958 28
SECTOR PERFORMANCEFOR 1 YEAR TO 30 JUNE 2013
For
per
sona
l use
onl
y

0%
1%
2%
3%
4%
5%
6%
7%
8%
9%
-30% -20% -10% 0% 10% 20% 30% 40% 50%
Yiel
d
Revaluation
Commercial ServicesValue $118millionRevaluation (8.8%)Yield 4.5%
MILTON CORPORATION LIMITED AN AUSTRALIAN LISTED INVESTMENT COMPANY SINCE 1958 29
SECTOR PERFORMANCEFOR 1 YEAR TO 30 JUNE 2013
For
per
sona
l use
onl
y

PORTFOLIO MOVEMENTS
MILTON CORPORATION LIMITED AN AUSTRALIAN LISTED INVESTMENT COMPANY SINCE 1958
Additions = $44million
Unlisted investment company = $10.7 millionPurchases = $33.4 million
Disposals = $18million
Larger disposals:• Hills Industries• Cabcharge• Alumina• Consolidated Media• CFS Retail Trust• Charter Hall Office
Trust
Larger purchases:• A P Eagers• ASX• Automotive Holdings Group• IOOF Holdings• McMillan Shakespeare• Tatts Group• Telstra• Westfield Group
30
For
per
sona
l use
onl
y

McMILLAN SHAKESPEARE GROUP
MILTON CORPORATION LIMITED AN AUSTRALIAN LISTED INVESTMENT COMPANY SINCE 1958 31
For
per
sona
l use
onl
y

VALUE PROPOSITION
• For the investor seeking reliable income Milton provides fully franked dividends semi annually
– Interim dividend of 39 cps paid in March 2013– Final dividend of 43 cps paid in September 2013– Special dividend of 2.5 cps paid in September 2013
• For the investor seeking the benefits of equity investment Milton provides exposure to a diverse portfolio of listed companies
– Investment portfolio at 30 June 2013 was valued at $2.2 billion
• For the investor seeking a low cost professionally managed investment – Total operating costs in 2013 represented 0.14% per annum of average total assets
MILTON CORPORATION LIMITED AN AUSTRALIAN LISTED INVESTMENT COMPANY SINCE 1958 32
For
per
sona
l use
onl
y

MILTON CORPORATION LIMITED AN AUSTRALIAN LISTED INVESTMENT COMPANY SINCE 1958 33
SEPTEMBER 2013 NTA
For
per
sona
l use
onl
y

ANNUAL GENERAL MEETING10 OCTOBER 2013
34
MILTON CORPORATION LIMITED AN AUSTRALIAN LISTED INVESTMENT COMPANY
SINCE 1958
MILTON CORPORATION LIMITED AN AUSTRALIAN LISTED INVESTMENT COMPANY SINCE 1958
For
per
sona
l use
onl
y