Embed Size (px)
Citation preview

VANCOUVER 2015
1 | P a g e
MINE TO MILL OPTMISATION AT PADDINGTON GOLD OPERATIONS
*S.S. Kanchibotla1, T.G. Vizcarra1, S.A.R. Musunuri1, S. Tello1, A. Hayes2 and T. Moylan2
1JKTech Pty Ltd 40 Isles Road
Indooroopilly, QLD Australia 4068 (Corresponding author: [email protected])
2Norton Gold Fields Limited
Level 36, Exchange Plaza 2, The Esplanade Perth,WA 6000
VANCOUVER 2015
2 | P a g e
MINE TO MILL OPTMISATION AT PADDINGTON GOLD OPERATIONS
ABSTRACT
Blasting plays a major role in the fragmentation of rock in open pit mining, which is then crushed and processed before the final product is obtained. Tailoring the blasting method to suit rock mass characteristics can lead to significant improvements downstream. Mine to Mill is a methodology developed at the JKMRC, University of Queensland, which takes a holistic approach to optimising mining operations by characterising the rock mass to be blasted and improving the fragmentation of rock upfront using optimised blasting methods as a means of improving mill throughput and reducing specific energy consumption. This paper provides a case study of the implementation of Mine to Mill at Norton Gold Fields’ Paddington operation, where the use of optimised blast designs resulted in a significant increase in mill throughput and a reduction in specific energy.
KEYWORDS Mine to mill, blast optimisation, ore characterization
MINE TO MILL - METHODOLOGY In most metal mining operations, in-situ ore is separated from waste rock and is subjected to a
series of breakage and separation processes to produce a valuable product. The profitability of an operation largely depends on how efficiently the in-situ rock (ore and waste) is converted into the final product (operating cost) and how much value (price) it commands in the market. Breakage of in-situ rock generally takes place in three stages:
• Blasting to prepare the ore for excavation, transportation and subsequent crushing and grinding • Primary crushing to improve its handling characteristics and to prepare the ore for subsequent size
reduction • Grinding in semi-autogenous (SAG) or autogenous (AG) mills followed by ball mills and sometimes
fine grinding mills. Alternatively, further crushing in either crushing and screening circuits or high pressure grinding rolls (HPGR) followed by ball mills and sometimes fine grinding mills
Separation of waste and ore takes place at both the mine and at the mill. It starts at the mine,
where the strip ratio (waste:ore) determines the amount of waste that needs to be removed in order to expose the ore. Generally, good stable walls resulting from careful blasting can permit steeper walls.
In many mines, especially in narrow vein ore bodies, ore and waste are blasted together, during
which the rock mass within the blast volume is fractured and displaced. Dilution can occur if ore and waste are mixed or if the waste is mis-classified as ore and sent to the mill for further processing. Similarly, ore loss can occur if the ore is mis-classfied as waste and sent to waste dumps.
At the mill, separation of ore and waste takes place in different stages depending on the
mineralogical characteristics of the ore. A number of factors determine the recovery of the valuable minerals in the subsequent processes following the size reduction stage. One of the key factors is the final grind size of the product that is fed to the separation stage (such as flotation and/or leaching).
Despite the fact that breakage and separation are interdependent and takes place at both the mine
and mill, each process is optimised independently without considering the impact of one on the other. This
VANCOUVER 2015
3 | P a g e
practice is common in many operations because mining and milling are managed as separate cost centres each trying to minimize their unit costs. Research at the JKMRC has challenged this silo based optimisation and developed a holistic methodology, “Mine to Mill Optimisation”, to improve the overall efficiency of mining operations. A number of case studies have clearly demonstrated 10-20% improvement in mill throughputs and better mine to mill reconciliation indicating lower dilution levels (Gaunt et al. 2015, Kanchibotla 2013, Rogers and Kanchibotla 2013, Engmann et al. 2012).
A general perception of mill optimization is simply increasing blasting energy to produce finer
fragmentation. However, this may not be applicable in all cases because indiscriminate increase of blast energy can increase ore loss, dilution and damage, negating all the benefits of finer fragmentation. Therefore, proper optimization of the mine to mill value chain requires an understanding of the leverage of each process on overall value chain efficiency and then using that leverage to maximize the overall profitability of the operation rather than individual processes.
BACKGROUND ON PADDINGTON GOLD OPERATIONS
In 2011, Norton Gold Fields Ltd realised that the Paddington mill was expected to treat a
significant portion of fresh ore from the Navajo Chief open pit. This fresh ore from Navajo Chief was harder compared to the then blend of altered ore and was expected to have a negative impact on mill performance unless remedial measures were implemented. As a result, JKTech was requested to implement a project to optimise the D&B process in the fresh ore within the Navajo Chief open pit to maximise the throughput of Paddington mill. An additional objective was to assess the risk of blast induced ore loss and dilution. The project started in August 2011 with a mine to mill process review and was implemented over a period of 12 months in a systematic and staged manner. The stages involved initial baseline trials, modelling and simulations and finally implementing the recommendations and quantifying benefits.
BASELINE TRIALS
During this phase, two baseline blasts were conducted in August 2011 in the fresh ore zone of the Navajo Chief deposit. These blasts were conducted on 5 m benches with the then current design parameters listed in Table 1 below. These blasts were fired using a ‘V’ initiation pattern, with 25 ms inter-hole and 42 ms inter-row delays using single primers.
Table 1 - Blast design parameters used for baseline trials
Blast ID 315310-11 (TB1) 310305-03 (TB2)
Bench Height (m) 5 5 Burden x Spacing (m) 3 x 3.5 3 x 3.5 Blasthole Dia. (mm) 115 115 Stemming (m) 2.3 2.3 m Sub Drill (m) 0.5 0.5 Explosive Type Titan 3080G Titan 3080G Density (g/cc) 1.15 1.15 Blast Tonnes 32,149 37,237
Design implementation of each blast was carefully monitored to benchmark QA/QC standards.
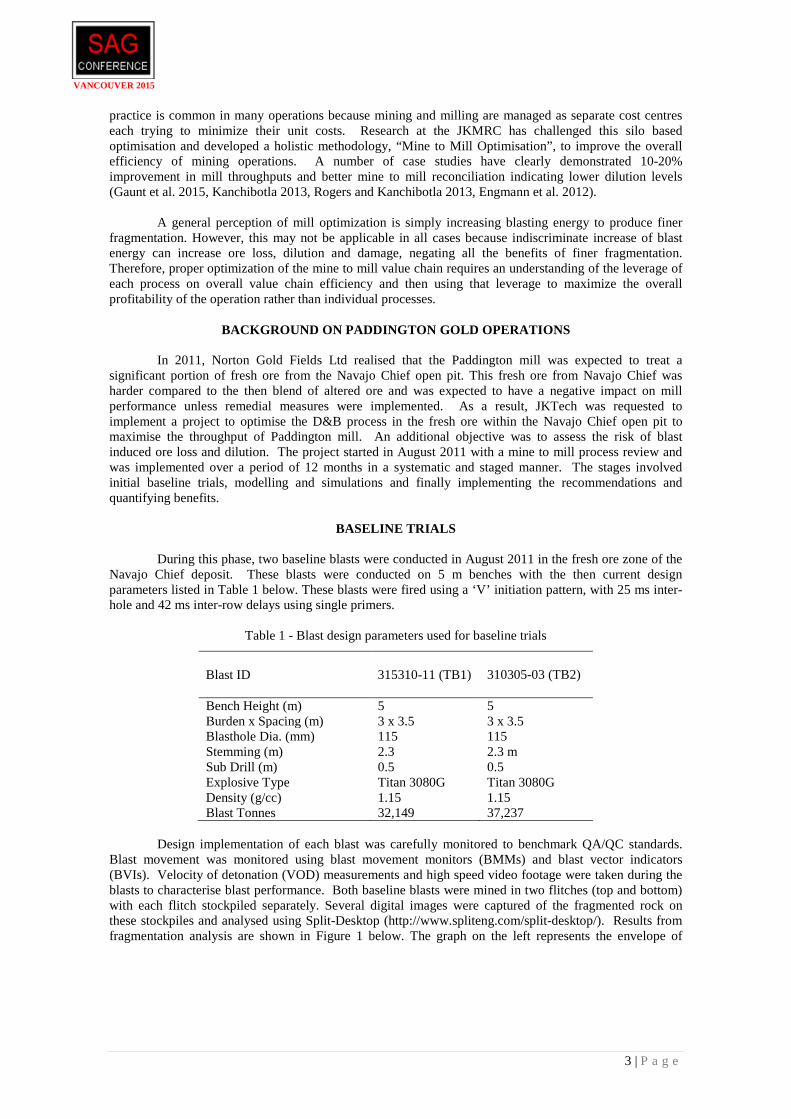
Blast movement was monitored using blast movement monitors (BMMs) and blast vector indicators (BVIs). Velocity of detonation (VOD) measurements and high speed video footage were taken during the blasts to characterise blast performance. Both baseline blasts were mined in two flitches (top and bottom) with each flitch stockpiled separately. Several digital images were captured of the fragmented rock on these stockpiles and analysed using Split-Desktop (http://www.spliteng.com/split-desktop/). Results from fragmentation analysis are shown in Figure 1 below. The graph on the left represents the envelope of
VANCOUVER 2015
4 | P a g e
particle size distributions for the first baseline blast (TB1) and the one on the right shows the second baseline blast (TB2). It can also be seen from these graphs that the average particle size distribution (PSD) of the top flitch (TF) was coarser than the bottom flitch (BF) (solid black lines compared to solid red lines in Figure 1 which was to be expected due to the greater concentration of explosive energy at the bottom of the blast hole. Also, there is a large overlap between the PSDs of top and bottom flitches which is shown by the shaded region in the figure below.
Figure 1 - ROM size distributions of bottom and top flitches in the baseline trials Ore from the baseline blasts was campaigned through the SAG mill for 3 days, during which plant
surveys were executed and samples of key streams obtained, including belt cut samples of the SAG mill feed. The Paddington comminution circuit is a conventional SABC circuit consisting of a 24 ft. diameter SAG mill (3.8 MW) and a 15 ft. diameter ball mill (3.5 MW). Cyclone overflow (O/F) is sent downstream for gold leaching. Following sampling, the SAG mill was crash stopped and the total load measured. The SAG mill ball load was also measured following a grind out after the first survey.
The circuit throughput during Survey 1 was 307 tph. During Survey 2, throughput was lower at
278 tph despite the feed originating from the bottom flitch. A possible explanation for this was the large overlap between the top and bottom flitch size distribution envelopes, as shown in Figure 1. Furthermore, the mass of blasted material totalled approximately 70,000 t and therefore the surveys provided only a snapshot of circuit performance while processing about 1% of the blasted ore. The lower throughput and a more dilute cyclone feed density were thought to be contributing factors to the finer P80 during the second survey. Table 2 summarises circuit performance during the surveys.
VANCOUVER 2015
5 | P a g e
Table 2 - Baseline circuit performance
Unit Parameter Survey 1 (Top Flitch) Survey 2 (Bottom Flitch)
SAG mill
Throughput (tph) 307 278 F80 (mm) 92.6 93.8 Power (kW) 3735 3683 Recycle rate (%) 22 23 % solids 66 66 Total load (%) 29.1 32.8 Ball load (%) 11.1 11.1
Pebble crusher Power (kW) 41 39 CSS (mm) 24 11
Ball mill Power (kW) 3538 3537 Ball load (%) 35 35 Recirculating load (%) 278 387
Cyclones
Pressure (kPa) 161 155 Water recovery (%) 55 45 Feed density (% solids) 66% 61% Circuit P80 (µm) 103 61
Total Power (kW) 7314 7259 kWh/t 23.8 26.1
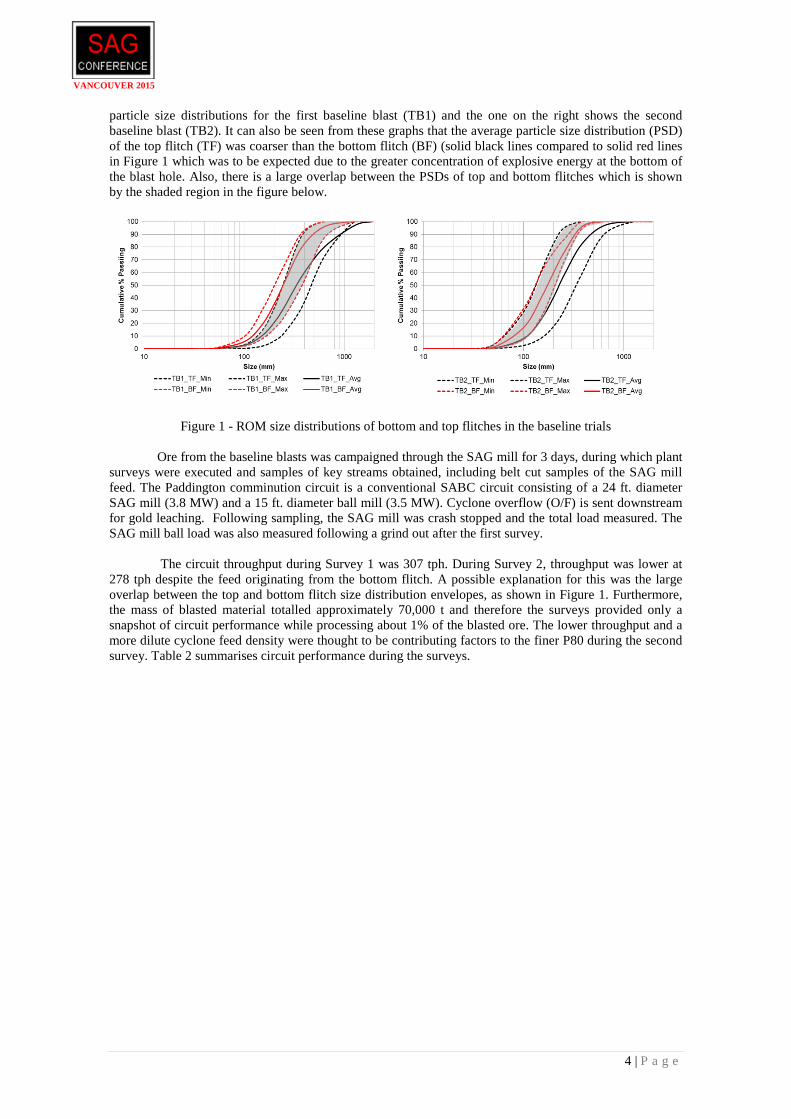
ORE CHARACTERISTICS AT THE NAVAJO CHIEF DEPOSIT The Navajo Chief deposit is hosted within a sequence of fine to coarse grained clastic sediments
comprising of siltstones, greywackes and sandstones, intruded locally by felsic porphyry. Mineralisation is associated with albite-silica-carbonate-sericite-pyrite alteration around quartz-pyrite vein arrays (sourced from: www.nortongoldfields.com.au, 2012). Mineralisation plunges shallowly to the south and remains open down-plunge at depth and along strike as shown in Figure 2 below (sourced from: www.nortongoldfields.com.au, 2012).
Figure 2 - Navajo Chief Gold deposit (www.nortongoldfields.com.au, 2012) The properties of the rock mass are of fundamental importance to blast design. It is widely
understood that blasting loosens the existing rock mass structure to liberate in-situ blocks as well as creating new fractures within the intact material. The in-situ block size distribution therefore has a great effect on fragmentation and blasting performance. Scan line mapping results indicated that the in-situ block
VANCOUVER 2015
6 | P a g e
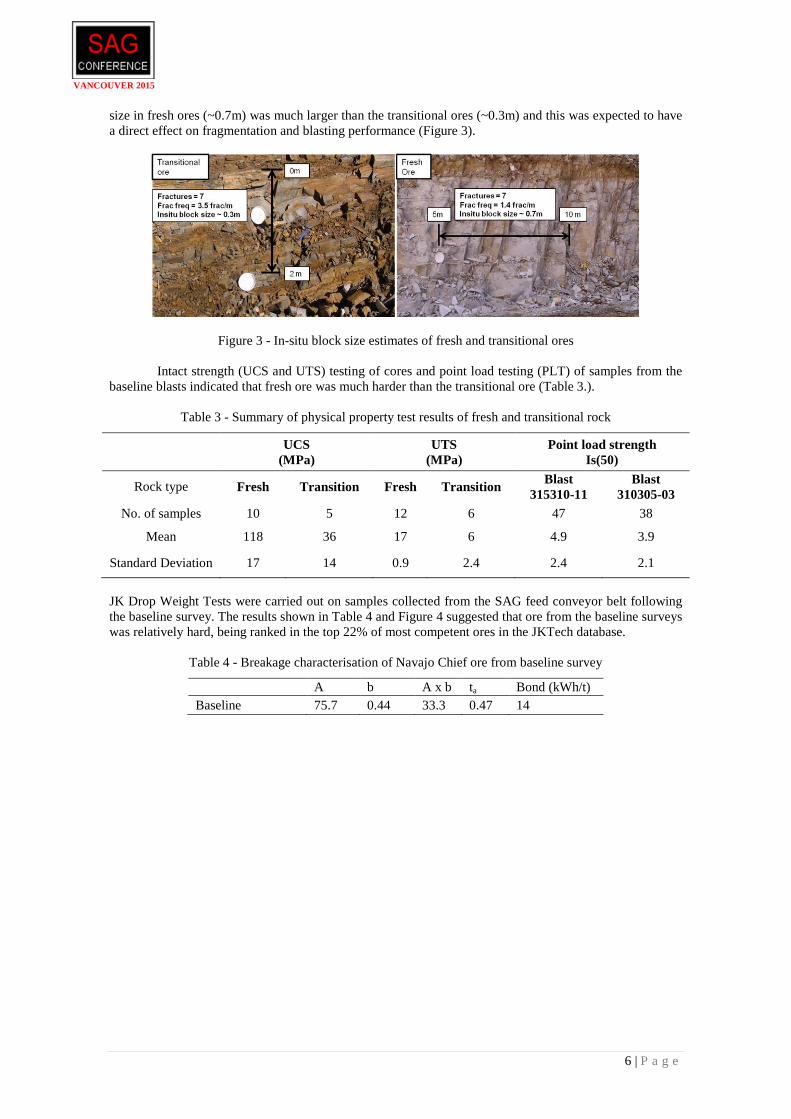
size in fresh ores (~0.7m) was much larger than the transitional ores (~0.3m) and this was expected to have a direct effect on fragmentation and blasting performance (Figure 3).
Figure 3 - In-situ block size estimates of fresh and transitional ores Intact strength (UCS and UTS) testing of cores and point load testing (PLT) of samples from the
baseline blasts indicated that fresh ore was much harder than the transitional ore (Table 3.).
Table 3 - Summary of physical property test results of fresh and transitional rock
UCS (MPa)
UTS (MPa)
Point load strength Is(50)
Rock type Fresh Transition Fresh Transition Blast 315310-11
Blast 310305-03
No. of samples 10 5 12 6 47 38
Mean 118 36 17 6 4.9 3.9
Standard Deviation 17 14 0.9 2.4 2.4 2.1
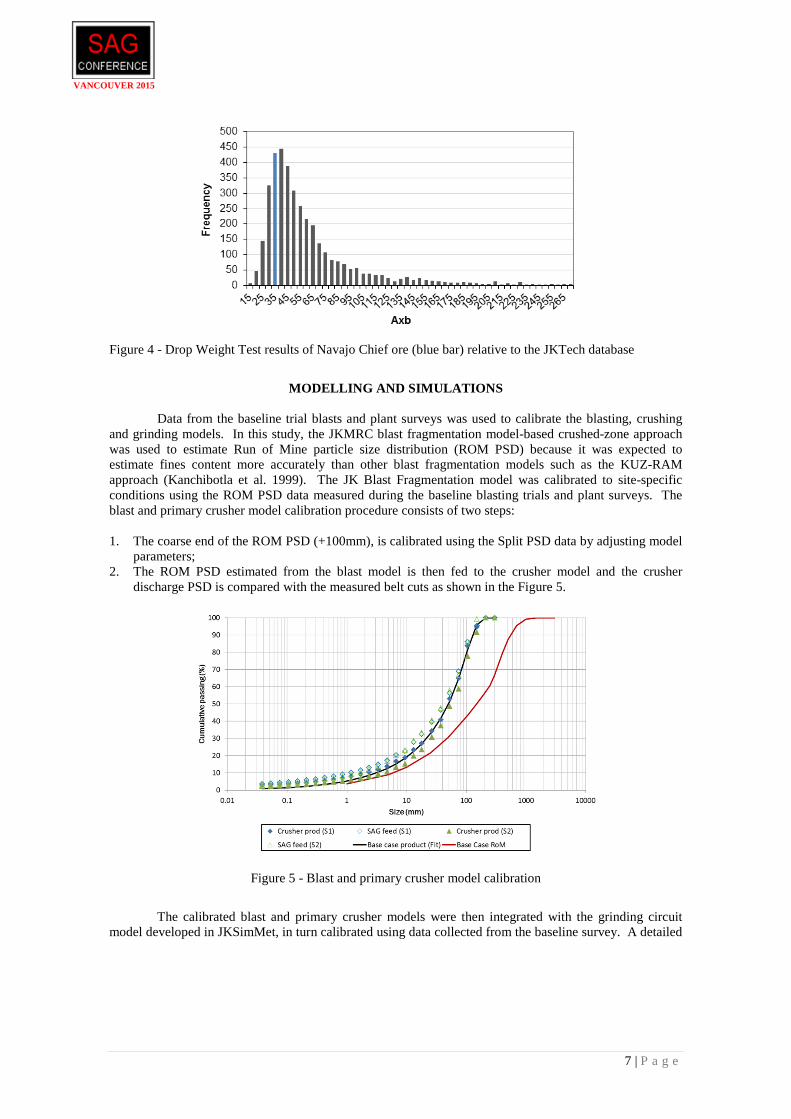
JK Drop Weight Tests were carried out on samples collected from the SAG feed conveyor belt following the baseline survey. The results shown in Table 4 and Figure 4 suggested that ore from the baseline surveys was relatively hard, being ranked in the top 22% of most competent ores in the JKTech database.
Table 4 - Breakage characterisation of Navajo Chief ore from baseline survey
A b A x b ta Bond (kWh/t) Baseline 75.7 0.44 33.3 0.47 14
VANCOUVER 2015
7 | P a g e
Figure 4 - Drop Weight Test results of Navajo Chief ore (blue bar) relative to the JKTech database
MODELLING AND SIMULATIONS
Data from the baseline trial blasts and plant surveys was used to calibrate the blasting, crushing
and grinding models. In this study, the JKMRC blast fragmentation model-based crushed-zone approach was used to estimate Run of Mine particle size distribution (ROM PSD) because it was expected to estimate fines content more accurately than other blast fragmentation models such as the KUZ-RAM approach (Kanchibotla et al. 1999). The JK Blast Fragmentation model was calibrated to site-specific conditions using the ROM PSD data measured during the baseline blasting trials and plant surveys. The blast and primary crusher model calibration procedure consists of two steps:
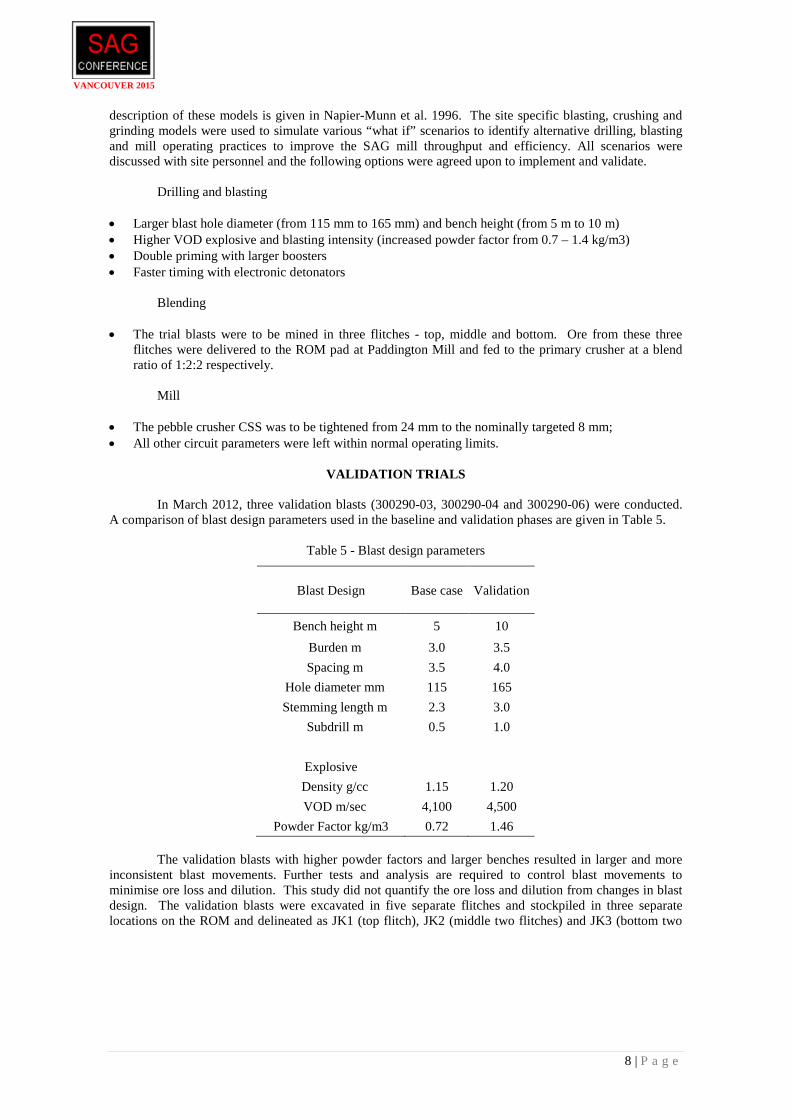
1. The coarse end of the ROM PSD (+100mm), is calibrated using the Split PSD data by adjusting model
parameters; 2. The ROM PSD estimated from the blast model is then fed to the crusher model and the crusher
discharge PSD is compared with the measured belt cuts as shown in the Figure 5.
Figure 5 - Blast and primary crusher model calibration
The calibrated blast and primary crusher models were then integrated with the grinding circuit
model developed in JKSimMet, in turn calibrated using data collected from the baseline survey. A detailed
VANCOUVER 2015
8 | P a g e
description of these models is given in Napier-Munn et al. 1996. The site specific blasting, crushing and grinding models were used to simulate various “what if” scenarios to identify alternative drilling, blasting and mill operating practices to improve the SAG mill throughput and efficiency. All scenarios were discussed with site personnel and the following options were agreed upon to implement and validate.
Drilling and blasting
• Larger blast hole diameter (from 115 mm to 165 mm) and bench height (from 5 m to 10 m) • Higher VOD explosive and blasting intensity (increased powder factor from 0.7 – 1.4 kg/m3) • Double priming with larger boosters • Faster timing with electronic detonators
Blending • The trial blasts were to be mined in three flitches - top, middle and bottom. Ore from these three
flitches were delivered to the ROM pad at Paddington Mill and fed to the primary crusher at a blend ratio of 1:2:2 respectively.
Mill
• The pebble crusher CSS was to be tightened from 24 mm to the nominally targeted 8 mm; • All other circuit parameters were left within normal operating limits.
VALIDATION TRIALS
In March 2012, three validation blasts (300290-03, 300290-04 and 300290-06) were conducted.
A comparison of blast design parameters used in the baseline and validation phases are given in Table 5.
Table 5 - Blast design parameters
Blast Design
Base case Validation
Bench height m 5 10 Burden m 3.0 3.5 Spacing m 3.5 4.0
Hole diameter mm 115 165 Stemming length m 2.3 3.0
Subdrill m 0.5 1.0
Explosive Density g/cc 1.15 1.20 VOD m/sec 4,100 4,500
Powder Factor kg/m3 0.72 1.46 The validation blasts with higher powder factors and larger benches resulted in larger and more
inconsistent blast movements. Further tests and analysis are required to control blast movements to minimise ore loss and dilution. This study did not quantify the ore loss and dilution from changes in blast design. The validation blasts were excavated in five separate flitches and stockpiled in three separate locations on the ROM and delineated as JK1 (top flitch), JK2 (middle two flitches) and JK3 (bottom two
VANCOUVER 2015
9 | P a g e
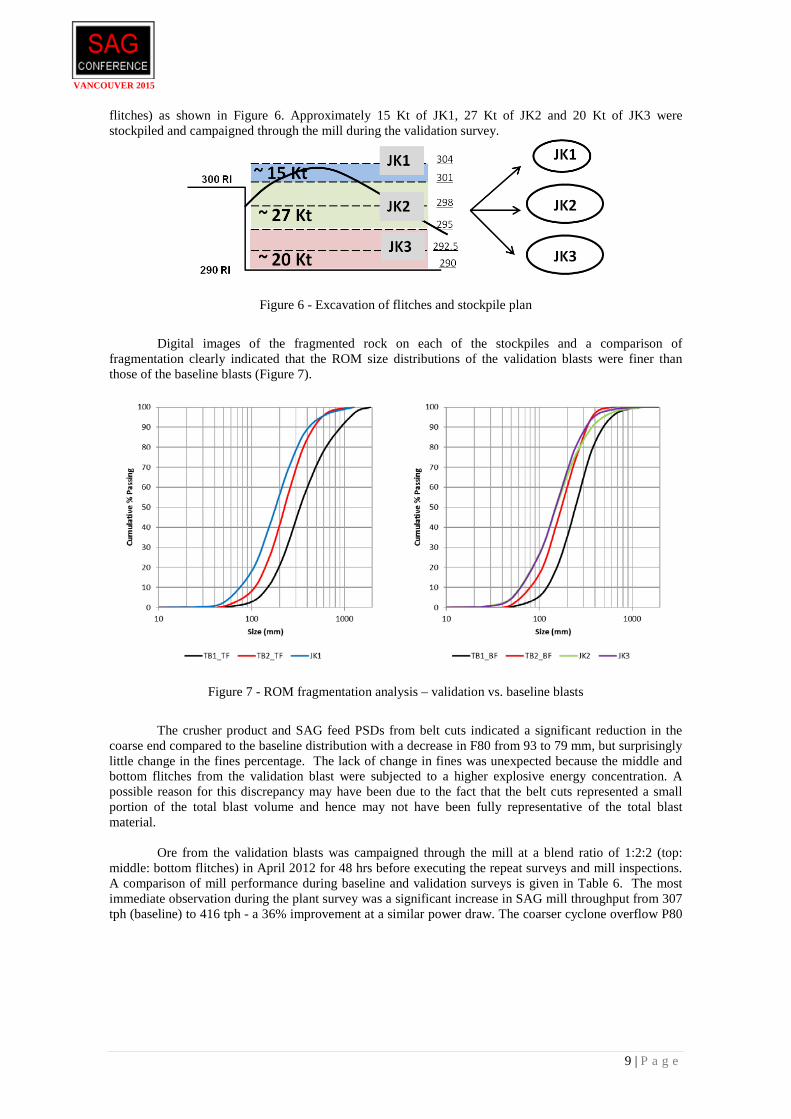
flitches) as shown in Figure 6. Approximately 15 Kt of JK1, 27 Kt of JK2 and 20 Kt of JK3 were stockpiled and campaigned through the mill during the validation survey.
Figure 6 - Excavation of flitches and stockpile plan
Digital images of the fragmented rock on each of the stockpiles and a comparison of
fragmentation clearly indicated that the ROM size distributions of the validation blasts were finer than those of the baseline blasts (Figure 7).
Figure 7 - ROM fragmentation analysis – validation vs. baseline blasts
The crusher product and SAG feed PSDs from belt cuts indicated a significant reduction in the
coarse end compared to the baseline distribution with a decrease in F80 from 93 to 79 mm, but surprisingly little change in the fines percentage. The lack of change in fines was unexpected because the middle and bottom flitches from the validation blast were subjected to a higher explosive energy concentration. A possible reason for this discrepancy may have been due to the fact that the belt cuts represented a small portion of the total blast volume and hence may not have been fully representative of the total blast material.
Ore from the validation blasts was campaigned through the mill at a blend ratio of 1:2:2 (top:
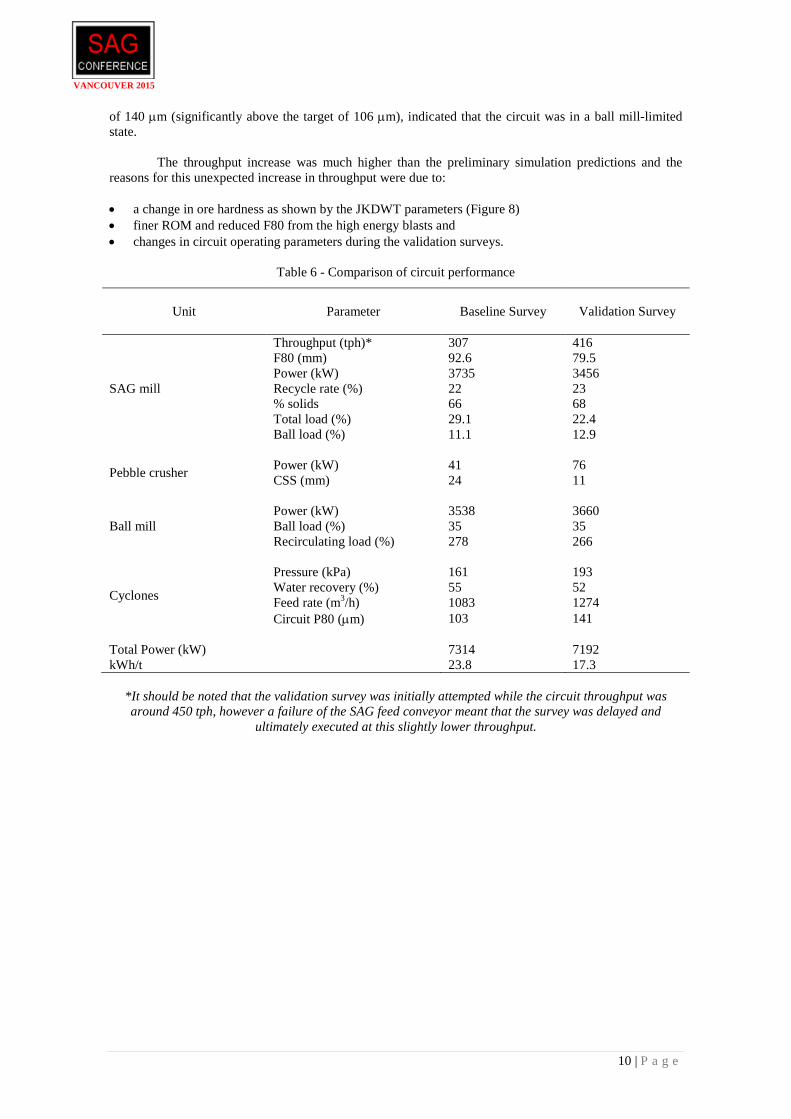
middle: bottom flitches) in April 2012 for 48 hrs before executing the repeat surveys and mill inspections. A comparison of mill performance during baseline and validation surveys is given in Table 6. The most immediate observation during the plant survey was a significant increase in SAG mill throughput from 307 tph (baseline) to 416 tph - a 36% improvement at a similar power draw. The coarser cyclone overflow P80
VANCOUVER 2015
10 | P a g e
of 140 µm (significantly above the target of 106 µm), indicated that the circuit was in a ball mill-limited state.
The throughput increase was much higher than the preliminary simulation predictions and the
reasons for this unexpected increase in throughput were due to:
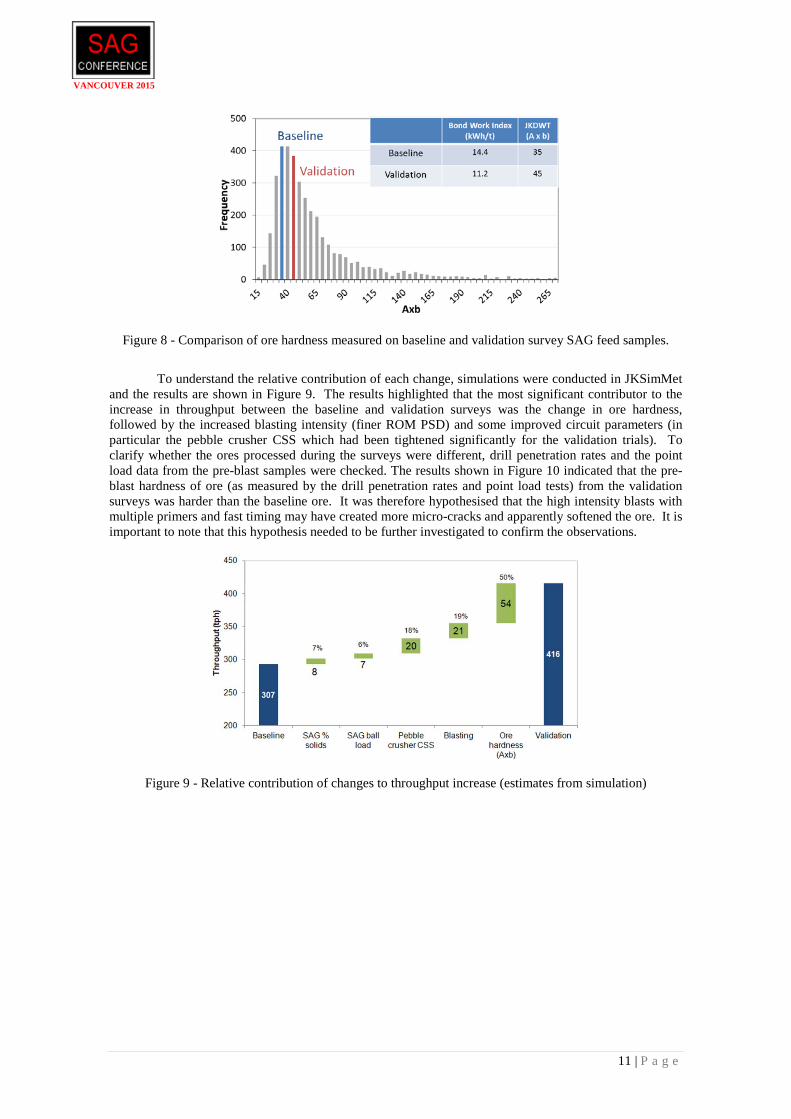
• a change in ore hardness as shown by the JKDWT parameters (Figure 8) • finer ROM and reduced F80 from the high energy blasts and • changes in circuit operating parameters during the validation surveys.
Table 6 - Comparison of circuit performance
Unit Parameter Baseline Survey
Validation Survey
SAG mill
Throughput (tph)* 307 416 F80 (mm) 92.6 79.5 Power (kW) 3735 3456 Recycle rate (%) 22 23 % solids 66 68 Total load (%) 29.1 22.4 Ball load (%) 11.1 12.9
Pebble crusher Power (kW) 41 76 CSS (mm) 24 11
Ball mill Power (kW) 3538 3660 Ball load (%) 35 35 Recirculating load (%) 278 266
Cyclones
Pressure (kPa) 161 193 Water recovery (%) 55 52 Feed rate (m3/h) 1083 1274 Circuit P80 (µm) 103 141
Total Power (kW) 7314 7192 kWh/t 23.8 17.3
*It should be noted that the validation survey was initially attempted while the circuit throughput was around 450 tph, however a failure of the SAG feed conveyor meant that the survey was delayed and
ultimately executed at this slightly lower throughput.
VANCOUVER 2015
11 | P a g e
Figure 8 - Comparison of ore hardness measured on baseline and validation survey SAG feed samples.
To understand the relative contribution of each change, simulations were conducted in JKSimMet
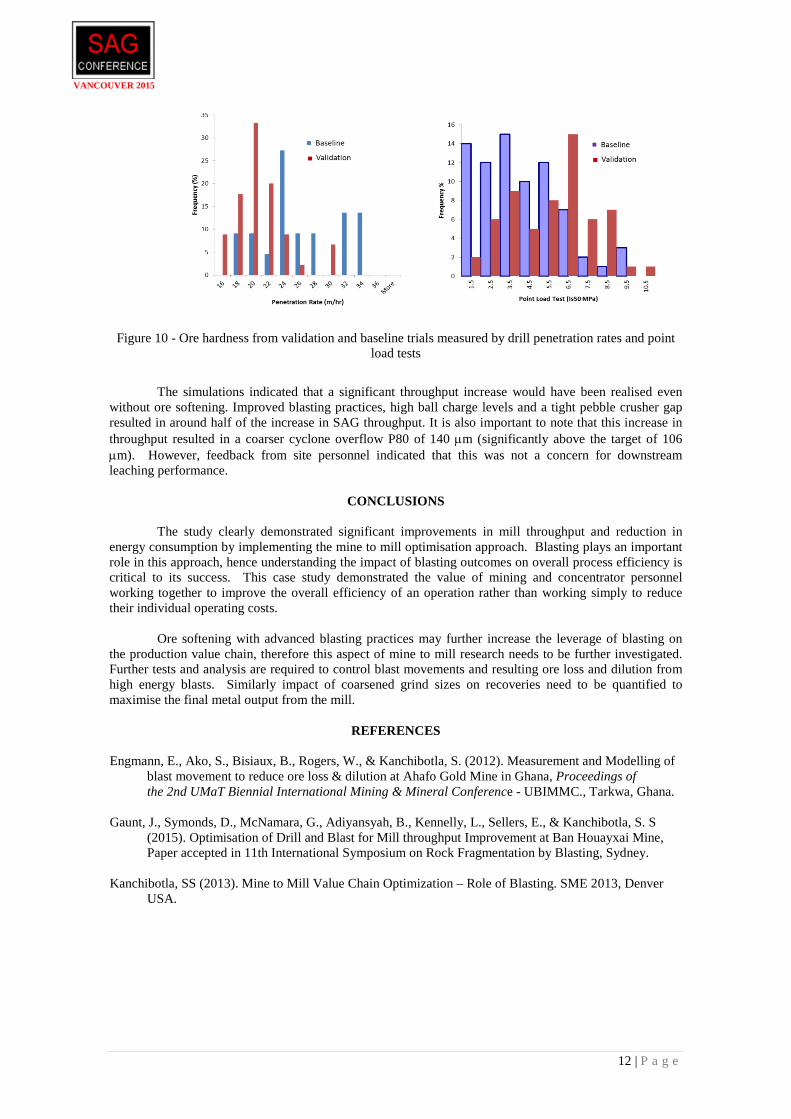
and the results are shown in Figure 9. The results highlighted that the most significant contributor to the increase in throughput between the baseline and validation surveys was the change in ore hardness, followed by the increased blasting intensity (finer ROM PSD) and some improved circuit parameters (in particular the pebble crusher CSS which had been tightened significantly for the validation trials). To clarify whether the ores processed during the surveys were different, drill penetration rates and the point load data from the pre-blast samples were checked. The results shown in Figure 10 indicated that the pre-blast hardness of ore (as measured by the drill penetration rates and point load tests) from the validation surveys was harder than the baseline ore. It was therefore hypothesised that the high intensity blasts with multiple primers and fast timing may have created more micro-cracks and apparently softened the ore. It is important to note that this hypothesis needed to be further investigated to confirm the observations.
Figure 9 - Relative contribution of changes to throughput increase (estimates from simulation)
VANCOUVER 2015
12 | P a g e
Figure 10 - Ore hardness from validation and baseline trials measured by drill penetration rates and point load tests
The simulations indicated that a significant throughput increase would have been realised even
without ore softening. Improved blasting practices, high ball charge levels and a tight pebble crusher gap resulted in around half of the increase in SAG throughput. It is also important to note that this increase in throughput resulted in a coarser cyclone overflow P80 of 140 µm (significantly above the target of 106 µm). However, feedback from site personnel indicated that this was not a concern for downstream leaching performance.
CONCLUSIONS
The study clearly demonstrated significant improvements in mill throughput and reduction in energy consumption by implementing the mine to mill optimisation approach. Blasting plays an important role in this approach, hence understanding the impact of blasting outcomes on overall process efficiency is critical to its success. This case study demonstrated the value of mining and concentrator personnel working together to improve the overall efficiency of an operation rather than working simply to reduce their individual operating costs.
Ore softening with advanced blasting practices may further increase the leverage of blasting on
the production value chain, therefore this aspect of mine to mill research needs to be further investigated. Further tests and analysis are required to control blast movements and resulting ore loss and dilution from high energy blasts. Similarly impact of coarsened grind sizes on recoveries need to be quantified to maximise the final metal output from the mill.
REFERENCES
Engmann, E., Ako, S., Bisiaux, B., Rogers, W., & Kanchibotla, S. (2012). Measurement and Modelling of
blast movement to reduce ore loss & dilution at Ahafo Gold Mine in Ghana, Proceedings of the 2nd UMaT Biennial International Mining & Mineral Conference - UBIMMC., Tarkwa, Ghana.
Gaunt, J., Symonds, D., McNamara, G., Adiyansyah, B., Kennelly, L., Sellers, E., & Kanchibotla, S. S
(2015). Optimisation of Drill and Blast for Mill throughput Improvement at Ban Houayxai Mine, Paper accepted in 11th International Symposium on Rock Fragmentation by Blasting, Sydney.
Kanchibotla, SS (2013). Mine to Mill Value Chain Optimization – Role of Blasting. SME 2013, Denver
USA.

VANCOUVER 2015
13 | P a g e
Kanchibotla S.S., Valery W., & Morrell S. (1999). Modelling fines in blast fragmentation and its impact on crushing and grinding, Explo-99, Kalgoorlie.
Napier-Munn, T.J., Morrell, S., Morrison, R.D. & Kojovic, T., (1996). Mineral Comminution Circuits:
Their Design and Optimisation. JKMRC, University of Queensland, Brisbane, 413pp
Rogers, W. & Kanchibotla S. (2013). Application of stochastic approach to predict blast movement. Rock Fragmentation by Blasting: Fragblast 10. P. K. Singh, A. Sinha (eds). CRC Press