Embed Size (px)
Citation preview
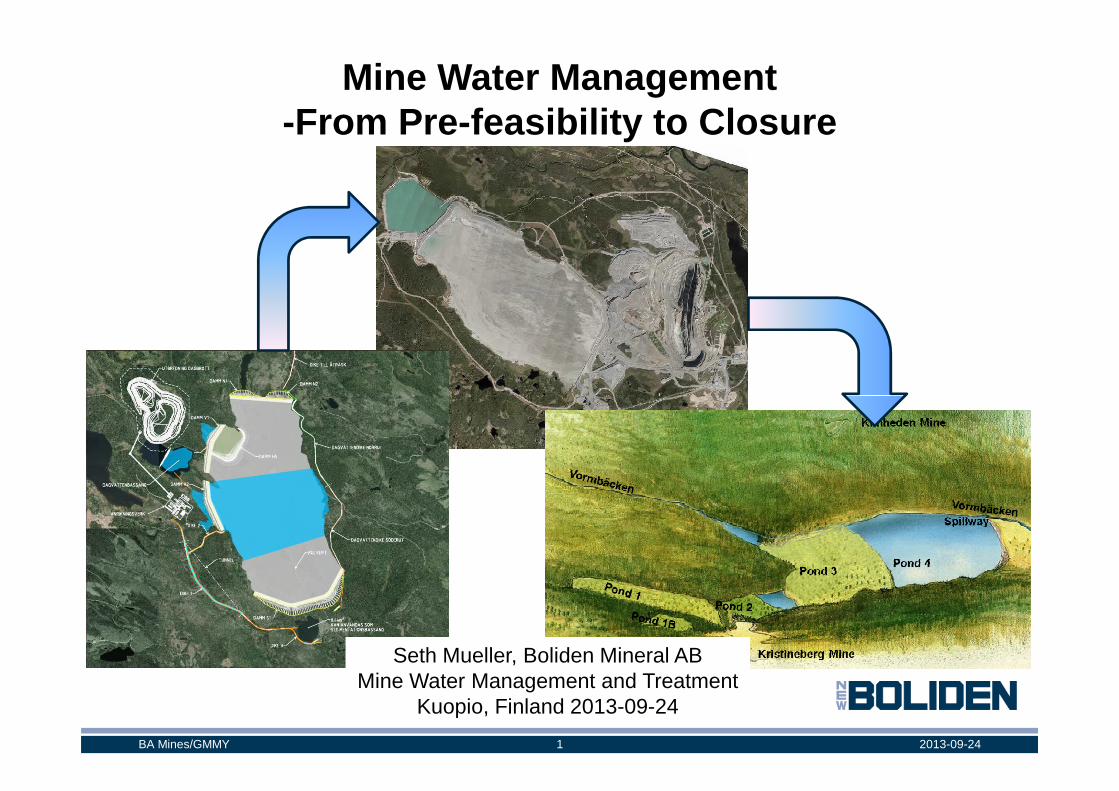
Mine Water Management-From Pre-feasibility to Closure
2013-09-241BA Mines/GMMY
Seth Mueller, Boliden Mineral ABMine Water Management and Treatment
Kuopio, Finland 2013-09-24
Outline
� Water managment plan approach
� Water balance models as a tool for planning and management
� Pre-feasibility- Laver example
� Under operations- Aitik example
� Closure Planning
2013-09-242BA Mines/GMMY
Water Management Plan Approach
� Define objectives
� Define exisiting conditions
� Develop water balance models
� Identify and implement optimization measures
� Identify and minimize risks
� Water management plan/reporting internal control/ Annual Report
2013-09-243BA Mines/GMMY
Model Construction
� GoldSim (www.goldsim.com)
� Reasons� Commonly used for mine and environmental application (large user group)� Visual development environment with a large number of modeling “elements”
including logical and discrete event capabilitiesincluding logical and discrete event capabilities� Strong probabilistic capabilities� Hierarchical structure� Integration with Excel and relational databases� Chemistry capabilities� Sensitivity and optimization tools� GoldSim Player dashboard models can be used license-free� Number of different modules for different types of models
2013-09-244BA Mines/GMMY
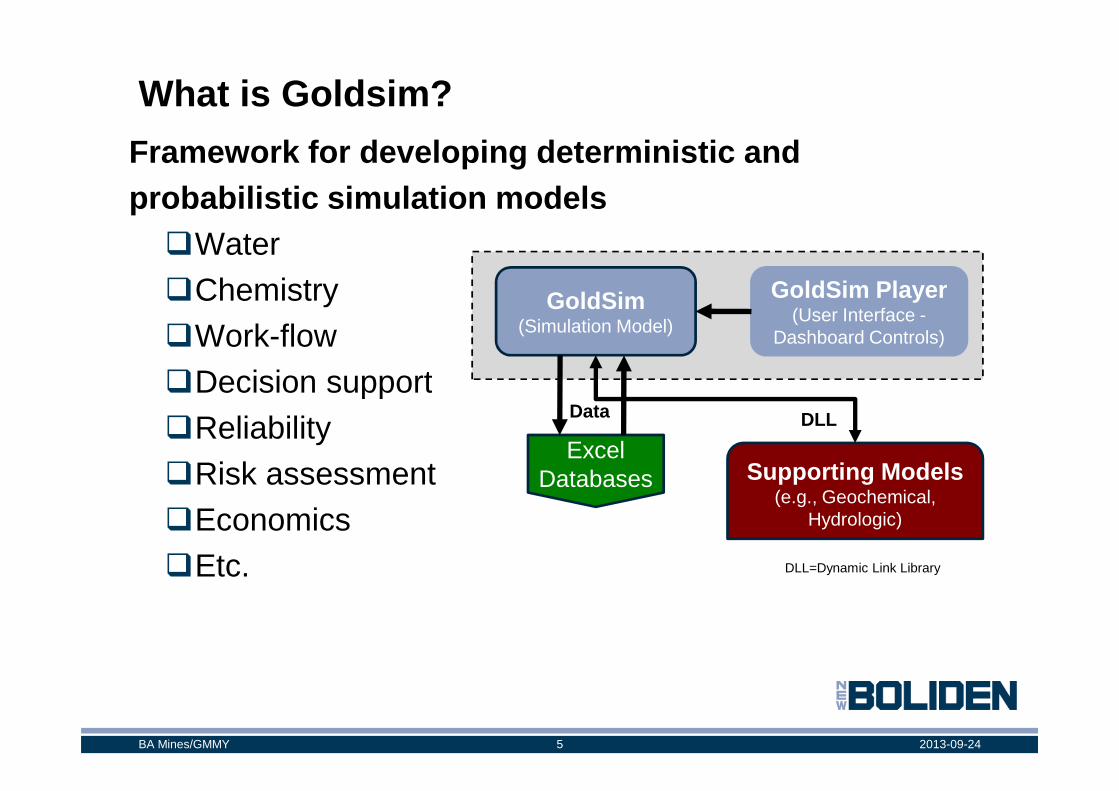
What is Goldsim?
Framework for developing deterministic and probabilistic simulation models
�Water�Chemistry�Work-flow�Decision support
GoldSim(Simulation Model)
GoldSim Player (User Interface -
Dashboard Controls)
2013-09-245BA Mines/GMMY
�Decision support�Reliability�Risk assessment �Economics�Etc.
ExcelDatabases
Data
Supporting Models(e.g., Geochemical,
Hydrologic)
DLL
DLL=Dynamic Link Library
Input data types
� Static Data� Physical data such as: catchment areas, max and min volumes, stage-volume
relationships, etc.
� Real-Time Pre-Operational and Operational data� Measured data such as: historical precipitation, flow meter records, mine production,
2013-09-246BA Mines/GMMY
� Measured data such as: historical precipitation, flow meter records, mine production, slurry flow and density, etc.
� Dynamic and Uncertain Data� Projected data or calculated such as: future precipitation, future mine production,
seepage rates, heap draindown, etc.
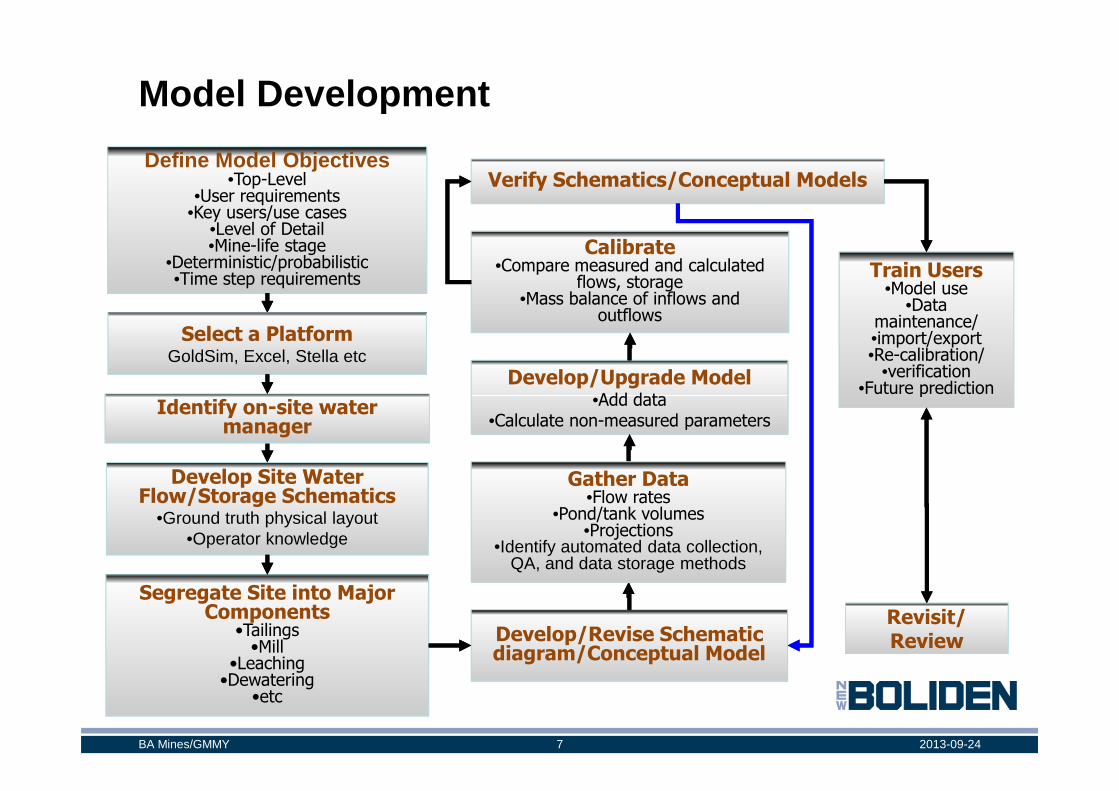
Model Development
Define Model Objectives•Top-Level
•User requirements•Key users/use cases
•Level of Detail•Mine-life stage
•Deterministic/probabilistic•Time step requirements
Verify Schematics/Conceptual Models
Develop/Upgrade Model •Add data
Calibrate•Compare measured and calculated
flows, storage•Mass balance of inflows and
outflows
Train Users•Model use
•Data maintenance/•import/export•Re-calibration/
•verification•Future prediction
Identify on-site water
Select a PlatformGoldSim, Excel, Stella etc
2013-09-247BA Mines/GMMY
Develop Site Water Flow/Storage Schematics
•Ground truth physical layout•Operator knowledge
Segregate Site into Major Components
•Tailings•Mill
•Leaching•Dewatering
•etc
Develop/Revise Schematic diagram/Conceptual Model
•Add data•Calculate non-measured parameters
•Future prediction
Revisit/Review
Identify on-site water manager
Gather Data•Flow rates
•Pond/tank volumes•Projections
•Identify automated data collection, QA, and data storage methods
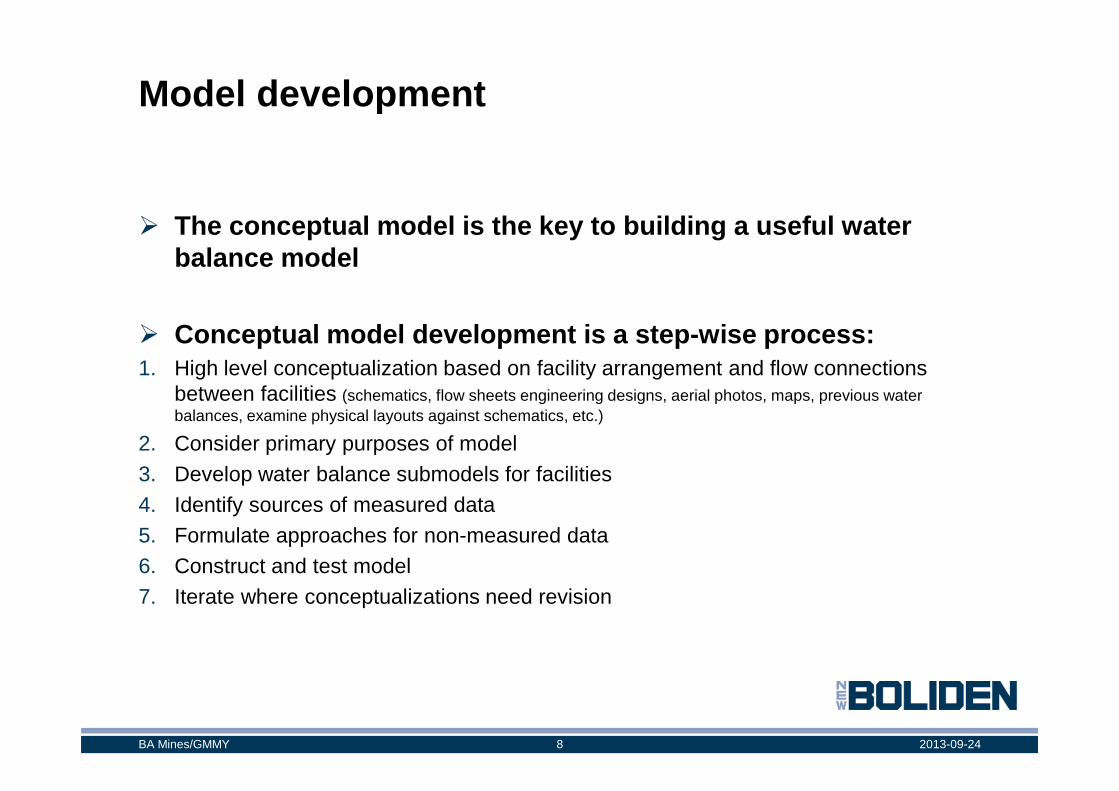
Model development
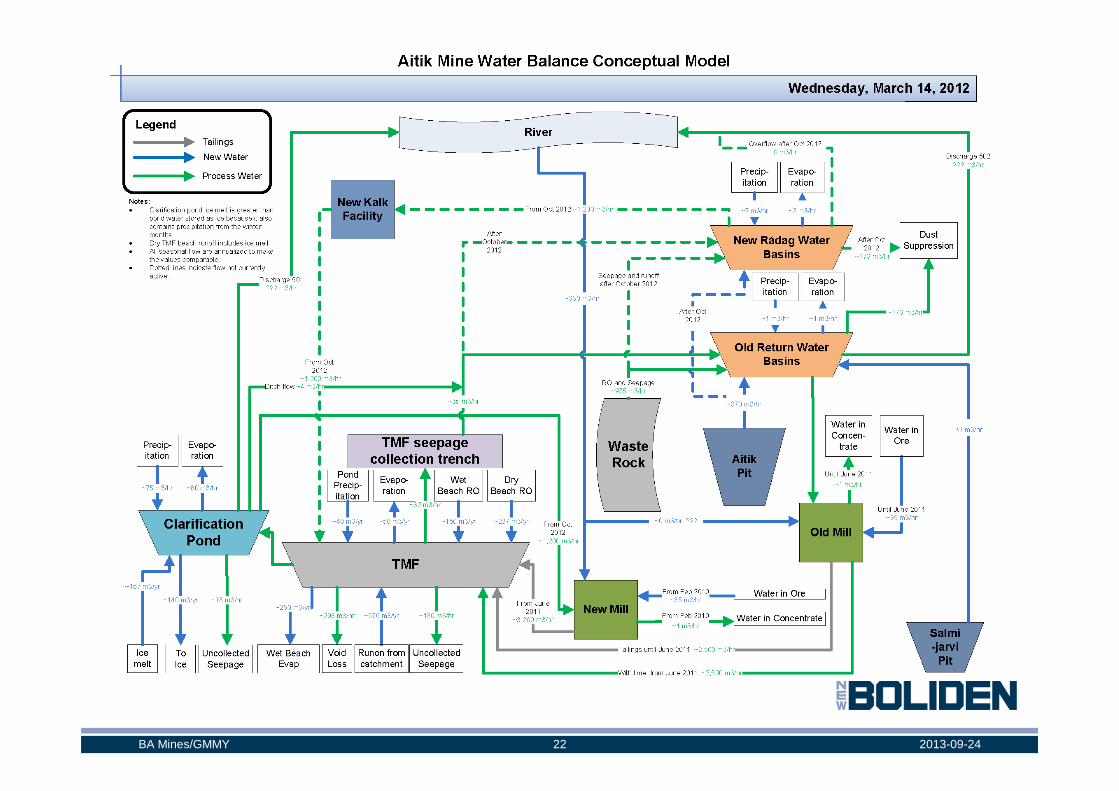
� The conceptual model is the key to building a usefu l water balance model
� Conceptual model development is a step-wise process :1. High level conceptualization based on facility arrangement and flow connections
between facilities (schematics, flow sheets engineering designs, aerial photos, maps, previous water between facilities (schematics, flow sheets engineering designs, aerial photos, maps, previous water balances, examine physical layouts against schematics, etc.)
2. Consider primary purposes of model3. Develop water balance submodels for facilities4. Identify sources of measured data5. Formulate approaches for non-measured data6. Construct and test model7. Iterate where conceptualizations need revision
2013-09-248BA Mines/GMMY
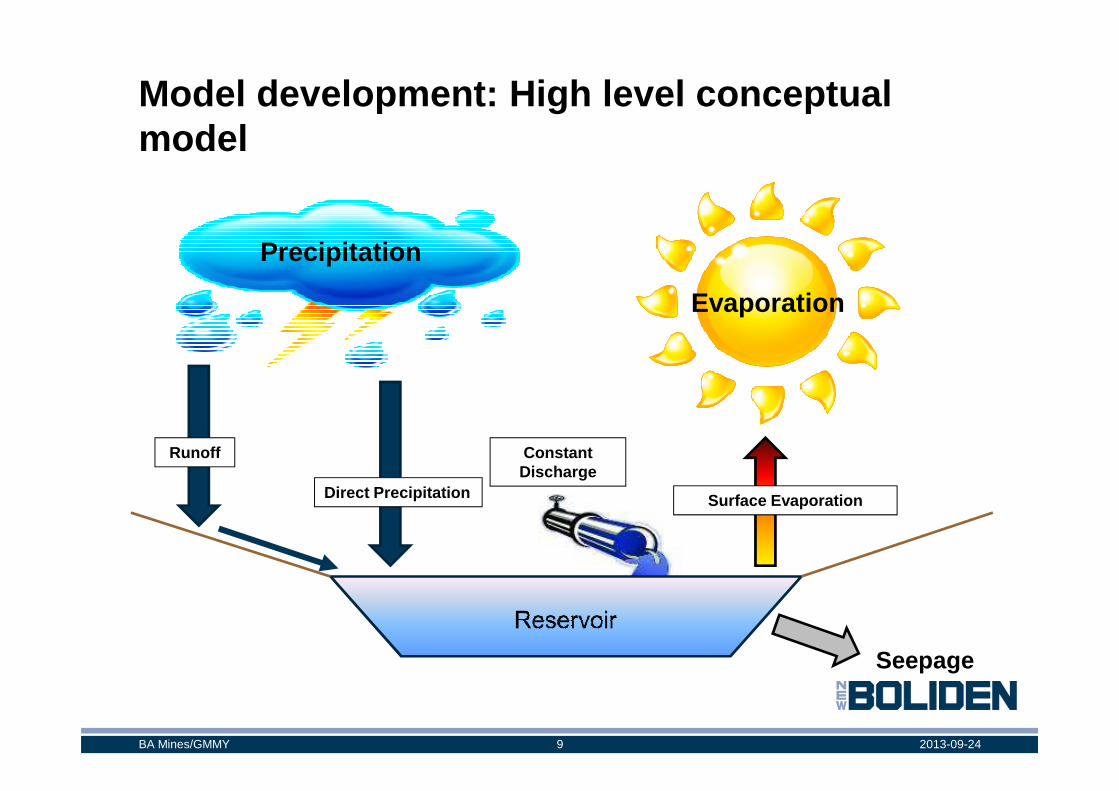
Model development: High level conceptualmodel
Precipitation
Evaporation
2013-09-249BA Mines/GMMY
Constant Discharge
Direct Precipitation
Runoff
Seepage
Surface Evaporation
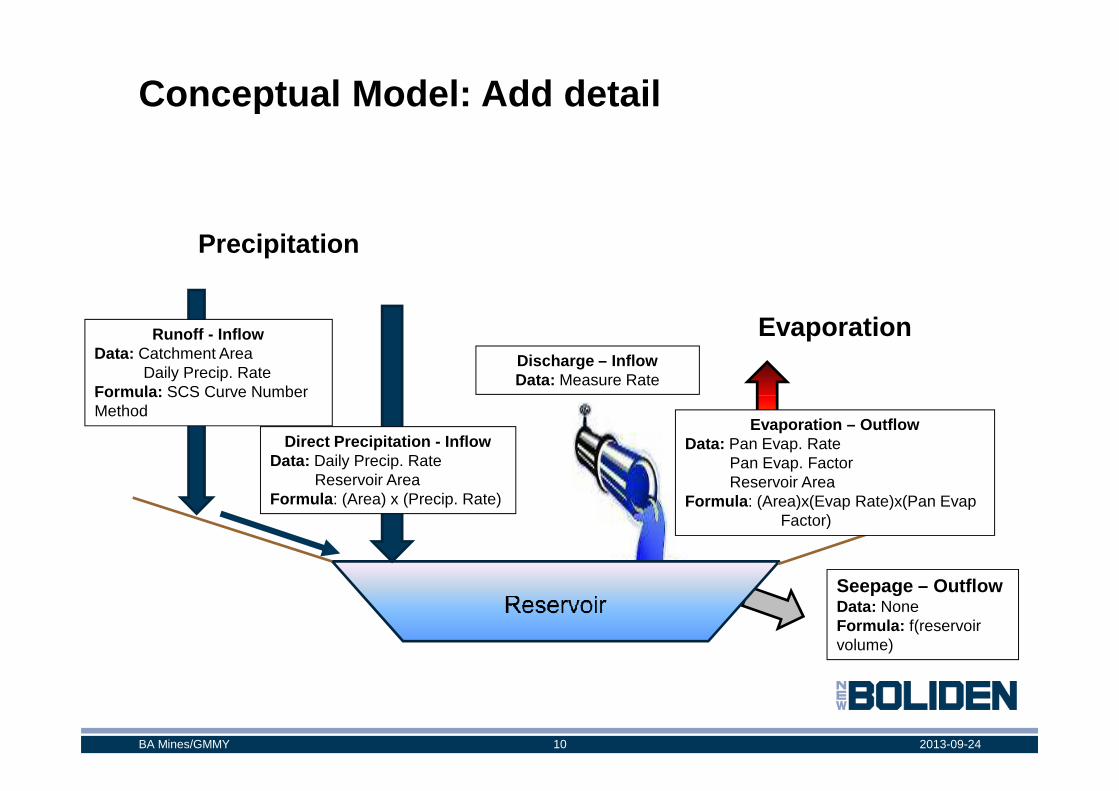
Conceptual Model: Add detail
Evaporation
Precipitation
Discharge – InflowData: Measure Rate
Runoff - InflowData: Catchment Area
Daily Precip. RateFormula: SCS Curve Number
2013-09-2410BA Mines/GMMY
Seepage – OutflowData: NoneFormula: f(reservoir volume)
Direct Precipitation - InflowData: Daily Precip. Rate
Reservoir AreaFormula : (Area) x (Precip. Rate)
Formula: SCS Curve Number Method
Evaporation – OutflowData: Pan Evap. Rate
Pan Evap. FactorReservoir Area
Formula : (Area)x(Evap Rate)x(Pan Evap Factor)
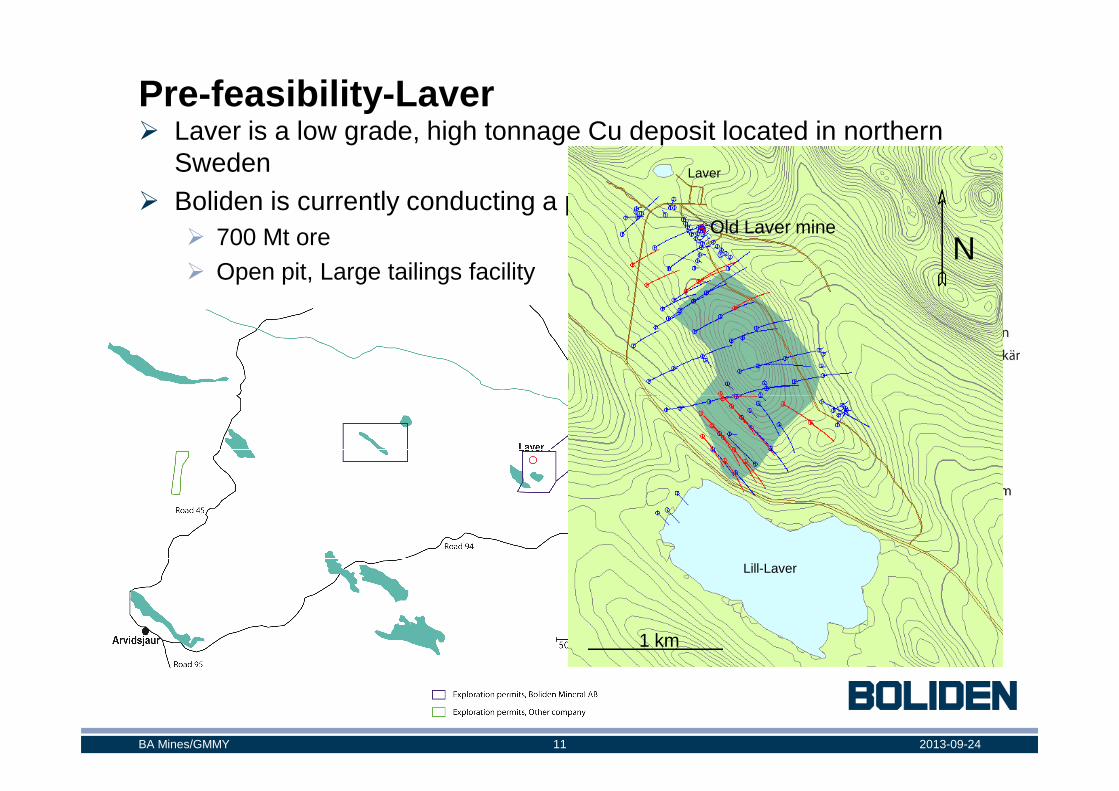
Pre-feasibility-Laver� Laver is a low grade, high tonnage Cu deposit located in northern
Sweden� Boliden is currently conducting a prefeasability study of Laver
� 700 Mt ore� Open pit, Large tailings facility
Laver
Old Laver mineN
2013-09-2411BA Mines/GMMY
1 km
Lill-Laver
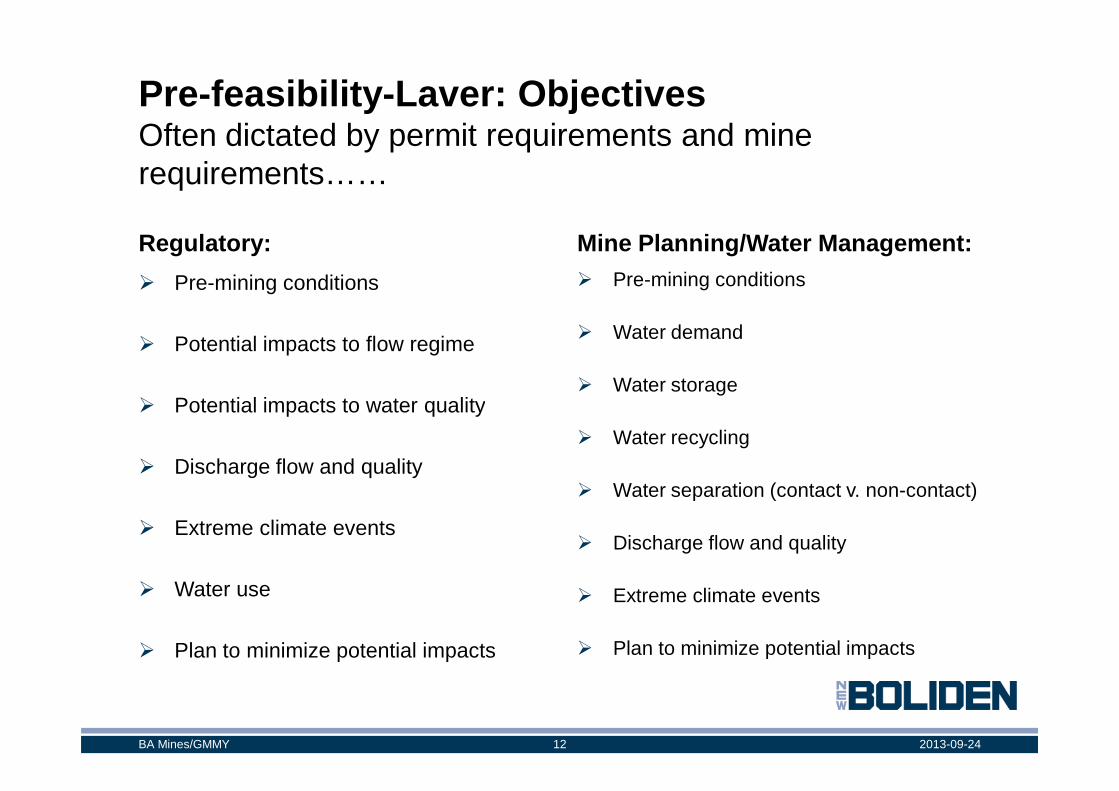
Pre-feasibility-Laver: ObjectivesOften dictated by permit requirements and minerequirements……
Regulatory:
� Pre-mining conditions
� Potential impacts to flow regime
� Potential impacts to water quality
Mine Planning/Water Management:� Pre-mining conditions
� Water demand
� Water storage� Potential impacts to water quality
� Discharge flow and quality
� Extreme climate events
� Water use
� Plan to minimize potential impacts
Water storage
� Water recycling
� Water separation (contact v. non-contact)
� Discharge flow and quality
� Extreme climate events
� Plan to minimize potential impacts
2013-09-2412BA Mines/GMMY
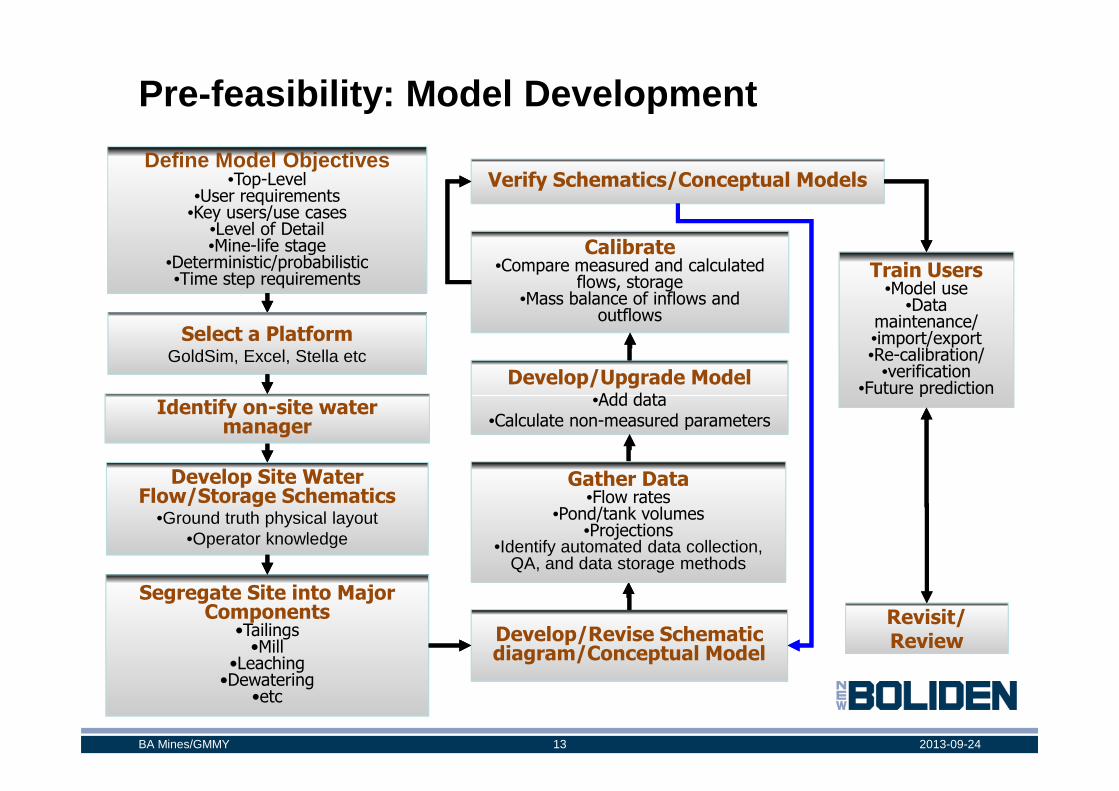
Pre-feasibility: Model Development
Define Model Objectives•Top-Level
•User requirements•Key users/use cases
•Level of Detail•Mine-life stage
•Deterministic/probabilistic•Time step requirements
Verify Schematics/Conceptual Models
Develop/Upgrade Model •Add data
Calibrate•Compare measured and calculated
flows, storage•Mass balance of inflows and
outflows
Train Users•Model use
•Data maintenance/•import/export•Re-calibration/
•verification•Future prediction
Identify on-site water
Select a PlatformGoldSim, Excel, Stella etc
2013-09-2413BA Mines/GMMY
Develop Site Water Flow/Storage Schematics
•Ground truth physical layout•Operator knowledge
Segregate Site into Major Components
•Tailings•Mill
•Leaching•Dewatering
•etc
Develop/Revise Schematic diagram/Conceptual Model
•Add data•Calculate non-measured parameters
•Future prediction
Revisit/Review
Identify on-site water manager
Gather Data•Flow rates
•Pond/tank volumes•Projections
•Identify automated data collection, QA, and data storage methods
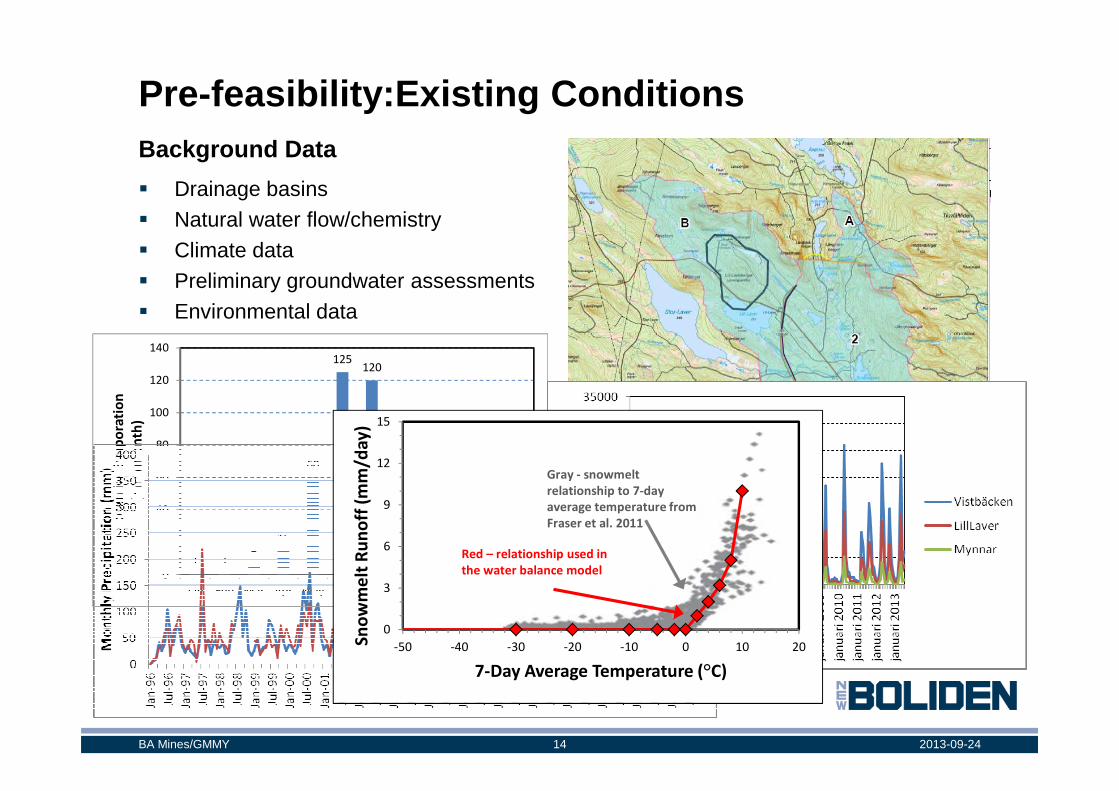
Pre-feasibility: Existing ConditionsBackground Data
� Drainage basins� Natural water flow/chemistry� Climate data� Preliminary groundwater assessments� Environmental data
125120
120
140
Po
ten
tia
l E
va
po
rati
on
2013-09-2414BA Mines/GMMY
1 16
15
60
75
30
102 1
0
20
40
60
80
100
Jan Feb Mar Apr May Jun Jul Aug Sep Oct Nov Dec
Po
ten
tia
l E
va
po
rati
on
(mm
/mo
nth
)
0
3
6
9
12
15
-50 -40 -30 -20 -10 0 10 20Sn
ow
me
lt R
un
off
(m
m/d
ay
)
7-Day Average Temperature (°C)
Red – relationship used in
the water balance model
Gray - snowmelt
relationship to 7-day
average temperature from
Fraser et al. 2011
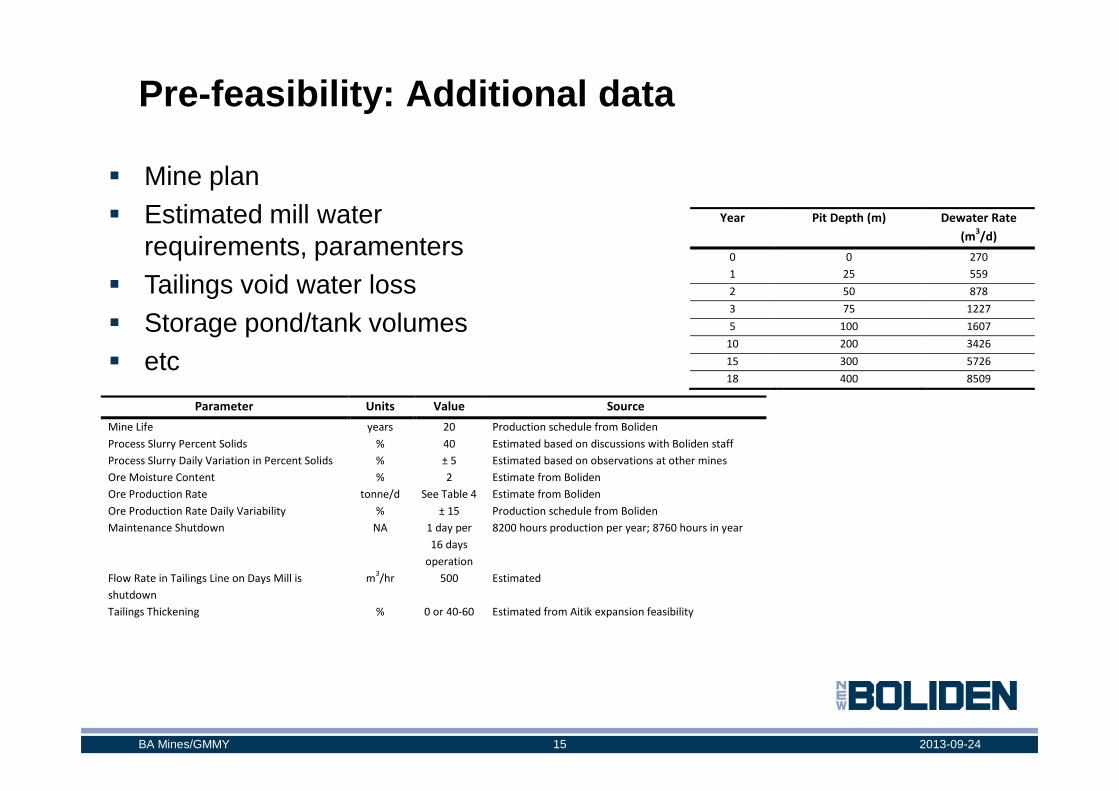
Pre-feasibility: Additional data
� Mine plan� Estimated mill water
requirements, paramenters� Tailings void water loss� Storage pond/tank volumes� etc
Year Pit Depth (m) Dewater Rate
(m3/d)
0 0 270
1 25 559
2 50 878
3 75 1227
5 100 1607
10 200 3426
15 300 5726
18 400 8509
2013-09-2415BA Mines/GMMY
Parameter Units Value Source
Mine Life years 20 Production schedule from Boliden
Process Slurry Percent Solids % 40 Estimated based on discussions with Boliden staff
Process Slurry Daily Variation in Percent Solids % ± 5 Estimated based on observations at other mines
Ore Moisture Content % 2 Estimate from Boliden
Ore Production Rate tonne/d See Table 4 Estimate from Boliden
Ore Production Rate Daily Variability % ± 15 Production schedule from Boliden
Maintenance Shutdown NA 1 day per
16 days
operation
8200 hours production per year; 8760 hours in year
Flow Rate in Tailings Line on Days Mill is
shutdown
m3/hr 500 Estimated
Tailings Thickening % 0 or 40-60 Estimated from Aitik expansion feasibility
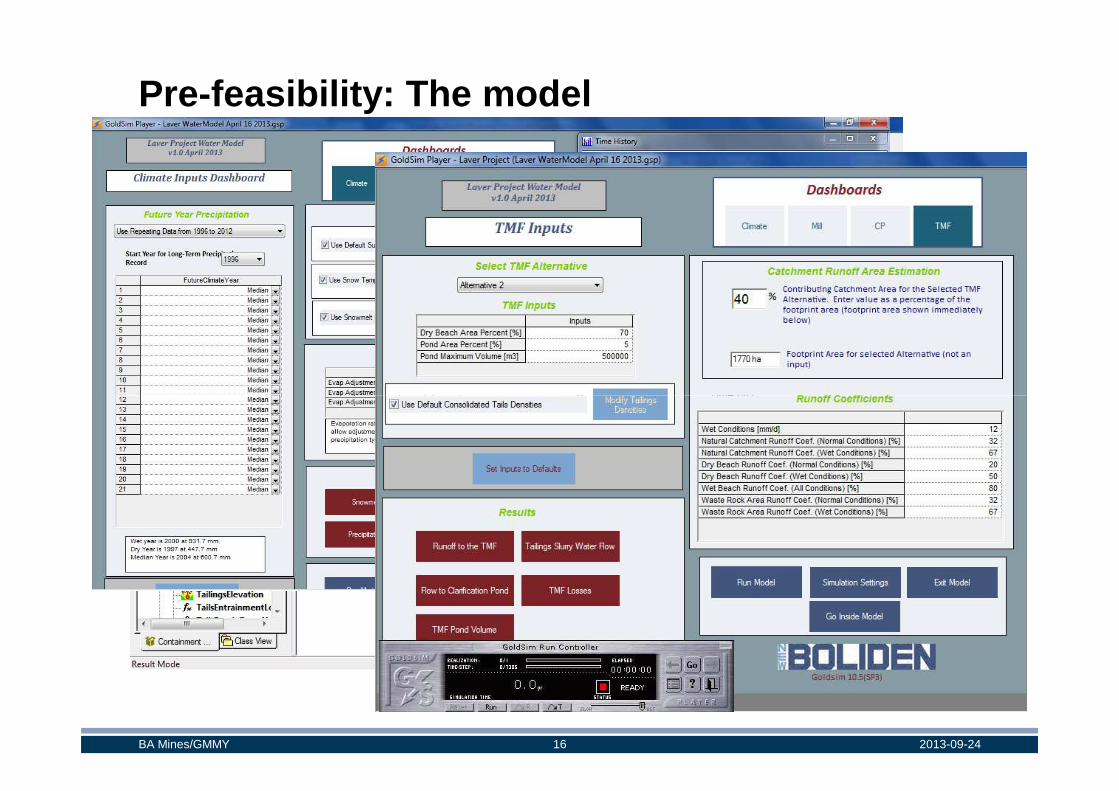
Pre-feasibility: The model
2013-09-2416BA Mines/GMMY
Pre-feasibility-Laver: How are we using the model
� Optimize storage volumes� Pump Capacity� Climate scenarios � Building in chemistry-internal water quality/discharge water quality� Water use (groundwater and surface water)/downstream impacts� Tailings deposition and water management
� It will be a critical tool in the permitting process
2013-09-2417BA Mines/GMMY
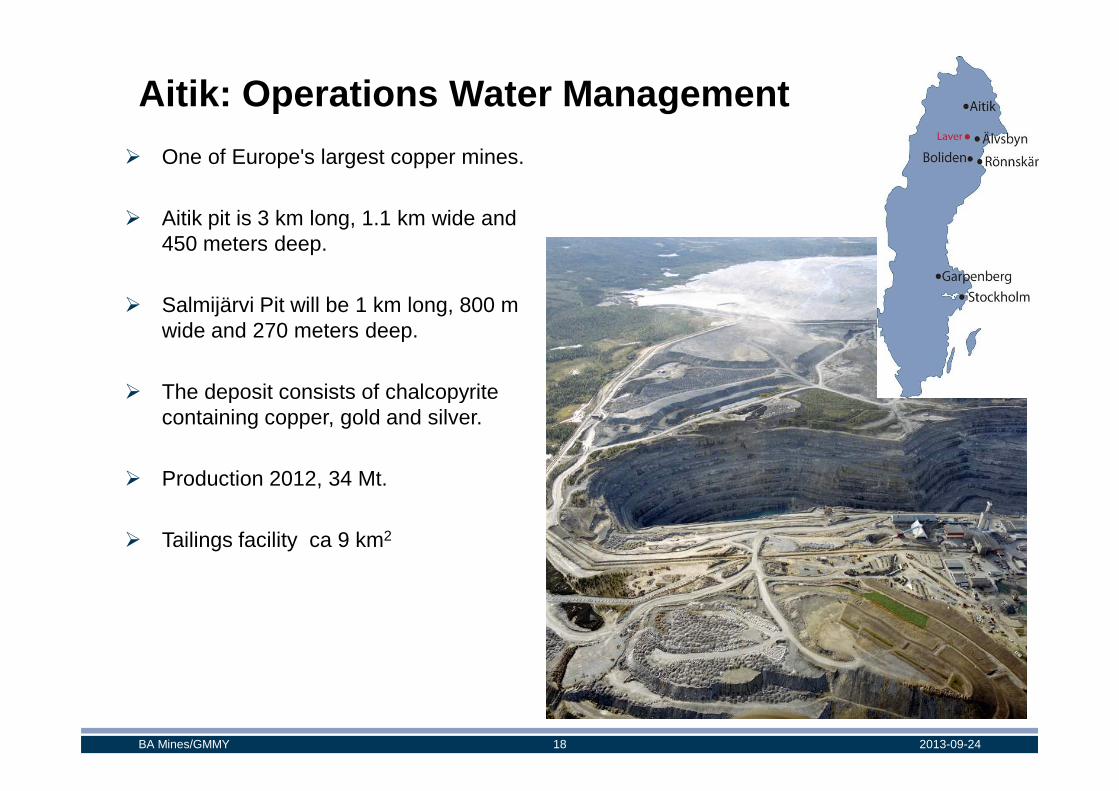
Aitik: Operations Water Management
� One of Europe's largest copper mines.
� Aitik pit is 3 km long, 1.1 km wide and 450 meters deep.
� Salmijärvi Pit will be 1 km long, 800 m wide and 270 meters deep.
� The deposit consists of chalcopyrite
2013-09-2418BA Mines/GMMY
� The deposit consists of chalcopyrite containing copper, gold and silver.
� Production 2012, 34 Mt.
� Tailings facility ca 9 km2
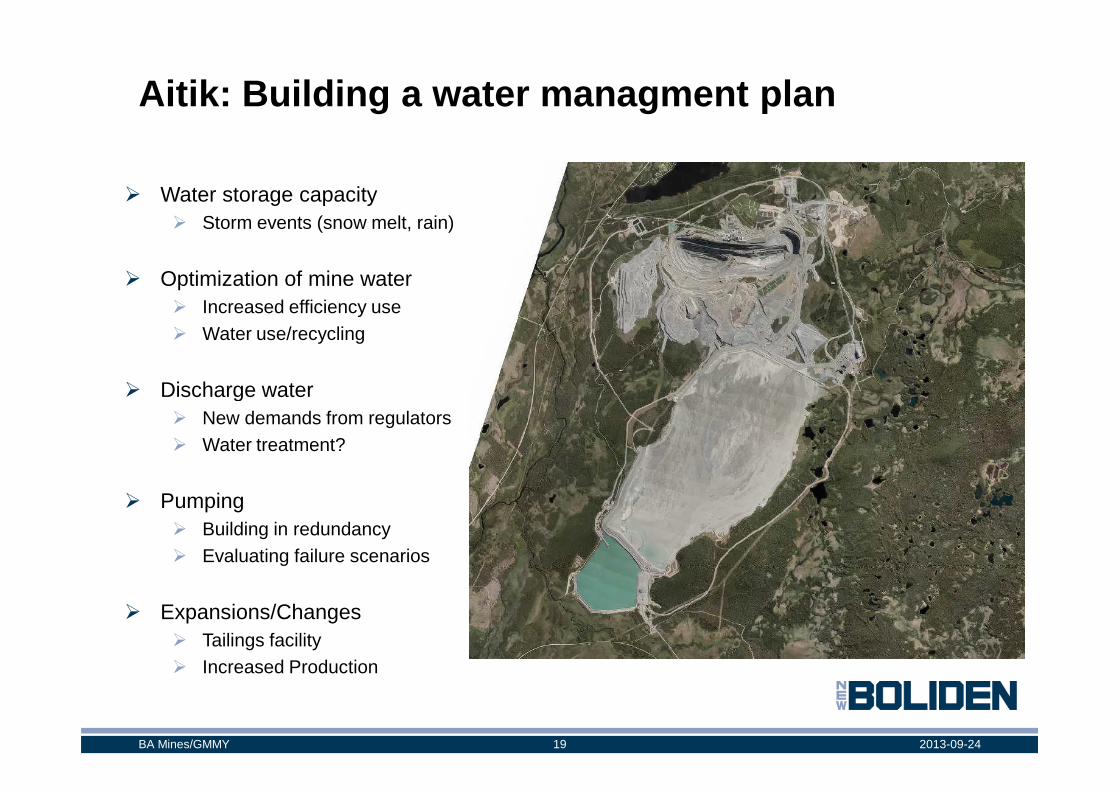
Aitik: Building a water managment plan
� Water storage capacity� Storm events (snow melt, rain)
� Optimization of mine water� Increased efficiency use� Water use/recycling
� Discharge water� Discharge water� New demands from regulators� Water treatment?
� Pumping� Building in redundancy� Evaluating failure scenarios
� Expansions/Changes� Tailings facility� Increased Production
2013-09-2419BA Mines/GMMY
2013-09-2420BA Mines/GMMY
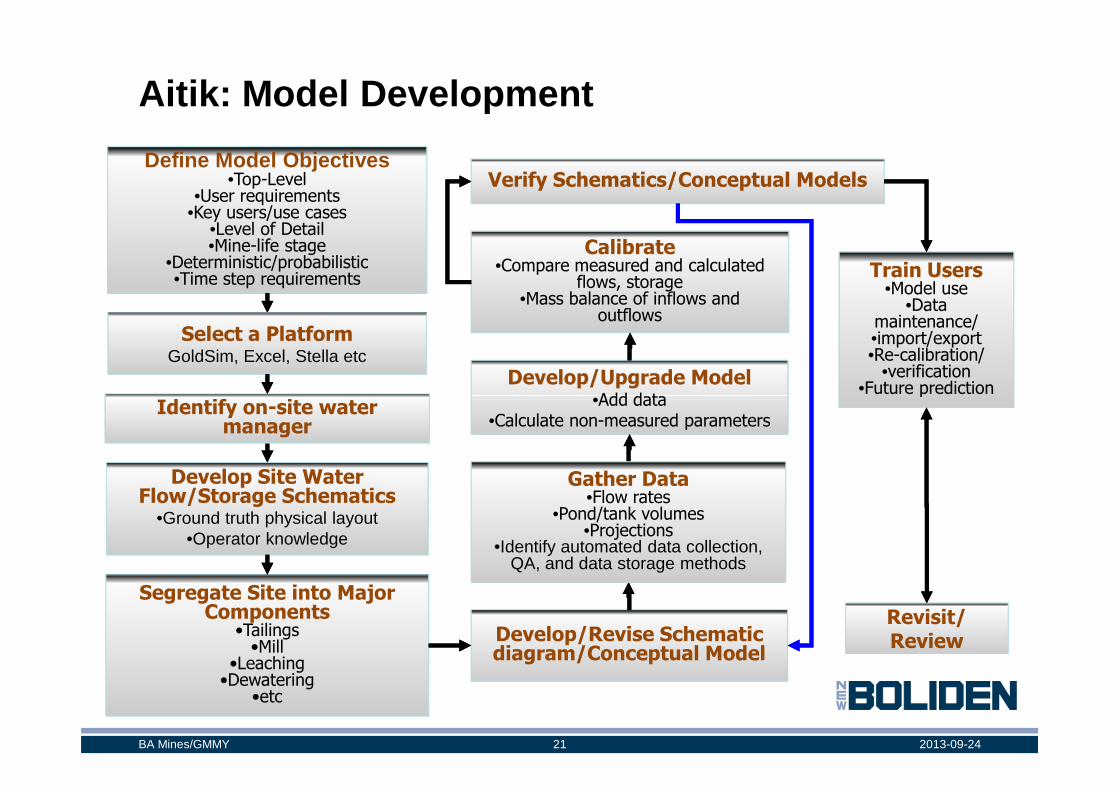
Aitik: Model Development
Define Model Objectives•Top-Level
•User requirements•Key users/use cases
•Level of Detail•Mine-life stage
•Deterministic/probabilistic•Time step requirements
Verify Schematics/Conceptual Models
Develop/Upgrade Model •Add data
Calibrate•Compare measured and calculated
flows, storage•Mass balance of inflows and
outflows
Train Users•Model use
•Data maintenance/•import/export•Re-calibration/
•verification•Future prediction
Identify on-site water
Select a PlatformGoldSim, Excel, Stella etc
2013-09-2421BA Mines/GMMY
Develop Site Water Flow/Storage Schematics
•Ground truth physical layout•Operator knowledge
Segregate Site into Major Components
•Tailings•Mill
•Leaching•Dewatering
•etc
Develop/Revise Schematic diagram/Conceptual Model
•Add data•Calculate non-measured parameters
•Future prediction
Revisit/Review
Identify on-site water manager
Gather Data•Flow rates
•Pond/tank volumes•Projections
•Identify automated data collection, QA, and data storage methods
2013-09-2422BA Mines/GMMY
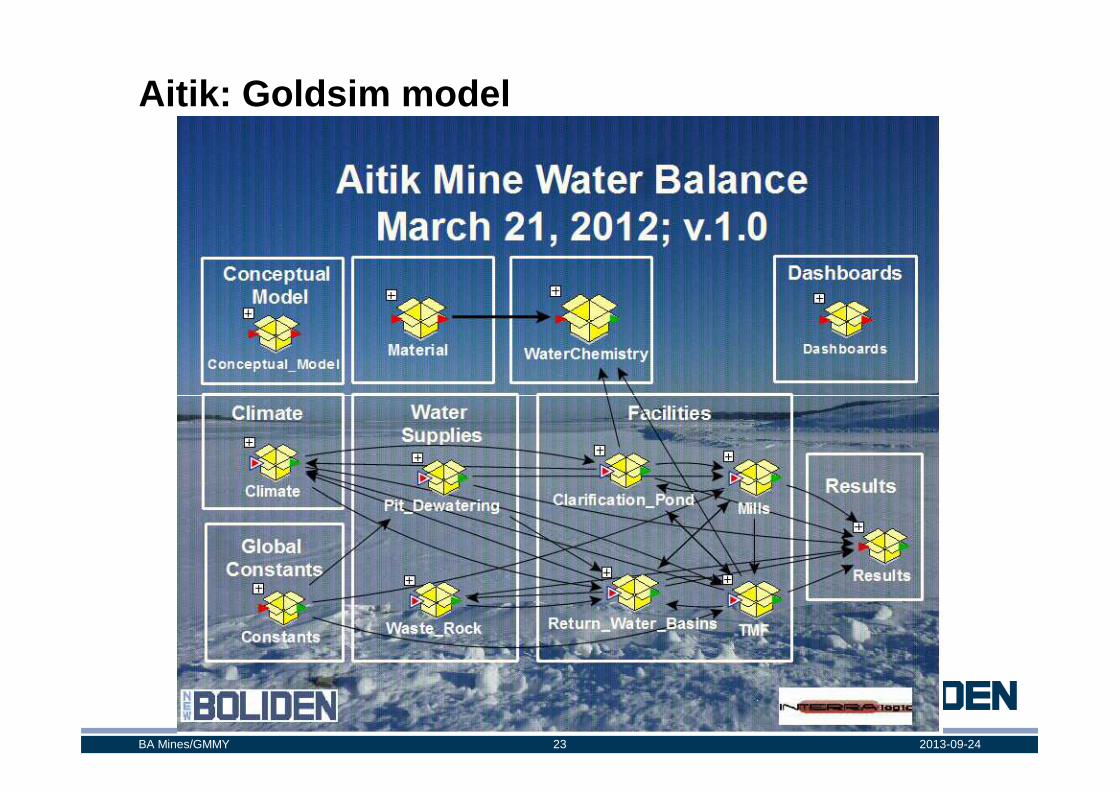
Aitik: Goldsim model
2013-09-2423BA Mines/GMMY
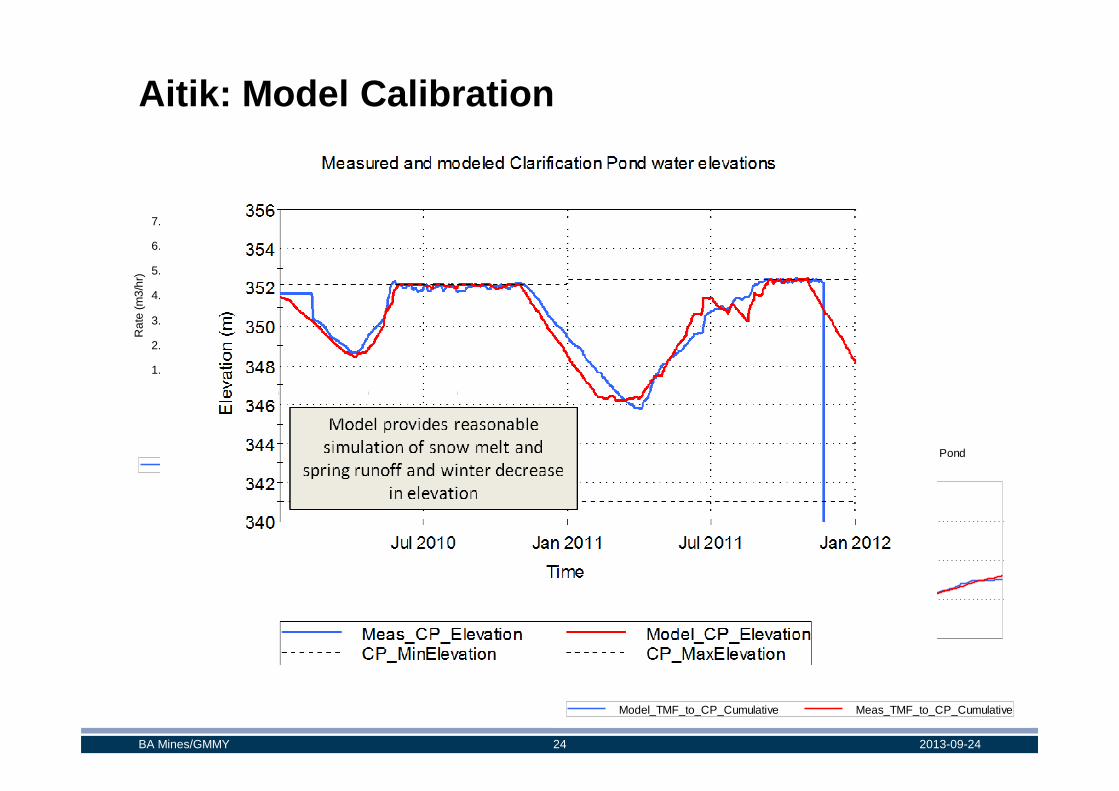
Aitik: Model Calibration
0
1.0e04
2.0e04
3.0e04
4.0e04
5.0e04
6.0e04
7.0e04
Rat
e (m
3/hr
)
Modeled and measured flow rate from TMF to Clarification Pond
2013-09-2424BA Mines/GMMY
0Jul 2010 Jan 2011 Jul 2011
Time
Meas_TMF_to_CP_Rate Model_TMF_to_CP_Rate
0
5.0e07
1.0e08
1.5e08
2.0e08
Jul 2010 Jan 2011 Jul 2011
Vol
ume
(m3)
Time
Modeled and measured cumulative flow from TMF to Clarification Pond
Model_TMF_to_CP_Cumulative Meas_TMF_to_CP_Cumulative
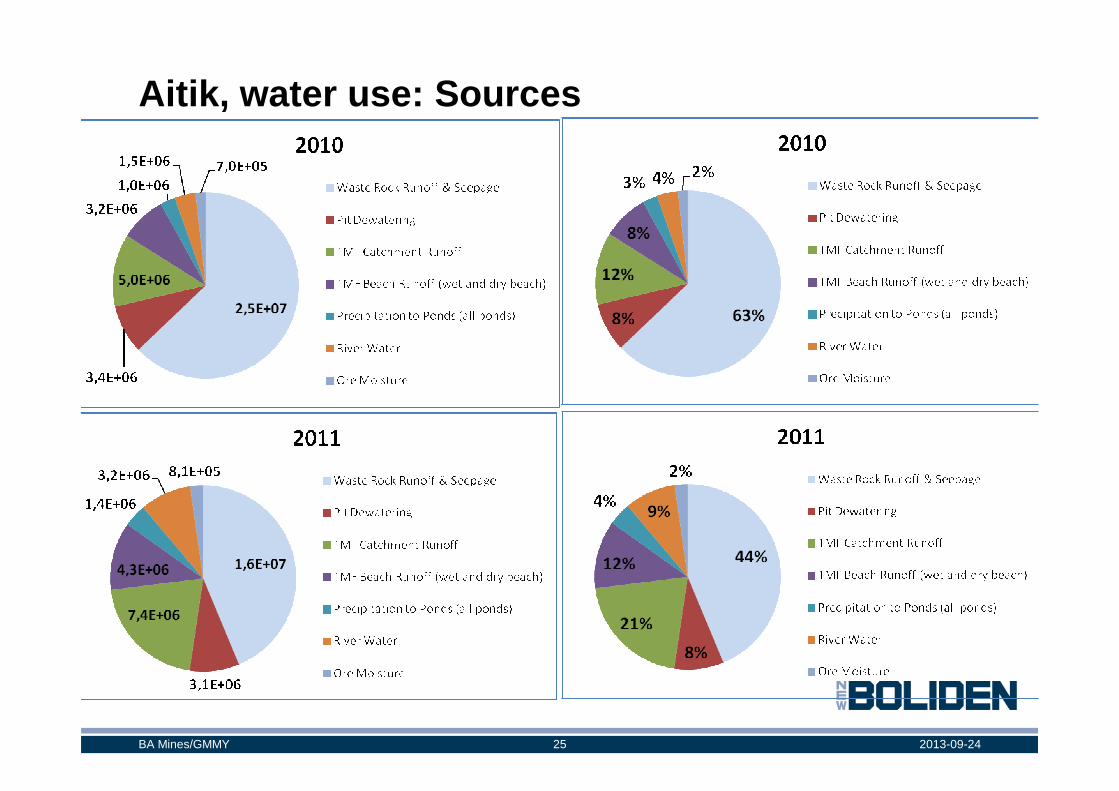
Aitik, water use: Sources
2013-09-2425BA Mines/GMMY
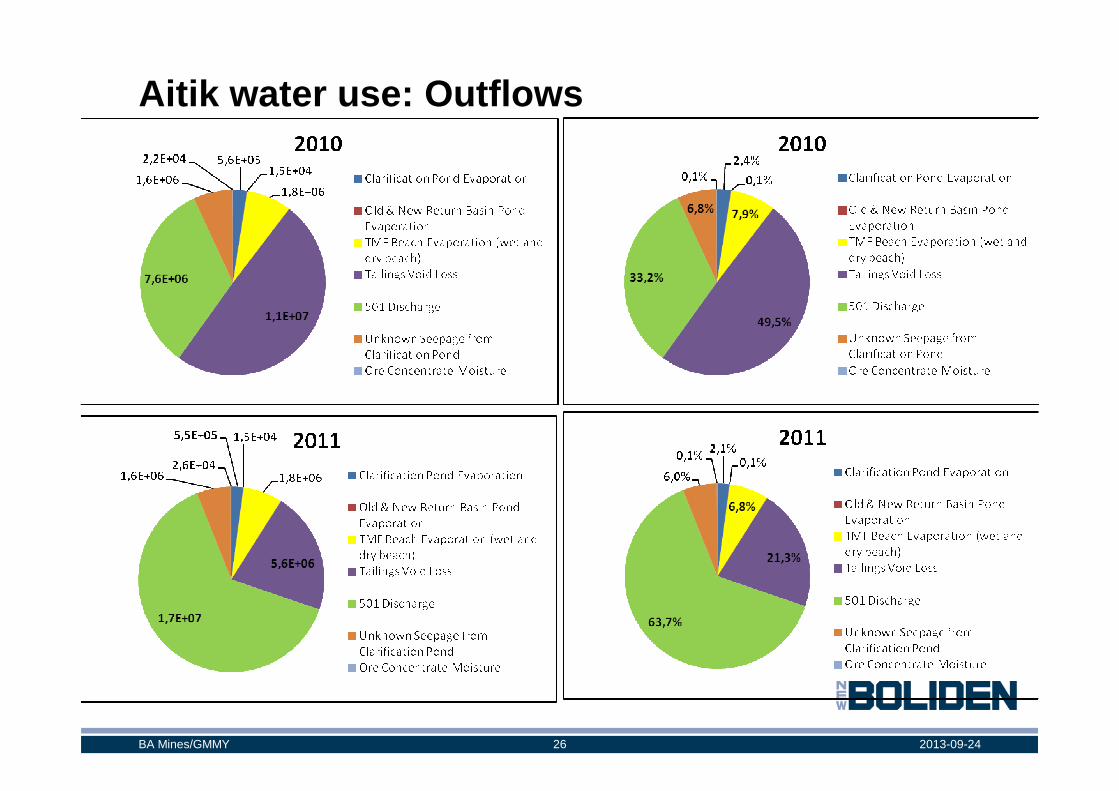
Aitik water use: Outflows
2013-09-2426BA Mines/GMMY
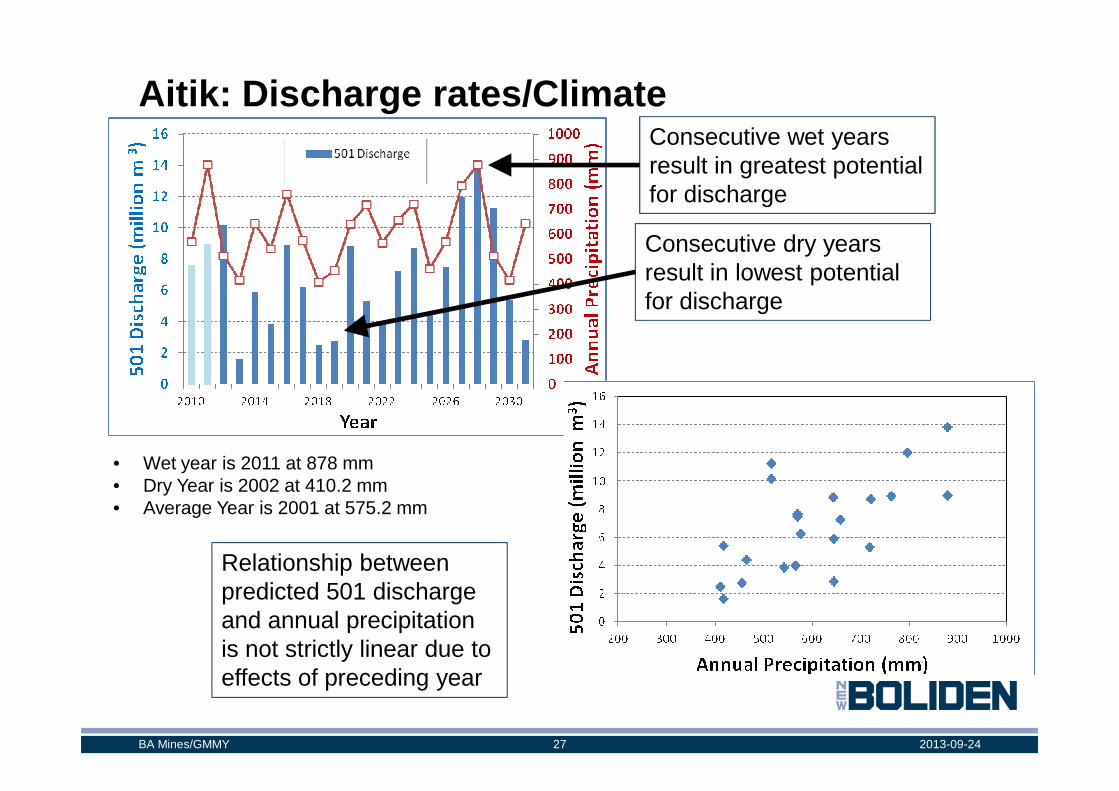
Aitik: Discharge rates/ClimateConsecutive wet years result in greatest potential for discharge
Consecutive dry years result in lowest potential for discharge
2013-09-2427BA Mines/GMMY
• Wet year is 2011 at 878 mm• Dry Year is 2002 at 410.2 mm• Average Year is 2001 at 575.2 mm
Relationship between predicted 501 discharge and annual precipitation is not strictly linear due to effects of preceding year
Aitik 45: Evaluating production/tailingsexpansion� Production increase from 36 to 45 Mton/yr, increase in size of tailings magasine and
clarification pond.
� 2 Alternatives considered for HS and LS tailings deposition, additional water storagecapacity:� Alternative 1: HS-South, Storage South� Alternative 2: HS-South, Storage North
� Alternatives run with multiple wet years, multiple dry years and average year climate
2013-09-2428BA Mines/GMMY
� Alternatives run with multiple wet years, multiple dry years and average year climatescenarios
� Both Alternative 1 and 2 have the full built capacity by 2015, and are essentially nullrunoff areas (only runoff from dam walls)
� All water in either the existing clarification pond or new north clarification pond is considered to be ”dirty” water.
� All excess water from the HS magasin passes through treatment prior to re-enteringthe system or being discharged.
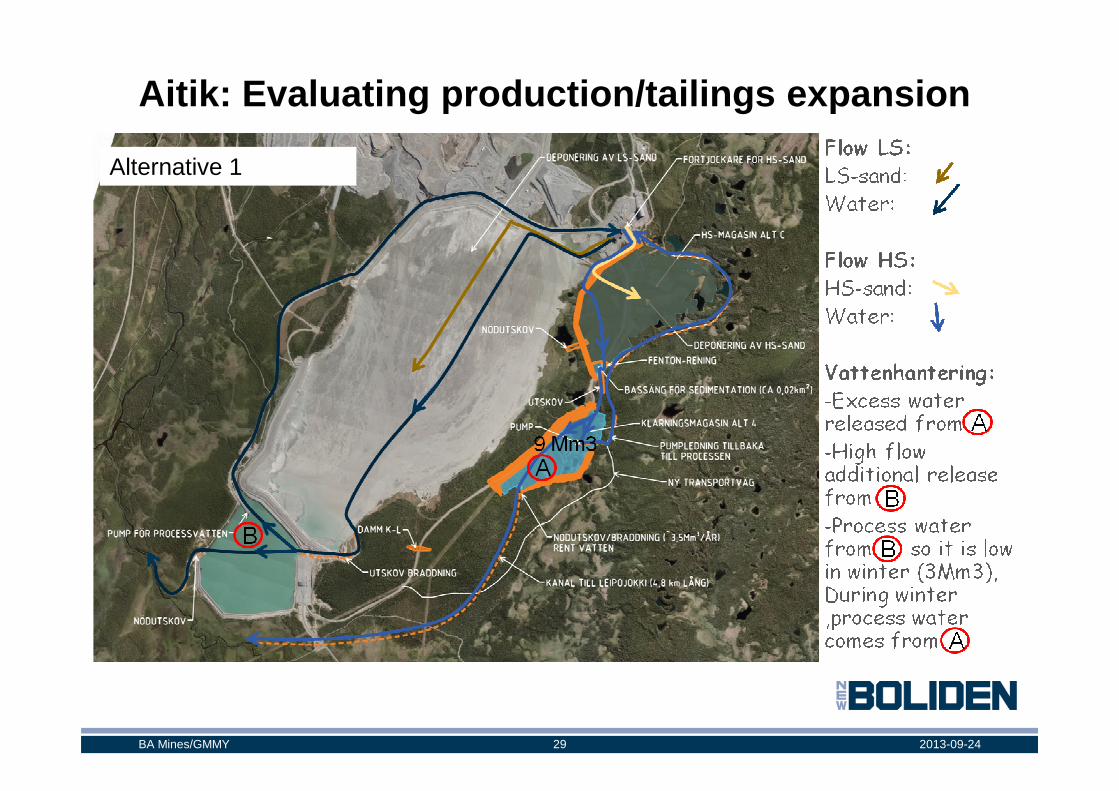
Aitik: Evaluating production/tailings expansion
Alternative 1
2013-09-2429BA Mines/GMMY
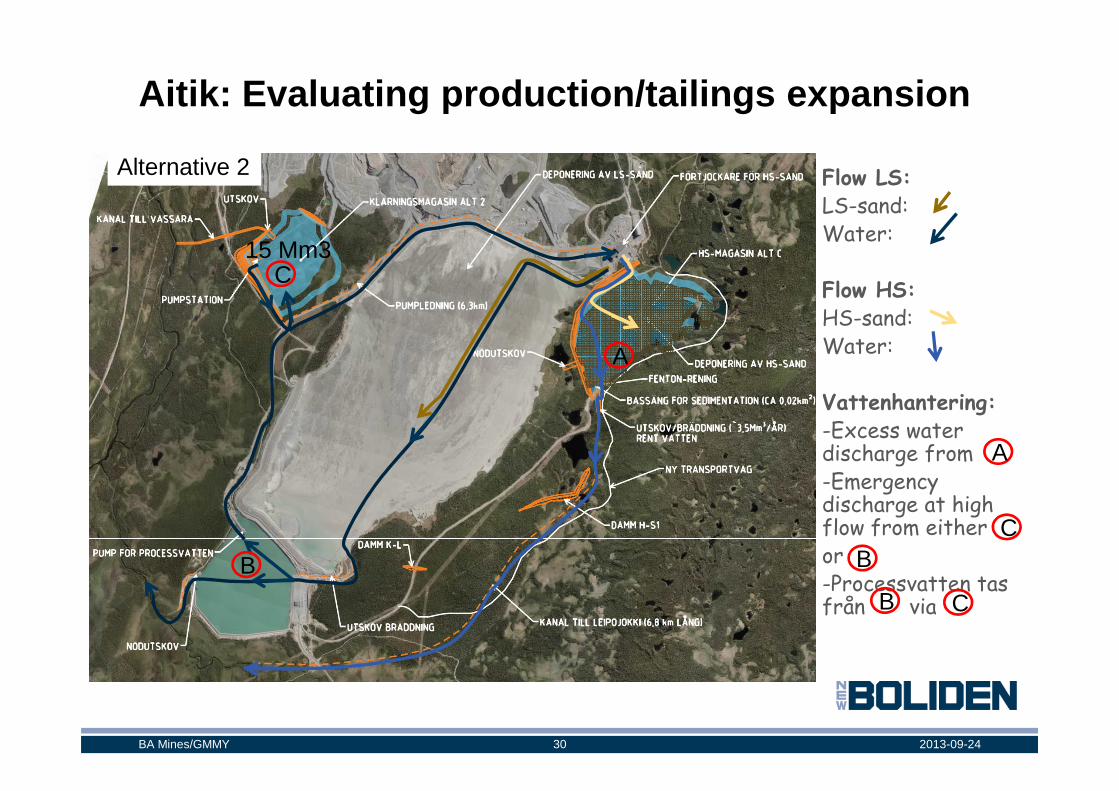
Aitik: Evaluating production/tailings expansion
Flow LS:LS-sand:Water:
Flow HS:HS-sand:Water:
Vattenhantering:
C
A
15 Mm3
Alternative 2
2013-09-2430BA Mines/GMMY
Vattenhantering:-Excess water discharge from-Emergencydischarge at high flow from eitheror -Processvatten tas från via
A
BB
B C
C
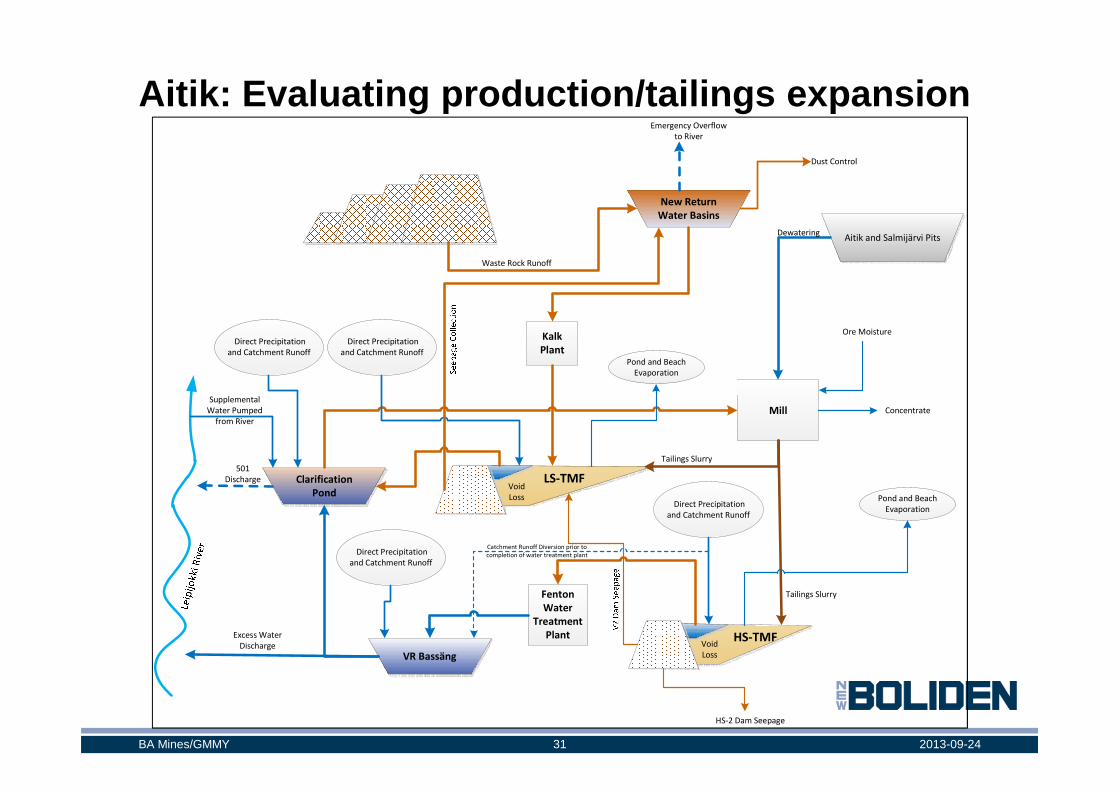
Aitik : Evaluating production/tailings expansion
Aitik and Salmijärvi PitsDewatering
Kalk
Plant
Waste Rock Runoff
Direct Precipitation
and Catchment Runoff
Direct Precipitation
and Catchment RunoffPond and Beach
Evaporation
Ore Moisture
New Return
Water Basins
Emergency Overflow
to River
Dust Control
2013-09-2431BA Mines/GMMY
LS-TMF
HS-TMF
Mill
VR Bassäng
Fenton
Water
Treatment
Plant
Clarification
Pond
501
Discharge
Tailings Slurry
Tailings Slurry
Direct Precipitation
and Catchment Runoff
Direct Precipitation
and Catchment Runoff
Pond and Beach
Evaporation
Concentrate
HS-2 Dam Seepage
Excess Water
Discharge Void
Loss
Void
Loss
Catchment Runoff Diversion prior to
completion of water treatment plant
Supplemental
Water Pumped
from River
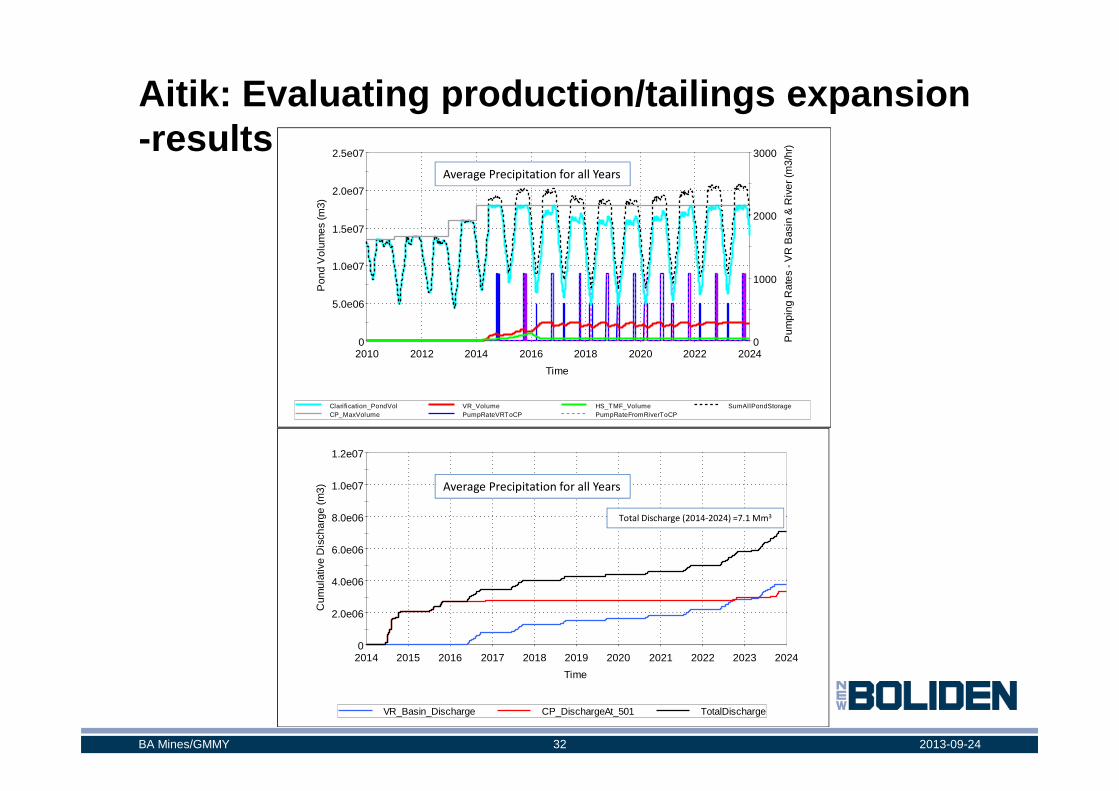
Aitik: Evaluating production/tailings expansion -results
0
5.0e06
1.0e07
1.5e07
2.0e07
2.5e07
2010 2012 2014 2016 2018 2020 2022 2024
Pon
d V
olum
es (m
3)
Time
0
1000
2000
3000
Pum
ping
Rat
es -
VR
Bas
in &
Riv
er (m
3/hr
)
Average Precipitation for all Years
2013-09-2432BA Mines/GMMY
0
2.0e06
4.0e06
6.0e06
8.0e06
1.0e07
1.2e07
2014 2015 2016 2017 2018 2019 2020 2021 2022 2023 2024
Cum
ulat
ive
Dis
char
ge (m
3)
Time
VR_Basin_Discharge CP_DischargeAt_501 TotalDischarge
Clarification_PondVol VR_Volume HS_TMF_Volume SumAllPondStorageCP_MaxVolume PumpRateVRToCP PumpRateFromRiverToCP
Average Precipitation for all Years
Total Discharge (2014-2024) =7.1 Mm3
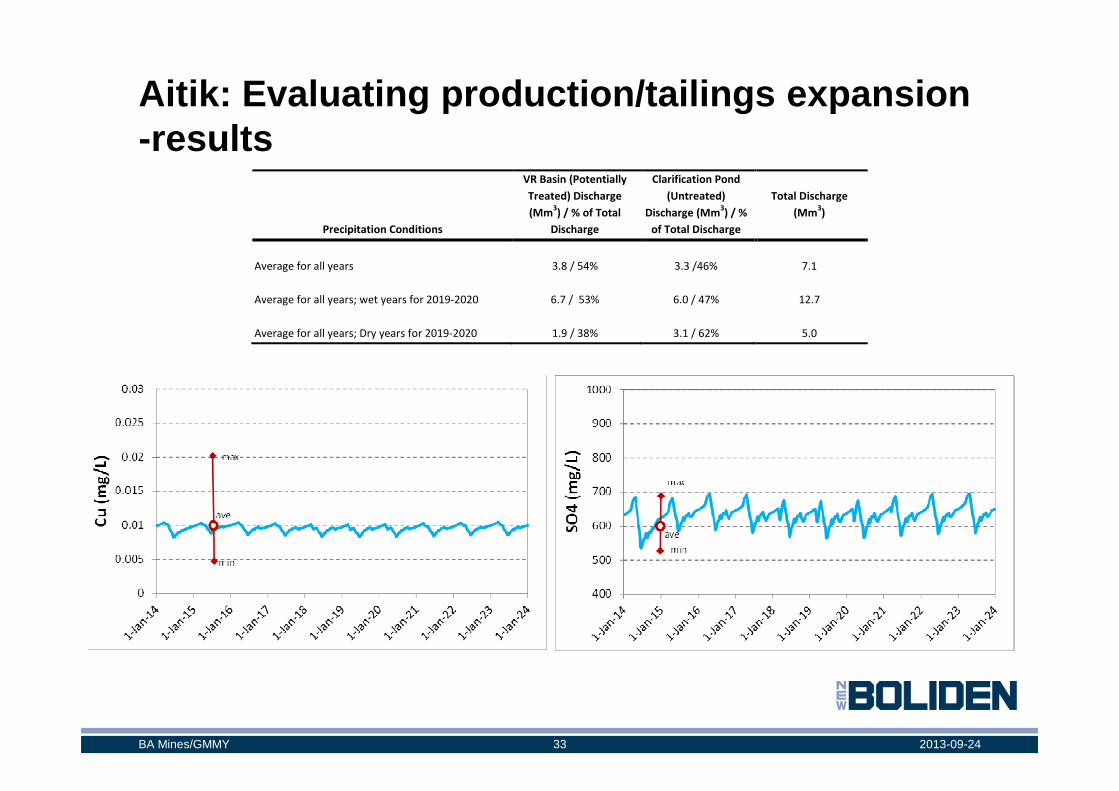
Aitik: Evaluating production/tailings expansion -results
Precipitation Conditions
VR Basin (Potentially
Treated) Discharge
(Mm3) / % of Total
Discharge
Clarification Pond
(Untreated)
Discharge (Mm3) / %
of Total Discharge
Total Discharge
(Mm3)
Average for all years 3.8 / 54%
3.3 /46% 7.1
Average for all years; wet years for 2019-2020 6.7 / 53%
6.0 / 47% 12.7
Average for all years; Dry years for 2019-2020 1.9 / 38%
3.1 / 62% 5.0
2013-09-2433BA Mines/GMMY
How are we using Water/Mass balance models for water management today?
� Layout-planning and design� Sizing of canals, basins, ponds, pumping capacity
� Estimation of environmental impacts� rechage rates/comsumption rates/discharge rates- how much, quality and when� Placement of water treatment systems (for best effect)
� Water management� Water requirements� Optimization of water usage� Effects of blending different source streams, recycling water� Optimization of discharge� Short term prediction for operational conditions� Planning for changes-production increases� Long term forecast for operations/closure scenarios� Redundancy tests
� Rep stop, climate events, system disturbances-pump failures, construction, power
2013-09-2434BA Mines/GMMY
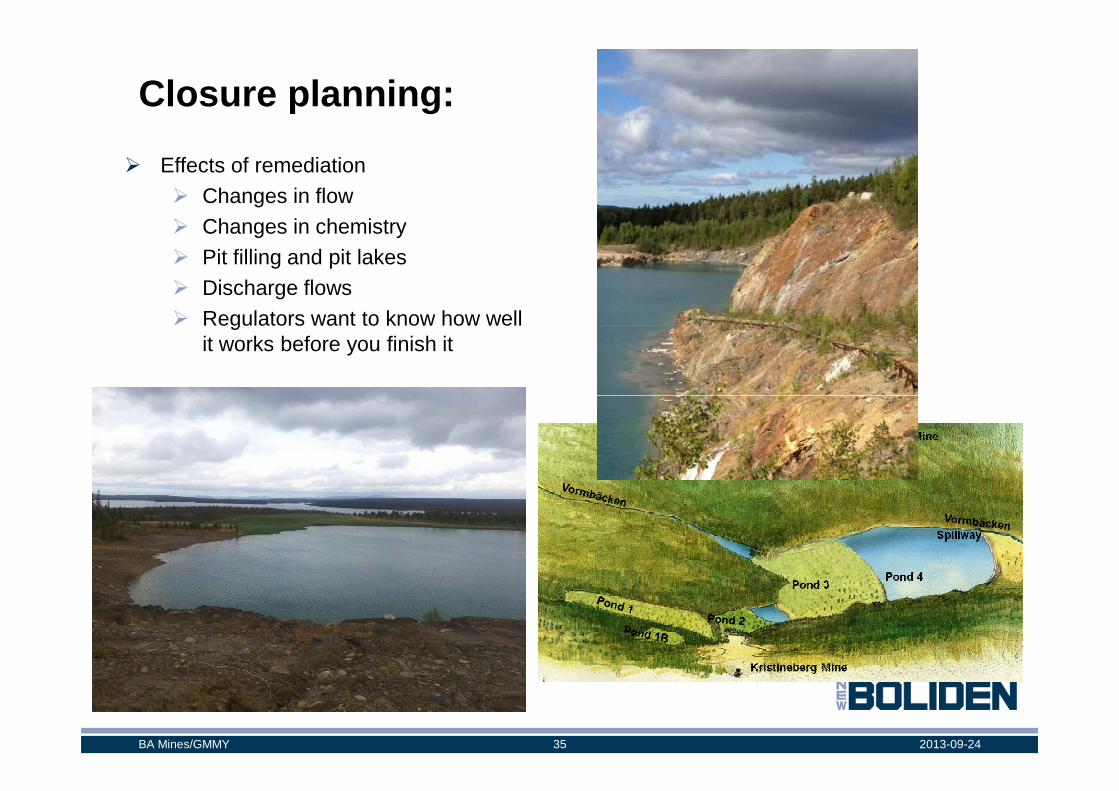
Closure planning :
� Effects of remediation� Changes in flow� Changes in chemistry� Pit filling and pit lakes � Discharge flows� Regulators want to know how well
it works before you finish it
2013-09-2435BA Mines/GMMY
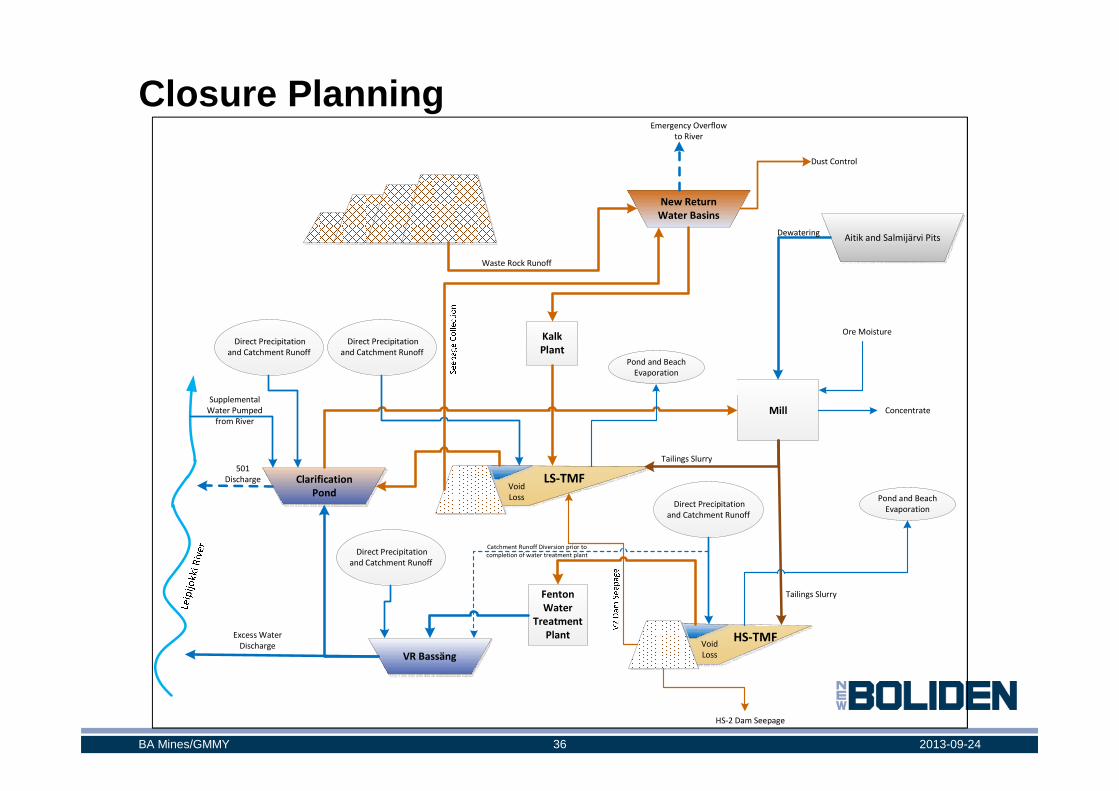
Closure Planning
Aitik and Salmijärvi PitsDewatering
Kalk
Plant
Waste Rock Runoff
Direct Precipitation
and Catchment Runoff
Direct Precipitation
and Catchment RunoffPond and Beach
Evaporation
Ore Moisture
New Return
Water Basins
Emergency Overflow
to River
Dust Control
2013-09-2436BA Mines/GMMY
LS-TMF
HS-TMF
Mill
VR Bassäng
Fenton
Water
Treatment
Plant
Clarification
Pond
501
Discharge
Tailings Slurry
Tailings Slurry
Direct Precipitation
and Catchment Runoff
Direct Precipitation
and Catchment Runoff
Pond and Beach
Evaporation
Concentrate
HS-2 Dam Seepage
Excess Water
Discharge Void
Loss
Void
Loss
Catchment Runoff Diversion prior to
completion of water treatment plant
Supplemental
Water Pumped
from River
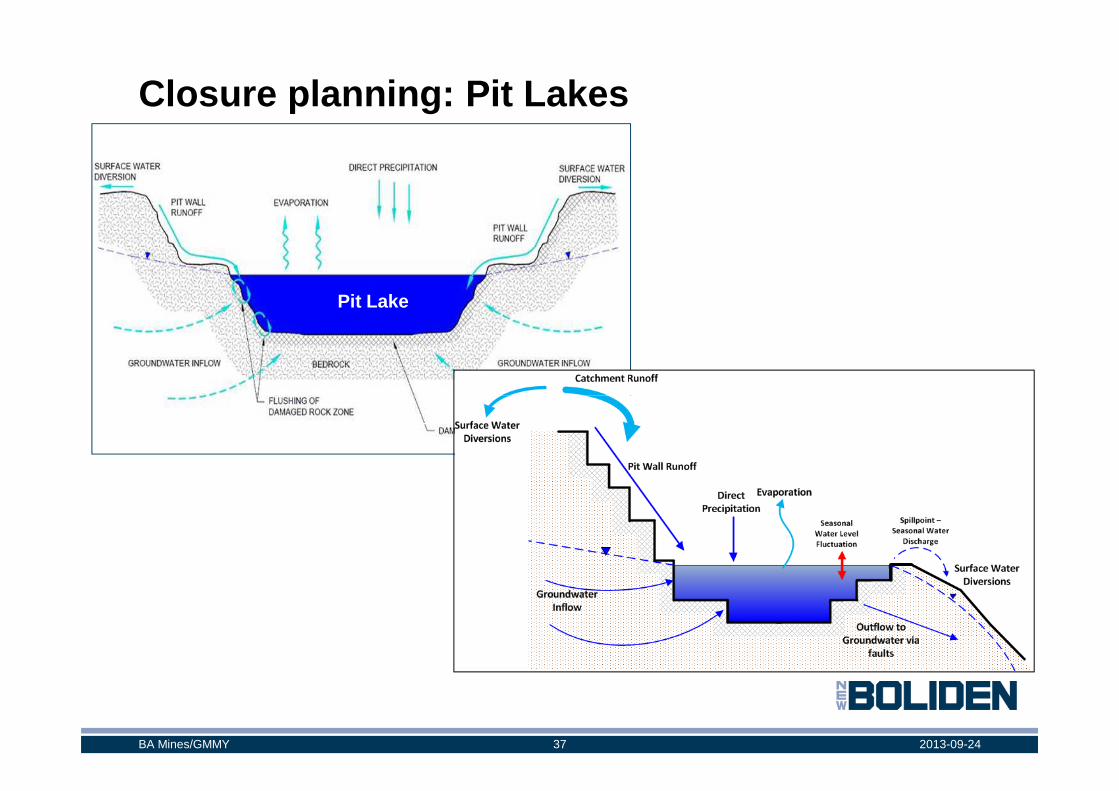
Closure planning : Pit Lakes
Pit Lake
2013-09-2437BA Mines/GMMY
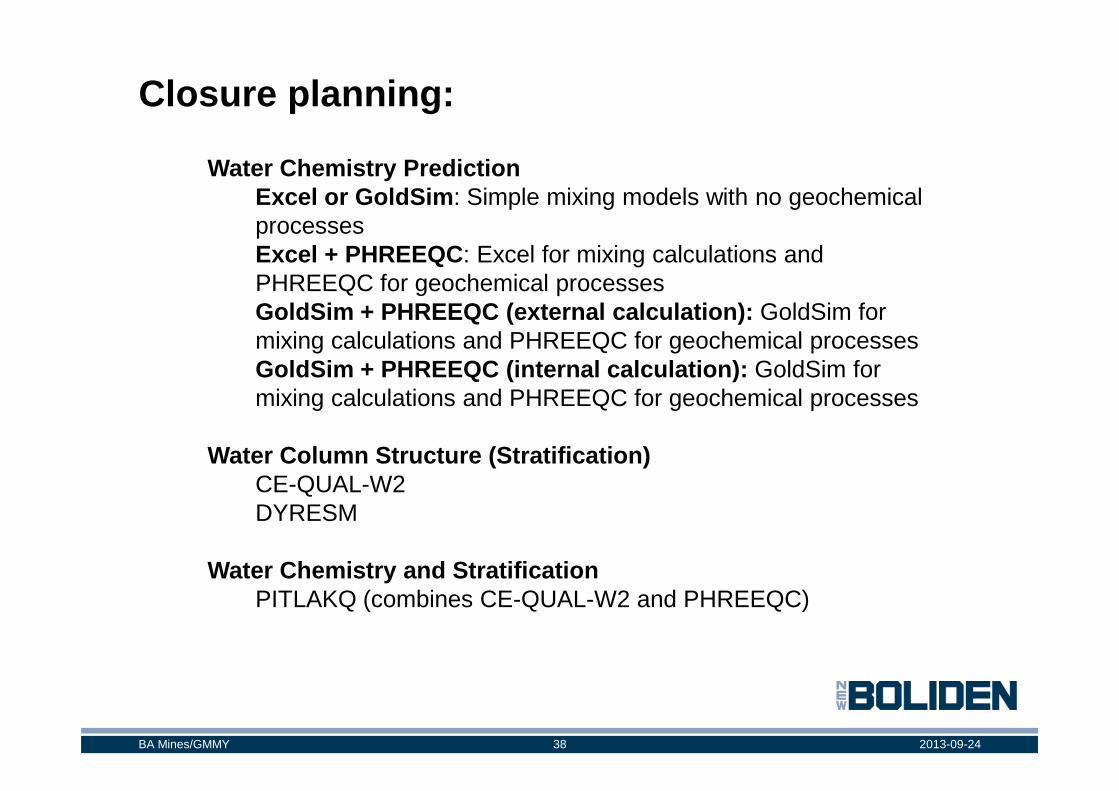
Closure planning :
Water Chemistry PredictionExcel or GoldSim : Simple mixing models with no geochemical processesExcel + PHREEQC : Excel for mixing calculations and PHREEQC for geochemical processesGoldSim + PHREEQC (external calculation): GoldSim for mixing calculations and PHREEQC for geochemical processesGoldSim + PHREEQC (internal calculation): GoldSim for mixing calculations and PHREEQC for geochemical processes
2013-09-2438BA Mines/GMMY
mixing calculations and PHREEQC for geochemical processes
Water Column Structure (Stratification)CE-QUAL-W2DYRESM
Water Chemistry and StratificationPITLAKQ (combines CE-QUAL-W2 and PHREEQC)
Thank you!
2013-09-2439BA Mines/GMMY