Embed Size (px)
Citation preview
BULLETION OF THE
Foreign Edition 2015 150
CONTENTS
The Geology of Gökçeada (Çanakkale).....RamazanSARI,AhmetTÜRKECAN,MustafaDÖNMEZ,ŞahsetKÜÇÜKEFE,ÜmitAYDINandÖnerÖZMEN 1
Benthic Foraminiferal Biostratigraphy of Malatya Oligo-Miocene Succession, (Eastern Taurids, Eastern Turkey).......................................................................................................................................................................FatmaGEDİK 19
TheSecretsofMassiveSulfideDepositsonMid-OceanRidgesandKüre-MağaradorukCopperDeposit...............................................................................YılmazALTUN,HüseyinYILMAZ,İlyasŞİNERandFatihYAZAR 51
OrogenicGoldProspectivityMappingUsingGeospatialDataIntegration,RegionofSaqez,NWofIran................................................................AlirezaALMASI,AlirezaJAFARİRAD,PeymanAFZALandManaRAHİMİ 65
GeologicalFactorsControllingPotentialofLigniteBedswithintheDanişmenFormationintheThraceBasin..................................................................DoğanPERİNÇEK,NurdanATAŞ,ŞeymaKARATUTandEsraERENSOY 77
ElementEnrichmentsinBituminousRocks,HatıldağField,Göynük/Bolu........................................................................................................................ AliSARI,MuradÇİLSALandŞükrüKOÇ 109
HalloysiteIntercalationofNorthwestAnatolia.............................................................................................................................BülentBAŞARAandSaruhanSAKLAR 121
RefinementoftheReverseExtrusionTesttoDeterminetheTwoConsistencyLimits.........................................................................................KamilKAYABALI,AylaBULUTÜSTÜNandAliÖZKESER 131
InvestigationofIrrigationWaterQualityofSurfaceandGroundwaterintheKütahyaPlain,Turkey.................................................................................... BerihuAbadiBERHE,MehmetÇELİKandUğurErdemDOKUZ 145
BriefNoteonNeogeneVolcanisminKemalpaşa–TorbalıBasin(İzmir)...................................................................................................................................................................... FikretGÖKTAŞ 163
Notes to the Authors ........................................................................................................................................................................169
MINERAL RESEARCH AND EXPLORATION
Bull. Min. Res. Exp. (2015) 150: 145-162
145
INVESTIGATION OF IRRIGATION WATER QUALITY OF SURFACE AND GROUNDWATER IN THE KÜTAHYA PLAIN, TURKEY
Berihu Abadi BERHEa*, Mehmet ÇELİKb and Uğur Erdem DOKUZa
a Ankara Üniversitesi, Fen Bilimleri Enstitüsü, Jeoloji Mühendisliği Anabilim Dalı, 06100, Tandoğan, Ankarab Ankara Üniversitesi, Mühendislik Fakültesi, Jeoloji Mühendisliği ABölümü, 06100, Tandoğan, Ankara
* Corresponding author: Berihu Abadi Berhe, [email protected]
ABSTRACTThe Kütahya plain is one of the plains in Kütahya/Turkey, where drinking, agricultural and industrial water supplies are highly dependent on groundwater resources. The local popula-tion largely depends on water from alluvial shallow aquifer waters and some on the Felent and Porsuk rivers. Appraisal of surface and groundwater quality is extremely important to make sure the sustainable use of it for drinking, agricultural, and industrial purposes. The chemical quality of surface and groundwater of Kütahya plain has been studied in detail in order to have better understanding of potential water quality. A total of 21 groundwater samples and 6 surface water samples were collected in and around the plain. The relative abundance of major ions (meq/l) for most of the water samples were Ca2+ ˃ Mg2+ ˃ (Na++K+) for cations and HCO3
- ˃SO42- ˃Cl- for anions. Five hydrochemical facies have been identi-
fied based on the major ion chemistry of the surface and groundwater of this area. However, based on hydrochemical facies, the type of water that predominates in the study area is Ca-Mg/Mg-Ca-HCO3 type during both December 2013 and June 2014. There is no significant change in the hydrochemical facies noticed during the two sampling periods. The chemical Index such as Sodium Absorption Ratio (SAR), Residual Sodium Carbonate (RSC), So-dium Percentage (%Na), Permeability Index (PI), Kelley Index (KI), Magnesium Ratio (MR), Potential Salinity (PS) and Total Hardness (TH) were calculated. The results indica-ted that SAR, RSC and KI values revealed 100%, %Na value revealed 92.6%, PI and PS values revealed 85.2% and MR value revealed 66.7% of water samples are within the safe limit suitable for irrigation. To sum up, the quality of surface and groundwater of Kütahya plain in general was suitable for irrigation.
Keywords: Water Chemistry, Water Quality, Hydrochemical Facies, Chemical Index, Agricultural Irrigation, Kütahya Plain
1. Introduction
Groundwater plays an important role in human life and development. The Safe portable water is absolutely essential for healthy living. About 80% diseases of the world population and more than one-third of the deaths in the developing countries are due to contamination of water (WHO 1993). Subsurface water is ultimate and most suitable fresh water resource for human consumption in both urban as well as rural areas. Rapid growth of population, development of agriculture and industrial activities especially in alluvial plain aquifers caused an intense increase in water consumption. The chemical
constituents of irrigation water can affect plant growth directly through toxicity or deficiency, or indirectly by altering plant availability of nutrients (Ayers and Westcot, 1985; Rowe and Abdel-Magid 1995). Capillary pressure is the main cause for increasing amount of salty waters in vadoz zone and hence the nature of upper part of the soil zone changes into more saline (Çelik et al., 2008).
Irrigation water quality is generally evaluated by some determining factors such as Sodium Absorption Ratio (SAR), Residual Sodium Carbonate (RSC), Sodium Percentage (%Na), and Electrical Conductivity (EC). Along with the these indicators,
Bulletin of the Mineral Research and Exploration
http://bulletin.mta.gov.tr
Irrigation of Quality of Kütahya Plain Waters
146
some additional indices to categorize the waters for irrigation like Permeability Index (PI), Kelley Index (KI) and Total Hardness (TH) are also important.
The location of this study area was Kütahya district of Kütahya plain. It is located in downstream of Köprüören plain and upstream of Porsuk dam where the people of Eskişehir and Kütahya use as main source of water for both irrigation and domestic purposes. In the study area, people of this district and surrounding villages are the pioneer users of surface and groundwater for drinking and irrigation Purpose.
The interactions between agricultural irrigation, surface water and groundwater resources are always very close. The agricultural activities and industrial establishments in Kütahya city such as: sugar factories, nitrogen factories and leather industries are responsible for disposing treated and untreated effluents in the natural drainage system of Felent and Porsuk rivers. This paper describes the surface and subsurface water chemistry of shallow aquifers affected by agricultural activities and industrial establishments at Kütahya plain, Kütahya, Turkey.
Therefore, the present study was mainly conducted to measure and analyze the irrigation water quality parameters of Felent and Porsuk Rivers and groundwater of Kütahya plain that could potentially impact food safety of irrigation crops.
1.1. Study Area
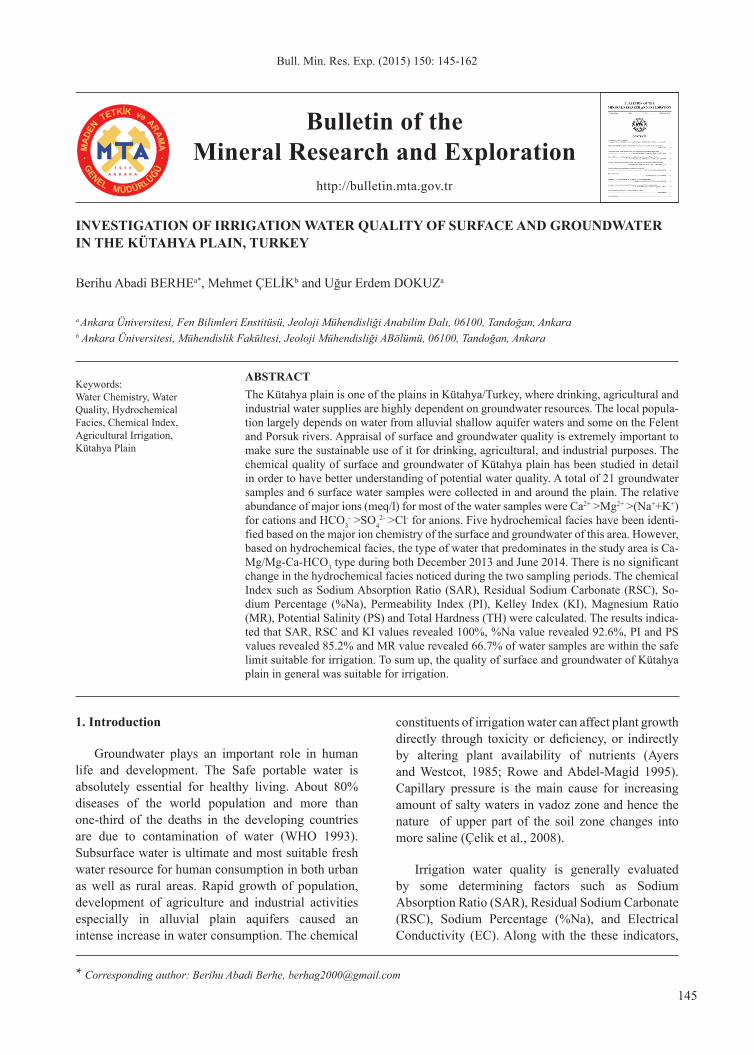
The study area, Kütahya plain including its catchment is bounded by (UTM ) coordinates 225000 – 268000 E longitude and 4345000 – 4380000 N latitude with an area of around 93 km2 and its cathment covers about 530 km2. Location map of study area shows in figure 1. The area is characterized by hills in the southwest and western parts. The highest elevation in the hilly area is 1764 m above sea level, whereas, much of the plain flat-lying, with height, typically, 920 to 950 m above sea level. The maximum length between the northwestern to southeastern tips and width of the plain is about 25.0 km and 5.5 km respectively. The natural surface drainage within the study area is generally towards the two dominant and perennial rivers: Felent and Porsuk Rivers. Felent River is fed by Enne dam located on the northwest of the Kütahya plain.
Figure 1- Location map of the study area and the sampling sites.
Bull. Min. Res. Exp. (2015) 150: 145-162
147
Kütahya has a warm summer continental climate, with cold and snowy winters and warm and dry summers. Rainfall occurs mostly during the spring and autumn. According to the data recorded at Kütahya Meteorological Station between the years 1975 and 2011, 75% of total rainfall occurs during the period of November - May and the annual average precipitation is about 543.85 mm. The average annual
air temperature is 10.8°C with a maximum in July to August and a minimum in December to January.
1.2. Geological and Hydrogeological situation
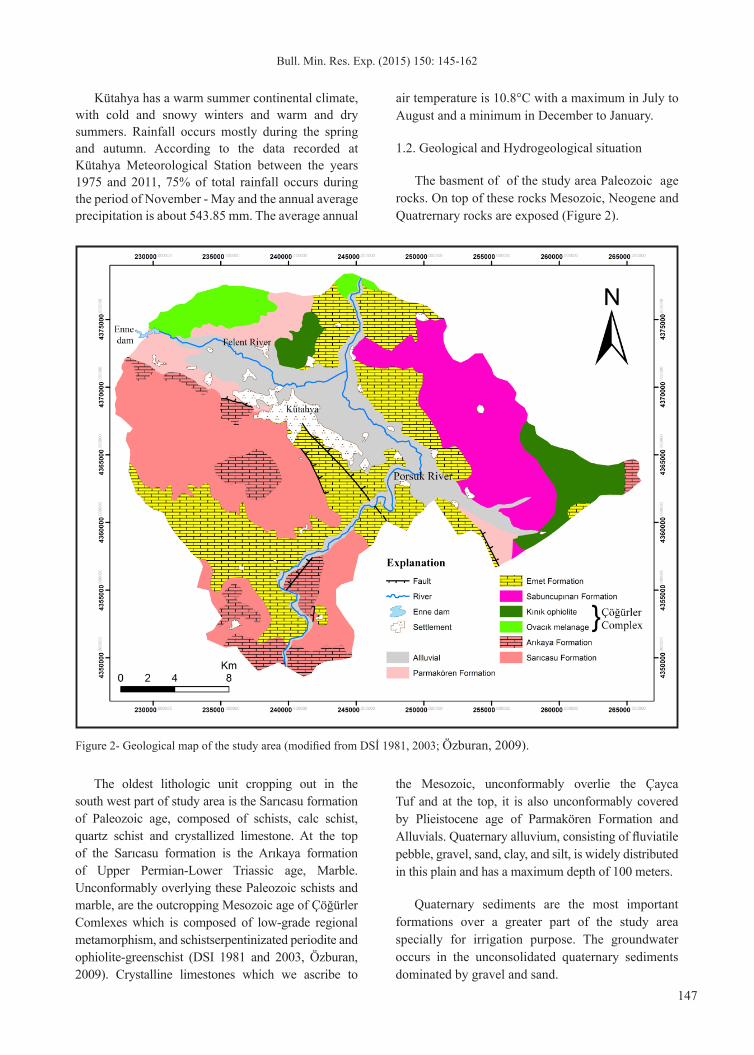
The basment of of the study area Paleozoic age rocks. On top of these rocks Mesozoic, Neogene and Quatrernary rocks are exposed (Figure 2).
Figure 2- Geological map of the study area (modified from DSİ 1981, 2003; Özburan, 2009).
The oldest lithologic unit cropping out in the south west part of study area is the Sarıcasu formation of Paleozoic age, composed of schists, calc schist, quartz schist and crystallized limestone. At the top of the Sarıcasu formation is the Arıkaya formation of Upper Permian-Lower Triassic age, Marble. Unconformably overlying these Paleozoic schists and marble, are the outcropping Mesozoic age of Çöğürler Comlexes which is composed of low-grade regional metamorphism, and schistserpentinizated periodite and ophiolite-greenschist (DSI 1981 and 2003, Özburan, 2009). Crystalline limestones which we ascribe to
the Mesozoic, unconformably overlie the Çayca Tuf and at the top, it is also unconformably covered by Plieistocene age of Parmakören Formation and Alluvials. Quaternary alluvium, consisting of fluviatile pebble, gravel, sand, clay, and silt, is widely distributed in this plain and has a maximum depth of 100 meters.
Quaternary sediments are the most important formations over a greater part of the study area specially for irrigation purpose. The groundwater occurs in the unconsolidated quaternary sediments dominated by gravel and sand.
Irrigation of Quality of Kütahya Plain Waters
148
In the plain the quaternary aquifer’s hydraulic conductivity (K) and transmissivity (T) ranges 0.01- 336 m/day and 1.61 - 1010 m2/day and with a mean values of 44.42 m/day and 213.48 m2/day, respectivelly (Berhe et al., 2014).
The Parmakören formation is also another water bearing formation exposed in western part of the plain. The sandstone and gravelstone of this formation has hydraulic conductivity that ranges from 0.02 to 0.44 m/day with a mean value of 0.11m/day, and transmissivity varies from 1.56 to 26.92 m2/day and its mean value is 8.59 m2/day (Berhe et al. 2014).
In some boreholes the hydraulic characteristics of limestone aquifer of Emet formation within the area is affected by the dominance of marl lithology. Yield values show that some wells gave very small amount of water: for example 0.7 L/sec. However, the overall yield and values of aquifer constants are generally high as compared to other aquifers of the study area. In this aquifer there is well that can provide about 84.27 L/sec and The calculated hydrualic conductivity (K) and transmissivity (T) of these wells of this formation are ranging between 0.003 – 26.3 m/day and 1.11 - 2662.01 m2/day with a mean value of 2.8 m/day and 350.81 m2/day, respectivelly (Berhe et al., 2014).
The well opened in Çöğürler Complex in the ophiolitic material and has a yield of 7 l/sec. According to the results calculated from pumping test of residual drawdown data, the transmissivity and hydrualic conductivity values were 6.64 m2/day and 0.034 m/day, respectively (Berhe et al., 2014).
2. Material and Method
Felent and Porsuk rivers were used to collect surface water samples and hand pumps, and wells opend by private and state hydrualic works Turkey were used to collect groundwater samples. A total of 6 surface river samples 3 from each were collected downstream and 21 groundwater samples were collected seasonally from Kütahya alluvial plain and sorrounding in December 2013 and June 2014. In-situ measurements of physicochemical parameters were done in the field using Multi 350i multi-parameter.
Water samples were filtered using 0.45 micron disposable capsule filter and collected in 250 ml polyethylene bottles with poly-seal caps for chemical analysis which have been done at Hacettepe University Water Chemistry Laboratory in Ankara, Turkey, using DIONEX LC25 and ICS-1000 High Performance Ion
Chromotgraphy system and Automatic acid titration burette (for HCO3
- and CO32-) using the Standard
Methods suggested by the American Public Health Association (APHA, 1989).
Aquachem Version 5.1 software was used to generate some of the important figures presented in this study.
In Arc GIS 10 software, geo-database was used to generate the spatial distribution maps of the chemical indices. The present work used the Inverse Distance Weighted (IDW) method for spatial interpolation of the chemical indices. Inverse Distance Weighted (IDW) is an interpolation technique in which interpolated estimates are made based on values at nearby locations weighted only by distance from the interpolation location (Naoum and Tsanis, 2004).
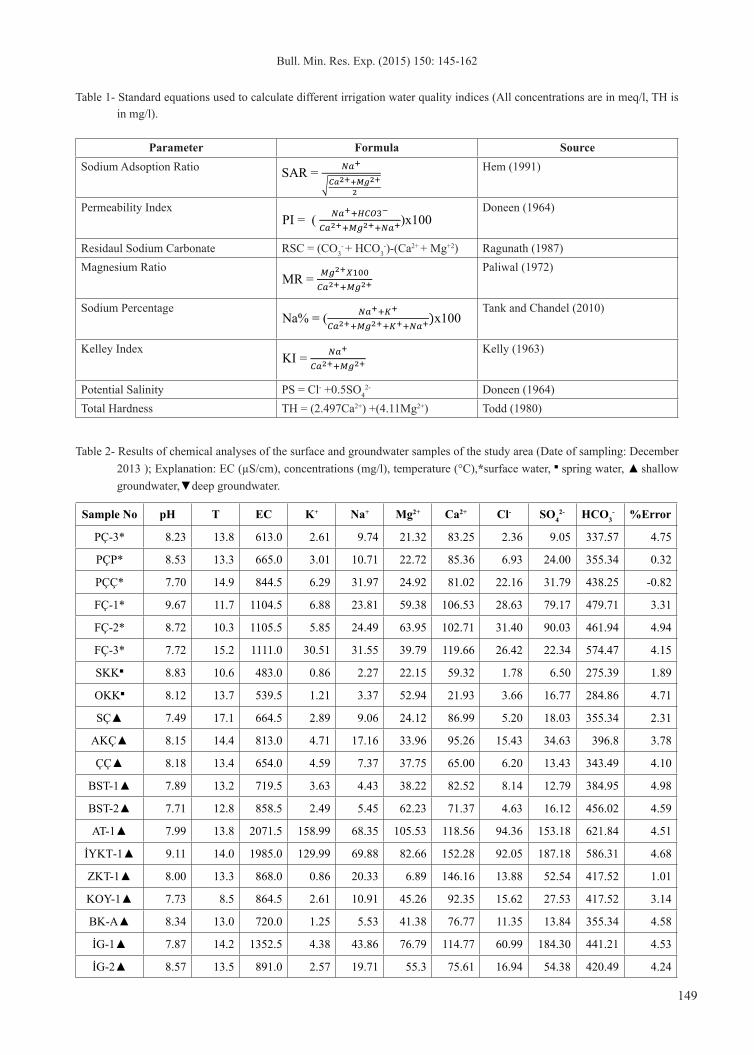
The parametres which were used in determination of irrigation water quality were all calculated using established standard equations (Table 1).
Electrical conductivity, at 25 °C, can be estimated by multiplying of the sum cations or anions (both in meq/l) by 100 where the accuracy of major ions is less than 5% (Appelo and Postma, 1994). In this study, electrical conductivity was not done in the field and the EC values of water samples collected during December 2013 was determined according this method (Table 2).
3. Results
3.1. Hydrogeochemistry
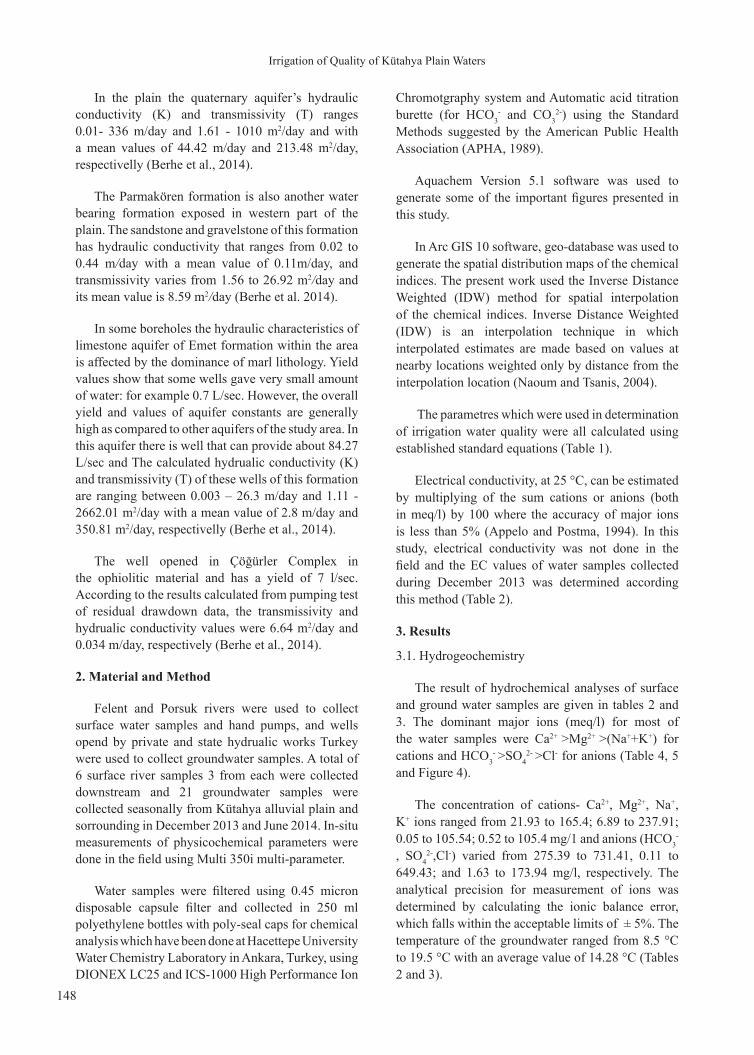
The result of hydrochemical analyses of surface and ground water samples are given in tables 2 and 3. The dominant major ions (meq/l) for most of the water samples were Ca2+ ˃Mg2+ ˃(Na++K+) for cations and HCO3
- ˃SO42- ˃Cl- for anions (Table 4, 5
and Figure 4).
The concentration of cations- Ca2+, Mg2+, Na+, K+ ions ranged from 21.93 to 165.4; 6.89 to 237.91; 0.05 to 105.54; 0.52 to 105.4 mg/1 and anions (HCO3
-
, SO42-,Cl-) varied from 275.39 to 731.41, 0.11 to
649.43; and 1.63 to 173.94 mg/l, respectively. The analytical precision for measurement of ions was determined by calculating the ionic balance error, which falls within the acceptable limits of ± 5%. The temperature of the groundwater ranged from 8.5 °C to 19.5 °C with an average value of 14.28 °C (Tables 2 and 3).
Bull. Min. Res. Exp. (2015) 150: 145-162
149
Table 2- Results of chemical analyses of the surface and groundwater samples of the study area (Date of sampling: December 2013 ); Explanation: EC (µS/cm), concentrations (mg/l), temperature (°C),*surface water, ■ spring water, ▲ shallow groundwater,▼deep groundwater.
Sample No pH T EC K+ Na+ Mg2+ Ca2+ Cl- SO42- HCO3
- %Error
PÇ-3* 8.23 13.8 613.0 2.61 9.74 21.32 83.25 2.36 9.05 337.57 4.75
PÇP* 8.53 13.3 665.0 3.01 10.71 22.72 85.36 6.93 24.00 355.34 0.32
PÇÇ* 7.70 14.9 844.5 6.29 31.97 24.92 81.02 22.16 31.79 438.25 -0.82
FÇ-1* 9.67 11.7 1104.5 6.88 23.81 59.38 106.53 28.63 79.17 479.71 3.31
FÇ-2* 8.72 10.3 1105.5 5.85 24.49 63.95 102.71 31.40 90.03 461.94 4.94
FÇ-3* 7.72 15.2 1111.0 30.51 31.55 39.79 119.66 26.42 22.34 574.47 4.15
SKK■ 8.83 10.6 483.0 0.86 2.27 22.15 59.32 1.78 6.50 275.39 1.89
OKK■ 8.12 13.7 539.5 1.21 3.37 52.94 21.93 3.66 16.77 284.86 4.71
SÇ▲ 7.49 17.1 664.5 2.89 9.06 24.12 86.99 5.20 18.03 355.34 2.31
AKÇ▲ 8.15 14.4 813.0 4.71 17.16 33.96 95.26 15.43 34.63 396.8 3.78
ÇÇ▲ 8.18 13.4 654.0 4.59 7.37 37.75 65.00 6.20 13.43 343.49 4.10
BST-1▲ 7.89 13.2 719.5 3.63 4.43 38.22 82.52 8.14 12.79 384.95 4.98
BST-2▲ 7.71 12.8 858.5 2.49 5.45 62.23 71.37 4.63 16.12 456.02 4.59
AT-1▲ 7.99 13.8 2071.5 158.99 68.35 105.53 118.56 94.36 153.18 621.84 4.51
İYKT-1▲ 9.11 14.0 1985.0 129.99 69.88 82.66 152.28 92.05 187.18 586.31 4.68
ZKT-1▲ 8.00 13.3 868.0 0.86 20.33 6.89 146.16 13.88 52.54 417.52 1.01
KOY-1▲ 7.73 8.5 864.5 2.61 10.91 45.26 92.35 15.62 27.53 417.52 3.14
BK-A▲ 8.34 13.0 720.0 1.25 5.53 41.38 76.77 11.35 13.84 355.34 4.58
İG-1▲ 7.87 14.2 1352.5 4.38 43.86 76.79 114.77 60.99 184.30 441.21 4.53
İG-2▲ 8.57 13.5 891.0 2.57 19.71 55.3 75.61 16.94 54.38 420.49 4.24
Table 1- Standard equations used to calculate different irrigation water quality indices (All concentrations are in meq/l, TH is in mg/l).
Parameter Formula SourceSodium Adsoption Ratio Hem (1991)
Permeability Index Doneen (1964)
Residaul Sodium Carbonate RSC = (CO3- + HCO3
-)-(Ca2+ + Mg+2) Ragunath (1987)Magnesium Ratio Paliwal (1972)
Sodium Percentage Tank and Chandel (2010)
Kelley Index Kelly (1963)
Potential Salinity PS = Cl- +0.5SO42- Doneen (1964)
Total Hardness TH = (2.497Ca2+) +(4.11Mg2+) Todd (1980)
Tables
Table 1- Standard equations used to calculate different irrigation water quality indices (All concentrations are in meq/l, TH is in mg/l)
Parameter Formula Source
Sodium Adsoption Ratio SAR = 𝑁𝑁𝑁𝑁𝑁𝑁𝑁𝑁+
�𝐶𝐶𝐶𝐶𝐶𝐶𝐶𝐶2++𝑀𝑀𝑀𝑀𝑀𝑀𝑀𝑀2+
2
Hem (1991)
Permeability Index PI = ( 𝑁𝑁𝑁𝑁𝑁𝑁𝑁𝑁++𝐻𝐻𝐻𝐻𝐻𝐻𝐻𝐻𝐻𝐻𝐻𝐻3−
𝐻𝐻𝐻𝐻𝑁𝑁𝑁𝑁2++𝑀𝑀𝑀𝑀𝑀𝑀𝑀𝑀2++𝑁𝑁𝑁𝑁𝑁𝑁𝑁𝑁+)x100 Doneen (1964)
Residaul Sodium Carbonate RSC = (CO3- + HCO3
-)-(Ca2+ + Mg+2) Ragunath (1987)
Magnesium Ratio MR = 𝑀𝑀𝑀𝑀𝑀𝑀𝑀𝑀2+𝑋𝑋𝑋𝑋100
𝐻𝐻𝐻𝐻𝑁𝑁𝑁𝑁2++𝑀𝑀𝑀𝑀𝑀𝑀𝑀𝑀2+Paliwal (1972)
SodiumPercent Na% = ( 𝑁𝑁𝑁𝑁𝑁𝑁𝑁𝑁++𝐾𝐾𝐾𝐾+
𝐻𝐻𝐻𝐻𝑁𝑁𝑁𝑁2++𝑀𝑀𝑀𝑀𝑀𝑀𝑀𝑀2++𝐾𝐾𝐾𝐾++𝑁𝑁𝑁𝑁𝑁𝑁𝑁𝑁+)x100 Tank and Chandel (2010)
Kelley Index KI = 𝑁𝑁𝑁𝑁𝑁𝑁𝑁𝑁+
𝐻𝐻𝐻𝐻𝑁𝑁𝑁𝑁2++𝑀𝑀𝑀𝑀𝑀𝑀𝑀𝑀2+Kelly (1963)
Potential Salinity PS = Cl- +0.5SO42- Doneen (1964)
Total Hardness TH = (2.497Ca2+) +(4.11Mg2+) Todd (1980)
Irrigation of Quality of Kütahya Plain Waters
150
Table 3- Results of chemical analyses of the surface and groundwater samples of the study area (Date of sampling: June 2014); Explanation: EC (µS/cm), concentrations (mg/l), temperature (°C),*surface water, ■ spring water, ▲ shallow groundwater,▼deep groundwater.
Sample No pH T EC K+ Na+ Mg2+ Ca2+ Cl- SO42- HCO3
- %Error
PÇ-3* 7.58 16.9 548 2.30 8.55 25.03 82.40 4.98 20.16 331.65 4.29
PÇP* 7.54 18.5 608 3.82 15.64 27.33 85.61 11.58 24.20 361.26 3.70
PÇÇ* 7.24 18.4 762 6.53 23.87 32.04 82.95 21.68 38.14 393.83 4.78
FÇ-1* 7.42 15.5 690 5.70 17.06 33.35 86.03 14.60 52.29 373.11 4.59
FÇ-2* 7.52 15.4 556 4.16 12.12 27.75 72.38 11.48 40.29 302.04 3.43
FÇ-3* 7.34 19.2 672 7.03 19.74 30.96 78.65 18.71 54.64 343.49 4.76
SKK■ 7.62 12.8 431 0.52 1.24 26.71 59.24 1.63 6.06 284.27 3.60
OKK■ 7.35 13.9 694 0.85 2.82 57.99 81.00 3.10 16.56 479.71 3.82
SÇ▲ 7.20 17.1 559 2.19 7.54 21.41 93.36 5.11 16.95 343.49 4.38
AKÇ▲ 7.32 15.9 672 3.44 14.25 35.31 91.09 11.61 32.62 393.83 3.69
ÇÇ▲ 7.47 15.4 542 3.63 6.01 43.46 60.63 5.21 12.59 367.18 3.02
BST-1▲ 7.55 16.4 629 2.26 3.68 43.18 77.69 5.96 12.62 384.95 3.78
BST-2▲ 7.32 16.2 681 2.15 5.15 57.10 75.63 3.87 12.93 456.02 4.50
AT-1▲ 7.15 17.1 2050 165.99 63.35 100.53 120.56 95.36 140.18 630.84 4.51
İYKT-1▲ 7.10 19.5 1677 105.40 57.44 85.59 146.58 89.27 173.05 581.10 3.78
ZKT-1▲ 7.04 18.6 822 0.60 16.73 12.42 165.40 17.00 50.88 444.17 4.72
KOY-1▲ 7.25 12.6 756 1.87 9.00 48.95 97.81 14.79 24.54 444.17 3.67
BK-A▲ 7.20 14.6 625 0.89 4.39 42.40 75.78 11.48 13.40 364.22 3.58
İG-1▲ 7.16 14.3 1226 3.29 39.84 83.02 128.86 83.41 231.92 438.25 2.12
İG-2▲ 7.21 12.3 767 2.10 18.59 54.37 82.82 15.96 60.84 432.33 3.54
İG-3▲ 7.19 12.5 1822 5.04 73.71 173.39 124.55 110.99 430.32 651.45 2.20
KOYM▲ 7.01 12.0 789 9.44 8.18 47.64 101.53 18.54 25.58 467.86 3.73
K-1▼ 7.13 17.6 832 6.88 29.65 34.13 102.73 76.57 50.57 319.80 3.35
K-2▼ 7.49 19.0 580 5.64 11.00 36.61 59.71 13.59 27.25 296.12 3.95
PÖ-1▼ 7.31 18.7 516 1.44 14.74 33.37 53.68 6.26 9.06 313.88 3.03
SKÇK▼ 7.11 13.5 667 0.73 5.42 21.79 120.93 8.38 5.21 432.33 3.06
OK Kuyu▼ 7.08 12.2 555 0.78 4.28 30.34 71.13 6.29 10.24 337.57 1.32
İG-3▲ 8.93 14.5 3135.0 8.02 105.54 237.91 154.30 173.94 649.43 731.41 2.83
KOYM▲ 7.74 12.2 1139.0 14.09 16.08 51.91 123.41 35.50 51.42 538.93 1.58
K-1▼ 7.92 14.5 704.5 6.53 19.94 22.95 86.74 25.48 41.09 296.12 3.34
K-2▼ 8.00 14.1 793.5 7.45 19.78 40.49 76.82 20.86 60.19 331.65 4.25
PÖ-1▼ 8.46 13.8 576.5 1.85 16.4 29.78 50.16 6.33 9.39 313.88 -0.05
SKÇK▼ 8.39 10.1 795.0 1.19 5.78 16.36 133.31 6.51 9.72 432.33 4.52
OKKuyu▼ 8.45 12.7 517.0 0.60 3.12 24.67 60.26 3.19 2.73 302.04 0.44
Table 2- (continued)
Bull. Min. Res. Exp. (2015) 150: 145-162
151
Figure 3- Piper’s diagram of surface and groundwater samples (Sampling date- A: December 2013 and B: June 2014).
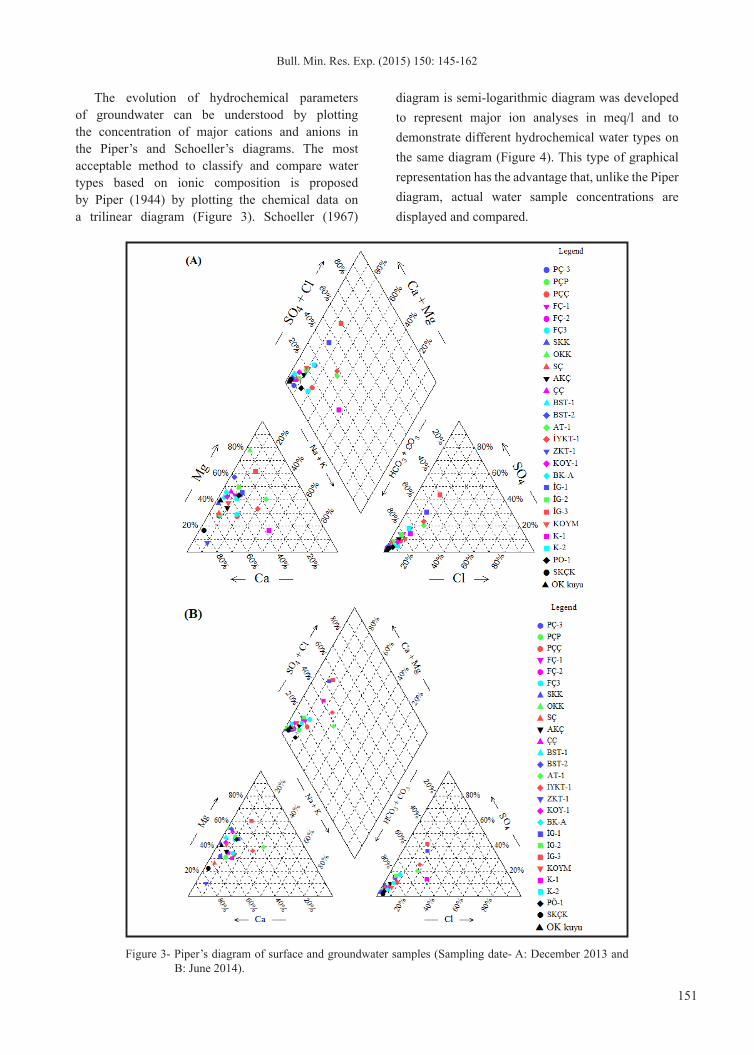
The evolution of hydrochemical parameters of groundwater can be understood by plotting the concentration of major cations and anions in the Piper’s and Schoeller’s diagrams. The most acceptable method to classify and compare water types based on ionic composition is proposed by Piper (1944) by plotting the chemical data on a trilinear diagram (Figure 3). Schoeller (1967)
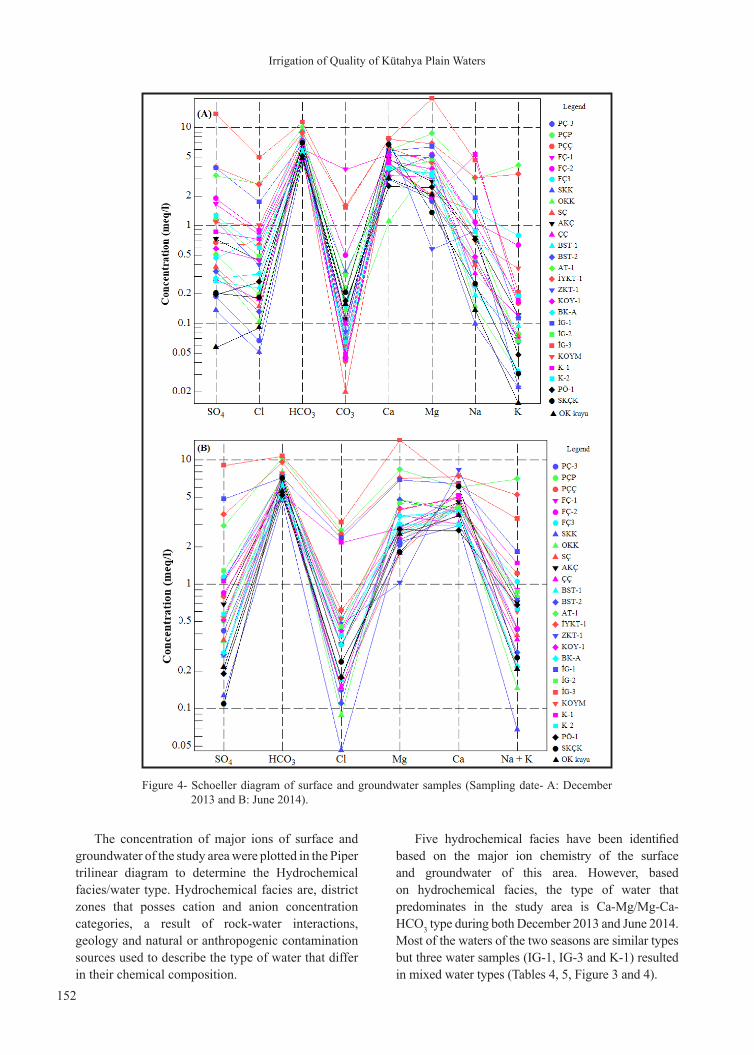
diagram is semi-logarithmic diagram was developed to represent major ion analyses in meq/l and to demonstrate different hydrochemical water types on the same diagram (Figure 4). This type of graphical representation has the advantage that, unlike the Piper diagram, actual water sample concentrations are displayed and compared.
Irrigation of Quality of Kütahya Plain Waters
152
Figure 4- Schoeller diagram of surface and groundwater samples (Sampling date- A: December 2013 and B: June 2014).
The concentration of major ions of surface and groundwater of the study area were plotted in the Piper trilinear diagram to determine the Hydrochemical facies/water type. Hydrochemical facies are, district zones that posses cation and anion concentration categories, a result of rock-water interactions, geology and natural or anthropogenic contamination sources used to describe the type of water that differ in their chemical composition.
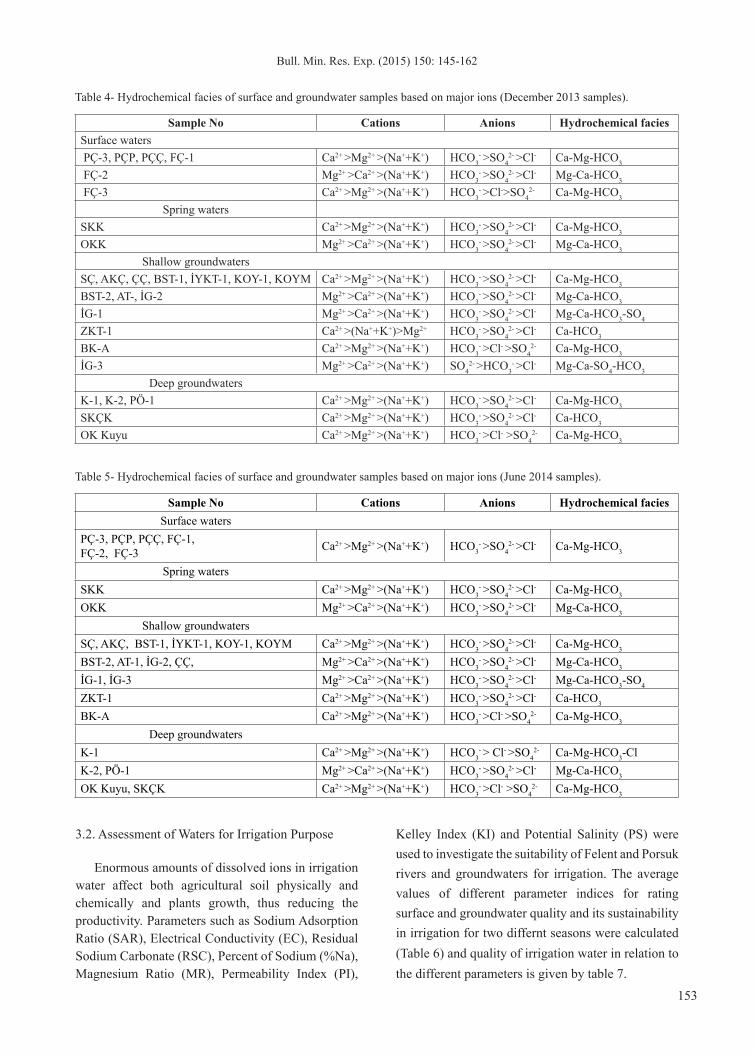
Five hydrochemical facies have been identified based on the major ion chemistry of the surface and groundwater of this area. However, based on hydrochemical facies, the type of water that predominates in the study area is Ca-Mg/Mg-Ca- HCO3 type during both December 2013 and June 2014. Most of the waters of the two seasons are similar types but three water samples (IG-1, IG-3 and K-1) resulted in mixed water types (Tables 4, 5, Figure 3 and 4).
Bull. Min. Res. Exp. (2015) 150: 145-162
153
Table 4- Hydrochemical facies of surface and groundwater samples based on major ions (December 2013 samples).
Sample No Cations Anions Hydrochemical faciesSurface waters PÇ-3, PÇP, PÇÇ, FÇ-1 Ca2+ ˃Mg2+ ˃(Na++K+) HCO3
- ˃SO42- ˃Cl- Ca-Mg-HCO3
FÇ-2 Mg2+ ˃Ca2+ ˃(Na++K+) HCO3- ˃SO4
2- ˃Cl- Mg-Ca-HCO3
FÇ-3 Ca2+ ˃Mg2+ ˃(Na++K+) HCO3- ˃Cl-˃SO4
2- Ca-Mg-HCO3
Spring waters SKK Ca2+ ˃Mg2+ ˃(Na++K+) HCO3
- ˃SO42- ˃Cl- Ca-Mg-HCO3
OKK Mg2+ ˃Ca2+ ˃(Na++K+) HCO3- ˃SO4
2- ˃Cl- Mg-Ca-HCO3
Shallow groundwatersSÇ, AKÇ, ÇÇ, BST-1, İYKT-1, KOY-1, KOYM Ca2+ ˃Mg2+ ˃(Na++K+) HCO3
- ˃SO42- ˃Cl- Ca-Mg-HCO3
BST-2, AT-, İG-2 Mg2+ ˃Ca2+ ˃(Na++K+) HCO3- ˃SO4
2- ˃Cl- Mg-Ca-HCO3
İG-1 Mg2+ ˃Ca2+ ˃(Na++K+) HCO3- ˃SO4
2- ˃Cl- Mg-Ca-HCO3-SO4
ZKT-1 Ca2+ ˃(Na++K+)˃Mg2+ HCO3- ˃SO4
2- ˃Cl- Ca-HCO3
BK-A Ca2+ ˃Mg2+ ˃(Na++K+) HCO3- ˃Cl- ˃SO4
2- Ca-Mg-HCO3
İG-3 Mg2+ ˃Ca2+ ˃(Na++K+) SO42- ˃HCO3
- ˃Cl- Mg-Ca-SO4-HCO3
Deep groundwatersK-1, K-2, PÖ-1 Ca2+ ˃Mg2+ ˃(Na++K+) HCO3
- ˃SO42- ˃Cl- Ca-Mg-HCO3
SKÇK Ca2+ ˃Mg2+ ˃(Na++K+) HCO3- ˃SO4
2- ˃Cl- Ca-HCO3
OK Kuyu Ca2+ ˃Mg2+ ˃(Na++K+) HCO3- ˃Cl- ˃SO4
2- Ca-Mg-HCO3
Table 5- Hydrochemical facies of surface and groundwater samples based on major ions (June 2014 samples).
Sample No Cations Anions Hydrochemical faciesSurface waters
PÇ-3, PÇP, PÇÇ, FÇ-1, FÇ-2, FÇ-3 Ca2+ ˃Mg2+ ˃(Na++K+) HCO3
- ˃SO42- ˃Cl- Ca-Mg-HCO3
Spring waters SKK Ca2+ ˃Mg2+ ˃(Na++K+) HCO3
- ˃SO42- ˃Cl- Ca-Mg-HCO3
OKK Mg2+ ˃Ca2+ ˃(Na++K+) HCO3- ˃SO4
2- ˃Cl- Mg-Ca-HCO3
Shallow groundwaters SÇ, AKÇ, BST-1, İYKT-1, KOY-1, KOYM Ca2+ ˃Mg2+ ˃(Na++K+) HCO3
- ˃SO42- ˃Cl- Ca-Mg-HCO3
BST-2, AT-1, İG-2, ÇÇ, Mg2+ ˃Ca2+ ˃(Na++K+) HCO3- ˃SO4
2- ˃Cl- Mg-Ca-HCO3
İG-1, İG-3 Mg2+ ˃Ca2+ ˃(Na++K+) HCO3- ˃SO4
2- ˃Cl- Mg-Ca-HCO3-SO4
ZKT-1 Ca2+ ˃Mg2+ ˃(Na++K+) HCO3- ˃SO4
2- ˃Cl- Ca-HCO3
BK-A Ca2+ ˃Mg2+ ˃(Na++K+) HCO3- ˃Cl- ˃SO4
2- Ca-Mg-HCO3
Deep groundwaters K-1 Ca2+ ˃Mg2+ ˃(Na++K+) HCO3
- ˃ Cl- ˃SO42- Ca-Mg-HCO3-Cl
K-2, PÖ-1 Mg2+ ˃Ca2+ ˃(Na++K+) HCO3- ˃SO4
2- ˃Cl- Mg-Ca-HCO3
OK Kuyu, SKÇK Ca2+ ˃Mg2+ ˃(Na++K+) HCO3- ˃Cl- ˃SO4
2- Ca-Mg-HCO3
3.2. Assessment of Waters for Irrigation Purpose
Enormous amounts of dissolved ions in irrigation water affect both agricultural soil physically and chemically and plants growth, thus reducing the productivity. Parameters such as Sodium Adsorption Ratio (SAR), Electrical Conductivity (EC), Residual Sodium Carbonate (RSC), Percent of Sodium (%Na), Magnesium Ratio (MR), Permeability Index (PI),
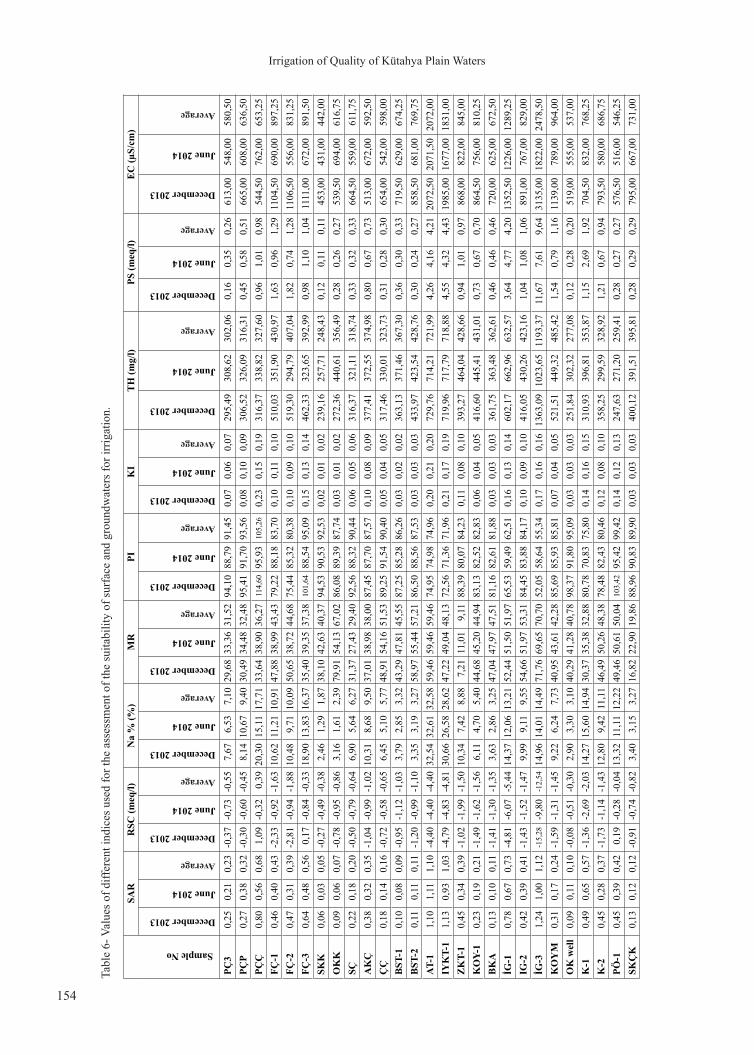
Kelley Index (KI) and Potential Salinity (PS) were used to investigate the suitability of Felent and Porsuk rivers and groundwaters for irrigation. The average values of different parameter indices for rating surface and groundwater quality and its sustainability in irrigation for two differnt seasons were calculated (Table 6) and quality of irrigation water in relation to the different parameters is given by table 7.
Irrigation of Quality of Kütahya Plain Waters
154
Sample No
SAR
R
SC (m
eq/l)
Na
% (%
)M
RPI
KI
TH
(mg/
l)PS
(meq
/l)E
C (µ
S/cm
)December 2013
June 2014
Average
December 2013
June 2014
Average
December 2013
June 2014
Average
December 2013
June 2014
Average
December 2013
June 2014
Average
December 2013
June 2014
Average
December 2013
June 2014
Average
December 2013
June 2014
Average
December 2013
June 2014
Average
PÇ3
0,2
5 0,
210,
23-0
,37
-0,7
3-0
,55
7,67
6,53
7,10
29,6
833
,36
31,5
294
,10
88,7
991
,45
0,07
0,06
0,07
295,
4930
8,62
302,
060,
160,
350,
2661
3,00
548,
0058
0,50
PÇP
0,27
0,38
0,32
-0,3
0-0
,60
-0,4
58,
1410
,67
9,40
30,4
934
,48
32,4
895
,41
91,7
093
,56
0,08
0,10
0,09
306,
5232
6,09
316,
310,
450,
580,
5166
5,00
608,
0063
6,50
PÇÇ
0,80
0,56
0,68
1,09
-0,3
20,
3920
,30
15,1
117
,71
33,6
438
,90
36,2
711
4,60
95,9
310
5,26
0,23
0,15
0,19
316,
3733
8,82
327,
600,
961,
010,
9854
4,50
762,
0065
3,25
FÇ-1
0,46
0,40
0,43
-2,3
3-0
,92
-1,6
310
,62
11,2
110
,91
47,8
838
,99
43,4
379
,22
88,1
883
,70
0,10
0,11
0,10
510,
0335
1,90
430,
971,
630,
961,
2911
04,5
069
0,00
897,
25FÇ
-20,
470,
310,
39-2
,81
-0,9
4-1
,88
10,4
89,
7110
,09
50,6
538
,72
44,6
875
,44
85,3
280
,38
0,10
0,09
0,10
519,
3029
4,79
407,
041,
820,
741,
2811
06,5
055
6,00
831,
25FÇ
-30,
640,
480,
560,
17-0
,84
-0,3
318
,90
13,8
316
,37
35,4
039
,35
37,3
810
1,64
88,5
495
,09
0,15
0,13
0,14
462,
3332
3,65
392,
990,
981,
101,
0411
11,0
067
2,00
891,
50SK
K0,
060,
030,
05-0
,27
-0,4
9-0
,38
2,46
1,29
1,87
38,1
042
,63
40,3
794
,53
90,5
392
,53
0,02
0,01
0,02
239,
1625
7,71
248,
430,
120,
110,
1145
3,00
431,
0044
2,00
OK
K0,
090,
060,
07-0
,78
-0,9
5-0
,86
3,16
1,61
2,39
79,9
154
,13
67,0
286
,08
89,3
987
,74
0,03
0,01
0,02
272,
3644
0,61
356,
490,
280,
260,
2753
9,50
694,
0061
6,75
SÇ0,
220,
180,
20-0
,50
-0,7
9-0
,64
6,90
5,64
6,27
31,3
727
,43
29,4
092
,56
88,3
290
,44
0,06
0,05
0,06
316,
3732
1,11
318,
740,
330,
320,
3366
4,50
559,
0061
1,75
AK
Ç0,
380,
320,
35-1
,04
-0,9
9-1
,02
10,3
18,
689,
5037
,01
38,9
838
,00
87,4
587
,70
87,5
70,
100,
080,
0937
7,41
372,
5537
4,98
0,80
0,67
0,73
513,
0067
2,00
592,
50Ç
Ç0,
180,
140,
16-0
,72
-0,5
8-0
,65
6,45
5,10
5,77
48,9
154
,16
51,5
389
,25
91,5
490
,40
0,05
0,04
0,05
317,
4633
0,01
323,
730,
310,
280,
3065
4,00
542,
0059
8,00
BST
-10,
100,
080,
09-0
,95
-1,1
2-1
,03
3,79
2,85
3,32
43,2
947
,81
45,5
587
,25
85,2
886
,26
0,03
0,02
0,02
363,
1337
1,46
367,
300,
360,
300,
3371
9,50
629,
0067
4,25
BST
-20,
110,
110,
11-1
,20
-0,9
9-1
,10
3,35
3,19
3,27
58,9
755
,44
57,2
186
,50
88,5
687
,53
0,03
0,03
0,03
433,
9742
3,54
428,
760,
300,
240,
2785
8,50
681,
0076
9,75
AT-1
1,10
1,11
1,10
-4,4
0-4
,40
-4,4
032
,54
32,6
132
,58
59,4
659
,46
59,4
674
,95
74,9
874
,96
0,20
0,21
0,20
729,
7671
4,21
721,
994,
264,
164,
2120
72,5
020
71,5
020
72,0
0IY
KT-
11,
130,
931,
03-4
,79
-4,8
3-4
,81
30,6
626
,58
28,6
247
,22
49,0
448
,13
72,5
671
,36
71,9
60,
210,
170,
1971
9,96
717,
7971
8,88
4,55
4,32
4,43
1985
,00
1677
,00
1831
,00
ZK
T-1
0,45
0,34
0,39
-1,0
2-1
,99
-1,5
010
,34
7,42
8,88
7,21
11,0
19,
1188
,39
80,0
784
,23
0,11
0,08
0,10
393,
2746
4,04
428,
660,
941,
010,
9786
8,00
822,
0084
5,00
KO
Y-1
0,23
0,19
0,21
-1,4
9-1
,62
-1,5
66,
114,
705,
4044
,68
45,2
044
,94
83,1
382
,52
82,8
30,
060,
040,
0541
6,60
445,
4143
1,01
0,73
0,67
0,70
864,
5075
6,00
810,
25B
KA
0,13
0,10
0,11
-1,4
1-1
,30
-1,3
53,
632,
863,
2547
,04
47,9
747
,51
81,1
682
,61
81,8
80,
030,
030,
0336
1,75
363,
4836
2,61
0,46
0,46
0,46
720,
0062
5,00
672,
50İG
-10,
780,
670,
73-4
,81
-6,0
7-5
,44
14,3
712
,06
13,2
152
,44
51,5
051
,97
65,5
359
,49
62,5
10,
160,
130,
1460
2,17
662,
9663
2,57
3,64
4,77
4,20
1352
,50
1226
,00
1289
,25
IG-2
0,42
0,39
0,41
-1,4
3-1
,52
-1,4
79,
999,
119,
5554
,66
51,9
753
,31
84,4
583
,88
84,1
70,
100,
090,
1041
6,05
430,
2642
3,16
1,04
1,08
1,06
891,
0076
7,00
829,
00İG
-31,
241,
001,
12-1
5,28
-9,8
0-1
2,54
14,9
614
,01
14,4
971
,76
69,6
570
,70
52,0
558
,64
55,3
40,
170,
160,
1613
63,0
910
23,6
511
93,3
711
,67
7,61
9,64
3135
,00
1822
,00
2478
,50
KO
YM
0,31
0,17
0,24
-1,5
9-1
,31
-1,4
59,
226,
247,
7340
,95
43,6
142
,28
85,6
985
,93
85,8
10,
070,
040,
0552
1,51
449,
3248
5,42
1,54
0,79
1,16
1139
,00
789,
0096
4,00
OK
wel
l0,
090,
110,
10-0
,08
-0,5
1-0
,30
2,90
3,30
3,10
40,2
941
,28
40,7
898
,37
91,8
095
,09
0,03
0,03
0,03
251,
8430
2,32
277,
080,
120,
280,
2051
9,00
555,
0053
7,00
K-1
0,49
0,65
0,57
-1,3
6-2
,69
-2,0
314
,27
15,6
014
,94
30,3
735
,38
32,8
880
,78
70,8
375
,80
0,14
0,16
0,15
310,
9339
6,81
353,
871,
152,
691,
9270
4,50
832,
0076
8,25
K-2
0,45
0,28
0,37
-1,7
3-1
,14
-1,4
312
,80
9,42
11,1
146
,49
50,2
648
,38
78,4
882
,43
80,4
60,
120,
080,
1035
8,25
299,
5932
8,92
1,21
0,67
0,94
793,
5058
0,00
686,
75PÖ
-10,
450,
390,
420,
19-0
,28
-0,0
413
,32
11,1
112
,22
49,4
650
,61
50,0
410
3,42
95,4
299
,42
0,14
0,12
0,13
247,
6327
1,20
259,
410,
280,
270,
2757
6,50
516,
0054
6,25
SKÇ
K0,
130,
120,
12-0
,91
-0,7
4-0
,82
3,40
3,15
3,27
16,8
222
,90
19,8
688
,96
90,8
389
,90
0,03
0,03
0,03
400,
1239
1,51
395,
810,
280,
290,
2979
5,00
667,
0073
1,00
Tabl
e 6-
Val
ues o
f diff
eren
t ind
ices
use
d fo
r the
ass
essm
ent o
f the
suita
bilit
y of
surf
ace
and
grou
ndw
ater
s for
irrig
atio
n.
Bull. Min. Res. Exp. (2015) 150: 145-162
155
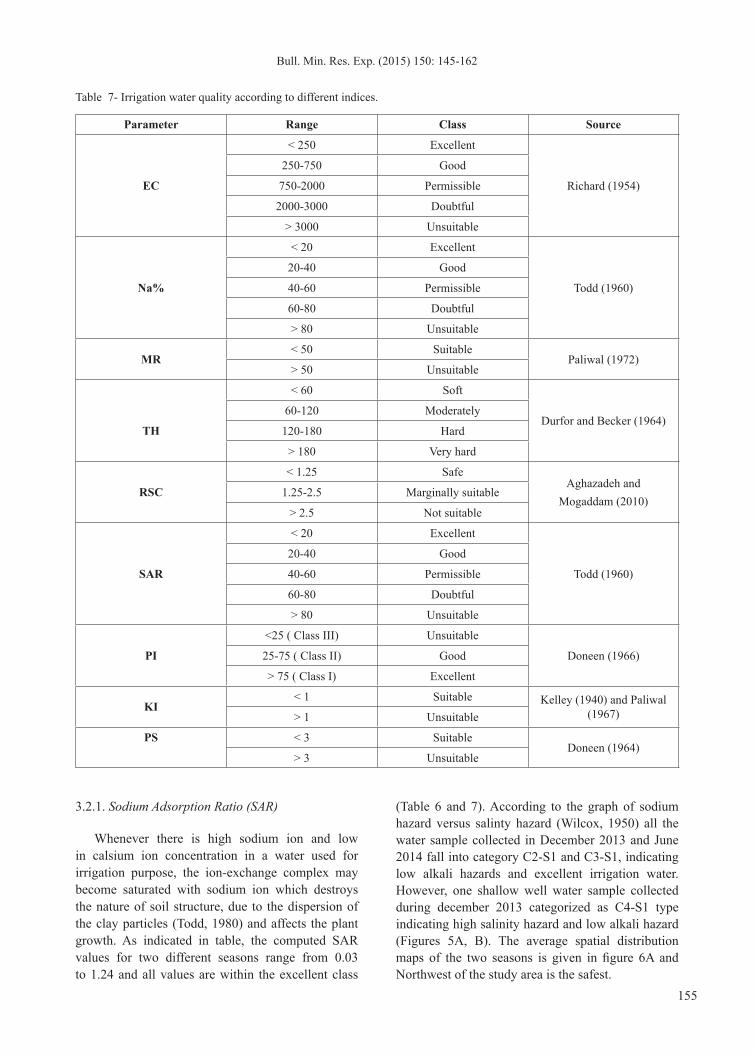
Table 7- Irrigation water quality according to different indices.
Parameter Range Class Source
˂ 250 Excellent
Richard (1954)
250-750 Good
EC 750-2000 Permissible
2000-3000 Doubtful
˃ 3000 Unsuitable
˂ 20 Excellent
20-40 Good
Na% 40-60 Permissible Todd (1960)
60-80 Doubtful
˃ 80 Unsuitable
MR˂ 50 Suitable
Paliwal (1972)˃ 50 Unsuitable
˂ 60 Soft
Durfor and Becker (1964)60-120 Moderately
TH 120-180 Hard
˃ 180 Very hard
˂ 1.25 SafeAghazadeh and
Mogaddam (2010)RSC 1.25-2.5 Marginally suitable
˃ 2.5 Not suitable
˂ 20 Excellent
20-40 Good
SAR 40-60 Permissible Todd (1960)
60-80 Doubtful
˃ 80 Unsuitable
˂25 ( Class III) Unsuitable
PI 25-75 ( Class II) Good Doneen (1966)
˃ 75 ( Class I) Excellent
KI˂ 1 Suitable Kelley (1940) and Paliwal
(1967)˃ 1 Unsuitable
PS ˂ 3 SuitableDoneen (1964)
˃ 3 Unsuitable
3.2.1. Sodium Adsorption Ratio (SAR)
Whenever there is high sodium ion and low in calsium ion concentration in a water used for irrigation purpose, the ion-exchange complex may become saturated with sodium ion which destroys the nature of soil structure, due to the dispersion of the clay particles (Todd, 1980) and affects the plant growth. As indicated in table, the computed SAR values for two different seasons range from 0.03 to 1.24 and all values are within the excellent class
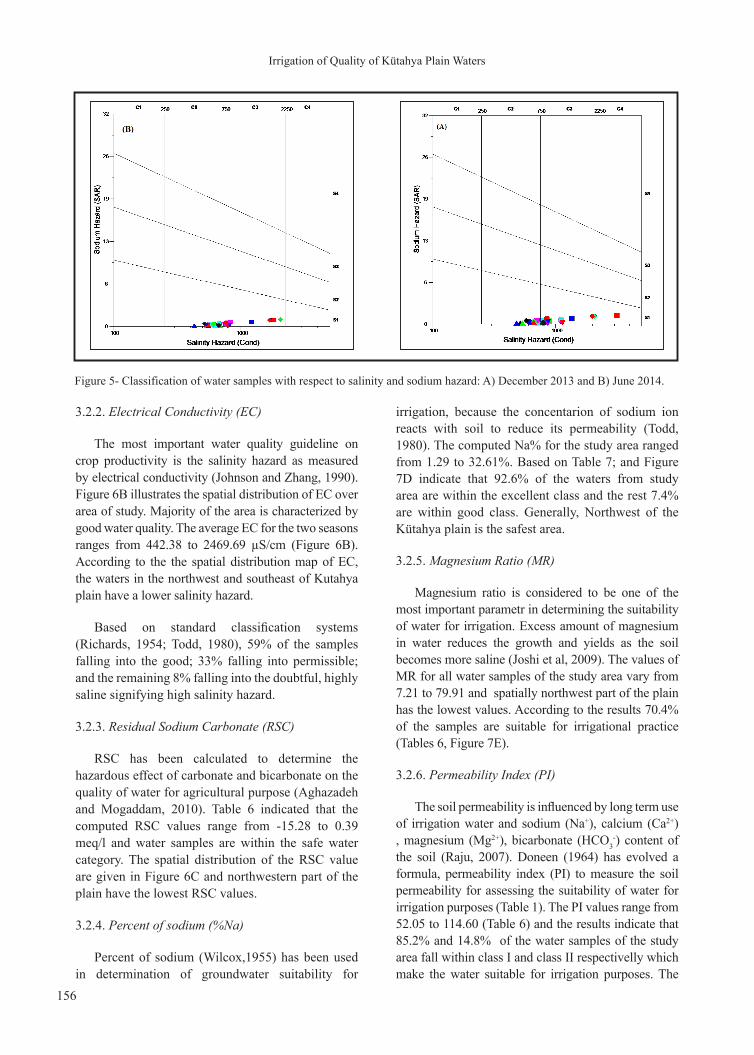
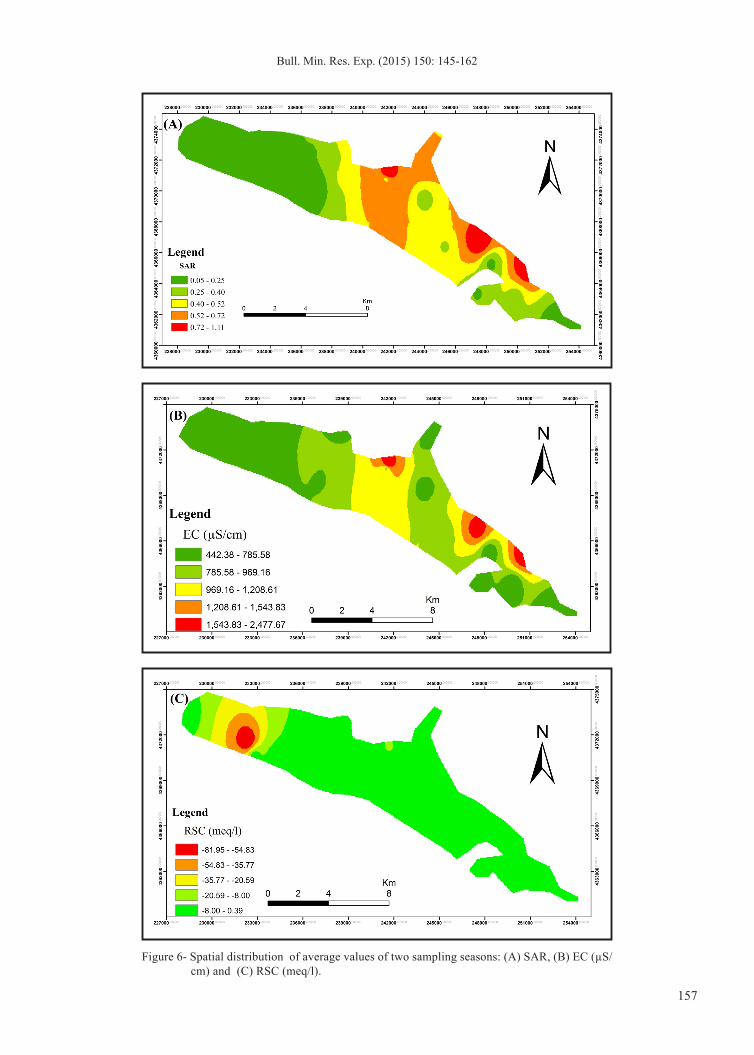
(Table 6 and 7). According to the graph of sodium hazard versus salinty hazard (Wilcox, 1950) all the water sample collected in December 2013 and June 2014 fall into category C2-S1 and C3-S1, indicating low alkali hazards and excellent irrigation water. However, one shallow well water sample collected during december 2013 categorized as C4-S1 type indicating high salinity hazard and low alkali hazard (Figures 5A, B). The average spatial distribution maps of the two seasons is given in figure 6A and Northwest of the study area is the safest.
Irrigation of Quality of Kütahya Plain Waters
156
3.2.2. Electrical Conductivity (EC)
The most important water quality guideline on crop productivity is the salinity hazard as measured by electrical conductivity (Johnson and Zhang, 1990). Figure 6B illustrates the spatial distribution of EC over area of study. Majority of the area is characterized by good water quality. The average EC for the two seasons ranges from 442.38 to 2469.69 µS/cm (Figure 6B). According to the the spatial distribution map of EC, the waters in the northwest and southeast of Kutahya plain have a lower salinity hazard.
Based on standard classification systems (Richards, 1954; Todd, 1980), 59% of the samples falling into the good; 33% falling into permissible; and the remaining 8% falling into the doubtful, highly saline signifying high salinity hazard.
3.2.3. Residual Sodium Carbonate (RSC)
RSC has been calculated to determine the hazardous effect of carbonate and bicarbonate on the quality of water for agricultural purpose (Aghazadeh and Mogaddam, 2010). Table 6 indicated that the computed RSC values range from -15.28 to 0.39 meq/l and water samples are within the safe water category. The spatial distribution of the RSC value are given in Figure 6C and northwestern part of the plain have the lowest RSC values.
3.2.4. Percent of sodium (%Na)
Percent of sodium (Wilcox,1955) has been used in determination of groundwater suitability for
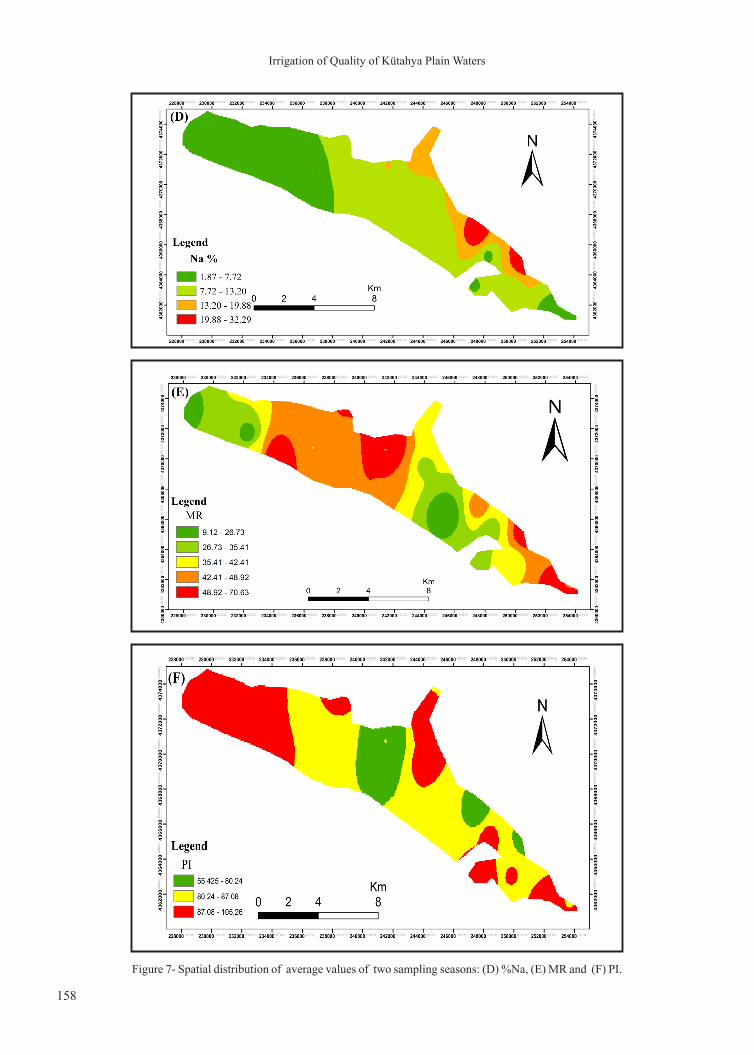
irrigation, because the concentarion of sodium ion reacts with soil to reduce its permeability (Todd, 1980). The computed Na% for the study area ranged from 1.29 to 32.61%. Based on Table 7; and Figure 7D indicate that 92.6% of the waters from study area are within the excellent class and the rest 7.4% are within good class. Generally, Northwest of the Kütahya plain is the safest area.
3.2.5. Magnesium Ratio (MR)
Magnesium ratio is considered to be one of the most important parametr in determining the suitability of water for irrigation. Excess amount of magnesium in water reduces the growth and yields as the soil becomes more saline (Joshi et al, 2009). The values of MR for all water samples of the study area vary from 7.21 to 79.91 and spatially northwest part of the plain has the lowest values. According to the results 70.4% of the samples are suitable for irrigational practice (Tables 6, Figure 7E).
3.2.6. Permeability Index (PI)
The soil permeability is influenced by long term use of irrigation water and sodium (Na+), calcium (Ca2+) , magnesium (Mg2+), bicarbonate (HCO3
-) content of the soil (Raju, 2007). Doneen (1964) has evolved a formula, permeability index (PI) to measure the soil permeability for assessing the suitability of water for irrigation purposes (Table 1). The PI values range from 52.05 to 114.60 (Table 6) and the results indicate that 85.2% and 14.8% of the water samples of the study area fall within class I and class II respectivelly which make the water suitable for irrigation purposes. The
Figure 5- Classification of water samples with respect to salinity and sodium hazard: A) December 2013 and B) June 2014.
Bull. Min. Res. Exp. (2015) 150: 145-162
157
Figure 6- Spatial distribution of average values of two sampling seasons: (A) SAR, (B) EC (µS/cm) and (C) RSC (meq/l).
Irrigation of Quality of Kütahya Plain Waters
158
Figure 7- Spatial distribution of average values of two sampling seasons: (D) %Na, (E) MR and (F) PI.
Bull. Min. Res. Exp. (2015) 150: 145-162
159
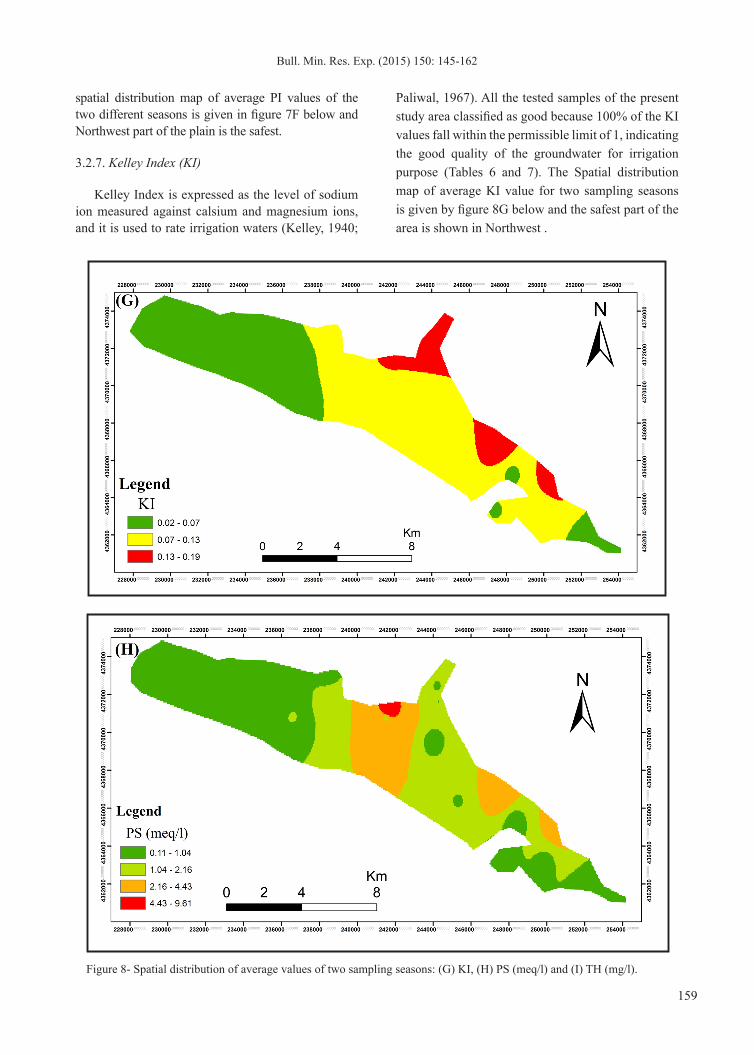
spatial distribution map of average PI values of the two different seasons is given in figure 7F below and Northwest part of the plain is the safest.
3.2.7. Kelley Index (KI)
Kelley Index is expressed as the level of sodium ion measured against calsium and magnesium ions, and it is used to rate irrigation waters (Kelley, 1940;
Paliwal, 1967). All the tested samples of the present study area classified as good because 100% of the KI values fall within the permissible limit of 1, indicating the good quality of the groundwater for irrigation purpose (Tables 6 and 7). The Spatial distribution map of average KI value for two sampling seasons is given by figure 8G below and the safest part of the area is shown in Northwest .
Figure 8- Spatial distribution of average values of two sampling seasons: (G) KI, (H) PS (meq/l) and (I) TH (mg/l).
Irrigation of Quality of Kütahya Plain Waters
160
Figure 8- (continued)
3.2.8. Potential Salinity (PS)
Potential salinity is another parameter used for the classification of water for irrigation purpose. Potential salinity value less than 3 meq/l is suitable for irrigation purpose. Results from study area ranged from 0.11 to 11.67 meq/L (Table 6). The results of PS suggest that 85.2% of waters of the study area are suitable for irrigation. The average potential salinity spatial distribution map of two sampling seasons is produced for the area (Figure 8H).
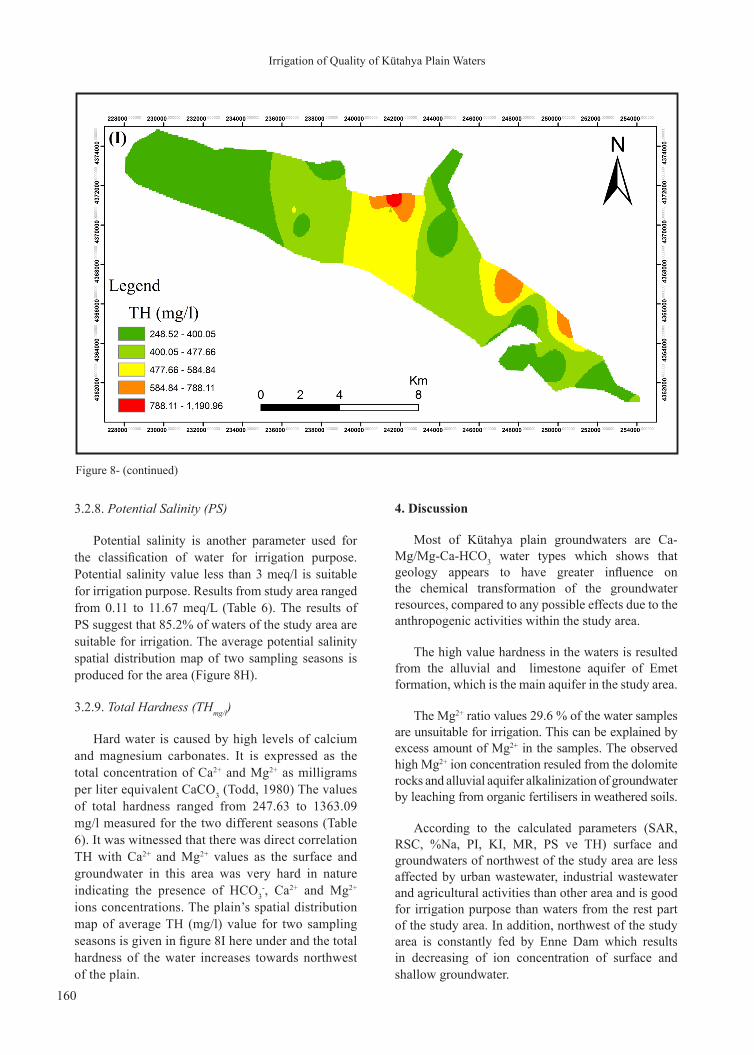
3.2.9. Total Hardness (THmg/l)
Hard water is caused by high levels of calcium and magnesium carbonates. It is expressed as the total concentration of Ca2+ and Mg2+ as milligrams per liter equivalent CaCO3 (Todd, 1980) The values of total hardness ranged from 247.63 to 1363.09 mg/l measured for the two different seasons (Table 6). It was witnessed that there was direct correlation TH with Ca2+ and Mg2+ values as the surface and groundwater in this area was very hard in nature indicating the presence of HCO3
-, Ca2+ and Mg2+ ions concentrations. The plain’s spatial distribution map of average TH (mg/l) value for two sampling seasons is given in figure 8I here under and the total hardness of the water increases towards northwest of the plain.
4. Discussion
Most of Kütahya plain groundwaters are Ca-Mg/Mg-Ca-HCO3 water types which shows that geology appears to have greater influence on the chemical transformation of the groundwater resources, compared to any possible effects due to the anthropogenic activities within the study area.
The high value hardness in the waters is resulted from the alluvial and limestone aquifer of Emet formation, which is the main aquifer in the study area.
The Mg2+ ratio values 29.6 % of the water samples are unsuitable for irrigation. This can be explained by excess amount of Mg2+ in the samples. The observed high Mg2+ ion concentration resuled from the dolomite rocks and alluvial aquifer alkalinization of groundwater by leaching from organic fertilisers in weathered soils.
According to the calculated parameters (SAR, RSC, %Na, PI, KI, MR, PS ve TH) surface and groundwaters of northwest of the study area are less affected by urban wastewater, industrial wastewater and agricultural activities than other area and is good for irrigation purpose than waters from the rest part of the study area. In addition, northwest of the study area is constantly fed by Enne Dam which results in decreasing of ion concentration of surface and shallow groundwater.
Bull. Min. Res. Exp. (2015) 150: 145-162
161
The water chemistry of Kütahya plain is very important and needs care because the Porsuk Dam which uses as drinking water for both Kütahya and Eskişehir cities is situated in downstream. So any activities such as: agricultural activities, use of fertilizers, agricultural spraying, factory wastes and waste storage done in Kütahya plain should be controled.
Acknowledgements
This paper constitutes part of an on-going PhD research of the corresponding author, sponsored by the Ankara University Reaserch Institute. The author would like to express his thank and gratitude to the Reaserch Institute Office.
Received: 31.10.2014Accepted: 11.02.2015Published: June 2015
References
Aghazadeh, N., Mogaddam, A.A. 2010. Assessment of groundwater quality and its suitability for drinking and agricultural uses in the Oshnavieharea, Northwest of Iran. Journal of Environmental Protection 1, 30-40.
APHA, 1989. Standard methods for the examination of water and wastewater. 17th edition, American Public Health Association, Washington D.C., 1,268 p.
Appelo, C.A.J., Postma, D. 1994. Geochemistry. Groundwater and Pollution. Rotterdam, A.A. Balkema, 521 p.
Ayers, R.S., Westcot, D.W. 1985. Water quality for agriculture. Irrigation and drainage paper No. 29. Food and agriculture organization of the United Nations. Rome, 1-117.
Berhe, B.A., Çelik, M., Dokuz, U.E. 2014. Determination of aquifer properties of the Kütahya plain from a pumping and recovery test data. 67th Geological Congress of Turkey, 14-18 April 2014, Ankara, 324-325.
Çelik, M., Ünsal, N., Tüfenkçi, O.O., Bolat, S. 2008. Assessment of water quality of the Lake Seyfe basin, Kırşehir, Turkey, Environmental Geology, 55, 559-569.
Doneen, L.D. 1964. Notes on water quality in agriculture. Published as a water science and engineering paper 4001, Department of Water Science and Engineering, University of California.
Doneen, L.D. 1966. Water quality requirement for agriculture. Proc. National Sym. Quality Standards for Natural Waters. University of Michigan, Ann. Report, 213- 218.
DSİ, 1981. Kütahya ve Köprüören Ovaları Hidrojeolojik Etüt Raporu, 65, say, Devlet Su İşleri Genel Müdürlüğü, 64 s, Ankara.
DSİ, 2003. Kütahya Ovası Karst Hidrojeolojisi Ara Raporu, Devlet Su İşleri, 41 s, Eskişehir.
Dufor C.N., Becker, E., 1964. Public water supplies of the 100 largestcities in the United States, 1962: U.S. Geological Survey, Water-Supply Paper 1812.
Hem, J.D. 1991. Study and interpretation of the chemical characteristics of natural waters. Book 2254, third edition. Scientific Publishers, Jodhpur.
Johnson, G., Zhang, H. 1990. Classification of Irrigation Water Quality, Oklahoma cooperative extension fact sheets (available at http://www.osuextra.com).
Joshi, D.M., Kumar, A., Agrawal. N. 2009. Assessment of the irrigation water quality of river Ganga in Haridwar District India. Journal of Chemistry 2(2), 285-292.
Kelley, W.P. 1940. Permissible composition and concentration of irrigation waters, Proc. ASCE 66.
Kelley, W.P. 1963. Use of saline irrigation water. Soil science., 95(6), 385-391.
Naoum, S., Tsanis, I.K. 2004. Ranking of spatial interpolation techniques using a GIS-based DSS. Global Nest: the International journal 6(1), 1-20.
Özburan, M. 2009. Neotectonic investigation of Kütahya and its surrounding. Ph.D. thesis, Kocaeli University, 227 p. Izmit (Unpublished).
Paliwal, K.V., 1967. Effect of gypsum application on the quality of irrigation waters. The Madras agricultural journal 59, 646–647.
Paliwal, K.V. 1972. Irrigation with saline water. New Delhi, IARI, 198p.
Piper, A.M. 1944. A graphical procedure in the geochemical interpretation of water analysis. Transactions, American Geophysical Union 25, 914–928.
Ragunath, H.M., 1987. Groundwater, second ed. Wiley Eastern Ltd, New Delhi, 456p.
Raju N.J., 2007. Hydrogeochemical parameters for assessment of groundwater quality in the upper Gunjanaeru River basin, Cuddapah District, Andhra Predesh, South India, Environmental Geology, 52, 1067-1074.
Richards, L.A., 1954. Diagnosis and Improvement of saline and alkali soils. Agric. Handbook 60, USDA & IBH Publishing Company Limited, New Delhi, India. 98- 99.
Rowe, D.R., Abdel-Magid, I.M., 1995. Handbook of Wastewater Reclamation and reuse. CRC Press, Inc. 550p.
Schoeller H., 1967. Geochemistry of groundwater. An international guide for research and practice, UNESCO, 15, 1-18.
Irrigation of Quality of Kütahya Plain Waters
162
Tank, D.K., Chandel, C.P.S., 2010. Analysis of the major ion constituents in groundwater of Jaipur City. Nature and Science, 8(10), 1-7.
Todd, D.K., 1960. Groundwater Hydrology. 1st ed., John Wiley and Sons, Inc,, 336p.
Todd, D.K., 1980. Groundwater Hydrology. 2nd ed., John Wiley and Sons, New York, 535p.
WHO, 1993. Guidelines for Drinking-Water Quality - 2nd Edition -Volume 1 - Recommendations, Geneva.
Wilcox, L.V. 1950. Classification and Use of Irrigation Waters. Department of Agriculture, United States, Circular No. 696, 16 p, Washington D.C.
Wilcox, L.V. 1955. Classification and use of Irrigation Waters. U.S. Dept. of Agric., Circular No. 696, 19 p, Washington D.C.


![arXiv:cs/0701005v1 [cs.PF] 30 Dec 2006arXiv:cs/0701005v1 [cs.PF] 30 Dec 2006 Exact solutionsfor thetwo-and all-terminal reliabilitiesoftheBrecht-Colbournladderand thegeneralizedfan](https://img.pdfslide.net/doc/110x75/5e71e1e4e4926132ab7525ae/arxivcs0701005v1-cspf-30-dec-2006-arxivcs0701005v1-cspf-30-dec-2006-exact.jpg)


![Research Article HomoKinase: A Curated Database of Human ...downloads.hindawi.com/journals/isrn/2013/417634.pdf · and KinWeb [ ], thetwo currentlyavailable databases which include](https://img.pdfslide.net/doc/110x75/5fb47ef667a7e3528210e6f2/research-article-homokinase-a-curated-database-of-human-and-kinweb-thetwo.jpg)