Embed Size (px)
Citation preview

MINERAL RESERVES
AND RESOURCES Update
Wayne Robinson
Chief Executive Officer: Gold Division
28 July 2016

Disclaimer
The information in this presentation may include forward-looking statements, which are based on current expectations andprojections about future events. These statements may include, without limitation, any statements preceded by, followed by orincluding words such as “target,” “expect,” “may,” “anticipate,” “estimate,” “will,” and other words and terms of similarmeaning or the negative thereof. These forward-looking statements, as well as those included in any other material discussedat the meeting, are subject to risks, uncertainties and assumptions, including, among other things, the development ofSibanye’s business, general economic conditions and actions of regulators. In light of these risks, uncertainties andassumptions, the events in the forward-looking statements may not occur. No representation or warranty is made that anyforward-looking statement will come to pass and no reliance should be placed on any forward-looking statement. No oneundertakes to publicly update or revise any such forward-looking statement.
In accordance with the requirements imposed by the JSE, Sibanye Gold reports its reserves using the terms and definitions ofthe SAMREC Code (2007 edition). There are differences between the SAMREC Code and the Security and ExchangeCommission’s Industry Guide 7. Mineral or ore reserves, as defined under the SAMREC Code, are divided into categories ofproved and probable reserves and are expressed in terms of tonnes to be processed at mill feed head grades, allowing forestimated mining dilution, recovery and other factors.
The lead Competent Person designated in terms of SAMREC, who take responsibility for the consolidation and reporting ofSibanye Gold’s Mineral Resources and Mineral Reserves and of the overall regulatory compliance of these figures is Mr.Gerhard Janse van Vuuren, who gave his consent for the disclosure of the 2015 Mineral Resource and Mineral ReserveStatement. Mr Janse van Vuuren [BTech (MRM), GDE (Mining Eng.), MBA and MSCoC] is registered with Plato (PMS No 243) andhas 27 years’ experience relative to the type and style of mineral deposit under consideration. He is the current Vice President:Mine Technical Services and is a full time employee of Sibanye Gold. Mr. van Vuuren consents to the inclusion of all informationin this release relating to mineral resources and mineral reserves in the form in which it appears.
The respective business unit based Mineral Resource Managers, relevant project managers and the respective MineralResource Management discipline heads have been designated as the Competent Persons in terms of SAMREC and takeresponsibility for the reporting of Mineral Resources and Mineral Reserves for their respective area(s) of responsibility. Additionalinformation regarding these personnel, as well as the teams involved with the compilation of the Mineral Resource and MineralReserve declaration is incorporated in the Mineral Resources and Mineral Reserves Supplement that was published inconjunction with the 2015 Sibanye Gold Integrated Report.
2

Location of gold operations and projects
3Focused on the Wits Basin

Driefontein
4One of the most productive gold mines ever
* at average R15.7/US$ year to date
Commissioned 1952
Production to date 108Moz
Resources 19.8Moz
Reserves 8.2Moz
Production (2016F)* 553koz
AISC (2016F) US$780/oz
LOM 27 years

Kloof
5A high grade, long life operation
Commissioned 1968
Resources 28.2Moz
Resource grade 15.4g/t
Reserves 6.5Moz
Reserve grade 7.5g/t
Production (2016F) 488koz
AISC (2016F) US$825/oz
LOM 18 years* at average R15.7/US$ year to date

Beatrix
6Gold projects provide opportunities to extend life + Uranium potential
* at average R15.7/US$ year to date
Commissioned 1983
Resources (gold) 9.6Moz
Reserves (gold) 4.3Moz
Production (2016F) 315koz
AISC (2016F)* US$865/oz
LOM 14 years
Resources (uranium) 26.0 Mlb
Reserves (uranium) 11.7Mlb

Cooke
7Significant surface tailings resources with high uranium content
* at average R15.7/US$ year to date
Commissioned 1961
Resources (gold) 15.9Moz
Reserves (gold) 1.5Moz
Production (2016F) 252koz
AISC (2016F)* US$890/oz
LOM 8 years
Resources (uranium) 95.4Mlb
Resources (uranium) 14.7Mlb

RESERVES AND
RESOURCESOverview
8

Sibanye Gold Division 2016 R&R declaration
• Gold Mineral Reserves increased by 9% to 31.0Moz, despite depletion
of 1.6Moz in 2015
• Depth extension projects at Driefontein 5 Shaft, Kloof 4 Shaft and
Beatrix South were included
• Maiden Gold Reserve at Burnstone and gold and uranium reserves
at the Beisa Project were included
• Continued conversion of secondary reefs and white areas at operations (1.4Moz)
– increased expenditure on exploration − R65.1m in 2015 to R77.5m in 2016
• Quality reporting
– Investment Analyst Society 'Squirrel Award' for reporting in 2013 and 2015
9Organic growth projects have increased mineral Resources and Reserves
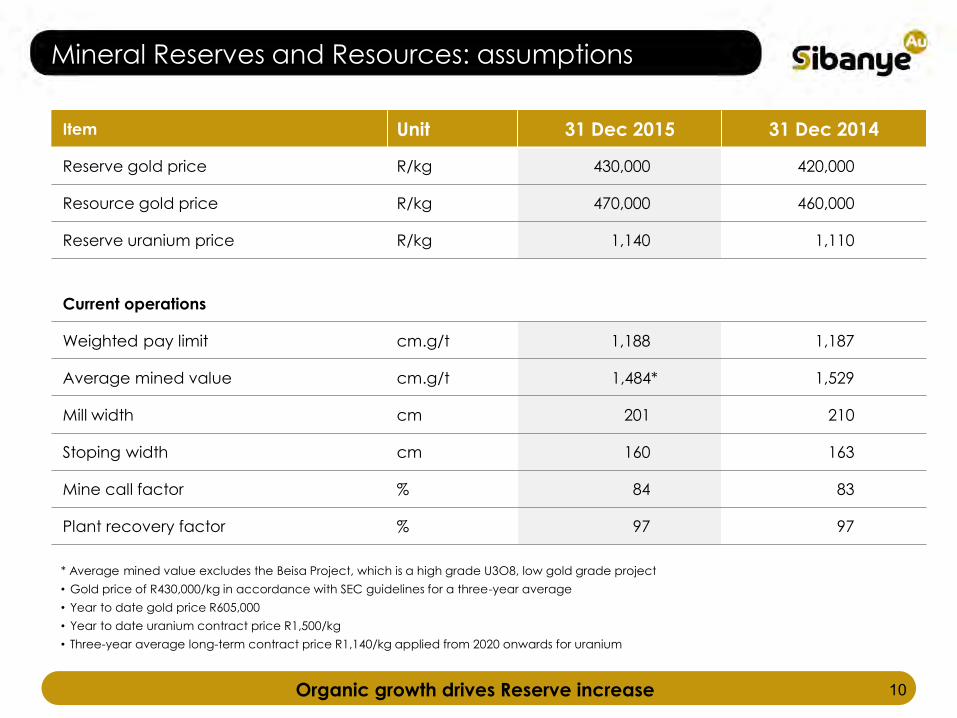
Mineral Reserves and Resources: assumptions
10Organic growth drives Reserve increase
Item Unit 31 Dec 2015 31 Dec 2014
Reserve gold price R/kg 430,000 420,000
Resource gold price R/kg 470,000 460,000
Reserve uranium price R/kg 1,140 1,110
Current operations
Weighted pay limit cm.g/t 1,188 1,187
Average mined value cm.g/t 1,484* 1,529
Mill width cm 201 210
Stoping width cm 160 163
Mine call factor % 84 83
Plant recovery factor % 97 97
* Average mined value excludes the Beisa Project, which is a high grade U3O8, low gold grade project
• Gold price of R430,000/kg in accordance with SEC guidelines for a three-year average
• Year to date gold price R605,000
• Year to date uranium contract price R1,500/kg
• Three-year average long-term contract price R1,140/kg applied from 2020 onwards for uranium

Gold Mineral Resources and Reserves: operations
11Significant addition to operation’s reserves through organic growth projects
Resources Reserves
Gold 31 Dec 2015 total31 Dec
201431 Dec 2015 total
31 Dec 2014
Tons (Mt) Grade (g/t) Gold (Moz) Gold (Moz) Tons (Mt) Grade (g/t) Gold (Moz) Gold (Moz)
Underground
Beatrix 55.8 5.3 9.530 9.788 38.2 3.5 4.264 3.598
Cooke 95.8 5.1 15.860 16.475 9.8 4.7 1.471 1.841
Driefontein 55.0 11.1 19.691 22.755 35.5 7.1 8.102 7.228
Kloof 56.6 15.4 28.023 29.106 26.3 7.5 6.383 6.706
Total underground 263.2 8.6 73.103 78.124 109.8 5.7 20.219 19.374
Surface rock dumps (SRD)
Beatrix 5.3 0.4 0.062 0.071 5.3 0.4 0.062 0.071
Cooke 4.7 0.3 0.052 0.114 4.7 0.3 0.052 0.114
Driefontein 4.6 0.6 0.094 0.125 4.6 0.6 0.094 0.125
Kloof 9.5 0.5 0.163 0.223 9.5 0.5 0.163 0.194
Total SRD 24.1 0.5 0.372 0.533 24.1 0.5 0.372 0.504
Total operations 287.3 8.0 73.475 78.657 134.0 4.8 20.591 19.878

Gold Mineral Resources and Reserves: major projects
12Maiden Reserves declared at Burnstone and Beisa
Resources Reserves
Gold 31 Dec 2015 total31 Dec
201431 Dec 2015 total
31 Dec 2014
Tons (Mt) Grade (g/t) Gold (Moz) Gold (Moz) Tons (Mt) Grade (g/t) Gold (Moz) Gold (Moz)
Underground
Beisa North 14.8 3.4 1.619 1.619
Bloemhoek 28.3 4.7 4.297 4.297
Burnstone 54.1 5.1 8.890 8.890 13.0 4.3 1.799
De Bron Merriespruit 28.3 4.4 4.022 4.022 15.4 4.3 2.112 2.088
Total underground 125.5 4.7 18.828 18.828 28.4 4.3 3.911 2.088
TSFs
Cooke surface (RSO) 280.4 0.3 2.401 2.401 280.4 0.3 2.401 2.401
Driefontein 169.1 0.3 1.819 1.805 169.1 0.3 1.819 1.805
Kloof 265.3 0.3 2.267 2.253 265.3 0.3 2.267 2.253
Total TSF 714.8 0.3 6.486 6.459 714.8 0.3 6.486 6.459
Projects 840.3 0.9 25.314 25.287 743.2 0.4 10.397 8.547
Total Sibanye Gold 1,127.6 2.7 98.790 103.944 877.1 1.1 30.988 28.425

Uranium Mineral Resources and Reserves: operations
13Significant underground and surface uranium resources
Resources Reserves
Uranium 31 Dec 2015 total31 Dec
201431 Dec 2015 total
31 Dec 2014
Tons (Mt) Grade (kg/t) U3O8 (Mlb) U3O8 (Mlb) Tons (Mt) Grade (kg/t) U3O8 (Mlb) U3O8 (Mlb)
Underground
Beatrix 11.4 1.074 26.968 26.968 7.4 0.715 11.654 -
Cooke 58.5 0.530 68.423 66.385 4.2 0.336 3.073 3.827
Driefontein
Kloof
Total underground 69.9 0.619 95.391 93.353 11.5 0.579 14.727 3.827
Surface rock dumps (SRD)
Beatrix
Cooke
Driefontein
Kloof
Total SRD
Total operations

Uranium Mineral Resources and Reserves: major projects
14Significant underground and surface uranium reserves
Resources Reserves
Uranium 31 Dec 2015 total31 Dec
201431 Dec 2015 total
31 Dec 2014
Tons (Mt) Grade (kg/t) U3O8 (Mlb) U3O8 (Mlb) Tons (Mt) Grade (kg/t) U3O8 (Mlb) U3O8 (Mlb)
Underground
Beisa North 14.8 1.084 35.373 35.373
Bloemhoek
Burnstone
De Bron Merriespruit
Total underground 14.8 1.084 35.373 35.373
TSFs
RSO 280.4 0.088 54.256 54.256 280.4 0.088 54.256 54.256
Driefontein 160.9 0.064 22.686 22.326 160.9 0.064 22.686 22.326
Kloof 265.3 0.038 22.146 22.071 265.3 0.038 22.146 22.071
Total TSF 706.6 0.064 99.088 98.653 706.6 0.064 99.088 98.653
Projects 721.4 0.085 134.461 134.026 706.6 0.064 99.088 98.653
Total Sibanye Gold 791.3 0.132 229.852 227.379 718.1 0.072 113.814 102.480

Delivering a sustainable Gold Division
Forecast of gold produced based on LoM profiles
15Extending the operating life
Note: Project profile is based on pre-feasibility and feasibility studies as at December 2015
Based on Reserves declared as at 31 December 2015
Assumptions: Gold price: R430,000/kg, Uranium R1,455/lb (real 2015 terms)
0
10 000
20 000
30 000
40 000
50 000
60 000
kg
Gold Fields plan
Pre-feasibilities studies
undertaken
De Bron
Beisa
Pending capital approval
WRTRP
Projects in development
Burnstone
Below infrastructure projects
Kloof
Driefontein
Surface reserves in LoM
Kloof
Driefontein
Cooke
Beatrix
Underground reserves in LoM
Kloof
Driefontein
Cooke
Beatrix

2016 LOM REVIEWCurrent operations
and organic projects

Operations LoM profiles: square metres
17Based on current mine plan, production stable until 2023
0
20 000
40 000
60 000
80 000
100 000
120 000
140 000
Ave
rag
e m
²/m
on
th
Beatrix Cooke Driefontein Kloof
Kloof and Driefontein DE Projects start production

Operations LoM profiles: tons milled
18Surface TSF and SRD mining to be replaced by WRTRP
0
200 000
400 000
600 000
800 000
1 000 000
1 200 000
1 400 000
1 600 000
1 800 000
2 000 000
Ave
rag
e t
/mo
nth
Beatrix Cooke Driefontein Kloof Surface
Current Cooke surface and Driefontein SRD complete in 2016
Kloof SRD complete in 2019

Operations LoM profiles: forecast gold produced
19Gold production stable for five years
0
500
1 000
1 500
2 000
2 500
3 000
3 500
4 000
4 500
Ave
rag
e k
g/m
on
th
Beatrix Cooke Driefontein Kloof Surface

Operations LoM profiles: average value mined
20LoM profiles based on stable geological models and in line with current values
0
500
1 000
1 500
2 000
2 500
cm
.g/t
Group Beatrix Cooke Driefontein Kloof
Increase in average due
to Driefontein below
infrastructure forming
largest % of remaining
miningBeatrix increase in
value due to West
Section comprising
majority of tail

Operations LoM profiles: development
21Development excludes opening up and secondary development required to access white areas
0
1 000
2 000
3 000
4 000
5 000
6 000
7 000
Ave
rag
e m
/mo
nth
Beatrix Cooke Driefontein Kloof

LoM profiles: development replacement rate
22The historical replacement rate is ~20m²/month
0
10
20
30
40
50
60
70
80
90
100
2013 2014 2015 2016 2017 2018 2019 2020
m²/
m
Standard replacement ratio (with allowance for flexibility) is ~12m2/month for Cooke and between 20-30m²/month for the other operations
The ratio increases as the development grid is completed and required development declines

Development requirement
23Planning pyramids are used to scientifically calculate development required
Gold
rec.
316kg
Tons milled
40,000
Stoping m2
6,137
Ledging m2
341
Main Reef metres Secondary
88 88 0
Main
195Waste metres
195Secondary
0
Main
282Total metres
282Secondary
0
Gold required/planned (input)
All development is calculated from ratios as per standard layout. Flexibility is added to the minimum amount required
Ledging – calculated from ratio of stoping to ledgingas per standard layout
Tons and square metres are calculated from ore flow parameters (input)

Access to secondary reefs
• Development required to access secondary reef horizon is significantly less than
original development required to access the primary reef
• ORD capex is significantly lower
• As a result, pay limits for the secondary reefs will be lower than average
24Existing infrastructure reduces capital cost
Existing infrastructure Planned development

Developed ore reserves: months per mine
Developed ore reserves (DOR) are available for mining in the short term, pending
sequencing and/or equipping of individual panels
25The continued focus on cost reduction and development maintains flexibility
18
29
26
17
30
24
18
0
5
10
15
20
25
30
35
Beatrix Kloof Driefontein Cooke
Mo
nth
s o
f m
inin
g a
va
ila
ble
DOR months 2014 DOR months PresentDOR months present
Cooke

Addressing operational underperfomance
• Cooke 4 has continued to underperform operationally and losses
have accumulated
• Section 189 notification given on 11 July 2016
• Underperformance largely volume related driven by:
– complex geology and structure
– seismic activity affecting access to high grade panels
– section 54 stoppages
• Closure of Cooke 4* would:
– reduce annual production by between 1.5t to 2t
– reduce AISC costs at the Cooke Operations by R32,000/kg
– reduce Sibanye Gold Divison AISC by R7,800/kg
• Resulting in a more profitable Group
26Sibanye will not subsidise loss-making production
*Using 2015 reported numbers

QUESTIONS