Embed Size (px)
Citation preview
Mineralogy and Alteration of the Phosphate Deposits of Florida
U.S. GEOLOGICAL SURVEY BULLETIN 1914
AVAILABILITY OF BOOKS AND MAPS OF THE U.S. GEOLOGICAL SURVEY
Instructions on ordering publications oft~ U.S. Geological Survey, along with prices of the last offerings, are given in the current-year issues of the monthly catalog "New Publications of the U.S. Geological Survey." Prices of available U.S. Geological Survey publications released prior to the current year are listed in the most recent annual "Price and Availability List" Publications that are listed in various U.S. Geological Survey catalogs (seeback inside cover) but not listed in the most recent annual "Price and Availability List" are no longer a"ailable.
Prices of reports released to the open files are given in the listing "U.S. Geological Survey Open-File Reports," updated monthly, which is for sale in microfiche from the U.S. Geological Survey, Books and Open-File Reports Section, Federal Center, Box 25425, Denver, CO 80225. Reports released through the NTIS may be obtaine.d by writing to the National Technical Information Service, U.S. Department of Commerce, Springfield, VA 22161; please include NTIS report number with inquiry.
Order U.S. Geological Survey publications by mail or over the counter from the offices given below.
BY MAIL
Books
Professional Papers, Bulletins, Water-Supply Papers, Techniques of Water-Resources Investigations, Circulars, publications of general interest (such as leaflets, pamphlets, booklets), single copies of Earthquakes & Volcanoes, Preliminary Determination of Epicenters, and some miscellaneous reports, including some of the foregoing series that have gone out of print at the Superintendent of Documents, are obtainable by mail from
U.S. Geological Survey, Books and Open-File Reports Federal Center, Box 25425
Denver, CO 80225
Subscriptions to periodicals (Earthquakes & Volcanoes and Preliminary Determination of Epicenters) can be obtained ONLY from the
Superintendent of Documents Government Printing Office
Washington, D.C. 20402
(Check or money order must be payable to Superintendent of Documents.)
Maps
For maps, address mail orders to
U.S. Geological Survey, Map Distribution Federal Center, Box 25286
Denver, CO 80225
Residents of Alaska may order maps from
Alaska Distribution Section, U.S. Geological Survey, New Federal Building - Box 12
101 Twelfth Ave., Fairbanks, AK 99701
OVER THE COUNTER
Books
Books of the U.S. Geological Survey are available over the counter at the following Geological Survey Public Inquiries Offices, all of which are authorized agents of the Superintendent of Documents:
• WASHINGTON, D.C.--Main Interior Bldg., 2600 corridor, 18th and C Sts., NW.
• DENVER, Colorado--Federal Bldg., Rm. 169, 1961 Stout St. • LOS ANGELES, California--Federal Bldg., Rm. 7638, 300 N.
Los Angeles St. • MENLO PARK, California--Bldg. 3 (Stop 533), Rm. 3128,
345 Middlefield Rd. • RESTON, Vlrginia--503 National Center, Rm. 1C402, 12201
Sunrise Valley Dr. • SALT LAKE CITY, Utah--Federal Bldg., Rm. 8105, 125
South State St. • SAN FRANCISCO, California--Customhouse, Rm. 504, 555
Battery St. • SPOKANE, Washington--U.S. Courthouse, Rm. 678, West
920 Riverside Ave .. • ANCHORAGE, Alaska--Rm. 101,4230 University Dr. • ANCHORAGE, Alaska--Federal Bldg, Rm. E-146, 701 C St.
Maps
Maps may be purchased over the counter at the U.S. Geological Survey offices where books are sold (all addresses in above list) and at the following Geological Survey offices:
• ROLLA, Mlssourl--1400 Independence Rd. • DENVER, Colorado--Map Distribution, Bldg. 810, Federal
Center • FAIRBANKS, Alaska--New Federal Bldg., 101 Twelfth Ave.

Mineralogy and Alteration of the Phosphate Deposits of Florida
By S.J. VAN KAUWENBERGH, J.B. CATHCART, and G.H. McCLELlAN
A detailed study of the mineralogy and chemistry of the phosphate deposits of Florida
U.S. GEOLOGICAL SURVEY BULLETIN 1914

DEPARTMENT OF THE INTERIOR
MANUEL LUJAN, JR., Secretary
U.S. GEOLOGICAL SURVEY
Dallas L. Peck, Director
Any use of trade, product, or firm names in this publication is for descriptive purposes only and does not imply endorsement by the U.S. Government.
UNITED STATES GOVERNMENT PRINTING OFFICE: 1990
For sale by the Books and Open-File Reports Section U.S. Geological Survey Federal Center Box 25425 Denver, CO 80225
Library of Congress Cataloging-in-Publication Data
Van Kauwenbergh, S. J. Mineralogy and alteration of the phosphate deposits of Florida : a detailed
study of the mineralogy and chemistry of the phosphate deposits of Florida I by S.J. Van Kauwenbergh, J.B. Cathcart, and G. H. McClellan.
p. em. - (U.S. Geological Survey bulletin ; 1914) Includes bibliographical references. Supt. of Docs. no.: I 19.3:1914 1. Phosphates-Florida. 2. Geology, Stratigraphic-Neogene. 3. Geology-Florida. I. Cathcart, James Bachelder, 1917- II. McClellan,
Guerry H. Ill. Title. IV. Series. QE75.B9 no. 1914 [TN914. U6F6] 557.3 s-dc20 89-600376 [553.6'4'09759] CIP
CONTENTS
Abstract 1 Introduction 1
Acknowledgments 2 Methods of study 3
Grain-size analyses 3 Geology S
Structure S Stratigraphy S
Chemical analyses of phosphate ores 7 Mineralogy 10
Francolite 10 Clays 17 Carbonates 20 Other minerals 21
Discussion and conclusions 21 References 23 Appendix 27
FIGURES
1. Sketch map of Florida showing major structural features and phosphate mines 4
2. Histograms showing variations in a-values of francolite in bulk and screened samples from the Bone Valley Member of the Peace River Formation 14
3. Histograms showing variations in a-values of francolite in bulk and screened samples from the undifferentiated Peace River Formation 1S
4. Contrasts in the depositional and postdepositional histories of the North Carolina and Florida phosphorite deposits 22
5-23. Diagrams showing lithologic, stragraphic, mineralogic, and grain-size analyses of sections from Florida phosphate mines
5. Swift Creek Mine 28 6. Suwannee River mine 29 7. Noralyn Mine 30 8. Gardinier (Cargill) mine 31 9. Nichols mine 32
10. Ft. Meade mine 33 11. Clear Springs mine 34 12. C.F. Hardee complex 35 13. Ft. Green mine 36 14. Saddle Creek mine 37 15. Lonesome mine 38 16. Watson mine 39 17. Phosphoria mine 40 18. Rockland mine 41
Contents Ill
19. Haynsworth mine 42 20. Lonesome mine 43 21. Hookers Prairie mine 44 22. Four Corners mine 45 23. Kingsford mine 46
TABLES
1. Average grain sizes of samples of the Bone Valley Member of the Peace River Formation and undifferentiated Peace River Formation, Florida 5
2. Stratigraphic nomenclature and lithologic descriptions, Florida phosphate districts 6
3. Chemical analyses of bulk samples of Florida phosphate ores 8 4. Comparison of the theoretical composition of fluorapatite and francolite 11 5. Calculated francolite compositions of various commercial phosphate
ores 12 6. Unit-cell a-values of Florida phosphate ores 12 7. Variations of francolite a-values and composition with stratigraphy, Florida
phosphate ores 16 8. Examples of a-values of less-altered francolite from various localities 16 9. Francolite samples from Florida with a-values less than 9.330
(±0.003 A) 16 10. Chemical analyses of palygorskite samples from Florida phosphate
deposits 18 11. Characteristic d-spacings of smectite from Florida phosphate deposits 18 12. Chemical and layer-charge analyses of selected Florida smectite samples 19 13. X-ray analyses of Florida dolomite samples 20
IV Contents
Mineralogy and Alteration of the Phosphate Deposits of Florida
By S.J. Van Kauwenbergh\ J.B. Cathcarf, and G. H. McCiellan3
Abstract
The Neogene phosphorites of Florida were deposited in a major phosphogenic province that extended from North Carolina into the Florida Peninsula. Although phosphate is present in all areas where Miocene strata occur offshore and onshore, both in outcro'p and the subsurface, economic or potentially economic Miocene and Pliocene deposits are known only from North Carolina, southern South Carolina and northern Georgia, southern Georgia and northern Florida, and central Florida. Identified resources in the phosphate province of the Atlantic Coastal Plain are estimated to be about 7 billion tons, and additional hypothetical resources are thought to be about 13 billion tons. The Florida phosphate deposits are the most productive in the world. About 1 billion tons of phosphaterock concentrate, containing an average of about 32 percent P20s, have been produced since the start of mining in 1888.
Phosphate mining in Florida was initially confined to high-grade deposits in Polk and Hillsborough Counties. This mining district is commonly called the central Florida landpebble phosphate district. In recent years mining has progressed deeper into sections in this district and to the southern extension of the district in Hardee and Manatee Counties. In the future, mining could move even further south into DeSoto County. Two mines have been developed in north Florida.
The phosphatic sediments of the Florida deposits are unconsolidated or partly consolidated sand, clay, and carbonate rock (limestone and dolomite). The deposition of phosphate was, in part, structurally controlled. Phosphate was deposited in basins on the flanks of structural or topographic highs. The economic deposits were reworked, concentrated, and enriched after deposition. Uneconomic phosphatic carbonate rocks are abundant below mined sections and in the deeper parts of basins.
Manuscript approved for publication, October 6, 1989. 1Intemational Fertilizer Development Center, Muscle Shoals,
AL 35662. 2U .S. Geological Sutvey, Denver, CO 80225. 3Department of Geology, University of Florida, Gainesviile, FL
32611.
The most abundant minerals of the Florida deposits include carbonate-fluorapatite (francolite), quartz, dolomite, and clay minerals. Francolite is the only economic phosphate mineral. Iron and aluminum phosphates are characteristic of the uneconomic, highly weathered parts of the deposits. Quartz is the principal gangue mineral. Dolomite is a source of unwanted magnesium in fertilizer processing, and mining is generally terminated when indurated dolostone beds are encountered. Clays are also a source of impurities and present a significant disposal problem.
This study shows that all the Florida deposits are altered or are mixtures of more and less altered material. Changes in ore characteristics in individual sections and across the entire deposit are due to gross variations in mineralogic composition and more subtle variations in francolite and clay composition. These variations in mineralogic composition can be related to the depositional history, reworking, and weathering of the deposits.
INTRODUCTION
The Neogene phosphorite deposits of the southeastern United States were formed in a major phosphogenic province that extended along the Atlantic Coastal Plain from North Carolina to the center of the Florida Peninsula. Phosphate occurs onshore and offshore in rocks of Miocene age. Younger phosphatic strata are also present; much of this phosphate probably was derived from pre-existing Miocene rocks. Although phosphate grains are present in all areas where Miocene sedimentary rocks occur, economic or potentially economic Miocene and Pliocene deposits are present only in North Carolina, southern South Carolina and northern Georgia, southern Georgia and northern Florida, and central Florida. The identified recoverable resources of this vast deposit have been estimated by Cathcart and others (1984, p. 44) to be about 7 billion metric tons of concentrate, and additional hypothetical resources may be as much as 13 billion tons.
The initial discovery of phosphate in the United States was near Charleston, South Carolina, and
Introduction 1
phosphate was first mined there in 1867. Mining of phosphate in Florida began in 1888 from phosphatebearing gravel bars along the Peace River in Polk County and the Alafia River in Hillsborough County. These were the so-called river-pebble deposits. The dredging that b~g~n in the rivers moved onto the flood plains, and mmmg finally spread to the uplands adjacent to the rivers. The upland material was called, logically enough, land pebble. Ore from the higher grade and more uniform land-pebble deposits became the mainstay of the phosphate market, and river-pebble mining ceased early in the 20th century.
In the first half century of mining in Florida, only the plus 16-mesh fraction (pebble) was utilized. Flotation to separate fine-grained phosphate from quartz became technically and economically feasible in the mid-1930s. U!il~zin~ flotation technology, the Florida phosphatemmmg mdustry expanded; maximum production was reached in 1979 at approximately 42 million tons per year, and the total production of product (about 32 percent P20s) from 1891 to 1984 approached 1 billion tons (Cathcart, 1985).
The location of the economic phosphate deposits of the southeastern United States is in part controlled by structure (Cathcart, 1968; Freas, 1968; Freas and Riggs, 1968; Riggs, 1984). Phosphate was deposited in basins on the flanks of topographic or structural highs. Although structure appears to be a prime factor in the location of the deposits, other factors such as reworking and secondary enrichment have contributed to the formation of economic deposits. Rooney and Kerr (1967) noted the extensively reworked nature of the North Carolina phosphorite and a general lack of alteration. Cathcart and Davidson (1952), Altschuler and others (1958), Altschuler and others (1964), and Altschuler (1965) have pointed out the importance of extensive reworking and secondary enrichment in the Florida deposits.
The phosphatic sediments of the economic deposits of Florida are unconsolidated or partly consolidated clay, sand, and minor carbonate rock. All the Miocene ~ediments of Florida contain phosphate particles (pellets, mterclasts, bone fragments, and other grain types), quartz, clay minerals, and carbonate minerals (dolomite and calcite). Phosphatic carbonate rocks, some of which are well cemented, are abundant below mined sections and in the deeper parts of the basins. A major part of the total resource is this type of material. Heavy minerals are presen! thr?ughout the phosphatic sediments, but they occur m mmor or trace amounts. Iron and aluminum phosphate minerals are the products of weathering in the surficial parts of the deposits.
The most abundant minerals of the phosphate deposits of Florida are francolite (carbonatefluorapatite), quartz, dolomite, and various clay minerals. . Francolite is the only economic phosphate
mineral. Quartz is the most abundant mineral in the deposits. The clay minerals are a major source of elemental impurities in the ore (Fe3
+, AJ3+, Mg2+ ). The disposal of the clay minerals in the slime fraction (generally minus 150 mesh) is a serious problem in Florida. Magnesium, mostly in dolomite, is difficult and expensive to remove by beneficiation or during chemical processing. Francolite, dolomite, and the clay minerals of the deposits have variable compositions that may indicate both the environment of deposition and diagenesis, and the discussion in this paper therefore focuses primarily on these mineral groups.
Until recently, all mining of the high-grade landpebble deposits of the central Florida phosphate district was in Polk and Hillsborough Counties, and mining was generally restricted to the coarse phosphorite at the top of the sections. These coarse high-grade deposits in the upper parts of sections in the central district are becoming depleted, and therefore mining is progressing deeper into sections in the central district and, to the south, into the southern extension in Hardee, Manatee, and DeSoto Counties (Bernardi and Hall, 1980). Two mines have been developed in northern Florida (Swift Creek and Suwannee River). The deposits of the southern extension and northern Florida are lower in grade, and the easily beneficiated pebble (plus 16-mesh) fraction is less abundant and is contaminated by dolomite grains. The phosphate grains of the feed fraction (minus 16 plus 150-mesh) are lower in P205 content and have greater amounts of mineral contaminants than the deposits in the central district. The changes in ore characteristics from the central district to the southern extension have been attributed to certain geologic factors. The southern deposits are less intensely altered, and there is a transition in the depositional environment from nearshore to offshore conditions (Riggs, 1979a, 1979b; Bernardi and Hall, 1980; Cathcart, 1985).
All the economic phosphate deposits of Florida have been altered or are mixtures of more and less altered material. Part of the change in ore characteristics from the central district to outlying areas and deeper in sections is due to systematic variations in the composition of the francolite constituent of the ore. Complex cycles of deposition, reworking, and subaerial weathering produced the deposits in their present state.
Acknowledgments
The field and laboratory studies that this paper summarizes have been part of a cooperative study between the U.S. Geological Survey (USGS) and the International Fertilizer Development Center (IFDC) under the auspices of the International Geological Correlation Program (IGCP) Project !56-Phosphorites.
2 Mineralogy and Alteration of the Phosphate Deposits of Florida

This paper represents the continued commitment of these organizations to phosphorite research. The association with the IGCP enables developing countries to use this research in developing their phosphate resources.
We are indebted to many of our colleagues for their contributions to this work. T.M. Scott, Florida Geological Survey, was very helpful in unraveling stratigraphic details and assisting in some of the fieldwork. Z.S. Altschuler provided stimulating discussions on the geochemistry and mineralogy of the deposits. The following IFDC colleagues provided analyses: B.W. Biggers, M.R. Williams, B.A. Hamilton, T.C. Woodis, and D.W. Wright. M.R. Williams is particularly thanked for her efforts; much of the sample preparation and X-ray diffraction analysis was her responsibility. Marie Thompson and Marie Stribling cheerfully coordinated the artwork and word processing. Their staffs are gratefully acknowledged.
We are deeply grateful to the mining and administrative staffs of the many companies engaged in phosphate mining in Florida for their wholehearted cooperation in allowing J .B. Cathcart access to operating pits in 1984.
METHODS OF STUDY
J.B. Cathcart collected 51 samples from mines in north, central, and south Florida during 1984 (fig.l). The samples represent currently mined economic zones (matrix). Stratigraphic correlations were made by J.B. Cathcart with the assistance ofT .M. Scott of the Florida Geological Survey. Several of the samples were collected over vertical distances of tens of feet, and some were composited from sections taken from different sites at the same mine. Therefore, some of the observed variations in mineralogy may be the result of homogenization. These samples should not be construed as representative of any particular mine.
All chemical and XRD (X-ray diffraction) analyses were performed in the laboratories of IFDC. Copper radiation, at 50 kV (kilovolts) and 20 ma (milliamperes) with a graphite monochromator, was used for all XRD work. Chemical analyses were done by one or more of the standard analytical methods: X-ray fluorescence, atomic absorption, ion chromatography, gas evolution, and colorimetric and gravimetric determinations. Majorelement analyses were cross-checked by two methods.
The samples were oven dried at 95°C, gently disaggregated by hand, and split to obtain representative samples for bulk chemical analyses and XRD studies. About half of each sample was placed in 1 L (liter) of distilled water containing 0.05 g (gram) of dispersant and allowed to stand overnight. Samples were wet screened
on 20- and 200-mesh (Tyler) sieves to separate the plus 20-(pebble ), minus 20- plus 200- (flotation feed), and minus 200-mesh (slime) fractions. The clay fraction ( < 2 p.m (micrometer)) was separated from the minus 200-mesh fraction by standard sedimentation techniques (Folk, 1974).
Separated size fractions (pebble, flotation feed, slime, and clay) and bulk samples were X-rayed in random powder packs to determine their mineralogy. Mineral abundances were estimated from the XRD traces as major, minor, or trace (see appendix for details). These data are qualitative and are used only to identify the mineral assemblages and compare relative proportions of the minerals in the different size fractions and at the various mine localities.
Air-dried, oriented clay samples were prepared by sedimentation onto glass slides for clay-mineral analysis. To facilitate identification of specific clay minerals, the oriented samples were glycolated and X -rayed again. These oriented samples were then heated to 350°C and X-rayed once more. Some clay samples were also treated by lithium saturation. Randomly oriented smectite samples that contained no detectable kaolinite were X-rayed to determine the d-spacings of the 060 reflections. These characteristic d-spacings were utilized to determine the smectite component.
Francolite unit -cell dimensions were determined by a high-resolution computer-assisted XRD technique, and data were reduced by an iterative hexagonal leastsquares method. These unit -cell dimensions have a standard error of ±0.003 A (angstrom). The a-value of the francolite unit cell shows the greatest variation and indicates isomorphic substitution in the apatite structure (McClellan and Lehr, 1969; McClellan, 1980). Thus, the a-value is the parameter rised in this report as an indicator of francolite composition. In general, the smaller the a-value, the greater the amount of C02, S04, and V04 that are substituted for P04 and sodium, and magnesium for calcium in the francolite.
Grain-Size Analyses
Average grain sizes of the Bone Valley Member and the economic undifferentiated part of the Peace River Formation are given in table 1. Grain-size data for individual sections are given in figures 5-23 (appendix). Bernardi and Hall (1980) listed similar grain-size data for the land-pebble district and southern extension using slightly different mesh sizes. Obviously, the Bone Valley Member, differentiated by its pebble content, is coarser. The remaining underlying undifferentiated part of the Peace River Formation has a higher content of feed fraction, but the proportion of slime is about the same.
Methods of Study 3

a~ ar CHATTAHOOCHEE', I ANTICLINE --- --- I GEORGIA \ -, / =-"-Fi:"oruo.A.-~--------t
- ...; :(-. _ Swift Creek (\ 1
o-0(:) / ' a'?d S~annee'-\ -<,.~ / '-R.!!!..er mmes
6'0.J // '\
-',,,"'} JACKSONVILLE
BASIN
/ \ -t~~----------------~------+-----~--+-------------------~30°
\
EXPLANATION ---Boundary of land-pebble
phosphate district
- - -Boundary of southern extension
Mine
------
0
--- ---
R 27 E 30 MILES
0 30 KILOMETERS
\ \ \ \ \
I I
I
0
0
I ST.JOHN'S ( PLATFORM
' \ .. r-\
\ \ \
CENTRAL FLORIDA
PLATFORM
9o
\ SANFORD \ HIGH
\ 1'--/ \ BREVARD \PLATFORM
\ \ \
-
OKEECHOBEE BASIN
100 MILES
100 KILOMETERS
Figure 1. Sketch map of Florida showing major structural features and phosphate mines in central Florida.
4 Mineralogy and Alteration of the Phosphate Deposits of Florida
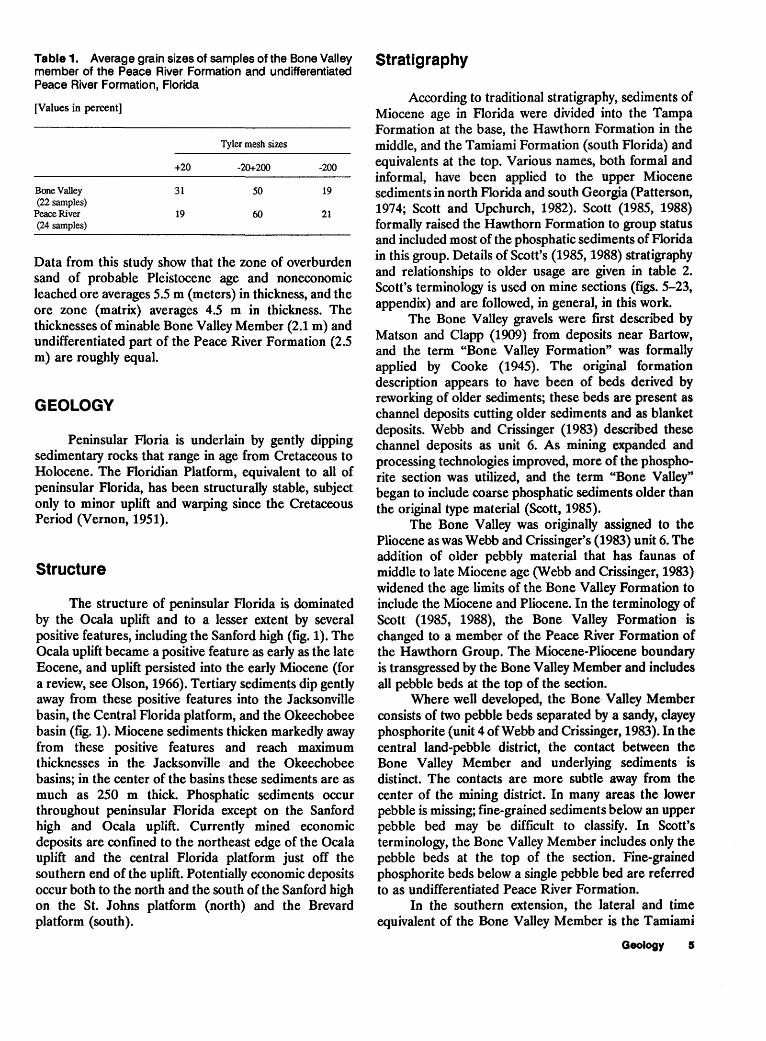
Table 1. Average grain sizes of samples of the Bone Valley member of the Peace River Formation and undifferentiated Peace River Formation, Florida
[Values in percent)
Tyler mesh sizes
+20 -20+200 -200
Bone Valley 31 50 19 (22 samples)
Peace River 19 60 21 (24 samples)
Data from this study show that the zone of overburden sand of probable Pleistocene age and noneconomic leached ore averages 5.5 m (meters) in thickness, and the ore zone (matrix) averages 4.5 m in thickness. The thicknesses of minable Bone Valley Member (2.1 m) and undifferentiated part of the Peace River Formation (2.5 m) are roughly equal.
GEOLOGY
Peninsular Floria is underlain by gently dipping sedimentary rocks that range in age from Cretaceous to Holocene. The Floridian Platform, equivalent to all of peninsular Florida, has been structurally stable, subject only to minor uplift and warping since the Cretaceous Period (Vernon, 1951).
Structure
The structure of peninsular Florida is dominated by the Ocala uplift and to a lesser extent by several positive features, including the Sanford high (fig. 1). The Ocala uplift became a positive feature as early as the late Eocene, and uplift persisted into the early Miocene (for a review, see Olson, 1966). Tertiary sediments dip gently away from these positive features into the Jacksonville basin, the Central Florida platform, and the Okeechobee basin (fig. 1). Miocene sediments thicken markedly away from these positive features and reach maximum thicknesses in the Jacksonville and the Okeechobee basins; in the center of the basins these sediments are as much as 250 m thick. Phosphatic sediments occur throughout peninsular Florida except on the Sanford high and Ocala uplift. Currently mined economic deposits are confined to the northeast edge of the Ocala uplift and the central Florida platform just off the southern end of the uplift. Potentially economic deposits occur both to the north and the south of the Sanford high on the St. Johns platform (north) and the Brevard platform (south).
Stratigraphy
According to traditional stratigraphy, sediments of Miocene age in Florida were divided into the Tampa Formation at the base, the Hawthorn Formation in the middle, and the Tamiami Formation (south Florida) and equivalents at the top. Various names, both formal and informal, have been applied to the upper Miocene sediments in north Florida and south Georgia (Patterson, 1974; Scott and Upchurch, 1982). Scott (1985, 1988) formally raised the Hawthorn Formation to group status and included most of the phosphatic sediments of Florida in this group. Details of Scott's (1985, 1988) stratigraphy and relationships to older usage are given in table 2. Scott's terminology is used on mine sections (figs. 5-23, appendix) and are followed, in general, in this work.
The Bone Valley gravels were first described by Matson and Clapp (1909) from deposits near Bartow, and the term "Bone Valley Formation" was formally applied by Cooke (1945). The original formation description appears to have been of beds derived by reworking of older sediments; these beds are present as channel deposits cutting older sediments and as blanket deposits. Webb and Crissinger (1983) described these channel deposits as unit 6. As mining expanded and processing technologies improved, more of the phosphorite section was utilized, and the term "Bone Valley" began to include coarse phosphatic sediments older than the original type material (Scott, 1985).
The Bone Valley was originally assigned to the Pliocene as was Webb and Crissinger's (1983) unit 6. The addition of older pebbly material that has faunas of middle to late Miocene age (Webb and Crissinger, 1983) widened the age limits of the Bone Valley Formation to include the Miocene and Pliocene. In the terminology of Scott (1985, 1988), the Bone Valley Formation is changed to a member of the Peace River Formation of the Hawthorn Group. The Miocene-Pliocene boundary is transgressed by the Bone Valley Member and includes all pebble beds at the top of the section.
Where well developed, the Bone· Valley Member consists of two pebble beds separated by a sandy, clayey phosphorite (unit 4 of Webb and Crissinger, 1983). In the central land-pebble district, the contact between the Bone Valley Member and underlying sediments is distinct. The contacts are more subtle away from the center of the mining district. In many areas the lower pebble is missing; fine-grained sediments below an upper pebble bed may be difficult to classify. In Scott's terminology, the Bone Valley Member includes only the pebble beds at the top of the section. Fine-grained phosphorite beds below a single pebble bed are referred to as undifferentiated Peace River Formation.
In the southern extension, the lateral and time equivalent of the Bone Valley Member is the Tamiami
Geology 5
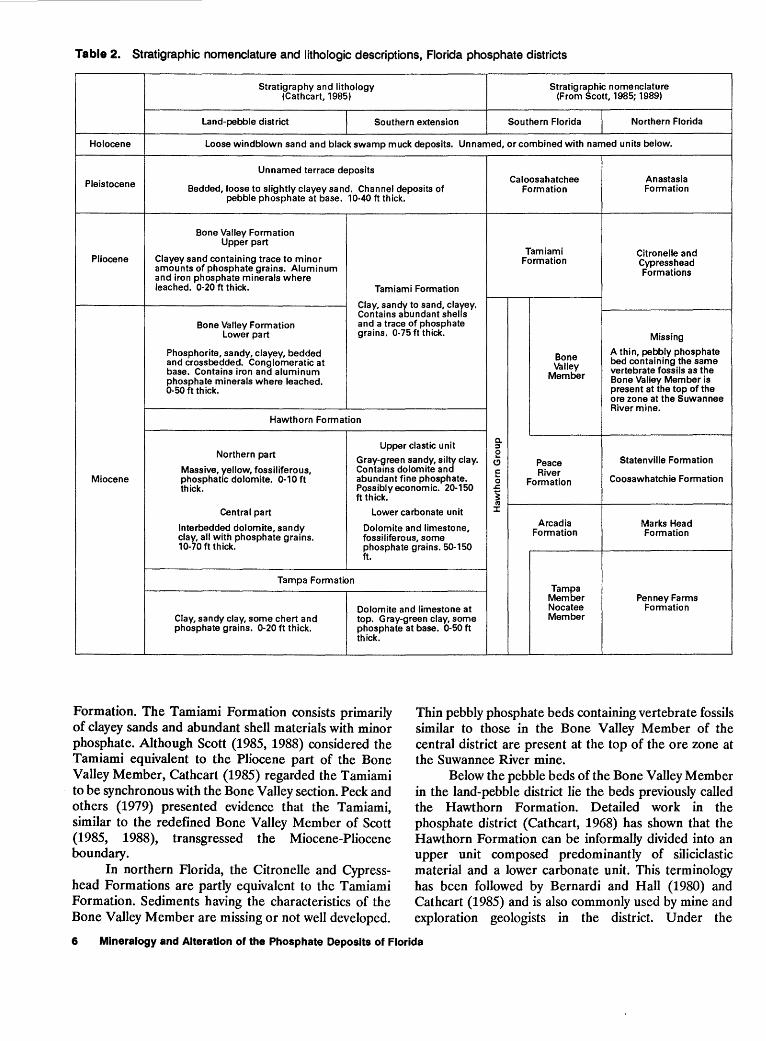
Table 2. Stratigraphic nomenclature and lithologic descriptions, Florida phosphate districts
Stratigraphy and lithology Stratigraphic nomenclature (Cathcart, 1985) (From Scott, 1985; 1989)
Land-pebble district Southern extension Southern Florida Northern Florida
Holocene Loose windblown sand and black swamp muck deposits. Unnamed, or combined with named units below.
Unnamed terrace deposits Caloosahatchee Anastasia Pleistocene Bedded, loose to slightly clayey sand. Channel deposits of Formation Formation
pebble phosphate at base. 10-40 ft thick.
Bone Valley Formation Upper part
Tamiami Citronelle and Pliocene Clayey sand containing trace to minor Formation Cypress head
amounts of phosphate grains. Aluminum Formations and iron phosphate minerals where leached. 0-20 ft thick. Tamiami Formation
Clay, sandy to sand, clayey. Contains abundant shells
Bone Valley Formation and a trace of phosphate Lower part grains. 0-75 ft thick. Missing
Phosphorite, sandy, clayey, bedded Bone A thin, pebbly phosphate
and crossbedded. Conglomeratic at Valley bed containing the same
base. Contains iron and aluminum Member vertebrate fossils as the
phosphate minerals where leached. Bone Valley Member is 0-50 ft thick. present at the top of the
ore zone at the Suwannee River mine.
Hawthorn Formation
Upper clastic unit a. ::1
Northern part 0 Gray-green sandy, silty clay. (; Peace Statenville Formation
Massive, yellow, fossiliferous, Contains dolomite and c River Miocene phosphatic dolomite. 0-10 ft abundant fine phosphate. 0 Formation Coosawhatchie Formation
thick. Possiblyeconomic. 20-150 .r.
ft thick. ~ ('tl
Central part Lower carbonate unit J:
Interbedded dolomite, sandy Dolomite and limestone, Arcadia Marks Head
clay, all with phosphate grains. fossiliferous, some Formation Formation
10-70 ft thick. phosphate grains. 50-150 ft.
Tampa Formation Tampa
Member Penney Farms Dolomite and limestone at Nocatee Formation
Clay, sandy clay, some chert and top. Gray-green clay, some Member phosphate grains. 0-20 ft thick. phosphate at base. 0-50 ft
thick.
Formation. The Tamiami Formation consists primarily of clayey sands and abundant shell materials with minor phosphate. Although Scott (1985, 1988) considered the Tamiami equivalent to the Pliocene part of the Bone Valley Member, Cathcart (1985) regarded the Tamiami to be synchronous with the Bone Valley section. Peck and others (1979) presented evidence that the Tamiami, similar to the redefined Bone Valley Member of Scott (1985, 1988), transgressed the Miocene-Pliocene boundary.
Thin pebbly phosphate beds containing vertebrate fossils similar to those in the Bone Valley Member of the central district are present at the top of the ore zone at the Suwannee River mine.
In northern Florida, the Citronelle and Cypresshead Formations are partly equivalent to the Tamiami Formation. Sediments having the characteristics of the Bone Valley Member are missing or not well developed.
Below the pebble beds of the Bone Valley Member in the land-pebble district lie the beds previously called the Hawthorn Formation. Detailed work in the phosphate district (Cathcart, 1968) has shown that the Hawthorn Formation can be informally divided into an upper unit composed predominantly of siliciclastic material and a lower carbonate unit. This terminology has been followed by Bernardi and Hall (1980) and Cathcart (1985) and is also commonly used by mine and exploration geologists in the district. Under the
6 Mineralogy and Alteration of the Phosphate Deposits of Florida
stratigraphic revision, the upper clastic unit of the Hawthorn Formation is assigned to the Peace River Formation (Scott, 1985, 1988).
The Peace River Formation below the Bone Valley Member consists primarily of phosphatic, gray-green to blue clay, sand, and dolostone. Dolostone lenses are found at the base of the unit in the transition to the beds below. The undifferentiated Peace River Formation contains discontinuous pebble beds. Distinct pebble beds can be observed below indurated dolostones at the bases of many mines when water levels in drainage ditches are low.
The Statenville and Coosawhatchie Formations of north Florida are equivalent to the undifferentiated Peace River Formation. The Statenville Formation consists of phosphatic to very phosphatic interbedded and cross-bedded sand and clay with minor carbonate beds. The underlying Coosawhatchie Formation is composed of phosphatic, dolomitic sand and clay. Phosphate production in north Florida is from the Statenville Formation.
Below the Peace River Formation the carbonate unit of the Hawthorn has been renamed the Arcadia Formation (Scott, 1985, 1988, modified from Dall and Harris, 1892). The distinction between the Arcadia and Peace River Formations is the carbonate content. Where the carbonate content of the rock exceeds 50 percent and persists to depth, it is termed "Arcadia Formation". The Arcadia consists primarily of indurated dolostones. Phosphate grains and some nodules are present. It may not be possible to differentiate the Peace River and Arcadia Formations by outcrop alone; that is, if dolostone beds are found at the bottom of mining pits, they may either be carbonate lenses at the base of the Peace River or the top of the Arcadia Formation.
Equivalents of the Arcadia Formation in north Florida are the Marks Head and Penney Farms Formations. The Marks Head Formation is a complexly interbedded sequence of phosphatic carbonate, sand, and clay. The underlying Penney Farms Formation lies unconformably on Eocene carbonates and consists of interbedded phosphatic dolomites and siliciclastics. The dolomites become more abundant at the base.
The Tampa Formation has been reassigned as a member of the Arcadia Formation of the Hawthorn Group. The Tampa Member consists primarily of limestone and minor dolostone. A discontinuous darkgray to gray-green silty dolomitic clay occurs at the base. The Tampa Member pinches out north of the central Florida phosphate district and appears to be the time equivalent of the Penney Farms Formation in north Florida.
CHEMICAL ANALYSES OF PHOSPHATE ORES
The chemical analyses of bulk samples of phosphate ore (table 3) indicate their mineralogic composition. Each chemical component is present in one or more minerals. Each mineral, especially francolite and iron and aluminum phosphates, may have variable compositions.
Beneficiation engineers and phosphate geologists commonly evaluate the chemistry of ore and phosphate concentrate in terms of major-element ratios such as CaO/P20s and F/P20s. The F!P20s ratio for a stoichiometric fluorapatite is 0.09, and for the most highly substituted francolite it is about 0.15 (McClellan, 1980). Similarly, the CaO/P20s ratio is 1.32 for fluorapatite and 1.62 for francolite with maximum substitution. The presence of carbonates increases the CaO/P20s ratio above the ratio of the francolite that is present. Conversely, the presence of nonapatitic phosphates depresses this ratio.
The P20 5 contents of the samples are highly variable both within mines and within the entire data set; thus, general trends are not apparent. P20s is a component of francolite and of iron and aluminum phosphate minerals. The average P20s content of the Florida deposits is listed in industry reports and trade journals as 32 percent or about 70 percent bone phosphate of lime· (BPL), but this figure is for concentrated phosphate particles and not for the deposit in the ground. The arithmetic average of the P20s content of all the stratigraphically correlated matrix samples in this study is 13.9 percent. Data in Pirkle and others (1967) show that 13 matrix samples from the central district averaged 15.5 percent P20 5 • If the data from north Florida and the southern extension are excluded, the samples of this study contain an average of 14.5 percent P20s. The Bone Valley Member, or equivalents, has a slightly higher P20s content (14.6 percent) than the minable undifferentiated Peace River Formation or equivalents (13.3 percent). Phosphate gravels of the Bone Valley Member are thin or absent to the south and east of the central district, and samples from north Florida and the transition to the southern extension are an indication of ore assays in the future; these samples average 9.5 percent P20s.
The CaO content varies primarily with the francolite and carbonate contents but also with the clay and calcium-aluminum phosphate components. In 12 of the 17 mines examined, having both the Bone Valley Member and the undifferentiated part of the Peace River Formation in the section, the CaO/P20s ratio increases with depth. In three mines, the ratio decreases; in two, it remains the same. Samples of the Bone Valley Member and its possible equivalent in North Florida have a lower average CaO/P20s ratio (1.44) than samples of the undif-
Chemical Analyses of Phosphate Ores 7

Table 3. Chemical analyses of bulk samples of Florida phosphate ores
(Analyses in weight percent. BVE, Bone Valley Member equivalent; LBV, leached Bone Valley Member, Peace River Formation; BV, Bone Valley Member, Peace River Formation; UPR, undifferentiated Peace River Formation; S, = Statenville Formation]
Mine and sample no.
Swift CreekSuwannee River:
1-84--------- BVE 2-84-------- s 3-84-------- s
Noralyn: 6-84--------- BV 4-84--------- UPR 5-84-------- UPR
Gardinier (Cargill): 8-84--------- BV 7-84-------- BV
Nichols: 10-84----- BV 9-84--------- UPR
Fort Meade: 13-84---- BV 12-84----- UPR 11-84------ UPR
Clear Springs: 16-84----- BV 15-84-------- UPR 14-84------ UPR
Hardee Complex: 17-84----- BV 18-84----- BV 19-84------ UPR
Fort Green: 20-84----- LBV 21-84------- BV 22-84----- UPR
Saddle Creek: 25-84 .......... BV 24-84 .......... BV 23-84 .......... UPR
F
8.0 14.8 1.3 7.8 11.9 1.1
10.1 15.5 1.5
21.0 26.2 2.1 22.5 32.6 2. 7 11.2 17.0 1.5
7.3 9.9 1.1 21.0 32.3 2.6
11.9 13.9 2.0 13.8 20.0 1. 7
16.5 24.4 2.0 5.4 7.9 .8
19.8 29.2 2.4
29.6 42.4 3.0 15.1 21.8 1.8 9.2 13.8 1.2
5.7 5.6 .6 19.0 31.3 2.3 20.2 30.0 2.6
15.9 25.5 2.1 22.4 38.4 2.1 15.4 21.6 1.8
15.5 23.3 1.8 15.9 26.1 1.9 15.6 22.6 1.9
Analyses
61.1 3.6 0.7 5.6 2.5 63.8 6.7 1.5 1.7 1.0 64.5 3.3 .9 1.4 .5
39.5 5.2 .8 1.1 .2 31.3 3.6 1.5 2.6 .4 51.0 2.4 8.3 1.7 .9
73.9 4.2 .6 .8 .2 .3 34.6 2.6 1.6 2.8
69.9 3.0 1.3 1.1 56.5 2.6 .6 1.4
46.3 3.9 73.9 5.5 33.1 3.4
20.2 2.9 51.5 3.1 65.1 4.4
80.5 4.0 43.2 1.4 3.2 2.2
17.9 4.6 2.1 2.1 1.9 1.9
48.9 4.3 47.8 3.4 50.0 3.3
.73 1.9 1.4 .9 2.7 3.0
.27 1.7
.59 2.0
.59 1.9
.50 .7
.55 2.7 2.8 3.0
.52 1.9
.7 2.6 1.5 1.8
1.7 1.1 1.8 1.4 2.1 .9
.1
.2
.3
.3
.6
.1
.2
.4
.1
.2
.4
.2
.3
.3
.3
.5
.7
1.85 1.52 1.53
1.25 1.45 1.52
1.36 1.54
1.17 1.45
1.48 1.46 1.47
1.43 1.44 1.50
.98 1.65 1.48
1.60 1.71 1.40
1.50 1.64 1.44
Ratios
0.16 .14 .15
.10
.12
.13
.15
.12
.17
.12
.12
.15
.12
.10
.12
.13
.10
.12
.12
.13
.09
.12
.12
.12
.12
ferentiated Peace River Formation (1.55). The increase in CaO/P20s ratio with depth is primarily due to increases in dolomite content; however, in sections devoid of detectable carbonate, the composition of the francolite appears to change. The presence of iron and aluminum phosphate minerals in near-surface samples i_s indicated by CaO/P20s ratios of less than 1.32.
Francolite is the most common fluorine-bearing mineral in the deposits, although hydroxyl-bearing iron and aluminum phosphates may contain fluorine. The relatively low CaO/P 2 Os and high F /P 2 Os ratios in samples from the Gardinier (Cargill) and Nichols mines (table 3)
suggest that other fluorine-bearing mineral phases may be present, although none has been identified. Although the average F!P20s ratio is the same (0.12) for the Bone Valley Member and the undifferentiated part of the Peace River Formation, it increases with depth in 9 of the 17 mine sections examined, remains the same in 4 sections, and decreases in 4 sections. The increase in the F/P20 5 ratio with depth in many mines suggests that, in general, the francolite is more highly substituted at depth.
Si02 occurs primarily as quartz and clay minerals and to a lesser extent as feldspar and opal. Ah03 is
8 Mineralogy and Alteration of the Phosphate Deposits of Florida

Table 3. Chemical analyses of bulk samples of Florida phosphate ores-Continued
Analyses Ratios
Mine and Strati-sample no. graphy PzOs CaO F SiOz Al203 Fe203 COz MgO CaO-PzOs F-PzOs
Lonesome: 26-84----- BV 11.1 13.2 1.1 47.6 12.3 3.5 0.2 0.9 1.19 0.10 27-84----- UPR 21.0 27.6 2.2 31.6 5.9 2.9 1.0 .5 1.31 .10 28-84----- UPR 12.4 16.4 1.4 54.2 3.9 5.9 .6 .3 1.32 .11
Watson: 29-84----- UPR 15.0 22.2 1.8 47.3 3.4 3.1 1.9 .8 1.48 .12
Phosphoria: 31-84----- BV 11.2 14.6 1.2 62.9 5.7 .88 .9 .3 1.30 .11 30-84------ UPR 12.3 16.9 1.4 55.6 5.7 1.7 1.3 .4 1.30 .11 30A-84------- UPR 9.5 14.0 1.2 52.0 6.1 7.3 1.3 .9 1.47 .12
Rockland: 32-84---- BV 10.0 11.6 1.0 61.2 7.9 1.4 .9 .5 1.16 .10 33-84----- UPR 7.2 10.6 1.0 47.1 2.1 17.0 7.2 1.2 1.47 .14
Haynsworth: 34-84---- BY 18.3 25.9 2.1 46.4 1.7 .87 1.2 .24 1.41 .11 35-84---- UPR 17.3 24.2 1.9 47.5 2.1 .93 1.5 .25 1.39 .11
Lonesome: 37-84---- BY 12.1 18.7 1.3 57.1 5.0 1.3 1.4 .49 1.54 .11 36-84---- UPR 13.3 22.6 1.7 48.1 4.5 1.8 1.2 2.0 1.70 .12
Hookers Prairie: 41-84---- l.BV 20.2 28.4 2.3 37.4 4.1 .76 2.2 .29 1.40 .11 40-84----- BY 13.7 23.0 1.7 50.1 4.4 1.4 2.1 .58 1.68 .12 39-84----- UPR 10.6 22.0 1.4 41.0 3.6 1.7 7.5 4.2 2.07 .13 38-84----- UPR 8.4 13.6 .8 66.6 3.6 1.8 1.3 .78 1.62 .09
Four Comers: 44-84---- BY 8.7 13.1 .8 74.0 1.1 .88 1.0 .2 1.50 .09 43-84---- UPR 9.7 21.1 1.0 47.9 1.8 1.2 8.1 3.96 2.17 .10 42-84----- UPR 9.5 14.7 .9 62.6 4.3 2.5 1.2 .59 1.54 .09
Kingsford: 47-84----- BY 12.6 18.8 1.2 53.9 5.1 1.9 1.1 .49 1.49 .09 46-84--- UPR 15.4 28.6 1.8 28.6 2.7 4.4 9.1 3.59 1.86 .11 45-84---- UPR 12.0 23.2 1.4 41.0 3.1 2.3 8.0 3.33 1.93 .12
Noranda-Hopewell: 48-84----- Unknown 22.8 33.2 2.4 27.4 4.6 1.6 2.2 .46 1.46 .10
Beker-Wmgate Creek: I 49-84---- Unknown 30.3 44.7 3.4 7.9 1.2 2.1 4.0 .49 1.47 .11 50-84----- Unknown 13.7 32.6 1.6 17.3 1.4 1.9 16.9 7.6 2.38 .12
1 Sample 49-84 is a -20+200 mesh concentrate; sample 50-84 is +20 mesh pebble. Mining is under water, so stratigraphy is unknown.
present in the clay minerals, aluminophosphate minerals, the result of both varying amounts of the mineral and feldspar. Fe203 is highly variable and occurs as iron components and varying composition of the mineral oxides, in iron phosphate minerals, and in clay carbonate species. The proportions of the mineral phases present minerals. The C02 content varies with the amounts of may not be indicated by chemical data alone; however, francolite and rhombic carbonate minerals. Most MgO is changes in the CaO/P20s and FIP20s ratios can indicate in dolomite, but francolite and the clay minerals also variations of francolite composition both regionally and contain MgO. stratigraphically. The Bone Valley Member is only
The chemistry of the samples from mine to mine slightly more phosphatic than the minable zones of the and within mines is highly variable, and differences are undifferentiated part of the Peace River Formation.
Chemical Analyses of Phosphate Ores 9
MINERALOGY
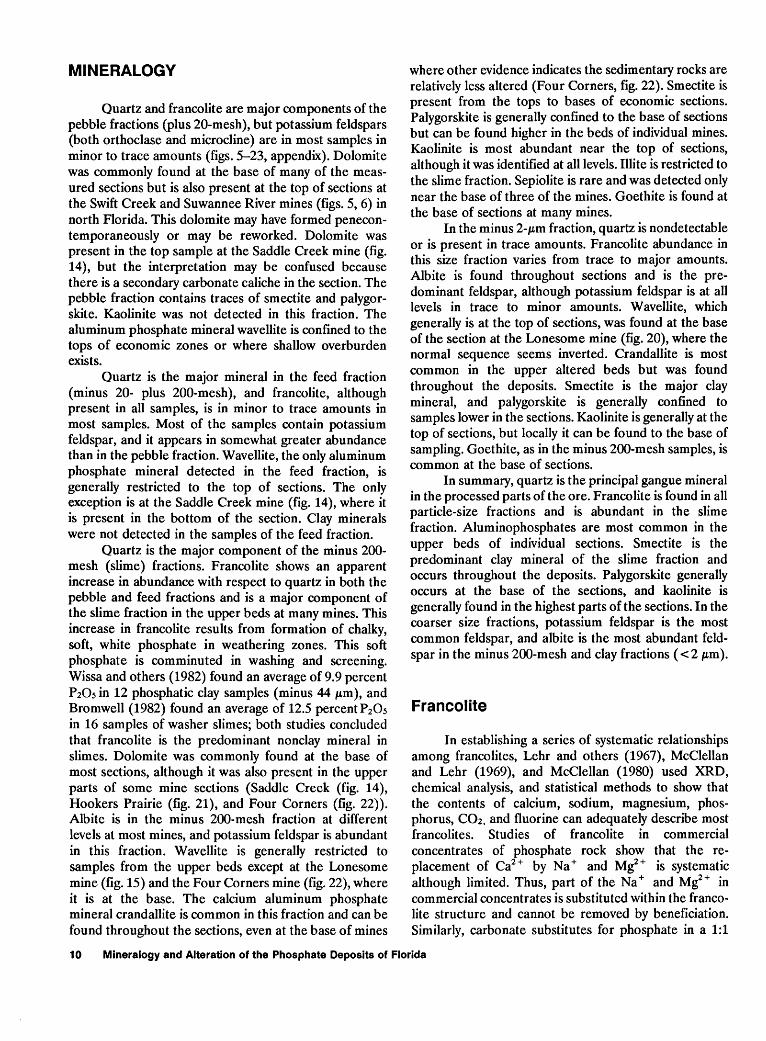
Quartz and francolite are major components of the pebble fractions (plus 20-mesh), but potassium feldspars (both orthoclase and microcline) are in most samples in minor to trace amounts (figs. 5-23, appendix). Dolomite was commonly found at the base of many of the measured sections but is also present at the top of sections at the Swift Creek and Suwannee River mines (figs. 5, 6) in north Florida. This dolomite may have formed penecontemporaneously or may be reworked. Dolomite was present in the top sample at the Saddle Creek mine (fig. 14), but the interpretation may be confused because there is a secondary carbonate caliche in the section. The pe~ble frac!i~n contains traces of smectite and palygorskite. Kaohmte was not detected in this fraction. The aluminum phosphate mineral wavellite is confined to the tops of economic zones or where shallow overburden exists.
Quartz is the major mineral in the feed fraction (minus 20- plus 200-mesh), and francolite, although present in all samples, is in minor to trace amounts in most samples. Most of the samples contain potassium feldspar, and it appears in somewhat greater abundance than in the pebble fraction. Wavellite, the only aluminum phosphate mineral detected in the feed fraction, is gener~lly ~estricted to the top of sections. The only ~xcephon I~ at the Saddle Creek mine (fig. 14), where it IS present m the bottom of the section. Clay minerals were not detected in the samples of the feed fraction.
Quartz is the major component of the minus 200-~esh (sl~me) fractions. Francolite shows an apparent mcrease m abundance with respect to quartz in both the pebble and feed fractions and is a major component of the slime fraction in the upper beds at many mines. This increase . in francolite results from formation of chalky, soft, white phosphate in weathering zones. This soft phosphate is comminuted in washing and screening. Wissa and others (1982) found an average of 9.9 percent P205 in 12 phosphatic clay samples (minus 44 ~m), and ~romwell (1982) found an average of 12.5 percentP20 5 m 16 samples of washer slimes; both studies concluded that francolite is the predominant nonclay mineral in slimes. Dolomite was commonly found at the base of most sections, although it was also present in the upper parts of some mine sections (Saddle Creek (fig. 14), Ho~ker.s ~rairie (fi~. 21), and Four Corners (fig. 22)). Albite IS m the mmus 200-mesh fraction at different levels at most mines, and potassium feldspar is abundant in this fraction. Wavellite is generally restricted to samples from the upper beds except at the Lonesome ~i~e (fig. 15) and the Four Corners mine (fig. 22), where It . IS at the base. The calcium aluminum phosphate mmeral crandallite is common in this fraction and can be found throughout the sections, even at the base of mines
where other evidence indicates the sedimentary rocks are relatively less altered (Four Corners, fig. 22). Smectite is present from the tops to bases of economic sections. Palygorskite is generally confined to the base of sections but can be found higher in the beds of individual mines. Kaolinite is most abundant near the top of sections, although it was identified at all levels. Illite is restricted to the slime fraction. Sepiolite is rare and was detected only near the base of three of the mines. Goethite is found at the base of sections at many mines.
In the minus 2-~m fraction, quartz is nondetectable or is present in trace amounts. Francolite abundance in this size fraction varies from trace to major amounts. Albite is found throughout sections and is the predominant feldspar, although potassium feldspar is at all levels in trace to minor amounts. Wavellite, which generally is at the top of sections, was found at the base of the section at the Lonesome mine (fig. 20), where the normal sequence seems inverted. Crandallite is most common in the upper altered beds but was found throughout the deposits. Smectite is the major clay mineral, and palygorskite is generally confined to samples lower in the sections. Kaolinite is generally at the top of sections, but locally it can be found to the base of sampling. Goethite, as in the minus 200-mesh samples, is common at the base of sections.
In summary, quartz is the principal gangue mineral in the processed parts of the ore. Francolite is found in all particle-size fractions and is abundant in the slime fraction. Aluminophosphates are most common in the upper beds of individual sections. Smectite is the predominant clay mineral of the slime fraction and occurs throughout the deposits. Palygorskite generally occurs at the base of the sections, and kaolinite is generally found in the highest parts of the sections. In the coarser size fractions, potassium feldspar is the most common feldspar, and albite is the most abundant feldspar in the minus 200-mesh and clay fractions ( < 2 ~m ).
Francolite
In establishing a series of systematic relationships among francolites, Lehr and others (1967), McClellan and Lehr (1969), and McClellan (1980) used XRD, chemical analysis, and statistical methods to show that the contents of calcium, sodium, magnesium, phosphorus, C02. and fluorine can adequately describe most francolites. Studies of francolite in commercial concentrates of phosphate rock show that the replacement of Ca2 + by Na + and Mg2 + is systematic although limited. Thus, part of the Na + and Mg2
+ in commercial concentrates is substituted within the francolite structure and cannot be removed by beneficiation. Similarly, carbonate substitutes for phosphate in a 1:1
10 Mineralogy and Alteration of the Phosphate Deposits of Florida
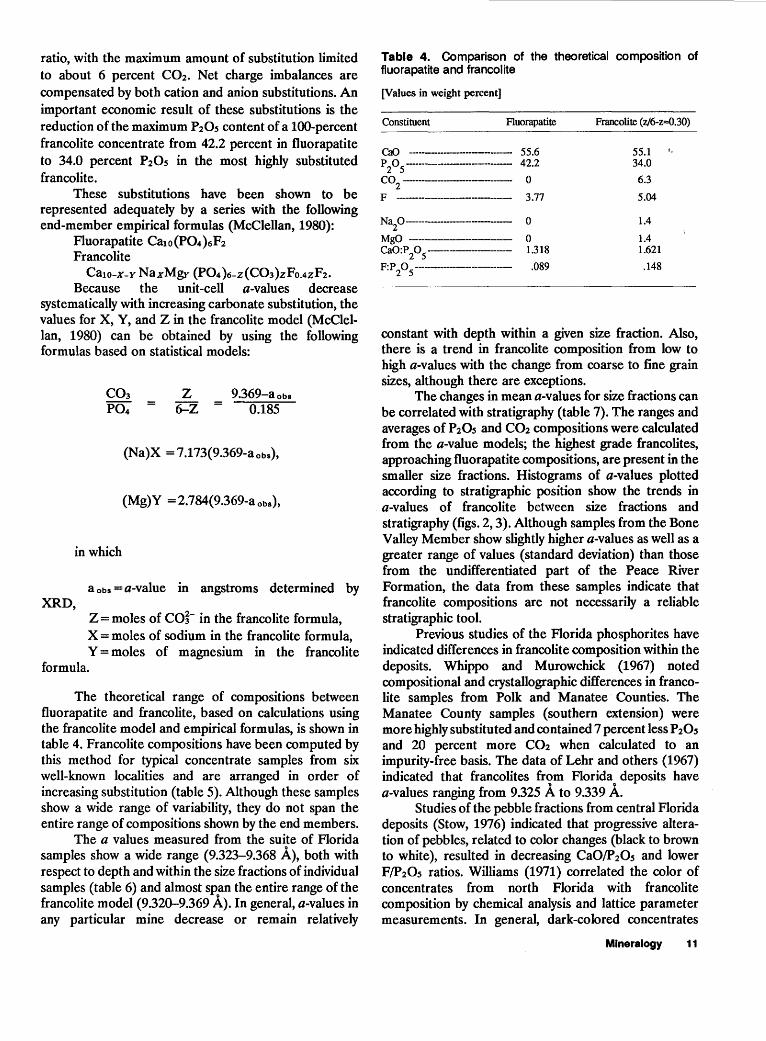
ratio, with the maximum amount of substitution limited to about 6 percent C02. Net charge imbalances are compensated by both cation and anion substitutions. An important economic result of these substitutions is the reduction of the maximum P20s content of a 100-percent francolite concentrate from 42.2 percent in fluorapatite to 34.0 percent P20s in the most highly substituted francolite.
These substitutions have been shown to be represented adequately by a series with the following end-member empirical formulas (McClellan, 1980):
Fluorapatite Ca1o(P04)6F2 Francolite
Ca1o-X-Y NaxMgy (P04)6-z(C03)zFo.4zF2. Because the unit -cell a-values decrease
systematically with increasing carbonate substitution, the values for X, Y, and Z in the francolite model (McClellan, 1980) can be obtained by using the following formulas based on statistical models:
z 6-Z
9.369-aobs 0.185
(Na)X =7.173(9.369-aobs),
(Mg)Y =2.784(9.369-aobs),
in which
XRD, a obs =a-value in angstroms determined by
z = moles of co~- in the francolite formula, X= moles of sodium in the francolite formula, Y = moles of magnesium in the francolite
formula.
The theoretical range of compositions between fluorapatite and francolite, based on calculations using the francolite model and empirical formulas, is shown in table 4. Francolite compositions have been computed by this method for typical concentrate samples from six well-known localities and are arranged in order of increasing substitution (table 5). Although these samples show a wide range of variability, they do not span the entire range of compositions shown by the end members.
The a values measured from the suite of Florida samples show a wide range (9.323-9.368 A), both with respect to depth and within the size fractions of individual samples (table 6) and almost span the entire range of the francolite model (9.320-9.369 A). In general, a-values in any particular mine decrease or remain relatively
Table 4. Comparison of the theoretical composition of fluorapatite and francolite
[Values in weight percent]
Constituent Fluorapatite
Ca() -------------------- 55.6 p 2 0 5 ----------------------- 42.2
C02 ------------------------ 0
F --------------------------- 3. 77
Na2 0---------------------- 0
MgO --------------------- 0 1.318 CaO:P 2 0
5 -----------------
F:P 2 0 5
--------------------- .089
Francolite (z/6-z...0.30)
55.1 I,
34.0
6.3
5.04
1.4
1.4 1.621
.148
constant with depth within a given size fraction. Also, there is a trend in francolite composition from low to high a-values with the change from coarse to fine grain sizes, although there are exceptions.
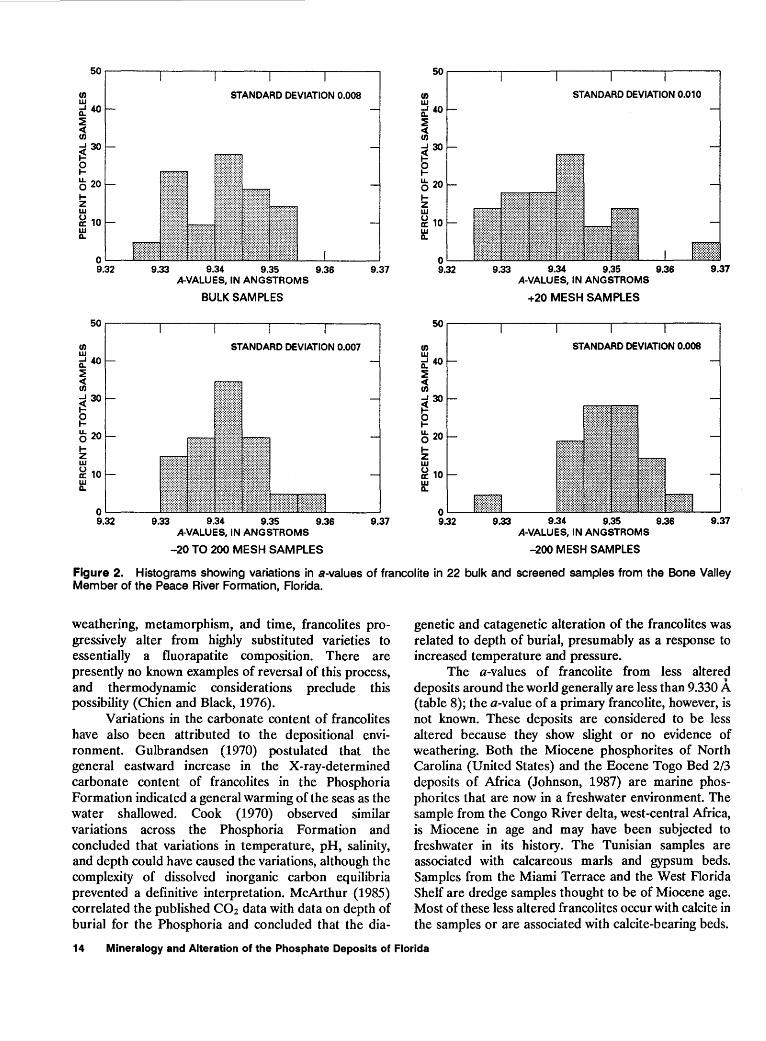
The changes in mean a-values for size fractions can be correlated with stratigraphy (table 7). The ranges and averages of P20s and C02 compositions were calculated from the a-value models; the highest grade francolites, approaching fluorapatite compositions, are present in the smaller size fractions. Histograms of a-values plotted according to stratigraphic position show the trends in a-values of francolite between size fractions and stratigraphy (figs. 2, 3). Although samples from the Bone Valley Member show slightly higher a-values as well as a greater range of values (standard deviation) than those from the undifferentiated part of the Peace River Formation, the data from these samples indicate that francolite compositions are not necessarily a reliable stratigraphic tool.
Previous studies of the Florida phosphorites have indicated differences in francolite composition within the deposits. Whippo and Murowchick (1967) noted compositional and crystallographic differences in francolite samples from Polk and Manatee · Counties. The Manatee County samples (southern extension) were more highly substituted and contained 7 percent less P20s and 20 percent more C02 when calculated to an impurity-free basis. The data of Lehr and others (1967) indicated that francolites from Florida deposits have a-values ranging from 9.325 A to 9.339 A.
Studies of the pebble fractions from central Florida deposits (Stow, 1976) indicated that progressive alteration of pebbles, related to color changes (black to brown to white), resulted in decreasing CaO/P20s and lower F!P20s ratios. Williams (1971) correlated the color of concentrates from north Florida with francolite composition by chemical analysis and lattice parameter measurements. In general, dark-colored concentrates
Mineralogy 11
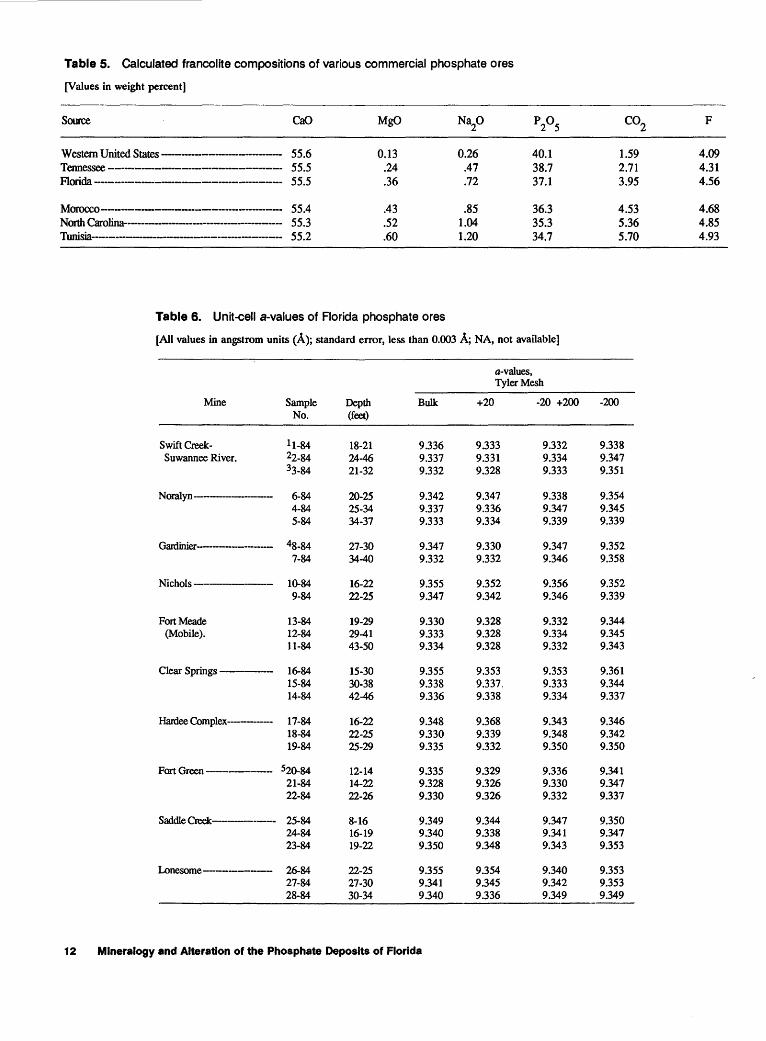
Table 5. Calculated francolite compositions of various commercial phosphate ores
[Values in weight percent]
Source CaO MgO Na20 P205 C0
2 F
Western United States-------------------- 55.6 0.13 0.26 40.1 1.59 4.09 Tennessee------------------------------ 55.5 .24 .47 38.7 2.71 4.31
Florida --------------------------------- 55.5 .36 .72 37.1 3.95 4.56
Morocco---------------------------- 55.4 .43 .85 36.3 4.53 4.68 North Carolina-------------------------------------- 55.3 .52 1.04 35.3 5.36 4.85
Tunisia-------------------------------------- 55.2 .60 1.20 34.7 5.70 4.93
Table 6. Unit-cell a-values of Florida phosphate ores
[All values in angstrom units (A); standard error, less than 0.003 A; NA, not available]
a-values, Tyler Mesh
Mine Sample Depth Bulk +20 -20 +200 -200 No. (feet)
Swift Creek- 11-84 18-21 9.336 9.333 9.332 9.338 Suwannee River. 22-84 24-46 9.337 9.331 9.334 9.347
33-84 21-32 9.332 9.328 9.333 9.351
Noralyn----------- 6-84 20-25 9.342 9.347 9.338 9.354 4-84 25-34 9.337 9.336 9.347 9.345 5-84 34-37 9.333 9.334 9.339 9.339
Gardinier--------- 48-84 27-30 9.347 9.330 9.347 9.352 7-84 34-40 9.332 9.332 9.346 9.358
Nichols---------- 10-84 16-22 9.355 9.352 9.356 9.352 9-84 22-25 9.347 9.342 9.346 9.339
Fort Meade 13-84 19-29 9.330 9.328 9.332 9.344 (Mobile). 12-84 29-41 9.333 9.328 9.334 9.345
11-84 43-50 9.334 9.328 9.332 9.343
Clear Springs------ 16-84 15-30 9.355 9.353 9.353 9.361 15-84 30-38 9.338 9.337. 9.333 9.344 14-84 42-46 9.336 9.338 9.334 9.337
Haidee Complex--------- 17-84 16-22 9.348 9.368 9.343 9.346 18-84 22-25 9.330 9.339 9.348 9.342 19-84 25-29 9.335 9.332 9.350 9.350
Fort Green-------- 520-84 12-14 9.335 9.329 9.336 9.341 21-84 14-22 9.328 9.326 9.330 9.347 22-84 22-26 9.330 9.326 9.332 9.337
Saddle Creek------------ 25-84 8-16 9.349 9.344 9.347 9.350 24-84 16-19 9.340 9.338 9.341 9.347 23-84 19-22 9.350 9.348 9.343 9.353
Lonesome--------- 26-84 22-25 9.355 9.354 9.340 9.353 27-84 27-30 9.341 9.345 9.342 9.353 28-84 30-34 9.340 9.336 9.349 9.349
12 Mineralogy and Alteration of the Phosphate Deposits of Florida

Table 6. Unit-cell a-values of Florida phosphate ores-Continued
a-values, Tyler Mesh
Mine Sample Depth Bulk +20 -20 +200 -200 No. (feet)
Watson--------------- 29-84 10.5-22.5 9.338 9.336 9.335 9.342
Phosphoria------------------- 31-84 18-22 9.342 9.338 9.347 9.355 30-84 22-31 9.345 9.345 9.347 9.352
30A-84 31-33 9.336 9.336 9.337 9.355 Rockland---------- 32-84 15-35 9.340 9.345 9.342 9.347
33-84 35-37 9.335 9.328 9.337 9.345
IIaynsworth---------------- 34-84 30-33 9.340 9.336 9.340 9.356 35-84 33-36 9.345 9.337 9.339 9.357
Lonesome-------- 37-84 16-26 9.346 9.344 9.340 9.345 36-84 26-32 9.345 9.346 9.339 9.348
Hookers Prairie----- 41-84 14-17 9.334 9.332 9.336 9.343 40-84 17-23 9.332 9.333 9.335 9.345 39-84 23-29 9.332 9.328 9.329 9.335 38-84 29-35 9.338 9.331 9.332 9.338
Four Comers-------- 44-84 14-19 9.340 9.332 9.330 9.327 43-84 23-35.5 9.336 9.324 9.332 9.333 42-84 37-43 9.336 9.328 9.335 9.349
Kingsford-------------- 47-84 18-23 9.337 9.335 NA 9.360 46-84 23-30 9.332 9.329 9.328 9.323 45-84 30-42.5 9.334 9.330 9.335 9.329
Noranda-Hopewell---- 48-84 Unknown 9.338 9.337 9.341 9.348
Beker-Wingate6 _____________ 49-84 Concentrate 9.336 NA NA NA 50-84 Pebble 9.331 NA NA
lcombined sample. 2Swift Creek mine. 3suwannee River mine. 4Two samples from both the Bone Valley Member of the Peace River Fonnation and undifferentiated Peace
River Fonnation collected 4 mi apart. 50ne sample 20-84, leached Bone Valley Member, three samples (21-84), Bone Valley Member, three
samples (22-84), undifferentiated Peace River Fonnation collected about 1 mi apart.
contained the most highly substituted francolites. The color of francolite grains appeared to be related to several factors including enclosing lithology, lateral and vertical stratigraphic position, postdepositional history, and possibly grain size. Williams (1971) noted the cyclicity of sedimentation and reworking of parts of the deposits as evidenced by the presence of white (altered) francolite grains in dark-colored restricted marine or basinal sediments.
Weathering, alteration, and enrichment of phosphate deposits have been described and interpreted chemically and mineralogically at sites in Morocco (Lucas and others, 1980), Senegal (Flicoteaux and Lucas, 1984), and Togo (Fiicoteaux and Lucas, 1984). For each deposit, changes in chemical ratios and francolite
crystallographic properties were noted that indicated a progressive decrease in carbonate content in the weathered zones.
McArthur (1980) compared onshore and offshore Moroccan phosphorites and suggested that postdepositional weathering and interaction with ground water removes sodium, strontium, co3, and so4 from the structure of francolite. McArthur (1978) had earlier proposed the "constant composition hypothesis," according to which all primary francolites formed under similar conditions and therefore had similar compositions. McClellan (1980), working with a large sample base from deposits around the world, noted the variability of apatites in individual deposits with geologic time and proposed that through the combined effects of
Mineralogy 13
en w ~ 40 ~ <( en ...J 30 ~ 0 1-
~ 20 1-z w ~ 10 w 0..
STANDARD DEVIATION 0.008
9.33 9.34 9.35 9.36 9.37
en w ~ 40 ~ <( en ....130 ~ ~ ~ 20 1-z w ~ 10 w 0..
0....___ __ _
A-VALUES, IN ANGSTROMS
BULK SAMPLES
STANDARD DEVIATION 0.007
9~ ~33 9~ 9~ 9~ A-VALUES, IN ANGSTROMS
-20 TO 200 MESH SAMPLES
9.37
en w ~40 ~ <( en ....130 ~ ~ ~ 20 1-z w ~ 10 ~
50
en w ~40 ~ <( en ....130 ~ 0 1-
~ 20 1-z w ~ 10 w 0..
9.33
9.33
STANDARD DEVIATION 0.010
9.34 9.35 9.36 9.37 A-VALUES, IN ANGSTROMS
+20 MESH SAMPLES
STANDARD DEVIATION 0.008
9.34 9.35 9.36 9.37 A-VALUES, IN ANGSTROMS
-200 MESH SAMPLES
Figure 2. Histograms showing variations in a-values of francolite in 22 bulk and screened samples from the Bone Valley Member of the Peace River Formation, Florida.
weathering, metamorphism, and time, francolites progressively alter from highly substituted varieties to essentially a fluorapatite composition. There are presently no known examples of reversal of this process, and thermodynamic considerations preclude this possibility (Chien and Black, 1976).
Variations in the carbonate content of francolites have also been attributed to the depositional environment. Gulbrandsen (1970) postulated that the general eastward increase in the X-ray-determined carbonate content of francolites in the Phosphoria Formation indicated a general warming of the seas as the water shallowed. Cook (1970) observed similar variations across the Phosphoria Formation and concluded that variations in temperature, pH, salinity, and depth could have caused the variations, although the complexity of dissolved inorganic carbon equilibria prevented a definitive interpretation. McArthur (1985) correlated the published C02 data with data on depth of burial for the Phosphoria and concluded that the dia-
genetic and catagenetic alteration of the francolites was related to depth of burial, presumably as a response to increased temperature and pressure.
The a-values of francolite from less altered deposits around the world generally are less than 9.330 A (table 8); the a-value of a primary francolite, however, is not known. These deposits are considered to be less altered because they show slight or no evidence of weathering. Both the Miocene phosphorites of North Carolina (United States) and the Eocene Togo Bed 2/3 deposits of Africa (Johnson, 1987) are marine phosphorites that are now in a freshwater environment. The sample from the Congo River delta, west -central Africa, is Miocene in age and may have been subjected to freshwater in its history. The Tunisian samples are associated with calcareous marls and gypsum beds. Samples from the Miami Terrace and the West Florida Shelf are dredge samples thought to be of Miocene age. Most of these less altered francolites occur with calcite in the samples or are associated with calcite-bearing beds.
14 Mineralogy and Alteration of the Phosphate Deposits of Florida
(I) w ~ 40 ~ < (I)
-'30 ~ ~ ~ 20 .... z w ~ 10 ~
0'-----
STANDARD DEVIATION 0.005
9~ ~~ 9~ 9~ 9~
(I) w ~ 40 ~
~ -'30 ~ ~ ~ 20 .... z w ~ 10 w n..
A-VALUES, IN ANGSTROMS
BULK SAMPLES
STANDARD DEVIATION 0.006
9.37
9.~ 9.34 9.35 9.36 9.37 A-VALUES, IN ANGSTROMS
-20 TO 200 MESH SAMPLES
(I) w ~ 40 ~ < (I)
-'30 ~ ~ ~ 20 .... z w ~ 10 w n..
(I) w
50
~ 40 ~ < (I)
-'30 ~ 0 .... ~ 20 .... z w ~ 10 w n..
9.~
9.~
STANDARD DEVIATION 0.007
9.34 9.35 9.36 9.37 A-VALUES, IN ANGSTROMS
+20 MESH SAMPLES
STANDARD DEVIATION 0.008
9.34 9.35 9.36 9.37 A-VALUES, IN ANGSTROMS
-200 MESH SAMPLES
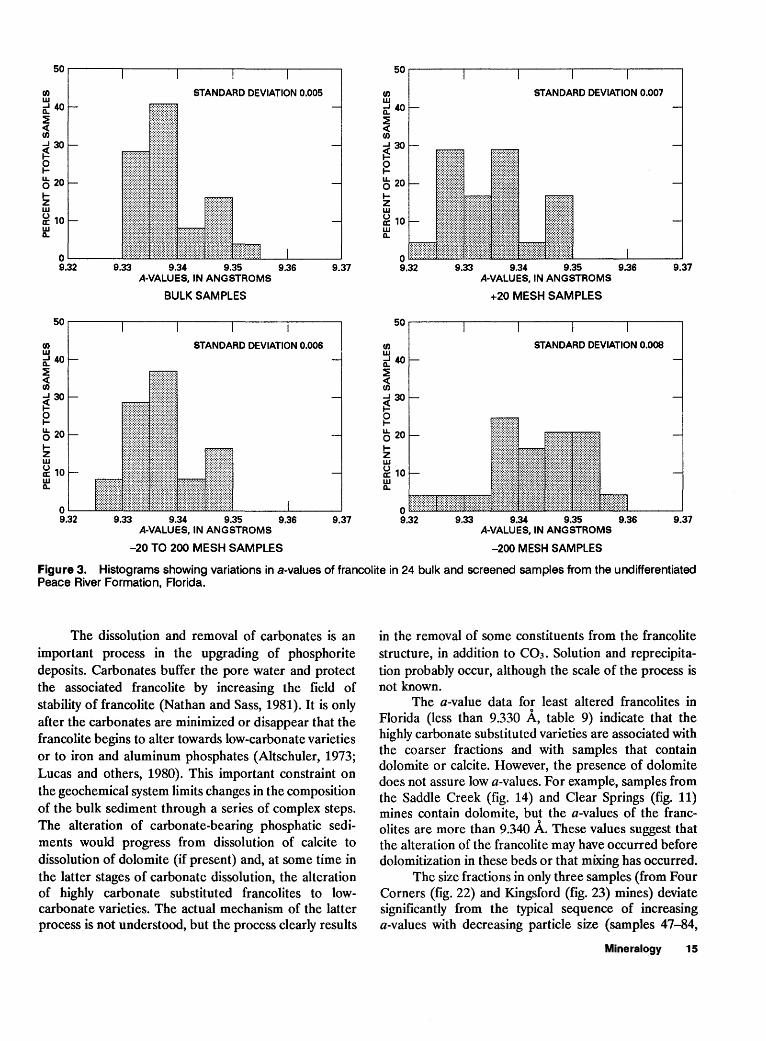
Figure 3. Histograms showing variations in a-values of francolite in 24 bulk and screened samples from the undifferentiated Peace River Formation, Florida.
The dissolution and removal of carbonates is an important process in the upgrading of phosphorite deposits. Carbonates buffer the pore water and protect the associated francolite by increasing the field of stability of francolite (Nathan and Sass, 1981 ). It is only after the carbonates are minimized or disappear that the francolite begins to alter towards low-carbonate varieties or to iron and aluminum phosphates (Altschuler, 1973; Lucas and others, 1980). This important constraint on the geochemical system limits changes in the composition of the bulk sediment through a series of complex steps. The alteration of carbonate-bearing phosphatic sediments would progress from dissolution of calcite to dissolution of dolomite (if present) and, at some time in the latter stages of carbonate dissolution, the alteration of highly carbonate substituted francolites to lowcarbonate varieties. The actual mechanism of the latter process is not understood, but the process clearly results
in the removal of some constituents from the francolite structure, in addition to C03. Solution and reprecipitation probably occur, although the scale of the process is not known.
The a-value data for least altered francolites in Florida (less than 9.330 A, table 9) indicate that the highly carbonate substituted varieties are associated with the coarser fractions and with samples that contain dolomite or calcite. However, the presence of dolomite does not assure low a-values. For example, samples from the Saddle Creek (fig. 14) and Clear Springs (fig. 11) mines contain dolomite, but the a-values of the francolites are more than 9.340 A. These values suggest that the alteration of the francolite may have occurred before dolomitization in these beds or that mixing has occurred.
The size fractions in only three samples (from Four Corners (fig. 22) and Kingsford (fig. 23) mines) deviate significantly from the typical sequence of increasing a-values with decreasing particle size (samples 47-84,
Mineralogy 15

Table 7. Variations of francolite a-values and composition with stratigraphy, Florida phosphate ores
[X-ray P205 and C02 values, in weight percent, calculated by procedures from McOellan (1980)]
Sample group (Tyler mesh)
Range a-values
(A±o.003)
Mean a-value
(A±0.003)
Range X-ray C02
Average X-ray C02
Bone Valley Member of the Peace River Formation (22 samples)
Bulk ----------------------------- 9.328-9.355 +20 ---------------------------- 9.328-9.368 -20 to +200.--------------------------------------- 9.330-9.356 -200--------------------------------- 9.327-9.361
9.341 9.340 9.341 9.349
35.86-39.14 35.86-39.31 36.12-36.94 35.73-40.08
37.65 37.50 37.65 38.84
4.93-1.87 4.93-0.14 4.72-1.74 5.03-1.04
3.53 3.64 3.53 2.60
Undifferentiated Peace River Formation (24 samples)
Bulk ------------------------------ 9.330-9.350 + 20 ---------------------------------- 9.324-9.348 -20 to +2oo.------------------~-------------------- 9.328-9.346 -200----------------------------------- 9.323-9.357
9.338 9.334 9.337 9.343
Table 8. Examples of a-values of less-altered francolite from various localities throughout the world
(Values are in angstrom units (A)]
Sample No. of Range Average locality samples (A±0.0001) (A...+0.0001)
Congo, Africa (offshore)---- 5 9.320-9.327 9.324 Togo, Africa (Bed 2!3)-------------- 5 9.325-9.333 9.329 Tunisia------------------------- 5 9.320-9.331 9.327 North Carolina---------------------- 18 9.318-9.332 9.323 Miami Terrace ------------- 1 None 9.326 West Florida Shelf----------------- 1 None 9.319
46-84, 45-84). At the Four Corners mine (fig. 22), the beds below sample set 44-84 show a normal progression to higher a-values with decreasing particle size. In two of these three samples (44-84 and 47-84) as well as in sample 13-84 (fig. 10), aluminophosphates occur with less altered francolites in the pebble fraction. This unusual association may result from mixing of materials from different sources or may indicate that francolites do not have to progress to low-carbonate-substituted varieties before conversion to aluminophosphates can occur.
The variability in francolite composition may result from many factors. Original composition, presence of carbonates, mixing of altered francolite with unaltered francolite, stratigraphic position or depth, degree and depth of weathering, depth and character of overburden, size of phosphate particles, possible sheltering effects of impermeable clay beds or indurated dolomite layers,
26.12-39.00 35.35-38.69 35.86-38.84 35.22-40.12
37.22 36.66 37.08 37.94
4.72-2.48 5.33-2.72 4.93-2.60 5.43-1.61
3.87 4.30 3.98 3.31
Table 9. FrancoliteDsamples from Florida with a-values less than 9.330 (±0.003 A)
Size fraction Carbonates
Sample (fyler All size Mine No. mesh) a-value fractions
Suwannee River--------- 3-84 +20 9.328 Dolomite, calcite.
Fort Meade------------------- 13-84 +20 9.328 Not detected. 12-84 +20 9.328 Dolomite. 11-84 +20 9.328 Dolomite.
Fort Green ------------- 20-84 +20 9.329 Not detected. 21-84 +20 9.326 Not detected. 22-84 +20 9.326 Dolomite.
Rockland--------------- 33-84 +20 9.328 Dolomite.
Hookers Prairie--------- 39-84 +20 9.328 Dolomite. 39-84 -20-200 9.329 Dolomite.
Four Comers----------- 44-84 -200 9.327 Dolomite. 43-84 +20 9.324 Dolomite. 42-84 +20 9.328 Dolomite.
Kingsford----------------- 46-84 +20 9.329 Dolomite. 46-84 -20-200 9.328 Dolomite. 46-84 -200 9.323 Dolomite. 45-84 -200 9.329 Dolomite.
hydrologic controls, and paleotopography all may have contributed to producing the francolite compositions of today.
The general increase in a-values from coarser to finer size fractions may be due to preferential alteration of the fine sizes because of their greater relative surface area. Mixing of altered and prim~ry or less altered francolites in various particle sizes may have occurred
16 Mineralogy and Alteration of the Phosphate Deposits of Florida
during subaerial or subaqueous exposure and erosion of the phosphorites. The fine-grained altered francolite could have been preferentially moved offshore to be mixed with primary or less altered francolites, and the resultant a-values of such samples would then vary in proportion to the composition of the constituents.
On the basis of francolite compositions, every section examined in this study shows some degree of alteration, even in the lowermost beds of the downdip facies in the southern extension of the central district. The precise stratigraphic position of the samples from the Wingate Creek mine cannot be ascertained because the section is mined by dredge; however, the samples show enough variation to indicate that they were from a zone of detectable alteration. The lowermost beds of the Kingsford mine (fig. 23) appear to be the least altered of the sections studied.
In deeper sections, downdip to the south, and in the north where the phosphatic Miocene sediments of Florida are less altered, the francolites change in composition to more highly substituted varieties with decreasing P20s content and increasing impurity content. In general, the finer size fractions contain francolite with the lowest carbonate substitution, lowest impurity content, and greatest P20s concentration. Based on an average of 12.5 percent P20s in washer tailings (Bromwell, 1982) and an average a-value of 9.346 A for combined beds of the Bone Valley Member and the undifferentiated part of the Peace River Formation, the francolite content of an aluminophosphate-free sample slime would be about 33 weight percent. Because most slime samples contain appreciable amounts of aluminophosphates, this is a maximum value. Deviations from the typical occurrence of most altered francOlite at the top of the sections and in the finer size fractions indicate the complex nature of the formation of the deposits.
Clays
The clay minerals in the phosphate deposits of Florida are a mixture of common (smectite, illite, and kaolinite) and less common (palygorskite and sepiolite) minerals. The general sequence of clay minerals in economic zones is, from top to base, kaolinite to smectite to smectite plus palygorskite (Altschuler and others, 1964). Smectite is the most abundant clay mineral in the Florida Miocene sediments (McClellan, 1962; Weaver and Beck, 1977; Reik, 1982). The smectite may be original detrital material (Weaver and Beck, 1977), the result of diagenesis, or a mixture of the two. The kaolinite is thought to be a mixture of detrital material (Weaver and Beck, 1977) and material derived from the alteration of smectite (Altschuler and others, 1963). The illite in these sediments is considered to be detrital and is only a minor phase.
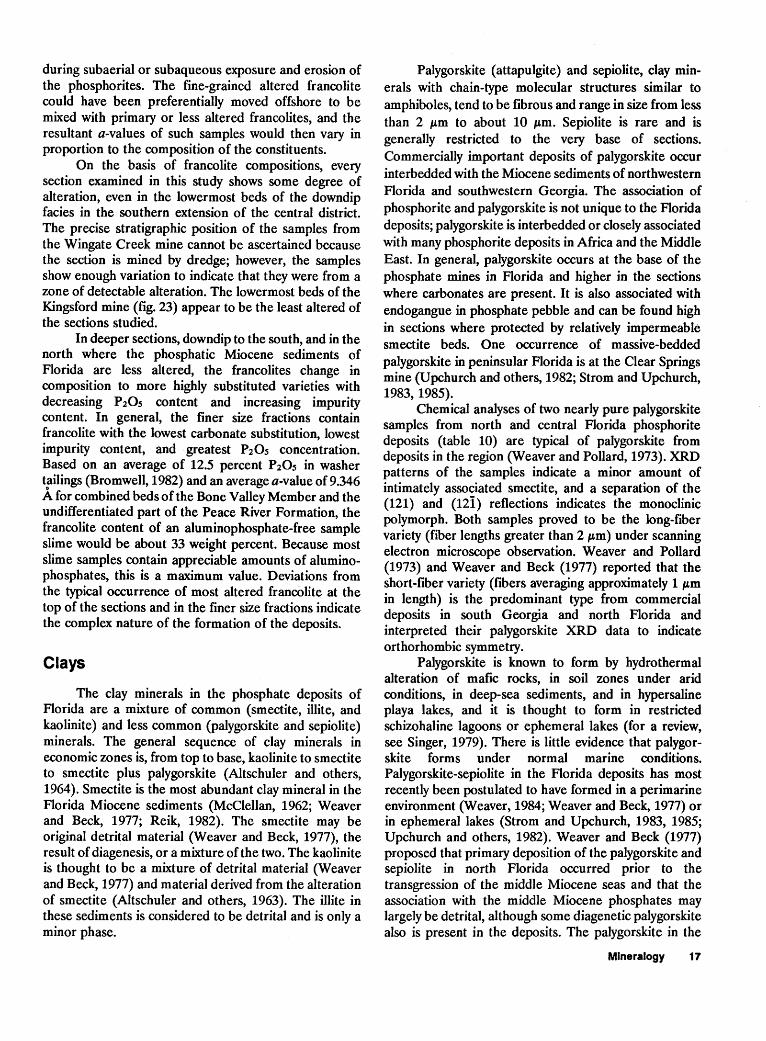
Palygorskite ( attapulgite) and sepiolite, clay minerals with chain-type molecular structures similar to amphiboles, tend to be fibrous and range in size from less than 2 p.m to about 10 p.m. Sepiolite is rare and is generally restricted to the very base of sections. Commercially important deposits of palygorskite occur interbedded with the Miocene sediments of northwestern Florida and southwestern Georgia. The association of phosphorite and palygorskite is not unique to the Florida deposits; palygorskite is interbedded or closely associated with many phosphorite deposits in Africa and the Middle East. In general, palygorskite occurs at the base of the phosphate mines in Florida and higher in the sections where carbonates are present. It is also associated with endogangue in phosphate pebble and can be found high in sections where protected by relatively impermeable smectite beds. One occurrence of massive-bedded palygorskite in peninsular Florida is at the Clear Springs mine (Upchurch and others, 1982; Strom and Upchurch, 1983, 1985).
Chemical analyses of two nearly pure palygorskite samples from north and central Florida phosphorite deposits (table 10) are typical of palygorskite from deposits in the region (Weaver and Pollard, 1973). XRD patterns of the samples indicate a minor amount of intimately associated smectite, and a separation of the (121) and (12i) reflections indicates the monoclinic polymorph. Both samples proved to be the long-fiber variety (fiber lengths greater than 2 p.m) under scanning electron microscope observation. Weaver and Pollard (1973) and Weaver and Beck (1977) reported that the short-fiber variety (fibers averaging approximately 1 p.m in length) is the predominant type from commercial deposits in south Georgia and north Florida and interpreted their palygorskite XRD data to indicate orthorhombic symmetry.
Palygorskite is known to form by hydrothermal alteration of mafic rocks, in soil zones under arid conditions, in deep-sea sediments, and in hypersaline playa lakes, and it is thought to form in restricted schizohaline lagoons or ephemeral lakes (for a review, see Singer, 1979). There is little evidence that palygorskite forms under normal marine conditions. Palygorskite-sepiolite in the Florida deposits has most recently been postulated to have formed in a perimarine environment (Weaver, 1984; Weaver and Beck, 1977) or in ephemeral lakes (Strom and Upchurch, 1983, 1985; Upchurch and others, 1982). Weaver and Beck (1977) proposed that primary deposition of the palygorskite and sepiolite in north Florida occurred prior to the transgression of the middle Miocene seas and that the association with the middle Miocene phosphates may largely be detrital, although some diagenetic palygorskite also is present in the deposits. The palygorskite in the
Mineralogy 17
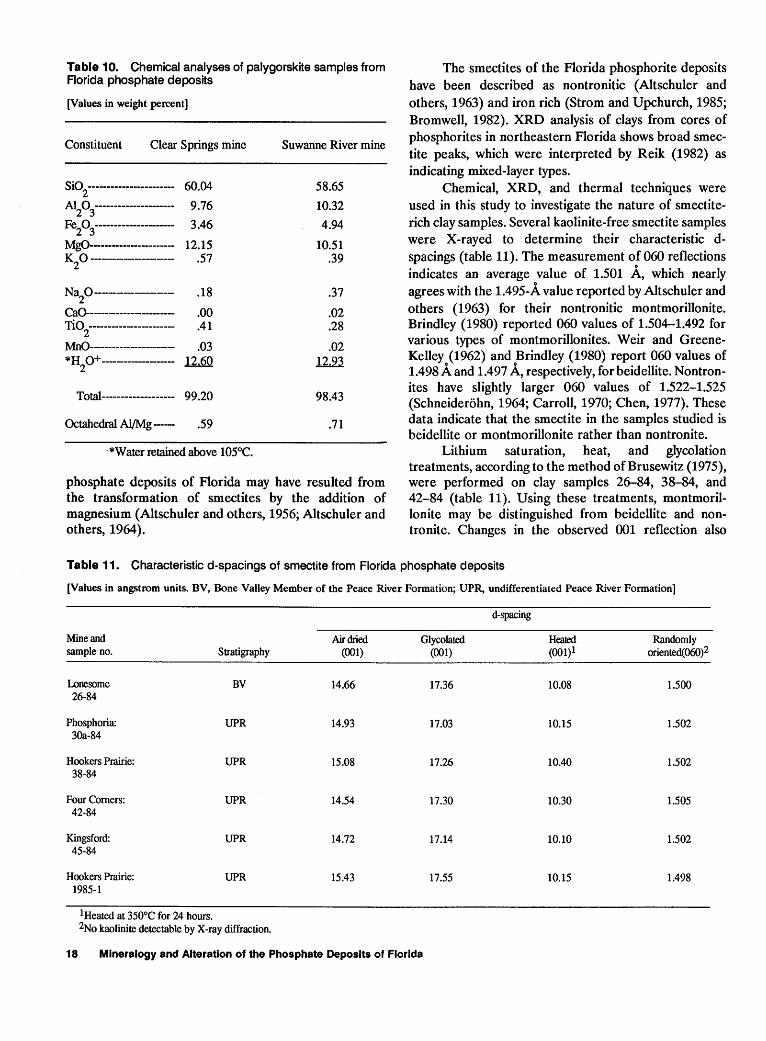
Table 10. Chemical analyses of palygorskite samples from Florida phosphate deposits
[Values in weight percent)
Constituent Clear Springs mine
SiO -----------------------2
AI 0 ---------------------2 3
Fe 0 ---------------------2 3 MgO--------------------K 0 --------------------
2
Na 0-------------------2
CaO-------------------'IiO ----------------------
2 MnO------------------*H o+ -------------------
2
60.04
9.76
3.46
12.15 .57
.18
.00
.41
.03 .lMQ
Total------------------- 99.20
Octahedral Al/Mg ----- .59
·*Water retained above l05°C.
Suwanne River mine
58.65
10.32
4.94
10.51 .39
.37
.02
.28
.02 12.23.
98.43
.71
phosphate deposits of Florida may have resulted from the transformation of smectites by the addition of magnesium (Altschuler and others, 1956; Altschuler and others, 1964).
The smectites of the Florida phosphorite deposits have been described as nontronitic (Altschuler and others, 1963) and iron rich (Strom and Upchurch, 1985; Bromwell, 1982). XRD analysis of clays from cores of phosphorites in northeastern Florida shows broad smectite peaks, which were interpreted by Reik (1982) as indicating mixed-layer types.
Chemical, XRD, and thermal techniques were used in this study to investigate the nature of smectiterich clay samples. Several kaolinite-free smectite samples were X-rayed to determine their characteristic dspacings (table 11). The measurement of 060 reflections indicates an average value of 1.501 A, which nearly agrees with the 1.495-A value reported by Altschuler and others (1963) for their nontronitic montmorillonite. Brindley (1980) reported 060 values of 1.504-1.492 for various types of montmorillonites. Weir and GreeneKelley (1962) and Brindley (1980) report 060 values of 1.498 A and 1.497 A, respectively, for beidellite. Nontronites have slightly larger 060 values of 1.522-1.525 (Schneiderohn, 1964; Carroll, 1970; Chen, 1977). These data indicate that the smectite in the samples studied is beidellite or montmorillonite rather than nontronite.
Lithium saturation, heat, and glycolation treatments, according to the method ofBrusewitz (1975), were performed on clay samples 26-84, 38-84, and 42-84 (table 11 ). Using these treatments, montmorillonite may be distinguished from beidellite and nontronite. Changes in the observed 001 reflection also
Table 11. Characteristic d-spacings of smectite from Florida phosphate deposits
[Values in angstrom units. BV, Bone Valley Member of the Peace River Formation; UPR, undifferentiated Peace River Formation]
d-spacing
Mine and Air dried Glycolated Heated Randomly sample no. Stratigraphy (001) (001) (001)1 oriented(060)2
Lonesome BV 14.66 17.36 10.08 1.500 26-84
Phosphoria: UPR 14.93 17.03 10.15 1.502 30a-84
Hookers Prairie: UPR 15.08 17.26 10.40 1.502 38-84
Four Comers: UPR 14.54 17.30 10.30 1.505 42-84
Kingsford: UPR 14.72 17.14 10.10 1.502 45-84
Hookers Prairie: UPR 15.43 17.55 10.15 1.498 1985-1
1 Heated at 350°C for 24 hours. 2No kaolinite detectable by X-ray diffraction.
18 Mineralogy and Alteration of the Phosphate Deposits of Florida
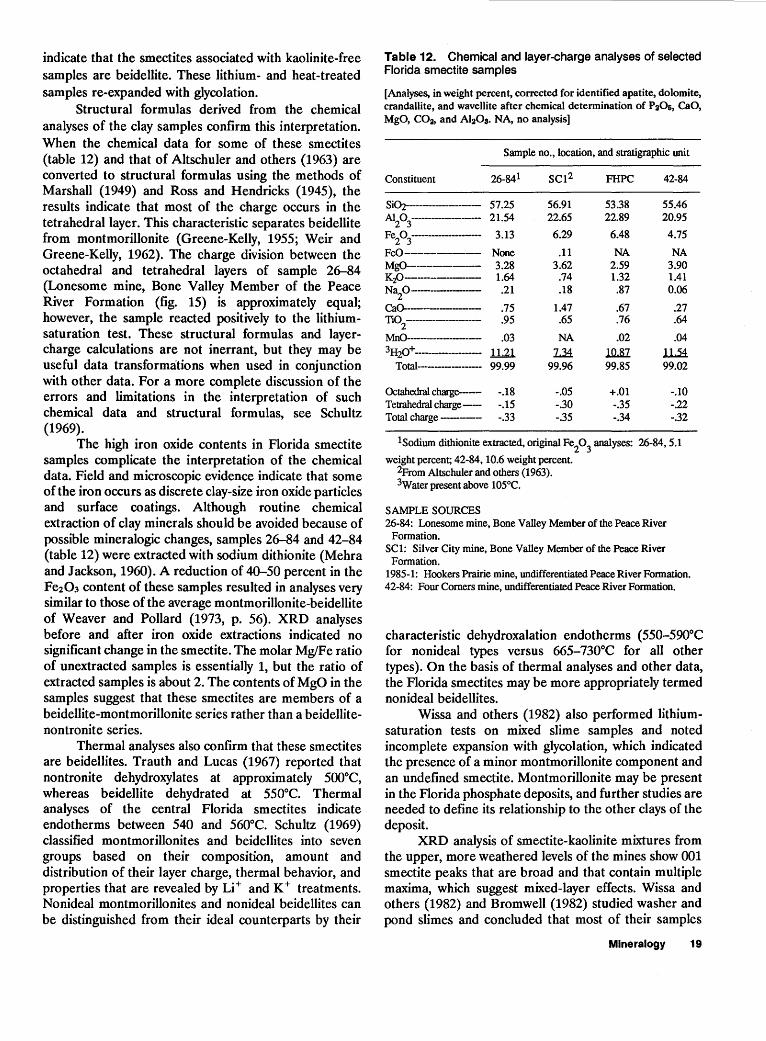
indicate that the smectites associated with kaolinite-free samples are beidellite. These lithium- and heat-treated samples re-expanded with glycolation.
Structural formulas derived from the chemical analyses of the clay samples confirm this interpretation. When the chemical data for some of these smectites (table 12) and that of Altschuler and others (1963) are converted to structural formulas using the methods of Marshall (1949) and Ross and Hendricks (1945), the results indicate that most of the charge occurs in the tetrahedral layer. This characteristic separates beidellite from montmorillonite (Greene-Kelly, 1955; Weir and Greene-Kelly, 1962). The charge division between the octahedral and tetrahedral layers of sample 26-84 (Lonesome mine, Bone Valley Member of the Peace River Formation (fig. 15) is approximately equal; however, the sample reacted positively to the lithiumsaturation test. These structural formulas and layercharge calculations are not inerrant, but they may be useful data transformations when used in conjunction with other data. For a more complete discussion of the errors and limitations in the interpretation of such chemical data and structural formulas, see Schultz (1969).
The high iron oxide contents in Florida smectite samples complicate the interpretation of the chemical data. Field and microscopic evidence indicate that some of the iron occurs as discrete clay-size iron oxide particles and surface coatings. Although routine chemical extraction of clay minerals should be avoided because of possible mineralogic changes, samples 26-84 and 42-84 (table 12) were extracted with sodium dithionite (Mehra and Jackson, 1960). A reduction of 40-50 percent in the Fe2 03 content of these samples resulted in analyses very similar to those of the average montmorillonite-beidellite of Weaver and Pollard (1973, p. 56). XRD analyses before and after iron oxide extractions indicated no significant change in the smectite. The molar Mg!Fe ratio of unextracted samples is essentially 1, but the ratio of extracted samples is about 2. The contents of MgO in the samples suggest that these smectites are members of a beidellite-montmorillonite series rather than a beidellitenontronite series.
Thermal analyses also confirm that these smectites are beidellites. Trauth and Lucas (1967) reported that nontronite dehydroxylates at approximately 500°C, whereas beidellite dehydrated at 550°C. Thermal analyses of the central Florida smectites indicate endotherms between 540 and 560°C. Schultz (1969) classified montmorillonites and beidellites into seven groups based on their composition, amount and distribution of their layer charge, thermal behavior, and properties that are revealed by Li + and K + treatments. Nonideal montmorillonites and nonideal beidellites can be distinguished from their ideal counterparts by their
Table 12. Chemical and layer-charge analyses of selected Florida smectite samples
[Analyses, in weight percent, corrected for identified apatite, dolomite, crandallite, and wavellite after chemical determination of P20s, CaO, MgO, C02, and Al20s. NA, no analysis]
Sample no., location, and stratigraphic unit
Constituent 26-841 SC12 FHPC 42-84
Si02----------------- 57.25 56.91 53.38 55.46 AJ"2 0 3------------------- 21.54 22.65 22.89 20.95
Fe2 0 3-------------------- 3.13 6.29 6.48 4.75
FeO------------ None .11 NA NA MgO------------ 3.28 3.62 2.59 3.90 KzO----------- 1.64 .74 1.32 1.41 Na
20--------- .21 .18 .87 0.06
CaO.------------- .75 1.47 .67 .27 TiO 2------------------- .95 .65 .76 .64
MnO.------------ .03 NA .02 .04
3H2o+ -------------------- .l.l.2.l 1.3! lQ.81 lL5! Total------------------- 99.99 99.96 99.85 99.02
Octahedral charge----- -.18 -.05 +.01 -.10 Tetrahedral charge-- -.15 -.30 -.35 -.22 Total charge----- -.33 -.35 -.34 -.32
lsodium dithionite extracted, original Fe2o
3 analyses: 26-84, 5.1
weight percent; 42-84, 10.6 weight percent. 2From Altschuler and others (1963). 3water present above l05°C.
SAMPLE SOURCES 26-84: Lonesome mine, Bone Valley Member of the Peace River
Formation. SC1: Silver City mine, Bone Valley Member of the Peace River
Formation. 1985-1: Hookers Prairie mine, undifferentiated Peace River Formation. 42-84: Four Corners mine, undifferentiated Peace River Formation.
characteristic dehydroxalation endotherms (550-590°C for nonideal types versus 665-730°C for all other types). On the basis of thermal analyses and other data, the Florida smectites may be more appropriately termed nonideal beidellites.
Wissa and others (1982) also performed lithiumsaturation tests on mixed slime samples and noted incomplete expansion with glycolation, which indicated the presence of a minor montmorillonite component and an undefined smectite. Montmorillonite may be present in the Florida phosphate deposits, and further studies are needed to define its relationship to the other clays of the deposit.
XRD analysis of smectite-kaolinite mixtures from the upper, more weathered levels of the mines show 001 smectite peaks that are broad and that contain multiple maxima, which suggest mixed-layer effects. Wissa and others (1982) and Bromwell (1982) studied washer and pond slimes and concluded that most of their samples
Mineralogy 19
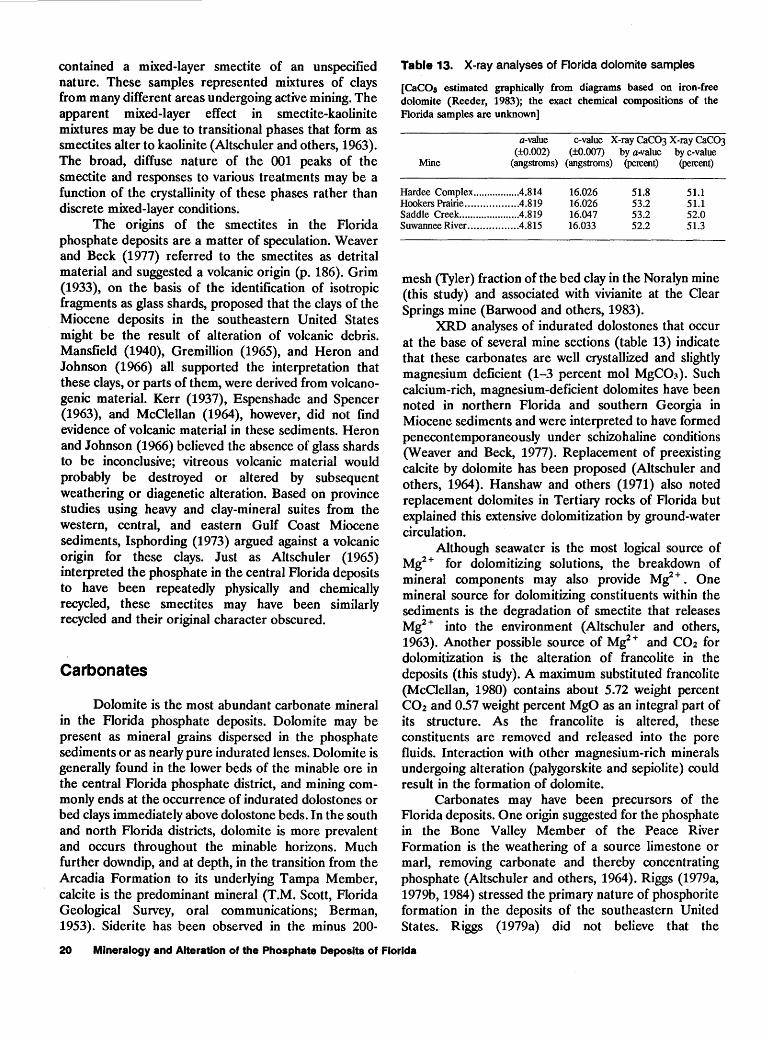
contained a mixed-layer smectite of an unspecified nature. These samples represented mixtures of clays from many different areas undergoing active mining. The apparent mixed-layer effect in smectite-kaolinite mixtures may be due to transitional phases that form as smectites alter to kaolinite (Altschuler and others, 1963). The broad, diffuse nature of the 001 peaks of the smectite and responses to various treatments may be a function of the crystallinity of these phases rather than discrete mixed-layer conditions.
The origins of the smectites in the Florida phosphate deposits are a matter of speculation. Weaver and Beck (1977) referred to the smectites as detrital material and suggested a volcanic origin (p. 186). Grim (1933), on the basis of the identification of isotropic fragments as glass shards, proposed that the clays of the Miocene deposits in the southeastern United States might be the result of alteration of volcanic debris. Mansfield (1940), Gremillion (1965), and Heron and Johnson (1966) all supported the interpretation that these clays, or parts of them, were derived from volcanogenic material. Kerr (1937), Espenshade and Spencer (1963), and McClellan (1964), however, did not find evidence of volcanic material in these sediments. Heron and Johnson (1966) believed the absence of glass shards to be inconclusive; vitreous volcanic material would probably be destroyed or altered by subsequent weathering or diagenetic alteration. Based on province studies using heavy and clay-mineral suites from the western, central, and eastern Gulf Coast Miocene sediments, Isphording (1973) argued against a volcanic origin for these clays. Just as Altschuler (1965) interpreted the phosphate in the central Florida deposits to have been repeatedly physically and chemically recycled, these smectites may have been similarly recycled and their original character obscured.
Carbonates
Dolomite is the most abundant carbonate mineral in the Florida phosphate deposits. Dolomite may be present as mineral grains dispersed in the phosphate sediments or as nearly pure indurated lenses. Dolomite is generally found in the lower beds of the minable ore in the central Florida phosphate district, and mining commonly ends at the occurrence of indurated dolostones or bed clays immediately above dolostone beds. In the south and north Florida districts, dolomite is more prevalent and occurs throughout the minable horizons. Much further downdip, and at depth, in the transition from the Arcadia Formation to its underlying Tampa Member, calcite is the predominant mineral (T.M. Scott, Florida Geological Survey, oral communications; Berman, 1953). Siderite has been observed in the minus 200-
Table 13. X-ray analyses of Florida dolomite samples
[CaCOs estimated graphically from diagrams based on iron-free dolomite (Reeder, 1983); the exact chemical compositions of the Florida samples are unknown]
a-value c-value X-ray CaC03 X-ray CaC03 (±0.002) (±0.007) by a-value by c-value
Mine (angstroms) (angstroms) (percent) (percent)
Hardee Complex ................ .4.814 Hookers Prairie ................. .4.819 Saddle Creek ..................... .4.819 Suwannee River ................ .4.815
16.026 16.026 16.047 16.033
51.8 53.2 53.2 52.2
51.1 51.1 52.0 51.3
mesh (Tyler) fraction of the bed clay in the Noralyn mine (this study) and associated with vivianite at the Clear Springs mine (Barwood and others, 1983).
XRD analyses of indurated dolostones that occur at the base of several mine sections (table 13) indicate that these carbonates are well crystallized and slightly magnesium deficient (1-3 percent mol MgC03). Such calcium-rich, magnesium-deficient dolomites have been noted in northern Florida and southern Georgia in Miocene sediments and were interpreted to have formed penecontemporaneously under schizohaline conditions (Weaver and Beck, 1977). Replacement of preexisting calcite by dolomite has been proposed (Altschuler and others, 1964). Hanshaw and others (1971) also noted replacement dolomites in Tertiary rocks of Florida but explained this extensive dolomitization by ground-water circulation.
Although seawater is the most logical source of Mg2 + for dolomitizing solutions, the breakdown of mineral components may also provide Mi + • One mineral source for dolomitizing constituents within the sediments is the degradation of smectite that releases Mg2
+ into the environment (Altschuler and others, 1963). Another possible source of Mg2
+ and C02 for dolomitization is the alteration of francolite in the deposits (this study). A maximum substituted francolite (McClellan, 1980) contains about 5.72 weight percent C02 and 0.57 weight percent MgO as an integral part of its structure. As the francolite is altered, these constituents are removed and released into the pore fluids. Interaction with other magnesium-rich minerals undergoing alteration (palygorskite and sepiolite) could result in the formation of dolomite.
Carbonates may have been precursors of the Florida deposits. One origin suggested for the phosphate in the Bone Valley Member of the Peace River Formation is the weathering of a source limestone or marl, removing carbonate and thereby concentrating phosphate (Altschuler and others, 1964). Riggs (1979a, 1979b, 1984) stressed the primary nature of phosphorite formation in the deposits of the southeastern United States. Riggs (1979a) did not believe that the
20 Mineralogy and Alteration of the Phosphate Deposits of Florida
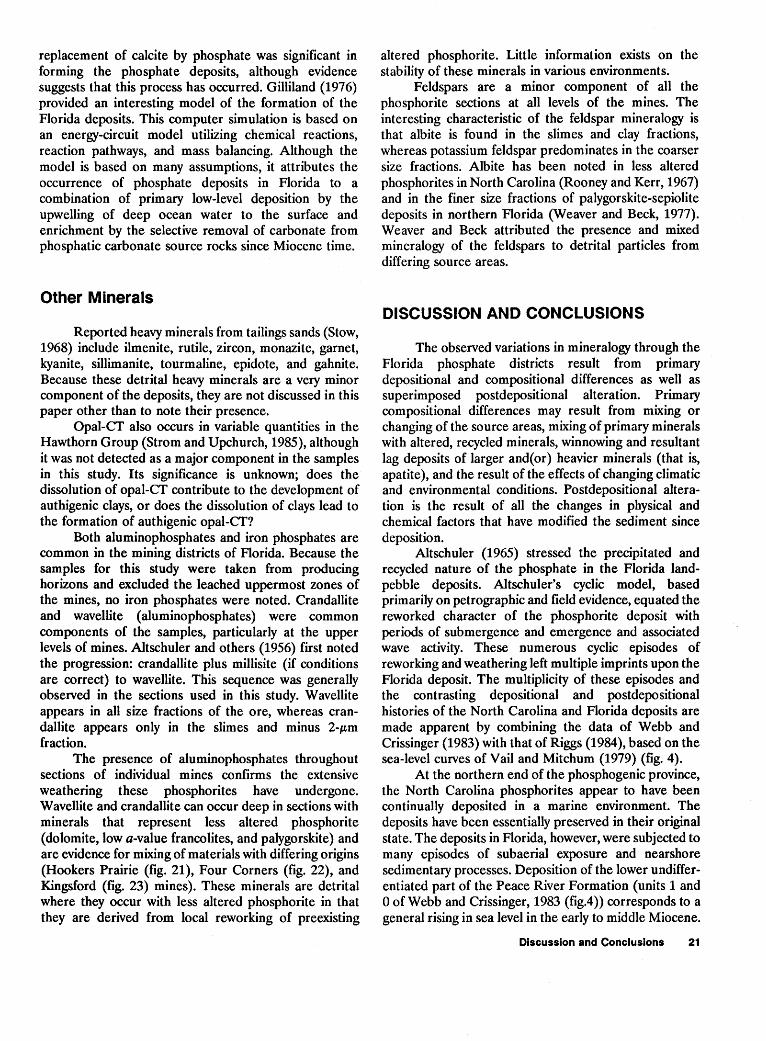
replacement of calcite by phosphate was significant in forming the phosphate deposits, although evidence suggests that this process has occurred. Gilliland (1976) provided an interesting model of the formation of the Florida deposits. This computer simulation is based on an energy-circuit model utilizing chemical reactions, reaction pathways, and mass balancing. Although the model is based on many assumptions, it attributes the occurrence of phosphate deposits in Florida to a combination of primary low-level deposition by the upwelling of deep ocean water to the surface and enrichment by the selective removal of carbonate from phosphatic carbonate source rocks since Miocene time.
Other Minerals
Reported heavy minerals from tailings sands (Stow, 1968) include ilmenite, rutile, zircon, monazite, garnet, kyanite, sillimanite, tourmaline, epidote, and gahnite. Because these detrital heavy minerals are a very minor component of the deposits, they are not discussed in this paper other than to note their presence.
Opal-CT also occurs in variable quantities in the Hawthorn Group (Strom and Upchurch, 1985), although it was not detected as a major component in the samples in this study. Its significance is unknown; does the dissolution of opal-CT contribute to the development of authigenic clays, or does the dissolution of clays lead to the formation of authigenic opal-CT?
Both aluminophosphates and iron phosphates are common in the mining districts of Florida. Because the samples for this study were taken from producing horizons and excluded the leached uppermost zones of the mines, no iron phosphates were noted. Crandallite and wavellite ( aluminophosphates) were common components of the samples, particularly at the upper levels of mines. Altschuler and others (1956) first noted the progression: crandallite plus millisite (if conditions are correct) to wavellite. This sequence was generally observed in the sections used in this study. Wavellite appears in all size fractions of the ore, whereas crandallite appears only in the slimes and minus 2-~tm fraction.
The presence of aluminophosphates throughout sections of individual mines confirms the extensive weathering these phosphorites have undergone. Wavellite and crandallite can occur deep in sections with minerals that represent less altered phosphorite (dolomite, low a-value francolites, and palygorskite) and are evidence for mixing of materials with differing origins (Hookers Prairie (fig. 21 ), Four Corners (fig. 22), and Kingsford (fig. 23) mines). These minerals are detrital where they occur with less altered phosphorite in that they are derived from local reworking of preexisting
altered phosphorite. Little information exists on the stability of these minerals in various environments.
Feldspars are a minor component of all the phosphorite sections at all levels of the mines. The interesting characteristic of the feldspar mineralogy is that albite is found in the slimes and clay fractions, whereas potassium feldspar predominates in the coarser size fractions. Albite has been noted in less altered phosphorites in North Carolina (Rooney and Kerr, 1967) and in the finer size fractions of palygorskite-sepiolite deposits in northern Florida (Weaver and Beck, 1977). Weaver and Beck attributed the presence and mixed mineralogy of the feldspars to detrital particles from differing source areas.
DISCUSSION AND CONCLUSIONS
The observed variations in mineralogy through the Florida phosphate districts result from primary depositional and compositional differences as well as superimposed postdepositional alteration. Primary compositional differences may result from mixing or changing of the source areas, mixing of primary minerals with altered, recycled minerals, winnowing and resultant lag deposits of larger and( or) heavier minerals (that is, apatite), and the result of the effects of changing climatic and environmental conditions. Postdepositional alteration is the result of all the changes in physical and chemical factors that have modified the sediment since deposition.
Altschuler (1965) stressed the precipitated and recycled nature of the phosphate in the Florida landpebble deposits. Altschuler's cyclic model, based primarily on petrographic and field evidence, equated the reworked character of the phosphorite deposit with periods of submergence and emergence and associated wave activity. These numerous cyclic episodes of reworking and weathering left multiple imprints upon the Florida deposit. The multiplicity of these episodes and the contrasting depositional and postdepositional histories of the North Carolina and Florida deposits are made apparent by combining the data of Webb and Crissinger (1983) with that of Riggs (1984), based on the sea-level curves of Vail and Mitchum (1979) (fig. 4).
At the northern end of the phosphogenic province, the North Carolina phosphorites appear to have been continually deposited in a marine environment. The deposits have been essentially preserved in their original state. The deposits in Florida, however, were subjected to many episodes of subaerial exposure and nearshore sedimentary processes. Deposition of the lower undifferentiated part of the Peace River Formation (units 1 and 0 of Webb and Crissinger, 1983 (fig.4)) corresponds to a general rising in sea level in the early to middle Miocene.
Discussion and Conclusions 21
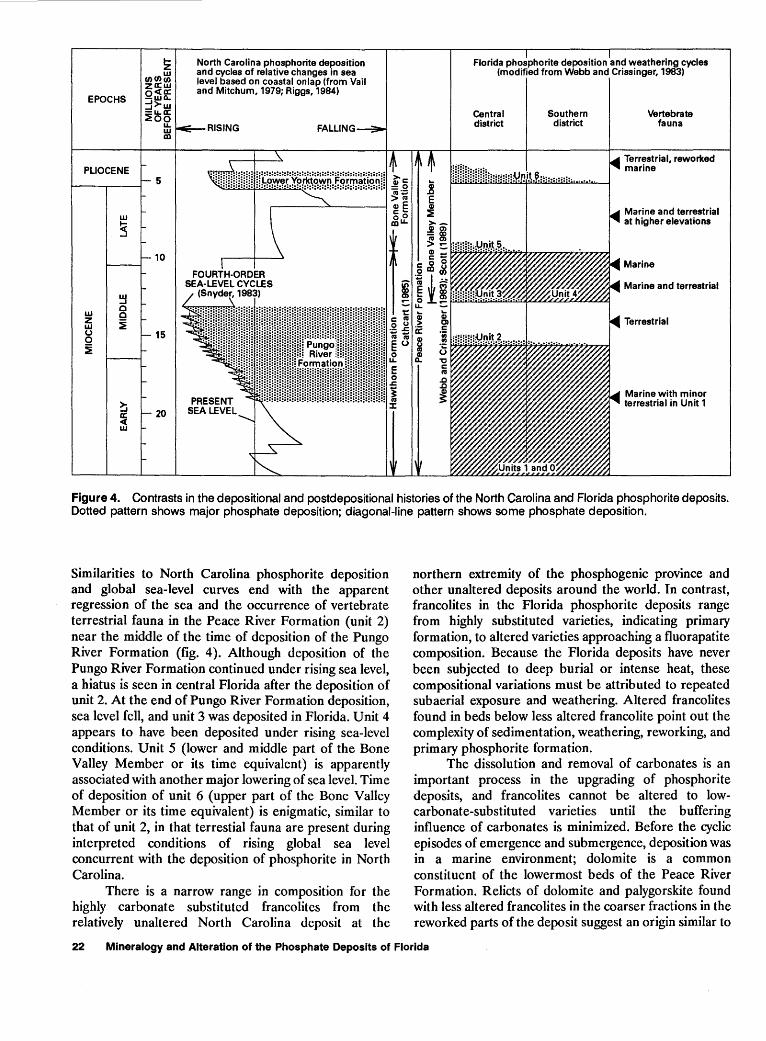
EPOCHS
~ (I)(/)~ za:w e<a: -wa. :j>w -u..a: :iEee
5
LL w m
10
15
20
North Carolina phosphorite deposition and cycles of relative changes in sea level based on coastal on lap (from Vail and Mitchum, 1979; Riggs, 1984)
RISING
Florida phosphorite deposition and weathering cycles (modified from Webb and Crissinger, 1983)
Central district
Southern district
Vertebrate fauna
Terrestrial, reworked marine
Marine and terrestrial at higher elevations
Marine
Marine and terrestrial
Terrestrial
Marine with minor terrestrial in Unit 1
Figure 4. Contrasts in the depositional and postdepositional histories of the North Carolina and Florida phosphorite deposits. Dotted pattern shows major phosphate deposition; diagonal-line pattern shows some phosphate deposition.
Similarities to North Carolina phosphorite deposition and global sea-level curves end with the apparent regression of the sea and the occurrence of vertebrate terrestrial fauna in the Peace River Formation (unit 2) near the middle of the time of deposition of the Pungo River Formation (fig. 4 ). Although deposition of the Pungo River Formation continued under rising sea level, a hiatus is seen in central Florida after the deposition of unit 2. At the end of Pungo River Formation deposition, sea level fell, and unit 3 was deposited in Florida. Unit 4 appears to have been deposited under rising sea-level conditions. Unit 5 (lower and middle part of the Bone Valley Member or its time equivalent) is apparently associated with another major lowering of sea level. Time of deposition of unit 6 (upper part of the Bone Valley Member or its time equivalent) is enigmatic, similar to that of unit 2, in that terrestial fauna are present during interpreted conditions of rising global sea level concurrent with the deposition of phosphorite in North Carolina.
There is a narrow range in composition for the highly carbonate substituted francolites from the relatively unaltered North Carolina deposit at the
northern extremity of the phosphogenic province and other unaltered deposits around the world. In contrast, francolites in the Florida phosphorite deposits range from highly substituted varieties, indicating primary formation, to altered varieties approaching a fluorapatite composition. Because the Florida deposits have never been subjected to deep burial or intense heat, these compositional variations must be attributed to repeated subaerial exposure and weathering. Altered francolites found in beds below less altered francolite point out the complexity of sedimentation, weathering, reworking, and primary phosphorite formation.
The dissolution and removal of carbonates is an important process in the upgrading of phosphorite deposits, and francolites cannot be altered to lowcarbonate-substituted varieties until the buffering influence of carbonates is minimized. Before the cyclic episodes of emergence and submergence, deposition was in a marine environment; dolomite is a common constituent of the lowermost beds of the Peace River Formation. Relicts of dolomite and palygorskite found with less altered francolites in the coarser fractions in the reworked parts of the deposit suggest an origin similar to
22 Mineralogy and Alteration of the Phosphate Deposits of Florida
the noneconomic carbonate-rich beds deeper in sections and downdip. With each period of emergence, freshwater conditions would have removed carbonates, and alteration of the francolites would have occurred.
Dolomite within and below phosphorite beds indicates diagenetic influences. These sediments have been exposed to the repetitive influence of freshwater, seawater, and mixed waters under both phreatic and vadose conditions. Mixed-water conditions may be conducive to the formation of dolomite (Folk and Land, 1975).
The effects of weathering are also indicated by the variations in clay mineralogy with depth. Aluminophosphates and kaolinite formed at the top of the deposits, but unstable palygorskite and sepiolite are preserved at the base. The presence of aluminum-rich smectites (beidellites) also may indicate the overall degree of weathering of the deposits.
It is difficult to decide what aspects of the mineralogy and chemistry of the deposits are cumulative or are the result of the last weathering overprint. Every section examined in this study showed some degree of alteration even in the lowermost beds of the downdip facies in the southern extension. The significant trends of francolite composition suggest that the most recent weathering cycle overshadowed all other events. However, the extent and degree of alteration caused by early weathering cycles are masked by successive weathering cycles. Although most of the major periods of sedimentation and subaerial exposure can be documented (fig. 4), the shorter term effects of minor sealevel fluctuations and possibly changing paleoclimatic conditions are unknown.
As mining progresses into leaner, less altered parts of the deposits, changes in ore characteristics will vary with the degree of weathering of specific parts of the deposit or with proportions of unaltered and altered material. The transition from mining altered ores to less altered ores will result in the processing of phosphate containing greater amounts of endogange contamination and more highly carbonate substituted francolites. The inevitable depletion of high-grade phosphate ores must be accompanied by the development and refinement of processing technology if the Florida phosphate industry is to remain economically viable.
REFERENCES
Altschuler, Z.S., 1965, Precipitation and recycling of phosphate in the Florida land-pebble phosphate deposits: U.S. Geological Survey Professional Paper 525-B, p. B91-B95.
___ 1973, The weathering of phosphate depositsGeochemical and environmental aspects, in Griffith, E.J ., and others, eds., Environmental phosphorus handbook: New York, John Wiley and Sons, p. 33-96.
Altschuler, Z.S., Cathcart, J.B., and Young, E.J., 1964, Geology and geochemistry of the Bone Valley Formation and its phosphate deposits, west central Florida: Geological Society of America annual meeting, Miami Beach, 1964, field trip 6, guidebook, 68 p.
Altschuler, Z.S., Clarke, R.S., Jr., and Young, E.J., 1958, Geochemistry of uranium in apatite and phosphorite: U.S. Geological Survey Professional Paper 314-D, p. 45-90.
Altschuler, Z.S., Dwornik, E.J., and Kramer, H., 1963, Transformation of montmorillonite to kaolinite during weathering: Science, v. 141, p. 148-152.
Altschuler, Z.S., Jaffee, E. B., and Cuttitta, F., 1956, The aluminum phosphate zone of the Bone Valley Formation, Florida, and its uranium deposits, in Page, L.R., Stocking, H.E., and Smith, H.B., compilers, Contributions to the geology of uranium and thorium by the United States Geological Survey and Atomic Energy Commission for the United Nations International Conference on the Peaceful Uses of Atomic Energy, Geneva, Switzerland, 1955: U.S. Geological Survey Professional Paper 300, p. 495-504.
Barwood, H.L., Zelazny, L. W., Gricius, A., and Murowchick, B. L., 1983, Mineralogy of the central Florida phosphate mining district, in The central Florida phosphate district: Geological Society of America Southeastern Section, field trip guidebook, p. 83-89.
Berman, R., 1953, A mineralogic study of churn drill cuttings from a well through the Bone Valley Formation, Hillsborough County, Florida: Nuclear Science Abstracts, v. 7, no. 18A, abs. 5060, p. 616.
Bernardi, J.P., and Hall, R.B., 1980, Comparative analysis of the central Florida phosphate district to its southern extension: Mining Engineering, v. 32, no. 8, p. 1256-1261.
Brindley, G.W., 1980, Order-disorder in clay mineral structures, in Brindley, G. W., and Brown, G., eds., Crystal structures of clay minerals and their X-ray identification: Mineralogical Society of London, Monograph 5, p. 125-196.
Bromwell, L.G., 1982, Physico-chemical properties of Florida phosphatic clays: Florida Institute of Phosphate Research, Publication 02-003-020, 92 p.
Brusewitz, A. M. B., 1975, Studies of the Li test to distinguish between beidellite and montmorillonite: International Clay Conference, Mexico City, 1975, Proceedings, p. 419-427.
Carroll, D., 1970, Clay minerals-A guide to their X-ray identification: Geological Society of America Special Paper 126, 80 p.
Cathcart, J.B., 1968, Phosphate in the Atlantic and Gulf Coastal Plains, in Brown, L.F. ed., Forum on geology of industrial minerals, 4th, Austin, Texas, 1968, Proceedings: Austin, University of Texas, Bureau of Economic Geology, p. 23-34.
References 23
___ 1985, Economic geology of the land-pebble phosphate district of Florida and its southern extension, in Cathcart, J .B., and Scott, T.M., eds., Florida land-pebble phosphate district: Geological Society of America annual meeting, Orlando, Fla., 1985, field-trip guidebook, p. 4-28.
Cathcart, J. B., and Davidson, D.F., 1952, Distribution and origin of phosphate in the land-pebble district of Florida: U.S. Geological Survey Trace Elements Investigations Report TEI-212, 12 p.
Cathcart, J.B., Sheldon, R.P., and Gulbrandsen, R.A., 1984, Phosphate-rock resources of the United States: U.S. Geological Survey Circular 888, 48 p.
Chen, Pei-Yuan, 1977, Table of key lines in X-ray powder diffraction patterns of minerals in clays and associated rocks: Indiana Geological Survey Occasional Paper 21, 67p.
Chien, S.H., and Black, C.A., 1976, Free energy of formation of carbonate apatites in some phosphate rocks: Soil Science Society of America Journal, v. 40, p. 234-239.
Cook, P.J., 1970, Repeated diagenetic calcitization, phosphatization and silicification in the Phosphoria Formation: Geological Society of America Bulletin, v. 81, p. 2107-2116.
Cooke, C.W., 1945, Geology of Florida: Florida Geological Survey Bulletin 29, 335 p.
Dall, W.H., and Harris, G.D., 1892, Correlation papers, Neogene: U.S. Geological Survey Bulletin 84, 349 p.
Espenshade, G.H., and Spencer, C.W., 1963, Geology of the phosphate deposits of northern peninsular Florida: U.S. Geological Survey Bulletin 1118, 115 p.
Flicoteaux, R., and Lucas, J., 1984, Weathering of phosphate minerals, in Nriagu, J.O., and Moore, P.B., eds., Phosphate minerals: New York, Springer-Verlag, p. 292-317.
Folk, R.L., 1974, Petrology of sedimentary rocks: Austin, Texas, Hemphill Publishing Co.
Folk, R.L., and Land, L.S., 1975, Mg!Ca ratio and salinity-Two controls over crystallization of dolomite: American Association of Petroleum Geologists Bulletin, v. 59, p. 60-68.
Freas, D.H., 1968, Exploration for Florida phosphate deposits, in Seminar on sources of mineral raw materials for the fertilizer industry in Asia and the Far East: United Nations Economic Commission for Asia and the Far East Mineral Resources Development Series, no. 32, p. 187-199.
Freas, D.H., and Riggs, S.R., 1968, Environments of phospho-rite deposition in the central Florida phosphate district, in Brown, L. F., ed., Forum on geology of industrial minerals, 4th, Austin, Texas: Austin, University of Texas Bureau of Economic Geology, p. 117-128.
Gilliland, M.W., 1976, A geochemical model for evaluating theories on the genesis of Florida's sedimentary phosphate deposits: Mathematical Geology, v. 8, no. 3, p. 219-242.
Greene-Kelly, R., 1955, Dehydration of the montmorillonite minerals: Mineralogical Magazine, v. 30, p. 604.
Gremillion, L., 1965, The origin of attapulgite in the Miocene strata of Florida and Georgia: Tallahassee, Florida State University Ph.D. dissertation, 159 p.
Grim, R.E., 1933, Petrography of the fuller's earth deposits, Olmstead, Illinois, with a brief study of some non-Illinois earths: Economic Geology, v. 29, p. 344-363.
Gulbrandsen, R.A., 1970, Relation of carbon dioxide content of apatite of the Phosphoria Formation to regional facies: U.S. Geological Survey Professional Paper 700-B, p. B9-B13.
Hanshaw, B.B., Back, W., and Deike, R.G., 1971, A geochemical hypothesis for dolomitization by ground water: Economic Geology, v. 66, p. 710-724.
Heron, S.P., and Johnson, H.S., 1966, Clay mineralogy, stratigraphy, and structural setting of the Hawthorn Formation, Coosawhatchie District, South Carolina: Southeast Geology, v. 7, p. 51-63.
Isphording, W.C., 1973, Discussion of the occurrence and origin of sedimentary palygorskite/sepiolite deposits: Clays and Clay Minerals, v. 21, p. 391-401.
Johnson, A.K.C., 1987, Le Bassin C6tier a Phosphates du Togo (Maastrichtien-Eocene moyen): Universite de Bourgogne and the Universite du Benin (Togo), unpub. Ph.D. dissertation.
Kerr, P., 1937, Attapulgus clay: American Mineralogist, v. 22, p. 548.
Lehr, J.R., McClellan, G.H., Smith, J.P., and Frazier, A.W., 1968, Characterization of apatites in commercial phosphate rocks, in Colloque International sur les phosphates mineraux solides, Toulouse, France, 1967, v. 2, Phosphates naturals-phosphates dans ]'agriculture: Paris, Societe Chimique de France, p. 29-44.
Lucas, J., Flicoteaux, R., Nathan, Y., Prev<>t, L., and Shabar, Y., 1980, Differential aspects of phosphorite weathering: Society of Economic Paleontologists and Mineralogists Special Publication 29, p. 41-51.
Mansfield, G., 1940, Clay investigations in the southern states, 1934-1935-Introduction: U.S. Geological Survey Bulletin 901, 9 p.
Marshall, C.E., 1949, The colloid chemistry of the silicate minerals: New York, Academic Press, Inc., 195 p.
Matson, G.C., and Clapp, F.G., 1909, A preliminary report of the geology of Florida with special reference to the stratigraphy: Florida Geological Survey 2nd Annual Report, p. 25-173.
McArthur, J.M., 1978, Systematic variations in the contents of Na, Sr, COs, and S04 in marine carbonate-fluorapatite and their relation to weathering: Chemical Geology, v. 21, p. 82-112.
___ 1980, Post-depositional alteration of the carbonatefluorapatite phase of Moroccan phosphates, in Bentor, Y.K., ed., Marine phosphorites-Geochemistry, occurrence, genesis: Society of Economic Paleontologists and Mineralogists Special Publication 29, p. 53-60.
___ 1985, Francolite geochemistry-compositional controls during formation, diagenesis, metamorphism and weathering: Geochimica et Cosmochimica Acta, v. 49, p. 23-35.
24 Mineralogy and Alteration of the Phosphate Deposits of Florida

McClellan, G.H., 1962, Identification of clay minerals from the Hawthorn Formation from the Devil's Mill Hopper, Alachua County, Florida: Gainesville, University of Florida M.S. thesis, 119 p.
___ 1964, Petrology of attapulgus clay in north Florida and southwest Georgia: Urbana, Ill., University of Illinois Ph.D. dissertation, 127 p.
___ 1980, Mineralogy of carbonate fluorapatites, in Phosphatic and glauconitic sediments: Geological Society of London Journal, v. 137, pt. 6, p. 675-681.
McClellan, G.H., and Lehr, J.R., 1969, Crystal chemical investigation of natural apatites: American Mineralogist, v.54,p. 1374-1391.
Mehra, O.P., and Jackson, M.L., 1960, Iron oxide removal from soils and clays by a dithionite-citrate system buffered with sodium bicarbonate: National Academy of· ScienceNational Research Council, Clays and Clay Minerals, 7th Conference, Proceedings, p. 317-327.
Nathan, Y., and Sass, E., 1981, Stability relations of apatites and calcium carbonates: Chemical Geology, v. 34, p. 103-111.
Olson, N.K., ed., 1966, Geology of the Miocene and Pliocene series in the North Florida-South Georgia area: Atlantic Coastal Plain Geological Association, 7th annual field trip, guidebook, 94 p.
Patterson, S.H., 1974, Fullers earth and other industrial mineral resources of the Meigs-Attapulgus-Quincy district, Georgia and Florida: U.S. Geological Survey Professional Paper 828, 43 p.
Peck, D.M., Missimer, T.M., Slater, D.H., Wise, S.W., Jr., and O'Donnell, T.H., 1979, Late Miocene glacial-eustatic lowering of sea level-Evidence from the Tamiami Formation of south Florida: Geology, v. 7, p. 285-288.
Pirkle, E.C., Yoho, W.H., and Webb, S.D., 1967, Sediments of the Bone Valley phosphate district of Florida: Economic Geology, v. 62, p. 237-261.
Reeder, R.J., 1983, Crystal chemistry of the rhombohedral carbonates, in Reeder, R.J., ed., Carbonates-Mineralogy and chemistry: Mineralogical Society of America, Reviews in Mineralogy, v. 11, p. 1-47.
Reik, B.A., 1982, Oay mineralogy of the Hawthorn Formation in northern and eastern Florida, in Scott, T.M., and Upchurch, S.B., eds., Miocene of the southeastern United States: Florida Bureau of Geology, Special Publication 25, p. 247-250.
Riggs, S.R., 1979a, Petrology of the tertiary phosphate system of Florida: Economic Geology, v. 74, p. 195-220.
___ 1979b, Phosphorite sedimentation in Florida-A model phosphogenic system: Economic Geology, v. 74, p. 285-314.
___ 1984, Paleoceanographic model of Neogene phosphorite deposition, U.S. Atlantic continental margin: Science, v. 223, p. 123-131.
Rooney, T.P., and Kerr, P.F., 1967, Mineralogic nature and origin of phosphorite, Beaufort County, North Carolina: Geological Society of America Bulletin, v. 78, p. 731-748.
Ross, C.S., and Hendricks, S.B., 1945, Minerals of the montmorillonite group: U.S. Geological Survey Professional Paper 205-B, 79 p.
Schneiderhohn, P., 1964, Nontronit von Hoben Hagen und Chloropal vom Meenser Steinberg bei Gottingen: Tschermaks Mineralogische und Petrographische Mitteilungen, v. 10, p. 385-399.
Schultz, L.G., 1969, Lithium and potassium absorption, dehydration temperature and structural water content of aluminous smectites: Clays and Clay Minerals, v. 17, p. 115-149.
Scott, T.M., 1985, The lithostratigraphy of the central Florida phosphate district and its southern extension, in Cathcart, J.B., and Scott, T.M., eds., Florida land-pebble phosphate district: Geological Society of America, annual meeting, Orlando, Fla, October, 1985, Field-trip guidebook, p. 28-38.
___ 1988, Lithostratigraphy of the Hawthorn Group (Miocene) of Florida: Florida Geological Survey Special Publication 59, 148 p.
Scott, T.M., and Upchurch, S.B., eds., 1982, Miocene of the southeastern United States: Florida Bureau of Geology Special Publication 25, 318 p.
Singer, A., 1979, Palygorskite in sediments-Detrital, diagenetic or neoformed-A critical review: Geological Research, v. 68, p. 996-1008.
Snyder, S.W.P., 1983, Seismic stratigraphy within the Miocene Carolina phosphogenic province- Chronostratigraphy, paleotopographic controls, sea level cyclicity, Gulf Stream dynamics, and the resulting depositional framework: Chapel Hill, University of North Carolina M.S. thesis, 183 p.
Stow, S.H., 1968, The heavy minerals of the Bone Valley Formation and their potential value: Economic Geology, v. 63, p. 973-977.
___ 1976, Effects of weathering on the chemical and heavy mineral composition and physical properties of phosphate pebbles from the Bone Valley Formation of Florida: Southeastern Geology, v. 18, p. 83-98.
Strom, R.N., and Upchurch, S.B., 1983, Palygorskite ( attapulgite )-rich sediments in the Hawthorn Formation-A product of alkaline lake deposition? in The central Florida phosphate district: Geological Society of America, Southeastern Section, guidebook, p. 73-82.
___ 1985, Palygorskite distribution and silicification in the phosphatic sediments of central Florida, in Snyder, Scott, ed., Guidebook, Eighth international field workshop and symposium (southeastern United States): Paris, France, International Geological Correlation Program, Project 156-Phosphorites, p. 118-126.
Trauth, N., and Lucas, J., 1967, Thermal methods in the study of clay minerals: Groupe Francaise Argiles Bulletin, v. 19, p. 11-24.
Upchurch, S.B., Strom, R.N., and Nuckels, M.G., 1982, Silicification of Miocene rocks from central Florida, in Scott, T.M., and Upchurch, S.B., eds., Miocene of the southeastern United States: Florida Bureau of Geology Special Publication 25, p. 251-284.
References 25
Vail, P.R., and Mitchum, R.M, 1979, Global cycles of relative changes of sea level from seismic stratigraphy, in Watkins, J.S., Montadert, L., and Dickerson, P.W., eds., Geological and geophysical investigations of continental margins: American Association of Petroleum Geologists Memoir 29, p. 469-472.
Vernon, R.O., 1951, Geology of Citrus and Levy Counties, Florida: Florida Geological Sutvey Bulletin 33, 256 p.
Weaver, C.E., 1984, Origin and geologic implications of the palygorskite of the S.E. United States, in Palygorskitesepiolite, occurrences, genesis and uses: New York, Elsevier Publishing Co., p. 39-58.
Weaver, C.E., and Beck, K.C., 1977, Miocene of the S.E. United States-A model for chemical sedimentation in a perimarine environment: New York, Elsevier Publishing Co., 234 p.
Weaver, C.E., and Pollard, L.D., 1973, The chemistry of clay minerals: New York, Elsevier Publishing Co., 213 p.
Webb, S.D., and Crissinger, D.B., 1983, Stratigraphy and vertebrate paleontology of the central and southern phosphate districts of Florida, in The central Florida phosphate district: Geological Society of America, Southeastern Section, field-trip guidebook, p. 28-72.
Weir, A.H., and Greene-Kelly, R., 1962, Beidellite: American Mineralogist, v. 47, p. 137-146.
Whippo, R.E., and Murowchick, B.L., 1967, The crystal chemistry of some sedimentaty apatites: Society of Mining Engineers Transactions, v. 19, no. 4, p. 257-263.
Williams, G.K., 1971, Geology and geochemistty of the sedimentary phosphate deposits of northern peninsular Florida: Tallahassee, Florida State University Ph.D. dissertation, 124 p.
Wissa, A.E.Z., Fuleihan, N.F., and Ingra, T.S., 1982, Evolution of phosphatic clay disposal and reclamation methods, in Mineralogy of phosphatic clays: Bartow, Fla., Florida Institute of Phosphate Research, v. 2, 55 p.
26 Mineralogy and Alteration of the Phosphate Deposits of Florida

APPENDIX Figures 5-23
Lithologic, stratigraphic, mineralogic, and grain-size analyses of sections from Florida phosphate mines
Samples 1-84 to 47-84
Figures 5-23 contain lithologic notes, stratigraphic interpretations, mineralogy, francolite a-values, and screen data for the samples used in this study. In the mineralogy section, major minerals (in capital letters) have a most intense peak (1/h = 100) greater than 50 percent of the most intense peak determined. Mineral components with a most intense peak less than 50 percent and greater than 10 percent are termed minor (m). Trace minerals (tr.) have a 1/11 = 100 peak that is less than 10 percent of the most intense peak. Analyses by X-ray diffraction by the authors. Screen data are in Tyler mesh. Names in capital letters in the Lithology column are local terminology. K, potassium.
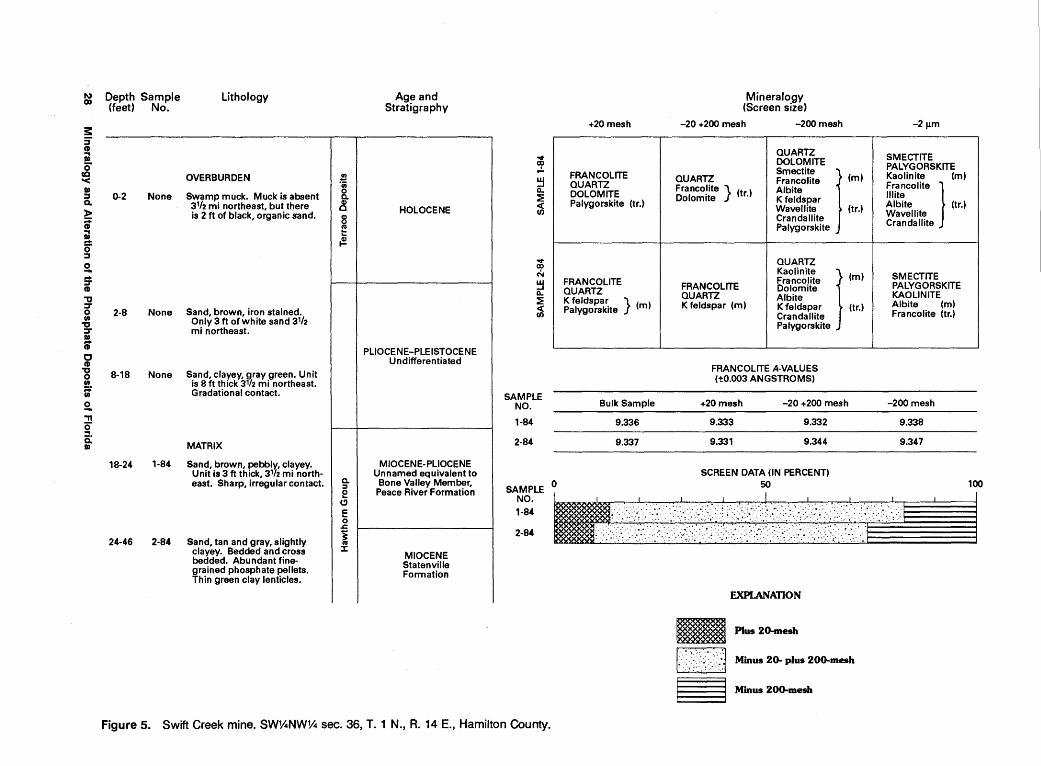
N (X)
3: 3" CD .. II)
0 CQ
'< II) ::s a. )> ;::; CD .. II)
g. ::s 2. ... ::s" CD
"tt ::s" 0 UJ , ::s" II)
S' c CD , 0 UJ ;::; UJ
2. ., Q a: II)
Depth Sample (feet) No.
lithology
OVERBURDEN
o-2 None Swamp muck. Muck is absent 31/2 mi northeast, but there is 2ft of black, organic sand.
2-8 None Sand, brown, iron stained. Only 3ft of white sand 31h mi northeast.
8-18 None Sand, clayey, gray green. Unit is 8ft thick 3172 mi northeast. Gradational contact.
MATRIX
18-24 1-84 Sand, brown, pebbly, clayey. Unit is 3ft thick, 3172 mi north-east. Sharp, irregular contact.
24-46 2-84 Sand, tan and gray, slightly clayey. Bedded and cross bedded. Abundant fine-grained phosphate pellets. Thin green clay lenticles.
~ ·;; 0 c. ~ a ~ ;p.
c. ::I e
CJ c 0
.&:
j IV :I:
Age and Stratigraphy
HOLOCENE
PLIOCENE-PLEISTOCENE Undifferentiated
MIOCENE-PLIOCENE Unnamed equivalent to
Bone Valley Member, Peace River Formation
MIOCENE Statenville Formation
.... ! ~ n.. ::::! ~
.... co N ~ n.. ::::! <( (/)
SAMPLE NO .
1-84
2-84
SAMPLE NO. 1-84
2-84
Figure 5. Swift Creek mine. SW1ANW1fil sec. 36, T. 1 N., R. 14 E., Hamilton County.
+20 mesh
FRANCOLITE QUARTZ DOLOMITE Palygorskite (tr.)
FRANCOLITE QUARTZ K feldspa~ } (m) Palygorskite
Bulk Sample
9.336
9.337
Mineralogy (Screen size)
-20 +200 mesh -200mesh
QUARTZ DOLOMITE
Smectite I l QUARTZ Francolite (m Franco~ite } (tr.) Albite Dolomite K feldspar
Wavellite (tr.) Crandallite Palygorskite
QUARTZ
Kaolinh~ llml Francolite FRANCOLITE Dolomite QUARTZ Albite K feldspar (m) K feldspar (tr.)
Crandallite Palygorskite
FRANCOLITE A-VALUES (t0.003 ANGSTROMS)
+20 mesh -20 +200 mesh
9.333 9.332
9.331 9.344
SCREEN DATA (IN PERCENT)
-2 JLm
I SMECTITE PALYGORSKITE Kaolinite (m) Francolite } Illite Albite (tr.) Wavellite
J Crandallite
SMECTITE PALYGORSKITE KAOLINITE Albite (m) Francolite (tr.)
-200 mesh
9.338
9.347
0 ~ 100 .I I I I· I I I I d ···_::·.:::· ").·::::_··'<::.:::.- :_::::::_:: ·.: :\.:.\::t ;:: •. ::; .·•'.• .. •I
EXPLANATION
~ Plus 20-mesh
v.::_::;_.:(:.::·.J Minus 20- plus 200-mesh
~ Minus 200-mesh

"TI cS" c ; UJ
~ w
~
Depth Sample (feet) No.
Lithology
OVERBURDEN
0-2 None Sand, black, organic.
2-10 None Sand, red brown, iron stained. Unit is gray and 8ft thick 2 mi northeast.
10-18 None Sand, clayey, yellow. Unit is 3ft thick 2 mi northeast.
MATRIX
18-21 1-84 Sand, clayey, leached; some white and brown phosphate.
21-32 3-84 Sand, clayey, mottled rust and blue gray. Thin green clay lenses. Unit is 6ft thick 2 mi northeast and is underlain by 6ft of interbedded hard, thin dolomite and gray-brown phosphatic sand. These units are bedded and cross bedded. Un-derlain by yellow bedded dolomite.
~ ·;;; 0 a. Q)
a B ~
~
a. :l 0 (; 1:::
0 .r:.
~ nl :I:
Age and Stratigraphy
HOLOCENE
PLEISTOCENE
Irregular, sharp contact
MIOCENE-PLIOCENE Unnamed equivalent to
Bone Valley Member, Peace River Formation
MIOCENE Statenville Formation
I
I
oct
~ ~ a.. ::E ~
oct 00 M ~ a.. ::E ~
SAMPLE NO.
1-84
3-84
SAMPLE NO. 1-84
3-84
+20 mesh
FRANCOLITE QUARTZ DOLOMITE Palygorskite (tr.)
FRANCOLITE QUARTZ Kfeldspar } Palygorskite (tr.) Calcite
Bulk Sample
9.336
9.332
Mineralogy (Screen size)
-20 +200 mesh -200 mesh
QUARTZ DOLOMITE
Smectite j (m) QUARTZ Francolite Franco!ite } (tr.) Albite Dolom1te K feldspar
Wavellite (tr.) Crandallite Palygorskite
QUAmL l Smectite QUARTZ Palygorskite (m) Francolite } Francolite Dolomite (tr.) Albite K feldspar K feldsp~r (tr.)
Crandalhte
FRANCOLITE A-VALUES (t0.003 ANGSTROMS)
+20 mesh -20 +200 mesh
9.333 9.332
9.328 9.333
SCREEN DATA (IN PERCENT)
-2 JLm
SMECTITE PALYGORSKITE Kaolinite (m) Francolite } Illite Albite (tr.) Wavellite Crandallite
SMECTITE Palygorskite } (m) Albite Francolite (t ) Dolomite r. Crandallite
-200 mesh
9.338
9.351
0 ~ 100
... >: ...... ::~_~_; · .' :_:.-.:: .. · -~:·:.:· · .. ;.:· .. Y .·.~:>; .. : :-:-: ._: :~-=-· :.::: :·: :· .-r.-1 ~ I I I I I I I I I
020 ,,: .'· ·.::·:n· ...... _.,· .······:·:.: :. ':·.·.· •. ,'. ···•·····:.rl
EXPLANATION
m5R Plus 20-mesh
1:·.-: .. :).:(:_:.::j Minus 20- plus 200-mesh
~ Minus 200-mesh
Figure 6. Suwannee River mine. SW1ANW1A sec. 30, T. 1 S., A. 16 E., Hamilton County.
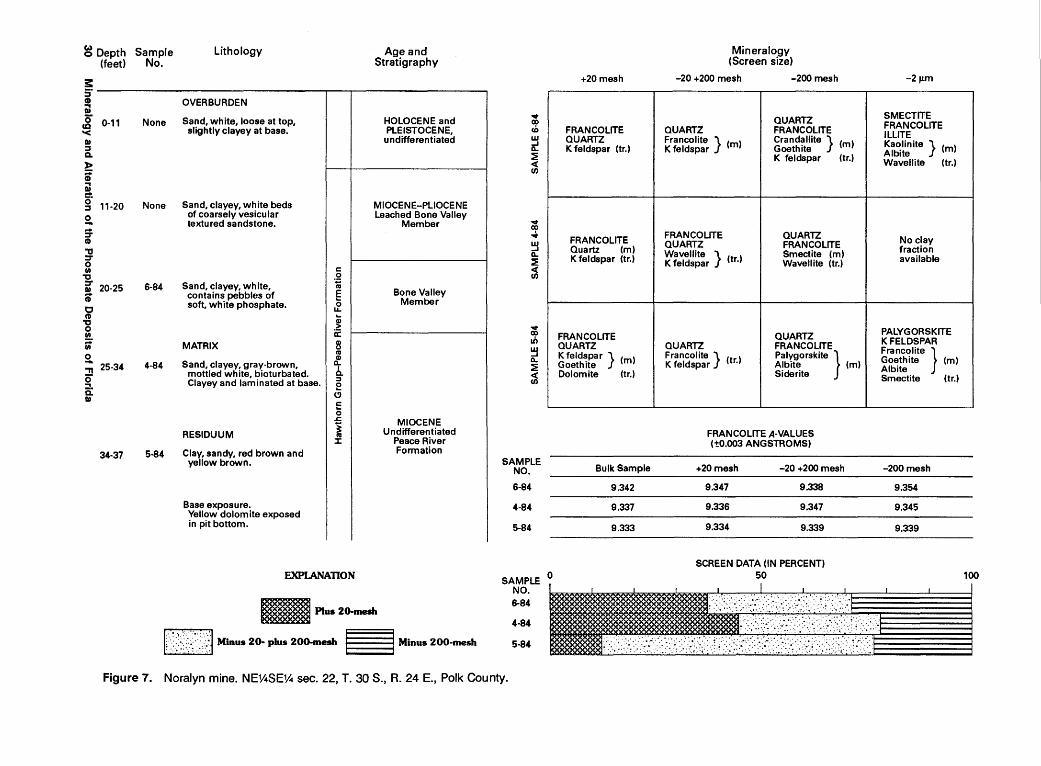
~ Depth Sample (feet) No.
s:: s· CD ; 0
CQ '< I» :::s Q.
~ <D ; ... o· :::s
a ... ::r CD ., ::r 0 en
"C ::r I» <D c (I)
"C 0 en ;::; en
a ., g a: I»
0-11 None
11-20 None
20-25 6-84
25-34 4-84
34-37 5-84
Lithology
OVERBURDEN
Sand, white, loose at top, slightly clayey at base.
Sand, clayey, white beds of coarsely vesicular textured sandstone.
c .2
Sand, clayey, white, "iO contains pebbles of e soft, white phosphate. 0
LL
~ a:
MATRIX ~ IV CD
Sand, clayey, gray-brown, a.. mottled white, bioturbated. 6. Clayey and laminated at base. :::1
e CJ c 0 .c
RESIDUUM i J:
Clay, sandy, red brown and yellow brown.
Base exposure. Yellow dolomite exposed in pit bottom.
EXPLANATION
Age and Stratigraphy
HOLOCENE and PLEISTOCENE,
undifferentiated
MIOCENE-PLIOCENE Leached Bone Valley
Member
Bone Valley Member
MIOCENE Undifferentiated
Peace River Formation
~~~~ Plus 20-mesh
lr--.. ~_;:_:\:.~:::_::_.:J Minus 20- plus 200-mesh ~ Minus 200-mesh
.. OJ> CD w ...J a.. ::.!: <( en
.. CXl ...;. ~ a.. ::.!: ~
.. CXl &b ~ a.. ::.!: <'j
SAMPLE NO.
6-84
4-84
5-84
SAMPLE NO. 6-84
4-84
5-84
Figure 7. Noralyn mine. NE1ASE1A sec. 22, T. 30 S., R. 24 E., Polk County.
+20mesh
FRANCOLITE QUARTZ K feldspar (tr.)
FRANCOLITE Quartz (m) K feldspar (tr.)
FRANCOLITE QUARTZ K feldspar } ( ) Goethite m Dolomite (tr.)
-- -- ----
Bulk Sample
9.342
9.337
9.333
Mineralogy (Screen size)
-20 +200 mesh -200 mesh
QUARTZ QUARTZ FRANCOLITE Francolite } ( ) Crandallite } ( ) K feldspar m Goethite m
K feldspar (tr.)
FRANCOLITE QUARTZ QUARTZ FRANCOLITE Wavellite } Smectite (m) K feldspar (tr.) Wavellite (tr.)
QUARTZ QUARTZ FRANCOLITE Francolite } K feldspar (tr.) Albite (m)
Palygorskite }
Siderite
------- -'-
FRANCOLITE A-VALUES (t0.003 ANGSTROMS)
+20mesh -20 +200 mesh
9.347 9.338
9.336 9.347
9.334 9.339
SCREEN DATA (IN PERCENT)
-2J..Lm
SMECTITE FRANCOLITE ILLITE Ka~linite } (m) Alb1te Wavellite (tr.)
No clay fraction
I
available
PALYGORSKITE KFELDSPAR Francolite } Goethite (m) Albite Smectite (tr.)
-
-200 mesh
9.354
9.345
9.339
0 ~ 100
: ':· .. : '·. ' . ;; J~:'!:@·;:,:·.:o. .. ·:.(l., < .. •: .• j -'''''1 ii20ii0\?~··:·,;·:··,,·,.> .. <::·.; .•. :,:···· ... ·,::·:l
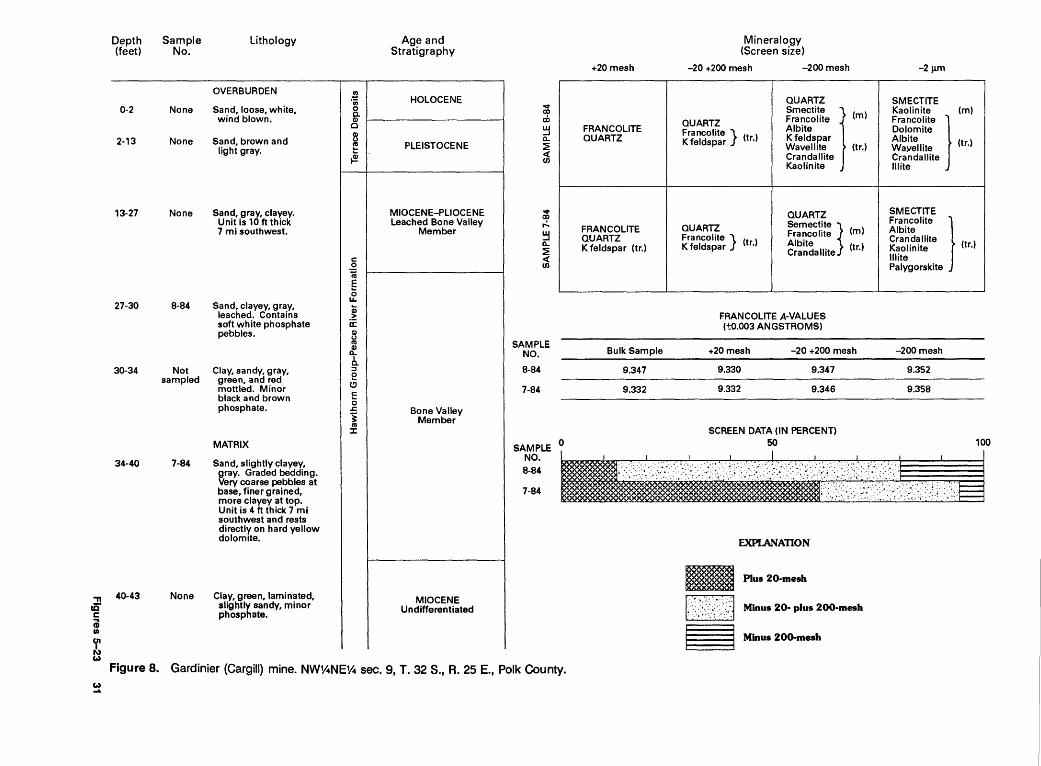
., Ui' c ; fn
~ w ....
Depth (feet)
0-2
2-13
13-27
27-30
30-34
34-40
40-43
Sample No.
None
None
None
8-84
Not sampled
7-84
None
Lithology
OVERBURDEN
Sand, loose, white, wind blown.
Sand, brown and light gray.
Sand, gray, clayey. Unit is 10ft thick 7 mi southwest.
Sand, clayey, gray, leached. Contains soft white phosphate pebbles.
Clay, sandy, gray, green, and red mottled. Minor black and brown phosphate.
MATRIX
Sand, slightly clayey, gray. Graded bedding. Very coarse pebbles at base, finer grained, more clayey at top. Unit is 4ft thick 7 mi southwest and rests directly on hard yellow dolomite.
Clay, green, laminated, slightly sandy, minor phosphate.
!3 ·;;; 0 0. (I)
c B cu ... ~
c:: .g cu e 0
LL.
~ ~ (I) C) cu (I) a.. 0. :::1
e (!)
c:: 0
.&:.
j cu :I:
Age and Stratigraphy
HOLOCENE
PLEISTOCENE
MIOCENE-PLIOCENE Leached Bone Valley
Member
Bone Valley Member
MIOCENE Undifferentiated
I
..,. co 00 ~ a.. ~
~
..,. co ...:. ~ a.. ~ <( (I)
SAMPLE NO.
8-84
7-84
SAMPLE NO. 8-84
7-84
~
Figure 8. Gardinier (Cargill) mine. NW1ANE1A sec. 9, T. 32 S., R. 25 E., Polk County.
+20 mesh
FRANCOLITE QUARTZ
FRANCOLITE QUARTZ K feldspar (tr.)
Mineralogy (Screen size)
-20 +200 mesh -200 mesh
QUARTZ
Sm~me l QUARTZ Francolite (m)
Francolite } Albite K feldspar (tr.) K feldspar
Wavellite (tr.) Crandallite Kaolinite
QUARTZ QUARTZ Semectite ~ Francolite } Francolite (m) K feldspar (tr.) Albite
Crandallite (tr.)
~-- ---~---
Bulk Sample
9.347
9.332
FRANCOLITE A-VALUES (t0.003 ANGSTROMS)
+20 mesh -20 +200 mesh
9.330 9.347
9.332 9.346
EXPLANATION
~ Plus 20-mesh
1;·:;.:._>\t>·.:j Minus 20- plus 200-mesh
~ Minus 200-mesh
-2J.Lm
SMECTITE Kaolinite (m) Francolite } Dolomite Albite Wayellite (tr.) Crandallite Illite
SMECTITE Francolite } Albite Crandallite Kaolinite (tr.) Illite Palygorskite
-200 mesh
9.352
9.358
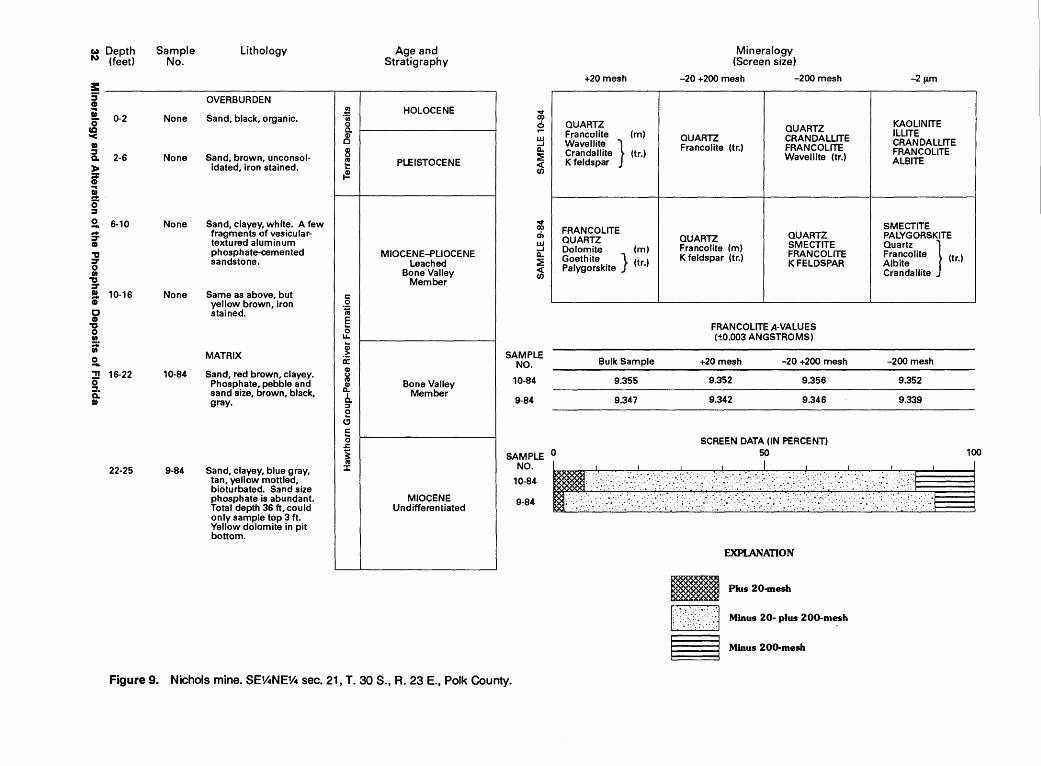
w Depth N (feet)
!: s· CD .. ., c8 '< ., ::J a. )>
i Gl .. 0 ::J
2. .. :::r CD
"'0 :::r 0 0 , :::r ; i' -g 0
it 2.
"" ~ a: .,
0-2
2-6
6-10
10-16
16-22
22-25
Sample No.
None
None
None
None
10-84
9-84
Lithology
OVERBURDEN
Sand, black, organic.
Sand, brown, unconsol-idated, iron stained.
Sand, clayey, white. A few fragments of vesicular-textured aluminum phosphate-cemented sandstone.
Same as above, but yellow brown, iron stained.
MATRIX
Sand, red brown, clayey. Phosphate, pebble and sand size, brown, black, gray.
Sand, clayey, blue gray, tan, yellow mottled, bioturbated. Sand size phosphate is abundant. Total depth 36ft, could only sample top 3ft. Yellow dolomite in pit bottom.
~ ·;;; 0 0.. Q)
c ~ ~
;p_
c .2 IV e 0 u..
~ a: Q) (J ca Q) a.. 0. :::J
e CJ c 0 ..c j ca J:
Age and Stratigraphy
HOLOCENE
PLEISTOCENE
MIOCENE-PLIOCENE Leached
Bone Valley Member
Bone Valley Member
MIOCENE Undifferentiated
I
I
i
i
I
..,. 00 0 .... ~ a.. :E ~
..,. 00 a, ~ a.. :E ~
SAMPLE NO.
10-84
9-84
SAMPLE NO.
10-84
9-84
Figure 9. Nichols mine. SEV..NEV.. sec. 21, T. 30 S., R. 23 E., Polk County.
+20 mesh
QUARTZ Francolite (m) Wavellite } Crandallite (tr.) K feldspar
FRANCOLITE QUARTZ Dolomite (m) Goethite . } (tr.) Palygorskite
-- J......_
Bulk Sample
9.355
9.347
Mineralogy (Screen size)
-20 +200 mesh -200 mesh
QUARTZ QUARTZ CRANDALLITE Francolite (tr.) FRANCOLITE
Wavellite (tr.)
QUARTZ QUARTZ SMECTITE Francolite (m) FRANCOLITE K feldspar (tr.) KFELDSPAR
-- ~------
FRANCOLITE A-VALUES (t0.003 ANGSTROMS)
+20 mesh -20 +200 mesh
9.352 9.356
9.342 9.346
SCREEN DATA (IN PERCENT)
-2f.Lm
KAOLINITE ILLITE CRANDALLITE FRANCOLITE ALBITE
SMECTITE PALYGORSKITE Quartz } Francolite (tr) Albite · Crandallite
I
I
---.!...-- --- ---
-200 mesh
9.352
9.339
0 ~ 100
It-•'·: .t . t:':' .; ... ~\<_·:_•::'·:. ·_:·,_-r(_ :·'· :.:':;.· •. -.. ,': ... ' ........ ~._. :I_> .. .
EXPLANATION
.. Plus 20-mesh
~~-... ~.::\.r~.:::.;J Minus 20- plus 200-mesh
~ Minus 200-mesh

-n ,]j" c ; 0
~ w
w w
Depth Sample (feet) No.
0-2 None
2-9 None
9-15 None
15-19 None
19-29 13-84
29-41 12-84
41-43 Not sampled
43-50 11-84
Lithology
OVERBURDEN Sand, black, organic.
Sand, white and tan, unconsolidated.
Sand, clayey, gray, leached. Boulders of sand cemented by aluminum phosphate.
Sand, clayey, gray ~reen. Leached. Soft whate phosphate.
MATRIX
Sand, gray green, pebbly. Graded bedding.
Sand, clayey, yellow and gray ~reen. Fine-grained p osphate pellets abundant.
Clay, sandy, yellow green with some phosphate pellets.
Sand, clayey, mottled brown and gray. Phosphate pebble and pellets. Graded. Blue clay clasts abundant at base.
Yellow dolomite in pit bottom.
B-~ calll ._o --a. ~~
c: ~ ca e 0
LL
~ a: CD (,) ca CD
0..
0. ::I 0
~ c: 0 .s:. ~ ca :I:
EXPLANATION
~~~ Plus 20-mesh
Age and Stratigraphy
HOLOCENE
PLEISTOCENE
MIOCENE-PLIOCENE Leached
Bone Valley Member
Bone Valley Member
MIOCENE Undifferentiated
j;":·_.::.:'.:~>~:::_:::·:;/1 Minus 20· plus 200-mesh ~ Minus 200.mesh
..,. co ~ ~ 0.. ~
~
..,. co ~ ~ 0.. ~ <( (/)
..,. ~ ... ~ 0.. ~
~
SAMPLE NO.
13-84
12-84
11-84
+20 mesh
FRANCOLITE QUARTZ Wavellite } K feldspar (tr.)
FRANCOLITE QUARTZ K feldspar (m)
FRANCOLITE Quartz (m) Goethite (tr.)
Bulk Sample
9.330
9.333
9.334
Mineralogy (Screen size)
-20 +200 mesh -200 mesh
QUARTZ
QUARTZ FRANCOLITE
Wavellite } Sm~M J Francolite (tr.) Albite (m)
K feldspar Wavellite Kaolinite Palygorskite (tr.)
QUARTZ QUARTZ Smectite J Francolite } Francolite (m) Dolomite (tr.) K feldspar K feldspar Crandallite (t )
Illite r.
QUARTZ FRANCOLITE
QUARTZ Albite 1 Francolite (m) K feldspar
K feldspar (tr.) Paly~orskite (m) Kaolinite Crandallite Dolomite(?) (tr.)
FRANCOLITE A-VALUES (±0.003 ANGSTROMS)
+20 mesh -20 +200 mesh
9.328 9.332
9.328 9.334
9.328 9.332
SCREEN DATA (IN PERCENT)
-2 Jlm
SMECTITE FRANCOLITE Illite } Wavellite (m) Kaolinite (tr.)
SMECTITE
K feldspar (m) ltliM J Quartz Francolite (tr.)
PALYGORSKITE SMECTITE ALBITE Francolite } Dolomite (tr.) K feldspar
-200 mesh
9.344
9.345
9.344
SAMPLE 0 50 100
:~~ -;:\<:;.I:Jli;),·\;J'::{;:;::-t,·,J~::~~~:['·.··j' I
Figure 10. Ft. Meade mine. NW1ANW1A sec. 28, T. 31 S., R. 25 E., Polk County.
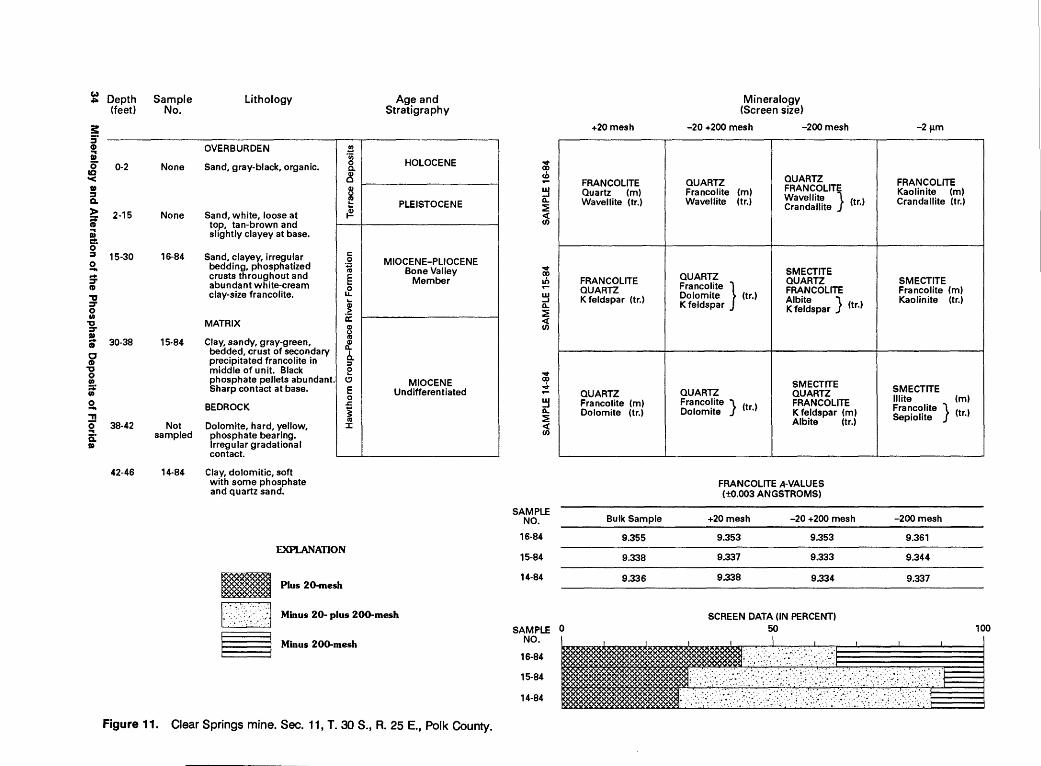
~ Depth (feet)
3: 3' CD .. I» 0
cc '< I» ::s a. )> ; ; ct 0 ::s a ... ':1' CD ., ':1' 0 en , ':1' I» S' c CD , 0 en ;::;' en a ., [ a: I»
0-2
2-15
15-30
30-38
38-42
42-46
Sample No.
None
None
16-84
15-84
Not sampled
14-84
Lithology
OVERBURDEN
Sand, gray-black, organic.
Sand, white, loose at top, tan-brown and slightly clayey at base.
Sand, clayey, irregular bedding, phosphatized crusts throughout and abundant white-cream clay-size francolite.
MATRIX
Clay, sandy, gray-green, bedded, crust of secondary precipitated francolite in middle of unit. Black phosphate pellets abundant. Sharp contact at base.
BEDROCK
Dolomite, hard, yellow, phosphate bearing. Irregular gradational contact.
Clay, dolomitic, soft with some phosphate and quartz sand.
!! ·;; 0 a. ~ tJj ~
~
c .~ cv E 0
LL
~ ~ CD (.) Ill CD a.. 0. ::;,
e C)
c 0
.J::.
i Ill J:
EXPLANATION
IB Plus 20-mesh
Age and Stratigraphy
HOLOCENE
PLEISTOCENE
MIOCENE-PLIOCENE Bone Valley
Member
MIOCENE Undifferentiated
,,·.:~:::;:i:X~.:J Minus 20- plus 200-mesh
~ Minus 200-mesh
Figure 11. Clear Springs mine. Sec. 11, T. 30 S., A. 25 E., Polk County.
J I
i
..,. co cD ... ~ a.. ~
~
..,. co ,;, ... ~ a.. ~
~
..,. co ...;. ... ~ a.. ~
~
SAMPLE NO.
16-84
15-84
14-84
SAMPLE NO.
16-84
15-84
14-84
+20mesh
FRANCOLITE Quartz (m) Wavellite (tr.)
FRANCOLITE QUARTZ K feldspar (tr.)
QUARTZ Francolite (m) Dolomite (tr.)
Bulk Sample
9.355
9.338
9.336
Mineralogy (Screen size)
-20 +200 mesh -200mesh
QUARTZ QUARTZ Francolite (m) FRANCOLITE
Wavellite } ( ) Wavellite (tr.) Crandallite tr.
QUARTZ SMECTITE QUARTZ
Francolite } FRANCOLITE Dolomite (tr.) Albite } K feldspar K feldspar (tr.)
SMECTITE QUARTZ QUARTZ Francolite } (t ) FRANCOLITE Dolomite r. K feldspar (m)
Albite (tr.)
FRANCOLITE A-VALUES (±0.003 ANGSTROMS)
+20 mesh -20 +200 mesh
9.353 9.353
9.337 9.333
9.338 9.334
SCREEN DATA (IN PERCENT)
-2 JLm
FRANCOLITE Kaolinite (m) Crandallite (tr.)
SMECTITE Francolite (m) Kaolinite (tr.)
SMECTITE Illite (m) Fra~c~lite } (tr) Sep1ohte ·
-200 mesh
9.361
9.344
9.337
0 ~ 100
-
.... ~ .. :::·.:.:1'''1 :-.:: • •. • • •• •f t • e • "• • •• 1 • • :• • • •
0 • I
0
• .·.1-----t
jfJ;.:_··_::_. · .. ·.:.·::::<: ::.··:·.:.·:.·<.I.

-n fE c ; • ~ w Cll
Depth (feet)
0-2
2-15
15-16
16-22
22-25
25-29
Sample No.
None
None
None
17-84
18-84
19-84
Lithology
OVERBURDEN Cl)
Sand, gray, organic. .iii 0 a. Q)
0
Sand, white, unconsoli-8 n:l ...
dated. Tan and slightly ~ clayey at base.
Sharp, irregular contact.
Clay, gray green, leached. Some fragments of cemented sand.
c 0
·.;::; n:l
E MATRIX 0
LL.
~ Sand, slightly clayey, tan gray, leached with a: soft white phosphate. Q)
(J n:l Q)
ll.. Sand, gra~, pebbly, ~lightly b. clayey. hosphate ts ::1
mostly black. e <.!) c 0
.r;
~ n:l
:::r: Sharp contact.
Sand, clayey, gray green, bedded with some pebble. Yellow dolomite in pit bottom.
EXPLANATION
Ell Plus 20-mesh
Age and Stratigraphy
HOLOCENE
PLEISTOCENE
MIOCENE-PLIOCENE Bone Valley
Member
MIOCENE Undifferentiated
t:·-~.:::::··::(:·:·:j Minus 20- plus 200-mesh ~Minus 200-mesh
...,. 00
~ ~ ll.. ~
~
...,. 00 00 .... ~ ll.. ~
~
...,. 00
~ ~ ll.. ~
~
SAMPLE NO.
17-84
18-84
19-84
SAMPLE NO.
17-84
18-84
19-84
+20 mesh
QUARTZ Franco!ite } (m) Wavelhte
FRANCOLITE QUARTZ
FRANCOLITE Quartz (m) Dolomite } ( ) K feldspar tr.
Bulk Sample
9.348
9.330
9.335
Mineralogy (Screen size)
-20 +200 mesh -200 mesh
QUARTZ QUARTZ Francolite (m) Francolite } Smectite } Wavellite (tr.) Wavellite (tr.)
Crandallite
SMECTITE QUARTZ QUARTZ Francolite } (tr) Francolite } (m) K feldspar . · K feldspar
Crandallite (tr.)
QUARTZ QUARTZ Smectite } Francolite } (tr) Francolite (m)
Kfeldspar K feldspar · Kaolinite (tr.)
FRANCOLITE A-VALUES (±0.003 ANGSTROMS)
+20 mesh -20 +200 mesh
9.368 9.343
9.339 9.348
9.332 9.350
SCREEN DATA (IN PERCENT)
-2~m
SMECTITE WAVELLITE QUARTZ Kaolinite J (m) Illite Francolite (tr) K feldspar ·
SMECTITE lllite(m) Kaolinite } Francolite (tr.)
SMECTITE Kaolinite } ( ) Illite m Albite (tr.)
-200 mesh
9.346
9.342
9.350
0 ~ 100
I I I I II ~;i~.:iff;~;;;}:i:~i:(?·i;.-:·.j . .,,. Figure 12. C.F. Hardee complex. SE1ANW1A sec. 5, T. 33 S., R. 24 E., Polk and Hardee Counties.
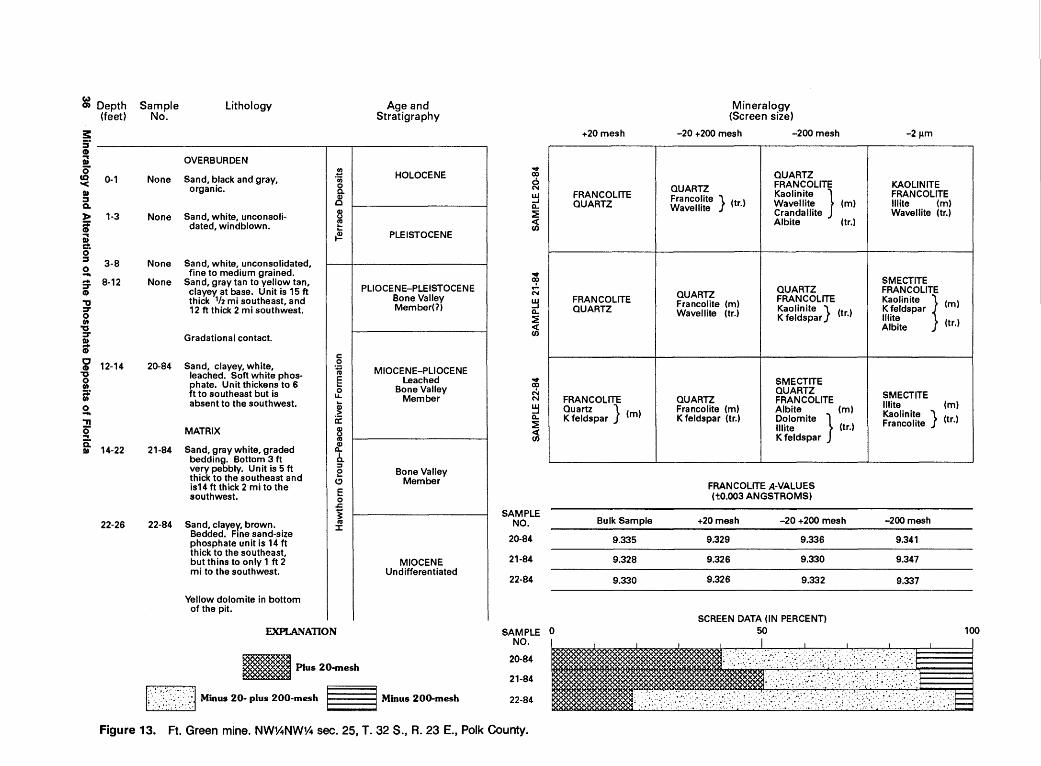
~ Depth (feet)
s:: s· CD ; 0
CQ '< I» ::J Q.
)>
;: ; ... cs· ::J
2. ... ::T CD "tJ ::T 0 0 , ::T I» ; c CD , 0 0
;: 2. "TI 0 .. a: I»
0-1
1-3
3-8
8-12
12-14
14-22
22-26
Sample No.
None
None
None
None
20-84
21-84
22-84
Lithology
OVERBURDEN !!
Sand, black and gray, ·;;; 0 organic. c. Q) c
Sand, white, unconsoli- ~ E dated, windblown. .!
Sand, white, unconsolidated, fine to medium grained.
Sand, gray tan to yellow tan, clayey at base. Unit is 15ft thick 1f2 mi southeast, and 12ft thick 2 mi southwest.
Gradational contact.
c Sand, clayey, white, 0
iO leached. Soft white phos- § phate. Unit thickens to 6 0 ft to southeast but is LL
absent to the southwest. ~ a: MATRIX Q)
(J Cll
Sand, gray white, graded £ bedding. Bottom 3 ft 6.
::J very pebbly. Unit is 5 ft e thick to the southeast and (!) is14 ft thick 2 mi to the c southwest. 0
.r:.
~ Sand, clayey, brown .. Cll
:I: Bedded. Fme sand-s1ze phosphate unit is 14ft thick to the southeast, but thins to only 1 ft 2 mi to the southwest.
Yellow dolomite in bottom of the pit.
EXPLANATION
1m Plus 20-mesh
Age and Stratigraphy
HOLOCENE
PLEISTOCENE
PLIOCENE-PLEISTOCENE Bone Valley Member(?)
MIOCENE-PLIOCENE Leached
Bone Valley Member
Bone Valley Member
MIOCENE Undifferentiated
jr·-.::::_:~:-:r~.:·:.J Minus 20- plus 200-mesh ~ Minus 200-mesh
oo:t co 6 N
~ 0.. ~
~
oo:t
~ N
~ 0.. ~
~
~ N N
~ 0.. ~
~
SAMPLE NO.
20-84
21-84
22-84
SAMPLE NO.
20-84
21-84
22-84
Figure 13. Ft. Green mine. NW1ANWV.. sec. 25, T. 32 S., R. 23 E., Polk County.
+20 mesh
FRANCOLITE QUARTZ
FRANCOLITE QUARTZ
FRANCOLITE Quartz } K feldspar (m)
Bulk Sample
9.335
9.328
9.330
Mineralogy (Screen size)
-20 +200 mesh -200 mesh
QUARTZ
QUARTZ FRANCOLITE
Franco!ite } (tr) Kaolinite } Wavellite (m) Wavelhte · Crandallite Albite (tr.)
QUARTZ QUARTZ FRANCOLITE Francolite (m) Kaolinite } ( ) Wavellite (tr.) K feldspar tr.
SMECTITE QUARTZ
QUARTZ FRANCOLITE Francolite (m) Albite (m) K feldspar (tr.) Dolomite }
Illite (tr.) K feldspar
FRANCOLITE A-VALUES ('t0.003 ANGSTROMS)
+20 mesh -20 +200 mesh
9.329 9.336
9.326 9.330
9.326 9.332
SCREEN DATA (IN PERCENT)
-2fJ.m
KAOLINITE FRANCOLITE Illite (m) Wavellite (tr.)
SMECTITE FRANCOLITE
K feldspar Kaolinite } (ml
Illite Albite (tr.)
SMECTITE Illite (m) Kaolinite } Francolite (tr.)
-200 mesh
9.341
9.347
9.337
0 50 100
-''1 ... :.: ·.·. ~--~- .. ···>: .. ·. ::,:.·:,. :· . .y; . _-:. ;' ·-:~~:·;.·'·:·:}:·:~;·:! . . .. ·::.~·-:- ·:·. :_. ... ·:.· :- ·:.: :: -~·:. ~<· ... : ··.; --~-~: ... -:-. . . . : .. · .. .. -:· ..... · . ····.: .. "; ·. ·. ·. · .... ·1
. : .;::~: . :/;_·_ ':}:'.: .. ·<:::::: .:·:· ... ::;_·:~ _::·_·. :~·:··:·::_·:::·:·~:·: .. ·~~:. : .. < .. ::·:·::·: .:>' ::·._,:\._:. ·-:~:; ·.· :::·.'
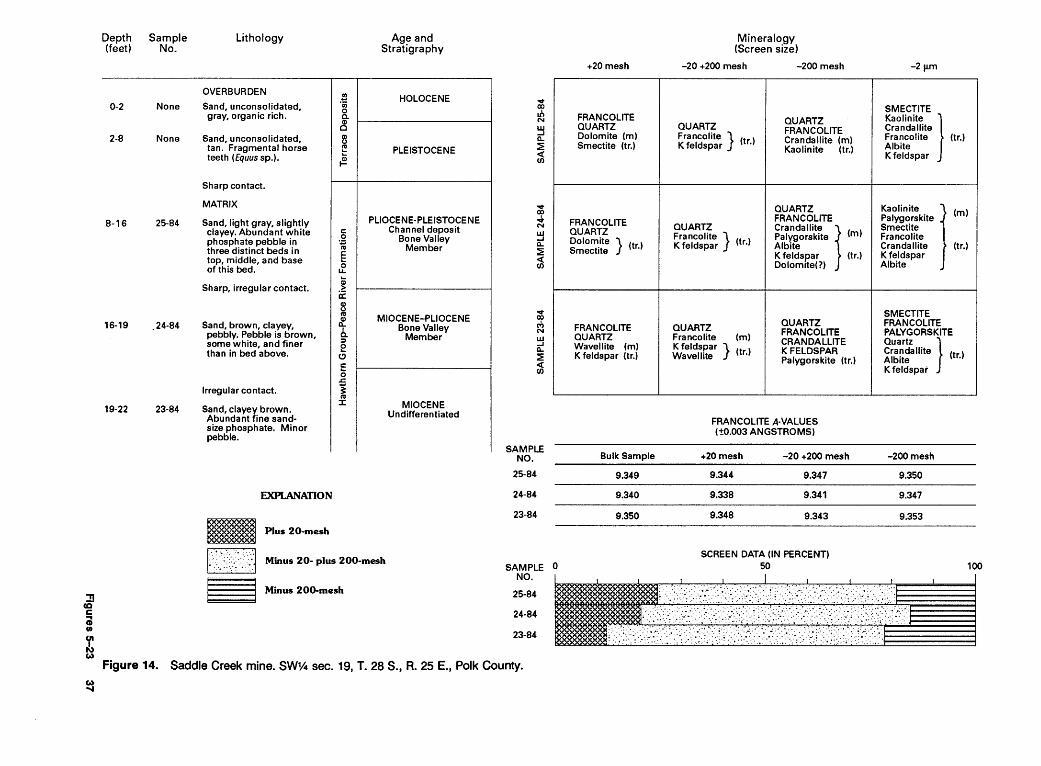
"11 cO c (; 0
~ w
w .....
Depth (feet)
0·2
2-8
8-16
16-19
19-22
Sample No.
None
None
25-84
.24-84
23-84
Lithology
OVERBURDEN
Sand, unconsolidated, gray, organic rich.
Sand, unconsolidated, tan. Fragmental horse teeth (Equus sp.).
Sharp contact.
MATRIX
Sand, light gray, slightly clayey. Abundant white phosphate pebble in three distinct beds in top, middle, and base of this bed.
Sharp, irregular contact.
Sand, brown, clayey, pebbly. Pebble is brown, some white, and finer than in bed above.
Irregular contact.
Sand, claye~ brown. Abundant ine sand-size phosphate. Minor pebble.
EXPLANATION
~~~ Plus 20-mesh
~ "iii 0 c. (I) 0
~ ~
~
c: .~ iQ E 0
LL
a; > a: (I) () Ill (I) a.. 0. :::1
e C)
c: 0 .c: j Ill
::r:
Age and Stratigraphy
HOLOCENE
PLEISTOCENE
PLIOCENE-PLEISTOCENE Channel deposit
Bone Valley Member
MIOCENE-PLIOCENE Bone Valley
Member
MIOCENE Undifferentiated
1;·:: .. ·:\)::.'·J Minus 20- plus 200-mesh
~ Minus 200-mesh
..,. CXl .;, N
~ a.. ~ <( fJ)
..,. CXl ..t N w ...J a.. ~ <( fJ)
..,. CXl cJ> N
w ...J a.. ~ <( fJ)
SAMPLE NO.
25-84
24-84
23-84
SAMPLE NO.
25-84
24-84
23-84
Figure 14. Saddle Creek mine. SWY4 sec. 19, T. 28 S., R. 25 E., Polk County.
+20 mesh
FRANCOLITE QUARTZ Dolomite (m) Smectite (tr.)
FRANCOLITE QUARTZ Dolom.ite } (tr.) Smect1te
FRANCOLITE QUARTZ Wavellite (m) K feldspar (tr.)
Bulk Sample
9.349
9.340
9.350
Mineralogy (Screen size)
-20 +200 mesh
QUARTZ Francolite } K feldspar (tr.)
QUARTZ Francolite } K feldspar (tr.)
QUARTZ Francolite (m) K feldspar } Wavellite (tr.)
-200 mesh
QUARTZ FRANCOLITE Crandallite (m) Kaolinite (tr.)
QUARTZ FRANCOLITE Crandallite } Palygorskite Albite K feldspar Dolomite(?)
QUARTZ FRANCOLITE CRANDALLITE
(m)
(tr.)
K FELDSPAR Palygorskite (tr.)
FRANCOLITE A-VALUES (±0.003 ANGSTROMS)
+20 mesh -20 +200 mesh
9.344 9.347
9.338 9.341
9.348 9.343
SCREEN DATA (IN PERCENT)
-2 Jim
SMECTITE
Crandallite Kaolinite }
Francolite Albite
(tr.)
K feldspar
Kaolinite Palygorskite Smectite Francolite Crandallite K feldspar Albite
j (m)
(tr.)
SMECTITE FRANCOLITE PALYGORSKITE
Crandallite (tr) Quartz }
Albite · K feldspar
-200 mesh
9.350
9.347
9.353
0 ~ 100
-~~~~~'I ;:;·: :·. :: .~,: .;r; .. :. ·~ ;:,?i:::~·,·::::?: ,:~r;::.i~ i::~·; :~;.- ~:,::1 ) I
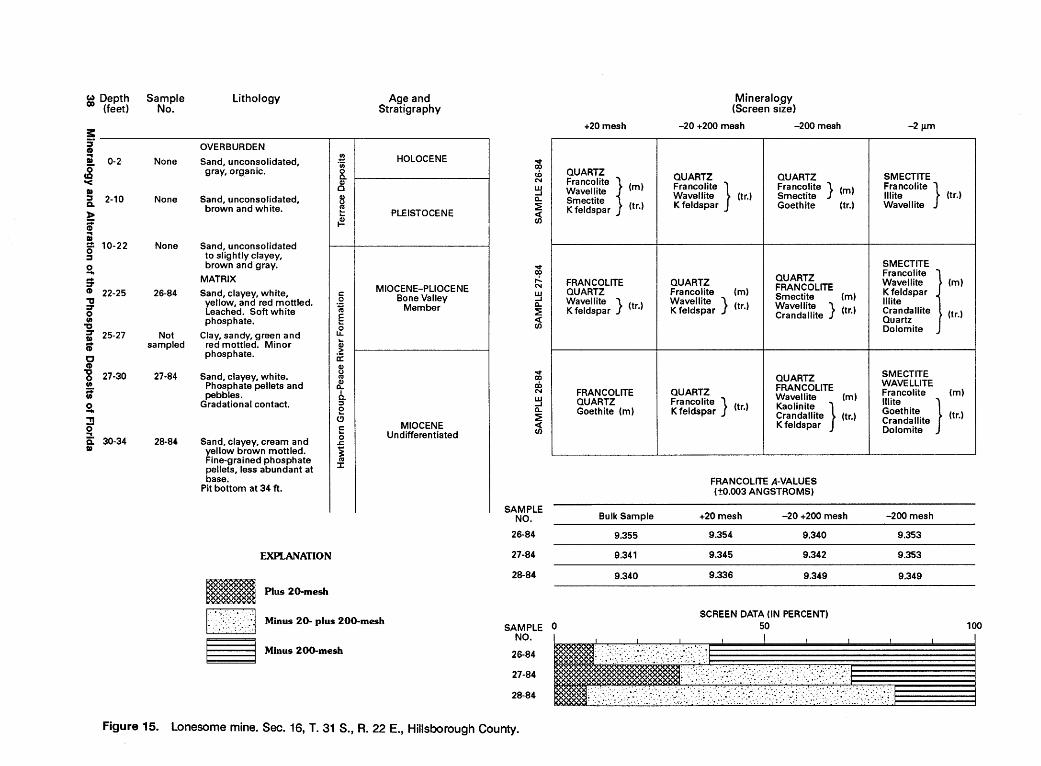
w Depth 00 (feet)
s:: :;· .,. ... Q)
0 CQ
"< Q) ::s Q.
~ ; ! c;· ::s 2. .. '::r .,. "'0 '::r 0 en , '::r
i c .,. , 0
~ en 2. ., Q a: Q)
0-2
2-10
10-22
22-25
25-27
27-30
30-34
Sample No.
None
None
None
26-84
Not sampled
27-84
28-84
Lithology
OVERBURDEN
Sand, unconsolidated, gray, organic.
Sand, unconsolidated, brown and white.
Sand, unconsolidated to slightly clayey, brown and gray.
MATRIX
Sand, clayey, white, yellow, and red mottled. Leached. Soft white phosphate.
Clay, sandy, green and red mottled. Minor phosphate.
Sand, clayey, white. Phosphate pellets and pebbles.
Gradational contact.
Sand, clayey, cream and ~ellow brown mottled.
ina-grained phosphate pellets, less abundant at base.
Pit bottom at 34 ft.
EXPLANATION
~ Plus 20-mesh
~ 'iii 0 c. Q)
0
B E ~
c:: .~ iii E 0 u.. Q; > a: Q) () Ill Q)
0.. o_ :::1
e C)
c:: 0
.r::.
~ Ill
::1:
Age and Stratigraphy
HOLOCENE
PLEISTOCENE
MIOCENE-PLIOCENE Bone Valley
Member
MIOCENE Undifferentiated
, .. ~.·).·(·.·/~ Minus 20- plus 200-mesh
~ Minus 200-mesh
...,. co cb N
w ..J 0.. ~ <( en
...,. co ...:. N
~ 0.. ~ <( en
...,. co 00 N
~ 0.. ~
~
SAMPLE NO.
26-84
27-84
28-84
+20 mesh
QUARTZ F"ncolite ~ 1 1 Wavellite m Smectite K feldspar (tr.)
FRANCOLITE QUARTZ Wavellite } K feldspar (tr.)
FRANCOLITE QUARTZ Goethite (m)
Bulk Sample
9.355
9.341
9.340
Mineralogy (Screen size)
-20 +200 mesh -200 mesh
QUARTZ QUARTZ Francolite } Francolite } ( ) Wavellite (tr.) Smectite m K feldspar Goethite (tr.)
QUARTZ QUARTZ
Francolite (m) FRANCOLITE
Wavellite } Smectite (m) K feldspar (tr.) Wavellite }
Crandallite (tr.)
QUARTZ
QUARTZ FRANCOLITE
Francolite } Wavellite (m)
K feldspar (tr.) Kaolinite } Crandallite (tr.) K feldspar
----
FRANCOLITE A-VALUES (t0.003 ANGSTROMS)
+20 mesh -20 +200 mesh
9.354 9.340
9.345 9.342
9.336 9.349
SCREEN DATA (IN PERCENT)
-2J.Lm
SMECTITE Francolite } Illite (tr.) Wavellite
SMECTITE
Francolite l Wavellite (m) K feldspar Illite Crandallite (t ) Quartz r. Dolomite
SMECTITE WAVELLITE Francolite (m)
tllite } Goethite Crandallite (tr.) Dolomite
-200 mesh
9.353
9.353
9.349
SAMPLE 0 50 100
2::, -:::;j I I : I I I I ::::: ~-:_ .. ::._---;:·;;3;. __ :_i_{.'i.(:' .. _.-;.;:1_-,_._ :•-~--·1
Figure 15. lonesome mine. Sec. 16, T. 31 S., R. 22 E., Hillsborough County.
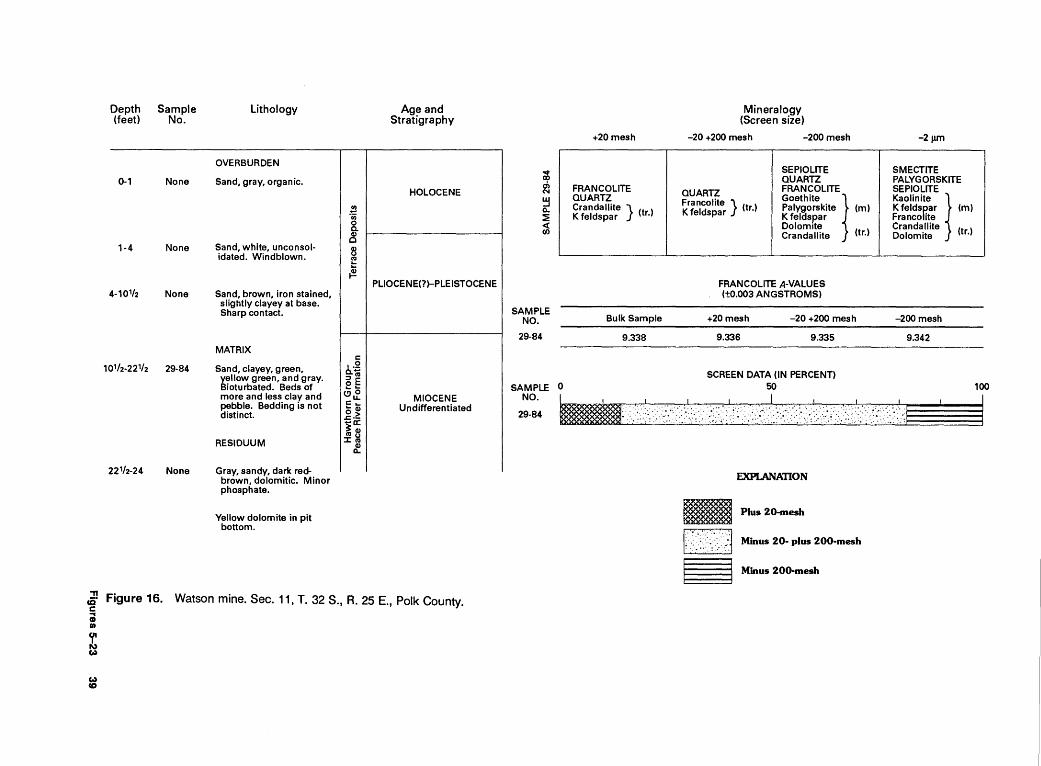
Depth (feet)
221/2-24
Sample No.
None
Lithology
Gray, sandy, dark redbrown, dolomitic. Minor phosphate.
Yellow dolomite in pit bottom.
!! 'iii 0 a. Q)
c B ~
~
c:
o.·g ::s"' oE ...... (,!)0
LL c: ... ... Q) 0> -=·-ja: ~~
Q) 0..
Age and Stratigraphy
HOLOCENE
PLIOCENE(?)-PLEISTOCENE
MIOCENE Undifferentiated
~ Figure 16. Watson mine. Sec. 11, T. 32 S., R. 25 E., Polk County. c Cil , ~ w
w CD
• co a, N
~ 0.. :::2:
~
SAMPLE NO.
29-84
SAMPLE NO.
29-84
+20 mesh
FRANCOLITE QUARTZ Crandallite } (tr) K feldspar ·
Bulk Sample
9.338
Mineralogy (Screen size)
-20 +200 mesh -200 mesh
SEPIOLITE QUARTZ
QUARTZ FRANCOLITE
Francolite } (tr) Goethite ~ Palygorskite (m) K feldspar · K feldspar Dolomite Crandallite (tr.)
FRANCOLITE A-VALUES (±0.003 ANGSTROMS)
+20 mesh -20 +200 mesh
9.336 9.335
SCREEN DATA (IN PERCENT)
-2 JUTl
SMECTITE PALYGORSKITE SEPIOLITE
Kaolinite 1 K feldspar (m) Francolite Cranda.llite (tr) Dolom1te •
-200 mesh
9.342
0 ~ 100
., : ' .• p.:~:_·.' ..•. ·;·,:'· • __ ,-~_.,._.'.' . .-:.::.'·.·.·.-/::! I I
EXPLANATION
~~~~ Plus 20-mesh
1."/.':\~:~::.:·:J Minus 20- plus 200-mesh
~ Minus 200-mesh

~Depth (feet)
s:: S" CD ; 0
CQ "< It :s a. )> ; ; .. 0 :s
2. :;: CD ., :r 0 fl) , :r It i c CD
'8 0
if 2. "'" ~ a. It
0-4
4-11
1 1-18
18-22
22-31
31-33
Sample No.
None
None
None
31-84
30-84
30A-84
Lithology
OVERBURDEN B-~ Sand, gray, and white, cuCil
unconsolidated. Top 1 .... o '-Q.
ft of sand is black and ~~ highly organic 1 mi northeast.
Sand, clayey white, contains abundant round, vesicular boulders of sandstone cemented by aluminum phosphates. Bed is missing 1 mi north-east and is a gray clayey sand.
Sand, gray, clayey, c:: leached. Zone is 4ft of .g vesicular aluminum cu
phosphate 1 mi north- E 0 east. Zone is underlain LL
by 2-ft intervals that ~ contain soft white
phosphate pebbles. a: B cu Q)
ll..
0. MATRIX ~
e (!)
Sand, gray and white, E pebbly. Zone is 2 ft 0
thick 1 mi northeast. .c:: i cu
Sand, clayey, gray-green and rust mottled. Fine-
J:
grained phosphate pellets. Bed is 10ft thick 1 mi northeast and rests on yellow dolomite.
RESIDUUM
Clay, very sandy, brown. Some fine-grained phos-phate pellets. Absent 1 mi northeast.
EXPLANATION
Bl Plus 20-rnesh
Age and Stratigraphy
PLEISTOCENE and HOLOCENE
MIOCENE-PLIOCENE Leached
Bone Valley Member
Bone Valley Member
MIOCENE Undifferentiated
1>.::.':'_-:t:::~J Minus 20- plus 200-mesh ~ Minus 200-mesh
..... op c;; w -l ll.. ~
~
..... 00
g ~ a.. ~ <( en
..... 00
~ ~ ll.. ~
~
SAMPLE NO.
31-84
30-84
30A-84
SAMPLE NO •
31-84
30-84
30A-84
Figure 17. Phosphoria mine. SE1A sec. 12, T. 31 S., R. 23 E., Polk County.
+20mesh
FRANCOLITE QUARTZ
FRANCOLITE Quartz (m) K feldspar (tr.)
FRANCOLITE Quartz (m) Smectite } Palygorskite (m)
Bulk Sample
9.342
9.345
9.336
Mineralogy (Screen size)
-20 +200 mesh -200 mesh
QUARTZ FRANCOLITE
QUARTZ Smectite ~ FRANCOLITE Crandallite (m)
Kaolinite K feldspar (tr.)
QUARTZ QUARTZ Smectite ~ Francolite } Francolite (m) K feldspar (tr.) Kfeldspar-
Crandallite (tr.)
QUARTZ QUARTZ Smect~ 1 FRANCOLITE Albite (m) K feldspar (m) Francolite Dolomite (tr.) Crandallite
Palygorskite (tr.)
FRANCOLITE A-VALUES (±0.003 ANGSTROMS)
+20mesh -20 +200 mesh
9.338 9.347
9.345 9.347
9.336 9.337
SCREEN DATA (IN PERCENT)
-2f.Ull
Smectite j Francolite (m) Albite Wavellite (tr.) Illite
SMECTITE
Kaolinite I Illite Crandallite Francolite (tr.) Albite K feldspar Dolomite
SMECTITE
Illite } Palyorskite Goethite (tr.) Francolite Albite
-200mesh
9.355
9.352
9.355
0 ~ 100
• ,,1:'''1 ii!i;,\;:1);/J~r\\;:;;,!rt\'-::ilr_/ii~~( .. :-:(:' >I
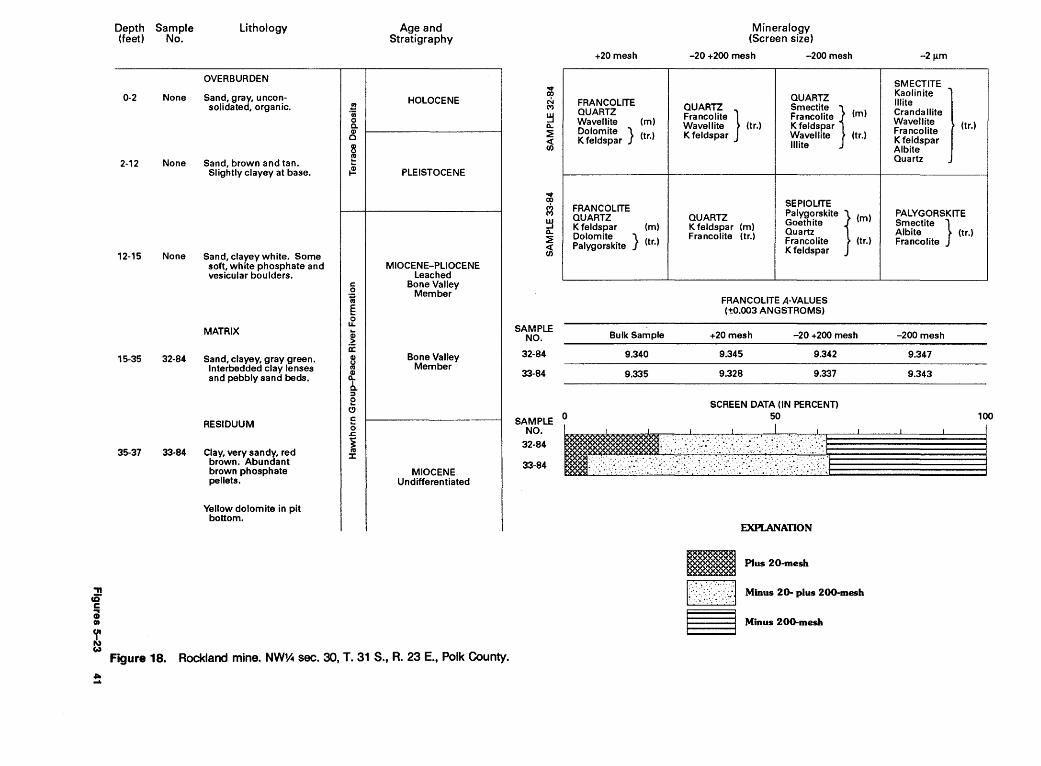
'TI ~ c ; tit
~ w
.. ....
Depth Sample (feet) No.
Lithology
OVERBURDEN
0-2 None Sand, gray, uncon-solidated, organic.
2-12 None Sand, brown and tan. Slightly clayey at base.
12-15 None Sand, clayey white. Some soft, white phosphate and vesicular boulders.
MATRIX
15-35 32-84 Sand, clayey, gray green. Interbedded clay lenses and pebbly sand beds.
RESIDUUM
35-37 33·84 Clay, very sandy, red brown. Abundant brown phosphate pellets.
Yellow dolomite in pit bottom.
~ ·; 0 a. Q)
Q
8 E
~
c: .g «<
e 0 u.
~ a: ~ «< Q)
Cl..
b. ::I
E C)
c: 0 .r:.
~ «< :I:
Age and Stratigraphy
HOLOCENE
PLEISTOCENE
MIOCENE-PLIOCENE Leached
Bone Valley Member
Bone Valley Member
MIOCENE Undifferentiated
Figure 18. Rockland mine. NWV.. sec. 30, T. 31 S., R. 23 E., Polk County .
... co r:., ("I)
w ..J Cl.. ::E ~
... co
~ ~ Cl.. ::E ~
SAMPLE NO.
32-84
33-84
SAMPLE NO .
32-84
33-84
+20 mesh
FRANCOLITE QUARTZ Wavellite (m) Dolomite } (tr.) K feldspar
FRANCOLITE QUARTZ K feldspar (m) Dolomite } (tr ) Palygorskite ·
Bulk Sample
9.340
9.335
Mineralogy (Screen size)
-20 +200 mesh -200 mesh
QUARTZ QUARTZ Smectite } F"'ncolite } Francolite (m) Wavellite (tr.) K feldspar K feldspar Wavellite (tr.)
Illite
SEPIOLITE Palyg~rskite } (ml QUARTZ Goethrte K feldspar (m) Quartz Franco lite (tr.) Francolite (tr.) K feldspar
FRANCOLITE A-VALUES (t0.003 ANGSTROMS)
+20 mesh -20 +200 mesh
9.345 9.342
9.328 9.337
SCREEN DATA (IN PERCENT)
-2JLm
SMECTITE
Kaolinite ) Illite Crandallite Wavelli~e (tr.) Francolite K feldspar Albite Quartz
PALYGORSKITE Smectite } Albite (tr.) Francolite
-200 mesh
9.347
9.343
0 00 100 ._,,,,,,,1 ;;;.-.·: :: ·::: ·:·~···. ~\·'· :·:<.:\}1
EXPLANATION
.. Plus 20-mesh
~~·.· .. ~.:·.:~ ... :t:·::.:J Minus 20- plus 200-mesh
~ Minus 200-mesh
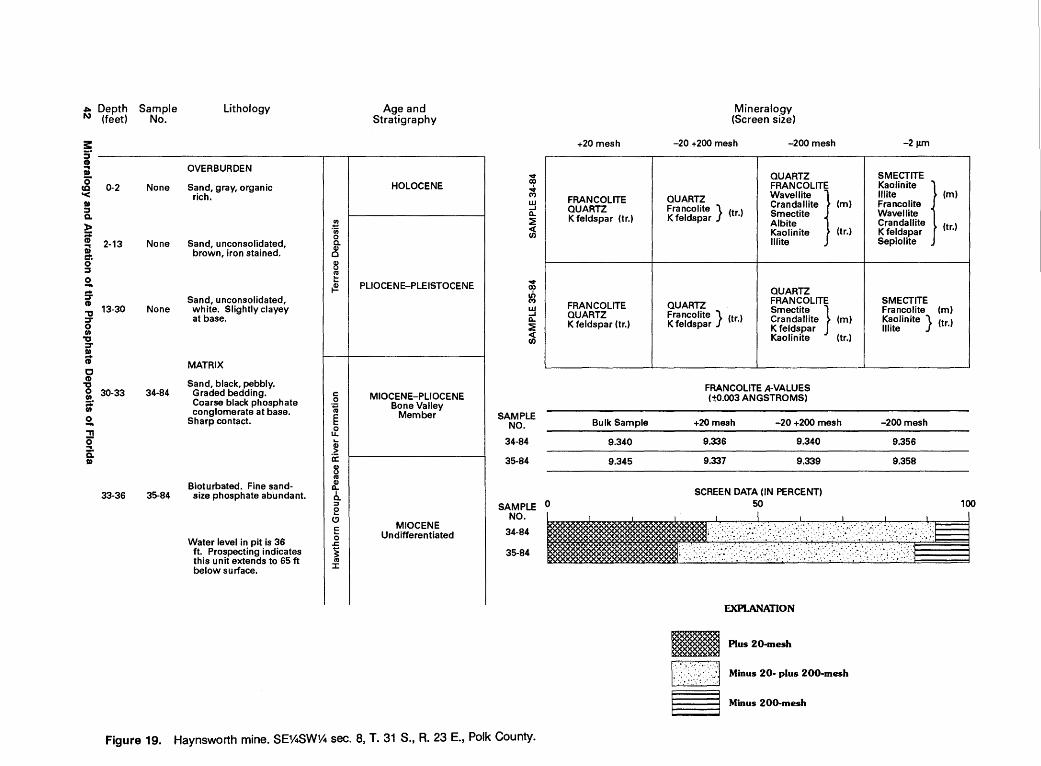
,. Depth Sample N (feet) No.
s:: s· CD ; 0
c.a '< I» :s Q.
)>
~ ~ 0 :s
2. :;: CD "tl ::T 0 0 ., ::T I» ; i' ., 0 0 ;::; 0
2. "T1
~ a: I»
0-2 None
2-13 None
13-30 None
30-33 34-84
33-36 35-84
Lithology
OVERBURDEN
Sand, gray, organic rich.
Sand, unconsolidated, brown, iron stained.
Sand, unconsolidated, white. Slightly clayey at base.
MATRIX
Sand, black, pebbly . Graded bedding. Coarse black phosphate conglomerate at base.
Sharp contact.
Bioturbated. Fine sand-size phosphate ab·undant.
Water level in pit is 36 ft. Prospecting indicates this unit extends to 65ft below surface.
~ ·;; 0 a. Cl)
0
B ~
~
c:: 0
·.;::::;
"' E 0 u.
~ a: 8 "' Cl) 0..
0. ::3
e (.!)
c:: 0
..c:: ~ "' ::I:
Age and Stratigraphy
HOLOCENE
PLIOCENE-PLEISTOCENE
MIOCENE-PLIOCENE Bone Valley
Member
MIOCENE Undifferentiated
I
..,. co ..t ('I)
~ 0.. ~
~
..,. co .;, ('I)
~ 0.. ~ <( (/)
SAMPLE NO.
34-84
35-84
+20 mesh
FRANCOLITE QUARTZ K feldspar (tr.)
FRANCOLITE QUARTZ K feldspar (tr.)
Bulk Sample
9.340
9.345
Mineralogy (Screen size)
-20 +200 mesh -200 mesh
QUARTZ FRANCOLITE
QUARTZ Wavellite 1 Francolite } Crandallite (m) K feldspar (tr.) Smectite
Albite Kaolinite (tr.) Illite
QUARTZ
QUARTZ FRANCOLITE
Francolite } (tr) Smectite } K feldspar · Crandallite (m)
K feldspar Kaolinite (tr.)
FRANCOLITE A-VALUES (±0.003 ANGSTROMS)
+20mesh -20 +200 mesh
9.336 9.340
9.337 9.339
SCREEN DATA (IN PERCENT)
-2J.Ull
SMECTITE
Kaolinite l Illite (m) Francolite Wavellite Crandallite (tr 1 K feldspar · Sepiolite
SMECTITE Francolite (m) K~olinite } (tr) Illite ·
-200 mesh
9.356
9.358
SAMPLE 0 50 100
NO. -1 1. 1 1 1 I~ 34-84 . . . :·:·_:::=._:::.·:_:~;-~.··::·~.:·::.:::=:···;. :-.~- ·~-:; :}:;_:._:::'·:_>_:: :.:l:>: ~-.: .. · .. : :.- ·-.:~.; :_::_;.: as.s• ==== .. .. .. ;. . . . . 1 . . : : . . . - - . •, ... : . . . .. : . . . . ·.• .' ... .'. . . . . .. ~ ·.: : . . . . .. .
EXPLANATION
~~~~ Plus 20-mesh
, .... ~.':(:X:.:·:)} Minus 20· plus 200-mesh
~ Minus 200-mesh
Figure 19. Haynsworth mine. SEY..SWY.. sec. 8, T. 31 S., R. 23 E., Polk County.

"TI <E" c ~
CD (I)
~ (,.)
ol:a (,.)
Depth Sample {feet) No.
Lithology
OVERBURDEN
0-16 None Sand, unconsolidated, gray at top, white and brown below. Slightly clayey at base.
MATRIX
16-26 37-84 Sand, clayey, brown and gray. Abundant sand-size, brown, cream, and gray phosphate pellets. Some pebble. Unit is missing 1 mi southwest. Top is leached.
26-32 36-84 Clay, sandy, red and green mottled, some pebble. Yellow and dolomitic at base. Unit is tan, brown, and red, and is bioturbated 1 mi southwest. Rests on hard yellow dolomite.
!l 'iii 0 c. ~ s ~
~
c: .~ n; E 0
LL
~ a: CD CJ ell CD
ll..
b. ::J
e Cl c: 0
.r::. j ell J:
Age and Stratigraphy
PLEISTOCENE and
HOLOCENE
MIOCENE-PLIOCENE Bone Valley
Member
MIOCENE Undifferentiated
..... co ...:. M
~ ll.. ~ <( (/)
..... co cb M
~ ll.. ~
~
SAMPLE NO.
37-84
36-84
+20 mesh
QUARTZ Francolite (m) Wavellite } K feldspar (tr.) Palygorskite
FRANCOLITE QUARTZ K feldspar (tr.)
Bulk Sample
9.346
9.345
Mineralogy {Screen size)
-20 +200 mesh -200 mesh
QUARTZ FRANCOLITE
QUARTZ Crandallite } (m) Francolite (m) Albite K feldspar (tr.) Kaolinite
Smectite (tr.) Wavellite
QUARTZ FRANCOLITE PALYGORSKITE
QUARTZ Smectite l KFELDSPAR Goethite (m)
Francolite (m) Dolomite K feldspar Wavellite (tr.) Sepiolite
FRANCOLITE A-VALUES (t0.003 ANGSTROMS)
+20 mesh -20 +200 mesh
9.344 9.340
9.346 9.339
SCREEN DATA (IN PERCENT)
-2JUll
SMECTITE Palygorskite1 Albite (m) Francolite K feldspar Crandallite (tr.)
1
SMECTITE PALYGORSKITE Sepiolite (m) Dolomite } Francolite (tr.) Crandallite
-200mesh
9.345
9.348
SAMPLE 0 50 100
NO ... I I I I I I I I :~:: ~_. ;(· , ·: ;:)\";. /( ... ·; · __ :·_:·.,;·;.:.~:;~~-'. ·' .... ··:,;·( ,J
EXPLANATION
~~~~ Plus 20-mesh
j:·~.·:' ... :(:.:·.;d Minus 20· plus 200-mesh
§§ Minus 200-mesh
Figure 20. Lonesome mine. NEV.. sec. 16, T. 31 S., R. 22 E., Hillsborough County.

t Depth Sample (feet) No.
i: s· CD ; ;g '< • :::J a. ~ S' ; ... c;· :::J
2. g. CD ., :::T 0 II)
"tJ :::T
i c CD
"tJ 0 II)
:::+ II)
2. ., 0 .. a: •
0-14 None
14-17 41-84
17-23 40-84
23-29 39-84
29-35 38-84
Lithology
OVERBURDEN
Sand, white, unconsolidated. Sand is only 3ft thick 1 mi east and is overlain by 4ft of swamp muck .
MATRIX
White pebbly sand, slightly clayey. Unit not present at section 1 mi east.
c:
~ "' Sand, pebbly, gray-green, e
clayey. Coarse phosphate 0 at base. A graded bed is LL
same thickness and lith- Q; ology at the mine section > a: 1 mi east. Sample 40-84 G)
is a composite from both (.)
"' localities. Q,) a.. o_ ::1
E Sand, clayey mottled gray Cl
and red-brown. Dolomitic. c:
Fine-sand size phosphate 0 .t::
more abundant than coarse ~ phosphate. Upper contact "' sharp and irregular. Unit 4 ::c ft thick at section 1 mi east.
Clay, very sandy, brown. Sand-size brown phosphate. Minor fine pebble size. Unit not present at section 1 mi east.
Yellow dolomite in pit bottom.
FRANCOLITE A-VALUES (t0.003 ANGSTROMS)
Age and Stratigraphy
HOLOCENE Swamp deposit
PLEISTOCENE Terrace sands
MIOCENE-PLIOCENE leached
Bone Valley Member
Bone Valley Member
(Graded bedding)
MIOCENE Undifferentiated
SAMPLE Bulk Sample +20 mesh -20 +200 mesh -200 mesh NO.
41-84 9.334 9.332 9.336 9.343
40-84 9.332 9.333 9.335 9.345
39-84 9.332 9.328 9.329 9.335
38-84 9.338 9.332 9.332 9.338
..,. ~ ..,. ~ a.. ~ <( en
..,. (X)
~ w __, a.. ~ <( en
..,. (X)
~ w __, a.. ~ <( en
..,. (X)
~ w __, a.. ~ <( en
+20 mesh
FRANCOLITE QUARTZ K feldspar (m)
FRANCOLITE Quartz (m) K feldspar } r Palygorskite (t .)
FRANCOLITE Quartz } K feldspar (m) Dolomite Palygorskite (tr.)
QUARTZ Francolite (m) K feld~par } (tr) Smect1te ·
SAMPLE 0 NO.
41-84
40-84
39-84
38-84 ~·.
-20 +200 mesh
QUARTZ Francolite (m) K feldspar (tr.)
QUARTZ Francolite } K feldspar (tr.) Palygorskite
QUARTZ Francolite (m) K feldspar (tr.)
QUARTZ Francolite } K feldspar (tr.) Smectite
Mineralogy (Screen size)
-200 mesh
FRANCOLITE QUARTZ
Smect~e j K feldspar (m) Wavellite Crandallite Kaolinite (tr.) Illite Palygorskite
QUARTZ SMECTITE FRANCOLITE CRANDALLITE KFELDSPAR Albite } (tr) Palygorskite ·
QUARTZ DOLOMITE Francolite } Smectite Palygorskite (tr.) Goethite K feldspar
QUARTZ KFELDSPAR Smectite (m) Palygorskite } (t ) Francolite r.
SCREEN DATA (IN PERCENT) 50
EXPLANATION
-2J.Lm
SMECTITE KAOLINITE ILLITE FRANCOLITE Albite (tr.)
SMECTITE
~lomlre ) Kaolinite Illite Crandallite (tr.) Francolite Albite K feldspar
No clay sample
SMECTITE Palygorsklre } Goethite Quartz r Francolite (t .) Albite Wavellite
100
~~~ Plus 20-mesh k.~:·::::.<:<.J Minus 20· plus 200-mesh ~ Minus 200-mesh
Figure 21. Hookers Prairie mine. SE1ANE1A sec. 7, T. 31 S., R. 24 E., Polk County.

., ~ c ;; ., ~ w
.. Ul
Depth (feet)
0-14
14-19
19-23
23-35112
351h-37
37-43
Sample No.
None
44-84
Not sampled
43-84
Not sampled
42-84
Lithology
OVERBURDEN (I)
Sand, black at top, gray, "C c:
white, and brown below (0
and slightly clayey at en base. B
~
~
MATRIX
Sand, pebbly, dark gray to black. Phosphate pellets and pebbles, most black, some gray and brown.
c: 0
~ BEDROCK e
0 LL
Hard, fossiliferous, yellow Q) dolomite. Pebbles and > grains of phosphate. a: Upper contact sharp CD
0 and irregular. ftl
CD fl-
Sand, clayey, gray-green b. and blue. Laminated. :I
0 Sand-size phosphate (; pellets. Pebbly sand c: near middle. Rubble 0 zone of partly phos- .r:. phatized dolomite ~ nodules at base. ftl
J:
Very, sharp, irregular contact.
Yellow phosphatic dolomite.
Sand, gray brown. Fine sand-size phosphate pellets. Water level at 43ft.
EXPLANATION
am Plus 20-mesh
Age and Stratigraphy
PLEISTOCENE and
HOLOCENE
MIOCENE-PLIOCENE Bone Valley
Member
MIOCENE Undifferentiated
jr:·.~:.:\.::?:_::{j Minus 20- plus 200-mesh ~ Minus 200-mesh
..,. CX)
.,f. ..,. ~ fl-::':E <( en
..,. CX)
M ..,. ~ fl-::':E
~
..,. CX)
N ..,. ~ fl-::!E ~
SAMPLE NO.
44-84
43-84
42-84
+20 mesh
QUARTZ Francolite (m) K feldspar (tr.)
FRANCOLITE DOLOMITE Quartz (m) K feldspar (tr.)
FRANCOLITE KFELDSPAR Quartz (m) Wavellite (tr.)
Bulk Sample
9.340
9.336
9.336
Mineralogy (Screen size)
-20 +200 mesh -200 mesh
QUARTZ
QUARTZ SMECTITE
Francolite } FRANCOLITE K feldspar (tr.) Crandallite }
K feldspar (tr.) Dolomite
QUARTZ DOLOMITE
Francolite (m) Smectite } Dolomite } Quartz K feldspar (tr.) Goethite (tr.)
Francolite
SMECTITE QUARTZ
QUARTZ Palygorskite! Francolite (m) Francolite } Goethite K feldspar (tr.) Dolomite
K feldspar Wavellite (tr.) Crandallite
FRANCOLITE A-VALUES (!0.003 ANGSTROMS)
+20mesh -20 +200 mesh
9.332 9.330
9.324 9.332
9.328 9.335
SCREEN DATA (IN PERCENT)
-2 JLm
SMECTITE KAOLINITE FRANCOLITE lllite(m)
SMECTITE Illite } Dolomite (m) Kaolinite (tr.)
SMECTITE Francolite } Albite K feldspar Palygorskite (tr.) Illite Goethite I
I
-200mesh
9.327
9.333
9.349
SAMPLE 0 50 100
NO. II' I I i I I I I I :: ~· .:·.:·:.:·· ... ::_-··. ·:;~: :·~·:· ....... :::·:I 42-84 . ·.: .. ·.· ...... :· . .-;. -~ ·.· ·• -::..-~ :·.: :·-. .-.·. :_. .... · .·.· :·-.-.1
Figure 22. Four Corners mine. NWV..NWV.. sec. 2, T. 33 S., R. 22 E., Hillsborough County .
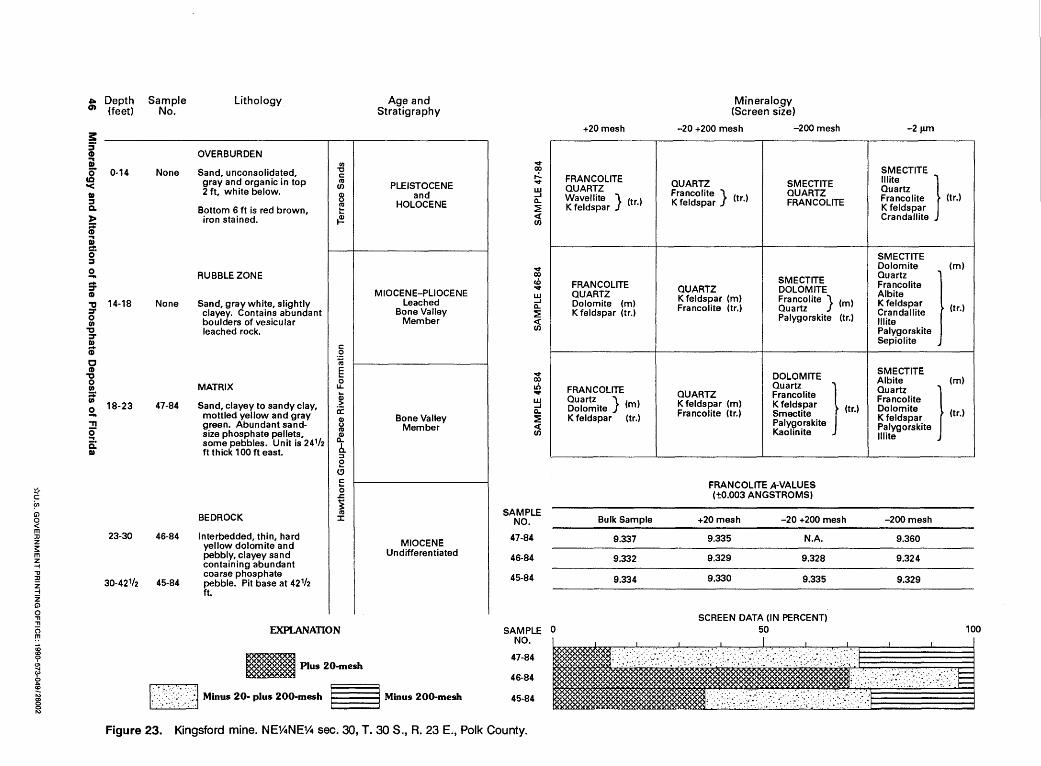
* c !:n c;) 0 < m ::0 z 3:: m z -t "'0 ::0 z -t z c;)
0 "11 "11 0 r':'
i8 ~
~ ~ 1\)
~ Depth O» (feet)
3: :;CD iil 0
cc '< I» ::r a. > i iil ~ 0 ::r
2. .. :::r CD "tJ :::r 0 0
"C ::T I» i c (I)
"C 0 0 ::; 0
2. -n [ c: I»
0-14
14-18
18-23
23-30
30-421/2
Sample No.
None
None
47-84
46-84
45-84
Lithology
OVERBURDEN Cl)
Sand, unconsolidated, 1:1 c:
gray and organic in top "' en 2ft, white below.
~ Bottom 6 ft is red brown, ~
iron stained. ~
RUBBLE ZONE
Sand, gray white, slightly clayey. Contains abundant boulders of vesicular leached rock.
c: .2 ~
E MATRIX
0 u.
Sand, clayey to sandy clay, ~ a= mottled yellow and gray Q)
green. Abundant sand- (J
size phosphate pellets, "' Q)
some pebbles. Unit is 241h 0....
b. ft thick 100ft east. :I
!: CJ c: 0
.s::.
~ BEDROCK "' :I:
Interbedded, thin, hard yellow dolomite and pebbly, clayey sand containing abundant coarse phosphate pebble. Pit base at 421/2 ft.
EXPLANATION
~~~~ Plus 20-mesh
Age and Stratigraphy
PLEISTOCENE and
HOLOCENE
MIOCENE-PLIOCENE Leached
Bone Valley Member
Bone Valley Member
MIOCENE Undifferentiated
1:·:.:./:.:~:·· .. \J Minus 20- plus 200-mesh ~Minus 200-mesh
..,. (X)
~ ..,. w ..J 0.... ~
~
..,. (X)
cb ..,. w ..J 0.... ~ <{ en
..,. (X)
.;., ..,. ~ 0.... ~
~
SAMPLE NO.
47-84
46-84
45-84
SAMPLE NO.
47-84
46-84
45-84
Figure 23. Kingsford mine. NEV4NE1A sec. 30, T. 30 S., R. 23 E., Polk County.
+20 mesh
FRANCOLITE QUARTZ Wavellite } (tr.) K feldspar
FRANCOLITE QUARTZ Dolomite (m) K feldspar (tr.)
FRANCOLITE Quartz. } (m) Dolomite K feldspar (tr.)
Bulk Sample
9.337
9.332
9.334
Mineralogy (Screen size)
-20 +200 mesh -200 mesh
QUARTZ SMECTITE Francolite } (tr.) QUARTZ K feldspar FRANCOLITE
SMECTITE QUARTZ DOLOMITE K feldspar (m) Francolite } (m) Francolite (tr.) Quartz
Palygorskite (tr.)
DOLOMITE
Quartt } QUARTZ Francolite K feldspar (m) K felds,Par (tr.) Francolite (tr.) Smectite
Palygorskite Kaolinite
FRANCOLITE A-VALUES (±0.003 ANGSTROMS)
+20 mesh -20 +200 mesh
9.335 N.A.
9.329 9.328
9.330 9.335
SCREEN DATA (IN PERCENT)
-21J.m
SMECTITE
Illite } Quartz Francolite (tr.) K feldspar Crandallite
SMECTITE (m)
g~~o~ite I Francolite Albite K feldsp~r (tr.) Crandalhte Illite Palygorskite Sepiolite
SMECTITE Albite (m)
Quartt } Francolite Dolomite (tr.) K feldspar Palygorskite Illite
-200 mesh
9.360
9.324
9.329
0 ~ 100
ii1Lr'•••-,:.:· ·. ,· __ •. ' .-.,:;··::·1


SELECTED SERIES OF U.S. GEOLOGICAL SURVEY PUBLICATIONS
Periodicals
Earthquakes & Volcanoes (issued bimonthly). Preliminary Determination of Epicenters (issued monthly).
Technical Books and Reports
Professional Papers are mainly comprehensive scientific reports of wide and lasting interest and importance to professional scientists and engineers. Included are reports on the results of resource studies and of topographic, hydrologic, and geologic investigations. They also include collections of related papers addressing different aspects of a single scientific topic.
Bulletins contain significant data and interpretations that are of lasting scientific interest but are generall:y more limited in scope or geographic coverage than Professional Papers. They include the results of resource studies and of geologic and topographic investigations; as well as collections of short papers related to a specific topic.
Water-Supply Papers are comprehensive reports that present significant interpretive results of hydrologic investigations of wide interest to professional geologists, hydrologists, and engineers. The series covers investigations in all phases of hydrology, including hydrogeology, availability of water, quality of water, and use of water.
Circulars present administrative information or important scientific information of wide popular interest in a format designed for distribution at no cost to the public. Information is usually of short-term interest.
Water-Resources Investigations Reports are papers of an interpretive nature made available to the public outside the formal USGS publications series. Copies are reproduced on request unlike formal USGS publications, and they are also available for public inspection at depositories indicated in USGS catalogs.
Open-File Reports include unpublished manuscript reports, maps, and other material that are made available for public consultation at depositories. They are a nonpermanent form of publication that may be cited in other publications as sources of information.
Maps
Geologic Quadrangle Maps are multicolor geologic maps on topographic bases in 7 1n.- or 15-minute quadrangle formats (scales mainly 1 :24,000 or 1 :62,500) showing bedrock, surficial, or engineering geology. Maps generally include brief texts; some maps include structure and columnar sections only.
Geophysical Investigations Maps are on topographic or planimetric bases at various scales; they show results of surveys using geophysical techniques, such as gravity, magnetic, seismic, or radioactivity, which reflect subsurface structures that are of economic or geologic significance. Many maps include correlations with the geology.
Miscellaneous Investigations Series Maps are on planimetric or topographic bases of regular and irregular areas at various scales; they present a wide variety of format and subject matter. The series also includes 7 1/2-minute quadrangle photogeologic maps on planimetric bases which show geology as interpreted from aerial photographs. Series also includes maps of Mars and the Moon.
Coal Investigations Maps are geologic maps on topographic or planimetric bases at various scales showing bedrock or surficial geology, stratigraphy, and structural relations in certain coal-resource areas.
Oil and Gas Investigations Charts show stratigraphic information for certain oil and gas fields and other areas having petroleum potential.
Miscellaneous Field Studies Maps are multicolor or black-andwhite maps on topographic or planimetric bases on quadrangle or irregular areas at various scales. Pre-1971 maps show bedrock geology in relation to specific mining or mineral-deposit problems; post-1971 maps are primarily black-and-white maps on various subjects such as environmental studies or wilderness ntineral investigations.
Hydrologic Investigations Atlases are multicolored or black-and· white maps on topographic or planimetric bases presenting a wide range of geohydrologic data of both regular and irregular areas; principal scale is 1:24,000 and regional studies are at 1:250,000 scale or smaller.
Catalogs
Permanent catalogs, as well as some others, giving comprehensive listings of U.S. Geological Survey publications are available Wlder the conditions indicated below from the U.S. Geological Survey, Books and Open-File Reports Section, Federal Center, Box 25425, Denver, CO 80225. (See latest Price and Availability List)
"Publications of the Geological Survey, 1879-1961" may be purchased by mail and over the counter in paperbaek book form and as a set of microfiche.
"Publications of the Geological Survey, 1962-1970" may be purchased by mail and over the counter in paperback book form and as a set of microfiche.
"Publications of the U.S. Geological Survey, 1971-1981" may be purchased by mail and over the counter in paperback book form (two volumes, publications listing and index) and as a set of microfiche.
Supplements for 1982,1983, 1984, 1985,1986, and for subsequent years since the last permanent catalog may be purchased by mail and over the counter in paperback book form.
State catalogs, "List of U.S. Geological Survey Geologic and Water-Supply Reports and Maps For (State)," may be purchased by mail and over the counter in paperback booklet form only
"Price and A vallabillty List of U.S. Geological Survey Publications," issued Bmlually, is available free of charge in paperback booklet form only.
Selected copies of a monthly catalog "New Publications of the U.S. Geological Survey" available free of charge by mail or may be obtained over the counter in paperback booklet form only. Those wishing a free subscription to the monthly catalog "New Publications of the U.S. Geological Survey" should write to the U.S. Geological Survey, 582 National Center, Reston, VA 22092.
Note.--Prices of Government publications listed in older catalogs, announcements, and publications may be incorrect Therefore, the prices charged may differ from the prices in catalogs, announcements, and publications.