Embed Size (px)
Citation preview

••
MINERALOGYOF VIBRACORE
HEAVY-MINERALCONCENTRATES AND
PRELIMINARYSTRATIGRAPHIC FRAMEWORK OF THESOUTHERN INNER CONTINENTAL SHELFOF NORTH CAROLINA
Nort" Carolilla
• •, ~
~""'-'-;-:""",-;:-'!:f'd' •. ". '. ...... . -".... ,,,,.. ..~., ., :• Long Bay
NORTH CAROLINA GEOLOGICAL SURVEY
•OPEN-FILE REPORT 94-2
Mineralogy of Vibracore Heavy-Mineral Concentrates andPreliminary Stratigraphic Framework of the Southern Inner
Continental Shelf of North Carolina
by
John G. Nickerson, Wenfeng Li, Mary E. Watson, andRichard C. Dentzman
North Carolina Geological Survey
Open-File Report 94-2
1994
Charles H. Gardner, Director and State Geologist
STATE OF NORTH CAROLINA
JAMES B. HUNT, JR., GOVERNOR
DEPARTMENT OF ENVIRONMENT,HEALTH AND NATURAL RESOURCESJOHNATHAN B. HOWES, SECRETARY
CONTENTS
Abstract....................................................................................................................................... IIntroduction IPrevious heavy-mineral work 4Laboratory procedures................................................................................................................ 4
Heavy-mineral separation and concentration 4Processing for textural data '" 5Mineralogy........................... 6
Stratigraphy 6Results 8Conclusions 8Acknowledgments 10Reference cited.............. 10Appendix A I IAppendix B................................................................................................................................ 14Appendix C....... I 8Appendix D 2 IAppendix E.. 26
ILLUSTRATIONS
Figure I. Cape Fear Cuspate Foreland project area 22. Location of vibracores in southern portion of study area 33. Location of vibracores in northeastern portion of study area 34. Preliminary stratigraphic framework 65. Total heavy mineral content (THM) versus mean grain size (0) 96. Average total heavy mineral content (THM) by stratigraphic unit.............................. 9

Mineralogy of Vibracore Heavy-Mineral Concentrates and PreliminaryStratigraphic Framework of the SouthernInner Continental Shelf of North Carolina
by
John G. Nickerson, North Carolina Geological SurveyWenfeng Li, North Carolina State University
Mary E. Watson, North Carolina Geological Surveyand Richard C. Dentzman, North Carolina State University
ABSTRACT
Heavy-mineral (specific gravity (sp gr) >2.96)and textural data for 113 samples from 47vibracores obtained from the southern inner Continental Shelf of North Carolina are presented. Apreliminary lithostratigraphic framework for theproject area is also presented. Subsamples fromheavy-mineral concentrates from the vibracoreswere examined. Average total heavy-mineral(THM) content, expressed as a weight percentageof the bulk sample, is 0.51 percent in a range of<0.01 percent to 3.25 percent with a standard deviation of 0.50 percent. Average economic heavymineral (EHM) content of the heavy-mineral concentrates is 45.78 weight percent in a range of 4.61percent to 68.87 weight percent. Ilmenite is themost abundant heavy mineral, averaging 26.60weight percent of the heavy-mineral concentrates.
Mean grain-size for the clastic samples is 2.88phi (0), in a range of 0.850 to 4.440 with a standard deviation of 1.00. Lithostratigraphic and limited biostratigraphic analyses reveal that Oligoceneage sands in the project area contain the highestpercentage of heavy minerals. These sands average 0.86 weight percent THM. Grain-size analyses of all clastic samples indicates that mediumgrained to very fine grained quartz sands (1.90 to3.50) have weight percent THM values greaterthan or equal 1.0. These values are considered toolow to warrant economic exploitation. Additional,more detailed analyses to determine the distribution of heavy minerals within stratigraphic units,
however, may be of interest to other investigations.
INTRODUCTION
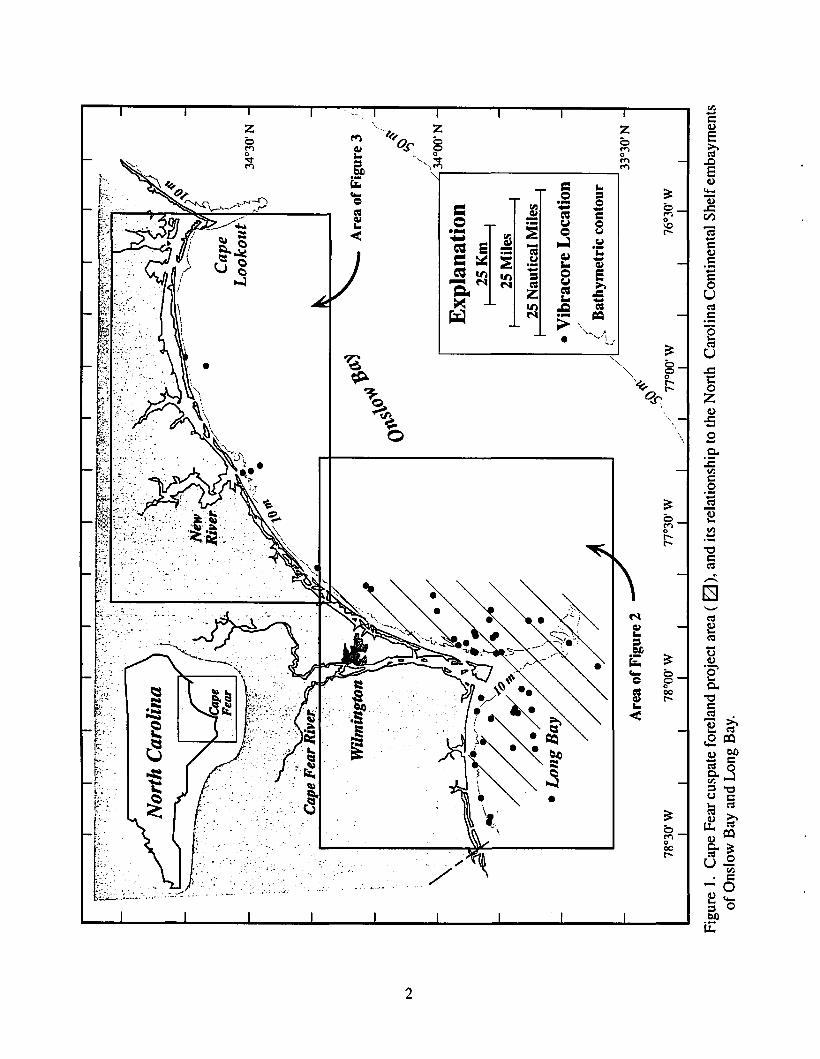
This paper presents a listing of heavy-mineral (specific gravity (sp gr) > 2.96) and texturaldata from a reconnaissance study of 47 vibracoresfrom the southern inner Continental Shelfof NorthCarolina. A preliminary lithostratigraphic framework for the project area is also presented. Mostof the vibracores were obtained from the Cape Fearcuspate foreland area (Figures 1,2, and 3). Thiswork is part of a multi-year project aimed at developing the stratigraphic framework and assessing the potential for heavy-mineral resources alongthe southern inner Continental ShelfofNorth Carolina. This is the fourth interim report generatedfrom this project.
The first report (Hoffman and others, 1991)included the basic geology and heavy-mineral content of 19 vibracores. Mineralogical data fromthese 19 vibracores were summarized in Nickersonand others (1993) and are not repeated in this report. The second report (Nickerson and others,1993) provided a summary of sample processingprocedures and a tabulation of heavy-mineral datafor 193 samples from 67 vibracores. The third report (Snyder and others, 1994) presented a working model of the stratigraphic framework for theinner shelf area from Mason Inlet to New Inlet,based on shallow, high-resolution seismic data.
The Coastal Engineering Research Center
Are
ao
fFig
ure
3
.--------------L
.,34
°00'
N
Exp
lana
tion
I2
5K
mI
I25
Mil
esI
I25
Nau
tica
lMil
esI
•V
ibra
core
Loc
atio
n(
r'~
Bat
hym
etri
cco
ntou
r/
"//
L..
...:
.------------l3
3°3
0·
N
of.e.,
\) 77°0
0'W
Are
ao
fFig
ure
2
Wil
min
gton
I.....
!"~. \:;:"
;,."
~...
Fig
ure
1.C
ape
Fea
rcu
spat
efo
rela
ndpr
ojec
tar
ea(
Ea)
,an
dit
sre
lati
onsh
ipto
the
Nor
thC
arol
ina
Con
tine
ntal
She
lfem
baym
ents
of
Ons
low
Bay
and
Lon
gB
ay.
Explanation
10KmI I10 Miles
I I10 Nautical Miles
I I
• Vibracore Location
/ Bath)metric contour
)4°00"N
33C40'N
•1142
739.
..~. ''i. ,~.. '~."',.-~,:~, ••. .- -~.
18°30'W
2000•1S000'W 11°30'W
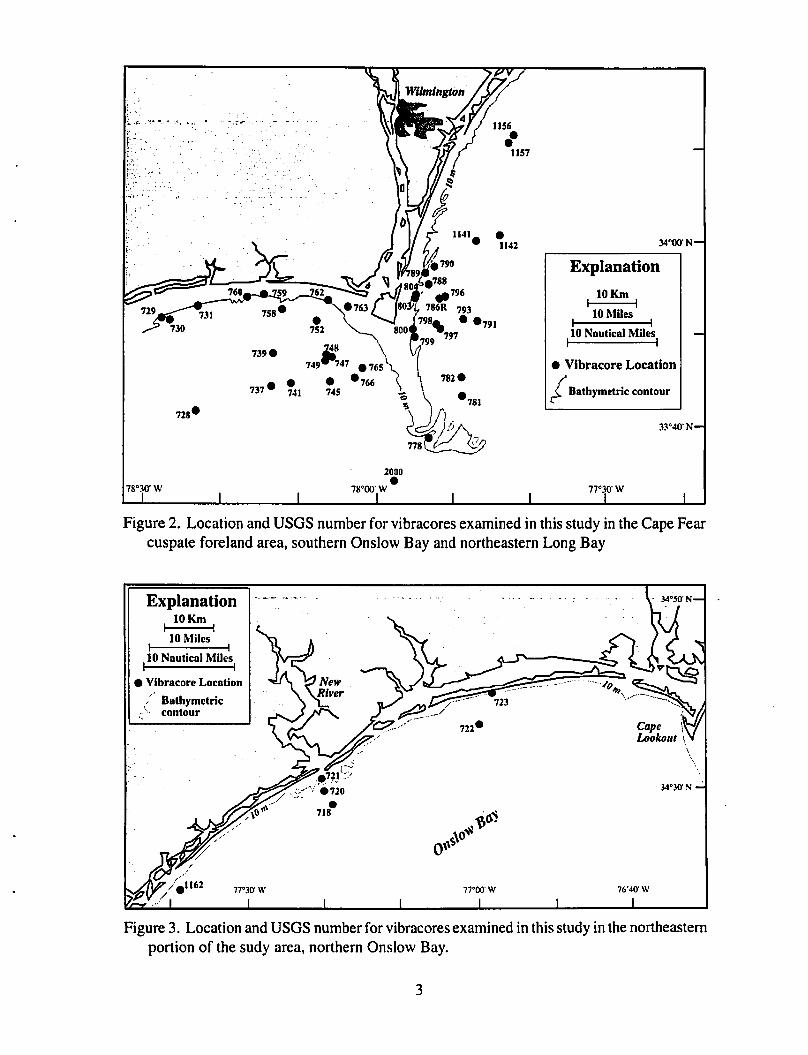
Figure 2. Location and USGS number for vibracores examined in this study in the Cape Fearcuspate foreland area, southern Onslow Bay and northeastern Long Bay
Explanation10Km
I I10 Miles
I I10 Nautical Miles
I I• Vibracore Location
"_< Bathymetric:, contour
77'30' W 77°00'W 76'40' W
34·30' N
Figure 3. Location and USGS number for vibracores examined in this study in the northeasternportion of the sudy area, northern Onslow Bay.
3

(CERC) of the U. S. Anny Corps of Engineerscollected the vibracores in 1971 and 1972 as a partof a CERC reconnaissance study designed to locateand inventory suitable sand resources and toacquire geologic data along the AtlanticContinental Shelf. This program was known asthe Inner Continental Shelf Sediment and Structureprogram (ICONS).
The North Carolina portion of the ICONS studyresulted in two companion reports (Meisburger,1977; 1979). The first report dealt exclusively withsand nourishment resources from this area; thesecond report presented lithologic, textural, andlimited biostratigraphic data for the North CarolinaICONS study area. Meisburger (1979) correlatedcores using lithologic data supported by limitedbiostratigraphic data.
The U.S. Geological Survey (USGS)inventoried and renumbered the ICONS vibracoresafter obtaining custody of them. The USGSnumbering scheme for the vibracores is usedherein; however, the CERC vibracore codes arealso provided for cross-reference purposes. An "R"designation following the core number indicates areplicate vibracore.
PREVIOUS HEAVY-MINERAL WORK
Meisburger (1979) reported small quantities ofcolored, translucent mineral grains in these cores,and noted that their occurrence was mostlyrestricted to the "surficial and near-surfacedeposits." He perfonned heavy-liquid separationof a "few selected samples" in bromofonn (sp gr =2.87) and detennined that most of these coloredtranslucent mineral grains were heavier than quartz.He also noted that most of these minerals were pinkto red, pale-yellow, or pale yellowish-green, andidentified these grains as gamet, staurolite, andepidote, respectively, based upon previousmineralogical studies of the surficial shelfsediments in the area (pilkey, 1963; Moore andGorsline, 1963; Gorsline, 1963).
Eighty-seven ocean floor grab-samples fromthe North Carolina Continental Shelf wereanalyzed for mineralogy and texture (Grosz andothers, 1990). Of the 87 samples, 54 were fromthe area referred to in that report as "south ofHatteras" which partially coincides with the currentstudy area. These samples averaged 1.04 weightpercent heavy minerals in a range of 0.04 to 3.27weight percent with a standard deviation of 0.71.
Textural and mineralogical analyses for193samples from 67 of the 114 ICONS vibracores werereported by Nickerson and others (1993). Thesesamples averaged 0.56 weight percent total heavyminerals (THM) in a range of<0.01 to 3.69 weightpercent with a standard deviation of 0.48.
The economic heavy minerals (EHM)ilmenite, leucoxene, rutile, zircon, monazite, andthe aluminosilicates (undifferentiated kyanite,sillimanite, and andalusite) comprised an averageof 44.4 weight percent of the heavy-mineralconcentrates in a range of 0.27 to 68.1 weightpercent. Ilmenite was found to be the mostabundant EHM in the concentrates with an averageweight percent of 26.07. The remaining EHMsuite, on average, contained 5.75 weight percentrutile, 5.73 weight percent zircon, 4.45 weightpercent leucoxene, 3.54 weight percentaluminosilicates, and 0.36 weight percentmonazite.
Mean grain size for the clastic samples wasdetermined to be 2.740. Grain size analysesindicated that sediments with THM content greaterthan or equal to 1.0 weight percent had mean grainsizes that fell between the 2.00 and 4.00 sizeclasses (fine- to very fine grained sand).
LABORATORY PROCEDURES
Heavy-Mineral Separation and Concentration
The procedures used in processing thevibracores are outlined in Nickerson and others(1993). Vibracores were opened, photographed,
4

Processing for Textural Data
smaller heavy-mineral concentrates « 10 g) weresplit at 0.5 A. On average, the dominant mineralphases in the separations were as follows:
described, subsampled, and processed for heavymineral content. Channel subsamples (about onekilogram) were taken to provide material fortextural and compositional analyses, and to producean archive sample. The remainder of the core wasconsumed in the processing for heavy-minerals.
Preconcentration of the heavy minerals wasperformed with a 3-tum spiral device where waterand centrifugal force act as separation agents. Thisseparation produced two subsamples: a spiralconcentrate and a spiral reject. Heavy-liquidseparation of the spiral concentrate throughAcetylene Tetrabromide (Tetrabromoethane, sp gr= 2.96) produced the final heavy-mineralconcentrates referred to as SHTBS (Spiral HeavyTetrabromoethane Sinks). A subsample of thespiral rejects material was also processed throughAcetylene Tetrabromide to estimate the amount ofheavy minerals "lost" in the spiraling operation.The spiral reject heavy-liquid concentrate isreferred to as SLTBS (Spiral LightTetrabromoethane Sink).
SeparationFerromagnetics
0.2 A fraction0.4 A fraction
0.6 A fraction
1.8 A fraction
> 1.8 A fraction
Mineralsilmenite, iron oxides, and traceamounts of epidote, aluminosilicates.zircon (with inclusions) andpyroboles (undifferentiatedamphiboles and pyroxenes)
ilmenite and garnet
ilmenite, epidote, staurolite. and
pyroboles
epidote, tourmaline, sulfides(mainly framboidal pyritel
marcasite), and staurolite
leucoxene, sulfides, rutile,
aluminosilicates. and tourmaline
zircon, quartz (present as acontaminant), rutile,
aluminosilicates, and phosphate
The amount of recovered heavy minerals(RHM) in the bulk sample was calculated bydividing the SHTBS weight by the bulk sampleweight. The heavy mineral content of the spiralrejects (as estimated from a subsample) added tothe RHM amount provides the THM value on abulk sample basis.
The heavy-mineral concentrates were weighed,labeled, and fractionated using two electromagneticdevices; a Frantz lsodynamic Magnetic Separatorand a Frantz Magnetic Barrier LaboratorySeparator. The latter instrument can be set tooperate a different amperages (A) to isolatemineral species of given magnetic susceptabilities.This separation facilitates the identification andquantification of the minerals present in the heavymineral fractions and reduces the number ofmineral species in a given magnetic fraction. Inmost samples, 6 magnetic fractions (ferromagnetic;0.2 A; 0.4 A; 0.6 A; 1.8 A and> 1.8 A) weregenerated for each heavy-mineral concentrate;
5
Standard sieve analysis techniques were used toobtain grain-size data for all clastic samples. Meangrain size and standard deviation were calculatedusing the method of moments described by Folk(1974). A portion of the channel subsample was usedfor sieve analysis. Splits of this subsample wereweighed and wet-sieved to remove material finer than40 (0.044 mm-silt and clay fractions) and materialcoarser than -1.00 (2.0 mm- gravel fraction). Theremaining sand-sized material was sieved, weighed,and archived. Calculations of mean grain sizeincorporated the finer than 40 weight fraction.Because the gravel fraction contained mostly shellmaterial and no mineral grains, its weight was ignoredin the calculations.
A representative split of the channel subsarnplewas used to determine carbonate content by aciddigestion. This work was performed by the NorthCarolina State University Minerals ResearchLaboratory in Asheville, North Carolina. Data forweight percent carbonate and mean grain size arelisted in Appendix C.

Mineralogy
All samples were examined under a binocular microscope with reflected- and transmitted-lightcapability. Mineral identification was accomplished by observing the shape, color, and opticalproperties of the mineral grains. Short-wave (254nm) and long-wave (365 nm) ultraviolet illumination aided in the identification of monazite and zircon, respectively. A petrographic microscope wasused to confirm mineral identities. Sixteen minerai species consistently categorized are listed inAppendix D. Visual estimation ofthe relative mineral abundances in each magnetic fraction was accomplished by comparing binocular volumetricestimates to area percentage diagrams ofTerry andChilingar (1955).
A thin layer of mineral grains (ideally one-grainthick) was viewed through the microscope in orderto allow for mineral identification and optimalcorrelation with the area percentage diagrams.Summing mineral species estimates across allmagnetic fractions for a given sample determinedthe final heavy-mineral composition for thatsample (Appendix D). Weight percent heavyminerals was calculated by multiplying thevolumetric estimate for a given mineral species bythe weight of that magnetic fraction, and dividingthis product by the bulk sample weight.
Detailed statistical analysis of the heavymineral concentrates is an ongoing thesis projectat North Carolina State University by Wenfeng Liand is planned to be presented in a future,comprehensive project report.
STRATIGRAPHY
A preliminary stratigraphic framework (Figure4) was established for this data set on the basis of:1) lithologic descriptions and photographs of thevibracores; 2) foraminiferal biostratigraphicanalysis performed on 19 project cores by LarryZarra, former geologist with the North CarolinaGeological Survey (NCGS), as summarized in
Hoffman and others (1991 )-Zarra'smicropaleontology notes remain on file at theNCGS and this work is cited extensively below as"Zarra (unpublished data);" 3) limited molluscanbiostratigraphic analysis provided by L. W. Ward,Virginia Museum of Natural History; 4) additionalbiostratigraphic work performed by Mary Watsonunder this current study; and 5) seismic sequenceanalysis of a portion of the study area as reportedin Snyder and others (1994).
Stratigraphic identifications, queried orquestioned where more data and analysis areneeded, are compiled in Appendix E. Note thatthis table includes samples for which mineralogicaland textural data have been given in earlier projectreports (Hoffman and others, 1991; Nickerson andothers, 1993). Those reports did not reflect thestratigraphic analysis done under this phase of thestudy.
Additional biostratigraphic work as well asmore complete integration of the litho- andbiostratigraphy with seismic sequence analysis ofthe region is anticipated in the next phase of thisstudy. This effort will refine the workingframework described below and stratigraphic
:>. Recent~ Qh)~
c~ Holocene~
(:;j::s0 Pleistocene
pp) PP2Pliocene
CMiocene Pungo River Fm.
~ River Bend Fm..€ Oligocene~ Oli~ocene sandf-
Eocene Castle Hayne Fm.
Paleocene Beaufort Fm.
Late Peedee Fm.Cretaceous
Figure 4. Preliminary stratigraphic frameworkfor ICONS vibracore data set.
6
assignments given to the project samples in channels cut into the underlying Peedee strata.Appendix E.
The oldest unit encountered, the PeedeeFormation of Late Cretaceous age, crops out innorthwestern and north-central Long Bay (cores732, 730, and 758). This unit is characteristicallya muddy, fine- to medium-grained quartz sand withtrace amounts ofglauconite and phosphate. Zarra(unpublished data) assigned samples from this unitto the Gansserina gansseri planktic Zone, whichis Maastrichtian (Upper Cretaceous). This unit hasbeen traced through the subbottom via seismicrecords into southern Onslow Bay as seismicsequence Kpd of Snyder and others (1994).
The Paleocene Beaufort Formation occurs incores 727, 736, 743, and 751. The unit consists ofmuddy, fine- to medium-grained glauconitic quartzsand with locally occurring turritelid-moldbiosparrudi te (core 751). Hoffman and others(1991) did not report any Paleocene section in thecores examined for that study. This unit isidentified on the basis of: I) lithologies thatcorrelate with Paleocene age sediments reportedby Harris (oral communication) from vibracoresin Long Bay; 2) the presence of Flabellum, a coralcommonly recognized as a Paleocene indicator, insample 727.2; 3) similar lithologies described fromonshore boreholes by Zarra (1991); and 4)stratigraphic identifications made by Meisburger(1979) on some of these same cores. Paleocenestrata have been reported to crop out in Long Bayby Meisburger (1979).
The middle Eocene Castle Hayne Formationcrops out in northern Long Bay (cores 752, and755) and consists ofa sandy bryozoan biomicruditeto a biosparrudite. Zarra (unpublished data)identified two diagnostic Castle Hayneforaminifera in core 755, Eponides carolinensisand Siphonina danvillensis, and core 767 containedthe middle Eocene megafossil Pectenmembranosus. Snyder and others (1994) showedthat the Castle Hayne Formation, in southernOnslow Bay, is thin, discontinuous, and occupies
7
Oligocene age deposits are represented by themolluscan-mold biosparrudite of the River BendFormation, and an unnamed fine- to very finegrained, well-sorted, dolomitic, muddy quartz sandunit. The River Bend Formation crops out in theNew River Inlet area in cores 718, 719, and farthersouth in core 2002. The unnamed sand unit iswidespread in southwestern Onslow Bay and cropsout in cores 1159, 1145, 1146, and 797. Hoffmanand others (1991) reported that the unnamedOligocene sand unit is biostratigraphicallyequivalent to the River Bend Formation.
Core 724 penetrated Miocene Pungo RiverFormation. The lithology consists of mediumgrained, poorly sorted, slightly shelly phosphaticsand. Zarra (unpublished data) noted the presenceof a middle to upper Miocene benthic indexspecies, Virgulinella miocenica, and stated that theage could be in the range of planktic Zone N9 toNIL
Several large valley-fililithosomes delineatedby seismic data in southern and south-centralOnslow Bay (PP"r unit ofSnyder and others, 1994)have been confirmed through vibracore data -to becomposed of biomicrudite, biomicrite, andbiosparrudite. These deposits, informally calledPP
Jin this study, commonly contain pieces of
bryozoans, barnacle plates, abraded fragments ofmolluscan shells, and a mixture of Pliocene andPleistocene micro and macrofaunas (cores 805,792, 2001 R in Hoffman and others, 1991; cores788, 789, 795, 803, 804 in this study). The PPJ
unit occupies 4 northwest-southeast-trendingpaleovalleys greater than 3 kilometers wide andcut more. than 15 meters deep into the Oligocenesection (Snyder and others, 1994).
Muddy shelly sands and silty clays of Pliocene,Pleistocene, or mixed PliolPleistocene age havebeen identified here as the PP2 unit. Within thisrange of lithologies, the unit exhibits a high degreeof variability throughout the study area. Thirty-
two cores have outcropping PP2 strata (AppendixE). Zarra (unpublished data) recognizedGlobigerina woodi and Globigerina eamesi, bothof which became extinct in the Pliocene, in core783. Other PP2 samples carry a clearly Pleistocenefauna (for example, Carolinapecten eboreus insample 781.2 or Chama gardneri in sample 745.1).Core 799 contained both Pliocene and Pleistocenefaunas (Mulinia congesta and Mulinia lateralis).
The PP2 unit is considered to be approximatelycorrelative with two lithosomes identified fromshallow, high-resolution seismic data by Snyderand others (1994): the lower shoreface, a seawardextension of the modern shoreface, and paleofluvial channel fill deposits which consist ofdistinct channel-fiJ) deposits that can be tracedlocally onto the shelf (Snyder and others, 1994).
Loose, slightly shelly, medium- to coarsegrained quartz sands present at the sediment-waterinterface along the inner shelf are interpreted torepresent the youngest unit in the area. It ispreliminarily assigned a Holocene age, and labeled"Qh/' Shells with original pigment remaining arecharacteristic of this unit. This unit likelyrepresents the two shoal lithosomes (linearshoreface-attached shoals and inner shelf sandshoals ) of Snyder and others (1994) and is mostprevalent in the Frying Pan Shoals area.
RESULTS
Data are tabulated in Appendices A, B, C,D, and E. Average THM content of the vibracores,expressed as a weight percentage of the bulksample, is 0.51 in a range of <0.0 I weight percent(sample 793.2) to 3.25 weight percent (sample1162.2) with a standard deviation of 0.50 weightpercent. Average EHM of the heavy-mineral concentrates is 45.78 weight percent. Ilmenite is themost abundant mineral of the EHM suite, constituting an average of 26.60 weight percent of theheavy-mineral concentrates.
The remainder of the average EHM content
8
contains 8.77 weight percent zircon with 4.47weight percent rutile, 4.27 weight percent aluminosilicates, 3.04 weight percent leucoxene, and0.19 weight percent monazite. Other minerals having lesser economic significance include staurolite, tourmaline, and garnet with average weightpercentages of 11.31,4.48, and 3.42, respectively.
Mean grain size for the clastic samples wasdetermined to be 2.880 (0.130 mm - fine-grainedsand) with a range of 0.800 (0.55 mm) to 4.440(0.045 mm) and a standard deviation of 1.00 (0.5mm). Grain size analysis indicates that sedimentswith weight percent THM greater than or equal to1.0 have mean grain sizes that fall between 1.90(0.26 mm) and 3.60 (0.08 mm) and are classifiedas medium- to very fine grained sand (Figure 5).Preliminary stratigraphic unit assignments indicatethat the Oligocene sand unit has the greatestpotential for heavy-mineral resources with anaverage weight percent THM of 0.86 (Figure 6).
The average zircon-tourmaline-rutile (ZTR)index (Hubert, 1962) for the quartz sands is 33, ina range of 17 to 68. The values obtained are highlyvariable and no obvious trend was identified. Theseresults are listed in Appendix C.
CONCLUSIONS
I) Heavy-mineral resource potential along thesouthern inner Continental Shelf of North Carolina appears to be poor based upon the examination of this data set. The average THM content for113 samples from 47 vibracores is 0.51 weightpercent and is well below the 4 percent thresholdgenerally considered to be of interest for economicresource potential (Garnar, 1978).
2) Average EHM of the heavy-mineralconcentrates is 45.8 weight percent, with a rangeof 4.6 to 68.8 weight percent, and a standarddeviation of 13.8. Ilmenite is the most commonheavy mineral, constituting 26.6 weight percent ofthe heavy-mineral concentrates.

- 1- - -, - - T - - 1- - -I - T - - r - -, - - l
- 1- _ -' _ _ .1 _ _ 1_ _ _I _ ·1 _ _ 1_ _ _I _ _ JI 1 I I I I I I I
- 1- - --i - - + - - 1- - -I - - + - - I- - -I - - .,I I I I I .1 I I I
-,- - -I - - T - - 1- - -I - - T - - ,- - -,- - -,- 1- - ~ - - -1- - - 1- - ·-1 - ~ -!- - - I- - -I - - -l•I I I I·· Ie .··1 1 1 I• •- 1- - -, - - T - -- 1-. - -1'- ;- ~,- -.,-. - -I -.- l_1- __1_ ~ ~·_I~'-.J -! _ 1.-. _.~ .!. ~Ie- __,
I • I • I •• • I·" I· II. I .1·. I• • ••
3.50
~3.00
= 2.50E-i-=~ 2.00~~
=- 1.50-.=cal-..- 1.00~
0.50
0.00
0.00 0.50 1.00 1.50 2.00 2.50 3.00 3.50 4.00 4.50
Mean Grain Size (0)
Figure 5. THM content versus mean grain size (0).
0.90
~ 0.80
=E-i 0.70-= 0.60~CJa..~ 0.50=-- 0040-~~ 0.30cal~
0.20a..~...< 0.10
0.00
~\;j \;j~ ""~'o c,' ) !b'
~ i' ~. ~ l:I b' ~~~ ~~. c.~ ~ &0(::' '~l'
&" R" ~tI~ cF ~R'" &'~ ~~. ~r:,~ .ffi q"tlf:.
q" q".~c,'" C?'S ~ ~c,
~.,'1>
Stratigraphic UnitFigure 6. Average weight percent total heavy minerals (THM) for stratigraphic units identified in the
Cape Fear cuspate foreland region.
9
3) Data derived from the initial 67 vibracores(Nickerson and others, 1993) are similar toconcentrations derived from the 47 vibracores inthe present study.
4) Preliminary stratigraphic unit assignmentsreveal that Oligocene sands in the project area, onaverage, contain 0.86 weight percent THM. Thisvalue is more than any other stratigraphic unit inthe project area.
ACKNOWLEDGMENTS
This project was supported in part by the U.S.Department of Interior, Minerals ManagementService (MMS) through a cooperative agreementwith the Continental Margins Committee of theAssociation ofAmerican State Geologists (AASG).This subagreement is administered and coordinatedfor MMS by the Bureau of Economic Geology,The University ofTexas at Austin and includes theNorth Carolina Department of Environment,Health, and Natural Resources as a subagreementrecipient. The MMS-AASG cooperativeagreement concerning work reported herein isnumber 14-35-0001-30643; the subagreementnumber is 30643-NC.
Andrew Grosz (USGS) provided thevibracores used in this study to the North CarolinaGeological Survey and much of the equipment usedin the sample processing. His guidance on various aspects ofthe study is gratefully acknowledged.Phillip Orozco assisted in sample processing courtesy of a grant supplied by the E. I. DuPont DeNemours and Company.
Reviews by Tim Davis, Steve Snyder, Al Carpenter, Charles Gardner, and Jeff Reid greatly improved the manuscript. Their efforts are appreciated.
REFERENCES CITED
Folk, R.L., 1974, Petrology of Sedimentary Rocks: Austin,Texas. Hemphill Publishing Company. 182 p.
Garnar, T.E., Jr., 1978, Geological classification andevaluation of heavy-mineral deposits: GeorgiaGeologic Survey Information Circular 49, p. 25-36.
Gorsline, D.S., 1963. Bottom sediments of the Atlantic shelfand slope off the southern United States: Journal ofGeology, v. 71, p. 422-440.
Grosz, A.E.• Hoffman, C.W., Gallagher, P.E.• Reid, J.C.• andHathaway, lC., 1990. Heavy-mineral resource potentialofsurficial sediments on the Atlantic Continental Shelfoffshore of North Carolina: a reconnaissance study:North Carolina Geological Survey Open-File Report.90-3,58 p.
Hoffman. C.W., Gallagher, P.E.• and Zarra. L., 1991,Stratigraphic framework and heavy-mineral resourcepotential of the inner Continental Shelf, Cape Fear area,North Carolina: first interim progress report: NorthCarolina Geological Survey Open-File Report. 91-3. 31p.
Hubert, J.F.. 1962, A Zircon-Tourmaline-Rutile maturityindex and the interdependence of the composition ofheavy mineral assemblages with the gross compositionand texture of sandstones: Journal of SedimentaryPetrology,v.32, no. 3. p. 440-450.
Meisburger. E.P., 1977, Sand resources of the inner ContinentalShelfof the Cape Fear region, North Carolina: U.S.ArmyCOl]>s ofEngineers. Coastal Engineering Research CenterTechnical Paper 77-11. 20 p.
Meisburger. E.P.• 1979. Reconnaissance geology ofthe innerContinental Shelf. Cape Fear region, North Carolina:U.S. Army Corps of Engineers, Coastal EngineeringResearch Center Technical Paper 79-3, 135 p.
Moore, lE., and Gorsline, D.S., 1963, Physical and chemicaldata for bottom sediments. south Atlantic coast of theUnited States: U.S. Fish and Wildlife Service. SpecialScience report, 366, 84 p.
Nickerson. lG., Li, Wenfeng. and Watson, M.E.• 1993,Heavy-mineral data for selected vibracores from thesouthern inner Continental Shelf of North Carolina:North Carolina Geological Survey Open-File Report.93-37.41 p.
Pilkey. O.H.• 1963. Heavy minerals of the U.S. southAtlantic Continental Shelf and slope: GeologicalSociety of America Bulletin. v. 74. p. 641-648.
Snyder, S.W.,. Hoffman, C.w., and Riggs, S.R., 1994,Seismic stratigraphic framework of the innerContinental Shelf: Mason Inlet to New Inlet, NorthCarolina: North Carolina Geological Survey Bulletin96,75 p.
Terry. R.D.• and Chilingar, G.V.. 1955. Summary of"concerning some additional aids in studyingsedimentary formations" by M.S. Shvetsov: Journalof Sedimentary Petrology, v. 25, p. 229-234.
10
APPENDIX A
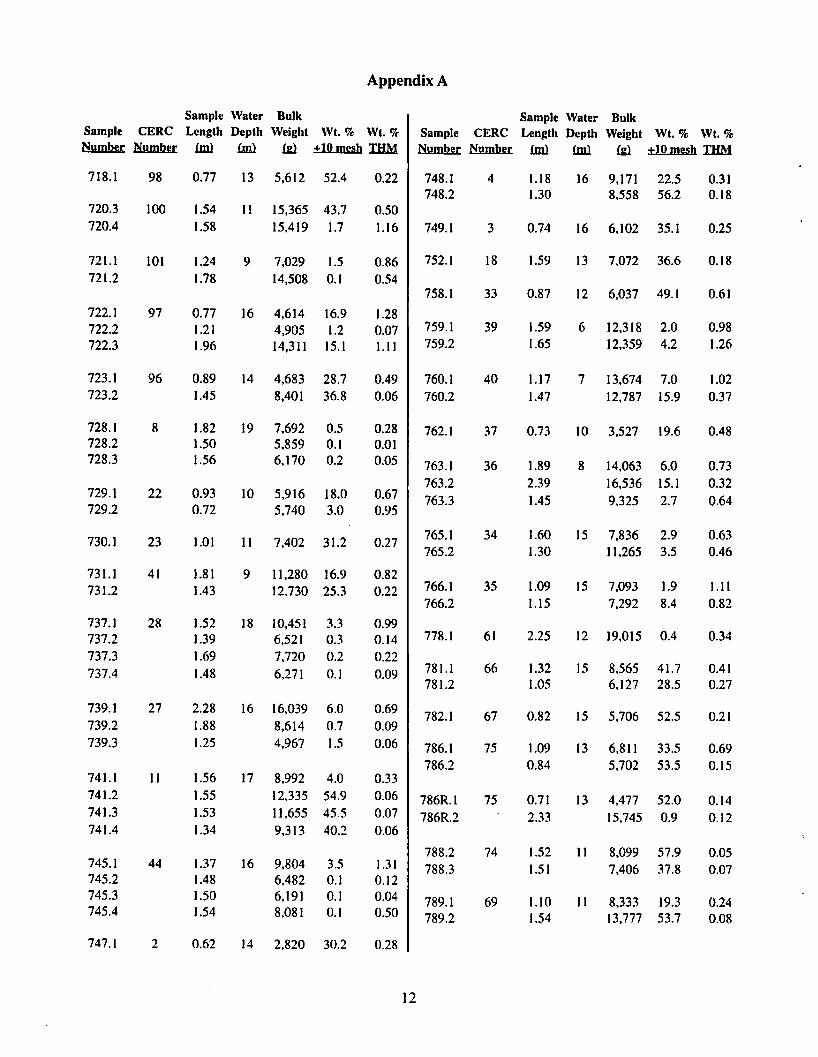
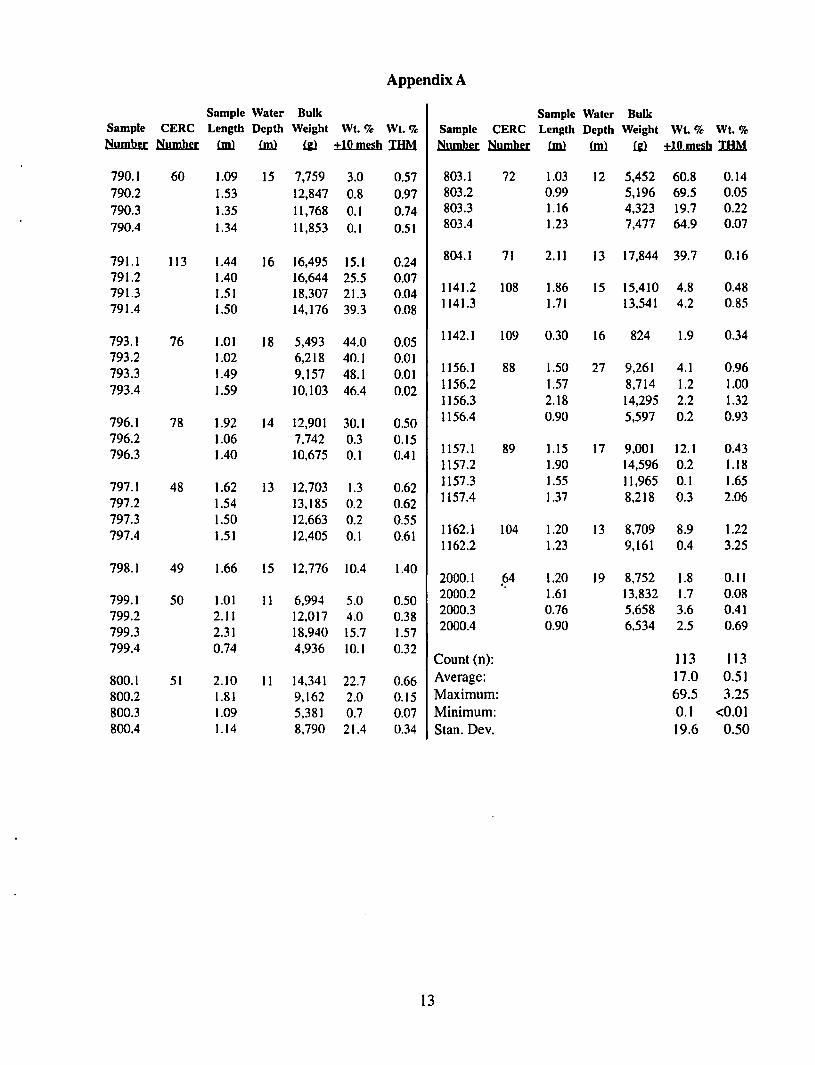
Table showing sample number, CERC code, sample length (in meters), water depth of vibracores( in meters), bulk sample weight (in grams), weight percent of the gravel fraction of the bulk sample(+10 mesh-2 mm), and weight percent total heavy minerals (THM). Sample numbers are derived fromthe USGS core number and a decimal extension (.1, .2, etc.) to indicate a core segment that has beenisolated as a sample interval. The.1 sample is the uppermost sample interval of a core, .2 is the nextsample down, and so on. Samples are typically .5 to 2 m in length.
II
]2
Appendix A
Sample Water Bulk Sample Water BulkSample CERe Length Depth Weight Wt. % Wt.% Sample CERC Length Depth Weight WL% Wt. %Number Number !ml !ml !J:} tlOmesh IBM Number Number !ml !ml !J:} tlOmesb IBM
790.1 60 1.09 15 7,759 3.0 0.57 803.1 72 1.03 12 5,452 60.8 0.14790.2 1.53 12,847 0.8 0.97 803.2 0.99 5,196 69.5 0.05
790.3 1.35 11,768 0.1 0.74 803.3 1.16 4,323 19.7 0.22
790.4 1.34 11,853 0.1 0.51 803.4 1.23 7,477 64.9 0.07
791.1 113 1.44 16 16,495 15.1 0.24 804.1 71 2.11 13 17,844 39.7 0.16
791.2 1.40 16,644 25.5 0.07791.3 1.51 18,307 21.3 0.04 1141.2 108 1.86 15 15,410 4.8 0.48
791.4 1.50 14,176 39.3 0.08 1141.3 1.71 13,541 4.2 0.85
793.1 76 1.01 18 5,493 44.0 0.05 1142.1 109 0.30 16 824 1.9 0.34
793.2 1.02 6,218 40.1 om793.3 1.49 9,157 48.1 0.01 1156.1 88 1.50 27 9,261 4.1 0.96
793.4 1.59 10,103 46.4 0.02 1156.2 1.57 8,714 1.2 1.001156.3 2.18 14,295 2.2 1.32
796.1 78 1.92 14 12,901 30.1 0.50 1156.4 0.90 5,597 0.2 0.93
796.2 1.06 7,742 0.3 0.15796.3 1.40 10,675 0.1 0041 1157.1 89 1.15 17 9,001 12.1 0.43
1157.2 1.90 14,596 0.2 1.18
797.1 48 1.62 13 12,703 1.3 0.62 1157.3 1.55 11,965 0.1 1.65
797.2 1.54 13,185 0.2 0.62 1157.4 1.37 8,218 0.3 2.06
797.3 1.50 12,663 0.2 0.55797.4 1.51 12,405 0.1 0.61 1162.1 104 1.20 13 8,709 8.9 1.22
1162.2 1.23 9,161 0.4 3.25
798.1 49 1.66 15 12,776 10.4 lAO2000.1 .64 1.20 19 8,752 1.8 0.11
799.1 50 1.01 II 6,994 5.0 0.50 2000.2 1.61 13,832 1.7 0.08
799.2 2.11 12,017 4.0 0.38 2000.3 0.76 5,658 3.6 0.41
799.3 2.31 18,940 15.7 1.57 2000.4 0.90 6,534 2.5 0.69
799.4 0.74 4,936 10.1 0.32Count (n): 113 113
800.1 51 2.10 II 14,341 22.7 0.66 Average: 17.0 0.51
800.2 1.81 9,162 2.0 0.15 Maximum: 69.5 3.25
800.3 1.09 5,381 0.7 0.07 Minimum: 0.1 <0.01800.4 1.14 8,790 21.4 0.34 Stan. Dev. 19.6 0.50
13

APPENDIX B
Table showing sample number, a short lithologic description, and total heavy mineral content (THM)for samples in the study.
14

SampleNumber
718.1720.3720.4721.1721.2722.1722.2722.3723.1723.2728.1728.2728.3729.1729.2730.1731.1731.2737.1737.2737.3737.4739.1739.2739.3741.1741.2741.3741.4745.1745.2745.3745.4747.1748.1748.2749.1752.1758.1759.1759.2760.1760.2762.1763.1763.2
Appendix B
Litholoeic Description
phosphatic, sandy, moldic biomicruditesandy, moldie, biomicrite / calcareous, fine-grained quartz sandcalcareous, fine-grained quartz sandvery fine grained quartz sandi muddy quartz sandi silty, laminated mudstonesilty mudstone I fine-grained quartz sandshelly, loose, fine- to medium-grained quartz sandsilty, sandy daymuddy, shelly, medium- to fine-grained quartz sand I phosphatic, sandy, dolomite cobblemuddy, shelly, medium-grained quartz sand I shell beds I flat, oblong pebbles at basesandy, bryozoan biomicrudite, scattered pebblesmuddy, medium- to fine-grained quartz sand I silty claysilty daysilty clayshelly, muddy, medium- to fine-grained quartz sandsilty organic-rich claymuddy, coarse- to fine-grained quartz sand I glauconitic, phosphatic, silty mudstoneslightly shelly, muddy medium- to fine-grained quartz sand / sandy dayglauconitic, phosphatic, very fine grained, sandy, dolomitic clayshelly, muddy, fine-grained quartz sandmuddy, fine-grained quartz sand, scattered shellssilty laminated mudstone/lenses of sand, silty partings,silty laminated mudstone/lenses of sand, silty partings,coarse-grained quartz sand / muddy, fine-grained quartz sand / silty mudstonesilty mudstonesilty mudstonemuddy, slightly shelly, fine-grained quartz sandsandy bryozoan biomicruditesandy bryozoan biomicruditesandy bryozoan biomicruditemuddy fine-grained sandsilty laminated claysilty laminated claysilty laminated clay Ifine-grained muddy sandsandy shell hashsandy biomicruditesandy biomicruditesandy biomicritebryozoan biomicruditemuddy, slightly shelly, medium- to granular-sized quartz sand, fines downwardslightly muddy, shelly medium- to fine-grained quartz sandshelly, muddy coarse to fine-grained quartz sand I organic-rich clayshelly, coarse- to fine-grained quartz sandshelly, coarse- to fine-grained quartz sandshelly, sandy clayl shelly, muddy coarse-grained quartz sandshelly, muddy coarse-grained sand I sandy clayshelly, muddy, coarse- to medium-grained quartz sand / sandy clay
15
Wt%111M
0.220.501.160.860.541.280.071.110.490.060.280.010.050.670.950.270.820.220.990.140.220.090.690.090.060.330.060.070.061.310.120.040.500.280.310.180.250:180.610.981.261.020,370.480.730.32

SampleNumber
Appendix B
LitholoKic DescriptionWt%TUM
763.3765.1765.2766.1766.2778.1781.1781.2782.1786.1786.2
786R.I786R.2
788.2788.3789.1789.2790.1790.2790.3790.4791.1791.2791.3791.4793.1793.2793.3793.4796.1796.2796.3797.1797.2797.3797.4798.1799.1799.2799.3799.4800.1800.2800.3800.4
interbedded shelly, muddy, medium- to fine-grained quartz sand & organic rich clay 0.64silty, muddy, fine-grained quartz sandi shellsl wood fragments 0.63coarse-medium, clean quartz sand 0.46muddy, fine-grained quartz sand 1.11muddy, fine-grained quartz sand I calcareous muddy quartz sand 0.82medium- to coarse-grained, slightly shelly clean quartz sand 0.34muddy, shelly, coarse- to medium-grained quartz sand with abraded (rounded) shell fragments 0.41muddy,shelly, fine- to coarse-grained quartz sand 0.27shelly quartz sand I phosphatic, sandy, moldic biomicrudite 0.21pebbly, shelly, medium-grained quartz sand 0.69sandy, bryozoan biomicrudite 0.15moldic biomicruditewith common mollusc steinkems 0.14glauconitic, phosphatic, silty, dolomitic quartz sand 0.12biomicrudite 0.05biomicrudite 0.07sandy biomicrudite 0.24sandy bryozoan biomicrudite 0.08medium-grained quartz sand I phosphatic, dolomitic quartz sand 0.57glauconitic, phosphatic, fine-grained, dolomitic quartz sand 0.97phosphatic, muddy, fine-grained, dolomitic quartz sand 0.74glauconitic, phosphatic, fine-grained, dolomitic quartz sand 0.51shelly coarse sand I muddy medium-grained quartz sandi sandy biomicrudite 0.24sandy biomicrudite 0.07sandy biomicrudite 0.04sandy biomicrudite 0.08bryozoan biomicrudite 0.05bryozoan biomicrudite 0.01bryozoan biomicrudite 0.01bryozoan biomicrudite 0.02shelly fine-grained quartz sand I shelly, muddy coarse- to medium-grained quartz sand I silty, sandy clay 0.50dolomitic, muddy, silty, fine-grained quartz sand 0.15dolomitic, muddy, silty, fine-grained quartz sand 0.41muddy, dolomitic, fine-grained quartz sand, phosphate, glauconite 0.62muddy, dolomitic, fine-grained quartz sand, phosphate, glauconite 0.62muddy, dolomitic, fine-grained quartz sand, phosphate, glauconite 0.55muddy, dolomitic, fine-grained quartz sand, phosphate, glauconite 0.61thin shell lag with coarse- to fine -grained quartz sand I muddy, dolomitic fine-grained quartz sand 1.40slightly shelly, coarse- to fine-grained quartz sand with scattered pebbles 0.50interbedded slightly shelly, muddy quartz sand and organic-rich clay and muddy fine-grained quartz sand 0.38muddy, very shelly, fine-grained quartz sand I muddy, shelly quartz sands 1.57phosphatic, muddy, dolomitic sands 0.32Silty clay I muddy, shelly quartz sand 0.66slightly shelly, silty, clay wi lenses of shelly, medium- to coarse-grained quartz sand 0.15slightly shelly, silty, clay wi lenses of shelly, medium-to coarse-grained quartz sand 0.07muddy, shelly quartz sandi muddy, dolomitic quartz sand 0.34
16

SampleNumber
803.1803.2803.3803.4804.1
1141.21141.31142.11156.11156.21156.31156.41157.11157.21157.31157.41162.11162.22000.12000.22000.32000.4
Appendix B
LitholoKic Description
thin coarse, shelly quartz sand I bryozoan biomicruditebryozoan biomicruditebryozoan biomicruditebryozoan biomicruditebryozoan biomicruditephosphatic, glauconitic, dolomitic muddy quartz sand, rounded, and well-sortedphosphatic, glauconitic, dolomitic muddy quartz sand, rounded, and well-sortedslightly shelly, muddy, medium-to coarse-grained quartz sandshelly, muddy fine-grained quartz sand I laminated silty clayshelly, muddy fine-grained quartz sand I laminated silty clayshelly, muddy fine-grained quartz sand, laminated silty clay I shelly, med·fine grained quartz sandglauconitic, very fine grained quartz sandmuddy, shelly, coarse- to medium-grained quartz sandslightly muddy, fine-grained quartz sand, glauconiteslightly muddy, fine-grained quartz sand, glauconiteslightly muddy, fine-grained quartz sand, glauconiteshelly, muddy, medium-grained quartz sandmuddy fine-grained quartz sandshelly, coarse-grained quartz sandshelly fine-grained quartz sandshelly fine-grained quartz sandshelly fine-grained quartz sand
17
Wt%TIIM
0.140.050.220.070.160.480.850.340.961.001.320.930.431.181.652.061.223.250.110.080.410.69
APPENDIX C
Sample number, THM in weight percent, zircon-tourmaline-rutile index (ZTR) for the quartz sandsamples, mean grain size (in phi units) for all clastic samples, and weight percent carbonate. ZTR indexis a measure of the samples maturity; ZTR= (Zircon+Tourmaline+Rutile in weight percent)/(sum ofthe transparent minerals in weight percent).
18
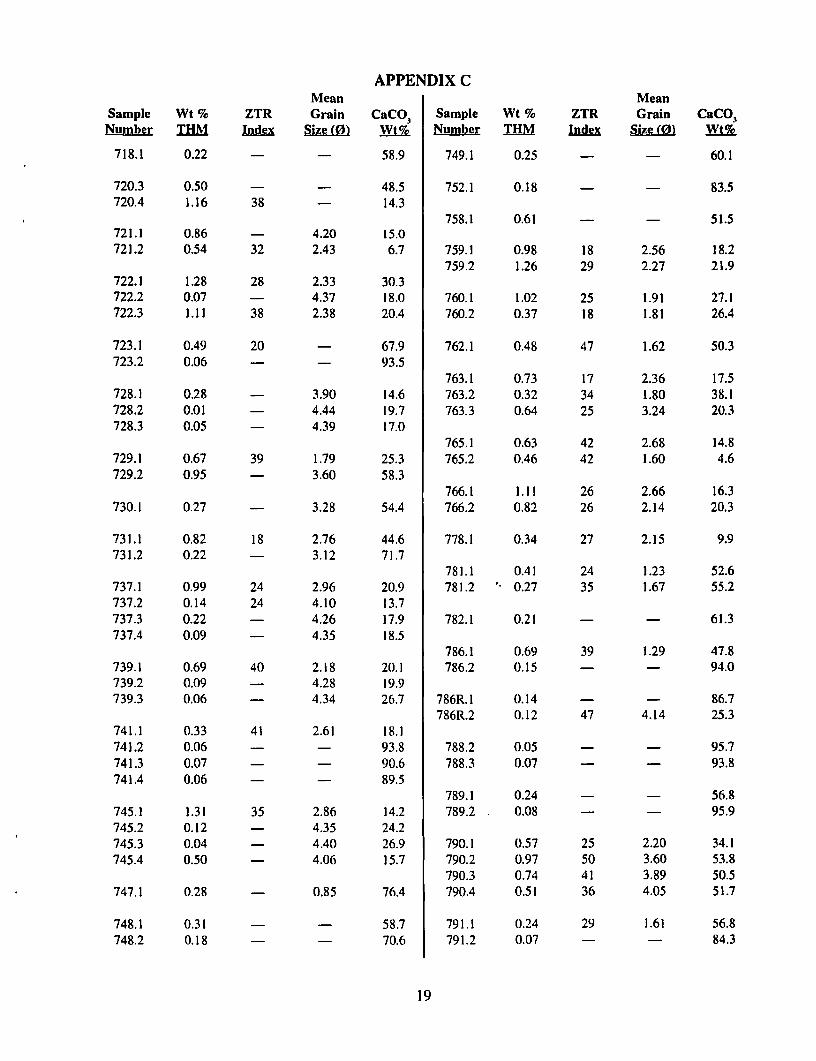
APPENDIXCMean Mean
Sample Wt% ZTR Grain CoCO) Sample Wt% ZTR Grain CaCO)Number IBM Index Size <0> :ID!& Number TI!M lmkx Size <0> ~
718.1 0.22 58.9 749.1 0.25 60.1
720.3 0.50 48.5 752.1 0.18 83.5720.4 1.16 38 14.3
758.1 0.61 51.5721.1 0.86 4.20 15.0721.2 0.54 32 2.43 6.7 759.1 0.98 18 2.56 18.2
759.2 1.26 29 2.27 21.9722.1 1.28 28 2.33 30.3722.2 0.07 4.37 18.0 760.1 1.02 25 1.91 27.1722.3 1.11 38 2.38 20.4 760.2 0.37 18 1.81 26.4
723.1 0.49 20 67.9 762.1 0.48 47 1.62 50.3723.2 0.06 93.5
763.1 0.73 17 2.36 17.5728.1 0.28 3.90 14.6 763.2 0.32 34 1.80 38.1728.2 0.01 4.44 19.7 763.3 0.64 25 3.24 20.3728.3 0.05 4.39 17.0
765.1 0.63 42 2.68 14.8729.1 0.67 39 1.79 25.3 765.2 0.46 42 1.60 4.6729.2 0.95 3.60 58.3
766.1 1.11 26 2.66 16.3730.1 0.27 3.28 54.4 766.2 0.82 26 2.14 20.3
731.1 0.82 18 2.76 44.6 778.1 0.34 27 2.15 9.9731.2 0.22 3.12 71.7
781.1 0.41 24 1.23 52.6737.1 0.99 24 2.96 20.9 781.2 . 0.27 35 1.67 55.2737.2 0.14 24 4.10 13.7737.3 0.22 4.26 17.9 782.1 0.21 61.3737.4 0.09 4.35 18.5
786.1 0.69 39 1.29 47.8739.1 0.69 40 2.18 20.1 786.2 0.15 94.0739.2 0.09 4.28 19.9739.3 0.06 4.34 26.7 786R.I 0.14 86.7
786R.2 0.12 47 4.14 25.3741.1 0.33 41 2.61 18.1741.2 0.06 93.8 788.2 0.05 95.7741.3 0.07 90.6 788.3 0.07 93.8741.4 0.06 89.5
789.1 0.24 56.8745.1 1.31 35 2.86 14.2 789.2 0.08 95.9745.2 0.12 4.35 24.2745.3 0.04 4.40 26.9 790.1 0.57 25 2.20 34.1745.4 0.50 4.06 15.7 790.2 0.97 50 3.60 53.8
790.3 0.74 41 3.89 50.5747.1 0.28 0.85 76.4 790.4 0.51 36 4.05 51.7
748.1 0.31 58.7 791.1 0.24 29 1.61 56.8748.2 0.18 70.6 791.2 0.07 84.3
19

APPENDIXCMean Mean
Sample Wt% ZTR Grain CaC03
Sample Wt% ZTR Grain CaC03Number :rHM Index Size (0) Wt% Number IBM ~ Size (0) m!&791.3 0.04 94.0791.4 0.08 94.7 804.1 0.16 87.1
793.1 0.05 99.6 1141.2 0.48 32 3.07 41.8793.2 0.01 99.5 1141.3 0.85 34 3.10 41.8793.3 0.01 99.6793.4 0.02 99.3 1142.1 0.34 27 1.82 46.3
796.1 0.50 43 1.48 45.9 1156.1 0.96 3.43 26.6796.2 0.15 68 4.11 20.9 1156.2 1.00 3.48 20.7796.3 0.41 57 4.20 18.1 1156.3 1.32 34 2.93 19.7
1156.4 0.93 21 3.08 5.5797.1 0.62 48 3.45 38.0797.2 0.62 34 3.52 38.2 1157.1 0.43 26 1.56 14.6797.3 0.55 50 3.57 33.2 1157.2 1.18 17 2.54 5.9797.4 0.61 52 3.74 27.6 1157.3 1.65 23 2.79 4.4
1157.4 2.06 20 2.93 6.3798.1 1.40 48 3.40 24.5799.1 0.50 30 1.64 8.1 1162.1 1.22 36 2.78 16.6
1162.2 3.25 41 2.97 9.2799.2 0.38 25 2.25 25.2799.3 1.57 39 2.36 45.3 2000.1 0.11 34 1.49 5.9799.4 0.32 22 57.0 2000.2 0.08 40 1.70 13.0
2000.3 0.41 39 2.20 23.5800.1 0.66 31 2.04 42.0 2000.4 0.69 38 2.48 19.7800.2 0.15 4.15 20.7800.3 0.07 4.42 21.8 Count (n): 113 63 80 113800.4 0.34 40 3.14 37.8 Average: 0.51 34 2.91 42.4
Maximum: 3.25 68 4.44 99.6803.1 0.14 77.9 Minimum: <0.01 17 0.85 4.4803.2 0.05 93.9 Stan. De\': 0.50 11 0.98 29.2803.3 0.22 68.5803.4 0.07 82.5
20
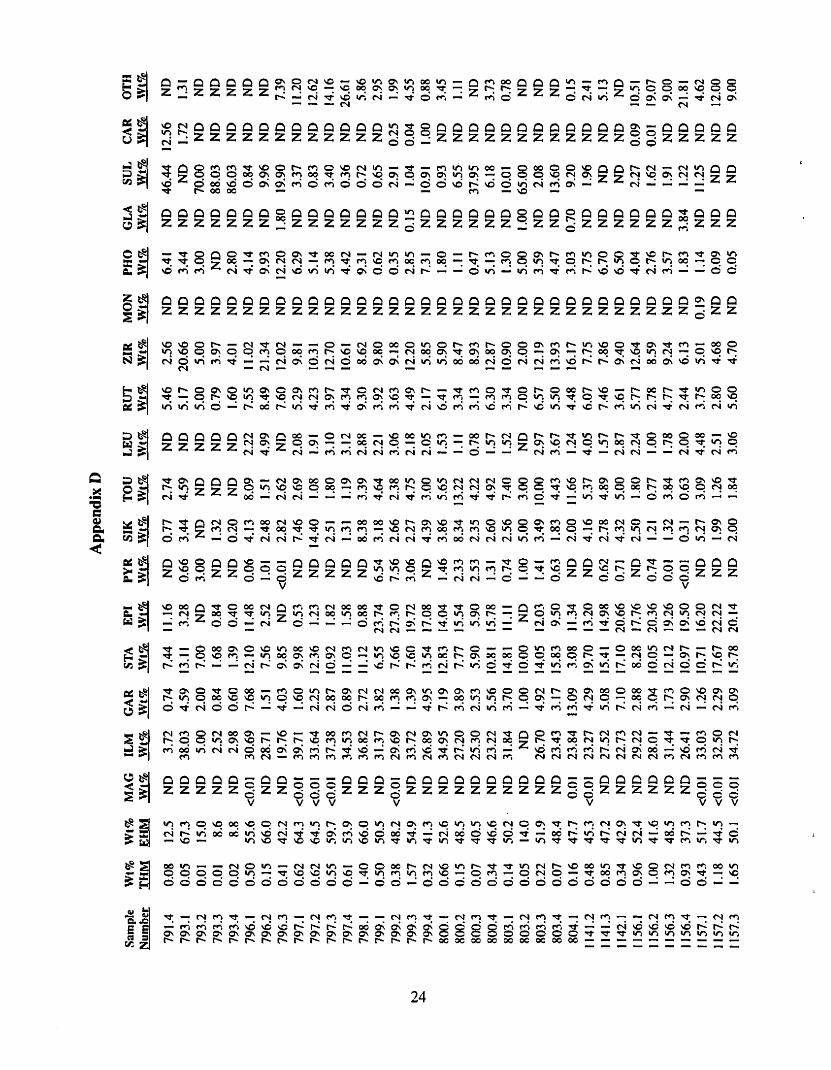
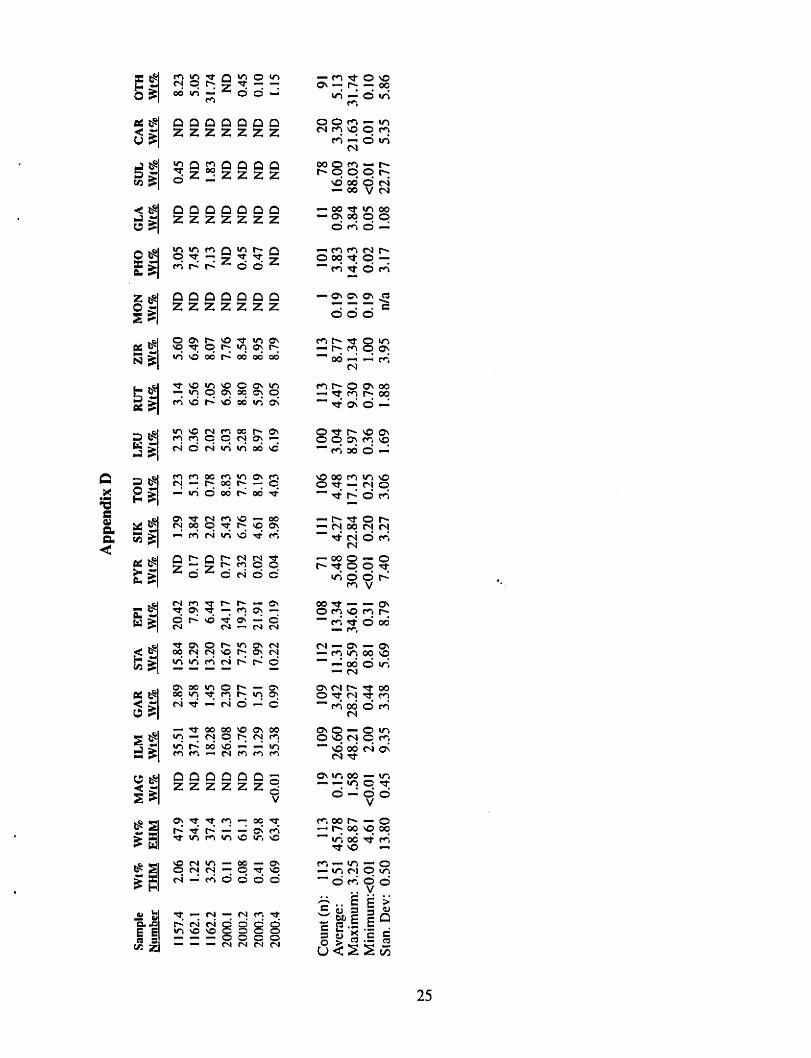
APPENDIX D
Table showing sample number, THM in weight percent, weight percent EHM of the heavy-mineralconcentrates, and weight percentages for the sixteen minerals categorized in this study. The mineralabundances are expressed as weight percentages of the heavy-mineral concentrates. "ND" means notdetected, or concentrations below visually quantifiable limits « 1%); trace amounts of minerals, whichwere visuaHy quantifiable, are reported as <0.0 I weight percent. Mineral species abbreviations are:MAG=magnetite, ILM=ilmenite, GAR=garnet, STA=staurolite, EPI=epidote, PYR=pyroboles(undifferentiated pyroxenes and amphiboles), SIK=aluminosilicates (undifferentiated kyanite, sillimaniteand andalusite), TOU=tourmaline, LEU=leucoxene (altered ilmenite), RUT=rutile, ZIR=zircon,MON=monazite, PHO=phosphate, GLA=glauconite, SUL=sulfides (framboidal pyrite/marcasite),CAR=carbonate material (generaHy sulfide-filled foraminiferal tests), and OTH=unidentified mineralgrains.
Summary statistics for the data set are given at the end of the table. "COUNT" in summary statisticsrefers to number of samples used in calculations.
21

App
endi
xD
Sam
ple
Wt%
lVt%
MA
GU
..MG
AR
STA
Erl
PYR
SIK
TOU
LEU
RUT
ZIR
MO
NPU
OG
LAS
UL
CAR
OTH
Num
ber
IHM
EH
MW
t%W
t%\V
t%W
t%W
t%W
t%\V
t%.ID
!&W
t%W
t%\V
t%W
t%W
tCk
Wtz
,W
t%J:
rt!&~
718.
10.
225
2.7
NO
35.0
56.
0016
.82
16.3
8N
O3.
742.
723.
0]1.
039.
91N
O4.
08N
ON
ON
O1.
27
720.
30
.50
47.2
NO
29.6
93.
452
].8
49.
77N
O3.
31]1
.6]
3.45
5.65
5.13
NO
2.53
NO
NO
3.37
0.20
720.
41.
1650
.2N
O29
.09
6.04
19.9
47.
07N
O1.
387.
886.
955.
717.
11N
O3.
47N
ON
ON
D5.
37
721.
10
.86
52.5
NO31
.64
8.45
14.2
08.
39N
O4.
885.
283.
514
.30
8.13
NO
4.11
NO
NO
NO
7.10
721.
20.
5440
.5N
O22
.53
1.J1
14.7
88.
115
.20
5.43
6.45
2.67
5.75
4.1
6N
O2.
42N
ON
ON
O21
.39
722.
11.
285
2.0
NO
36.1
34.
3412
.28
12.6
45
.32
3.88
6.75
4.13
2.63
5.2]
NO
3.51
NO
NO
NO
3.17
722.
20.
0763
.8N
D42
.03
2.38
15.8
67.
935.
553.
662.
384.
693.
11]0
.35
NO
1.04
ND
NO
NO
1.04
722.
31.
1159
.2N
O41
.88
2.90
10.0
07.
791.
572.
814.
012.
903.
128.
50N
O5.
31N
O3.
99N
O5.
23
723.
10.
4960
.4N
O45
.84
4.37
7.95
13.9
35.
373.
061.
063.
712.
045.
78N
D3.
34N
O0.
091.
551.
91
723.
20.
0633
.1N
D15
.90
2.65
5.12
3.71
0.53
3.29
0.47
2.35
6.29
5.23
NO
3.29
NO
45.4
15.
76N
O72
8.1
0.28
47.2
NO
28.7
44.
151.
5224
.00
15.4
74.
393.
984.
812.
896.
42N
O0.
58N
O1.
26N
O1.
80
728.
20.
0124
.0N
ON
ON
O3
.00
5.0
030
.00
7.00
NO
7.0
05.
005.
00N
ON
ON
O35
.00
NO
3
728.
30.
0537
.8N
O15
.82
1.58
3.95
27.6
818
.98
8.14
2.37
1.46
3.]4
9.28
NO
ND
NO
3.42
NO
4.18
729.
10
.67
38.8
NO
20.7
86.
546.
649.
9413
.56
5.21
]7.1
33.
292.
497.
00N
O0.
59N
D3.
17N
O3.
67
729.
20.
9568
.9N
O48
.2]
1.98
]3.2
1N
DN
O2.
360.
661.
323.
4013
.58
NO
8.49
NO
3.40
NO
3.40
tv73
0.]
0.27
49.5
NO
34
.]4
2.73
13.0
119
.99
3.22
5.84
1.62
2.58
1.42
5.58
NO
3.21
NO
6.68
NO
NO
N7
3].
]0.
8237
.7<
0.01
19.0
05.
1011
.07
17.4
718
.97
6.85
5.65
4.60
2.04
5.18
NO
3.05
ND
0.06
NO
0.96
731.
20.
2247
.8N
O28
.49
2.08
13.9
06.
954.
864.
586.
958.
053.
613.
05N
D9.
150.
697.
63N
OND
737.
10.
9944
.2N
O30
.04
1.69
5.08
32.9
01.
491.
161.
291.
042.
529.
39N
O0
.18
NO<
0.01
NO
13.2
1
737.
20.
1434
.2N
D11
.45
ND
1.53
24.0
827
.48
6.]
84.
052.
243.
4710
.89
NO
ND
ND
NO
NO
8.63
737.
30.
2233
.8N
O16
.24
0.81
0.81
34.6
12
0.3
03.
501.
622
.56
3.75
7.71
NO
NO
NO
NO
NO
8.07
737.
40.
093
2.8
'1.
5815
.77
NO
2.21
27.6
224
.71
7.0
01.
851.
063.
695.
29N
ON
ON
ON
ON
D9.
23
739.
10.
6947
.6<
0.01
24.5
24.
3915
.07
9.7
41.
923.
728.
264
.66
6.48
8.26
NO
6.52
NO
5.63
NO
0.82
739.
20.
0940
.2N
O14
.59
0.73
10.9
414
.59
2.]9
6.14
7.29
5.0
07.
716.
77N
O1.
35N
O18
.65
NO
4.06
739.
30
.06
20.0
NO
NO
3.00
10.0
010
.00
3.0
05
.00
5.00
5.0
07.
003.
00N
O2.
00N
O37
.00
NO
10.0
0
741.
10.
3361
.3N
O36
.00
1.56
6.86
13.1
03
.37
5.61
5.83
3.97
5.17
10.5
2N
D2.
86N
DN
ON
O5.
16
741.
20
.06
45.8
NO
19.2
52.
14]7
.82
3.56
NO
4.30
1.43
2.87
2.72
16.6
6N
D6.
44N
D22
.82
NO
NO74
1.3
0.07
39.9
NO
21.4
42.
1428
.59
3.57
NO
3.57
7.]
52.
715.
007.
13N
O9.
280
.7]
7.99
NO
0.71
741.
30.
0739
.9NO
2].
44
2.14
28.5
93.
57N
O3.
577
.]5
2.71
5.00
7.13
NO
9.28
0.71
7.99
NO
0.71
741.
40.
0644
.6NO
24.4
33.
7025
.91
3.70
ND
7.41
7.66
3.52
4.04
5.19
NO
3.90
NO
9.23
NO
1.30
745.
11.
3156
.2N
O33
.86
3.24
4.38
17.4
89.
533.
837.
305
.36
5.35
.7.
86N
O1.
02N
ON
ON
O0.
8J
745.
20.
1242
.7N
O19
.36
2.32
3.87
26.3
419
.36
4.51
3.87
5.6
44.
588.
57N
ON
ON
O0.
45N
D1.
[3
745.
30.
044
4.2
NO
23.5
3N
O5.
4919
.61
15.6
92.
16N
O4.
315.
598.
63N
ON
ON
D15
.00
NO
NO
745.
40
.50
55.2
NO
16.0
11.
71N
O20
.19
20
.]2
22.8
41.
446.
023.
426.
93N
DN
ON
ON
ON
O1.
33
747.
10.
2862
.2N
O36
.89
4.97
]0.6
42.
13N
D2.
912
.]3
1.45
2.03
18.8
8N
O5
.00
ND
0.87
NO
]2.0
9
748.
]0.
3155
.7N
D35
.81
2.59
]5.6
94.
43N
D3.
654.
782.
133.
2410
.91
NO
14.4
3N
O1.
76N
O0.
57

App
endi
xD
Sam
ple
\Vt%
Wt%
MA
G11
..MG
AR
ST
AE
PI
PYR
SIK
TOU
LEU
RU
TZ
IRM
ON
PH
OG
LA
SUL
CA
RO
TH
Num
ber
TII.M
EHM
\Vt%
\Vt%
\Vt%
Wt%
Wt%
Wt%~~~
Wt%
Wt%
\Vt%~~
\Vt%
Wt%~
748.
20.
1851
.1N
O29
.90
0.65
19.5
05.
25N
O5.
904.
553.
053.
508.
75N
O12
.80
NO
4.40
NO
1.75
749.
10.
2551
.31.
2935
.55
1.29
16.5
16.
46N
O5.
312.
291.
004.
185.
31N
O13
.09
NO
1.06
5.95
0.71
752.
10.
1834
.0N
O16
.01
5.60
24.0
22.
40N
O1.
994.
001.
002.
9911
.96
ND
1.99
NO24
.02
NO
4.00
758.
10.
6123
.1N
O14
.82
1.65
10.8
011
.30
0.47
3.31
5.21
0.86
1.02
3.15
NO
4.99
NO
40.5
9N
D1.
8375
9.1
0.98
38.7
ND
18.8
81.
6110
.37
21.8
120
.91
7.72
4.23
2.50
3.72
5.89
NO
2.17
NO
NO
NO
0.21
759.
21.
2651
.1N
O34
.12
5.59
17.2
615
.01
3.46
2.34
5.61
2.53
2.86
9.24
ND
0.42
NO
NO
NO
1.57
760.
11.
0247
.9<0
.01
28.5
52.
1310
.30
28.4
86.
861.
881.
733.
023.
1711
.33
NO
0.29
NO
NO
ND
2.27
760.
20.
3744
.9N
D31
.57
1.51
13.7
925
.31
6.87
2.49
1.38
1.43
2.76
6.69
NO
0.12
NO
0.02
NO
6.06
762.
10.
4867
.5N
D44
.25
2.25
15.0
05.
251.
501.
754.
502.
753.
7515
.00
NO
2.75
NO
ND
NO
1.25
763.
10.
7345
.0<0
.01
21.1
43.
2514
.79
29.0
83.
825.
992.
432.
902.
286.
61N
O0.
35N
ON
DN
O1.
3076
3.2
0.32
48.2
NO
21.8
35.
3118
.82
16.9
7N
O2.
617.
282.
264.
0311
.49
NO
0.02
NO
1.86
0.02
1.50
763.
30.
6446
.7N
O30
.80
2.70
6.37
19.7
79.
273.
925.
283.
473.
614.
90N
O0.
58N
O4.
800.
194.
3476
5.1
0.63
50.1
NO
23.0
90.
8713
.33
17.5
52.
005.
6811
.34
5.26
8.19
8.48
NO
0.57
NO
NO
NO
3.66
765.
20.
4656
.8N
O21
.51
2.57
17.8
66.
134.
395.
8810
.57
6.89
5.15
10.7
8N
ON
ON
O0.
23N
O1.
4276
6.1
1.11
49.7
NO
28.2
71.
134.
3931
.78
3.12
3.52
2.09
4.35
3.97
9.64
ND
0.53
NO
NO
ND
7.21
N76
6.2
0.82
49.5
NO
32.6
71.
696.
4828
.99
1.34
1.82
2.94
3.45
3.84
7.75
NO
0.07
ND
NO
0.64
8.32
l",.
)77
8.1
0.34
48.1
<0.0
127
.60
4.48
17.3
818
.56
0.07
4.95
4.38
2.93
6.78
5.88
NO
0.69
NO
NO
0.68
5.63
781.
10.
4136
.9N
O20
.22
14.8
522
.72
14.8
70.
753.
046.
432.
533.
207.
91N
O2.
07N
ON
ON
O1.
4178
1.2
0.27
50.4
NO
27.5
13.
5216
.64
17.9
2N
D4.
207.
123.
273.
6911
.77
ND
0.55
NO
2.84
ND
0.98
782.
10.
2152
.5N
O25
.45
28.2
73.
533.
53N
O4.
177.
07N
O5.
8617
.01
NO
2.17
NO
NO
NO
2.93
786.
10.
6951
.8N
O30
.20
9.83
14.4
08.
701.
711.
344.
592.
223.
7014
.39
NO
0.95
NO
6.95
NO
1.01
786.
20.
157.
0N
O2.
002.
003.
002.
001.
002.
00N
DN
O2.
001.
00N
O2.
00N
O83
.00
ND
NO78
6R.1
0.14
34.2
ND
J8.0
53.
0112
.03
5.0J
ND
NO
5.00
NO
4.59
11.5
6N
D3.
801.
2035
.76
NO
NO
786R
.20.
1240
.8<0
.01
19.5
62.
673.
961.
59N
O8.
251.
43N
O7.
985.
05N
O5.
830.
0541
.73
ND
1.90
788.
20.
054.
6N
DN
O1.
088.
082.
00N
O0.
92N
ON
O1.
382.
31N
D3.
92N
O80
.31
NO
NO
788.
30.
0712
.2N
D5.
511.
655.
515.
201.
101.
357.
00N
O3.
152.
25N
O6.
15N
O61
.15
NO
ND78
9.1
0.24
58.2
ND
31.0
05.
4713
.96
9.40
2.77
4.66
6.11
2.29
6.57
13.7
0N
O2.
74N
O1.
24N
O0.
1178
9.2
0.08
49.1
NO
22.7
14.
4212
.61
6.31
1.26
1.85
4.42
1.11
4.95
18.4
6N
O1.
37N
O20
.54
ND
NO
790.
10.
5742
.2N
O20
.66
4.80
19.0
519
.38
NO
5.96
4.00
3.13
3.63
8.80
NO
4.64
NO
1.25
NO
4.70
790.
20.
9746
.5N
O18
.5)
0.52
10.8
50.
60<
0.01
8.51
2.16
1.31
3.50
14.6
6N
O6.
87N
O24
.53
1.16
6.71
790.
30.
7468
.6N
O33
.23
2.22
7.86
0.31
NO
16.3
21.
932.
115.
0211
.31
NO
3.86
0.J5
10.6
41.
532.
9179
0.4
0.5)
62.0
NO
27.9
11.
3511
.51
NO
ND
15.9
70.
862.
594.
3411
.24
ND
5.06
0.49
11.3
01.
376.
0319
1.1
0.24
43.9
NO
24.5
23.
0920
.46
20.6
8N
O2.
664.
401.
994.
2810
.44
ND
3.81
ND
ND
NO
3.61
791.
20.
0740
.2N
O27
.64
1.49
4.49
26.6
5N
D2.
520.
250.
5)3.
516.
07N
O7.
59N
O11
.96
6.55
0.76
791.
30.
0426
.4N
O6.
560.
442.
158.
74N
D2.
131.
310.
565.
8711
.26
NO
8.44
ND
29.1
821
.63
1.13
App
endi
xD
Sam
ple
Wt%
Wt%
MA
GIL
MG
AR
STA
EP
IPY
RS
IKT
OU
LEU
RU
TZ
IRM
ON
PH
OG
LAS
UL
CA
RO
TH
Num
ber
111M
.EllM
Wt%
Wt%
Wt%~
..ID
2£W
t%W
t%.1Y
t!&~~
Wt%~
..wc&~
Wt%~~
791.
40.
0812
.5N
O3.
720.
747.
4411
.16
NO
0.77
2.74
NO
5.46
2.56
NO
6.41
ND
46.4
412
.56
NO79
3.1
0.05
67.3
NO
38.0
34.
5913
.11
3.28
0.66
3.44
4.59
NO
5.17
20.6
6N
O3.
44N
ON
D1.
721.
31
793.
20.
0115
.0N
O5.
002.
007.
00N
O3.
00N
DN
DN
O5.
005.
00N
O3.
00N
O70
.00
NO
NO79
3.3
0.01
8.6
ND
2.52
0.84
1.68
0.84
NO
1.32
NO
NO
0.79
3.97
NO
NO
ND
88.0
3N
ON
O79
3.4
0.02
8.8
NO
2.98
0.60
1.39
0.40
NO
0.20
NO
NO
1.60
4.01
NO
2.80
NO
86.0
3N
ONO
796.
10.
5055
.6<0
.01
30.6
97.
6812
.10
11.4
80.
064.
138.
092.
227.
5511
.02
ND
4.14
NO
0.84
ND
NO79
6.2
0.15
66.0
NO
28.7
11.
517.
562.
521.
012.
481.
514.
998.
492
].3
4N
O9.
93N
O9.
96N
ONO
796.
30.
4142
.2N
O]9
.76
4.03
9.85
NO
<0.0
12.
822.
62N
D7.
6012
.02
NO
12.2
01.
8019
.90
NO7.
39
797.
10.
6264
.3<0
.01
39.7
11.
609.
980.
53N
O7.
462.
692.
085.
299.
81N
O6.
29N
O3.
37N
O11
.20
797.
20.
6264
.5<0
.01
33.6
42.
2512
.36
1.23
NO
14.4
01.
081.
914.
2310
.3]
NO
5.14
NO
0.83
NO
12.6
2
797.
30.
5559
.7<0
.01
37.3
82.
8710
.92
1.82
NO
2.51
1.80
3.10
3.97
12.7
0N
O5.
38N
O3.
40N
O14
.16
797.
40.
6153
.9N
O34
.53
0.89
1].0
31.
58N
O1.
311.
193.
124.
3410
.61
NO
4.42
NO
0.36
NO
26.6
1
798.
11.
4066
.0N
O36
.82
2.72
11.1
20.
88N
O8.
383.
392.
889.
308.
62N
O9.
31N
O0.
72N
O5.
8679
9.]
0.50
50.5
NO
31.3
73.
826.
5523
.74
6.54
3.18
4.64
2.21
3.92
9.80
NO
0.62
NO
0.65
NO
2.95
799.
20.
3848
.2<0
.01
29.6
91.
387.
6627
.30
7.56
2.66
2.38
3.06
3.63
9.18
NO
0.35
NO
2.9]
0.25
1.99
tv79
9.3
1.57
54.9
ND
33.7
21.
397.
6019
.72
3.06
2.27
4.75
2.18
4.49
]2.2
0N
O2.
850.
151.
040.
044.
55~
799.
40.
3241
.3N
O26
.89
4.95
13.5
417
.08
NO
4.39
3.00
2.05
2.17
5.85
NO
7.3]
ND
10.9
11.
000.
88
800.
10.
6652
.6N
O34
.95
7.19
12.8
314
.04
1.46
3.86
5.65
1.53
6.41
5.90
NO
1.80
NO
0.93
NO
3.45
800.
20.
1548
.5N
O27
.20
3.89
7.77
15.5
42.
338.
3413
.22
1.11
3.34
8.47
NO
1.11
NO
6.55
-N
O1.1
180
0.3
0.07
40.5
NO
25.3
02.
535.
905.
902.
532.
354.
220.
783.
138.
93N
O0.
47N
O37
.95
NO
ND
800.
40.
3446
.6N
D23
.22
5.56
10.8
115
.78
1.3]
2.60
4.92
1.57
6.30
12.8
7N
O5.
13N
D6.
18N
O3.
73
803.
10.
1450
.2-
NO
31.8
43.
7014
.81
11.1
10.
742.
567.
401.
523.
3410
.90
NO
1.30
NO
10.0
1N
O0.
78
803.
20.
0514
.0N
ON
D1.
0010
.00
NO
1.00
5.00
3.00
NO
7.00
2.00
ND
5.00
1.00
65.0
0N
ONO
803.
30.
2251
.9N
O26
.70
4.92
14.0
512
.03
1.41
3.49
10.0
02.
976.
5712
.19
NO
3.59
NO
2.08
NO
NO80
3.4
0.07
48.4
NO
23.4
33.
17]5
.83
9.50
0.63
1.83
4.43
3.67
5.50
13.9
3N
O4.
47N
O13
.60
ND
NO80
4.1
0.16
47.7
0.01
23.8
413
.09
3.08
11.3
4N
O2.
0011
.66
1.24
4.48
16.1
7N
O3.
030.
709.
20N
O0.
15
1141
.20.
4845
.3<0
.01
23.2
74.
2919
.70
13.2
0N
O4.
165.
374.
056.
077.
75N
O7.
75N
O1.
96N
O2.
41
1141
.30.
8547
.2N
O27
.52
5.08
15.4
114
.98
0.62
2.78
4.89
1.57
7.46
7.86
NO
6.70
ND
NO
NO
5.13
lf42
.10.
3442
.9N
D22
.73
7.10
17.1
020
.66
0.71
4.32
5.00
2.87
3.61
9.40
NO
6.50
NO
NO
NO
ND11
56.1
0.96
52.4
NO
29.2
22.
888.
2817
.76
NO
2.50
1.80
2.24
5.77
12.6
4N
O4.
04N
O2.
270.
0910
.51
1156
.21.
0041
.6N
O28
.01
3.04
10.0
520
.36
0.74
1.21
0.77
1.00
2.78
8.59
NO
2.76
NO
1.62
0.01
19.0
7
1156
.31.
3248
.5N
O31
.44
1.73
12.1
219
.26
0.01
1.32
3.84
1.78
4.77
9.24
No
3.57
NO
1.91
NO
9.00
1]56
.40.
9337
.3N
O26
.41
2.90
10.9
719
.50
<0.0
10.
310.
632.
002.
446.
13N
O1.
833.
841.
22N
O21
.81
1157
.10.
4351
.7<0
.01
33.0
31.
2610
.71
16.2
0N
O5.
273.
094.
483.
755.
010.
191.
14N
O11
.25
NO
4.62
1157
.21.
1844
.5<0
.01
32.5
02.
2917
.67
22.2
2N
O1.
991.
262.
512.
804.
68N
O0.
09N
ON
ON
O12
.00
1157
.31.
6550
.1<0
.01
34.7
23.
0915
.78
20.1
4N
O2.
001.
843.
065.
604.
70N
O0.
05N
ON
DN
D9.
00
App
endi
xD
Sam
ple
Wt%
Wt%
MA
GIL
MG
AR
STA
EP
IPY
RSI
KTO
ULE
UR
UT
ZIR
MO
NPH
OG
LA
SUL
CA
RO
THN
um
ber
THM
EUM~
Wt%
lVt%
Wt9
'.,~
\Vt%
Wt%
Wt%
JY!.2
'£lV
t%W
t%~~
Wt%
Wt%
Wt%
Wt%
1157
.42.
0647
.9N
O35
.51
2.89
15.8
420
.42
NO
1.29
1.23
2.35
3.14
5.60
NO
3.05
NO
0.45
NO
8.23
1162
.11.
2254
.4N
O37
.14
4.58
15.2
97.
930.
173.
845.
130.
366.
566.
49N
O7.
45N
ON
ON
D5.
0511
62.2
3.25
37.4
NO
18.2
81.
4513
.20
6.44
NO
2.02
0.78
2.02
7.05
8.07
NO
7.13
NO
1.83
NO
31.7
42O
OCl.1
0.11
51.3
NO
26.0
82.
3012
.67
24.1
70.
775.
438.
835.
036.
967.
76N
ON
ON
ON
DN
ON
O20
00.2
0.08
61.1
ND
31.7
60.
117.
15]9
.31
2.32
6.76
7.75
5.28
8.80
8.54
ND
0.45
ND
ND
ND
0.45
2000
.30.
4159
.8N
D31
.29
1.51
7.99
21.9
10.
024.
618.
198.
975.
998.
95N
O0.
47N
ON
ON
O0.
1020
00.4
0.69
63.4
<0.0
135
.38
0.99
10.2
220
.19
0.04
3.98
4.03
6.19
9.05
8.79
NO
ND
NO
NO
NO
1.15
Co
un
t(n
):11
311
319
109
109
112
108
71II
I10
610
011
311
3I
101
II78
2091
Ave
rage
:0.
5145
.78
0.15
26.6
03.
4211
.31
13.3
45.
484.
274.
483.
044.
478.
770.
193.
830.
9816
.00
3.30
5.13
Max
imum
:3.
2568
.87
1.58
48.2
128
.27
28.5
934
.61
30.0
022
.84
]7.1
38.
979.
302
].3
40.
1914
.43
3.84
88.0
321
.63
31.7
4M
inim
um:<
O.O
I4.
61<
0.01
2.00
0.44
0.81
0.31
<0.
010.
200.
250.
360.
791.
000.
190.
020.
05<
0.01
0.01
0.10
Sta
n.D
ev:
0.50
13.8
00.
459.
353.
385.
698.
797.
403.
273.
061.
691.
883.
95n/
a3.
171.
0822
.77
5.35
5.86
N U'I
,"

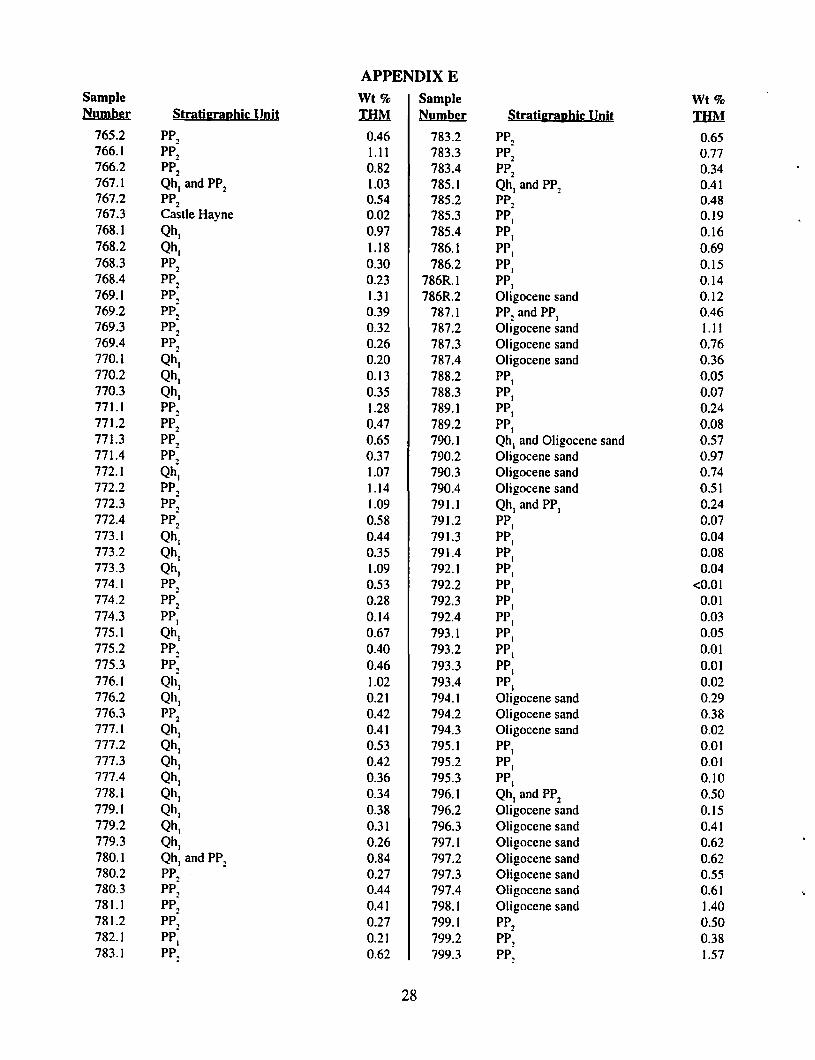
APPENDIX E
Table showing sample number, preliminary stratigraphic unit, and weight percent total heavy minerals(THM) for all CERC vibracore samples from the Cape Fear cuspate foreland project area. See text fordescriptions of units and for key to abbreviations used.
Note that this table includes samples for which mineralogical and textural data have been given inearlier project reports (Hoffman and others, 1991; Nickerson and others, 1993). Those reports did notreflect the stratigraphic work done under this phase of the study.
26

APPENDIXESample Wt% Sample Wt%Number Stratigraphic Unit IBM Number Stratigraphic Unit TI:IM
718.1 River Bend 0.22 739.2 PP2 0.09719.1 Oligocene sand 0.74 739.3 PP
2 0.06719.2 River Bend 0.18 740.1 PP2 0.87720.3 Oligocene sand 0.50 740.2 PP. 0.03720.4 Oligocene sand 1.16 740.3 PP. 0.02721.1 PP2 0.86 741.1 PP2 0.33721.2 PP2 0.54 741.2 Castle Hayne 0.06722.1 Qh. 1.28 741.3 Castle Hayne 0.07722.2 PP2 0.07 741.4 Castle Hayne 0.06722.3 PP2 1.11 742.1 PP2 0.47723.1 PP2 0.49 742.2 PP2 0.86723.2 PP. 0.06 742.3 Paleocene 0.73724.1 PP2 0.44 743.1 Qh. and PP2 0.69724.2 PP2 0.64 743.2 Paleocene 0.30724.3 Pungo River 1.00 745.1 PP2 1.31726.1 Qh, and PPz 0.48 745.2 PP2 0.12
726R.I PP2 0.07 745.3 PP2 0.04726R.2 PP2 0.12 745.4 PP2 0.50726R.3 PP: 0.17 747.1 Qh. 0.28726R.4 PP2 0.69 748.1 ?????? 0.31
727.1 PP2 0.18 748.2 ?????? 0.18727.2 PP. and Paleocene? 0.02 749.1 ?????? 0.25727.3 Paleocene 0.52 750.1 PP2 0.55727.4 Paleocene 0.23 751.1 PP2 0.74728.1 PP2 0.28 751.2 Paleocene 1.10728.2 PP2 0.01 752.1 Castle Hayne 0.18728.3 PP2 0.05 753.1 Qh. and PP2and PP. 0.28729.1 PP2 and Peedee? 0.67 754.1 PP2 and n??? 0.42729.2 Peedee 0.95 754R.1 Qh. 1.98730.1 Peedee 0.27 754R.2 Qh. 0.90731.1 PP2 and Peedee? 0.82 754R.3 Qh. 1.35731.2 Pcedee 0.22 754R.4 Qh. 0.94732.1 Peedee 0.23 755.1 Castle Hayne 0.09732.2 Peedee 0.21 755.2 Castle Hayne 0.05732.3 Peedee 0.16 756.1 PP1 0.10733.1 Qh. and PP2 and Peedee 2.11 756.2 PP1
0.07734.1 Qh. and PP2 1.84 757.1 Qh. 0.39734.2 PP2 and Paleocene? 0.84 758.1 Peedee 0.61735.1 PP2 0.86 759.1 Qh, 0.98735.2 PP2 0.55 759.2 PP2 1.26735.3 Peedee 0.70 760.1 Qh. 1.02736.1 Qh. and Paleocene? 0.95 760.2 Qh. 0.37736.2 Paleocene 0.98 761.1 PP, 0.43737.1 PP2 0.99 761.2 PP: and ?? 0.26737.2 PP2 0.14 762.1 PP2
0.48737.3 PP2 0.22 763.1 PP2 0.73737.4 PP2 0.09 763.2 PP2 0.32738.1 PP: 0.58 763.3 PP2 0.64738.2 PP2 0.67 764.1 Qh. 0.83738.3 Oligocene sand 0.83 764.2 PP: 0.55738.4 Oligocene sand 0.62 764.3 PPz 0.22739.1 PP2 0.69 765.1 PPz 0.63
27
APPENDIXESample Wt% Sample Wt%Number Stratigraphic Unit IHM Number Stratigraphic Unit mM
765.2 PP2 0.46 783.2 PP
2 0.65766.1 PP
21.1] 783.3 PP
2 0.77766.2 PP
2 0.82 783.4 PPz 0.34767.1 Qh. and PPz 1.03 785.1 Qh. and PPz 0.4]767.2 PP
2 0.54 785.2 PPz 0.48767.3 Castle Hayne 0.02 785.3 PP. 0.19768.] Qh. 0.97 785.4 PP. 0.16768.2 Qh. 1.18 786.1 PP. 0.69768.3 PP
2 0.30 786.2 PP. 0.]5768.4 PP: 0.23 786R.] PP. 0.14769.1 PP, 1.31 786R.2 Oligocene sand 0.12769.2 PP: 0.39 787.] PPz and PP. 0.46769.3 PP: 0.32 787.2 Oligocene sand 1.11769.4 PPz 0.26 787.3 Oligocene sand 0.76770.1 Qh. 0.20 787.4 Oligocene sand 0.36770.2 Qh. 0.13 788.2 PP. 0.05770.3 Qh. 0.35 788.3 PP1 0.07771.1 PP, 1.28 789.] PP
1 0.24771.2 PP: 0.47 789.2 PP1 0.0877].3 PP
2 0.65 790.1 Qh. and Oligocene sand 0.5777].4 PP: 0.37 790.2 Oligocene sand 0.97772.1 Qh. 1.07 790.3 Oligocene sand 0.74772.2 PP, 1.14 790.4 Oligocene sand 0.51772.3 PP: 1.09 791.1 Qh. and PP. 0.24772.4 PP: 0.58 791.2 PP. 0.07773.1 Qh
1 0.44 791.3 PP. 0.04773.2 Qh
1 0.35 791.4 PP. 0.08773.3 Qh
1 1.09 792.1 PP. 0.04774.1 PPz 0.53 792.2 PP. <0.01774.2 PP, 0.28 792.3 PP. 0.01774.3 PP: 0.14 792.4 PP. 0.03775.1 Qh
l 0.67 793.1 PP. 0.05775.2 PPz 0.40 793.2 PP. 0.01775.3 PP, 0.46 793.3 PP. 0.0]776.1 Qh~ 1.02 793.4 PP. 0.02776.2 Qh
l 0.2] 794.1 Oligocene sand 0.29776.3 PPz 0.42 794.2 Oligocene sand 0.38777.1 Qh
l0.4] 794.3 Oligocene sand 0.02
777.2 Qhl 0.53 795.] PP1 om
777.3 Qhl 0.42 795.2 PP
J om777.4 Qh
l 0.36 795.3 PP. 0.10778.] Qh
l 0.34 796.1 Qh. and PP2 0.50779.1 Qh
l 0.38 796.2 Oligocene sand 0.15779.2 Qh
l 0.31 796.3 Oligocene sand 0.41779.3 Qh. 0.26 797.1 Oligocene sand 0.62780.1 Qh l and PPz 0.84 797.2 Oligocene sand 0.62780.2 PP, 0.27 797.3 Oligocene sand 0.55780.3 PP: 0.44 797.4 Oligocene sand 0.6]78].1 PP: 0.4] 798.1 Oligocene sand ].4078].2 PP: 0.27 799.1 PP: 0.50782.1 PP. 0.2] 799.2 PP: 0.38783.1 PP: 0.62 799.3 PPz 1.57
28
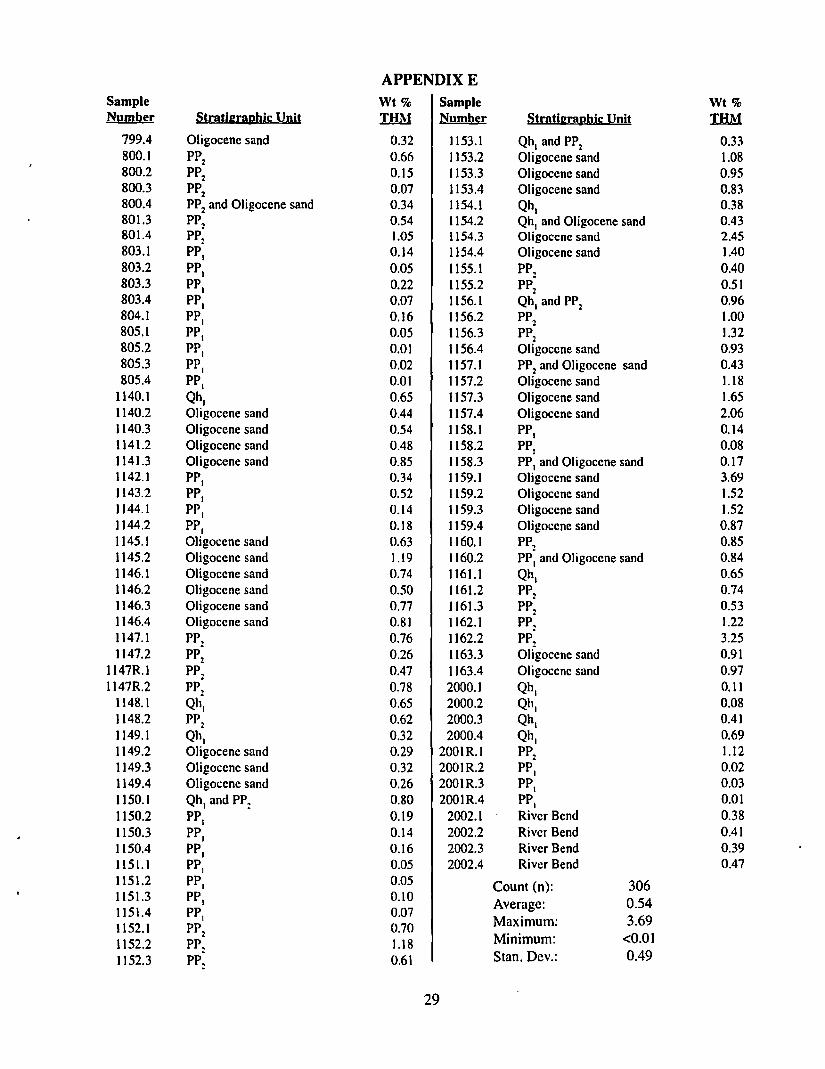
APPENDIXESample Wt% Sample Wt%Number Stratigraphic Unit TI!M Number Strath:raphic Unit IHM
799.4 Oligocene sand 0.32 1153.1 Qh, and PP2 0.33800.1 PP2 0.66 1153.2 Oligocene sand 1.08800.2 PP2 0.15 1153.3 Oligocene sand 0.95800.3 PP2 0.07 1153.4 Oligocene sand 0.83800.4 PP2 and Oligocene sand 0.34 1154.1 Qh. 0.38801.3 PP2 0.54 1154.2 Qh l and Oligocene sand 0.43801.4 PP: 1.05 1154.3 Oligocene sand 2.45803.1 PP
1 0.14 1154.4 Oligocene sand 1.40803.2 pp\ 0.05 1155.1 PP: 0.40803.3 PP1 0.22 1155.2 PP2 0.51803.4 PP1 0.07 1156.1 Qh, and PP2 0.96804.1 PP1 0.16 1156.2 PP: 1.00805.1 PPt 0.05 1156.3 PP2 1.32805.2 PP1 0.01 1156.4 Oligocene sand 0.93805.3 PP1 0.02 1157.1 PP: and Oligocene sand 0.43805.4 pp\ 0.01 1157.2 Oligocene sand U8
1140.1 Qhl 0.65 1157.3 Oligocene sand 1.65
1140.2 Oligocene sand 0.44 1157.4 Oligocene sand 2.061140.3 Oligocene sand 0.54 1158.1 PP. 0.141141.2 Oligocene sand 0.48 1158.2 PP1
0.081141.3 Oligocene sand 0.85 1158.3 PP I and Oligocene sand 0.171142.1 PP1 0.34 1159.1 Oligocene sand 3.691143.2 PP1 0.52 1159.2 Oligocene sand 1.521144.1 PP1 0.14 1159.3 Oligocene sand 1.521144.2 PP1 0.18 1159.4 Oligocene sand 0.871145.1 Oligocene sand 0.63 1160.1 PP: 0.851145.2 Oligocene sand 1.19 1160.2 PP1 and Oligocene sand 0.841146.1 Oligocene sand 0.74 1161.1 Qh, 0.651146.2 Oligocene sand 0.50 1161.2 PP: 0.741146.3 Oligocene sand 0.77 1161.3 PP2
0.531146.4 Oligocene sand 0.81 I162.1 PP: 1.221147.1 PP: 0.76 1162.2 PP: 3.251147.2 PP2 0.26 1163.3 Oligocene sand 0.91
1147RI PP2 0.47 1163.4 Oligocene sand 0.971147R2 PP: 0.78 2000.1 Qh, 0.11
1148.1 Qhl 0.65 2000.2 Qh
l0.08
1148.2 PP2 0.62 2000.3 Qht 0.411149.1 Qh
l 0.32 2000.4 Qhl
0.691149.2 Oligocene sand 0.29 200lRI PP2 1.121149.3 Oligocene sand 0.32 200IR.2 PP1 0.021149.4 Oligocene sand 0.26 200IR3 PPt 0.031I50.1 Qh l and PP: 0.80 200IR4 PP1
om1150.2 PP1 0.19 2002.1 River Bend 0.381150.3 PP1 0.14 2002.2 River Bend 0.411150.4 PP1 0.16 2002.3 River Bend 0.391151.1 PP1 0.05 2002.4 River Bend 0.471151.2 PP1 0.05 Count (n): 3061151.3 PP1 0.10
Average: 0.541151.4 PP, 0.07
Maximum: 3.691152.1 PP2 0.701152.2 PP: 1.18 Minimum: <0.01
1152.3 PP: 0.61 Stan. Dev.: 0.49
29


![[Beverly nickerson] sample_preparation_of_pharmace(bookos.org)](https://img.pdfslide.net/doc/110x75/55d0b94abb61ebcf718b4638/beverly-nickerson-samplepreparationofpharmacebookosorg.jpg)