Embed Size (px)
Citation preview
Minerals: Fish and Beef Cows
John PatersonExtension Beef SpecialistMontana State University

The Use of Rainbow Trout as a Biological Model for Beef Cattle: Are there similarities?
Liz Reed- MS Candidate in Animal Science

“Comparison of the Bioavailability of Copper Sulfate vs. Copper Lysine
in Rainbow Trout.”
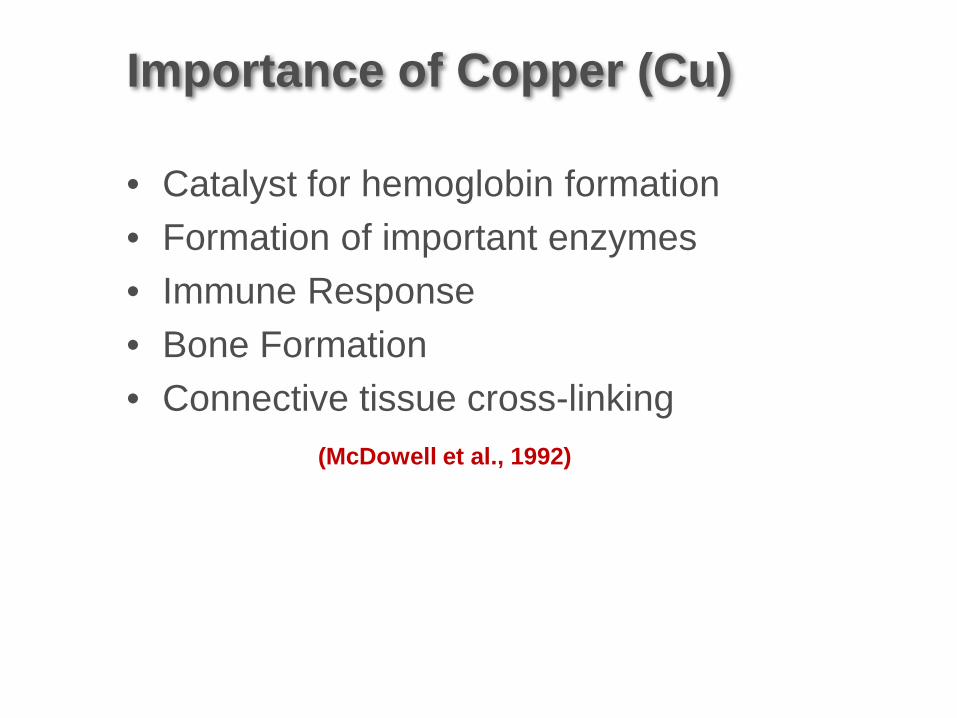
Importance of Copper (Cu)
• Catalyst for hemoglobin formation• Formation of important enzymes• Immune Response• Bone Formation• Connective tissue cross-linking
(McDowell et al., 1992)
Rationale to examine Cu needs of Rainbow Trout
• Shift to plant-based diets • New Cu sources available• Lower costs• Improve growth• Reduce pollution in aquaculture facilities
(Tan and Mai et. al., 2001)
Cu Source Comparisons in Rainbow Trout
• “Effects of different ligands on the bioaccumulation and subsequent depuration of dietary Cu and Zn in juvenile rainbow trout”(Kjoss et al. 2006)
• Equivalent Cu accumulation between CuSO4 and CuLys.
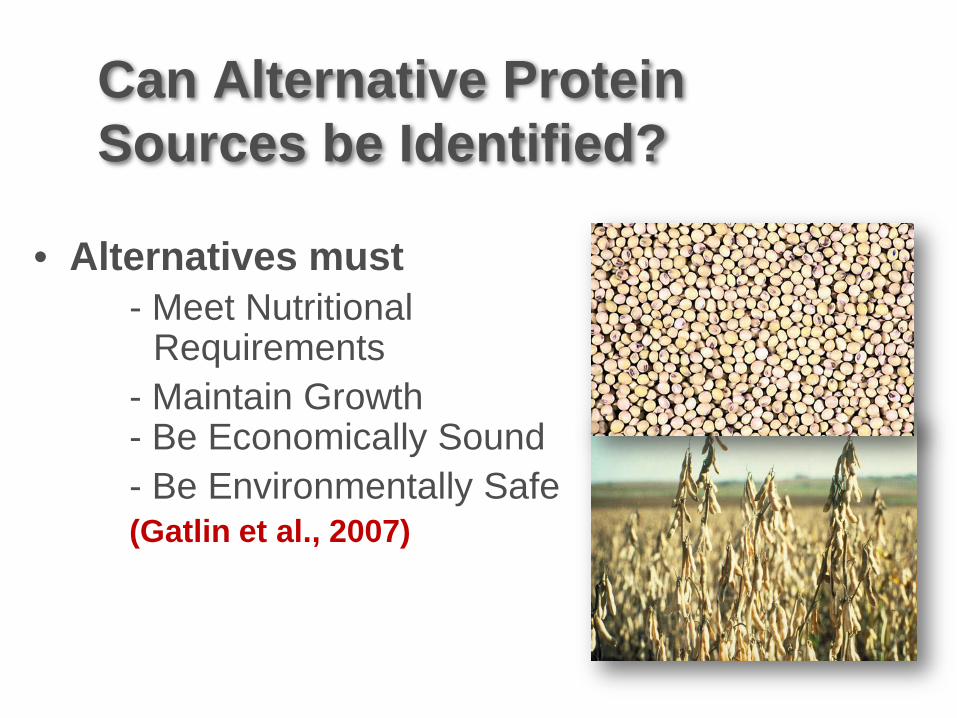
Can Alternative Protein Sources be Identified?
• Alternatives must - Meet Nutritional
Requirements- Maintain Growth - Be Economically Sound- Be Environmentally Safe(Gatlin et al., 2007)
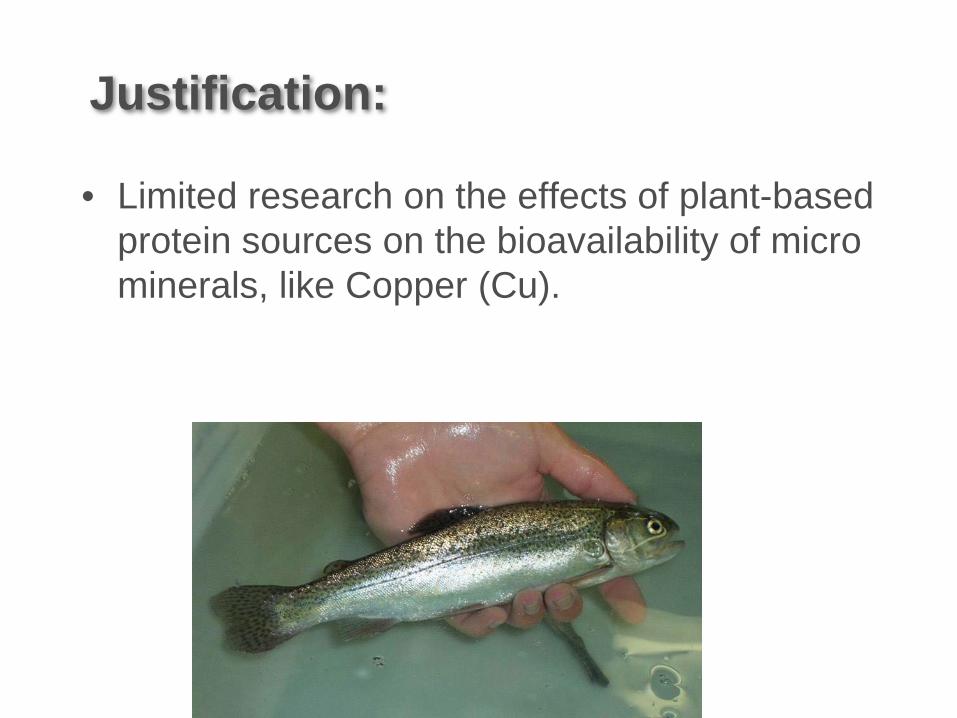
Justification:
• Limited research on the effects of plant-based protein sources on the bioavailability of micro minerals, like Copper (Cu).

Fish:
• Juvenile rainbow trout obtained from Trout Lodge, WA
• Average initial weight-28g (+/- 1.2 g)

Feeding
• Fish fed to visual satiation twice daily, six days a week
Plant-based pellet Fishmeal-based pellet

Results:
Copper source- CuSO4 vs CuLysCopper level- 0,5,10,15 and 20 ppm in the
dietProtein source- Plant-based vs. Fishmeal-
basedAny interactions

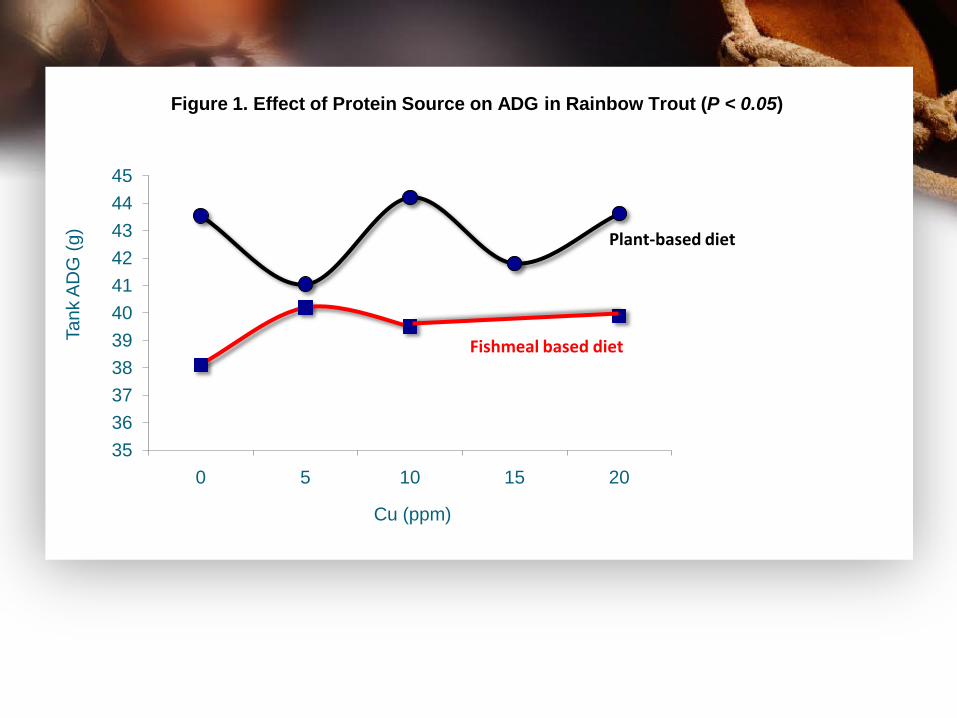
After 12 weeks there were no differences between copper sources (Sulfate vs. Lysine) for performance or uptake of copper by the liver.
3536373839404142434445
0 5 10 15 20
Tank
AD
G (g
)
Cu (ppm)
Figure 1. Effect of Protein Source on ADG in Rainbow Trout (P < 0.05)
Fishmeal based diet
Plant-based diet
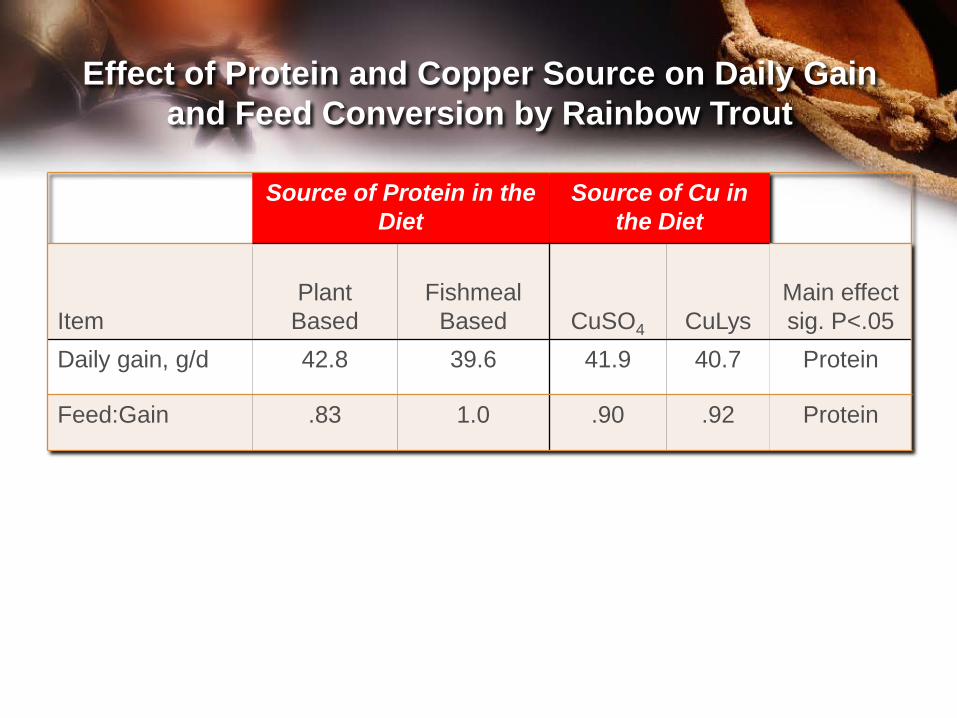
Source of Protein in the Diet
Source of Cu in the Diet
ItemPlant
BasedFishmeal
Based CuSO4 CuLysMain effectsig. P<.05
Daily gain, g/d 42.8 39.6 41.9 40.7 Protein
Feed:Gain .83 1.0 .90 .92 Protein
Effect of Protein and Copper Source on Daily Gain and Feed Conversion by Rainbow Trout
39.5
40
40.5
41
41.5
42
42.5
0 5 10 15 20
AD
G (
g)
Dietary Cu (ppm)
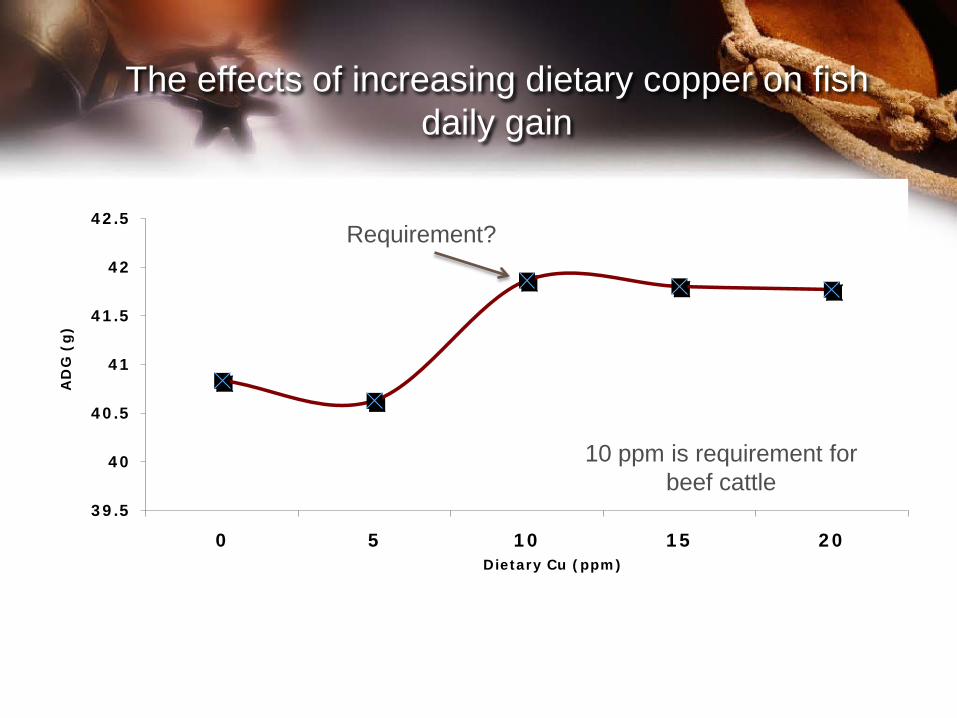
Requirement?
The effects of increasing dietary copper on fish daily gain
10 ppm is requirement for beef cattle
40
50
60
70
80
90
100
110
120
0 5 10 15 20
pp
m in
liv
er
Dietary Copper Concentration, ppm
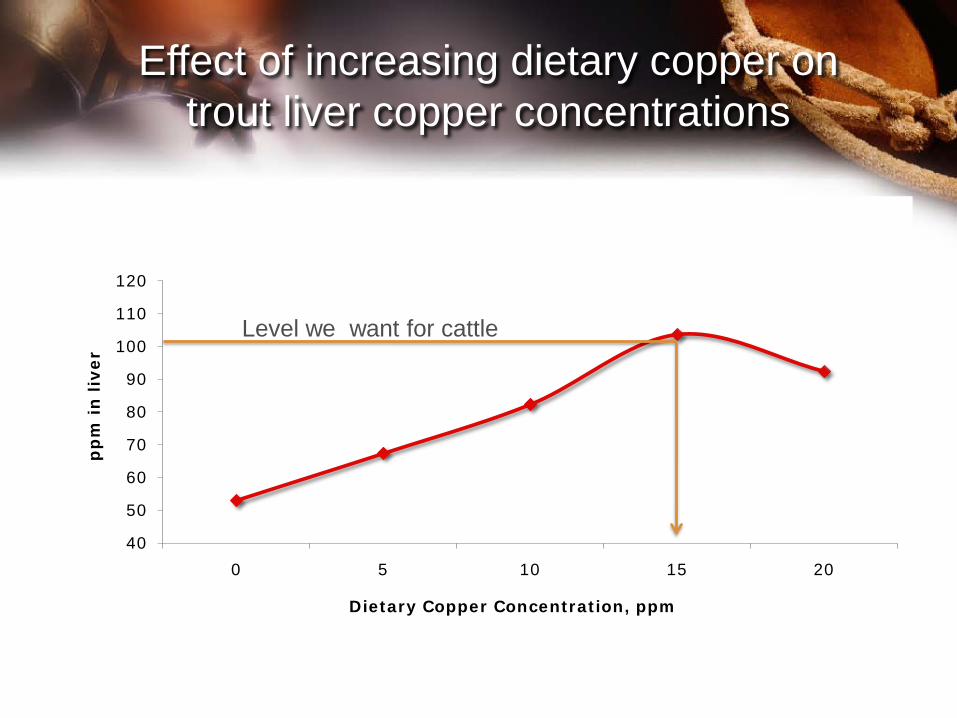
Effect of increasing dietary copper on trout liver copper concentrations
Level we want for cattle

0
20
40
60
80
100
120
140
0 5 10 15 20
µg C
u/g
liver
Cu (ppm)
Effects of Protein Source and Cu level on Liver Cu Levels in Rainbow Trout (P < 0.05)
Fishmeal based
Plant based

• The Effects of Forage Quality and Mineral Supplementation on Feeding Behavior by
Cattle”

Ricardo Manzano- PostDoc from Brazil
Question: How does mineral consumption change if you keep forage availability similar between spring and fall?

Composition of Mineral SupplementNutrient Concentration
Calcium 12.8%
Phosphorus 5.5%
Salt 26.2%
Magnesium 2.5%
Cobalt 34.9 ppm
Copper 2018 ppm
Iodine 183.5 ppm
Manganese 3027 ppm
Selenium 32 ppm
Zinc 6881 ppm
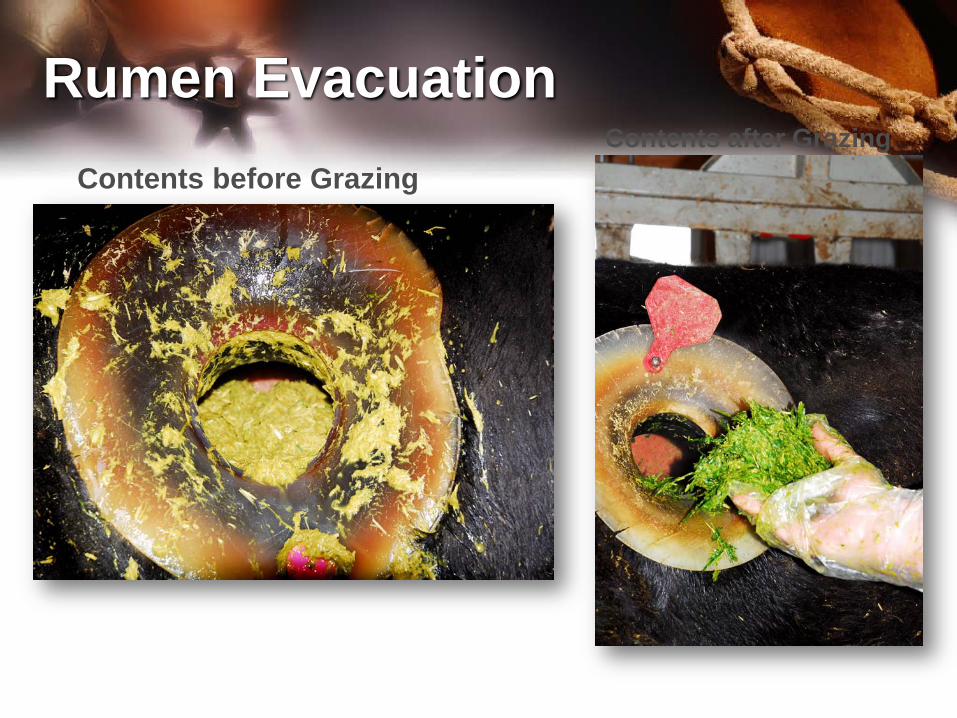
Contents before GrazingContents after Grazing
Rumen Evacuation

Putting the Original Contents Back After Sampling

Changes in forage digestibility for spring and fall pasture forage
3035404550556065707580
1 2 3 4
IVD
MD
,%
Period
Spring forage
Fall forage


050
100150200250300350400
0 1 2 3 4 5
Min
eral
Sup
plem
ent I
ntak
e(g
.day
-1)
Day
Daily Individual Mineral Supplement IntakePeriod 04 (July)
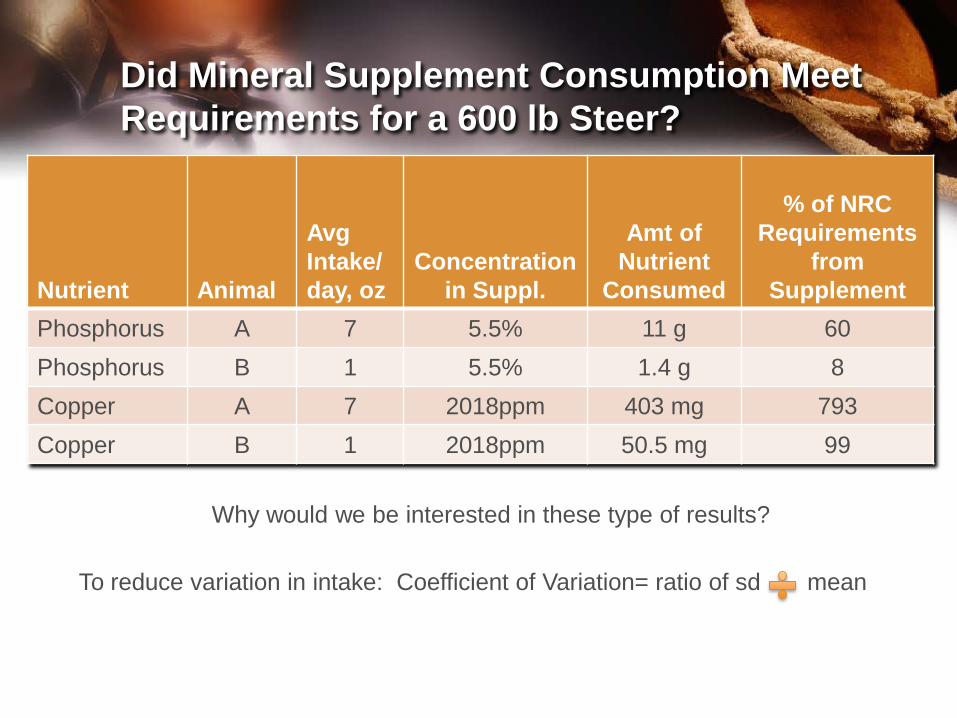
Did Mineral Supplement Consumption Meet Requirements for a 600 lb Steer?
Nutrient Animal
AvgIntake/day, oz
Concentrationin Suppl.
Amt of Nutrient
Consumed
% of NRC Requirements
from Supplement
Phosphorus A 7 5.5% 11 g 60Phosphorus B 1 5.5% 1.4 g 8Copper A 7 2018ppm 403 mg 793Copper B 1 2018ppm 50.5 mg 99
Why would we be interested in these type of results?
To reduce variation in intake: Coefficient of Variation= ratio of sd mean
0
5
10
15
1 2 3 4 5 6 7 8 9 101112131415161718192021222324
Atte
ndan
ce.h
our-1
Hour of the day (24 clock)
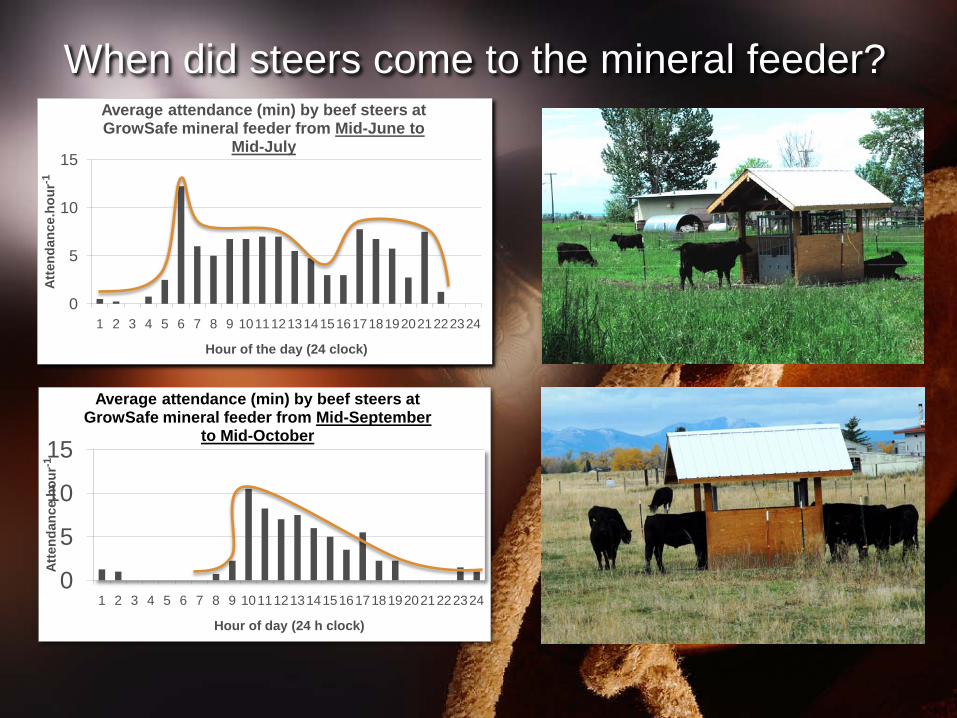
Average attendance (min) by beef steers at GrowSafe mineral feeder from Mid-June to
Mid-July
0
5
10
15
1 2 3 4 5 6 7 8 9 101112131415161718192021222324
Atte
ndan
ce.h
our-1
Hour of day (24 h clock)
Average attendance (min) by beef steers at GrowSafe mineral feeder from Mid-September
to Mid-October
When did steers come to the mineral feeder?
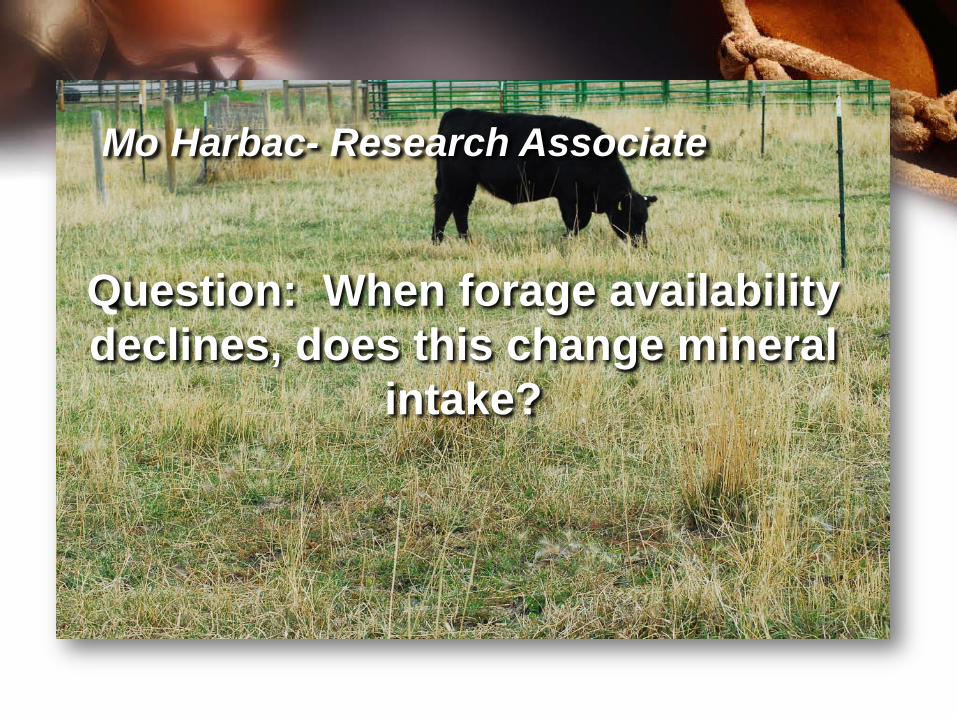
Question: When forage availability declines, does this change mineral
intake?
Mo Harbac- Research Associate

Steers allowed to select white salt only or mineral with no salt (Cafeteria Experiment)

0
2
4
6
8
10
12
14
Con
sum
ptio
n/da
y
First four days of cafeteria feeding
White salt (1 oz)
Mineral with No salt (12oz/day)
7 days pretrial(26% salt in
mineral)
4.5 oz
When given a choice, what will steers prefer, white salt or mineral without salt?

0
2
4
6
8
10
12
0 to 5 6 to 10 11 to 15 16 to 20
Oz
cons
umpt
ion/
day
White salt
Preference for white salt or mineral with no salt by grazing steers
Day of the Experiment
Mineral with no salt
Behavior of Beef Cows When
Supplemented with Magnesium Oxide on Pasture or in
DrylotTess Norville, MS Candidate
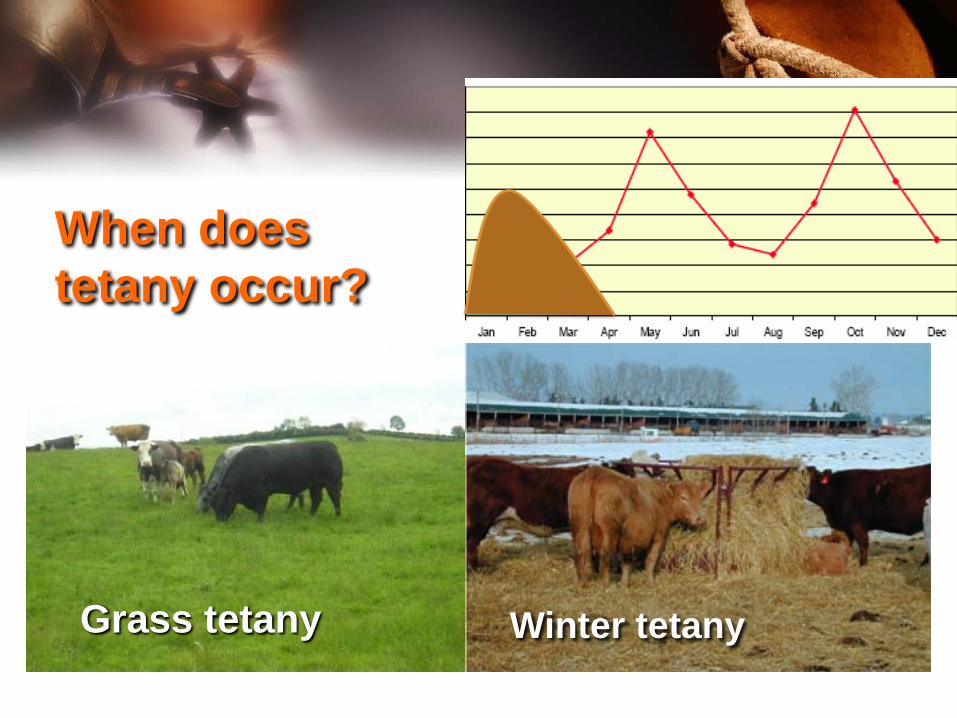
When does tetany occur?
Grass tetany Winter tetany

Symptoms of Tetany• The animal appears apprehensive with the head held high and a mild
tremor. The gait stiffens, and the animal begins to stagger and frequently falls over
• The animal becomes recumbent (lies on its side unable to get up), with marked convulsions
• Other signs, which may be seen at any of these stages, include watery diarrhea, skin that is cold to the touch and a low body temperature
• Death
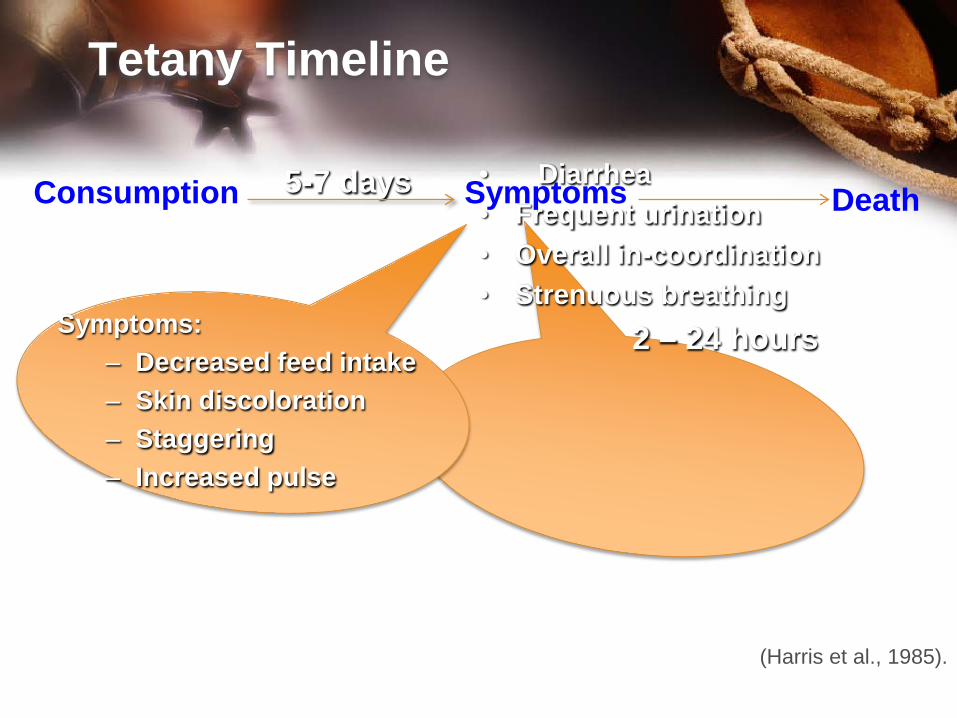
Tetany Timeline
5-7 days
Symptoms:– Decreased feed intake– Skin discoloration– Staggering– Increased pulse
• Diarrhea• Frequent urination• Overall in-coordination• Strenuous breathing
2 – 24 hours
Consumption Symptoms Death
(Harris et al., 1985).

Changes in Serum Mg after 5 daysDue to Tetany Ratio
-53
-52
-51
-50
-49
-48
-47
-46
-45
-44
-43
1.5 2.2 2.9 3.5
Perc
enta
ge c
hang
e fr
om In
itia
l Mg
Tetany RatioP>.10

Can Tetany be Prevented?
• Due to the limited time from consumption to death it is often difficult to diagnose.
• How is tetany prevented/treated?

Sources of Mg for supplements
• Magnesium Oxide– 56-60% Mg
• Magnesium Carbonate– 25.4% Mg
• Magnesium-Chloride– Very soluble, used in liquid feeds.– Used to lower the DCAB ratio.
• Mg Oxide and Mg Carbonate– Good sources of Mg when
evaluated on the basis of feed intake response and absorption(Ammerman et al., 1972).
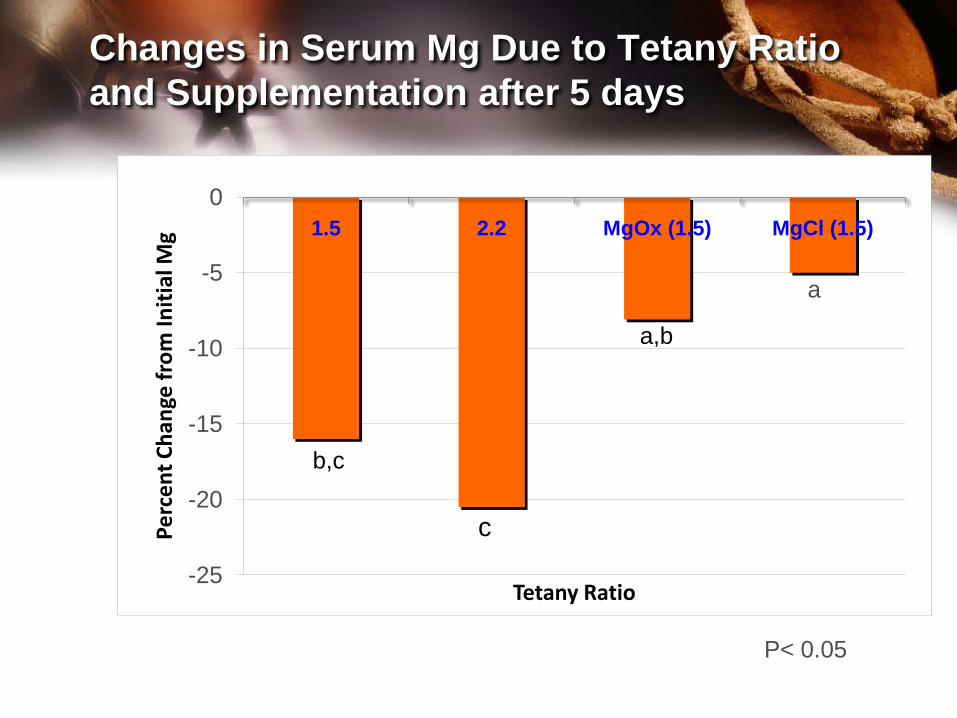
Changes in Serum Mg Due to Tetany Ratio and Supplementation after 5 days
-25
-20
-15
-10
-5
01.5 2.2 MgOx (1.5) MgCl (1.5)
Perc
ent C
hang
e fr
om In
itia
l Mg
Tetany Ratio
a,b
c
b,c
a
P< 0.05

Recent Observations from Univ. of MO
Dale Blevins from Mizzou suggests that during periods of hypomagnesia, providing ad libitumsalt may be beneficialfor increasing Mgconsumption.

Previous Mg Supplementation Research• Frye et al. (1977) examined the palatability of
MgO when combined with:• Trace mineralized salt (1:1 ratio)• Trace mineralized salt and cotton seed meal
(1:1:1 ratio)• Trace mineralized salt and dry sugarcane
molasses (1:1:1 ratio)• Trace mineralized salt and steamed bone meal
(1:1:1 ratio)
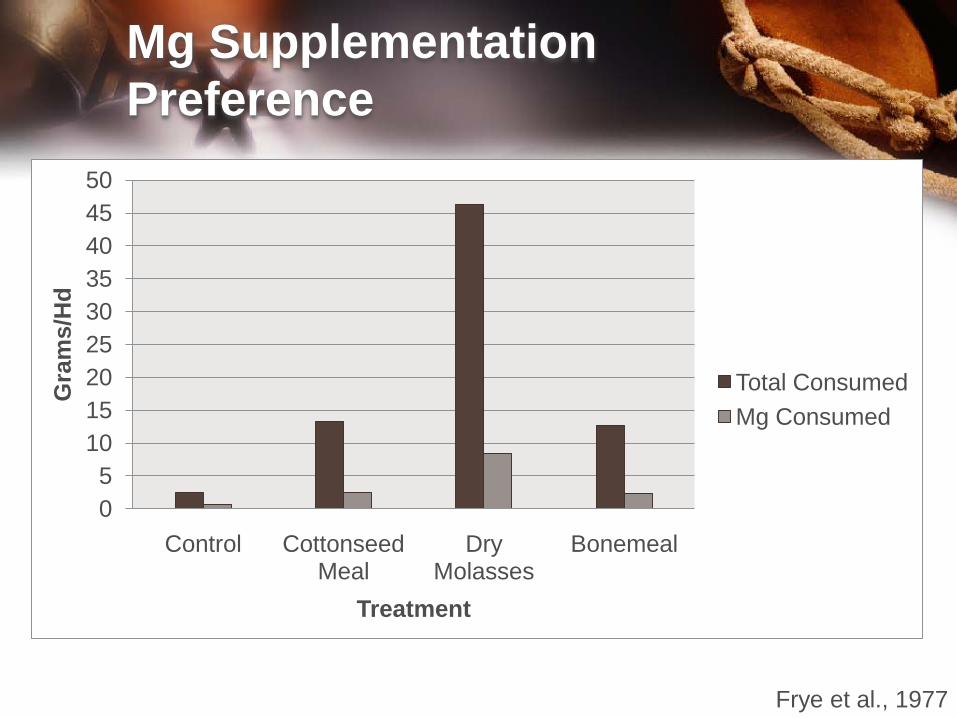
Mg Supplementation Preference
05
101520253035404550
Control Cottonseed Meal
Dry Molasses
Bonemeal
Gra
ms/
Hd
Treatment
Total ConsumedMg Consumed
Frye et al., 1977
Concerns with Mg Supplementation
• Palatability of the free-choice mineral can be enhanced by the addition of other feedstuffs such as protein, energy, molasses, and flavor enhancers.
• Little critical evidence has been presented to show that cattle will consume mineral supplements based upon metabolic requirements (Coppock et al, 1972).

Hypothesis
• Hypothesis 1:– H0: There will be no differences in
consumption, attendance, or duration between the 0.0% Mg supplement or the 10.0% Mg supplement.
• Hypothesis 2:– H0: There will be no differences in
consumption, attendance, or duration between the drylot or the pasture.
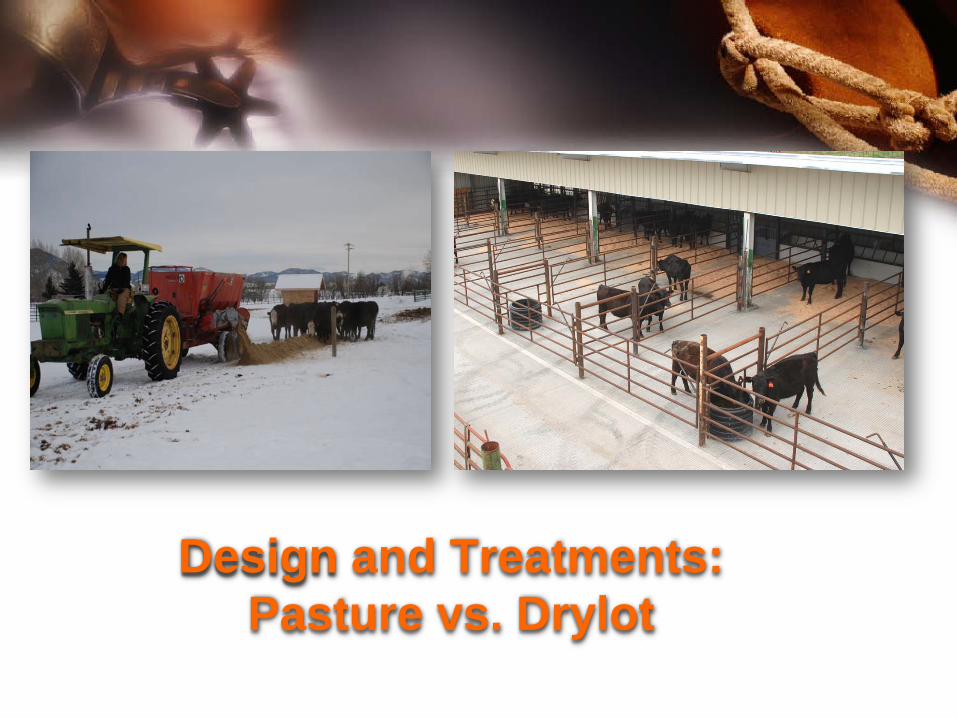
Design and Treatments: Pasture vs. Drylot
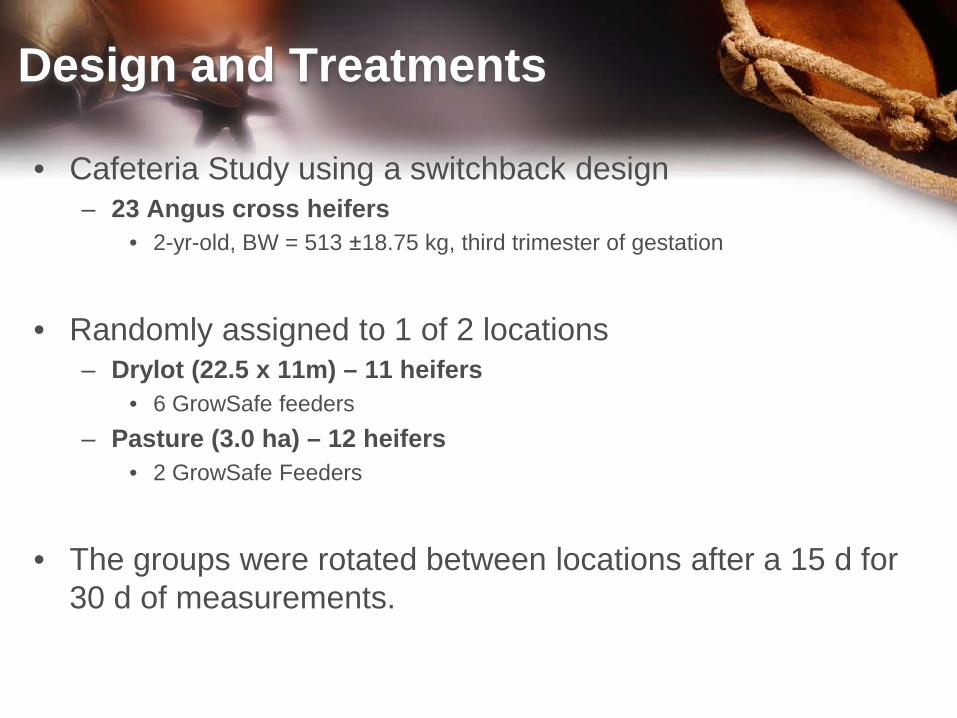
Design and Treatments
• Cafeteria Study using a switchback design– 23 Angus cross heifers
• 2-yr-old, BW = 513 ±18.75 kg, third trimester of gestation
• Randomly assigned to 1 of 2 locations– Drylot (22.5 x 11m) – 11 heifers
• 6 GrowSafe feeders– Pasture (3.0 ha) – 12 heifers
• 2 GrowSafe Feeders
• The groups were rotated between locations after a 15 d for 30 d of measurements.
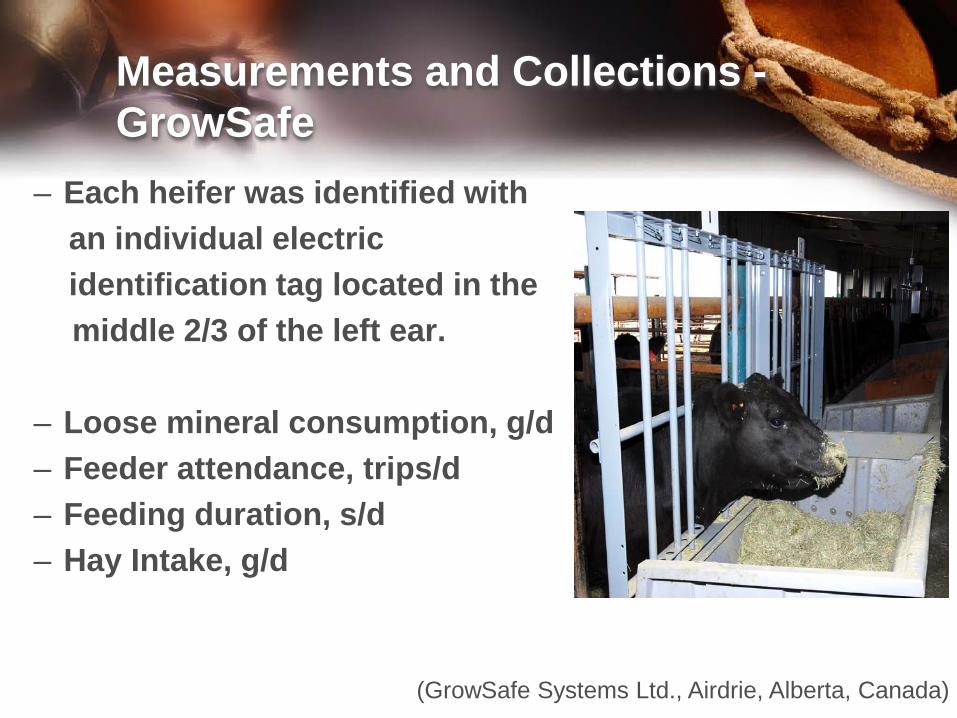
Measurements and Collections -GrowSafe
– Each heifer was identified withan individual electric identification tag located in themiddle 2/3 of the left ear.
– Loose mineral consumption, g/d– Feeder attendance, trips/d– Feeding duration, s/d– Hay Intake, g/d
(GrowSafe Systems Ltd., Airdrie, Alberta, Canada)
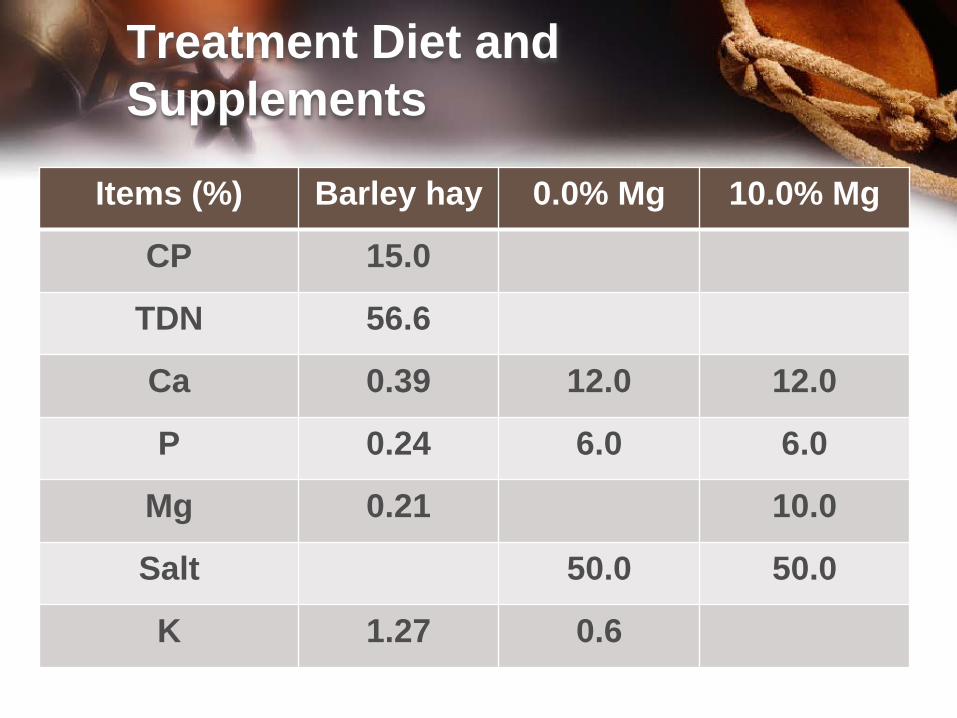
Treatment Diet and Supplements
Items (%) Barley hay 0.0% Mg 10.0% Mg
CP 15.0
TDN 56.6
Ca 0.39 12.0 12.0
P 0.24 6.0 6.0
Mg 0.21 10.0
Salt 50.0 50.0
K 1.27 0.6
Results
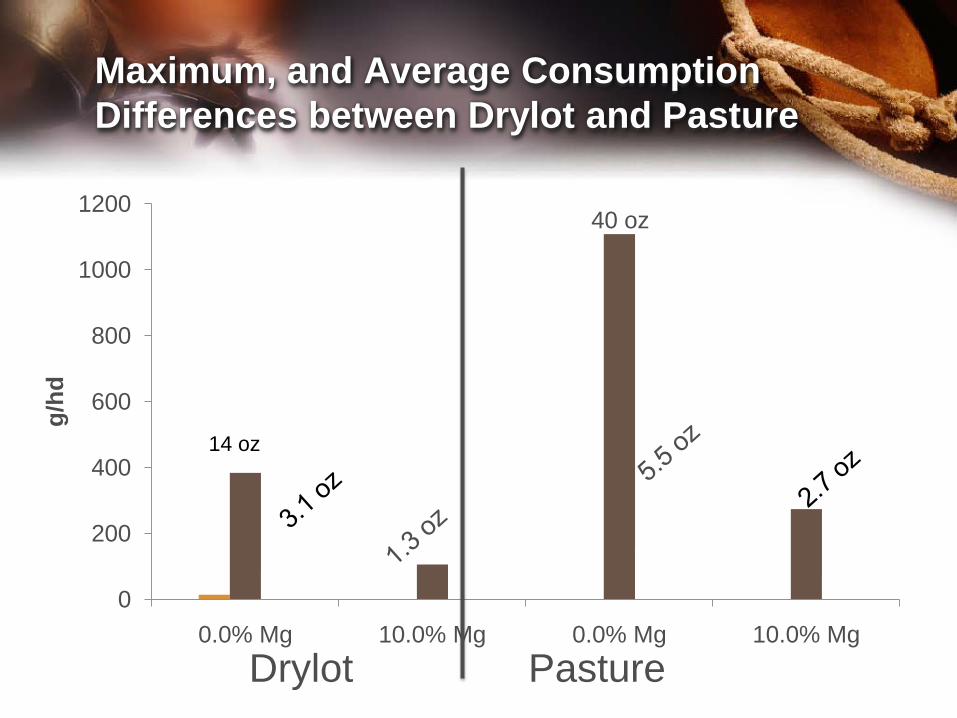
Maximum, and Average Consumption Differences between Drylot and Pasture
0
200
400
600
800
1000
1200
0.0% Mg 10.0% Mg 0.0% Mg 10.0% Mg
g/hd
14 oz
Drylot Pasture
40 oz
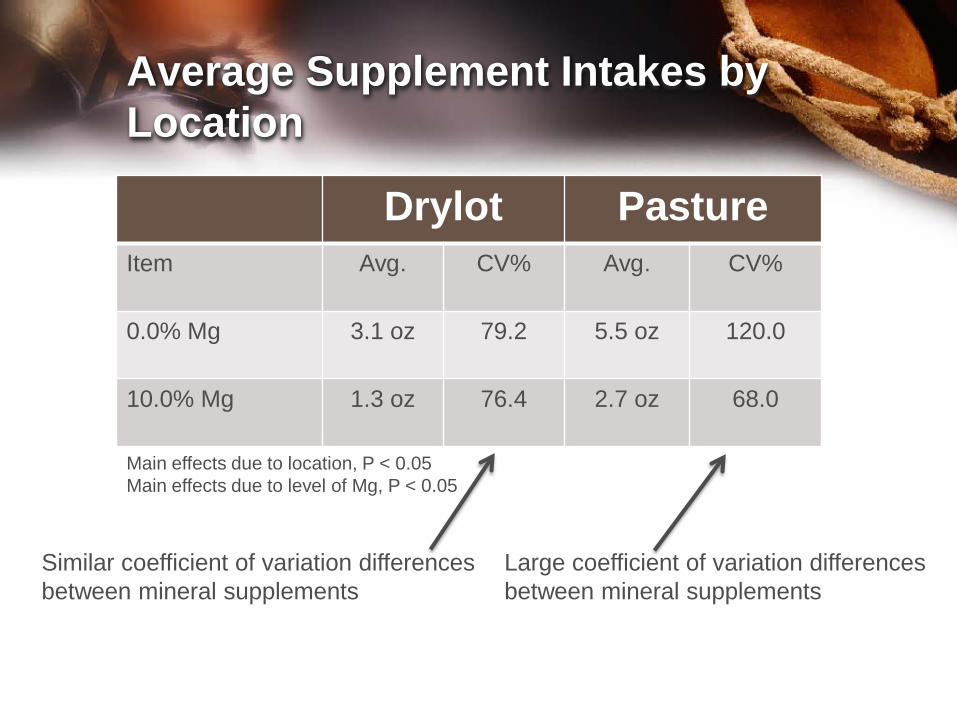
Average Supplement Intakes by Location
Drylot PastureItem Avg. CV% Avg. CV%
0.0% Mg 3.1 oz 79.2 5.5 oz 120.0
10.0% Mg 1.3 oz 76.4 2.7 oz 68.0
Similar coefficient of variation differences between mineral supplements
Large coefficient of variation differences between mineral supplements
Main effects due to location, P < 0.05Main effects due to level of Mg, P < 0.05
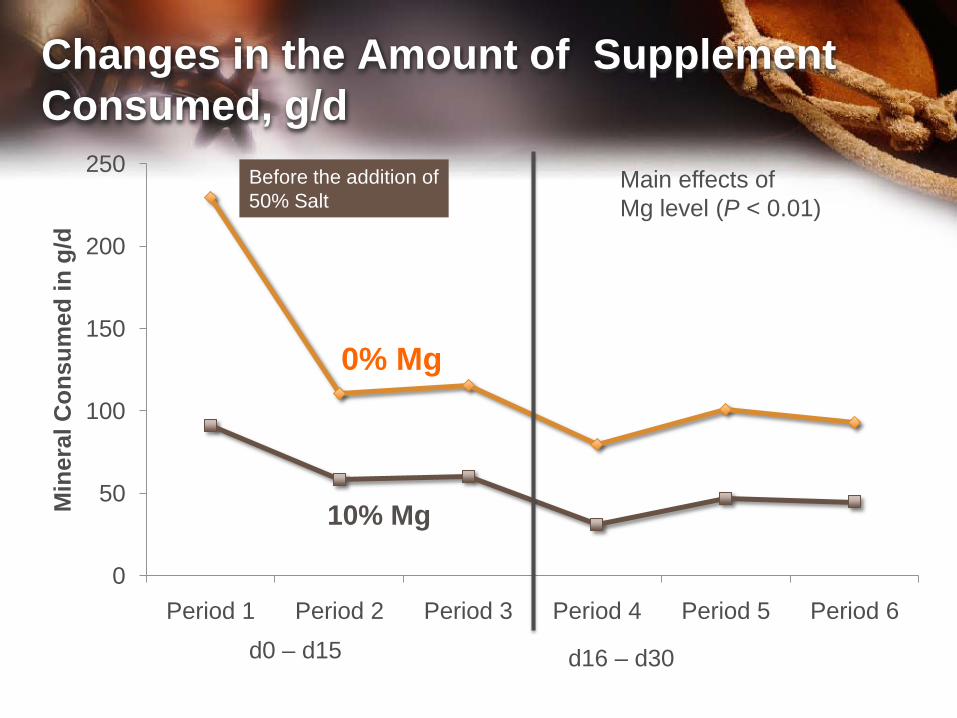
Changes in the Amount of Supplement Consumed, g/d
0
50
100
150
200
250
Period 1 Period 2 Period 3 Period 4 Period 5 Period 6
Min
eral
Con
sum
ed in
g/d
0% Mg
10% Mg
Main effects of Mg level (P < 0.01)
d0 – d15 d16 – d30
Before the addition of 50% Salt

Minimum, Maximum, and Average Differences in Consumption Between the First 15 d and the Second 15 d
0
200
400
600
800
1000
1200
0.0% Mg 10.0 % Mg 0.0% Mg 10.0 % Mg
Gra
ms/
hd
40 oz
d 0 – d15 d16 – d30
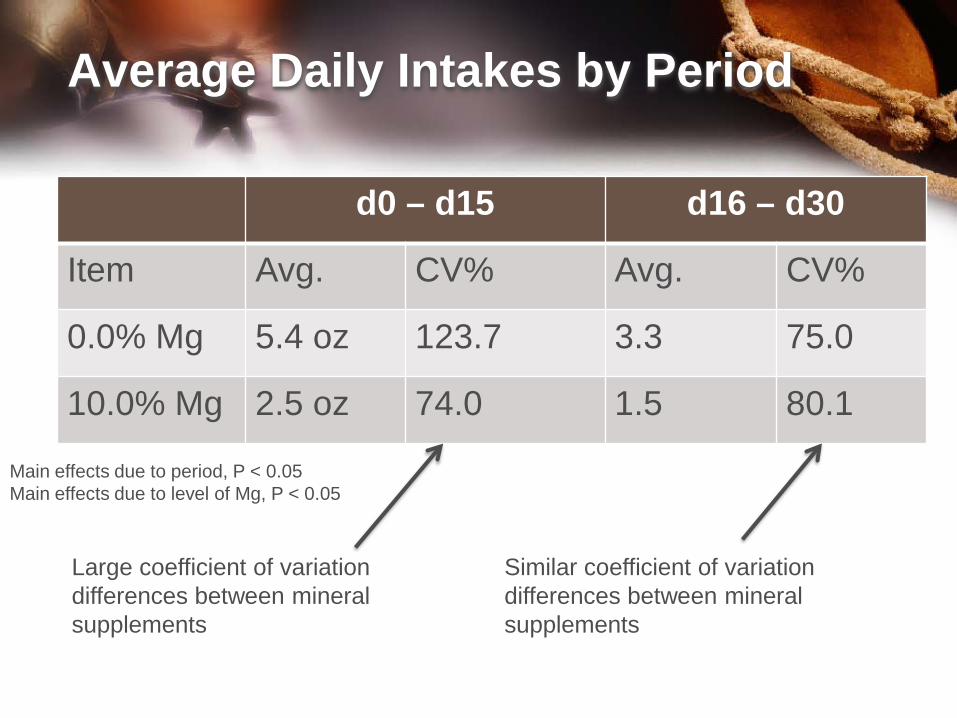
Average Daily Intakes by Period
d0 – d15 d16 – d30
Item Avg. CV% Avg. CV%
0.0% Mg 5.4 oz 123.7 3.3 75.0
10.0% Mg 2.5 oz 74.0 1.5 80.1
Large coefficient of variation differences between mineral supplements
Similar coefficient of variation differences between mineral supplements
Main effects due to period, P < 0.05Main effects due to level of Mg, P < 0.05
Behavior of Consumption

Average number of trips to the mineral feeder/day
0.00
1.00
2.00
3.00
4.00
5.00
6.00
Period 1 Period 2 Period 3 Period 4 Period 5 Period 6
Aver
age
num
ber o
f trip
s to
the
feed
er
d0 – d15 d16 – d30
Main effect due to Mg (P < 0.01)
0% Mg
10% Mg
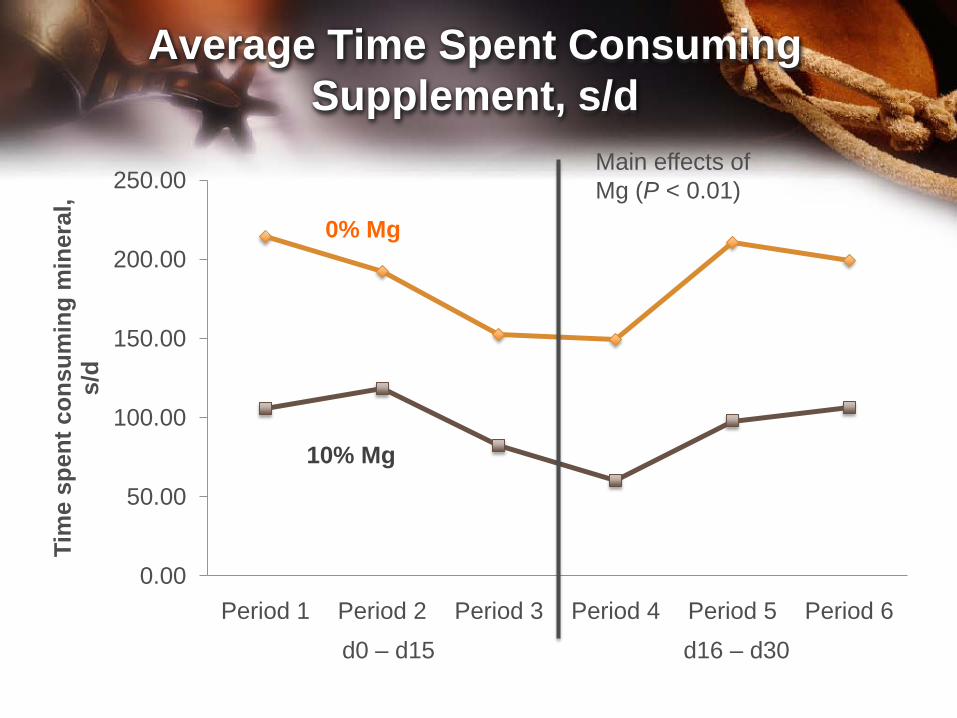
Average Time Spent Consuming Supplement, s/d
0.00
50.00
100.00
150.00
200.00
250.00
Period 1 Period 2 Period 3 Period 4 Period 5 Period 6
Tim
e sp
ent c
onsu
min
g m
iner
al,
s/d
0% Mg
10% Mg
d0 – d15 d16 – d30
Main effects of Mg (P < 0.01)
Conclusion
• The addition of MgO to the mineral decreased overall mineral consumption, feeding attendance, and feeding duration.
• Heifers consumed more supplement on pasture compared to cows fed in drylot.

Study Limitations
• Addition of 50 % salt to the MgO supplement, may decreased mineral consumption more than expected.
• Increasing the salt content decreased the frequency of visits from 1.05/d to 0.67/d
Implications
• Understanding animal behavior with addition of supplemental Mg to mineral mixes will better aid in the prevention of tetany and new supplemental Mg strategies.
• Additional research is needed to understand mineral consumption, attendance, and duration patterns between varying levels of Mg on different diets, seasons, and locations.

Future Work?
• Compare intake and behavior of mineral supplements provided in a tub vs. loose forms
• To determine if the coefficient of variation can be reduced for grazing animals.