Embed Size (px)
Citation preview

Minimum Data Set and the Framework for Sampling Dynamic Soil Properties
Arlene TugelSoil Scientist
Interpretations Staff, NSSC
National State Soil Scientist WorkshopMarch 17-21, 2008
Florence, KY
Outline
• Overall strategy
• Minimum data set
• Comparison studies
• Sampling framework using conceptual models
• Sampling Guide
• Responsibilities

Soil Change Leadership Team
• Karl Hipple, National Leader, Interpretations• Chris Smith, National Leader, Technical Soil Services• Susan Andrews, Director, Soil Quality Team• Larry West, National Leader, Investigations• Arlene Tugel, Soil Scientist, Interpretations• Jeff Herrick, Research Soil Scientist, ARS

Vision
Enhance NCSS data and products with information about how soils change.

Overall strategy
• Select priority benchmark soils
• Gather dynamic soil property data
• Populate a point database
• Develop interpretations of management effects on soil function and the consequences of change
• Use models and pedotransfer functions to populate the soil map unit data base.

IVShort-interval
monitoring
IIPhase
distinctions
ITaxonomic
classesRelatively unaltered control section Eroded Drained etc.
Drastically altered Transported (Minesols) Horizons destroyed Horizons mixed
Regular, periodic and cyclic fluctuationsSoil moistureTemperatureWater tables
IIIModels of change
Dynamic management effects on soilDynamic soil properties
Conventions for soil change

Change in function
IVShort-interval
monitoring
IIPhase
distinctions
ITaxonomic
classesRelatively unaltered control section Eroded Drained etc.
Drastically altered Transported (Minesols) Horizons destroyed Horizons mixed
Regular, periodic and cyclic fluctuationsSoil moistureTemperatureWater tables
IIIModels of change
Dynamic management effects on soilDynamic soil properties
Conventions for soil change

Minimum data set of dynamic soil properties
(March 15, 2008)– Organic C– pH– EC– Bulk density/Soil
porosity– Structure and macro-
pores– Aggregate stability (wet)– Total N (for C:N ratio)– Soil aggregate stability
(field kit)
Weighted Rankings
2.5
3.0
3.5
4.0
4.5
5.0
Also: Particle sizeRock fragments
Administered by ARS, Las Cruces, NM
OC
pH
EC
Bu
lk d
en
sity
Str
uct
ure
Ag
g.
sta
bili
ty NS
oil
ag
gre
g.
sta
bili
tyC
a/M
g/K
/Na
eC
EC
Po
t M
in N P
KC
l-Al
Act
ive
CP
OM
B-g
luco
sid
ase
Infil
tra
tion
Ksa
tM
icro
b-b
iom
ass

Criteria for selecting properties
1. Sensitive to management
2. Clearly represent soil function
3. Relatively insensitive to environmental fluctuations (or response can be modeled)
4. Easy to measure repeatably, and accurately
5. Low cost
Supplemental and experimental properties
• Supplemental (situation-specific)– CaCO3, KCl-Al, Ksat, etc.
• Experimental – Biological properties– New techniques
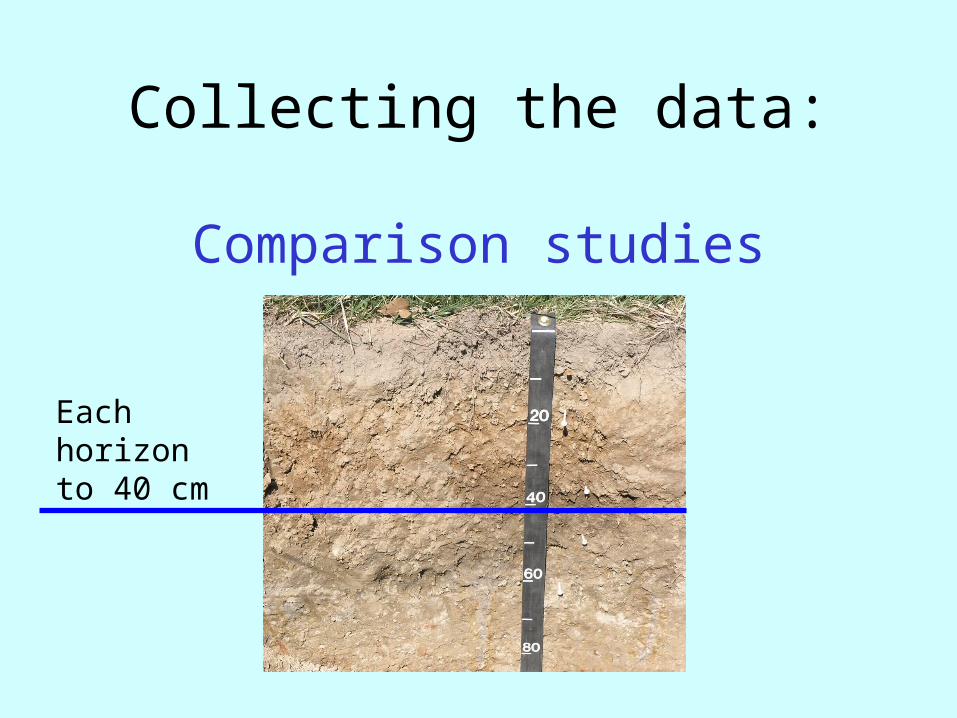
Collecting the data:
Comparison studies
Each horizon to 40 cm

Utah PilotArches National Park
Winter fat, perennial grass
PGS
Cheat grass
AG
Weed invasion
A. Compare various management systems or plant communities

B. Document the central tendency and range of variation
Bulk density
Central tendency of plot means
Central range Variation
Depth/horizon
full state phase range Mean Median
Interquartile range of plot
means CV
Begay fsl, 0-6%
PGS 0 - 2 cm 1.27 - 1.91 1.51 1.53 1.47 - 154 2.7
A not 0-2 1.27 - 1.68 1.51 1.53 1.44 - 1.56 4.5
B 1.46 - 1.62 1.55 1.55 1.52 - 1.58 2.0
AG 0 - 2 cm 1.01 - 1.68 1.42 1.46 1.32 - 1.47 6.9
A not 0-2 1.29 - 1.54 1.42 1.41 1.38 - 1.48 3.9
B 1.42 - 1.59 1.51 1.51 1.48 - 1.54 2.0

Bulk density
0-2
cm2
cm t
o ba
se o
f A
B t
o 25
cm
PG-S = perennial grass-shrub sub-state; AG = Annual grass (cheat grass) sub-state; n=4 = Median = Mean
High and low values of reference
state
C. Report differences between the inherent potential (reference state) and other management systems or land uses.

Framework to organize projects: Conceptual models
• State and transition models (STM) – from Ecological Site Descriptions
• Cropland management models
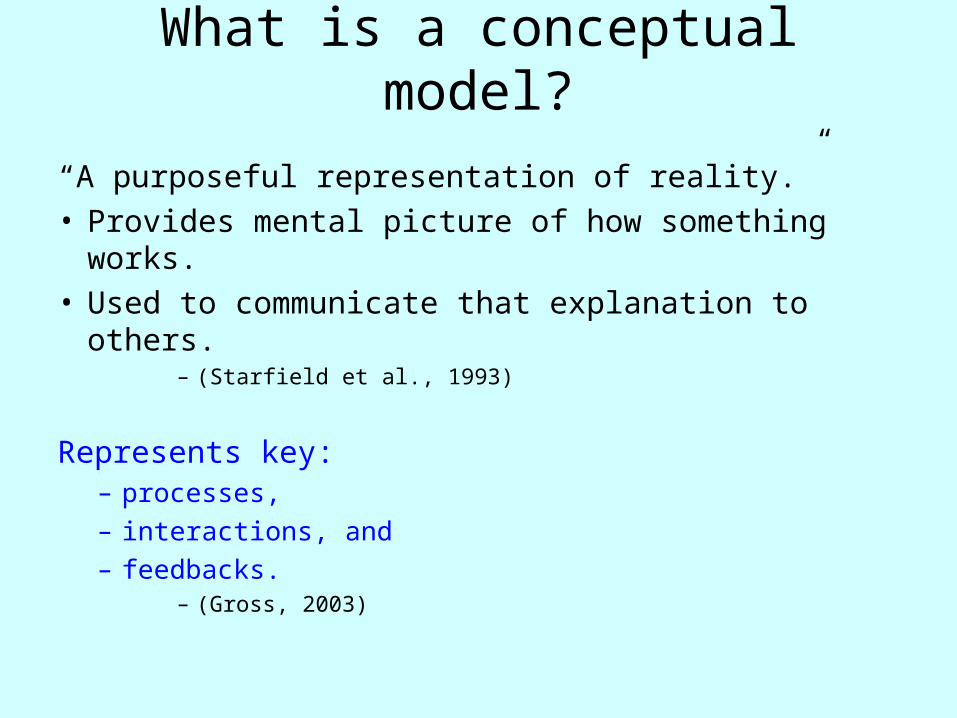
What is a conceptual model?
“A purposeful representation of reality.”• Provides mental picture of how something works. • Used to communicate that explanation to others.
– (Starfield et al., 1993)
Represents key: – processes, – interactions, and – feedbacks.
– (Gross, 2003)

Post oak/blackjack oak/little bluestem
Hot summer burn and /or long-term grazing
Burn, Site prep & Planting / Seeding.
No grazing or limited controlled grazing
Post oak/flowering dogwood/ tick trefoil-goldenrod. Multi-story. Canopy: 30-90%
Post oak/buckbrush (or similar) Lacks mid-story. Understory single species woody dominatedCanopy: open 30-90%
Pasture (improved)Non-native grass sod
Abandonment for 20+ yr with recruitment of woody natives
Harvest, site prep, seeding
PastureForest
Missouri PilotSTM by:
D. Wallace, J. Robinson,B. White, M. Kennedy

Uses of conceptual models in soil change projects
• Stratify the map unit component phase into multiple states that can be sampled;
• Help verify suitable sample locations;• Facilitate data extension to similar soils;• Organize relationships among management,
DSP’s, and plant communities (where present); – for interpretation, storage, and data delivery;
• Serve as a decision aid for conservation planning;– illustrates alternative states and predicted soil
responses to practices.

Soil Survey and Resource Inventory
Guide for Dynamic Soil Properties and Soil
Change VER. 1.1
2008
Soil Survey and Resource Inventory
Guide for Dynamic Soil Properties and Soil
Change VER. 1.1
2008
Procedures
• Comparisons studies• Conceptual models• 6 steps of a project• Interpreting soil change
and soil function
Cropland sampling design to be added

Six project steps
1. Project Planning – what
2. Sampling Design -- how
3. Sampling Requirements – how many/where
4. Field Work
5. Data Preparation
6. Data Analysis and Interpretation
Data storage
• SBAAG Ad-hoc committee (Sept. 2007)– Alan Price, Darrell Kautz, George Peacock,
Susan Andrews, Arlene Tugel
• Business requirements– For point data – Draft available on SBAAG sharepoint site– Work-in-progress
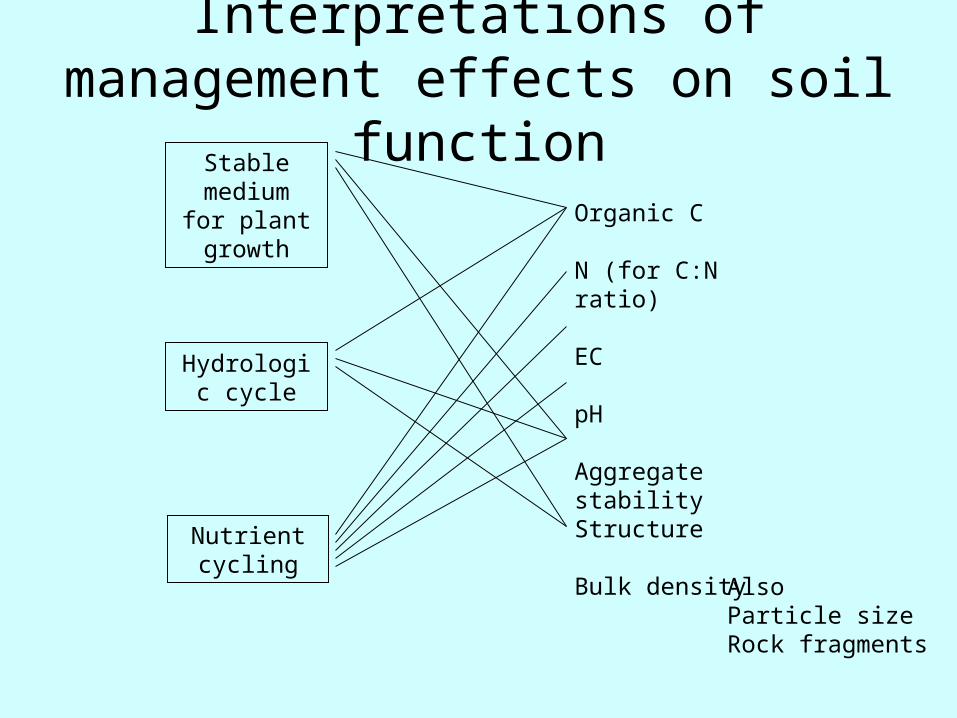
Stable medium for plant growth
Hydrologic cycle
Nutrient cycling
Organic C
N (for C:N ratio)
EC
pH
Aggregate stabilityStructure
Bulk density
Also Particle sizeRock fragments
Interpretations of management effects on soil function
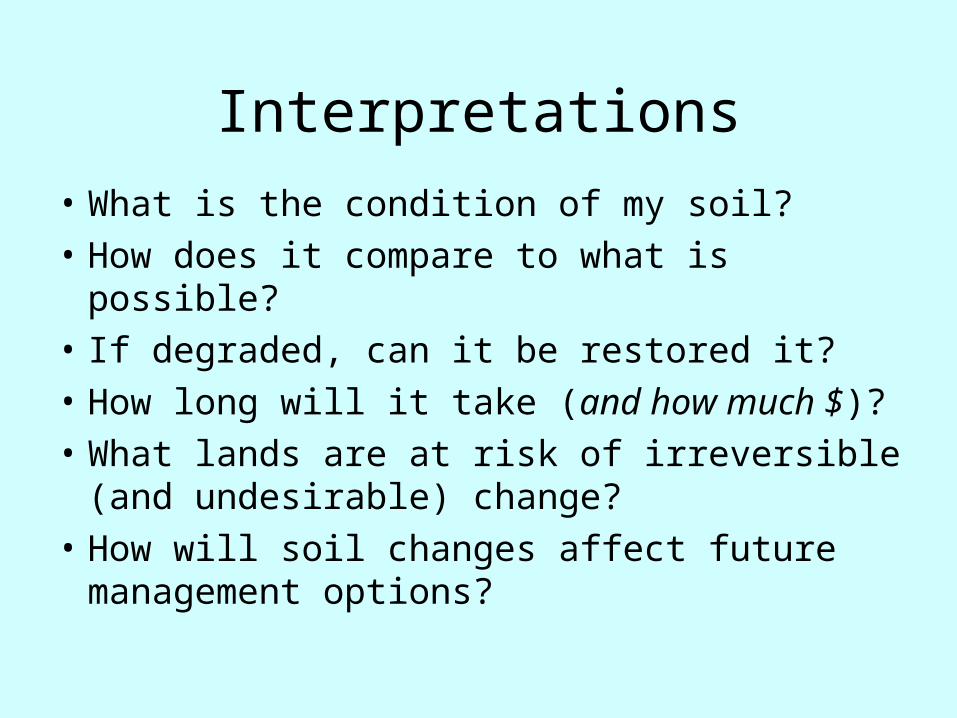
Interpretations
• What is the condition of my soil?
• How does it compare to what is possible?
• If degraded, can it be restored it?
• How long will it take (and how much $)?
• What lands are at risk of irreversible (and undesirable) change?
• How will soil changes affect future management options?
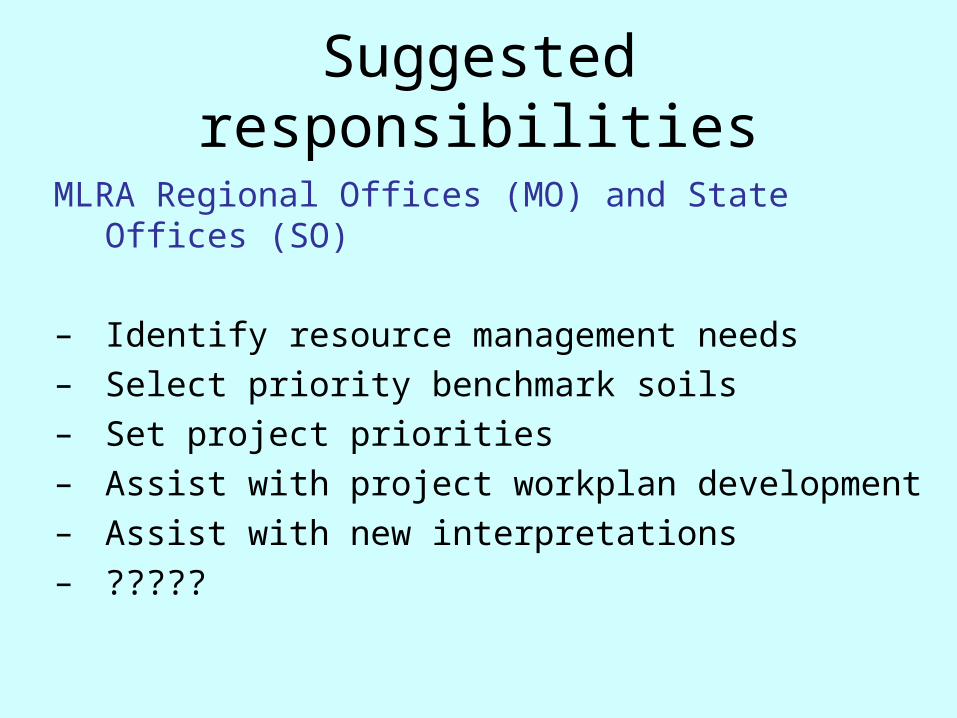
Suggested responsibilities
MLRA Regional Offices (MO) and State Offices (SO)
– Identify resource management needs– Select priority benchmark soils– Set project priorities– Assist with project workplan development– Assist with new interpretations– ?????

Suggested responsibilitiesMLRA Project Offices (SSO) and discipline specialists
– Identify resource management needs– Develop project workplans– OJT– Collect data – Quality control– Enter and prepare data
for analyses– ????
NOTE: As much of data summary and analyses as possible will be automated. Specialist assistance is needed for statistical tests.
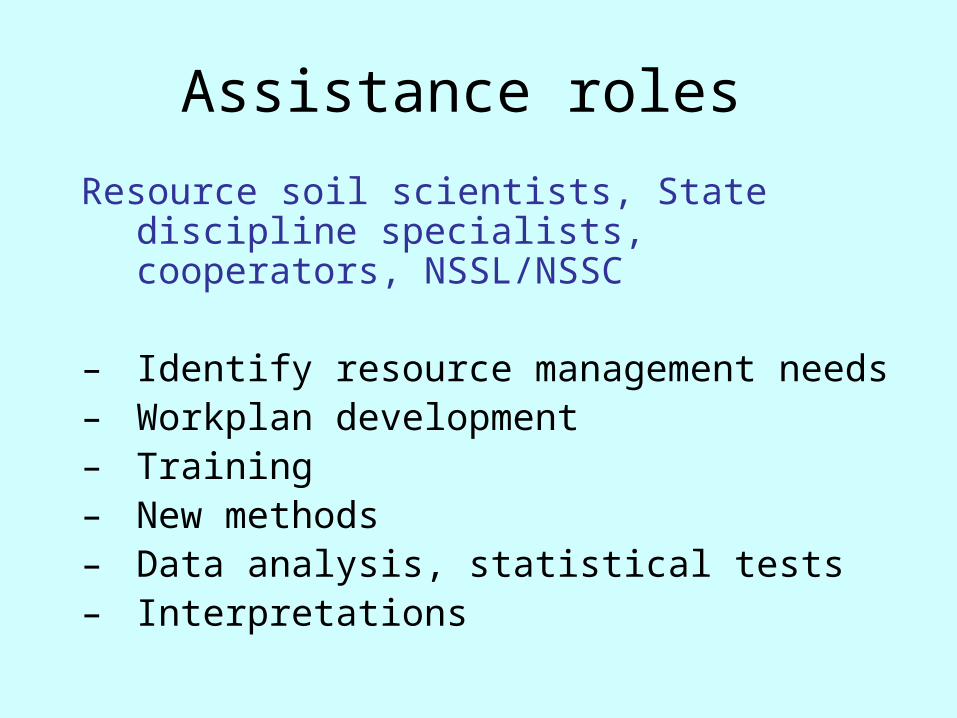
Assistance roles
Resource soil scientists, State discipline specialists, cooperators, NSSL/NSSC
– Identify resource management needs– Workplan development– Training– New methods– Data analysis, statistical tests – Interpretations
Questions?Mini-session topics
– Prioritizing benchmark soils (and important Ecological Sites)
– Management systems to be documented
– Operational questions
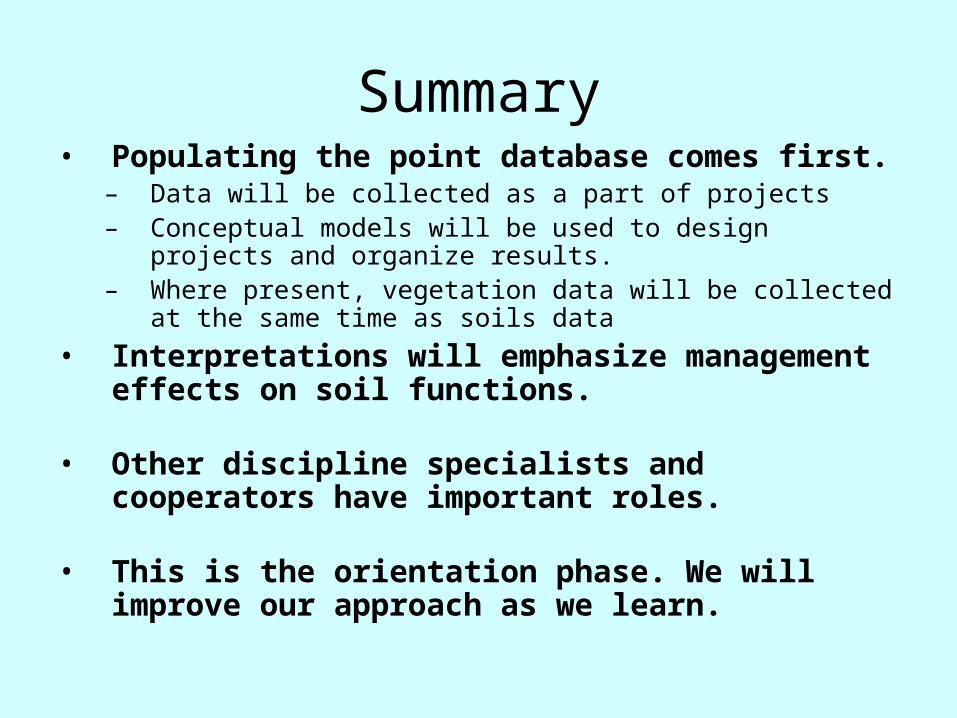
Summary• Populating the point database comes first.
– Data will be collected as a part of projects– Conceptual models will be used to design projects and
organize results.– Where present, vegetation data will be collected at the same
time as soils data
• Interpretations will emphasize management effects on soil functions.
• Other discipline specialists and cooperators have important roles.
• This is the orientation phase. We will improve our approach as we learn.