Embed Size (px)
Citation preview
Queen’s Global MarketsA PREMIER UNDERGRADUATE THINK-TANK
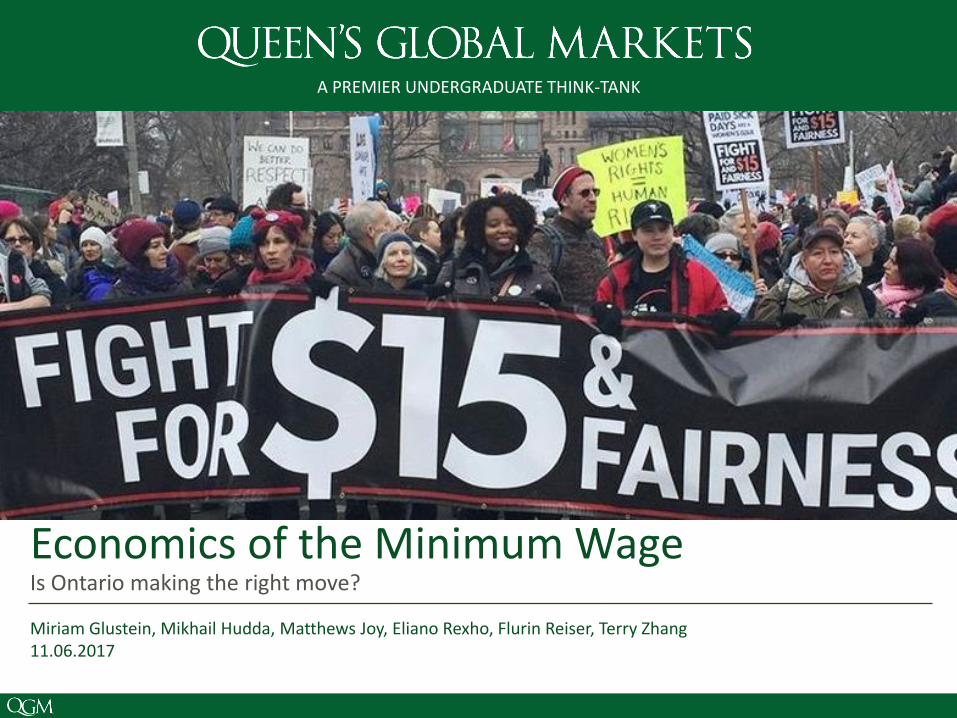
Economics of the Minimum Wage
Miriam Glustein, Mikhail Hudda, Matthews Joy, Eliano Rexho, Flurin Reiser, Terry Zhang 11.06.2017
Is Ontario making the right move?
2
AgendaWhat we will be discussing today
1 Introduction
2 Impact on Inflation and Unemployment
3 Positive Implications of Increasing the Minimum Wage
4 Alternatives to the Minimum Wage
5 Understanding Ontario’s Demographics

3
Introduction

4
Political and Economic Landscape
The Timeline
• Kathleen Wynne of the Ontario Liberal Party is seeking re-election in June 2018 provincial election
• Ontario minimum wage rose to $11.60/hour from $11.40/hour in October
• Ontario inflation rate at 1.7% (Canada – 1.6%)
• Ontario unemployment rate at 5.9% (Canada –6.3%)
The PlanWhat we know about the planned Ontario minimum wage increase
May 30, 2017 – Ontario government announces minimum wage increase
from $11.40/hour
October 1, 2017 –Minimum wage
rises to $11.60/hour
January 1, 2018 –Minimum wage
rises to $14.00/hour
January 1, 2019 –Minimum wage rises
to $15.00/hour
Demographic % of Minimum Wage Workers
Male 5.5%
Female 8.0%
Youths Age 15-19 50.2%
HS Diploma or Less 20.4%
Retail Sector 17.4%
Food and Accommodation 26.9%
Source: Maclean’s
5
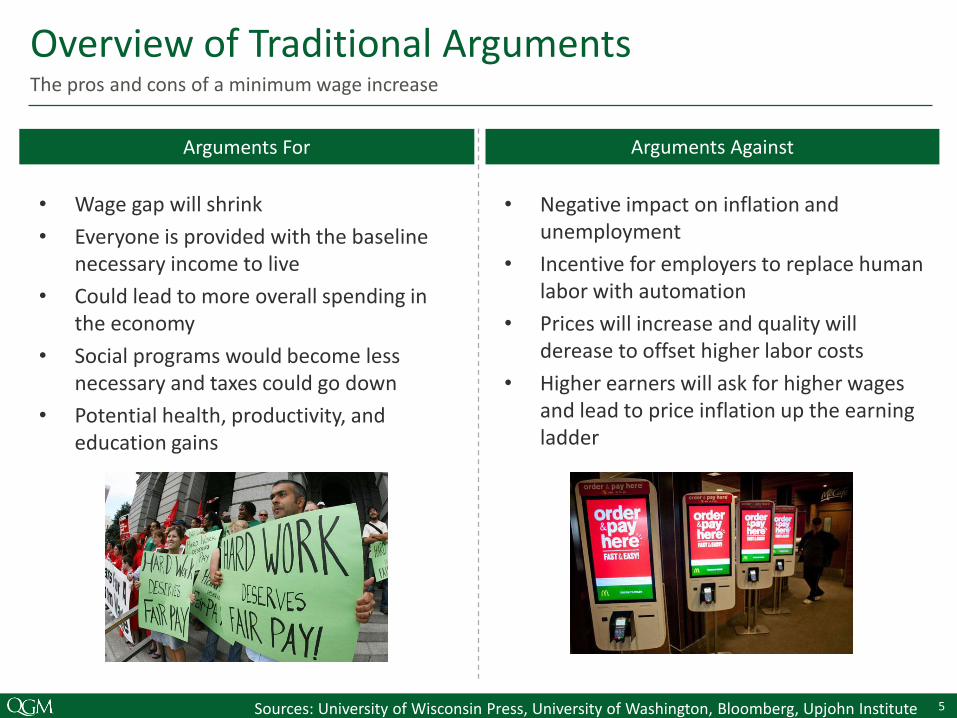
Overview of Traditional ArgumentsThe pros and cons of a minimum wage increase
Sources: University of Wisconsin Press, University of Washington, Bloomberg, Upjohn Institute
Arguments For Arguments Against
• Wage gap will shrink
• Everyone is provided with the baseline necessary income to live
• Could lead to more overall spending in the economy
• Social programs would become less necessary and taxes could go down
• Potential health, productivity, and education gains
• Negative impact on inflation and unemployment
• Incentive for employers to replace human labor with automation
• Prices will increase and quality will derease to offset higher labor costs
• Higher earners will ask for higher wages and lead to price inflation up the earning ladder

6
Examining Existing Studies and LiteratureFlaws in Methodology?
Aaronson, French, and McDonald Study 2008 Seattle Minimum Wage Study (UW) 2016
• Sample is based on 7,500 food items at 1,000
different establishments from 1995 to 1997
• Flaws
• Micro-industry approach leads to
conclusions that cannot be generalized
• Lack of a specific control group
• Omitted multiple state metropolitan areas
• 10% increase in minimum wage increases overall
restaurant prices restaurant prices by 0.7%
• 1.5% increase in fast food restaurants
• 1.8% increase for fast food in low wage regions
• Conclude that restaurants pass full cost of
minimum-wage increases to consumers, but
results were too imprecise to be certain
• Collected price data through a combination of
online "web scraping" and in-person visits to area
grocery stores, restaurants, and other retail
locations
• Flaws
• Excludes businesses with more than one location (48% of Seattle’s low-paid workforce)
• Not yet peer reviewed
• Lead researcher Jacob Vigdor likely biased as an opponent of minimum wage
• Restaurant prices increased by around 4%
• Unable to measure prices increases for groceries,
gas, and rent but assume modest increases of 1%
and 2%

7
Impact on Inflation and Unemployment
8
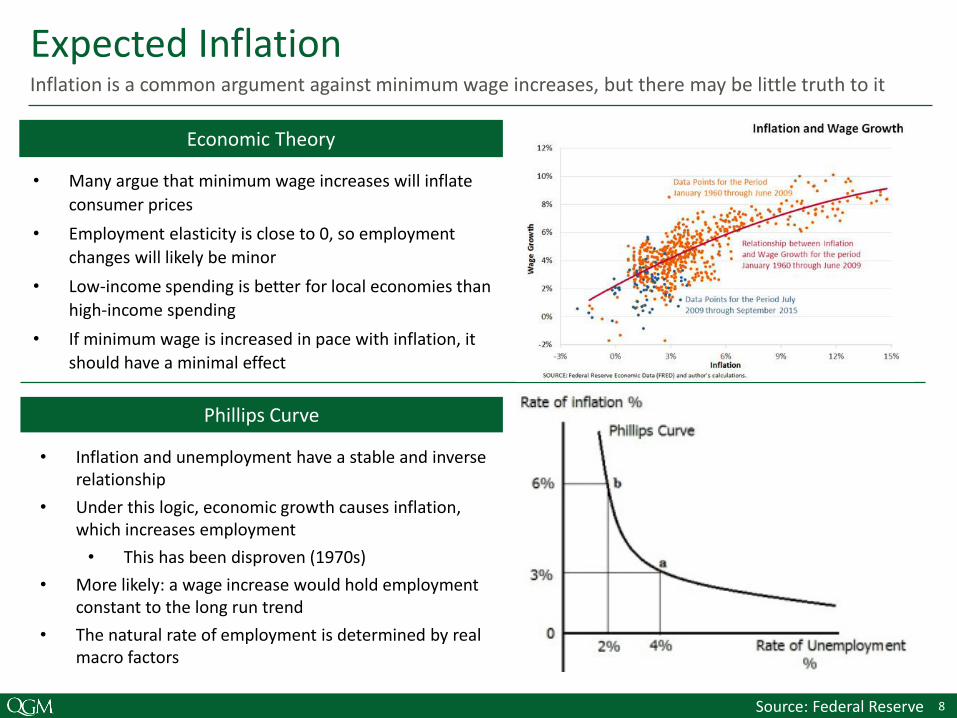
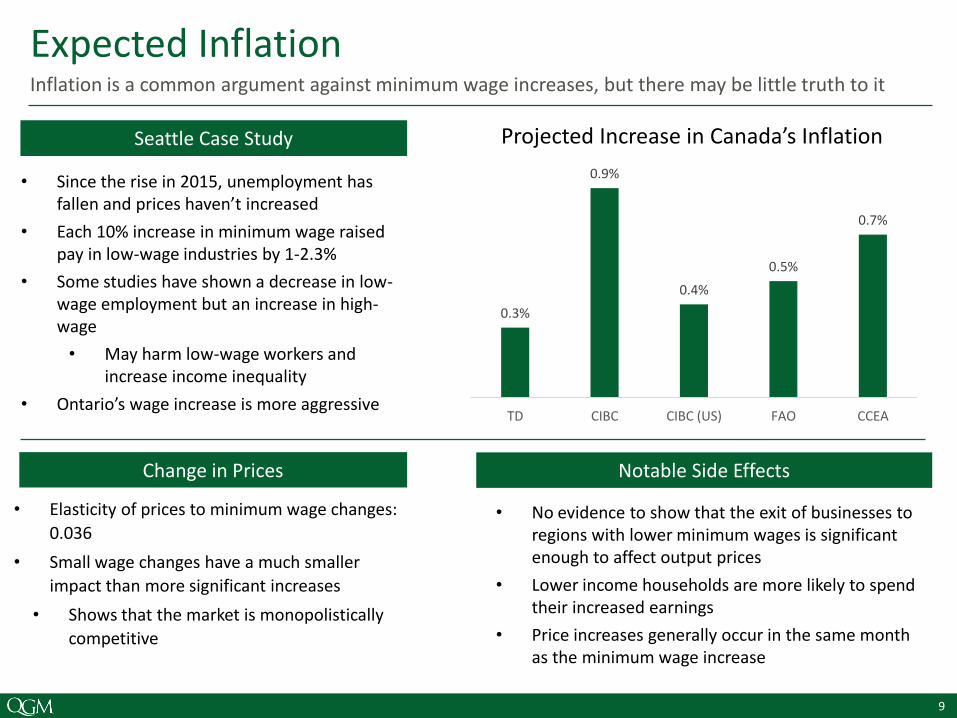
Expected InflationInflation is a common argument against minimum wage increases, but there may be little truth to it
Sources: BBC, The Economist, United Nations
Economic Theory
• Many argue that minimum wage increases will inflate
consumer prices
• Employment elasticity is close to 0, so employment
changes will likely be minor
• Low-income spending is better for local economies than
high-income spending
• If minimum wage is increased in pace with inflation, it
should have a minimal effect
Phillips Curve
• Inflation and unemployment have a stable and inverse relationship
• Under this logic, economic growth causes inflation,which increases employment
• This has been disproven (1970s)
• More likely: a wage increase would hold employment constant to the long run trend
• The natural rate of employment is determined by real macro factors
Source: Federal Reserve
9
Sources: BBC, The Economist, United Nations
Change in Prices
• Elasticity of prices to minimum wage changes:
0.036
• Small wage changes have a much smaller
impact than more significant increases
• Shows that the market is monopolistically
competitive
Notable Side Effects
• No evidence to show that the exit of businesses to regions with lower minimum wages is significant enough to affect output prices
• Lower income households are more likely to spend their increased earnings
• Price increases generally occur in the same month as the minimum wage increase
Seattle Case Study
• Since the rise in 2015, unemployment has fallen and prices haven’t increased
• Each 10% increase in minimum wage raised pay in low-wage industries by 1-2.3%
• Some studies have shown a decrease in low-wage employment but an increase in high-wage
• May harm low-wage workers and increase income inequality
• Ontario’s wage increase is more aggressive
0.3%
0.9%
0.4%
0.5%
0.7%
TD CIBC CIBC (US) FAO CCEA
Projected Increase in Canada’s Inflation
Expected InflationInflation is a common argument against minimum wage increases, but there may be little truth to it

10
Relationship between Nominal Wage and Inflation
Sources: BBC, The Economist, United Nations
y = 0.0079x + 0.0769
-40.0%
0.0%
40.0%
80.0%
120.0%
160.0%
-80.0% -60.0% -40.0% -20.0% 0.0% 20.0% 40.0% 60.0% 80.0% 100.0% 120.0% 140.0%
Infl
atio
n %
Incr
ease
Nominal Minimum Wage % Increase (USD)
Datasets collected from OECD
Regressing 30 countries’ data from 1960 - 2016

11
Relationship between Real Wage and Inflation
Sources: BBC, The Economist, United Nations
y = -0.2133x + 0.0825
-150.00%
-100.00%
-50.00%
0.00%
50.00%
100.00%
150.00%
-20.00% 0.00% 20.00% 40.00% 60.00% 80.00% 100.00% 120.00% 140.00%
Rea
l Min
Wag
e %
Incr
ease
Inflation % Increase
Datasets collected from OECD
Regressing 30 countries’ data from 1960 - 2016
12
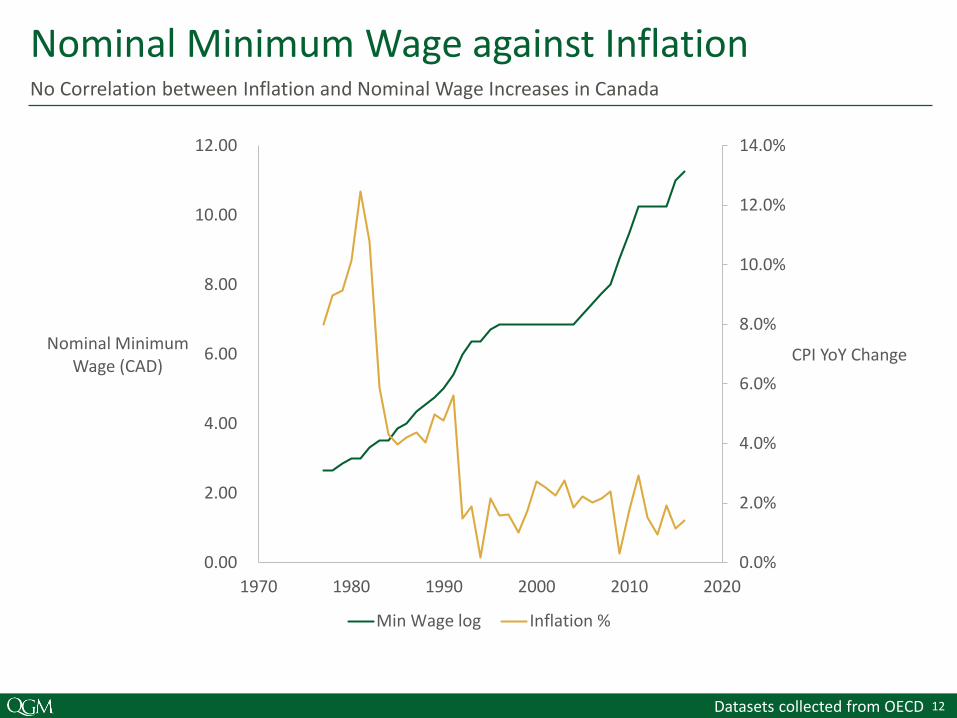
Nominal Minimum Wage against Inflation
Sources: BBC, The Economist, United Nations
0.0%
2.0%
4.0%
6.0%
8.0%
10.0%
12.0%
14.0%
0.00
2.00
4.00
6.00
8.00
10.00
12.00
1970 1980 1990 2000 2010 2020
CPI YoY ChangeNominal Minimum
Wage (CAD)
Min Wage log Inflation %
Datasets collected from OECD
No Correlation between Inflation and Nominal Wage Increases in Canada

13
0
1
2
3
4
5
6
7
20,000 30,000 40,000 50,000 60,000R
eal h
ou
rly
wag
e ($
)Unskilled labor (hours)
Labor Demand
Labor Supply
New Minimum Wage
Sources: BBC, The Economist, United Nations
Theoretical Impact on UnemploymentEconomic theory dictates that minimum wage raises will increase unemployment
0
1
2
3
4
5
6
7
20,000 30,000 40,000 50,000 60,000
Rea
l ho
url
y w
age
($)
Unskilled labor (hours)
Labor Demand
Labor Supply
New Minimum Wage
Increase in Unemployment
Unemployment
Employment
Buyer Surplus
Deadweight Loss
Seller Surplus
Deadweight Loss

14
Youth Unemployment against Nominal Wage
Sources: BBC, The Economist, United Nations
-0.15
-0.1
-0.05
0
0.05
0.1
0.15
1950 1960 1970 1980 1990 2000 2010 2020
Nominal Wage Increase Youth Unemployment
Datasets collected from OECD
Comparing log differences of US youth unemployment against log differences US nominal wages

15
Minimum Wage against Unemployment in Canada
Sources: BBC, The Economist, United Nations
y = 0.2249x - 0.0011
-0.2
-0.1
0
0.1
0.2
0.3
0.4
0.5
-0.1 -0.05 0 0.05 0.1 0.15
Log
Dif
fere
nce
Un
emp
loym
ent
Rat
es
Log Difference Nominal Minimum Wage
Datasets collected from OECD
Regressing Canada’s provincial data on log differences of unemployment against minimum wage

16
Québec Case StudyBackground
Sources: BBC, The Economist, United Nations
The Quiet Revolution
• 1960 – Jean Lesage of the Québec Liberal Party won the Provincial election and aimed on setting various social reforms
• Public sector saw growth throughout 1960s through initiatives such as the SGF (1962) and the nationalization of Hydro Québec (1963)
• Provincial budget rose from $745 million to $2.1 billion
• Share of Québec public spending went from 4 percentage points below Canadian average in 1961 to 4 percentage points above by 1978
• Socialist policies continued under Robert Bourassa of the Québec Liberal Party in the 1970s
0
500
1000
1500
2000
2500
3000
3500
4000
0
5000
10000
15000
20000
25000
30000
Qu
ébec
Go
vern
men
t Ex
pen
dit
ure
s ($
mill
ion
s)
Tota
l Pro
vin
cial
Go
vern
men
t Ex
pen
dit
ure
s ($
mill
ion
s)
Years
Québec Government Expenditures versus Total Provincial Government Expenditures (1955-1970)
Total government expenditures Quebec Expenditures
Source: Statistics Canada

17
Québec Case StudyThe Wage Increase
Sources: BBC, The Economist, United Nations
The Québec Wage Increase
• Minimum wage rose from $2.10 to $2.80 from the end of 1974 to the end of 1975
• 33% increase in the one year span
• Largest increase in the province’s history to date
$0.00
$0.50
$1.00
$1.50
$2.00
$2.50
$3.00
$3.50
$4.00
$4.50
19
65
19
66
19
67
19
68
19
69
19
70
19
71
19
72
19
73
19
74
19
75
19
76
19
77
19
78
19
79
19
80
19
81
19
82
19
83
19
84
19
85
Rea
l Wag
e
Years
Québec Minimum Wage (1965-1985)
• Narrowing its wage gap with Ontario was a reason
behind Québec’s minimum wage hike
• Minimum wage went from 8% below Ontario’s to
23% above it
• 1975-1985 was the only period that Québec has ever
had a higher minimum wage than Ontario
$0.00
$0.50
$1.00
$1.50
$2.00
$2.50
$3.00
$3.50
$4.00
$4.50
19
65
19
66
19
67
19
68
19
69
19
70
19
71
19
72
19
73
19
74
19
75
19
76
19
77
19
78
19
79
19
80
19
81
19
82
19
83
19
84
19
85
Rea
l Wag
e
Years
Québec and Ontario Minimum Wages (1965-1985)
Québec Minimum Wage Ontario Minimum Wage
Relative to Ontario
18
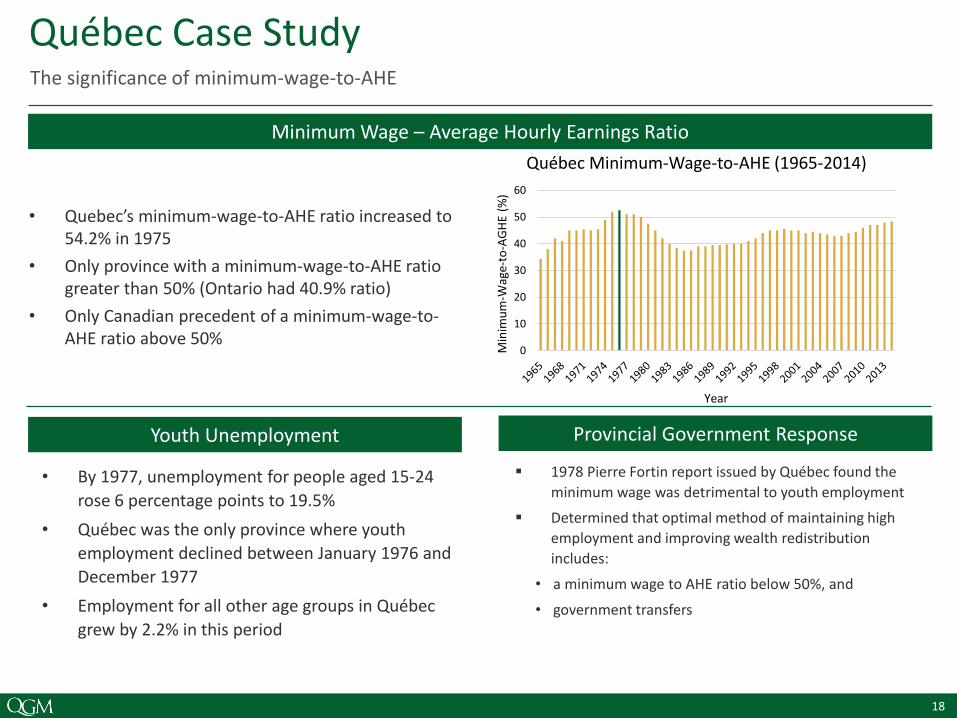
Youth Unemployment
• By 1977, unemployment for people aged 15-24
rose 6 percentage points to 19.5%
• Québec was the only province where youth
employment declined between January 1976 and
December 1977
• Employment for all other age groups in Québec
grew by 2.2% in this period
Minimum Wage – Average Hourly Earnings Ratio
• Quebec’s minimum-wage-to-AHE ratio increased to 54.2% in 1975
• Only province with a minimum-wage-to-AHE ratio greater than 50% (Ontario had 40.9% ratio)
• Only Canadian precedent of a minimum-wage-to-AHE ratio above 50%
Québec Case StudyThe significance of minimum-wage-to-AHE
Provincial Government Response
▪ 1978 Pierre Fortin report issued by Québec found the
minimum wage was detrimental to youth employment
▪ Determined that optimal method of maintaining high
employment and improving wealth redistribution
includes:
• a minimum wage to AHE ratio below 50%, and
• government transfers
0
10
20
30
40
50
60
Min
imu
m-W
age-
to-A
GH
E (%
)
Year
Québec Minimum-Wage-to-AHE (1965-2014)
19
Long-Term Unemployment
Subtopic
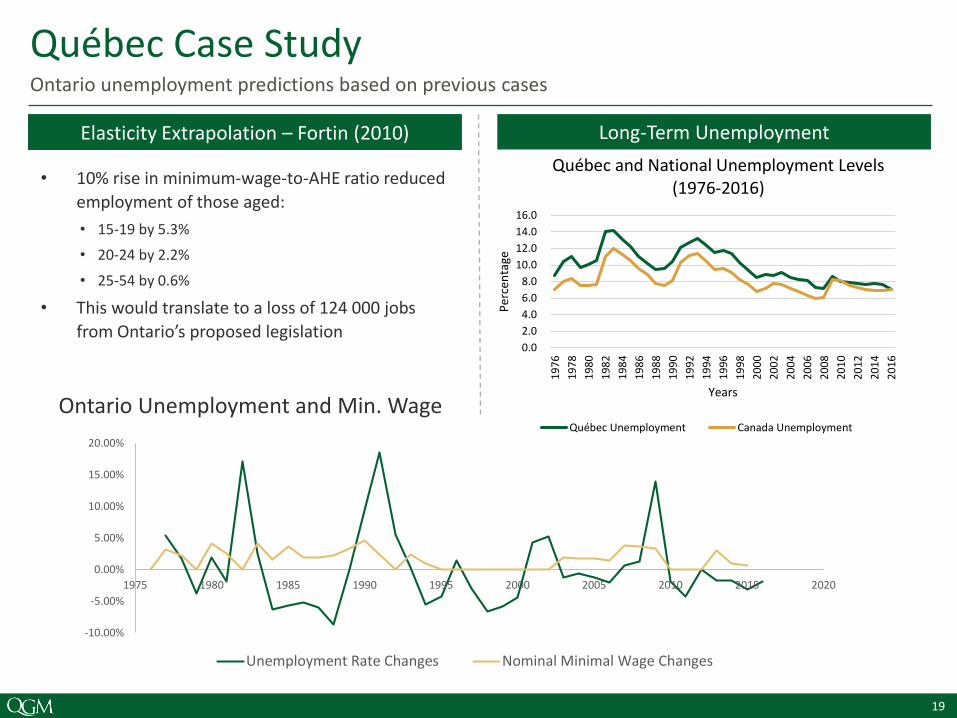
Québec Case StudyOntario unemployment predictions based on previous cases
Sources: BBC, The Economist, United Nations
Elasticity Extrapolation – Fortin (2010)
• 10% rise in minimum-wage-to-AHE ratio reduced
employment of those aged:
• 15-19 by 5.3%
• 20-24 by 2.2%
• 25-54 by 0.6%
• This would translate to a loss of 124 000 jobs
from Ontario’s proposed legislation 0.0
2.0
4.0
6.0
8.0
10.0
12.0
14.0
16.0
19
76
19
78
19
80
19
82
19
84
19
86
19
88
19
90
19
92
19
94
19
96
19
98
20
00
20
02
20
04
20
06
20
08
20
10
20
12
20
14
20
16
Per
cen
tage
Years
Québec and National Unemployment Levels (1976-2016)
Québec Unemployment Canada Unemployment
-10.00%
-5.00%
0.00%
5.00%
10.00%
15.00%
20.00%
1975 1980 1985 1990 1995 2000 2005 2010 2015 2020
Unemployment Rate Changes Nominal Minimal Wage Changes
Ontario Unemployment and Min. Wage
20
Positive Implications of Increasing the Minimum Wage

21
Poverty’s Rising Influence
• Inflation has been increasing over time
• Last minimum wage hike was in 2014
• $1 in 2014 is worth $0.96 now, giving the $11.40
that was minimum wage in 2014 less than $11 of
purchasing power today
• More people living in relative poverty
• Ontario relative poverty is highest among single
parents, for which the gap has skyrocketed 200%
Impact on PovertyA minimum wage increase is necessary to combat inflation and reduce poverty
Effect of a Minimum Wage Hike
• Those at the poverty threshold are helped most from minimum wage increases
• Arin Dube, an economist from UMass Amherst, believes a 10% increase reduces poverty by 2.4%
• An increase to $15 would lift 100,000 Ontarians above the poverty line
-200
0
200
400
600
800
1000
5 10 15 20 25 30 35 40 45 50
Ch
ange
in in
com
e, in
20
16
do
llars
Family income percentile, adjusted for family size
Cash income
Cash income + tax credits + non-cash transfers
Fed poverty threshold
∆ Family Income Percentile from 10% Minimum Wage Increase

22
y = 0.0494x + 0.036
-30.00%
-20.00%
-10.00%
0.00%
10.00%
20.00%
30.00%
40.00%
50.00%
-60.00% -40.00% -20.00% 0.00% 20.00% 40.00% 60.00% 80.00% 100.00%
Nominal Min. Wage % Increase (USD)
San Francisco Case Study
• When parents received wage
increases, their children:
• Completed 0.25 more years of
formal education, on average
• Were 34% more likely to
complete high school
• Were 22% less likely to have an
early or unexpected childbirth
Higher EducationImprovements in education make the economy more efficient
Increased Income for Students
• 15-24 year olds, mostly students, are 58% of minimum wage earners
• Generally from low-income families to start with
• More able to save money for higher education
Educational Improvements
• Currently, 54% of minimum wage earners have earned a high school diploma or less
• 3% of minimum wage earners have a university degree
• Education and training makes the workforce and economy more productive
Sources: BBC, The Economist, United Nations
Tertiary Education Enrollment % Increase

23
California Wage Increase Analysis
• The minimum wage rise increased household
income, even after job loss was considered
• Effect on health was severe reductions of chronic
disease, mental and physical disability, alcohol and
drug addictions, and obesity
• Reduced risk of premature death by 4-5%
Sources: BBC, The Economist, United Nations
Healthier Lower-Income FamiliesImprovements in health lead to lower social services costs
Applicability to Ontario
• Reduces strain on social services and healthcare
• In most recent budget, Ontario healthcare costs were $58 billion
• 42% of all public services costs
• 43% of healthcare costs go to hospitals
• The top 1% of users account for 33% of spending
0
5
10
15
20
25
30
0-99% FPL 100-199% FPL 200-299% FPL 300%+ FPL
Health Care Indicators by Family Income
0
5
10
15
20
25
30
35
40
45
0-99% FPL 100-199% FPL 200-299% FPL 300%+ FPL
% of Individuals Reporting Health by Family Income

24
Alternatives to the Minimum Wage

25
• The minimum wage concept is designed to allow one parent working full-time to support his or herself, his or her children, and a stay-at-home spouse
• Easy to replace low-income families with numbers and statistics
Earned Income Tax Credit
• The EITC provides a tax credit for every dollar
earned by a worker in a low-income household,
and it is refundable—so workers with no tax
liability get a check from the government
• Increases employment because subsidized wages
increase incentive to work
• Taxpayers must foot the bill
Sources: Time, Futurism, Classroom
Ethical Concerns and AlternativesAddressing the Living Wage
Ethical Concerns
$0
$1,000
$2,000
$3,000
$4,000
$5,000
$6,000
$0 $10,000 $20,000 $30,000 $40,000 $50,000
Inco
me
Tax
Cre
dit
Income
Universal Basic Income Examples
• Alaska’s Permanent Fund Dividend (PFD) derived
earnings from Alaska Permanent Fund (APD)
• Spending and saving increased
• Increase in purchasing power created 10,000
jobs
• Native American Poverty rate fell from 25% to
19%
• Namibia has set up Basic Income Grant Coalition
• Malnourished children fell from 42% to 10%
• Poverty rate has dropped from 86% to 68%
• Average earned income beyond UBI has increased 29%
• Crime has dropped 36.5%

26
Unconditional Basic Income (Switzerland)Understanding UBI
Sources: BBC, The Economist, United Nations
Overview of UBI
Overview of Switzerland
• Switzerland is located at the heart of Europe, but not member of the EU
• Political system is called “democratic federal republic
• Currently no minimum wage in Switzerland
• Great importance of collective labor agreements
Cost Estimation
164
70
36
270
Higher TaxesWelfareInstitutions
UncoveredCosts
Overall Cost
*Costs are quoted in CAD (billions)
• Two financing structures
• Market socialism
• Capitalist system
• Purpose of UBI
• Reduce poverty
• Increase transparency
• Promote economic growth

27
Unconditional Basic Income (Switzerland)Arguments for and against UBI
Sources: BBC, The Economist, United Nations
Would UBI work?
• Supporting UBI• Social, liberal benefits• Democratic and emancipatory• Easy to implement
• Problems with UBI• Misaligned incentives• Expensive and uncertain• Welfare institutions can not be removed• Leads to higher immigration
23%
77%
Yes No
Referendum Results
Switzerland does not want any experiments concerning the welfare institutions
Purpose of Referendum
• Relatively broad formulation of the referendum
• Basic monthly income of 3 250 CAD for adults (800 CAD for children) suggested
• Intention: Ensure humane life and enable
everyone to participate in the public life
• UBI would make minimum wage discussion
redundant

28
Understanding Ontario Demographics

29
Focusing on Ontario
“We don’t believe that anyone in Ontario who works full time should be struggling to pay their rent, put food on their tables or care for their families — especially when the provincial economy is doing so well.”
— Labor Minister Kevin Flynn
30
Application to Different Economic Regions
Subtopic
Kaitz Index
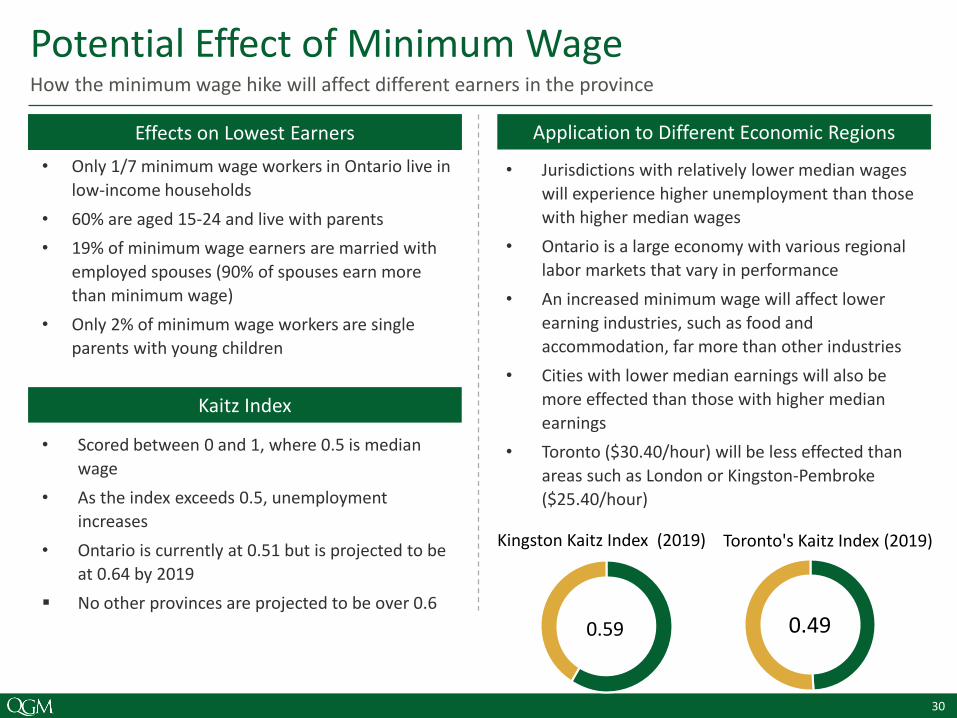
Potential Effect of Minimum WageHow the minimum wage hike will affect different earners in the province
Sources: BBC, The Economist, United Nations
Effects on Lowest Earners
• Only 1/7 minimum wage workers in Ontario live in
low-income households
• 60% are aged 15-24 and live with parents
• 19% of minimum wage earners are married with
employed spouses (90% of spouses earn more
than minimum wage)
• Only 2% of minimum wage workers are single
parents with young children
• Scored between 0 and 1, where 0.5 is median
wage
• As the index exceeds 0.5, unemployment
increases
• Ontario is currently at 0.51 but is projected to be
at 0.64 by 2019
▪ No other provinces are projected to be over 0.6
• Jurisdictions with relatively lower median wages
will experience higher unemployment than those
with higher median wages
• Ontario is a large economy with various regional
labor markets that vary in performance
• An increased minimum wage will affect lower
earning industries, such as food and
accommodation, far more than other industries
• Cities with lower median earnings will also be
more effected than those with higher median
earnings
• Toronto ($30.40/hour) will be less effected than
areas such as London or Kingston-Pembroke
($25.40/hour)
0.59 0.49
Kingston Kaitz Index (2019) Toronto's Kaitz Index (2019)
31
We believe increasing the minimum wage does not achieve the intended outcome of benefitting low-income families. It will potentially increase youth
unemployment rates, and modestly increase inflation levels.

32
Thank you!