Embed Size (px)
Citation preview

Mining Evolving Web Clickstreams with Explicit RetrievalSimilarity Measures
Olfa NasraouiDepartment of Electrical and
Computer EngineeringThe University of Memphis206 Engineering Science
Bldg., Memphis, TN 38152
Cesar CardonaDepartment of Electrical and
Computer EngineeringThe University of Memphis206 Engineering Science
Bldg., Memphis, TN 38152
Carlos RojasDepartment of Electrical and
Computer EngineeringThe University of Memphis206 Engineering Science
Bldg., Memphis, TN 38152
ABSTRACTData on the Web is noisy, huge, and dynamic. This poses enormous chal-lenges to most data mining techniques that try to extract patterns fromthis data. While scalable data mining methods are expected to cope withthe size challenge, coping with evolving trends in noisy data in a con-tinuous fashion, and without any unnecessary stoppages and reconfigu-rations is still an open challenge. This dynamic and single pass settingcan be cast within the framework of mining evolving data streams. Theharsh restrictions imposed by the “you only get to see it once” constrainton stream data calls for different computational models that may bringsome interesting surprises when it comes to the behavior of some wellknown similarity measures during clustering. In this paper, we explorethe task of mining evolving clusters in a single pass with a new scalableimmune based clustering approach (TECNO-STREAMS), and study theeffect of the choice of different similarity measures on the mining pro-cess and on the interpretation of the mined patterns. We propose a simplesimilarity measure that has the advantage of explicitely coupling the pre-cision and coverage criteria to the early learning stages, and furthermorerequiring that the affinity of the data to the learned profiles or summariesbe defined by the minimum of their coverage or precision, hence requir-ing that the learned profiles are simultaneously precise and complete,with no compromises. In our simulations, we study the task of miningevolving user profiles from Web clickstream data (web usage mining) ina single pass, and under different trend sequencing scenarios.
Keywordsartificial immune systems, unsupervised learning, clustering, stream datamining, web usage mining, text mining, mining evolving data
1. INTRODUCTIONNatural organisms exhibit powerful learning and processing abilities
that allow them to survive and proliferate generation after generationin ever changing and challenging environments. The natural immunesystem is a powerful defense system that exhibits many signs of cogni-tive learning and intelligence [6]. In particular the acquired or adaptiveimmune system is comprised mainly of lymphocytes which are specialtypes of white blood cells (B-cells) that detect and destroy pathogens,such as viruses and bacteria. Identification of a particular pathogen isenabled by soluble proteins on the cell surface, called antigens. Specialprotein receptors on the B-cell surface, called antibodies are specializedto react to a particular antigen by binding to this antigen. Lymphocytesare only activated when the bond exceeds a minimum strength that may
Copyright is held by the author/owner(s).WWW2004, May 17–22, 2004, New York, NY USA.ACM xxx.xxx.
be different for different lymphocytes. A stronger binding with an anti-gen induces a lymphocyte to clone more copies of itself, hence providingreinforcement. Mature lymphocytes form the long term memory of theimmune system, and help recognize and fight similar antigens that maybe encountered in the future. Therefore, the immune system can per-form pattern recognition and associative memory in a continuous anddecentralized manner.
Recently, data mining has put even higher demands on clustering al-gorithms. They now must handle very large data sets, leading to somescalable clustering techniques. However, most scalable clustering tech-niques such as BIRCH [27] and the scalable K-Means (SKM) [4] as-sume that clusters are clean of noise, hyper-spherical, similar in size,and span the whole data space. Robust clustering techniques have re-cently been proposed to handle noisy data. Another limitation of mostclustering algorithms is that they assume that the number of clusters isknown. However, in practice, the number of clusters may not be known.This problem is called unsupervised clustering. A recent explosion ofapplications generating and analyzing data streams has added new un-precedented challenges for clustering algorithms if they are to be ableto track changing clusters in noisy data streams using only the new datapoints because storing past data is not even an option [2, 1, 5, 9].
Web usage mining [24, 26, 20, 7, 21, 3, 19, 22, 18, 17, 25] has recentlyattracted attention as a viable framework for extracting useful access pat-tern information, such as user profiles, from massive amounts of Web logdata for the purpose of Web site personalization and organization. Mostefforts have relied mainly on clustering or association rule discovery asthe enabling data mining technologies. Typically, data mining has to becompletely re-applied periodically and offline on newly generated Webserver logs in order to keep the discovered knowledge up to date.
In [14], we proposed a new immune system inspired approach forclustering noisy multi-dimensional stream data, called TECNO-STREAMS(Tracking Evolving Clusters in NOisy Streams), that has the advantagesof scalability, robustness, and automatic scale estimation. TECNO-STREAMS is a scalable clustering methodology that gleams inspira-tion from the natural immune system to be able to continuously learnand adapt to new incoming patterns by detecting an unknown number ofclusters in evolving noisy data in a single pass.
In this paper, we study the possibility of mining evolving user profilesfrom Web clickstream data (web usage mining) in a single pass, and un-der different usage trend sequencing scenarios. We also study the effectof the choice of different similarity measures on the mining process andon the interpretation of the mined patterns. We propose a simple similar-ity measure that has the advantage of explicitely coupling the precisionand coverage criteria to the early learning stages, and furthermore requir-ing that the affinity of the data to the learned profiles or summaries bedefined by the minimum of their coverage or precision, hence requiring
42
that the learned profiles are simultaneously precise and complete, withno compromises.
The rest of the paper is organized as follows. In Section 2, we de-scribe the TECNO-STREAMS algorithm. and compare it to some exist-ing scalable clustering algorithms. In Section 3, we describe how we canuse TECNO-STREAMS to track evolving clusters in Web usage data,and illustrate using it for mining real Web clickstream data, while study-ing the effect of the choice of different similarity measures on miningand interpreting the evolving profiles. Finally, in Section 4, we presentour conclusions.
2. TECNO-STREAMS (TRACKING EVOLVINGCLUSTERS IN NOISY STREAMS)
The immune system (lymphocyte elements) can behave as an alterna-tive biological model of intelligent machines, in contrast to the conven-tional model of the neural system (neurons). In particular, the ArtificialImmune Network (AIN) model is based on Jerne’s Immune Networktheory [12]. The system consists of a network of B cell lymphocytesthat summarize the learned model. The immune network consists ofa set,
���, of artificial B-cells, as well as stimulating and suppressing
links between them. Learning takes as input a set of antigen trainingdata, ��� , and tries to learn an optimal immune network consisting oflinked B-Cells based on cloning operations as in nature. Each B-Cellrepresents a learned pattern that could be matched to or validated by anantigen/data item or another B-Cell in the network. A link between twoB-Cells gets stronger if they are more similar. Data from the antigentraining set is matched against a B-Cell based on a properly chosen sim-ilarity measure. This affects the B-Cell’s stimulation level, which in turnaffects both its outlook for survival, as well as the number of clones thatit produces. Because clones are similar to their spawning parent, they to-gether form a network of co-stimulated cells that can sustain themselveseven long after the disappearance of antigen data that has initiated thecloning. However, this network of B-cells will slowly wither and die if itis no longer stimulated by the antigen data for which it has specialized,hence gradually forgetting old encounters. This forgetting is the rea-son why the immune system needs periodical reminders in the form ofre-vaccination. The combined recall and forgetting behavior in the faceof external antigenic agents forms the fundamental principle behind theconcept of emerging or dynamic memory in the immune system. This isspecifically the reason why the immune system metaphor offers a verycompetitive model within the evolving data stream framework. In thefollowing description, we present a more formal treatment of the intu-itive concepts explained above.
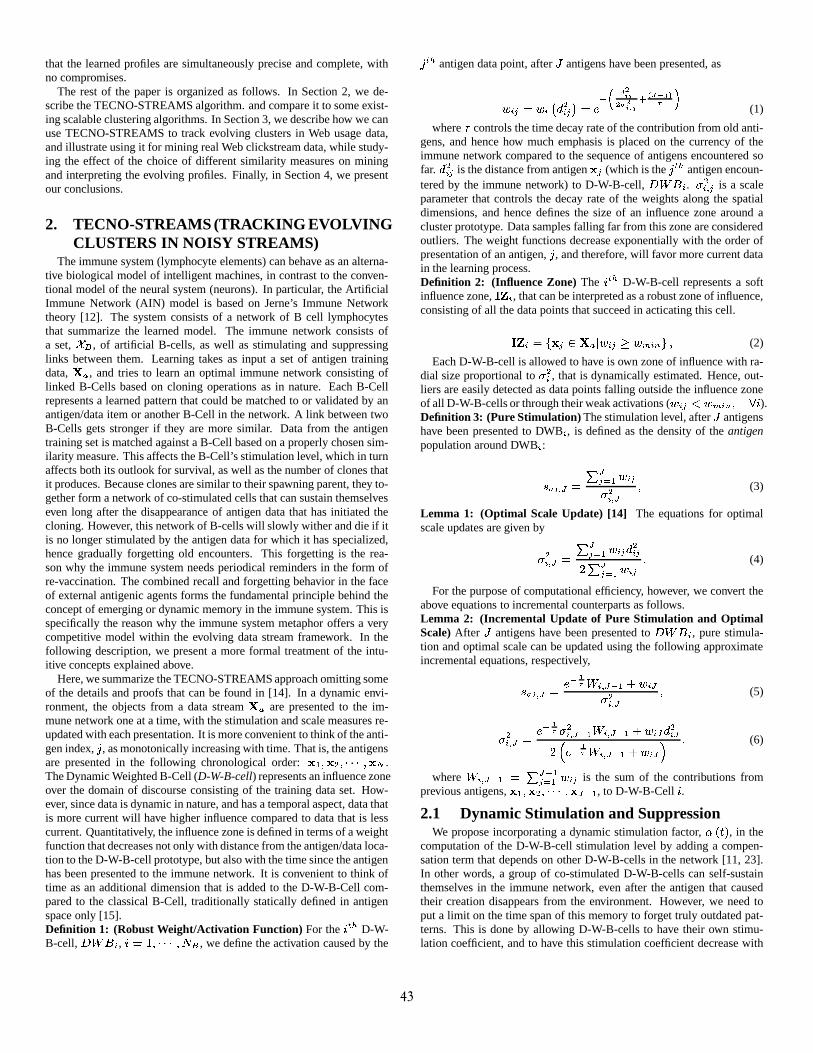
Here, we summarize the TECNO-STREAMS approach omitting someof the details and proofs that can be found in [14]. In a dynamic envi-ronment, the objects from a data stream � � are presented to the im-mune network one at a time, with the stimulation and scale measures re-updated with each presentation. It is more convenient to think of the anti-gen index, � , as monotonically increasing with time. That is, the antigensare presented in the following chronological order: ������ ������������ .The Dynamic Weighted B-Cell (D-W-B-cell) represents an influence zoneover the domain of discourse consisting of the training data set. How-ever, since data is dynamic in nature, and has a temporal aspect, data thatis more current will have higher influence compared to data that is lesscurrent. Quantitatively, the influence zone is defined in terms of a weightfunction that decreases not only with distance from the antigen/data loca-tion to the D-W-B-cell prototype, but also with the time since the antigenhas been presented to the immune network. It is convenient to think oftime as an additional dimension that is added to the D-W-B-Cell com-pared to the classical B-Cell, traditionally statically defined in antigenspace only [15].Definition 1: (Robust Weight/Activation Function) For the ����� D-W-B-cell, ����� � , �"!$#%&�����'�( � , we define the activation caused by the
� ��� antigen data point, after ) antigens have been presented, as
* � + ! * ��,.- � +0/ !2143576�89;:8�< 89>= :@?BADCFE :�GHJI
(1)
where K controls the time decay rate of the contribution from old anti-gens, and hence how much emphasis is placed on the currency of theimmune network compared to the sequence of antigens encountered sofar. - � + is the distance from antigen � + (which is the � ��� antigen encoun-tered by the immune network) to D-W-B-cell, ����� � . L ��M + is a scaleparameter that controls the decay rate of the weights along the spatialdimensions, and hence defines the size of an influence zone around acluster prototype. Data samples falling far from this zone are consideredoutliers. The weight functions decrease exponentially with the order ofpresentation of an antigen, � , and therefore, will favor more current datain the learning process.Definition 2: (Influence Zone) The � ��� D-W-B-cell represents a softinfluence zone, N�OP� , that can be interpreted as a robust zone of influence,consisting of all the data points that succeed in acticating this cell.
N�O � !RQ&� +TS � �VU * � + W *YX �[ZV\ (2)
Each D-W-B-cell is allowed to have is own zone of influence with ra-dial size proportional to L � , that is dynamically estimated. Hence, out-liers are easily detected as data points falling outside the influence zoneof all D-W-B-cells or through their weak activations ( * � + ] *YX �[Z _^`� ).Definition 3: (Pure Stimulation) The stimulation level, after ) antigenshave been presented to DWB � , is defined as the density of the antigenpopulation around DWB � :
a � ��M b !dc b+fe � * � +L ��M b (3)
Lemma 1: (Optimal Scale Update) [14] The equations for optimalscale updates are given by
L ��M b ! c b+�e � * � +�- � +g c b+fe � * � +ih (4)
For the purpose of computational efficiency, however, we convert theabove equations to incremental counterparts as follows.Lemma 2: (Incremental Update of Pure Stimulation and OptimalScale) After ) antigens have been presented to �����j� , pure stimula-tion and optimal scale can be updated using the following approximateincremental equations, respectively,
a � �>M b ! 1 3lkH �m�>M b 3 �on * �[bL ��M b (5)
L �>M b ! 1 3lkH L ��M b 3 � �p��M b 3 �on * �[b - �[bgTq 1 3lkH � ��M b 3 � n * �[bsr h (6)
where �p��M b 3 � ! c b 3 �+fe � * � + is the sum of the contributions fromprevious antigens, �"����o ���������� b 3 � , to D-W-B-Cell � .2.1 Dynamic Stimulation and Suppression
We propose incorporating a dynamic stimulation factor, tvuxw�y , in thecomputation of the D-W-B-cell stimulation level by adding a compen-sation term that depends on other D-W-B-cells in the network [11, 23].In other words, a group of co-stimulated D-W-B-cells can self-sustainthemselves in the immune network, even after the antigen that causedtheir creation disappears from the environment. However, we need toput a limit on the time span of this memory to forget truly outdated pat-terns. This is done by allowing D-W-B-cells to have their own stimu-lation coefficient, and to have this stimulation coefficient decrease with
43

their age: tvuxw�y ! �� ? �H�� . We also incorporate a dynamic suppression
factor,� uxw�y ! �� ? �H�� to control the proliferation and redundancy of the
D-W-B-cell population.
2.2 Bridging the Scalability Gap: Organizationand Compression of the Immune Network
The number of possible internal interactions (between different cellsin the network) can be a serious bottleneck in the face of all existingimmune network based learning techniques [11, 23]. Suppose that theimmune network is compressed by clustering the D-W-B-cells using alinear complexity approach such as K Means. Then the immune networkcan be divided into � subnetworks that form a parsimonious view of theentire network. For global low resolution interactions, such as the onesbetween D-W-B-cells that are very different, only the inter-subnetworkinteractions are germane. For higher resolution interactions such as theones between similar D-W-B-cells, we can drill down inside the cor-responding subnetwork and afford to consider all the intra-subnetworkinteractions.Lemma 3: (Effect of Network Compression on Scalability) The pro-posed AIS based clustering model can achieve scalability at a finite com-pression rate ( ��� ( � ).
2.3 Effect of the Network Compression on Inter-action Terms
Instead of taking into account all possible u>( � y interactions betweenall ( � cells in the immune network, only the intra-subnetwork interac-tions with the ( �� D-W-B-cells inside the parent subnetwork (the closestsubnetwork to which this B cell is assigned) are taken into account. Incase K-Means is used, this representative as well as the organization ofthe network into subnetworks is a by-product. For more complex datastructures, a reasonable best representative/prototype (such as a medoid)can be chosen. Taking these modifications into account, the stimulationand scale values that take advantage of the compressed network are givenby
a �'! a � �>M b n tvuxw�y c �9� e � * � L ��M b �
� uxw�y c �9� e � * � L ��M b (7)
where a � �>M b is the pure antigen stimulation after encountering ) anti-gens, given by (5 ) for D-W-B-cell � ; and ( �� is the number of B-cells inthe subnetwork that is closest to the � ��� DWB-cell. This will modify theD-W-B-cell scale update equations to become
L ��M b ! #g � �>M b n tvuxw�y c �9� e � * � - � � � uxw�y c �
9� e � * � - � � ��M b n tvuxw�y c �9� e � * � � � uxw�y c �
9� e � * � (8)
where � ��M b !21 3 kH L �>M b 3 � � �>M b 3 � n * �[bs- �[b and � ��M b !21 3 kH � ��M b 3 � n* � b2.4 Cloning in the Dynamic Immune System
The D-W-B-cells are cloned in proportion to their stimulation levelsrelative to the average network stimulation. However, to avoid prelimi-nary proliferation of D-W-B-Cells, and to encourage a diverse repertoire,new D-W-B-Cells do not clone before they are mature (their age, w�� ex-ceeds a lower limit w X �[Z ). Similarly, D-W-B-cells with age w ��� w X ���are frozen, or prevented from cloning, to give a fair chance to newerD-W-B-Cells. This means that (�� � Z���� 9 !���� � Z�� � 9��� �� � k � �"!$# w X �DZ&%w�� % w X ��� h2.5 TECNO-STREAMS: Tracking Evolving Clus-
ters in Noisy Data Streams with a ScalableImmune System Learning Model
TECNO-STREAMS Algorithm:(optional steps are enclosed in [] )
Fix the maximal population size, ' � X ��� ;Initialize D-W-B-cell population and ( �*) ( �DZ%� � using the first ' � X �+�input antigens;Compress immune network into , subnets using 2 iterations of K Means;Repeat for each incoming antigen - +/.
Present antigen to each subnet centroid, 02143�5 )76 398:898;3�, in network :Compute distance, activation weight, <=1 + and update ( 1 incrementally using(6);
Determine the most activated subnet (the one with maximum <=1 + );IF All B-cells in most activated subnet have < � +?> < X �[Z (antigen does
not sufficiently activate subnet) THEN .Create by duplication a new D-W-B-cell = - + and ( �@) ( �DZ%� � ;A
ELSE .Repeat for each D-W-B-cell � in most activated subnet .
IF < � +2B < X �[Z (antigen activates D-W-B-cell � ) THENRefresh age ( C )ED ) for D-W-B-cell � ;
ELSEIncrement age ( C ) for D-W-B-cell � ;
Compute distance from antigen - + to D-W-B-cell � ;Compute D-W-B-cell � ’s stimulation level using (7);Update D-W-B-cell � ’s ( � using (8);AA
Clone and mutate D-W-B-cells;IF population size B ' � X �+� Then .
IF (Age of B-cell > C X �DZ ) THENTemporarily scale D-W-B-cell’s stimulation level to the network average
stimulation;Sort D-W-B-cells in ascending order of their stimulation level;Kill worst excess (top ( ' �EF ' � X ��� ) according to previous sorting)
D-W-B-cells;[or move oldest/mature D-W-B-Cells to secondary (long term) storage];A
Compress immune network periodically (after every G antigens), into ,subnets using 2 iterations of K Means with the previous centroids as initialcentroids;A
2.6 Comparison to Other Clustering TechniquesBecause of paucity of space, we review only some related methods,
as summarized in Table 1. We note that all immune based techniques,as well as most evolutionary type clustering techniques are expected tobenefit from insensitivity to initial conditions (reliability) by virtue ofbeing population based. Moreover, most techniques achieve their scala-bility by using a special indexing structure which requires an additionalpreliminary scan of the data which may not be acceptable in the contextof data streams.
3. MINING EVOLVING USER PROFILES FROMNOISY WEB CLICKSTREAM DATA
Recently, data mining techniques have been applied to extract usagepatterns from Web log data [24, 26, 20, 7, 21, 19, 22, 3, 18, 17, 25]. In[19, 18], we have proposed new robust and fuzzy relational clusteringtechniques that allow Web usage clusters to overlap, and that can detectand handle outliers in the data set. A new subjective similarity measurebetween two Web sessions, that captures the organization of a Web site,was also presented as well as a new mathematical model for “robust”Web user profiles [19] and quantitative evaluation means for their vali-dation. Unfortunately, the computation of a huge relation matrix addeda heavy computational and storage burden to the clustering process.
In [17], we presented a quasi-linear complexity technique, called Hi-erarchical Unsupervised Niche Clustering (H-UNC), for mining bothuser profile clusters and URL associations in a single step. More re-cently, we have presented a new approach to mining user profiles that
44

Table 1: Comparison of proposed Scalable Immune Clustering Ap-proach with Other Algorithms
Approach � TECNO-STREAMS SKM [4] DBSCAN [8] DENCLUE [10] BIRCH [27]
Reliabibilty/Insensitivity yes no yes no no
to initialization
Robustness to noise yes no yes yes no
Requires Pre-Clustering scan/ no yes yes yes yes
Spatial Data Structure (integrated) (���
-tree) (���
-tree) ( ��� -tree)
Time Complexity: � A G � � � � � A � G � � A � G �Requires Buffer for Data no yes yes yes yes
Requires No. of Clusters no yes no yes no
Handles evolving clusters yes no no no no
Robust Automatic Scale yes no no no no
Estimation
Cluster Model network centroids medoids centroids centroids
Handles Arbitrary yes no yes no no
Dissimilarity Measures
Density/Partition based? Density Partition Density Density Partition
is inspired by concepts from the natural immune system [15]. This ap-proach proved to be successful in mining clusters and frequent item-sets from large web session data. This kind of data, which is extremelysparse, presents a real challenge to conventional clustering and frequentitemset mining techniques. Many data sets share this sparsity with click-stream data: these include text data as well as a large number of trans-actional databases. Unfortunately, all the above methods assume thatthe entire preprocessed Web session data could reside in main memory.This can be a disadvantage for systems with limited main memory incase of huge web session data, since the I/O operations would have tobe extensive to shuffle chunks of data in and out, and thus compromisescalability. Today’s web sites are a source of an exploding amount ofclickstream data that can put the scalability of any data mining techniqueinto question.
Moreover, the Web access patterns on a web site are very dynamic innature, due not only to the dynamics of Web site content and structure,but also to changes in the user’s interests, and thus their navigation pat-terns. The access patterns can be observed to change depending on thetime of day, day of week, and according to seasonal patterns or otherexternal events in the world. As an alternative to locking the state ofthe Web access patterns in a frozen state depending on when the Weblog data was collected and preprocessed, we propose an approach thatconsiders the Web usage data as a reflection of a dynamic environmentwhich therefore requires dynamic learning of the access patterns. An in-telligent Web usage mining system should be able to continuously learnin the presence of such conditions without ungraceful stoppages, recon-figurations, or restarting from scratch. In this section, we illustrate us-ing TECNO-STREAMS to continuously and dynamically learn evolvingWeb access patterns from non-stationary Web usage environments.
3.1 Similarity Measures Used in the Learning Phaseof Single-Pass Mining of Clusters in Web Data
For many data mining applications such as clustering text documentsand other high dimensional data sets, the Euclidean distance measure isnot appropriate. This is due mainly to the high dimensionality of theproblem, and the fact that two documents may not be considered similarif keywords are missing in both documents. More appropriate for thisapplication, is the cosine similarity measure between data item � � anda learned B-Cell profile ��+ , which in the simplest case, can both be de-fined as binary vectors of length � , the total number of items/URLs orkeywords, [13],
� � � � � + ! c Z 1 e ��� � 1���� + 1� c Z 1 e � � � 1 c Z 1 e � � + 1 h (9)
We note that it is easy to show that the cosine similarity is related tothe well known information retrieval measures of precision and coverageas follows:
� � � � � + !�� ���%1���� � + �"!$#&% � � + (10)
where the precision in the learning phase, ���%1��'��� + describes the ac-curacy of the learned B-cell profiles � + in representing the data � � , orthe ratio of the number of matching items (URLs or terms) between thelearned profile and the data (session or document) to the number of itemsin the learned profile:
���F1�� � � + ! c Z 1 e � � � 1 ��� + 1c Z 1 e � � + 1 (11)
while the coverage in the learning phase, �"!(#&% � � + describes the com-pleteness of the learned B-cell profiles ��+ in representing the data �o� ,or the ratio of the number of matching items (URLs or terms) betweenthe learned profile and the data (session or document) to the number ofitems in the data:
�"!(#&% � � + ! c Z 1 e �)� � 1��*� + 1c Z 1 e ��� + 1 h (12)
In light of (10), we can see that the cosine similarity tries to optimizeboth precision and coverage simultaneously and equally by combiningthem through the geometrical average. However, we noticed that whenlearning in a single pass framework, this tends to favor longer profilesthat tend to match more data, while compromising precision. Withoutloss of generality, if we confine ourselves to the simplest type of recom-mendation strategy or information retrieval scheme, we can see that com-promising precision can have a pernicious effect on the learned profiles,especially when these are viewed as the cluster or profile summaries thatwill be used later in a recommendation system based on recommend-ing the nearest profile, or in an information retrieval system based onmatching a user query to the nearest cluster representative centroid. Inorder to circumvent this problem, one can simply disregard the coveragecomponent from the cosine similarity, hence using only precision as asimilarity measure. However, we noticed that this would tend to sufferfrom the other extreme, resulting in very short profiles that completelyignore coverage. For this reason, we propose to use different combi-nation strategies of precision and coverage, not necessarily limited tothe geometrical average. It can be shown that the most conservativeaggregation that places harsh demands on both precision and coveragesimultaneously must be given by the following pessimistic aggregation,
� X �[Z � + !,+ !.-0/ ���%1�� � � + �"!(#&% � � +)1 (13)
Therefore, we will compare learning the profiles using cosine similar-ity
� � � � to learning using the most pessimistic aggregation of precisionand coverage, called Min-Of-Precision-Coverage or MinPC,
� X �[Z � + .3.2 Similarity Measures Used in the Validation
Phase of Single-Pass Mining of Clusters inWeb Data
In evaluating the goodness of the learned B-Cell profiles that makeup the immune network model, we recall that the B-cell profiles shouldrepresent the ground-truth trends as accurately as possible, and as com-pletely as possible, and that the distribution of the learned repertoire ofB-cell profiles should mirror the incoming stream of evolving data asrepresented by the ground truth profiles/topic representatives. Accuracy
45

can be measured based on the precision of the learned B-cell profiles,� � + relative to the ground truth profiles ����� � , while completeness canbe measured based on coverage of the learned B-cell profiles, � � + rel-ative to the ground truth profiles ����� � . Here, precision in the valida-tion phase, ���F1�� � � + describes the accuracy of the B-cell profiles � � + inrepresenting the ground truth profiles ����� � , or the ratio of the numberof matching items (URLs or terms) between the learned profile and theground truth profiles to the number of items in the learned profile:
���%1�� � � + ! c Z 1 e � � � � 1 �*� ��� + 1c Z 1 e � � � + 1 (14)
while the coverage in the validation phase, �"!$#&% � � + describes thecompleteness of the B-cell profiles � + in representing the data �o� , orthe ratio of the number of matching items (URLs or terms) between thelearned profile and the data (session or document) to the number of itemsin the data:
�"!(#&% � � + ! c Z 1 e � � � � 1 � � ��� + 1c Z 1 e � � ��� + 1 h (15)
These are the measures that are computed as TECNO-STREAMScontinuously learns the profiles from the incoming stream of web ses-sions or text documents.
3.3 Simulation Results with Single-Pass Miningof User Profiles from Real Web ClickstreamData
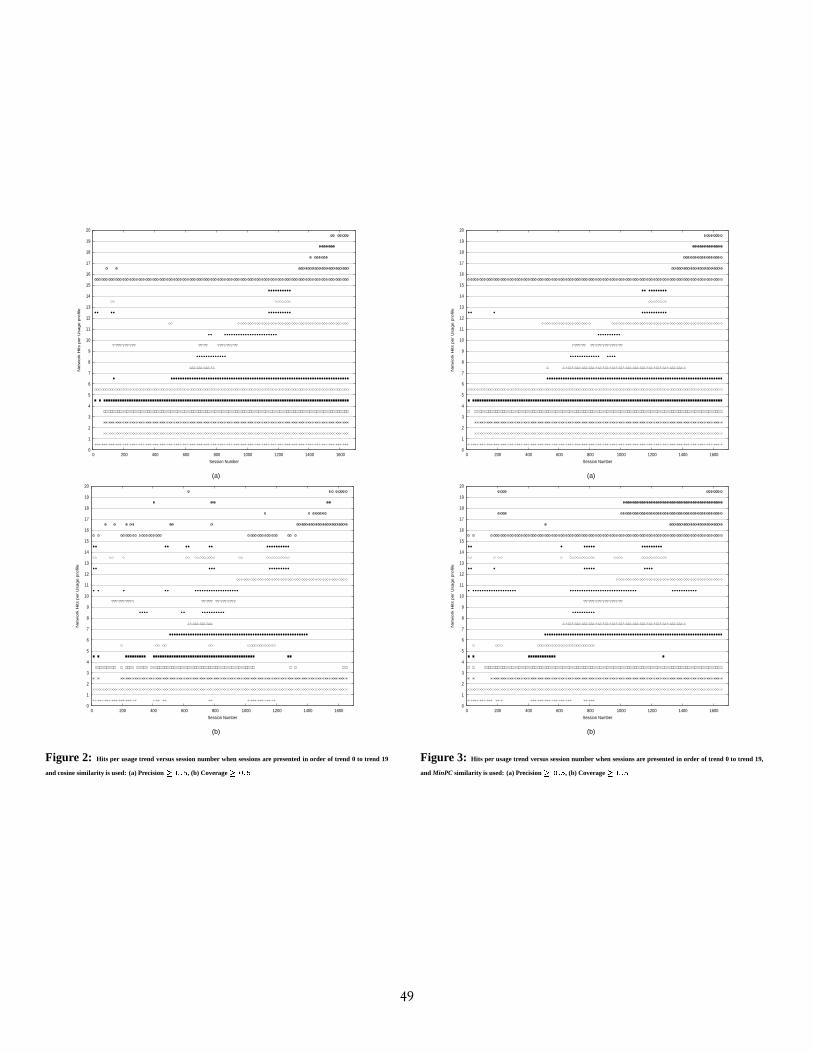
Profiles were mined from the 12-day clickstream data (from 1998)with 1704 sessions and 343 URLs from the website of the department ofComputer Engineering and Computer Science at the University of Mis-souri. This is a benchmark data set used in [16, 17]. The profiles thatwere discovered using TECNO-STREAMS in a single pass are com-parable to the ones previously obtained using a variety of less scalabletechniques [16, 17]. The maximum population size was 50, the controlparameter for compression was � ! # � , with periodical compressionevery � ! # � sessions. The activation threshold was * X �[Z ! � h � � ,and K ! # � � . We illustrate the continuous learning ability of the pro-posed technique using the following simulations:Scenario 1: We partition the Web sessions into 20 distinct sets of ses-sions, each one assigned to the closest of 20 profiles previously discov-ered and validated using Hierarchical Unsupervised Niche Clustering(HUNC) [17], and listed in Table 2. Then we presented these sessions toTECNO-STREAMS one profile at a time: sessions assigned to trend 0,then sessions assigned to profile 1, ���&� , etc.Scenario 2: We used the same session partition as scenario 1, but pre-sented the profiles in reverse order: sessions assigned to trend 19, thensessions assigned to trend 18, ����� , etc, ending with trend 0.Scenario 3: The Web sessions are presented in their natural chronologi-cal order exactly as received in real time by the web server.
For each of the above scenarios, we repeated the experiment usingcosine similarity
� � � � � + in learning as given by (9), and then again usingthe MinPC similarity
� X �DZ � + as given by (13).We track the number of B-cells that succeed in learning each one of
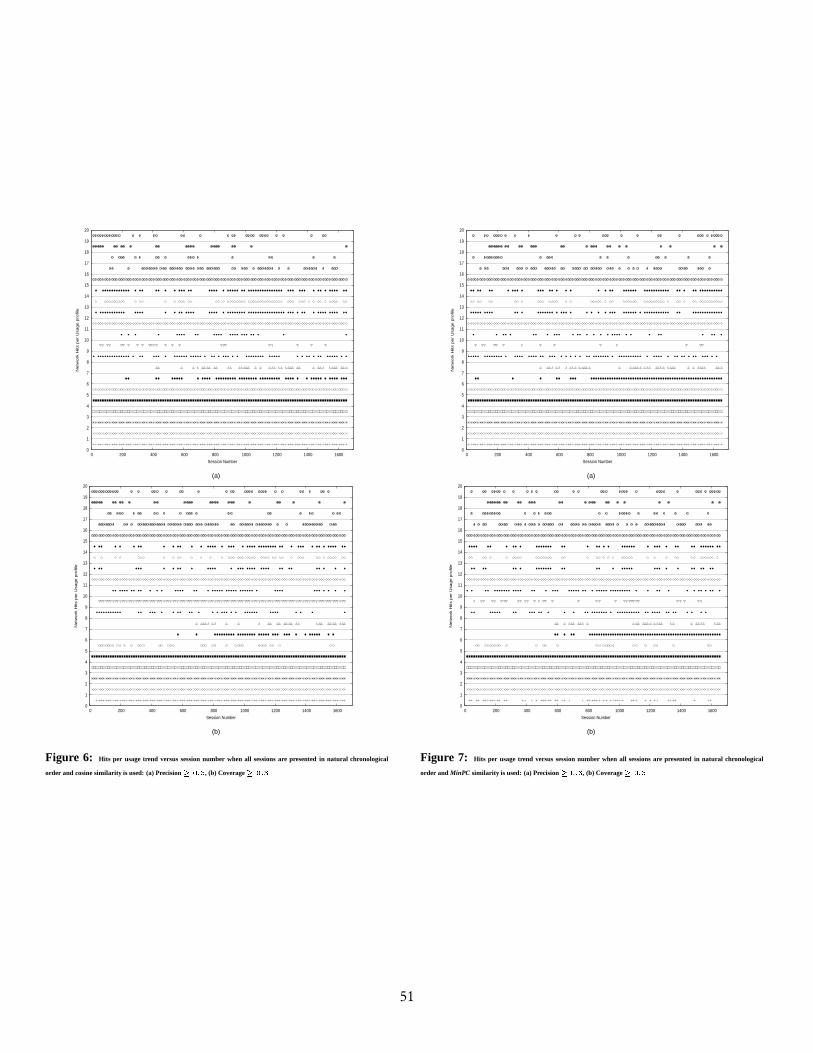
the 20 ground truth profiles after each session is presented, by count-ing the number of B-cells registering a sufficient match (i.e., above acertain threshold) with each ground truth profile based on one of the fol-lowing criteria: (i) precision ���%1�� � � + , measuring the accuracy of thelearned profiles compared to the ground truth profiles as given by (14),(ii) coverage �"!(#&% � � + , measuring the completeness of the learned pro-files compared to the ground truth profiles as given by (15). These twomeasures provide an evolving number of hits per profile relative to eachof the above criteria, as shown in Figures 2 - 7, for the two differentlearning similarity options, and the three above scenarios respectively.
Table 2: Summary of some usage trends previously discovered usingHierarchical Unsupervised Niche Clustering (only URLs with top 3to 4 relevance weights shown in each profile)9 ��� ��� 9 ��� ��� 9
0 106 � 0.99 - /people index.html � , � 0.98 - /people.html � , � 0.97 - /faculty.html �1 104 � 0.99 - / � , � 1.00 - /cecs computer.class �2 177 � 0.90 - /courses index.html � , � 0.88 - /courses100.html � ,
� 0.87 - /courses.html � , � 0.81 - / �3 61 � 0.80 - / � , � 0.48 - /degrees.html � , � 0.23 - /degrees grad.html �4 58 � 0.97 - /degrees undergrad.html � , � 0.97 - /bsce.html � , � 0.95 - /degrees index.html �5 50 � 0.56 - /faculty/springer.html � , � 0.38 - /faculty/palani.html �6 116 � 0.91 - /˜saab/cecs333/private � , � 0.78 - /˜saab/cecs333 �12 74 � 0.57 - /˜shi/cecs345 � , � 0.45 - /˜shi/cecs345/java examples � ,
� 0.46 - /˜shi/cecs345/Lectures/07.html �13 38 � 0.82 - /˜shi/cecs345 � , � 0.47 - /˜shi � , � 0.34 - /˜shi/cecs345/references.html �14 33 � 0.55 - /˜shi/cecs345 � , � 0.55 - /˜shi/cecs345/java examples � , � 0.33 - /˜shi/cecs345/Projects/1.html �15 51 � 0.92 - /courses index.html � , � 0.90 - /courses100.html � ,
� 0.86 - /courses.html � , � 0.78 - /courses200.html �16 77 � 0.78 - /˜yshang/CECS341.html � , � 0.56 - /˜yshang/W98CECS341 � , � 0.29 - /˜yshang �19 120 � 0.27 - /access � , � 0.23 - /access/details.html �
The y-axis is split into 20 intervals, with each interval devoted to thetrend/profile number indicated by the lower value (from 0 to 19). A hitfor the � ��� profile for session No. w is shown in these figures at loca-tion uxw���.y , and indicates the presence of at least one B-cell profile thatachieved the desired threshold in the validation measures of precision orcoverage.
The proposed immune clustering algorithm can learn the user profilesin a single pass. A single pass over all 1704 Web user sessions (with non-optimized Java code) took less than 7 seconds on a 2 GHz Pentium 4 PCrunning on Linux. With an average of 4 milliseconds per user session,the proposed profile mining system is suitable for use in a real time per-sonalization system to constantly and continuously provide a fresh andcurrent list of an unknown number of evolving user profiles. Old pro-files can be handled in a variety of ways. They may either be discarded,moved to secondary storage, or cached for possible re-emergence. Evenif discarded, older profiles that re-emerge later, would be re-learned fromscratch just like new profiles. Hence the logistics of maintaining old pro-files are less crucial compared to existing techniques.
Figures 2 and 3 show the evolving hits per usage trend for the cosinesimilarity and the MinPC similarity, respectively when scenario 1 is de-ployed for sequencing the usage trends. They both exhibit an expectedstaircase pattern proving the gradual learning of emergent usage trendsas these are experienced by the immune network in the order from trend0 to 19. The plot shows some peculiarities, for example at trend 15 sinceit records hits at the same time as trends 0, 2, 3, and 5. Table 2 andthe examination of the user sessions in each of these trends show thatthese trends do indeed share many similarities with trend 15, especiallyin terms of overlap. Typical cross reactions between similar patterns areactually desired and illustrate a certain tolerance for inexact matching.
Figures 2(a) and 3(a) show that the number of learned profiles satisfy-ing more than
� h � precision evolves in synchrony with the usage trendsbeing presented. Furthermore, Figure 3(a) shows that the MinPC sim-ilarity allows learning and maintaining high-precision profiles longerthan cosine similarity in Figure 2(a). For instance, compare the top 3profiles in each figure corresponding to trends 17, 18, and 19 that arepresented last in that sequence. Similarly, Figure 3(b) shows that theMinPC similarity allows learning more high-coverage profiles and cankeep them longer than the plain cosine similarity in Figure 2(b). Thiscan be seen in the top 5 profiles corresponding to trends 15, 16, 17, 18,
46

and 19 that are the last to be encountered in that sequence.Figures 4 and 5 show the evolving hits per usage trend for the co-
sine similarity and the MinPC similarity, respectively when scenario 2 isdeployed for sequencing the usage trends. They show an interesting in-verted staircase pattern due to the reverse presentation order. Again,comparing Figures 4(a) with Figure 5(a) shows that the MinPC sim-ilarity allows learning more high-precision profiles and can maintainthem longer than cosine. Similarly, by contrasting Figure 5(b) and Fig-ure 4(b), we can infer that the MinPC similarity allows learning morehigh-coverage profiles and can keep them longer.
Finally Figures 6 and 7 show the evolving hits per usage trend forthe cosine similarity and the MinPC similarity, respectively when thesessions are presented in their original chronological order correspond-ing to scenario 3. In this case, the order of presentation of the trendsis no longer sequenced in straight or reverse order of the trend number.Instead, the user sessions are presented in completely natural (chrono-logical) order, exactly as in real time. So we cannot expect a staircasepattern. In order to visualize the expected pattern, we simply plot thedistribution of the original input sessions, but with all the noise sessionsexcluded, in Figure 1 to further test the robustness to noise. This figureshows that the session data is quite noisy, and that the arrival sequenceand pattern of sessions belonging to the same usage trend may vary in away that makes incremental tracking and discovery of the profiles evenmore challenging than in a batch style approach, where the sessions canbe stored in memory, and a standard iterative approach is used to minethe profiles. It also shows how some of the usage trends (e.g: No. 13, 14,15) are not synchronized with others, and how some of the trends (No. 5,9, 13, 14) are weak and noisy. Such weak profiles can be even more elu-sive to discover in a real time web mining system. While Figures 6 and 7show the high precision and high-coverage B-cell distribution with time,Figure 1 shows the distribution of the input data with time. The fact thatall these figures show a striking similarity in the emergence patterns ofthe trends, attests to the fact that the immune network is able to form areasonable dynamic synopsis of the usage data, even after a single passover the data, for both types of similarity measures (cosine or MinPC).Again, even here, we notice that MinPC succeeds slightly better thancosine similarity in learning high-precision and high-coverage profiles.This can be seen for example by the fact that profiles 10 and 19 end uplost with the cosine similarity in Figures 6, because their correspondinglearned profiles fall below the precision and coverage threshold.
We notice furthermore that the gap between the MinPC and cosinesimilarities, in the number and fidelity of learned high-precision andhigh-coverage profiles compared to the incoming stream of evolvingtrends, gets wider when the trends are presented one at a time (scenarios1 and 2) as opposed to when they are presented in a more random, al-ternating order (scenario 3). Note that scenarios 1 and 2 are much morechallenging than scenario 3, and they were simulated intentionally to testthe ability of TECNO-STREAMS to learn completely new and unseenpatterns (usage trends, topics, ...etc), even after settling on a stable setof learned patterns before. In other words, these scenarios represent anextreme test of the adaptability of the single-pass web mining system.
It is interesting to note that the memory span of the network is affectedby the parameter K which affects the rate of forgetting in the immunenetwork. A low value will favor faster forgetting, and therefore a morecurrent set of profiles that reflect the most recent activity on a website,while a higher value will tend to keep older profiles in the network forlonger periods.
4. CONCLUSIONWe investigated using a new robust and scalable algorithm (TECNO-
STREAMS) and the effect of similarity for detecting an unknown num-ber of evolving clusters or trends in a noisy Web data stream. The mainfactor behind the ability of the proposed method to learn in a single pass
lies in the richness of the immune network structure that forms a dynamicsynopsis of the data. TECNO-STREAMS adheres to all the requirementsof clustering data streams [2]: compactness of representation, fast incre-mental processing of new data points, and clear and fast identificationof outliers. This is mainly due to the compression mechanism and thedynamic B-cell model that make the immune network manageable, andcontinuous learning possible.
Even though the cosine similarity has been prevalent in the majorityof web clustering approaches, it may fail to explicitely seek profiles thatachieve high coverage and high precision,empsimultaneously. The Min-Of-Precision-Coverage or MinPC similarity, proposed and investigatedin this paper, overcomes these drawbacks. Our simulations confirmedthat the MinPC similarity does a better job than cosine in learning froma stream of evolving data in a single pass setting, regardless of the orderof presentation. This is because the MinPC similarity has the advantageof explicitely coupling the precision and coverage criteria to the earlylearning stages, and furthermore requiring that the affinity of the data tothe learned profiles or summaries be defined by the minimum of theircoverage or precision, hence requiring that the learned profiles are si-multaneously precise and complete, with no compromises.
With an average of 4 milliseconds per user session, the proposed pro-file mining system is suitable for use in a real time personalization sys-tem to constantly and continuously provide the recommendation enginewith a current set of user profiles. The same can be said about the abil-ity to mine evolving topic profiles/summaries from a stream of text data,even in the presence of outliers. In fact detecting potential outliers withTECNO-STREAMS is a trivial process, limited to identifying input datathat fail to activate all the B-cells in the immune network, as describedin Section ??.
The logistics of maintaining, caching, or discarding old profiles aremuch less crucial with our approach than with most existing techniques.Even if discarded, older profiles that re-emerge later, would be re-learnedfrom scratch just like completely new profiles. Like the natural immunesystem, the strongest advantage of our approach is expected to be its easeof adaptation in dynamic environments such as the World Wide Web.Our approach is modular and generic enough that it can be extendedto handle richer Web object models, such as more sophisticated webuser profiles and web user sessions, or more elaborate text documentrepresentations. The only module to be extended would be the similaritymeasure that is used to compute the stimulation levels controlling thesurvival, interaction, and proliferation of the learned B-cell profiles.
5. ACKNOWLEDGMENTSThis work is supported by National Science Foundation CAREER
Award IIS-0133948 to O. Nasraoui.
6. REFERENCES[1] S. Babu and J. Widom. Continuous queries over data streams. In
SIGMOD Record’01, pages 109–120, 2001.[2] D. Barbara. Requirements for clustering data streams. ACM
SIGKDD Explorations Newsletter, 3(2):23–27, 2002.[3] J. Borges and M. Levene. Data mining of user navigation patterns.
In H. A. Abbass, R. A. Sarker, and C. Newton, editors, Web UsageAnalysis and User Profiling, Lecture Notes in Computer Science,pages 92–111. Springer-Verlag, 1999.
[4] P. Bradley, U. Fayyad, and C. Reina. Scaling clustering algorithmsto large databases. In Proceedings of the 4th international conf. onKnowledge Discovery and Data Mining (KDD98), 1998.
[5] Y. Chen, G. Dong, J. Han, B. W. Wah, and J. Wang.Multi-dimensional regression analysis of time-series data streams.In 2002 Int. Conf. on Very Large Data Bases (VLDB’02), HongKong, China, 2002.
[6] I. Cohen. Tending Adam’s Garden. Academic Press, 2000.
47

[7] R. Cooley, B. Mobasher, and J. Srivastava. Data preparation formining world wide web browsing patterns. Journal of knowledgeand information systems, 1(1), 1999.
[8] M. Ester, H. Kriegel, J. Sander, and X. Xu. A density-basedalgorithm for discovering clusters in large spatial databases withnoise. In 2nd International Conference on Knowledge Discoveryand Data Mining, pages 226–231, Portland Oregon, 1996.
[9] S. Guha, N. Mishra, R. Motwani, and L. O’Callaghan. Clusteringdata streams. In IEEE Symposium on Foundations of ComputerScience (FOCS’00), Redondo Beach, CA, 2000.
[10] A. Hinneburg and D. A. Keim. An efficient approach to clusteringin large multimedia databases with noise. In Knowledge Discoveryand Data Mining, pages 58–65, 1998.
[11] J. Hunt and D. Cooke. An adaptative, distributed learning system,based on immune system. In IEEE International Conference onSystems, Man and Cybernetics, pages 2494–2499, Los Alamitos,CA, 1995.
[12] N. K. Jerne. The immune system. Scientific American,229(1):52–60, 1973.
[13] R. R. Korfhage. Information Storage and Retrieval. Wiley, 1997.[14] O. Nasraoui, C. Cardona-Uribe, and C. Rojas-Coronel.
Tecno-streams: Tracking evolving clusters in noisy data streamswith a scalable immune system learning model. In IEEEInternational Conference on Data Mining, Melbourne, Florida,Nov. 2003.
[15] O. Nasraoui, D. Dasgupta, and F. Gonzalez. An artificial immunesystem approach to robust data mining. In Genetic andEvolutionary Computation Conference (GECCO) Late breakingpapers, pages 356–363, New York, NY, 2002.
[16] O. Nasraoui, H. Frigui, R. Krishnapuram, and A. Joshi. Miningweb access logs using relational competitive fuzzy clustering. InEighth International Fuzzy Systems Association Congress,Hsinchu, Taiwan, Aug. 1999.
[17] O. Nasraoui and R. Krishnapuram. One step evolutionary miningof context sensitive associations and web navigation patterns. InSIAM conference on Data Mining, pages 531–547, Arlington, VA,2002.
[18] O. Nasraoui, R. Krishnapuram, H. Frigui, and A. Joshi. Extractingweb user profiles using relational competitive fuzzy clustering.International Journal of Artificial Intelligence Tools,9(4):509–526, 2000.
[19] O. Nasraoui, R. Krishnapuram, and A. Joshi. Mining web accesslogs using a relational clustering algorithm based on a robustestimator. In 8th International World Wide Web Conference, pages40–41, Toronto, Canada, 1999.
[20] M. Perkowitz and O. Etzioni. Adaptive web sites: Automaticallysynthesizing web pages. In AAAI 98, 1998.
[21] C. Shahabi, A. M. Zarkesh, J. Abidi, and V. Shah. Knowledgediscovery from users web-page navigation. In Proceedings ofworkshop on research issues in Data engineering, Birmingham,England, 1997.
[22] J. Srivastava, R. Cooley, M. Deshpande, and P.-N. Tan. Web usagemining: Discovery and applications of usage patterns from webdata. SIGKDD Explorations, 1(2):1–12, Jan 2000.
[23] J. Timmis, M. Neal, and J. Hunt. An artificial immune system fordata analysis. Biosystems, 55(1/3):143–150, 2000.
[24] T. Yan, M. Jacobsen, H. Garcia-Molina, and U. Dayal. From useraccess patterns to dynamic hypertext linking. In Proceedings ofthe 5th International World Wide Web conference, Paris, France,1996.
[25] H. Yang, S. Parthasarathy, and S. Reddy. On the use of constrainedassociation rules for web mining. In WebKDD workshop on
0
1
2
3
4
5
6
7
8
9
10
11
12
13
14
15
16
17
18
19
20
0 200 400 600 800 1000 1200 1400 1600
Figure 1: Distribution of input sessions over usage trend versus session number when only non-noisy ( �9;: �
��� �) sessions are presented in natural chronological order. The horizental axis depicts the session number or a time stamp.
The vertical axis is split into several horizental bands, each one depicting one of the 20 usage trends. Trends 5, 9, 13, 14, 15,
and 19 appear to be weaker and noisier. Also trends 6 and 7 emerge late in the 12-day access log, while trend 0 weakens in
the last days.
Knowledge Discovery in the Web, pages 77–90, Edmonton,Alberta, Canada, 2002.
[26] O. Zaiane, M. Xin, and J. Han. Discovering web access patternsand trends by applying olap and data mining technology on weblogs. In Advances in Digital Libraries, pages 19–29, SantaBarbara, CA, 1998.
[27] T. Zhang, R. Ramakrishnan, and M. Livny. Birch: An efficientdata clustering method for large databases. In ACM SIGMODInternational Conference on Management of Data, pages103–114, New York, NY, 1996. ACM Press.
48
0
1
2
3
4
5
6
7
8
9
10
11
12
13
14
15
16
17
18
19
20
0 200 400 600 800 1000 1200 1400 1600
Netw
ork
Hits p
er
Usage p
rofile
Session Number
(a)
0
1
2
3
4
5
6
7
8
9
10
11
12
13
14
15
16
17
18
19
20
0 200 400 600 800 1000 1200 1400 1600
Ne
two
rk H
its p
er
Usa
ge
pro
file
Session Number
(b)
Figure 2: Hits per usage trend versus session number when sessions are presented in order of trend 0 to trend 19
and cosine similarity is used: (a) Precision ����� � , (b) Coverage ����� �
0
1
2
3
4
5
6
7
8
9
10
11
12
13
14
15
16
17
18
19
20
0 200 400 600 800 1000 1200 1400 1600N
etw
ork
Hits p
er
Usage p
rofile
Session Number
(a)
0
1
2
3
4
5
6
7
8
9
10
11
12
13
14
15
16
17
18
19
20
0 200 400 600 800 1000 1200 1400 1600
Ne
two
rk H
its p
er
Usa
ge
pro
file
Session Number
(b)
Figure 3: Hits per usage trend versus session number when sessions are presented in order of trend 0 to trend 19,
and MinPC similarity is used: (a) Precision ����� � , (b) Coverage ����� �
49

0
1
2
3
4
5
6
7
8
9
10
11
12
13
14
15
16
17
18
19
20
0 200 400 600 800 1000 1200 1400 1600
Netw
ork
Hits p
er
Usage p
rofile
Session Number
(a)
0
1
2
3
4
5
6
7
8
9
10
11
12
13
14
15
16
17
18
19
20
0 200 400 600 800 1000 1200 1400 1600
Ne
two
rk H
its p
er
Usa
ge
pro
file
Session Number
(b)
Figure 4: Hits per usage trend versus session number when sessions are presented in reverse order from trend 19
to trend 0, and cosine similarity is used: (a) Precision ����� � , (b) Coverage ����� �
0
1
2
3
4
5
6
7
8
9
10
11
12
13
14
15
16
17
18
19
20
0 200 400 600 800 1000 1200 1400 1600N
etw
ork
Hits p
er
Usage p
rofile
Session Number
(a)
0
1
2
3
4
5
6
7
8
9
10
11
12
13
14
15
16
17
18
19
20
0 200 400 600 800 1000 1200 1400 1600
Ne
two
rk H
its p
er
Usa
ge
pro
file
Session Number
(b)
Figure 5: Hits per usage trend versus session number when sessions are presented in reverse order from trend 19
to trend 0, and MinPC similarity is used: (a) Precision ����� � , (b) Coverage ����� �
50
0
1
2
3
4
5
6
7
8
9
10
11
12
13
14
15
16
17
18
19
20
0 200 400 600 800 1000 1200 1400 1600
Netw
ork
Hits p
er
Usage p
rofile
Session Number
(a)
0
1
2
3
4
5
6
7
8
9
10
11
12
13
14
15
16
17
18
19
20
0 200 400 600 800 1000 1200 1400 1600
Ne
two
rk H
its p
er
Usa
ge
pro
file
Session Number
(b)
Figure 6: Hits per usage trend versus session number when all sessions are presented in natural chronological
order and cosine similarity is used: (a) Precision ����� � , (b) Coverage ����� �
0
1
2
3
4
5
6
7
8
9
10
11
12
13
14
15
16
17
18
19
20
0 200 400 600 800 1000 1200 1400 1600N
etw
ork
Hits p
er
Usage p
rofile
Session Number
(a)
0
1
2
3
4
5
6
7
8
9
10
11
12
13
14
15
16
17
18
19
20
0 200 400 600 800 1000 1200 1400 1600
Ne
two
rk H
its p
er
Usa
ge
pro
file
Session Number
(b)
Figure 7: Hits per usage trend versus session number when all sessions are presented in natural chronological
order and MinPC similarity is used: (a) Precision ����� � , (b) Coverage ����� �
51