Embed Size (px)
Citation preview
21/07/2009
1
Mining Industry in Chile
Juan Carlos Guajardo B.
Executive Director
Friday 9th January 2009
Center for Copper and Mining Studies
•Independent think-tank, non-profit organization established in Santiago in 1984.
•Contribute to the design and debate of public policies which foster the best use of the mining industry's potential for development.
•CESCO has positioned itself as a meeting place for diverse sectors interested in mining --business, academia, policymakers and professionals--
•Membership of CESCO: executives or consultant for national and foreign mining companies, others as professors in local or foreign universities.
•Cesco is self-funded in 100% (Cesco Week, Conferences, others)
21/07/2009
2
1. The Relevance of Mining to Chile
“Situación y perspectivas de la minería en chile. La visión del sector privado”. Presentación de Alvaro Merino Lacoste. Sociedad Nacional de Minería. 26 octubre 2005. “Importancia del Sector Privado en el Desarrollo Minero de Chile”. Presentación de Alberto Salas SONAMI. La Serena, 4 de Junio de 2008.
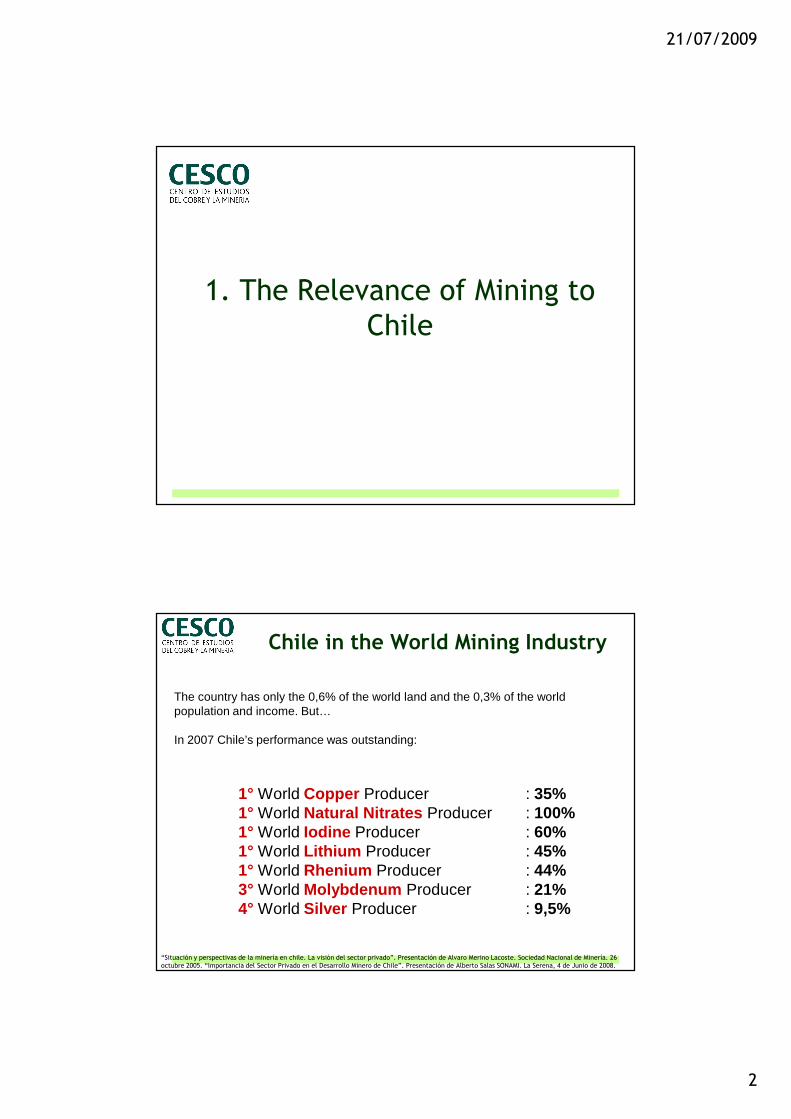
Chile in the World Mining Industry
The country has only the 0,6% of the world land and the 0,3% of the world population and income. But…
In 2007 Chile’s performance was outstanding:
1° World Copper Producer : 35%1° World Natural Nitrates Producer : 100%1° World Iodine Producer : 60%1° World Lithium Producer : 45%1° World Rhenium Producer : 44%3° World Molybdenum Producer : 21%4° World Silver Producer : 9,5%
21/07/2009
3
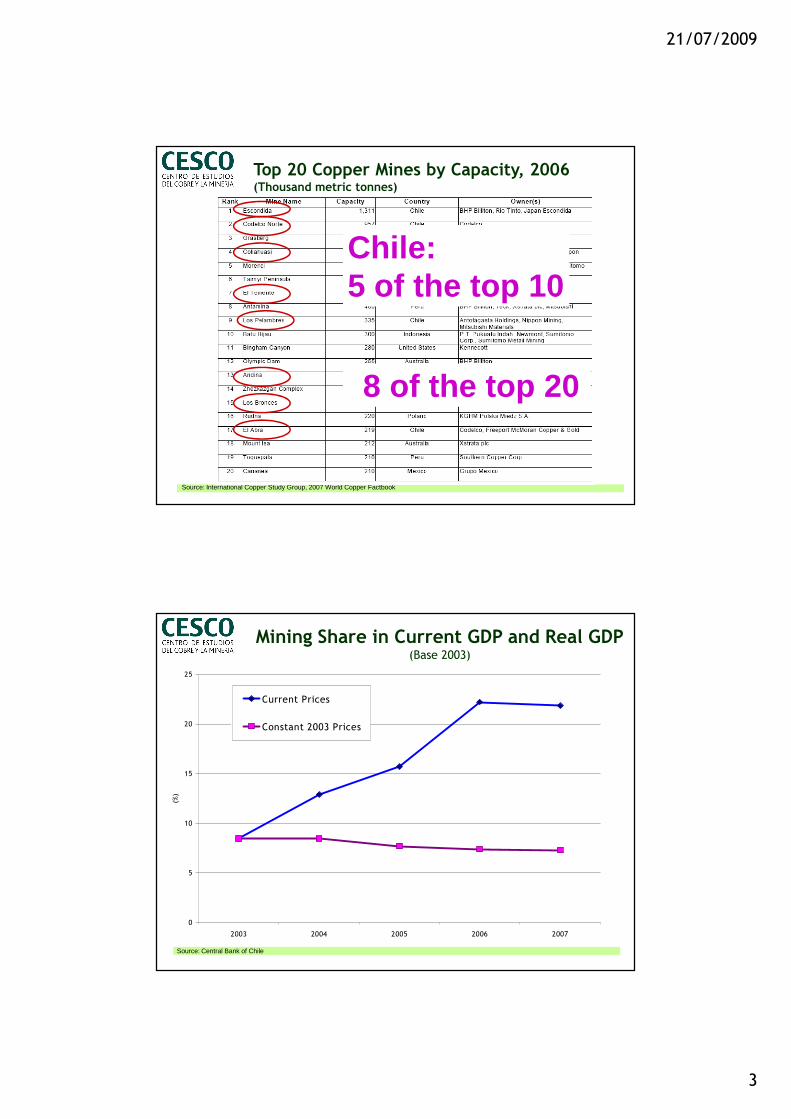
Source: International Copper Study Group, 2007 World Copper Factbook
Top 20 Copper Mines by Capacity, 2006(Thousand metric tonnes)
Chile:5 of the top 10
8 of the top 20
Mining Share in Current GDP and Real GDP(Base 2003)
Source: Central Bank of Chile
0
5
10
15
20
25
2003 2004 2005 2006 2007
(%)
Current Prices
Constant 2003 Prices
21/07/2009
4
0
20.000
40.000
60.000
80.000
100.000
120.000
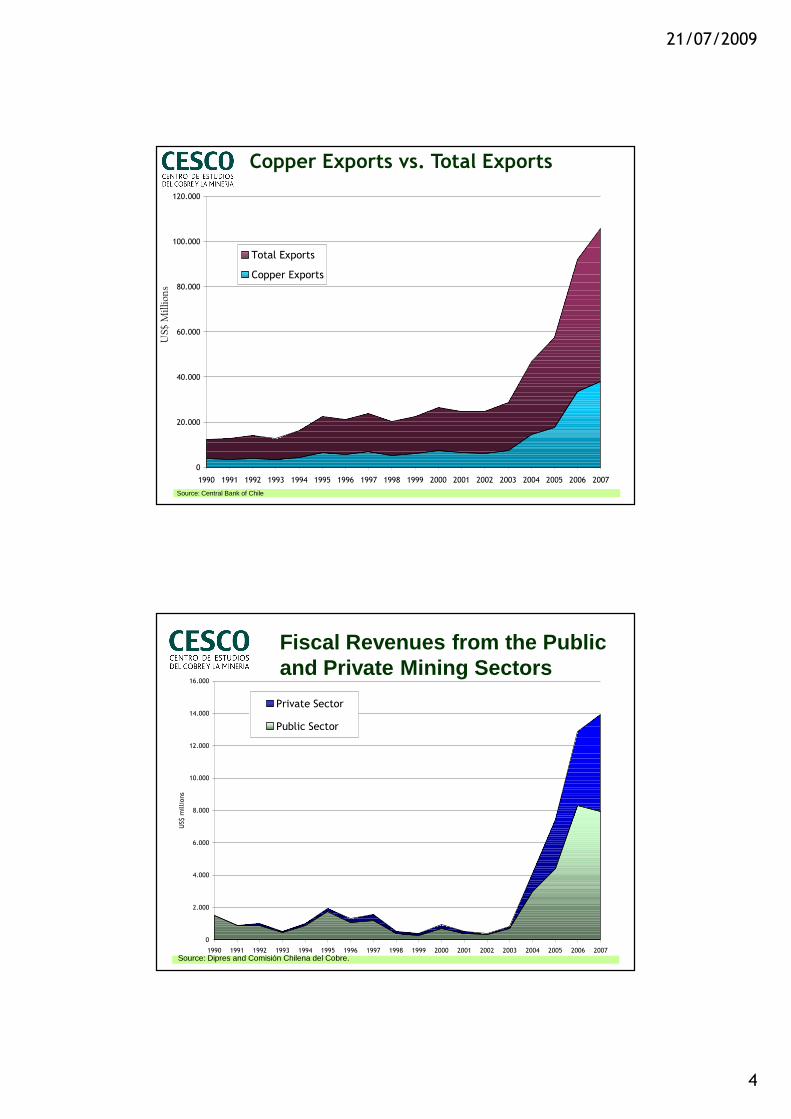
1990 1991 1992 1993 1994 1995 1996 1997 1998 1999 2000 2001 2002 2003 2004 2005 2006 2007
Total Exports
Copper Exports
Source: Central Bank of Chile
Copper Exports vs. Total ExportsUS$ M
illions
0
2.000
4.000
6.000
8.000
10.000
12.000
14.000
16.000
1990 1991 1992 1993 1994 1995 1996 1997 1998 1999 2000 2001 2002 2003 2004 2005 2006 2007
US$ m
illions
Private Sector
Public Sector
Fiscal Revenues from the Public and Private Mining Sectors
Source: Dipres and Comisión Chilena del Cobre.

21/07/2009
5
Fiscal Revenues from the Public and Private Mining vs The Total Fiscal Income
Source: Ministry of Finance.
0
5.000
10.000
15.000
20.000
25.000
30.000
35.000
40.000
45.000
50.000
1990 1991 1992 1993 1994 1995 1996 1997 1998 1999 2000 2001 2002 2003 2004 2005 2006 2007
US
$ M
illio
ns
0%
5%
10%
15%
20%
25%
30%
35%
40%
Total Fiscal Revenues
% Mining
Chile’s Copper Mining Industry
Annual Production (Copper Tons)
Number of Company
Sales(US$ Millions)
Nº of Employees
(2007)
Large Mining
> 30.000 19 40.000 34.745
Medium Mining
10.000 - 30.000 29 2.500 7.560 (2)
Small Mining
< 10.000 2.050 (1) 400 8.438 (2)
1. Monthly Average 2007
2. Metals Mining
Source: Instituto de Ingenieros en Minas de Chile, ENAMI, Cochilco, SONAMI.

21/07/2009
6
•(1) Cerro Colorado•(2) Quebrada Blanca •(3) Collahuasi •(4) El Abra •(5) Radomiro Tomic •(6) Chuquicamata •(7) Michilla-Lince •(8) Mantos Blancos•(9) Lomas Bayas•(10) Spence •(11) El Tesoro •(12) Escondida •(13) Zaldívar •(14) El Salvador •(15) Manto Verde •(16) La Candelaria •(17) El Indio •(18) Andacollo •(19) Los Pelambres•(20) El Soldado •(21) Andina •(22) Los Bronces •(23) El Teniente
Chile´s Copper Mines
Source: Instituto de Ingenieros en Minas de Chile, ENAMI, Cochilco, SONAMI.
Total Investment: US$ 63.516 millionsInvestment in mining: US$ 21.087 millions (1974 - 2006)
Foreign Investment in Mining and Other Sectors1974-2006
Source: Foreign Investment Committee
Mining is the Principal Sector in Foreign Investment
Chemicals
4%
Others
18%
Mining
32%
Electricity, gas and
water
20%
Communication
10%
Financial Services
10%
Food, Beverages
&Tobacco
3%
Insurance
3%

21/07/2009
7
0%
10%
20%
30%
40%
50%
60%
70%
1999 2007
Subcontratistas Planta TotalMinería Privada 39.000 31.000 70.000Codelco 28.000 14.000 42.000Total 67.000 45.000 112.000Fuente: Compañías Mineras
Outsourcing in Mining1999-2007
Source: INE and Mining Companies
Direct Employment and Outsourcing
Source: INE
Impact of Mining Activity in Chilean Employment

21/07/2009
8
Chile´s Mining Employment(Yearly Average)
Source: Anuario Cochilco.
0
10.000
20.000
30.000
40.000
50.000
60.000
70.000
1997 1998 1999 2000 2001 2002 2003 2004 2005 2006 2007
People
0,0
0,2
0,4
0,6
0,8
1,0
1,2
% Mining Employm
ent in Chile
2. Historical Trends and Political Issues

21/07/2009
9
GDP, Mining and Agriculture1860-2000
(Millions Chilean pesos of 1996)
Source: Wagner, Gert and José Díaz. 2008. Inflación y Tipo de Cambio: Chile 1810-2005. Documento de Trabajo Nº 328, Departamento de Economía Pontificia Universidad Católica de Chile.
Chilean Nitrate Production1860-2006(Tons)
Source: Wagner, Gert and José Díaz. 2008. Inflación y Tipo de Cambio: Chile 1810-2005. Documento de Trabajo Nº 328, Departamento de Economía Pontificia Universidad Católica de Chile. Anuario de Cochilco, 2007.

21/07/2009
10
Chilean Copper Production1860-2006(Tons)
Source: Wagner, Gert and José Díaz. 2008. Inflación y Tipo de Cambio: Chile 1810-2005. Documento de Trabajo Nº 328, Departamento de Economía Pontificia Universidad Católica de Chile. Anuario de Cochilco, 2007.
Chilean Copper Production by SourceState-Owned and Private
(Thousand Tons)
Source: Anuario de Cochilco, 1995 y 2007.
0
1.000
2.000
3.000
4.000
5.000
6.000
1985
1986
1987
1988
1989
1990
1991
1992
1993
1994
1995
1996
1997
1998
1999
2000
2001
2002
2003
2004
2005
2006
2007
Private Production
Codelco
21/07/2009
11
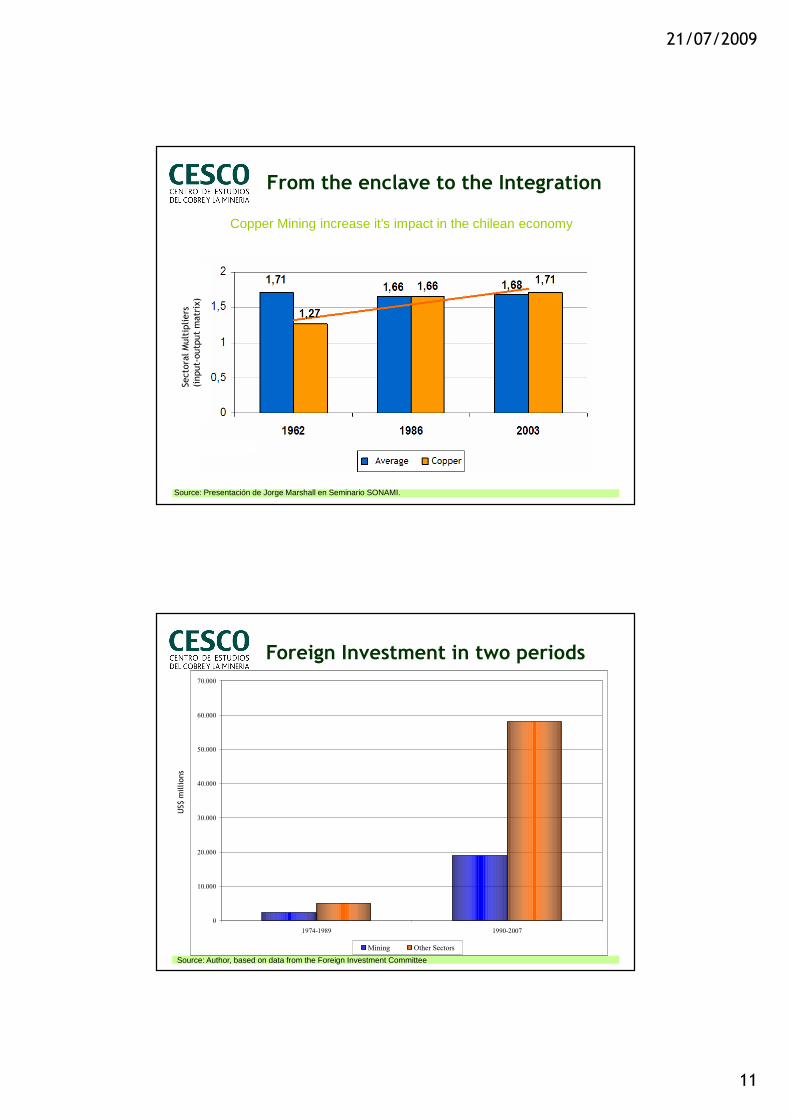
From the enclave to the Integration
Source: Presentación de Jorge Marshall en Seminario SONAMI.
Copper Mining increase it’s impact in the chilean economy
Sectoral Multipliers
(input-output matrix)
Source: Author, based on data from the Foreign Investment Committee
Foreign Investment in two periods
US$ m
illions
0
10.000
20.000
30.000
40.000
50.000
60.000
70.000
1974-1989 1990-2007
Mining Other Sectors

21/07/2009
12
Source: Superintendencia de AFP.
Salaries in Mining are high...
Annual Average of Taxable Income(USD december 2007)
Mining Regions Grow Fastest
Source: Presentación de Jorge Marshall: El Mercado del Cobre y la Economía Nacional. 7 de Agosto 2008.
GDP Growth between 1990-2006

21/07/2009
13
Average Labor Productivity by Sector(US$ of 2002)
Source: Sofofa, 2004.
Growth of GDP by Country Average
Source: International Monetary Fund
0,0 2,0 4,0 6,0 8,0 10,0 12,0
Japan
Hungary
Germany
France
Denmark
United Kingdom
Brazil
Portugal
Netherlands
United States
New Zealand
Spain
Mexico
Australia
Poland
Colombia
Croatia
Argentina
Indonesia
Luxembourg
Chile
Korea
India
Malaysia
Ireland
Singapore
China
1990-2007
21/07/2009
14
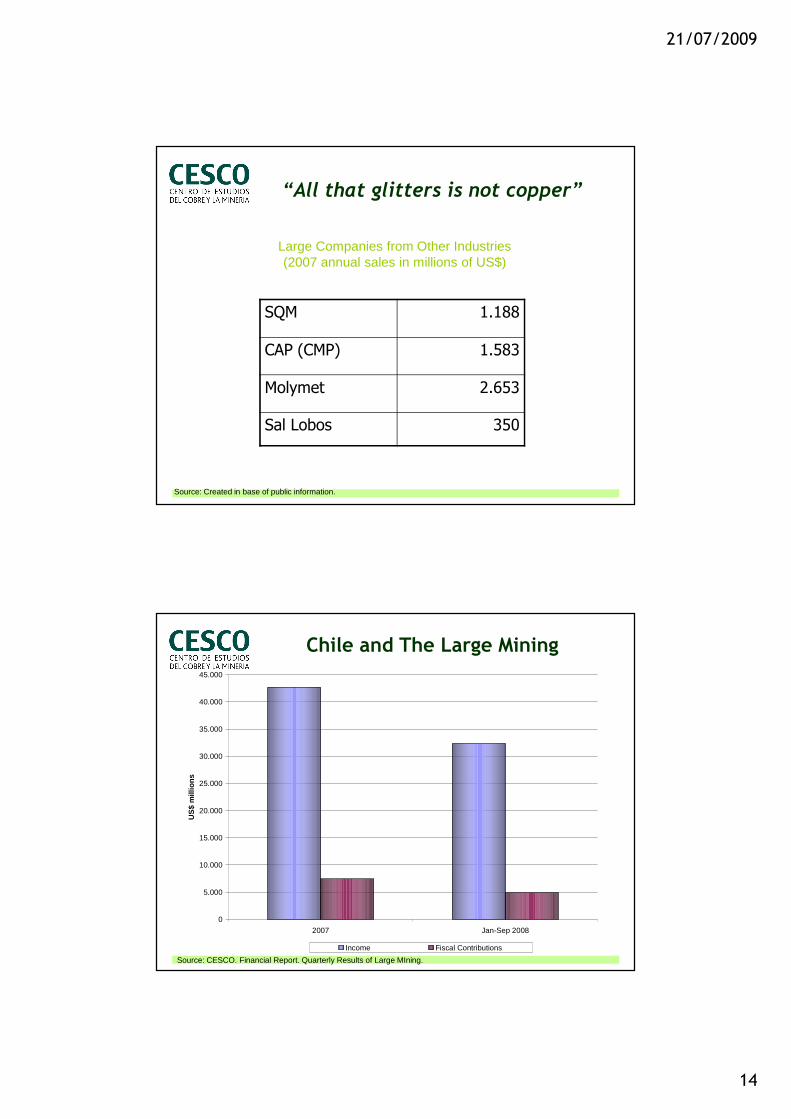
“All that glitters is not copper”
SQM 1.188
CAP (CMP) 1.583
Molymet 2.653
Sal Lobos 350
Source: Created in base of public information.
Large Companies from Other Industries(2007 annual sales in millions of US$)
Source: CESCO. Financial Report. Quarterly Results of Large MIning.
0
5.000
10.000
15.000
20.000
25.000
30.000
35.000
40.000
45.000
2007 Jan-Sep 2008
US
$ m
illio
ns
Income Fiscal Contributions
Chile and The Large Mining
21/07/2009
15
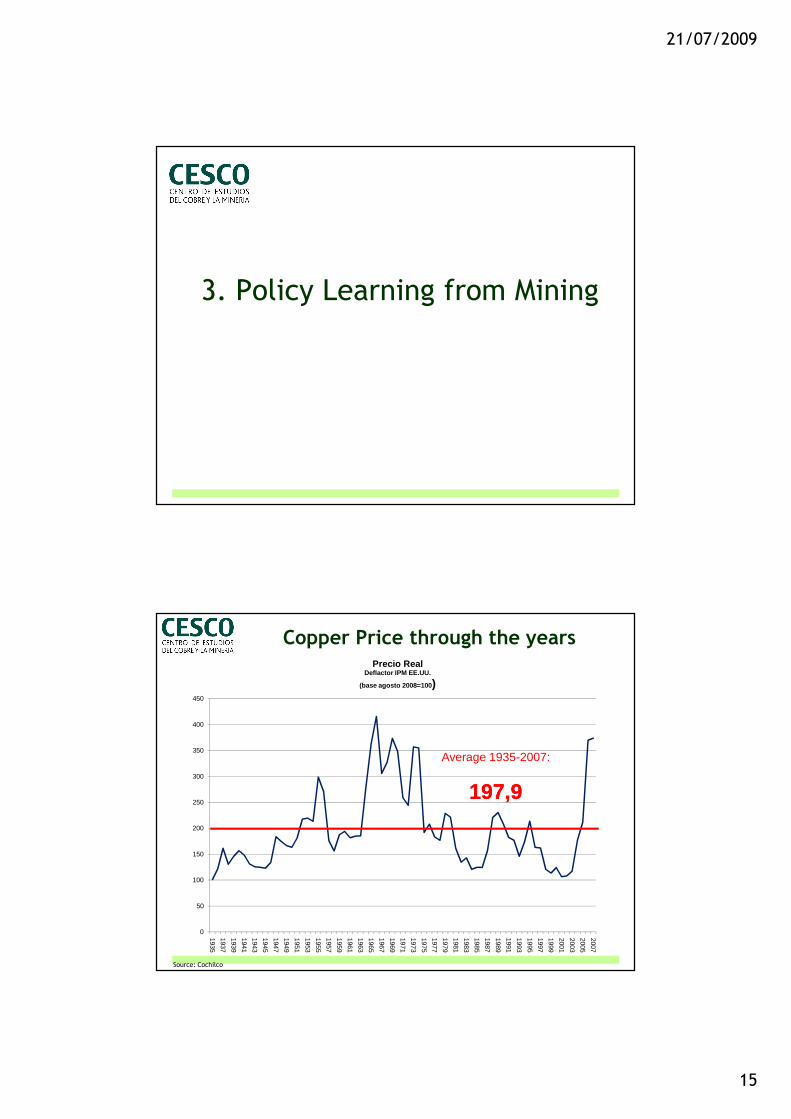
3. Policy Learning from Mining
Copper Price through the years
Source: Cochilco
0
50
100
150
200
250
300
350
400
450
1935
1937
1939
1941
1943
1945
1947
1949
1951
1953
1955
1957
1959
1961
1963
1965
1967
1969
1971
1973
1975
1977
1979
1981
1983
1985
1987
1989
1991
1993
1995
1997
1999
2001
2003
2005
2007
Precio RealDeflactor IPM EE.UU.
(base agosto 2008=100 )
Average 1935-2007:
197,9197,9
21/07/2009
16
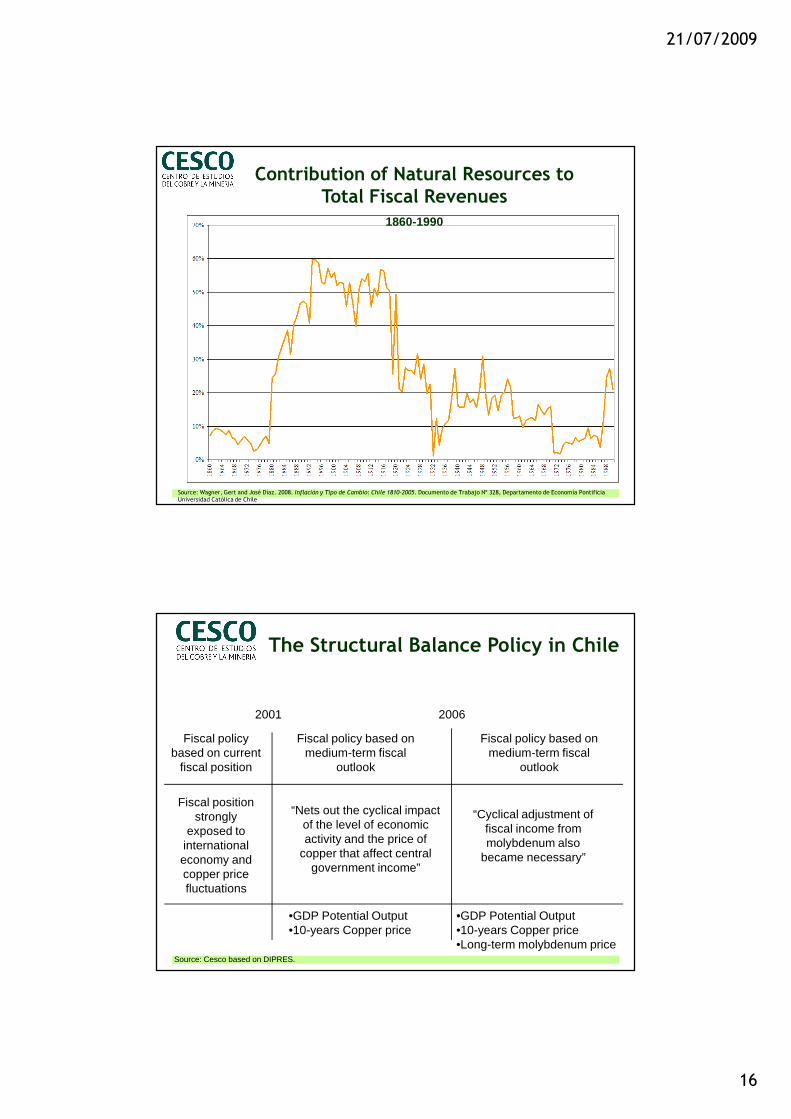
Source: Wagner, Gert and José Díaz. 2008. Inflación y Tipo de Cambio: Chile 1810-2005. Documento de Trabajo Nº 328, Departamento de Economía Pontificia Universidad Católica de Chile
Contribution of Natural Resources to Total Fiscal Revenues
1860-1990
The Structural Balance Policy in Chile
Source: Cesco based on DIPRES.
2001
Fiscal policy based on current
fiscal position
Fiscal policy based on medium-term fiscal
outlook
“Nets out the cyclical impact of the level of economic activity and the price of
copper that affect central government income”
2006
“Cyclical adjustment of fiscal income from molybdenum also
became necessary”
Fiscal position strongly
exposed to international economy and copper price fluctuations
Fiscal policy based on medium-term fiscal
outlook
•GDP Potential Output•10-years Copper price
•GDP Potential Output•10-years Copper price•Long-term molybdenum price
21/07/2009
17
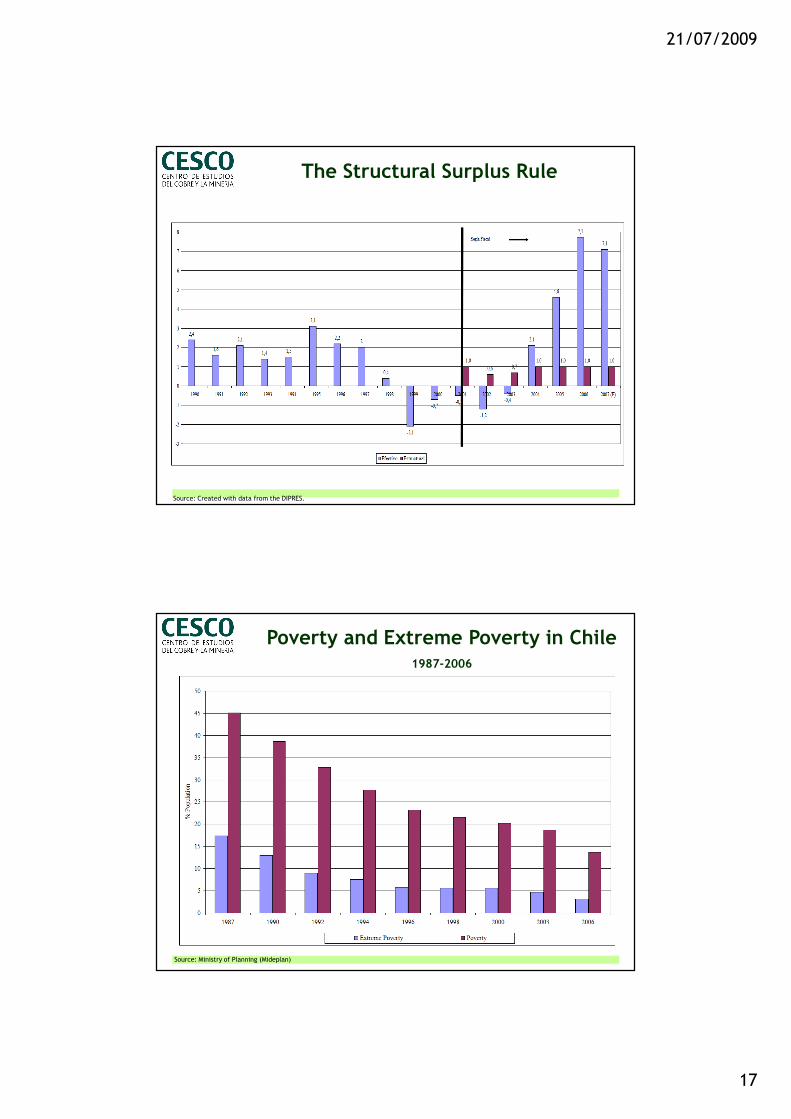
The Structural Surplus Rule
Source: Created with data from the DIPRES.
Poverty and Extreme Poverty in Chile1987-2006
Source: Ministry of Planning (Mideplan)
21/07/2009
18
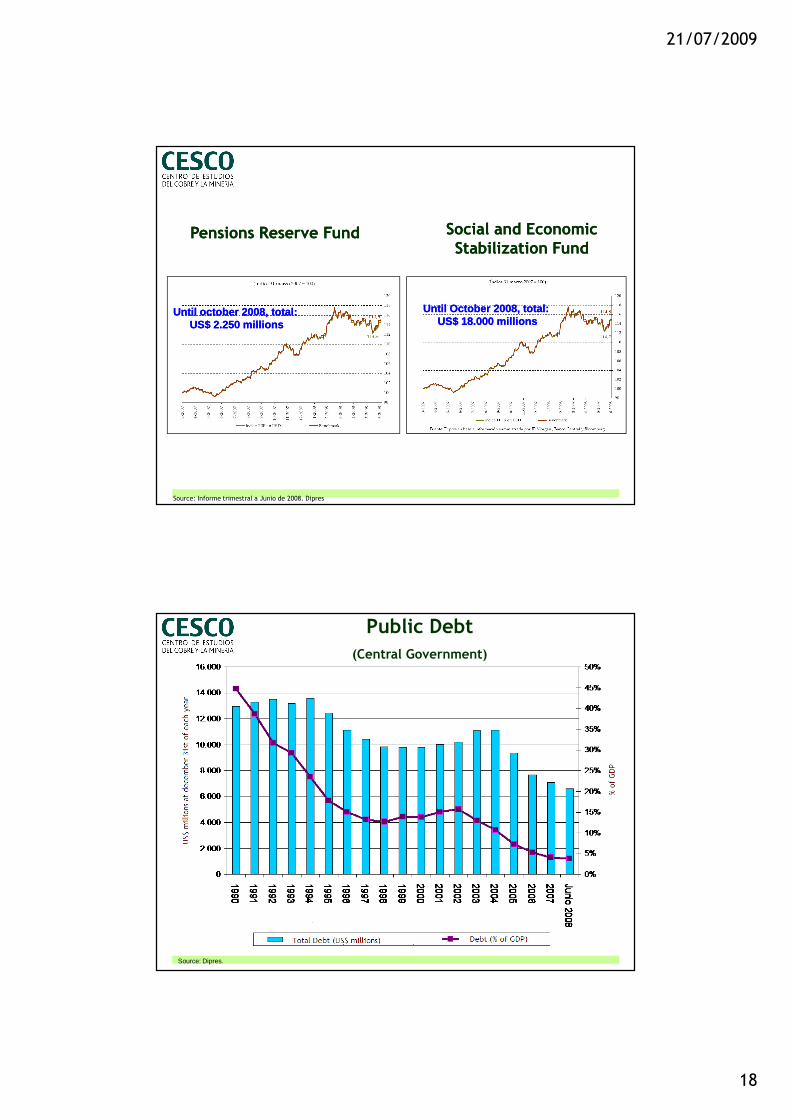
Source: Informe trimestral a Junio de 2008. Dipres
Pensions Reserve FundPensions Reserve Fund
Until october 2008, total:Until october 2008, total:US$ 2.250 millionsUS$ 2.250 millions
Social and Economic Social and Economic Stabilization Fund Stabilization Fund
Until October 2008, total:Until October 2008, total:US$ 18.000 millionsUS$ 18.000 millions
Public Debt(Central Government)
Source: Dipres.
21/07/2009
19
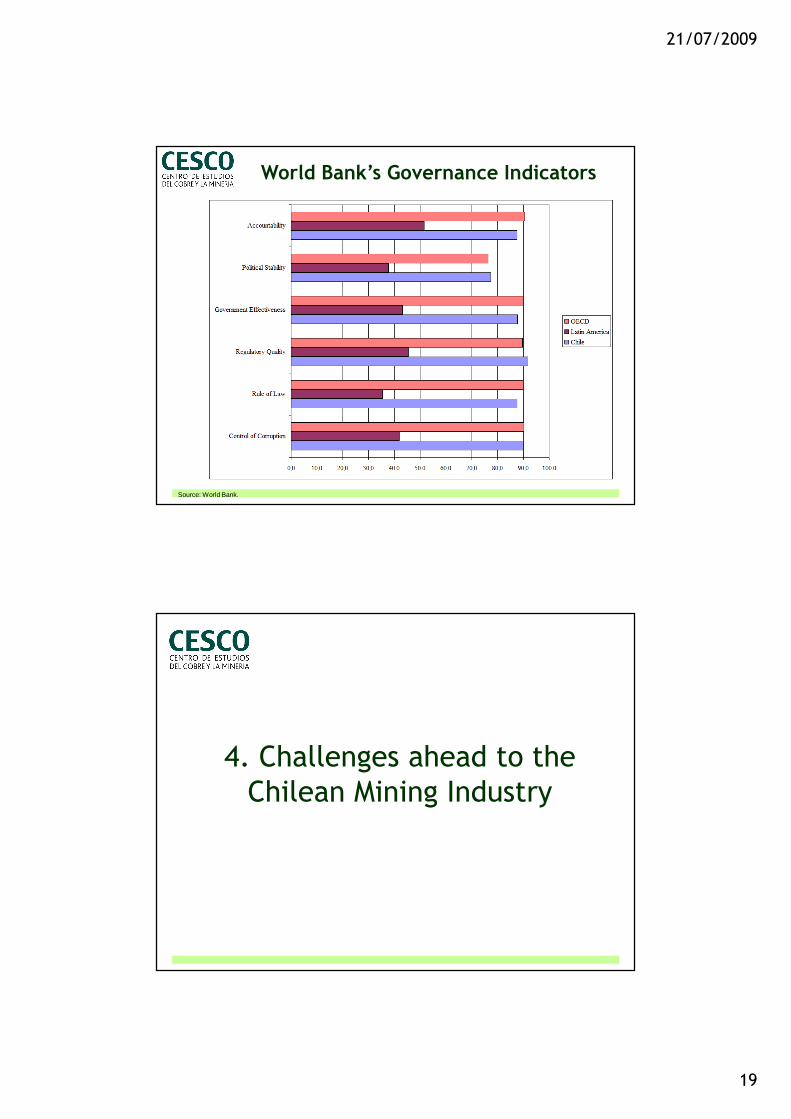
World Bank’s Governance Indicators
Source: World Bank.
4. Challenges ahead to the Chilean Mining Industry
21/07/2009
20
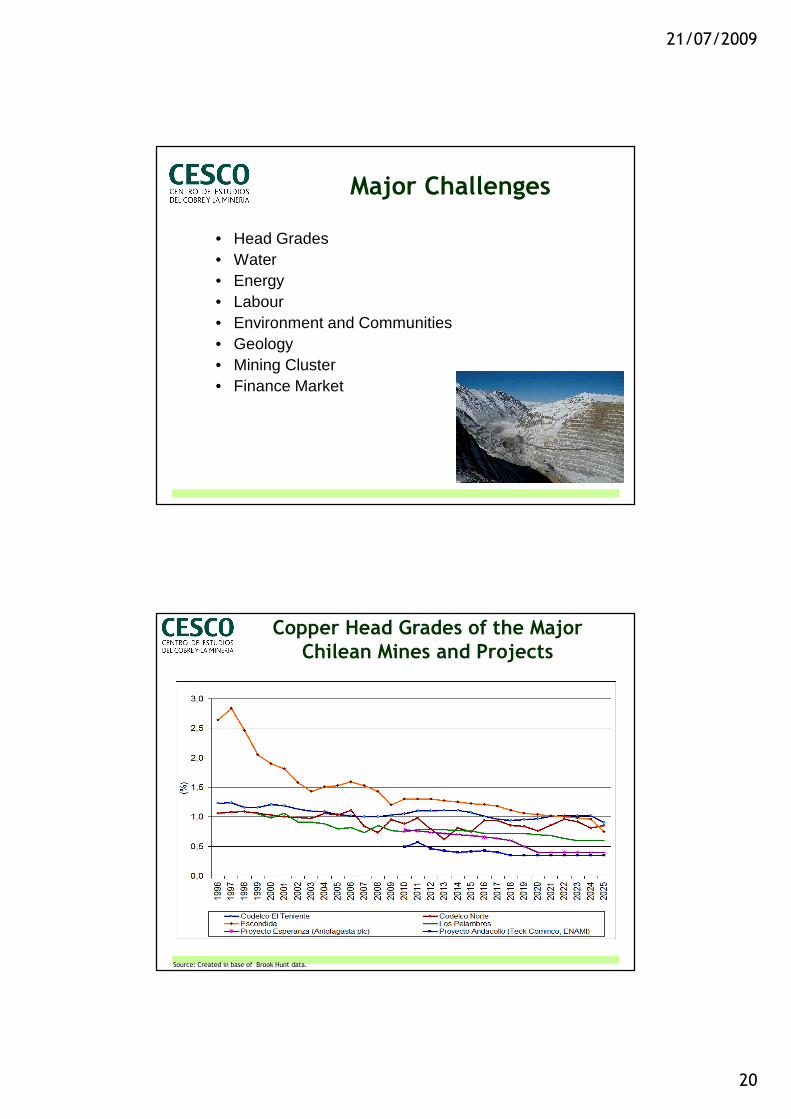
• Head Grades• Water• Energy• Labour• Environment and Communities• Geology• Mining Cluster• Finance Market
Major Challenges
Copper Head Grades of the Major Chilean Mines and Projects
Source: Created in base of Brook Hunt data.

21/07/2009
21
Water
• No existen recursos hídricos para sustentar las expansiones mineras
• Los derechos de agua se pagan hasta en 200 mil dólares el litro/segundo
• Existe falta de información sobre disponibilidad de recursos hídricos
• Perspectivas: plantas desaladoras de agua de mar, uso directo de agua de mar, incremento de técnicas de recuperación
Source: Created in base of Rodolfo Camacho (Datos promedios para año 2006) presentation.
Water Consumption in Mining vs. Water Consumption in Mining vs. Other sectors is low Other sectors is low (is concentrated in the north)
Water extraction by sector
Antofagasta and Country Total
21/07/2009
22
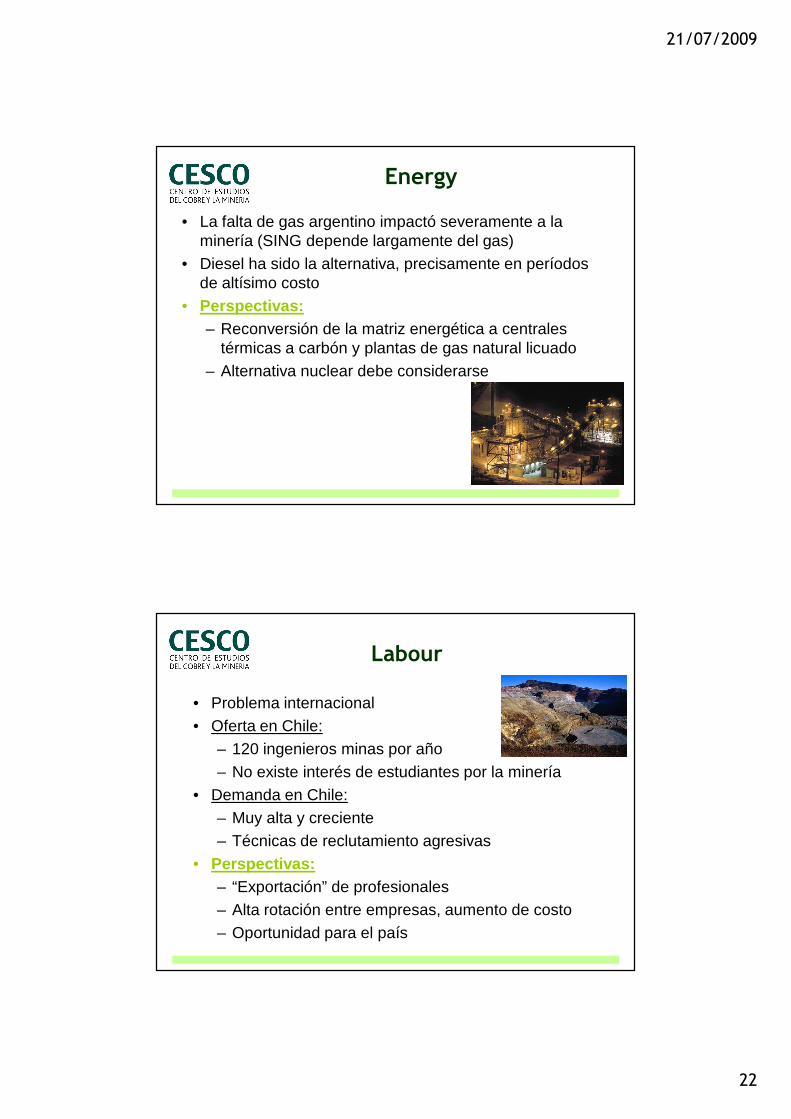
Energy
• La falta de gas argentino impactó severamente a la minería (SING depende largamente del gas)
• Diesel ha sido la alternativa, precisamente en períodos de altísimo costo
• Perspectivas:– Reconversión de la matriz energética a centrales
térmicas a carbón y plantas de gas natural licuado– Alternativa nuclear debe considerarse
• Problema internacional• Oferta en Chile:
– 120 ingenieros minas por año– No existe interés de estudiantes por la minería
• Demanda en Chile:– Muy alta y creciente– Técnicas de reclutamiento agresivas
• Perspectivas:– “Exportación” de profesionales– Alta rotación entre empresas, aumento de costo– Oportunidad para el país
Labour

21/07/2009
23
• Existe una mayor conciencia que se refleja en mayores demandas a la minería
• Permisos cada vez más complejos de obtener (retrasos)• Incertidumbre en aplicación de criterios
• Perspectivas: Expectativa por el establecimiento del Ministerio del Medio Ambiente
Environment and Communities
• La geología no es considerada como un activo estratégico nacional. Ejemplos:– Monitoreo vulcanológico– Investigación sísmica– Información geológica
• Perspectivas: Mejorar carta geológica, acceso online y compilación de información de exploración realizada en Chile
Geology
21/07/2009
24
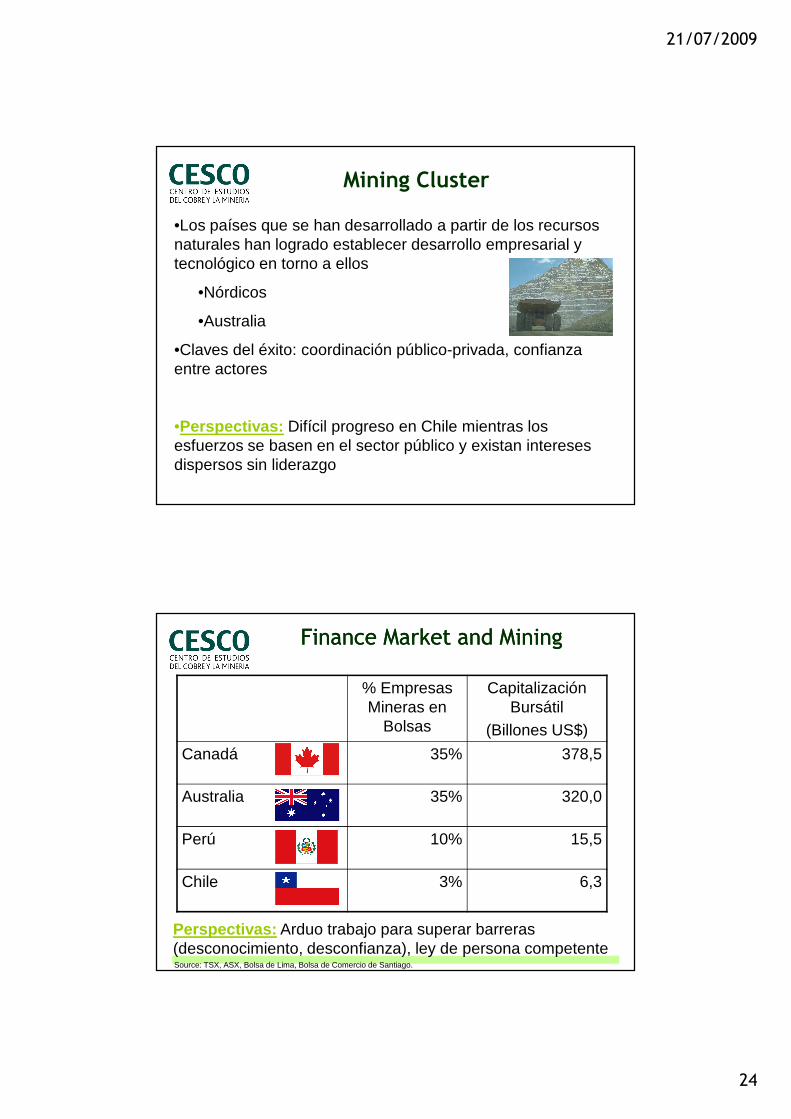
Mining Cluster
•Los países que se han desarrollado a partir de los recursos naturales han logrado establecer desarrollo empresarial y tecnológico en torno a ellos
•Nórdicos
•Australia
•Claves del éxito: coordinación público-privada, confianza entre actores
•Perspectivas: Difícil progreso en Chile mientras los esfuerzos se basen en el sector público y existan intereses dispersos sin liderazgo
Finance Market and MiningFinance Market and Mining
% Empresas Mineras en
Bolsas
Capitalización Bursátil
(Billones US$)
Canadá 35% 378,5
Australia 35% 320,0
Perú 10% 15,5
Chile 3% 6,3
Source: TSX, ASX, Bolsa de Lima, Bolsa de Comercio de Santiago.
Perspectivas: Arduo trabajo para superar barreras (desconocimiento, desconfianza), ley de persona competente
21/07/2009
25
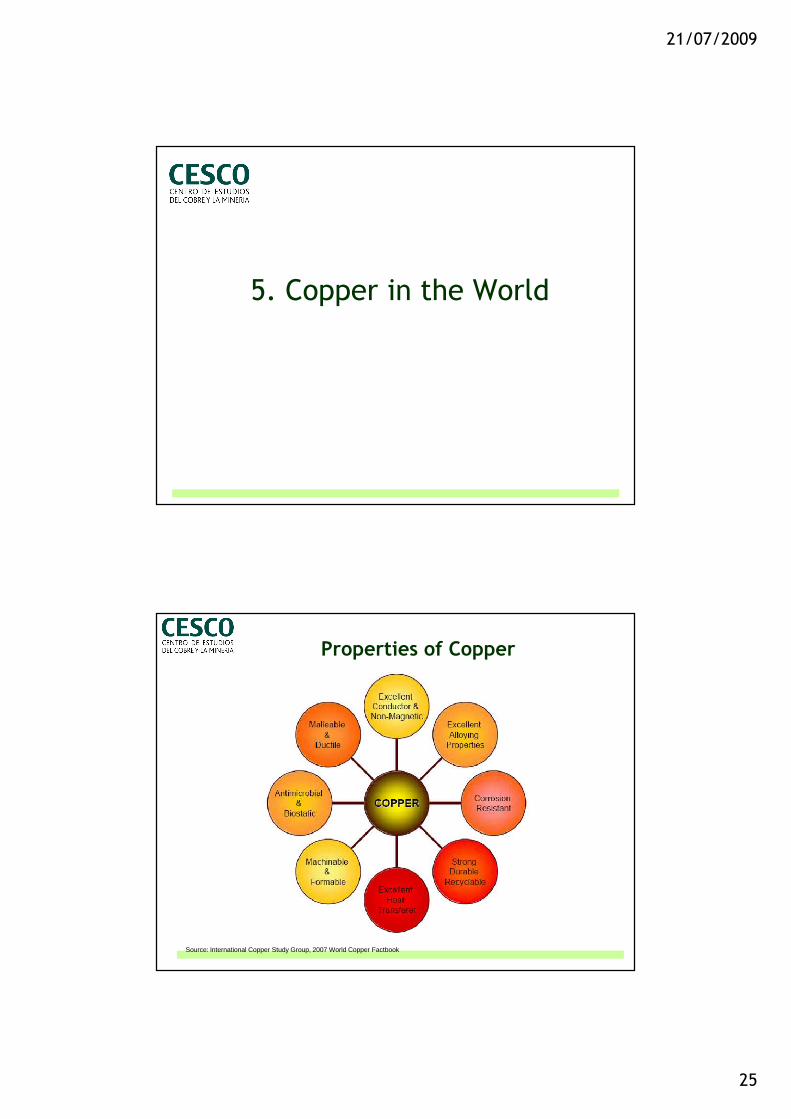
5. Copper in the World
Source: International Copper Study Group, 2007 World Copper Factbook
Properties of Copper
21/07/2009
26
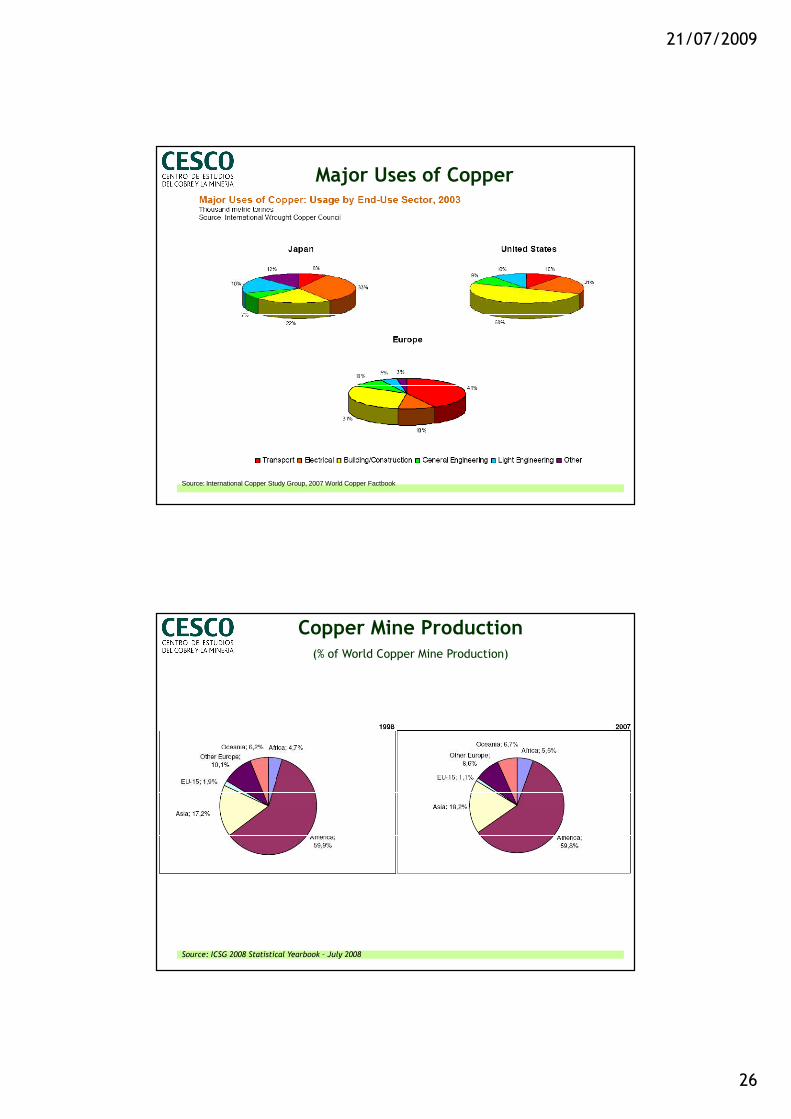
Source: International Copper Study Group, 2007 World Copper Factbook
Major Uses of Copper
Source: ICSG 2008 Statistical Yearbook – July 2008
Copper Mine Production(% of World Copper Mine Production)
21/07/2009
27
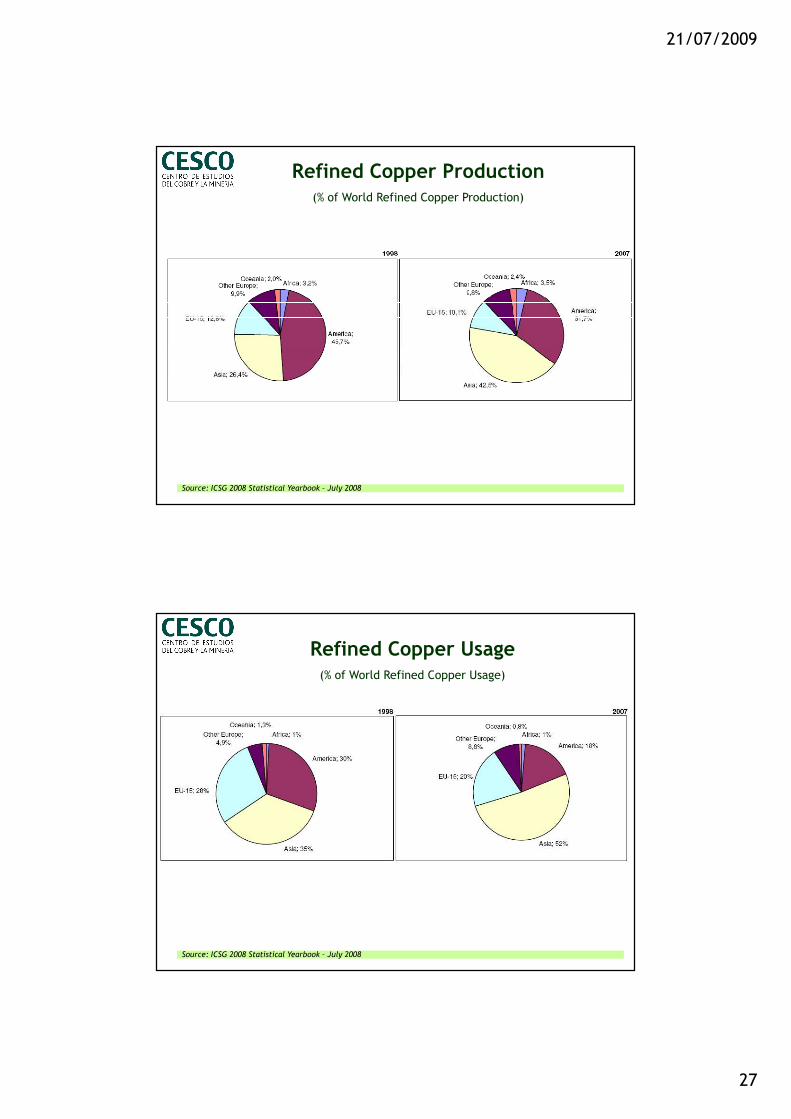
Source: ICSG 2008 Statistical Yearbook – July 2008
Refined Copper Production(% of World Refined Copper Production)
Source: ICSG 2008 Statistical Yearbook – July 2008
Refined Copper Usage(% of World Refined Copper Usage)
21/07/2009
28
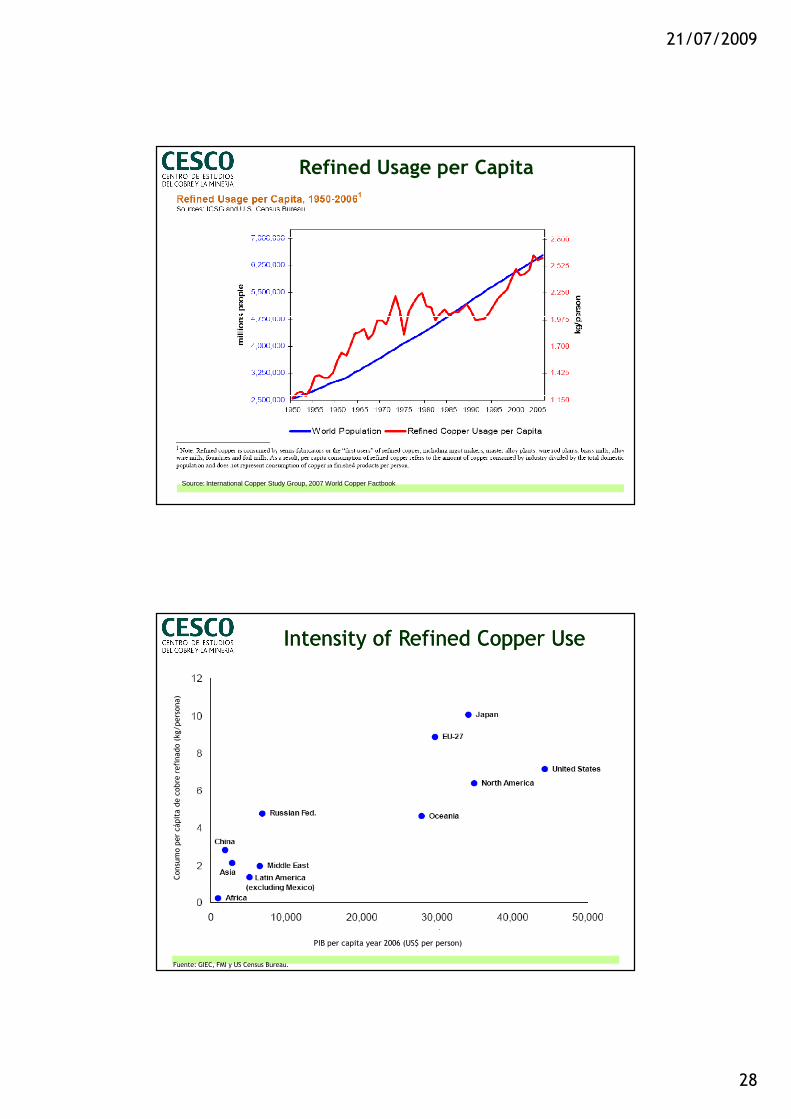
Source: International Copper Study Group, 2007 World Copper Factbook
Refined Usage per Capita
Intensity of Refined Copper UseIntensity of Refined Copper Use
Fuente: GIEC, FMI y US Census Bureau.
Consumo per cápita de cobre refinado (kg/persona)
PIB per capita year 2006 (US$ per person)
21/07/2009
29
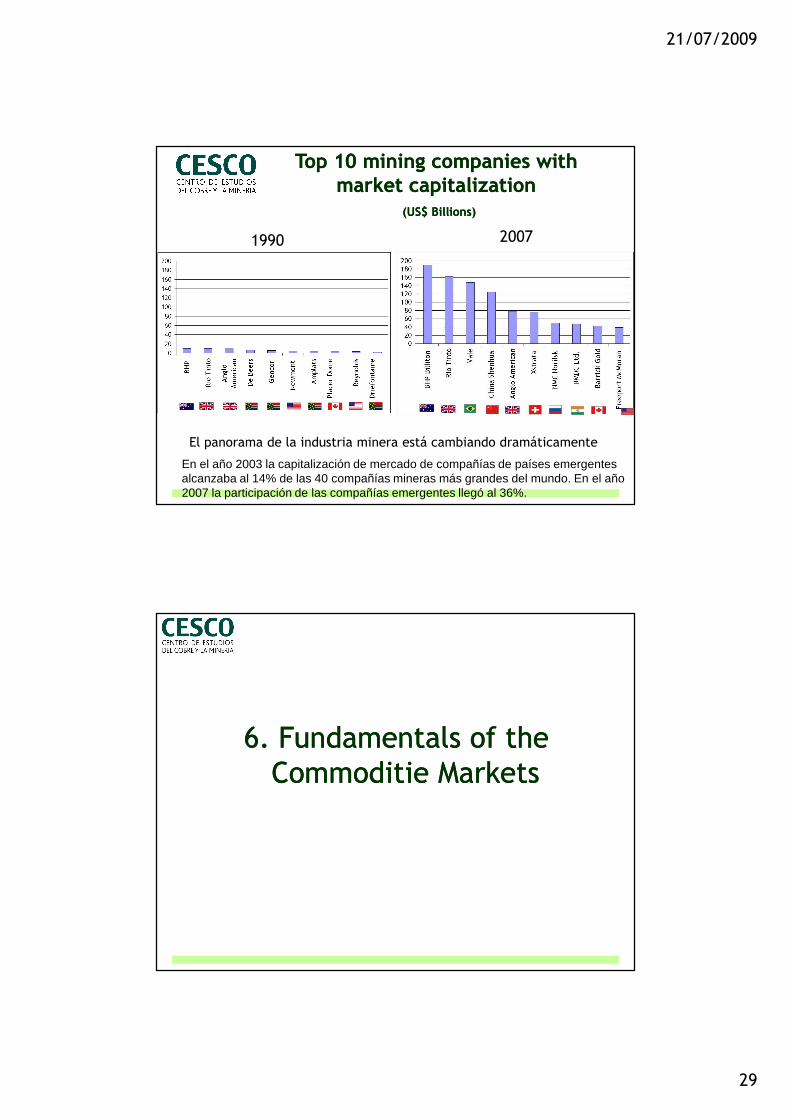
El panorama de la industria minera está cambiando dramáticamente
Top 10 mining companies with Top 10 mining companies with market capitalizationmarket capitalization
(US$ Billions)(US$ Billions)
1990 2007
En el año 2003 la capitalización de mercado de compañías de países emergentes alcanzaba al 14% de las 40 compañías mineras más grandes del mundo. En el año 2007 la participación de las compañías emergentes llegó al 36%.
6. Fundamentals of the 6. Fundamentals of the Commoditie MarketsCommoditie Markets
21/07/2009
30
There are three basic drivers of the collapse in co mmodity prices…
� The classic macro-economic cycle based on a downturn in cyclically sensitive sectors (construction, consumer durables) in the developed industrial world
� looks more like the more severe 1974/75 and 1980/82 cycles than the shallower 1990/91 or 2001/02 cycles
� note – the downturn caused the financial crisis, not vice versa
� Deliberate policy actions by the Chinese government to curb unsustainably rapid growth
� probably temporary; although structurally slower growth is not far off
� Withdrawal of commodity fund liquidity from the market
1www.crugroup.com
Source: CRU Strategies
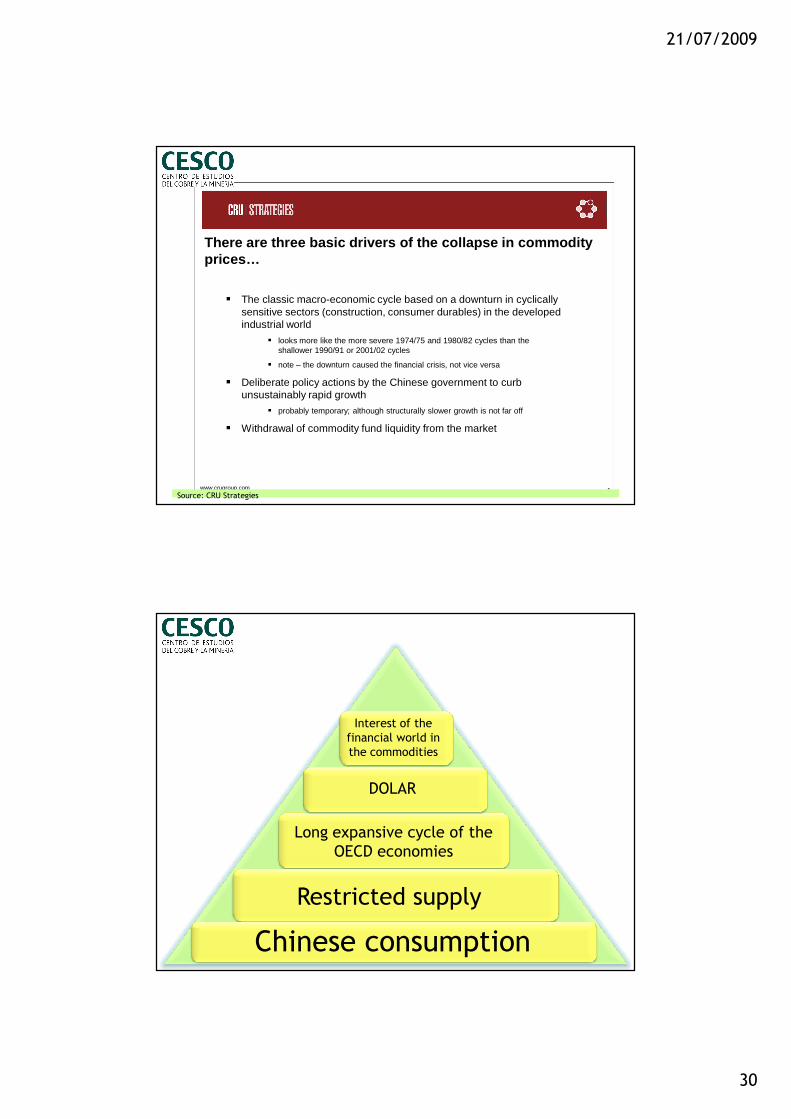
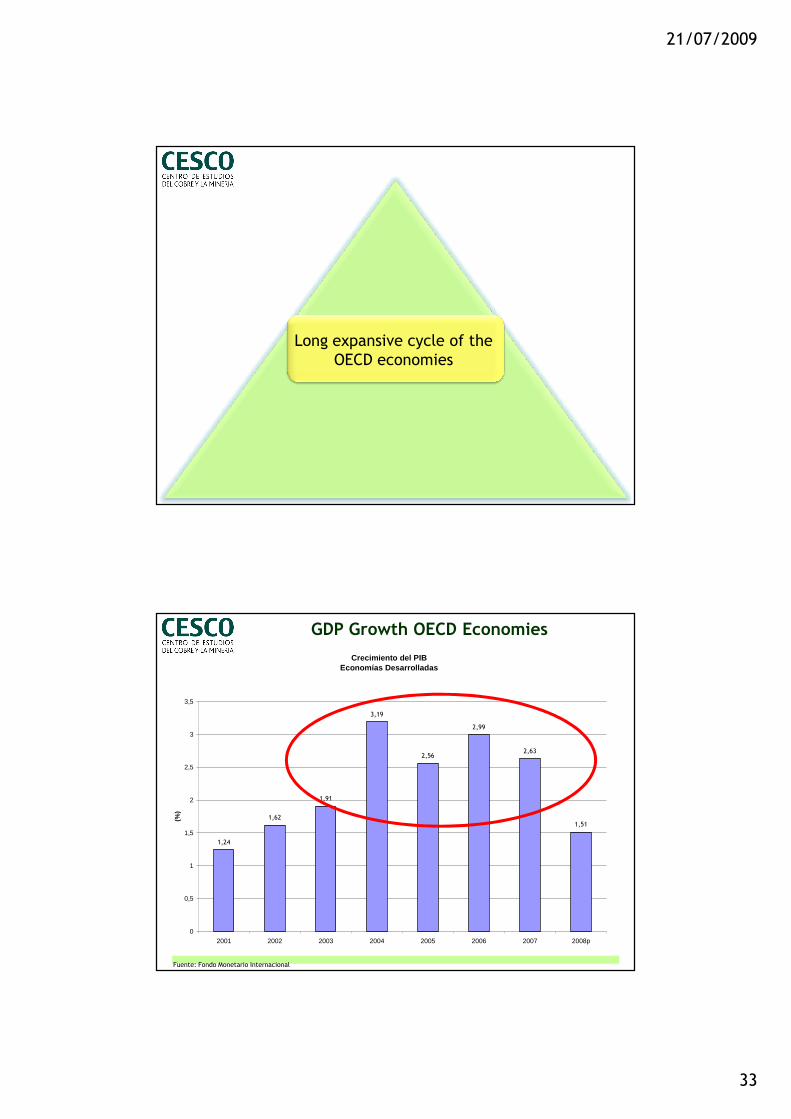
Long expansive cycle of the OECD economies
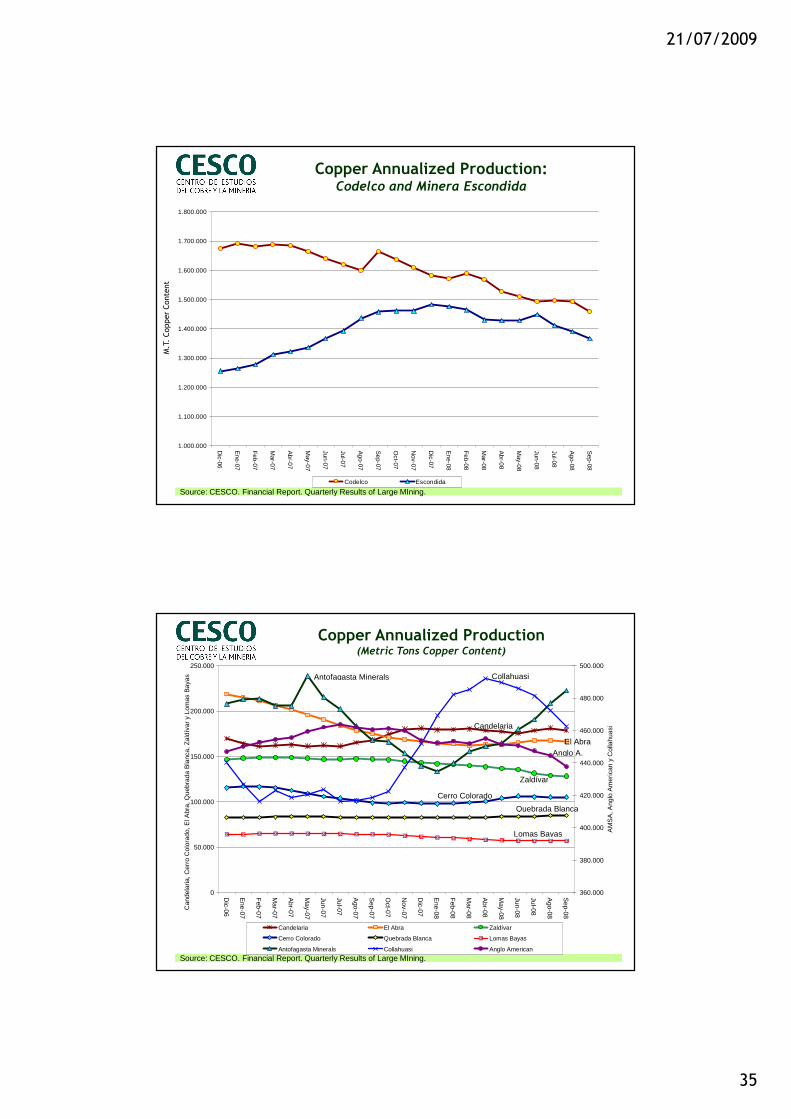
Restricted supply
Chinese consumption
DOLAR
Interest of the financial world in the commodities

21/07/2009
31
Interest of the financial world in the commodities
Copper Stock LME Monthly
0
100.000
200.000
300.000
400.000
500.000
600.000
700.000
800.000
900.000
Ene-03
Abr-03
Jul-03
Oct-03
Ene-04
Abr-04
Jul-04
Oct-04
Ene-05
Abr-05
Jul-05
Oct-05
Ene-06
Abr-06
Jul-06
Oct-06
Ene-07
Abr-07
Jul-07
Oct-07
Ene-08
Abr-08
Jul-08
Oct-08
Met
ric T
onne
s
The financial enthusiasm accelerated the
price rise… but it did not cause it.
Source: Comisión Chilena del Cobre

21/07/2009
32
DOLAR
Fuente: Commodity Outlook for 2009, 04 December 2008. Standard Chartered
2008 Second Half: Rebound in US Dolar
(USD Trade Weighted Index)
21/07/2009
33
Long expansive cycle of the OECD economies
GDP Growth OECD Economies
Fuente: Fondo Monetario Internacional
Crecimiento del PIB Economías Desarrolladas
1,24
1,62
1,91
3,19
2,56
2,99
2,63
1,51
0
0,5
1
1,5
2
2,5
3
3,5
2001 2002 2003 2004 2005 2006 2007 2008p
(%)

21/07/2009
34
Restricted supply
Producción Mundial de Cobre
Fuente: En base a datos del GIEC
Var 2007-2002:
14%
21/07/2009
35
Copper Annualized Production:Codelco and Minera Escondida
Source: CESCO. Financial Report. Quarterly Results of Large MIning.
1.000.000
1.100.000
1.200.000
1.300.000
1.400.000
1.500.000
1.600.000
1.700.000
1.800.000
Dic-06
Ene-07
Feb-07
Mar-07
Abr-07
May-07
Jun-07
Jul-07
Ago-07
Sep-07
Oct-07
Nov-07
Dic-07
Ene-08
Feb-08
Mar-08
Abr-08
May-08
Jun-08
Jul-08
Ago-08
Sep-08
Codelco Escondida
M.T. Copper Content
Copper Annualized Production(Metric Tons Copper Content)
Source: CESCO. Financial Report. Quarterly Results of Large MIning.
Candelaria
El Abra
Collahuasi
0
50.000
100.000
150.000
200.000
250.000
Dic-06
Ene-07
Feb-07
Mar-07
Abr-07
May-07
Jun-07
Jul-07
Ago-07
Sep-07
Oct-07
Nov-07
Dic-07
Ene-08
Feb-08
Mar-08
Abr-08
May-08
Jun-08
Jul-08
Ago-08
Sep-08
Can
dela
ria, C
erro
Col
orad
o, E
l Abr
a, Q
uebr
ada
Bla
nca,
Zal
díva
r y
Lom
as B
ayas
360.000
380.000
400.000
420.000
440.000
460.000
480.000
500.000
AM
SA
, Ang
lo A
mer
ican
y C
olla
huas
i
Candelaria El Abra Zaldívar
Cerro Colorado Quebrada Blanca Lomas Bayas
Antofagasta Minerals Collahuasi Anglo American
Anglo A.
Zaldívar
Cerro Colorado
Quebrada Blanca
Lomas Bayas
Antofagasta Minerals
21/07/2009
36
Chinese consumption
Chinese position is KEY Chinese position is KEY in the commodities in the commodities
marketmarket

21/07/2009
37
China Consumption of Commodities(Yearly)
Fuente: Presentación de Leonardo Suaréz “Monedas y precio del cobre: ¿punto de inflexión?”. LarraínVial.
Fuente: Macquarie en base a Standard Chartered, 2008.
Consumo
Inversión Exportaciones netas
Gasto del Gobierno
Contribution to the Growth of the GDP of China

21/07/2009
38
China and the annual consumption of copper
Fuente: En base a datos de International Copper Study Group (ICSG)
Consumo de Cobre de China
0
1.000
2.000
3.000
4.000
5.000
6.000
1960
1962
1964
1966
1968
1970
1972
1974
1976
1978
1980
1982
1984
1986
1988
1990
1992
1994
1996
1998
2000
2002
2004
2006
2008m
iles
de to
nela
das
1997: Crisis Asiática
1973: Crisis del Petróleo
2007: Crisis Subprime2008: Crisis Financiera
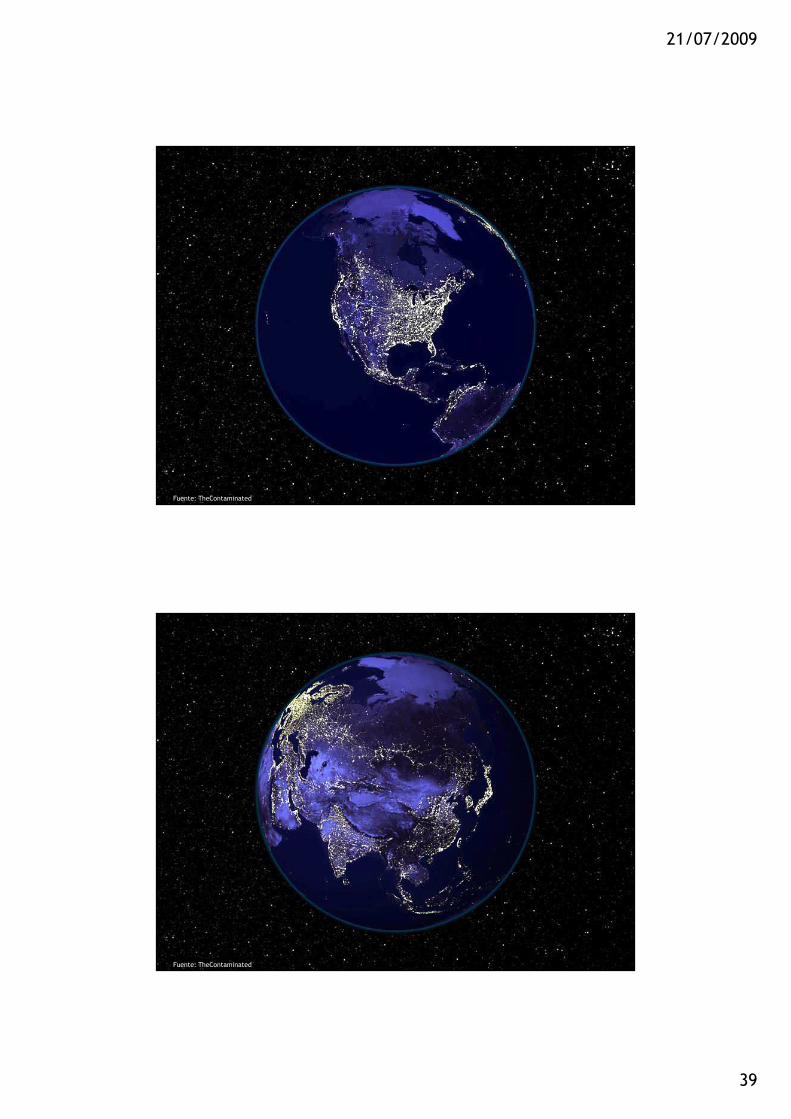
8. Commodities AGE
21/07/2009
39
Fuente: TheContaminated
Fuente: TheContaminated
21/07/2009
40
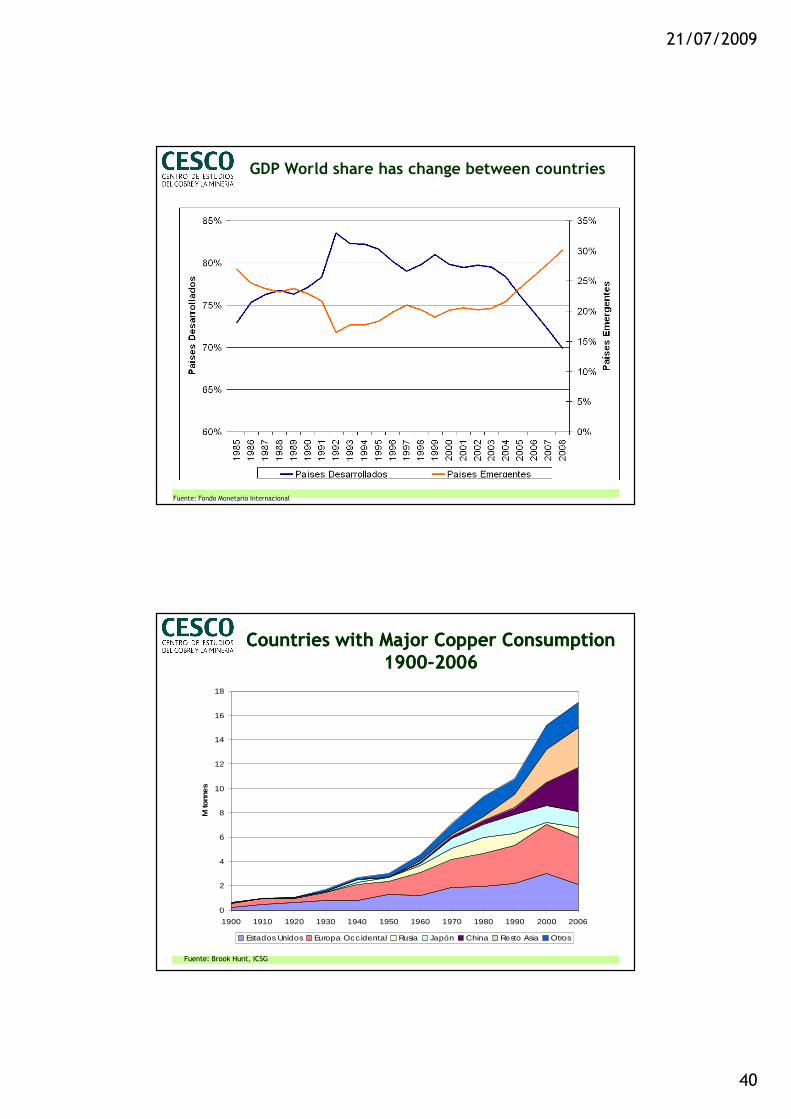
GDP World share has change between countries
Fuente: Fondo Monetario Internacional
Countries with Major Copper Consumption Countries with Major Copper Consumption 19001900--20062006
Fuente: Brook Hunt, ICSG
0
2
4
6
8
10
12
14
16
18
1900 1910 1920 1930 1940 1950 1960 1970 1980 1990 2000 2006
M to
nnes
Estados Unidos Europa Occ idental Rusia Japón China Resto Asia Otros
21/07/2009
41
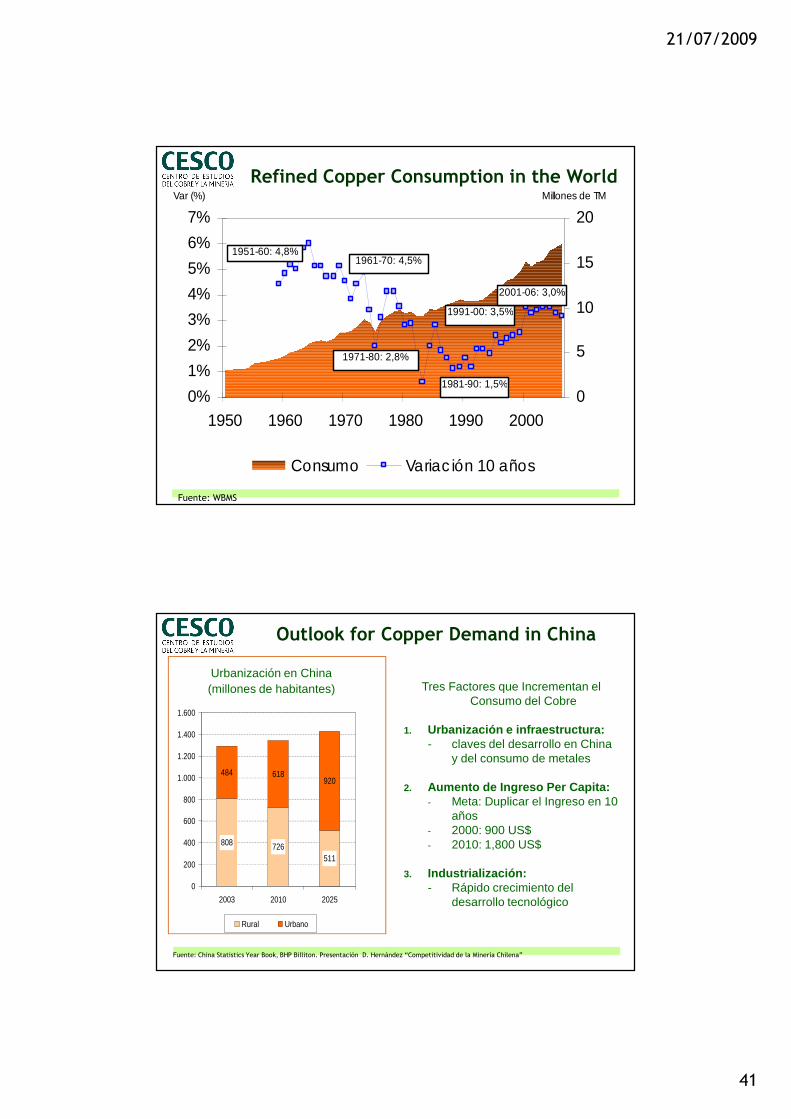
Refined Copper Consumption in the World
0%
1%
2%
3%
4%
5%
6%
7%
1950 1960 1970 1980 1990 2000
0
5
10
15
20
Consumo Variac ión 10 años
Millones de TMVar (%)
1951-60: 4,8%1961-70: 4,5%
1971-80: 2,8%
1981-90: 1,5%
1991-00: 3,5%
2001-06: 3,0%
Fuente: WBMS
808 726511
484 618920
0
200
400
600
800
1.000
1.200
1.400
1.600
2003 2010 2025
Rural Urbano
Urbanización en China(millones de habitantes) Tres Factores que Incrementan el
Consumo del Cobre
1. Urbanización e infraestructura:- claves del desarrollo en China
y del consumo de metales
2. Aumento de Ingreso Per Capita:- Meta: Duplicar el Ingreso en 10
años- 2000: 900 US$ - 2010: 1,800 US$
3. Industrialización:- Rápido crecimiento del
desarrollo tecnológico
Outlook for Copper Demand in China
Fuente: China Statistics Year Book, BHP Billiton. Presentación D. Hernández “Competitividad de la Minería Chilena”
21/07/2009
42
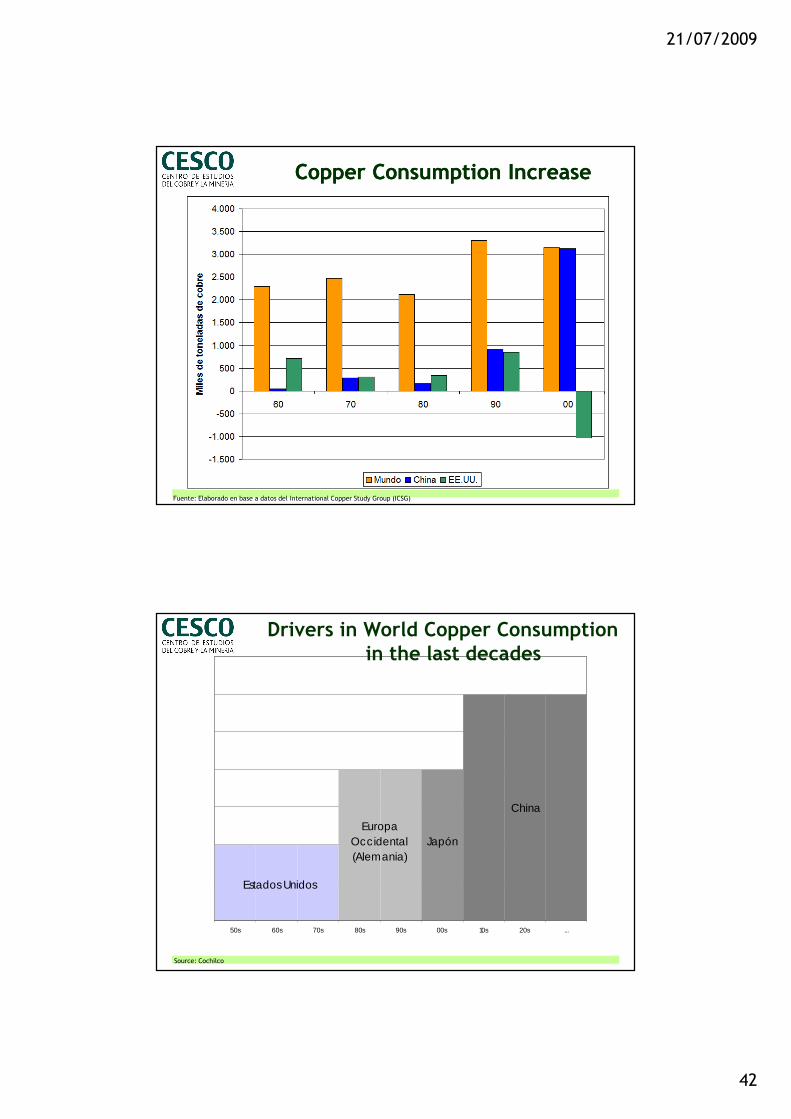
Copper Consumption IncreaseCopper Consumption Increase
Fuente: Elaborado en base a datos del International Copper Study Group (ICSG)
50s 60s 70s 80s 90s 00s 10s 20s ...
Estados Unidos
Europa Occidental (Alemania)
Japón
China
Drivers in World Copper Consumption in the last decades
Source: Cochilco

21/07/2009
43
What is Happening What is Happening in China?in China?
Source: Banco Central de Chile, Reuters, FED.
External Rates
0
1
2
3
4
5
6
7
8
01-0
6-06
01-0
7-06
01-0
8-06
01-0
9-06
01-1
0-06
01-1
1-06
01-1
2-06
01-0
1-07
01-0
2-07
01-0
3-07
01-0
4-07
01-0
5-07
01-0
6-07
01-0
7-07
01-0
8-07
01-0
9-07
01-1
0-07
01-1
1-07
01-1
2-07
01-0
1-08
01-0
2-08
01-0
3-08
01-0
4-08
01-0
5-08
01-0
6-08
01-0
7-08
01-0
8-08
01-0
9-08
01-1
0-08
01-1
1-08
(%)
0
2
4
6
8
10
12
14
16
18
20
Libor USD 180 days (daily) One year banks loans
Fed funds rate Reserve requirement rate (second axis)
21/07/2009
44
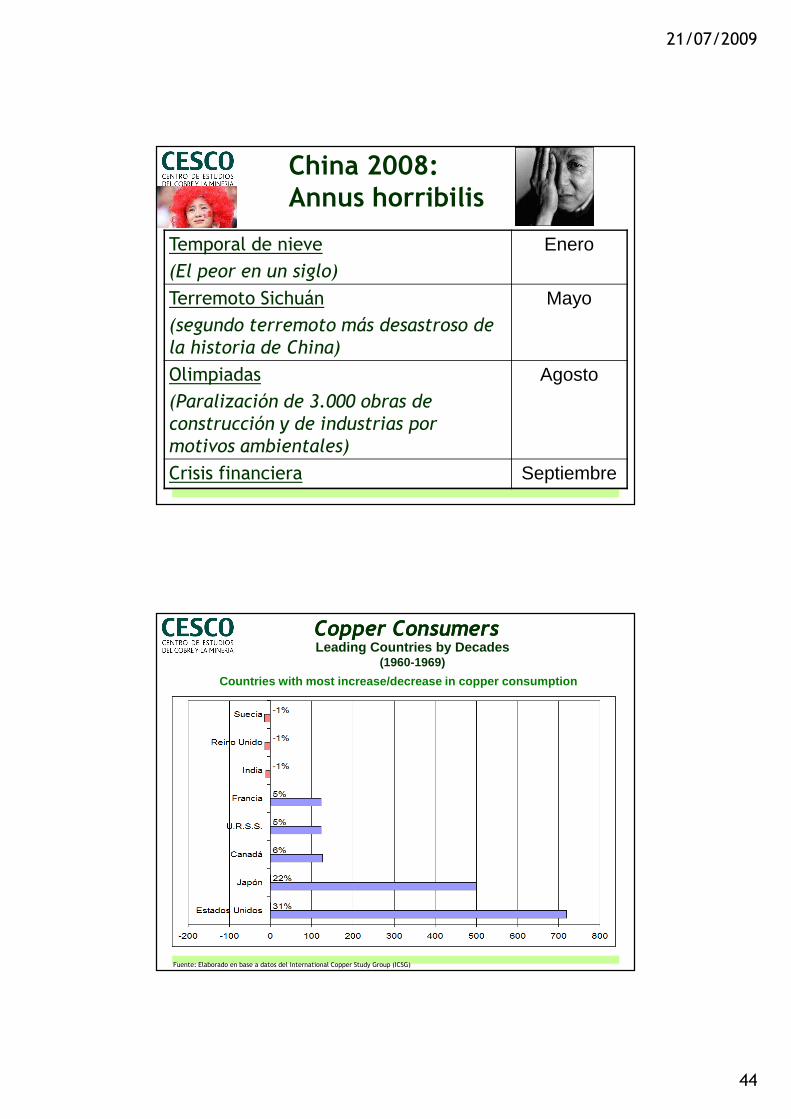
Temporal de nieve
(El peor en un siglo)
Enero
Terremoto Sichuán
(segundo terremoto más desastroso de la historia de China)
Mayo
Olimpiadas
(Paralización de 3.000 obras de construcción y de industrias por motivos ambientales)
Agosto
Crisis financiera Septiembre
China 2008: Annus horribilis
Fuente: Elaborado en base a datos del International Copper Study Group (ICSG)
Copper ConsumersCopper ConsumersLeading Countries by Decades
(1960-1969)
Countries with most increase/decrease in copper con sumption
21/07/2009
45
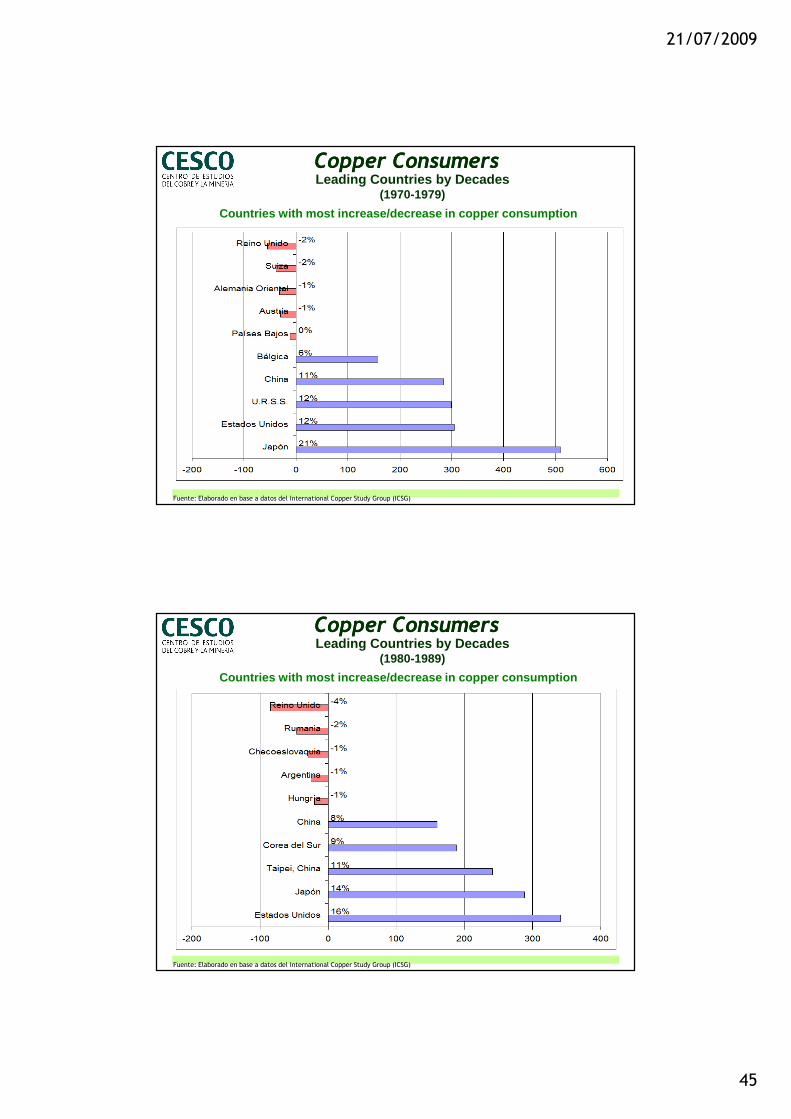
Fuente: Elaborado en base a datos del International Copper Study Group (ICSG)
Copper ConsumersCopper ConsumersLeading Countries by Decades
(1970-1979)
Countries with most increase/decrease in copper con sumption
Fuente: Elaborado en base a datos del International Copper Study Group (ICSG)
Copper ConsumersCopper ConsumersLeading Countries by Decades
(1980-1989)
Countries with most increase/decrease in copper con sumption
21/07/2009
46
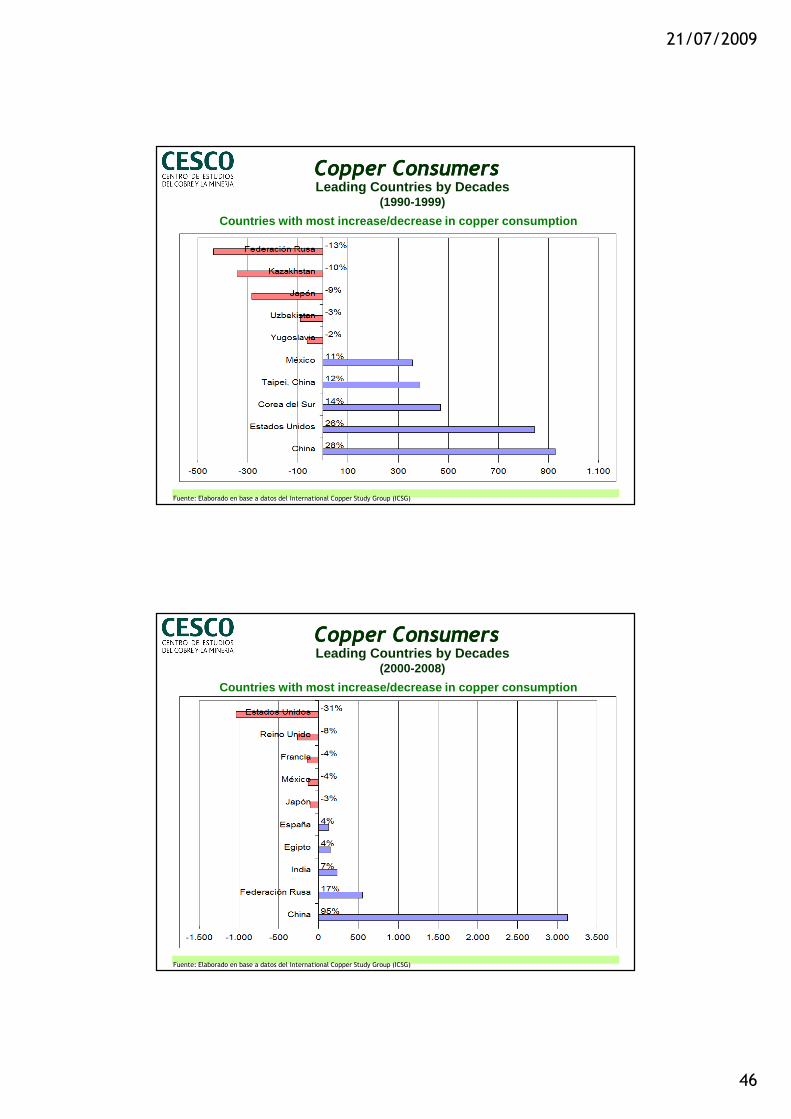
Fuente: Elaborado en base a datos del International Copper Study Group (ICSG)
Copper ConsumersCopper ConsumersLeading Countries by Decades
(1990-1999)
Countries with most increase/decrease in copper con sumption
Fuente: Elaborado en base a datos del International Copper Study Group (ICSG)
Copper ConsumersCopper ConsumersLeading Countries by Decades
(2000-2008)
Countries with most increase/decrease in copper con sumption

21/07/2009
47
Fuente: Elaborado en base a datos del International Copper Study Group (ICSG)
Copper ConsumersCopper ConsumersLeading Countries by Decades
(1960-2008)
Countries with most increase/decrease in copper con sumption
China has dominated the world metals growthChina has dominated the world metals growth2000-2007
60,0%60,0%
95,0% 87,0%
79,0%
0%
10%
20%
30%
40%
50%
60%
70%
80%
90%
100%
Acero Aluminio Cobre Zinc Niquel
% total de crecimiento
China Resto del mundo
Source: “Situaciones y Perspectivas de la Minería en Chile”. Presentación de Alvaro Merino Lacoste en “Encuentro Empresarial CORFO”. 10 Diciembre 2008.
21/07/2009
48
Mining Industry in Chile
Juan Carlos Guajardo B.
Executive Director
Friday 9th January 2009
Center for Copper and Mining Studies


![Mining Cluster in Chile[1]](https://img.pdfslide.net/doc/110x75/577cdc371a28ab9e78aa2449/mining-cluster-in-chile1.jpg)