Embed Size (px)
Citation preview

Mining Monitor (March 2018)
Strategic Research Division
12 March 2018
The Bank of Tokyo-Mitsubishi UFJ, Ltd.
MUFG Union Bank, N.A.
Table of Contents
1. Overview 3
2. Iron Ore 5
3. Coal 8
4. Copper 11
5. Aluminum 14
Mining Monitor | 12 March 2018 2
6. Nickel 17
7. Zinc 20
8. Gold 23
Appendix 26

1. Overview
Mining Monitor | 12 March 2018 3
Ryosuke Ohno
Strategic Research Division
THE BANK OF TOKYO-MITSUBISHI UFJ, LTD.

Mining Monitor | 12 March 2018 4
Mined Commodity Price Trends
In February 2018, trends in mined commodity prices relatively stabilized.
1. Overview
Mined Commodity Price Trends
On the whole, trends in mined commodity
prices relatively stabilized in February
2018.
Iron ore price rallied as the steel
production cuts in China is favoring the
use of more efficient quality grade one.
Average coking coal price fell, however,
strong buying interests from China led a
spot price recovery late in February.
Thermal coal price fell as tight supply in
China has eased after the rail transport
for coal has resumed to normal.
Aluminum price declined mainly by a
sharp build-up in aluminum inventories
due to increased Chinese exports.
Nickel price continued to rise, driven by
near-term supply reduction and longer-
term expectations of increased demand.
Average zinc price rose, however, the
price declined in late-February due to
concerns about rising supply in China.
Copper and gold prices were volatile as
these tracked the US dollar, however, the
average prices stabilized.
2017
Yr Avr Jul Aug Sep Oct Nov Dec Jan Feb
Iron Ore ($/t) 71 65 77 73 62 63 69 73 75
MoM - 17% 19% -6% -15% 2% 10% 6% 2%
YoY 22% 14% 27% 27% 5% -14% -14% -9% -16%
Coking Coal ($/t) 189 166 197 205 182 190 239 240 229
MoM - 13% 19% 4% -11% 5% 26% 0% -4%
YoY 33% 74% 73% 8% -22% -37% -10% 30% 42%
Thermal Coal ($/t) 88 84 95 96 97 95 99 105 103
MoM - 6% 13% 2% 1% -2% 4% 6% -3%
YoY 34% 33% 41% 33% 6% -2% 17% 26% 26%
Copper ($/t) 6,192 6,015 6,517 6,610 6,842 6,854 6,850 7,118 7,040
MoM - 5% 8% 1% 4% 0% 0% 4% -1%
YoY 27% 24% 37% 40% 44% 27% 21% 24% 18%
Aluminum ($/t) 1,968 1,903 2,030 2,096 2,131 2,097 2,080 2,210 2,182
MoM - 1% 7% 3% 2% -2% -1% 6% -1%
YoY 23% 17% 24% 33% 28% 21% 20% 23% 17%
Nickel ($/t) 10,410 9,491 10,890 11,216 11,336 11,972 11,495 12,865 13,596
MoM - 6% 15% 3% 1% 6% -4% 12% 6%
YoY 8% -8% 5% 11% 10% 8% 5% 29% 28%
Zinc ($/t) 2,891 2,787 2,981 3,117 3,265 3,229 3,196 3,442 3,533
MoM - 8% 7% 5% 5% -1% -1% 8% 3%
YoY 38% 28% 31% 36% 41% 26% 20% 27% 24%
Gold ($/oz) 1,259 1,238 1,284 1,315 1,283 1,282 1,267 1,332 1,331
MoM - -2% 4% 2% -2% 0% -1% 5% 0%
YoY 1% -8% -4% -1% 1% 4% 10% 12% 8%
Source: Bloomberg, The Bank of Tokyo-Mitsubishi UFJ, Strategic Research Division
2017 2018
Chern Woon Lam
Strategic Research Division (Singapore)
THE BANK OF TOKYO-MITSUBISHI UFJ, LTD.
2. Iron Ore
Mining Monitor | 12 March 2018 5

In February, iron ore prices rallied and
ended the month at $77/t. The average
price in February was $75/t, up 2%
from January’s $73/t. The steel
production cuts in China is favouring
the use of more efficient quality grade
iron ore such as the benchmark 62%
grade.
Chinese iron ore port inventories rose
to a record 156mn tons in the last
week of February.
The near-term positive outlook is
buoyed by the expectations of greater
steel production when the Chinese
winter supply curbs end. Banks like
Goldman Sachs and Citigroup are
forecasting iron ore prices to reach
$80-85/t in the next three months.
Iron ore pricing in the rest of 2018 may
be supported if a new round of
production curbs at Chinese city
Tangshan goes through. The
restrictions will raise steel prices and
the improved margins will allow mills to
pay more for iron ore.
6
Iron Ore Prices and Inventories
Prices rallied in February, as the use of efficient quality grade benchmark iron ore is favoured.
Near-term outlook is buoyed by expectations of greater steel production post-Chinese winter curbs.
2. Iron Ore
1) Price Trends
Mining Monitor | 12 March 2018
0
40
80
120
160
200
0
50
100
150
200
250
No
v-1
1
Feb
-12
Ma
y-1
2
Aug-1
2
No
v-1
2
Feb
-13
Ma
y-1
3
Aug-1
3
No
v-1
3
Feb
-14
Ma
y-1
4
Aug-1
4
No
v-1
4
Fe
b-1
5
Ma
y-1
5
Aug-1
5
No
v-1
5
Feb
-16
Ma
y-1
6
Aug-1
6
No
v-1
6
Feb
-17
Ma
y-1
7
Aug-1
7
No
v-1
7
Feb
-18
China Iron Ore Port Inventory (RHS) Iron Ore Fines 62%, CFR China Import Spot Price (LHS)
($/t) (Mt)
Source: Bloomberg, The Bank of Tokyo-Mitsubishi UFJ, Strategic Research Division
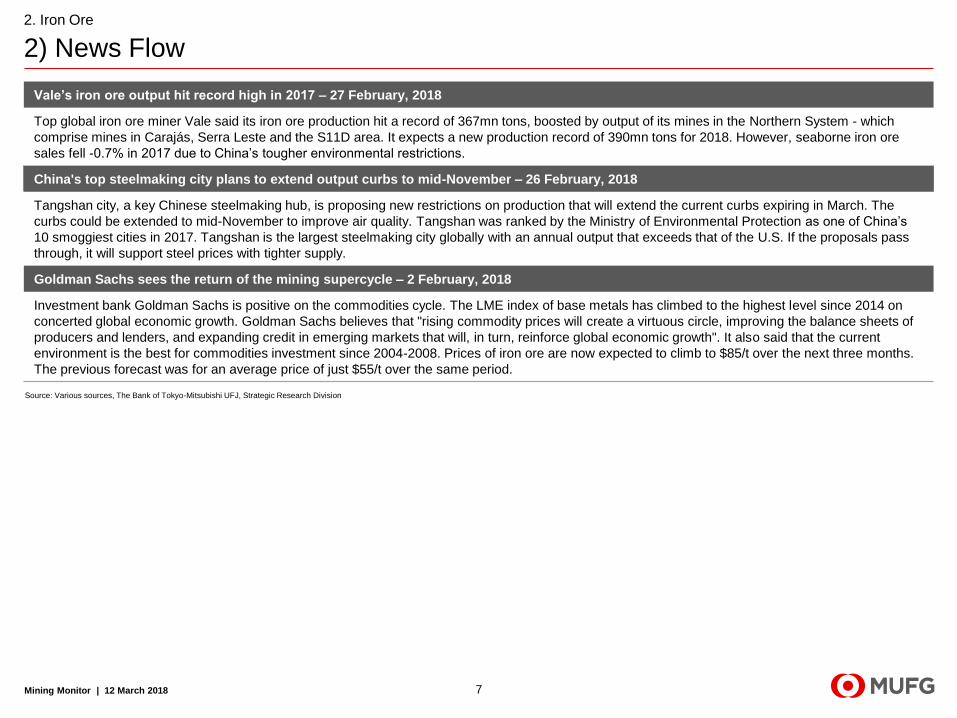
Vale’s iron ore output hit record high in 2017 – 27 February, 2018
Top global iron ore miner Vale said its iron ore production hit a record of 367mn tons, boosted by output of its mines in the Northern System - which
comprise mines in Carajás, Serra Leste and the S11D area. It expects a new production record of 390mn tons for 2018. However, seaborne iron ore
sales fell -0.7% in 2017 due to China’s tougher environmental restrictions.
China's top steelmaking city plans to extend output curbs to mid-November – 26 February, 2018
Tangshan city, a key Chinese steelmaking hub, is proposing new restrictions on production that will extend the current curbs expiring in March. The
curbs could be extended to mid-November to improve air quality. Tangshan was ranked by the Ministry of Environmental Protection as one of China’s
10 smoggiest cities in 2017. Tangshan is the largest steelmaking city globally with an annual output that exceeds that of the U.S. If the proposals pass
through, it will support steel prices with tighter supply.
Goldman Sachs sees the return of the mining supercycle – 2 February, 2018
Investment bank Goldman Sachs is positive on the commodities cycle. The LME index of base metals has climbed to the highest level since 2014 on
concerted global economic growth. Goldman Sachs believes that "rising commodity prices will create a virtuous circle, improving the balance sheets of
producers and lenders, and expanding credit in emerging markets that will, in turn, reinforce global economic growth". It also said that the current
environment is the best for commodities investment since 2004-2008. Prices of iron ore are now expected to climb to $85/t over the next three months.
The previous forecast was for an average price of just $55/t over the same period.
7
2. Iron Ore
2) News Flow
Source: Various sources, The Bank of Tokyo-Mitsubishi UFJ, Strategic Research Division
Mining Monitor | 12 March 2018

William Cheung
Strategic Research Division (Hong Kong)
THE BANK OF TOKYO-MITSUBISHI UFJ, LTD.
3. Coal
Mining Monitor | 12 March 2018 8

Average global coking coal price fell
by 4.3% from previous month to
$229/ton in February.
But it should be noted that price rose
greatly from $215/ton on 1 February
to $235/ton on 28 February, driven
by strong buying interests from
China amid restocking from Chinese
steelmakers ahead of Lunar New
Year holidays and strengthening
Chinese yuan against US dollar. Yet,
overall price were still below the
average price last month.
Average global thermal coal price fell
marginally by 2.6% month-on-month
to $103/ton in February.
The price decrease was due to ease
of supply tightness in China, as rail
transport for coal has resumed
normal when blizzard stopped. Also,
factories stopping work during the
Lunar New Year holidays reduced
the usage of electricity, which helped
relieve the demand pressure to a
certain extent.
Mining Monitor | 12 March 2018 9
Coal Prices
Average coking coal price fell in February, but strong buying interests from China led price recovery later this month.
Average thermal coal price fell as supply tightness has been eased after rail transport for coal has resumed normal.
3. Coal
1) Price Trends
0
50
100
150
200
250
300
350
Feb
-10
Ma
y-1
0
Aug-1
0
No
v-1
0
Feb
-11
Ma
y-1
1
Aug-1
1
No
v-1
1
Feb
-12
Ma
y-1
2
Aug-1
2
No
v-1
2
Feb
-13
Ma
y-1
3
Aug-1
3
No
v-1
3
Feb
-14
Ma
y-1
4
Aug-1
4
No
v-1
4
Feb
-15
Ma
y-1
5
Aug-1
5
No
v-1
5
Feb
-16
Ma
y-1
6
Aug-1
6
No
v-1
6
Feb
-17
Ma
y-1
7
Aug-1
7
No
v-1
7
Feb
-18
Spot Price (Coking Coal) Spot Price (Thermal Coal)($/t)
Source: Bloomberg, The Bank of Tokyo-Mitsubishi UFJ, Strategic Research Division
China to cut coal capacity by 150 million tons in 2018 – 5 March 2018
China will continue to cut coal production capacity by 150 million tons in 2018, according to the work report from NDRC (National Development and
Reform Commission) at the opening of the annual meeting of 13th National People's Congress held in early March. At the same time, coal-fired power
generating units with a capacity of below 300,000 kilowatts will be closed this year. The work report underscores China’s determination to remove coal
excess capacity, as gluts of coal production dragged down corporate profit and economic growth. Last month, NDRC said it aimed to meet its target for
reducing coal capacity two years earlier. China has cut 250 million tons of coal capacity last year, taking the total since 2016 to 460 million tons, almost
hitting its 2020 target of 500 million tons.
Coking coal price recovers in February, but still below January level – 19 February 2018
Coking coal price recovered from late January to February 2018 driven by strong buying interests from China, a result of restocking from Chinese steel
mills ahead of the Lunar New Year holidays and strengthening performance of Chinese yuan against US dollar. Domestic supply of coking coal in China
came under pressure due to the ongoing winter production cut. This in turn attracted Chinese buyers to return to the seaborne coking coal market in late
January. Besides, Chinese yuan has been strengthening against US dollar over the past few weeks, which made coal imports to China more attractive.
However, the 30-day average coking coal price on 19 February was still 12.7% below last month average, which was caused by a reduced level of
concern about Australia’s supply disruption, as well as slowing inventory re-stocking from Asian steelmakers and traders.
Thermal coal price falls marginally as coal inventories grow after rough winter – 12 February 2018
Coal inventories of power companies in China started to grow again in mid-February after severe supply shortages caused by rail transport disruption
due to blizzard as well as surging electricity consumption. As blizzard stopped, rail transport for coal has resumed normal recently. Also, factories
stopping work during the long Lunar New Year holidays would reduce the usage of electricity, which might help relieve the pressure on coal demand.
Therefore, the tightness of thermal coal market is likely to ease in February, according to the NDRC. For these reasons, the global thermal coal price fell
from $104.4/ton on 31 January 2018 to $98.7/ton on 12 February 2018.
China gives new inventive to drive quality coal – 9 February 2018
Coal companies in China will be encouraged to shut inefficient mines and replace them with larger one if they meet the standard set by the NDRC.
Companies that agree to establish long-term contracts with power plants or set up joint ventures with power utilities will be allowed to expand their
capacities by 130 percent to 300 percent. The NDRC will give those coal companies to shut outdated production within a year. This latest measure
plans to increase high-quality coal supply. It also aims to tie among coal mines, coal-related businesses and power utilities to stabilize thermal coal
price.
Mining Monitor | 12 March 2018 10
3. Coal
2) News Flow
Source: Various sources, The Bank of Tokyo-Mitsubishi UFJ, Strategic Research Division

Katia Tavarez
Strategic Research (NY)
MUFG UNION BANK, N.A.
4. Copper
Mining Monitor | 12 March 2018 11
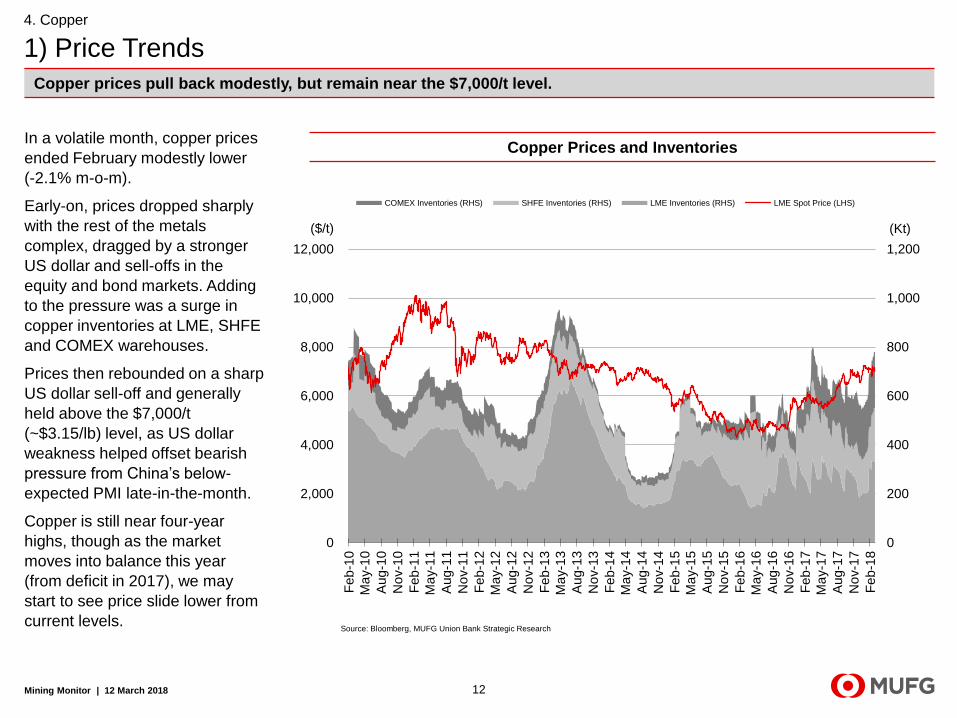
In a volatile month, copper prices
ended February modestly lower
(-2.1% m-o-m).
Early-on, prices dropped sharply
with the rest of the metals
complex, dragged by a stronger
US dollar and sell-offs in the
equity and bond markets. Adding
to the pressure was a surge in
copper inventories at LME, SHFE
and COMEX warehouses.
Prices then rebounded on a sharp
US dollar sell-off and generally
held above the $7,000/t
(~$3.15/lb) level, as US dollar
weakness helped offset bearish
pressure from China’s below-
expected PMI late-in-the-month.
Copper is still near four-year
highs, though as the market
moves into balance this year
(from deficit in 2017), we may
start to see price slide lower from
current levels.
Mining Monitor | 12 March 2018 12
Copper Prices and Inventories
Copper prices pull back modestly, but remain near the $7,000/t level.
4. Copper
1) Price Trends
0
200
400
600
800
1,000
1,200
0
2,000
4,000
6,000
8,000
10,000
12,000
Feb
-10
Ma
y-1
0
Aug-1
0
No
v-1
0
Feb
-11
Ma
y-1
1
Aug-1
1
No
v-1
1
Feb
-12
Ma
y-1
2
Aug-1
2
No
v-1
2
Feb
-13
Ma
y-1
3
Aug-1
3
No
v-1
3
Feb
-14
Ma
y-1
4
Aug-1
4
No
v-1
4
Feb
-15
Ma
y-1
5
Au
g-1
5
No
v-1
5
Feb
-16
Ma
y-1
6
Aug-1
6
No
v-1
6
Feb
-17
Ma
y-1
7
Aug-1
7
No
v-1
7
Feb
-18
COMEX Inventories (RHS) SHFE Inventories (RHS) LME Inventories (RHS) LME Spot Price (LHS)
($/t) (Kt)
Source: Bloomberg, MUFG Union Bank Strategic Research
Union fears Codelco privatization – 2 March, 2018
The union representative in the board of Chile’s Codelco voiced concerns that the incoming government’s proposal to split Codelco is the first step
toward privatization. During his campaign, President-elect Sebastian Pinera stressed that he would give Codelco more independence to make the
company more efficient. He also noted the need for ‘deep reflection’ on funding. More recently, Chile’s incoming Mining Minister Baldo Prokurica told
newspaper La Tercera that the government plans to break up the company into northern and southern units. Prokurica did not mention any plans to
privatize Codelco.
Southern Copper wins auction for $2.5bn Peru project – 21 February, 2018
Southern Copper won the bid for the Peruvian government’s first auction of the Michiquillay copper project – the first tender in almost ten years.
Southern Copper won the tender with a proposal to transfer US$400 million to the government and pay 3 percent royalties. With mineral resources of
1,150 Mt and a copper grade of 0.63%, the mine would produce 225Kt per year (along with by-products like molybdenum, gold, and silver) for an initial
mine life of over 25 years at a ‘very competitive cash-cost’. The estimated capital investment is around US$2.5 billion. Michiquillay will start production
in 2025 and will become one of Peru’s largest mines.
China copper imports end 2017 at multi-year lows – 8 February, 2018
In January, China imported 400Kt of refined copper (-2% m-o-m, +16% y-o-y). This positive yearly reading follows the negative print from December,
and, according to analysts, may reflect China’s clampdown on copper scrap.
Mining Monitor | 12 March 2018 13
4. Copper
2) News Flow
Source: Various sources, MUFG Union Bank Strategic Research

Erik Lambert
Strategic Research Division (London)
THE BANK OF TOKYO-MITSUBISHI UFJ, LTD.
5. Aluminum
Mining Monitor | 12 March 2018 14
Mining Monitor | 12 March 2018
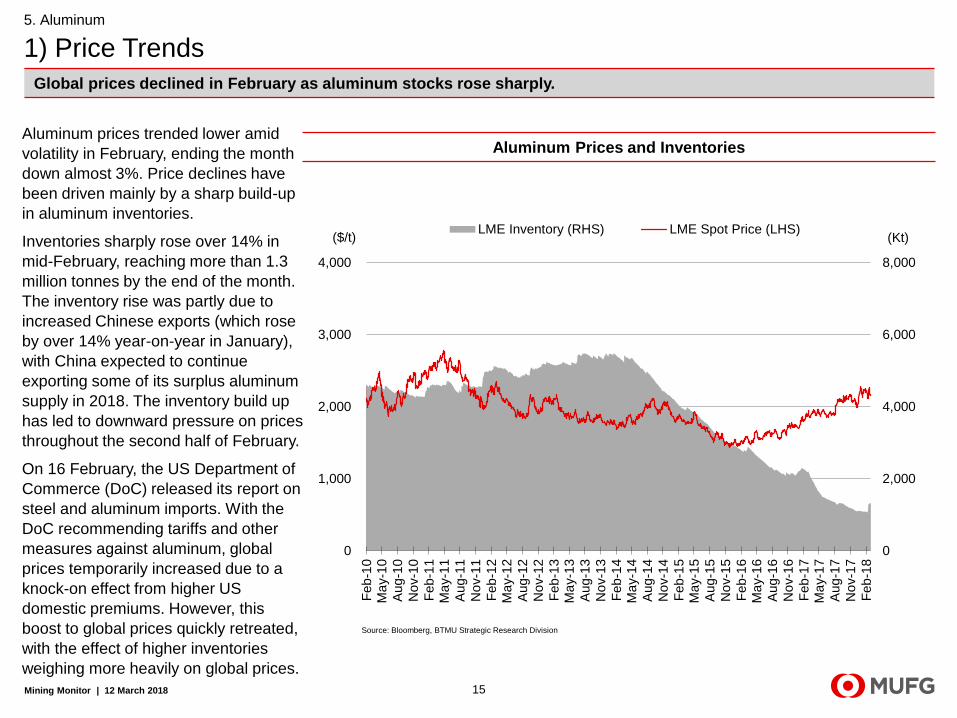
Aluminum prices trended lower amid
volatility in February, ending the month
down almost 3%. Price declines have
been driven mainly by a sharp build-up
in aluminum inventories.
Inventories sharply rose over 14% in
mid-February, reaching more than 1.3
million tonnes by the end of the month.
The inventory rise was partly due to
increased Chinese exports (which rose
by over 14% year-on-year in January),
with China expected to continue
exporting some of its surplus aluminum
supply in 2018. The inventory build up
has led to downward pressure on prices
throughout the second half of February.
On 16 February, the US Department of
Commerce (DoC) released its report on
steel and aluminum imports. With the
DoC recommending tariffs and other
measures against aluminum, global
prices temporarily increased due to a
knock-on effect from higher US
domestic premiums. However, this
boost to global prices quickly retreated,
with the effect of higher inventories
weighing more heavily on global prices.
15
Aluminum Prices and Inventories
Global prices declined in February as aluminum stocks rose sharply.
5. Aluminum
1) Price Trends
0
2,000
4,000
6,000
8,000
0
1,000
2,000
3,000
4,000
Feb
-10
Ma
y-1
0
Aug-1
0
No
v-1
0
Feb
-11
Ma
y-1
1
Aug-1
1
No
v-1
1
Feb
-12
Ma
y-1
2
Aug-1
2
No
v-1
2
Feb
-13
Ma
y-1
3
Aug-1
3
No
v-1
3
Feb
-14
Ma
y-1
4
Aug-1
4
No
v-1
4
Feb
-15
Ma
y-1
5
Aug-1
5
No
v-1
5
Feb
-16
Ma
y-1
6
Aug-1
6
No
v-1
6
Feb
-17
Ma
y-1
7
Aug-1
7
No
v-1
7
Feb
-18
LME Inventory (RHS) LME Spot Price (LHS)($/t) (Kt)
Source: Bloomberg, BTMU Strategic Research Division

Surging stockpiles push aluminium prices to two-month low - 14 February, 2018
Aluminum prices fell on Wednesday following a rapid build up in warehouse stocks; these inventory increases suggested strong market supply.
Inventories at warehouses registered by LME increased by more than 200,000 tonnes in the past week to over 1.3 million tonnes. Inventories in
Shanghai Futures Exchange warehouses also increased, after rising more than 600% in 2017. As much as 7 million tonnes of aluminum remains
outside of the exchange warehouse system as a result of market surpluses that built up in previous years.
China's industry ministry to crack down on aluminum price speculation – 1 March, 2018
China’s Ministry of Industry and Information Technology (MIIT) agreed to increase monitoring of the price of aluminum in order to prevent excessive
speculation in the market. The Ministry agreed to work with metals associations and other departments to avoid speculation. Chinese aluminum prices
fell roughly 17% since September, after rising more than 25% for the first eight months of 2017.
Trump to impose steep tariffs on steel, aluminum; stokes trade war fears – 2 March, 2018
US President Donald Trump announced plans to impose tariffs on aluminum imports. The 10% tariffs on aluminum imports were expected to increase
prices for end-users of the metal, and concerned several lawmakers regarding potential retaliatory measures that could be taken by other trading
partners of the US. Canadian aluminium exports to the United States were believed to be particularly vulnerable to the tariffs.
Mining Monitor | 12 March 2018 16
5. Aluminum
2) News Flow
Source: Various sources, The Bank of Tokyo-Mitsubishi UFJ, Strategic Research Division

Erik Lambert
Strategic Research Division (London)
THE BANK OF TOKYO-MITSUBISHI UFJ, LTD.
6. Nickel
Mining Monitor | 12 March 2018 17

Nickel prices continued their uptrend,
moving briefly above $14,000/tonne, a
level not achieved since mid-2015.
Prices then settled around $13,740 at
the end of the month. Continued
market bullishness has been driven
by fundamental trends supporting
higher prices.
On the supply side, some nickel
miners reported lower-than-expected
mining output in February; Sumitomo
Corporation expected production at its
Ambatovy project in Madagascar to
run at only 50% utilization for the
remainder of Q1 following disruption
due to a January cyclone, for
example. Lower mining output
contributed to a continuous decline in
inventories throughout February,
which have pressured prices.
Price increases have also been driven
by speculators, investing in nickel
given the metal’s use in lithium-ion
batteries. Demand for these batteries
is expected to increase significantly
as electric vehicle penetration grows
in the coming decade.
Mining Monitor | 12 March 2018 18
Nickel Prices and Inventories
Nickel prices continued their uptrend into February, driven higher by near-term supply reductions and longer-term
expectations of increased demand.
6. Nickel
1) Price Trends
0
100
200
300
400
500
0
10,000
20,000
30,000
40,000
Feb
-10
Ma
y-1
0
Aug-1
0
No
v-1
0
Feb
-11
Ma
y-1
1
Aug-1
1
No
v-1
1
Feb
-12
Ma
y-1
2
Aug-1
2
No
v-1
2
Feb
-13
Ma
y-1
3
Aug-1
3
No
v-1
3
Feb
-14
Ma
y-1
4
Aug-1
4
No
v-1
4
Feb
-15
Ma
y-1
5
Aug-1
5
No
v-1
5
Feb
-16
Ma
y-1
6
Aug-1
6
No
v-1
6
Feb
-17
Ma
y-1
7
Aug-1
7
No
v-1
7
Feb
-18
LME Inventory (RHS) LME Spot Price (LHS)($/t) (Kt)
Source: Bloomberg, BTMU Strategic Research Division

Nickel usage to grow 4%/year to 2027, deficit to narrow: Roskill – 8 February, 2018
Primary nickel consumption was expected to increase by around 4% per year from 2017-2027. A recent report by Roskill Information Services notes
that growth is expected to be driven by stainless steel production growth and increases in battery manufacturing. The company noted that “demand for
primary nickel in this market is anticipated to increase by 2.5% per year over the course of our forecast period, thanks to rising output in China and
Indonesia.”
Nickel hits multi-year high as industrial metals surge - 14 February, 2018
Nickel hit multi-year highs on Wednesday amid broader growth in industrial metals. Nickel on the LME closed up nearly 5% at $14,100, the highest level
since May 2015. Increasing Chinese imports, tight supply and interest from investment funds are expected to keep upward pressure on nickel prices.
Vale’s nickel production fell slightly in 2017 – 21 February, 2018
Production at the Indonesian subsidiary of Braziliain nickel miner Vale fell in 2017 to 76,807 metric tonnes, compared to 77,581 metric tonnes in 2016.
Planned maintenance in the fourth quarter contributed to the production declines. However, despite the production declines, revenues for the year were
expected to increase due to the effect of increasing nickel prices.
Mining Monitor | 12 March 2018 19
6. Nickel
2) News Flow
Source: Various sources, The Bank of Tokyo-Mitsubishi UFJ, Strategic Research Division

7. Zinc
Mining Monitor | 12 March 2018 20
Erik Lambert
Strategic Research Division (London)
THE BANK OF TOKYO-MITSUBISHI UFJ, LTD.

Zinc prices stalled in February, with an
end-of-month decline leaving prices
down 3%, capping the metal’s recent
rally.
Although LME zinc inventories have
continued to decline, which keeps
upward pressure on prices, signs of
higher future zinc production have put
a brake on bullishness in the sector.
Between January and February
several major zinc miners reported
increases in production in Q4 2017,
including Vedanta and MMG; this
furthered market perception of
production increases into 2018.
The late-February decline was directly
driven by concerns about rising supply
in China. A sharp increase in Chinese
zinc concentrates (mined supply for
smelters) imports in January, with
concentrates imports rising 48.5%
compared to December, signalled the
potential for a large amount of future
Chinese production to come onto the
market.
Mining Monitor | 12 March 2018 21
Zinc Prices and Inventories
Signs of robust 2018 production stalled zinc’s recent price rally in February.
7. Zinc
1) Price Trends
0
500
1,000
1,500
2,000
0
1,000
2,000
3,000
4,000
Feb
-10
Ma
y-1
0
Aug-1
0
No
v-1
0
Feb
-11
Ma
y-1
1
Aug-1
1
No
v-1
1
Feb
-12
Ma
y-1
2
Aug-1
2
No
v-1
2
Feb
-13
Ma
y-1
3
Aug-1
3
No
v-1
3
Feb
-14
Ma
y-1
4
Aug-1
4
No
v-1
4
Feb
-15
Ma
y-1
5
Aug-1
5
No
v-1
5
Feb
-16
Ma
y-1
6
Aug-1
6
No
v-1
6
Feb
-17
Ma
y-1
7
Aug-1
7
No
v-1
7
Feb
-18
LME Inventory (RHS) LME Spot Price (LHS)($/t) (Kt)
Source: Bloomberg, BTMU Strategic Research Division

Zinc miners, smelters spar over supply as 2018 terms delayed - 16 February, 2018
Zinc miners and smelters did not come to an agreement on 2018 financial terms for zinc processing at a recent industry gathering. Any future
agreement is likely to be delayed until March or April, as industry players negotiate amid a potential for growing zinc supply in H2 2018. Traders
expected that smelters would accept lower fees to process concentrate into metal, with subdued mine supply ongoing for three years.
Vedanta seeks to expand zinc output after price rally – 19 February, 2018
Zinc miner Vedanta could expand its African zinc operations, in order to capitalize on prices which reached their highest levels in a decade, following
underinvestment in production and the rally in zinc prices, which reached their highest levels since 2007. The recent rally has boosted Vedanta’s profits.
Vedanta’s CEO was bullish on zinc prices, noting that the “the market is in deficit for both zinc concentrate and metal.”
Aluminum Slips Ahead of Trump Tariff Decision While Zinc Sinks - 01 March, 2018
Zinc lost two percent on Thursday, as a range of metals were under market pressure. Zinc traded at $3,381 per tonne, falling for a third day in a row.
Declines were driven particularly by signs of supply growth in China. Sharp increases in zinc concentrates imports to China in January, particularly from
Australia, has been the driver of the price declines. According to Macquarie analyst Vivienne Lloyd: “We still think zinc is going to make one last push
higher on Chinese galvanized steel restocking from end-March, but the concentrates import data is focusing minds on the new material that’s going to
be coming into the market this year.”
Mining Monitor | 12 March 2018 22
7. Zinc
2) News Flow
Source: Various sources , The Bank of Tokyo-Mitsubishi UFJ, Strategic Research Division

Katia Tavarez
Strategic Research (NY)
MUFG UNION BANK, N.A.
8. Gold
Mining Monitor | 12 March 2018 23

Mining Monitor | 12 March 2018 24
Gold Prices, ETF Holdings, DXY Index and 10Yr US TIPS Yield
A volatile month for gold as it tracked the US dollar.
8. Gold
1) Price Trends
Gold prices came under pressure
in February (-2.0% m-o-m),
trading erratically throughout the
month but remaining above the
$1,300/lb threshold.
Gold tracked the US dollar’s
volatile movements closely, falling
sharply in early-February as the
dollar strengthened (and
bond/equity markets sold-off) and
rising quickly thereafter as the
dollar weakened. Despite dollar
support, gold prices ultimately
turned lower in the second-half of
February, pressured by rising real
rates in the US.
With the recent leg down in
prices, funds reduced bullish bets
on gold, with money manager net
length at the COMEX falling to
their lowest level this year. Gold
ETF holdings fell only modestly,
remaining near 4 ½ year highs.
1,000
1,300
1,600
1,900
2,200
2,500
2,800
800
1,000
1,200
1,400
1,600
1,800
2,000
Feb
-10
Ma
y-1
0
Aug-1
0
No
v-1
0
Feb
-11
Ma
y-1
1
Aug-1
1N
ov-1
1
Feb
-12
Ma
y-1
2
Aug-1
2
No
v-1
2
Feb
-13
Ma
y-1
3
Aug-1
3
No
v-1
3
Feb
-14
Ma
y-1
4
Aug-1
4
No
v-1
4
Feb
-15
Ma
y-1
5
Aug-1
5
No
v-1
5F
eb
-16
Ma
y-1
6
Aug-1
6N
ov-1
6
Feb
-17
Ma
y-1
7
Aug-1
7
No
v-1
7
Feb
-18
(t) ETF Holdings (RHS) Gold Price (LHS)($/oz)
Source: World Gold Council, GFMS, Bloomberg, MUFG Union Bank Strategic Research
Note: ETF Holdings are expressed in aggregate tons.
1.0
1.5
2.0
2.5
3.0
3.5
4.0
9
10
11
12
13
14
15
Feb
-10
Ma
y-1
0
Aug-1
0
No
v-1
0
Feb
-11
Ma
y-1
1
Aug-1
1
No
v-1
1
Feb
-12
Ma
y-1
2
Aug-1
2
No
v-1
2
Feb
-13
Ma
y-1
3
Aug-1
3
No
v-1
3
Feb
-14
Ma
y-1
4
Aug-1
4
No
v-1
4
Feb
-15
Ma
y-1
5
Aug-1
5
No
v-1
5
Feb
-16
Ma
y-1
6
Aug-1
6
No
v-1
6
Feb
-17
Ma
y-1
7
Aug-1
7
No
v-1
7
Feb
-18
Index DXY Inverse (LHS) 10Yr UST Yield (RHS) (%)
Source: Bloomberg, MUFG Union Bank Strategic Research

Mining Monitor | 12 March 2018 25
8. Gold
2) News Flow
Lundin Gold sees growth after Ecuador project – 5 March, 2018
Lundin Gold’s CEO said that the company is looking to becoming an at least one-million-a-year producer of gold with three to four operations. The
Canadian company will focus on North and Latin America for growth. Lundin Gold is firstly focused, however, on building its Fruta del Norte mine that
will be Ecuador’s biggest gold mine and for which the miner recently raised nearly half a billion in a private placement. The start of production for that
project is targeted for end-2019. It will produce over 325K ounces of gold annual with a mine life of 15 years.
Barrick will increase output starting in 2021 – 22 February, 2018
Barrick Gold, the world’s largest gold producer, will increase gold production by advancing four projects that could add more than 1 million ounces in
output starting in 2021. The company said that the Cortez Deep South, Goldrush and Turquoise Ridge projects in the US have been approved, and that
work on extending the life of the Lagunas Norte Mine in Peru is under way. These announcements come as Newmont Mining closes the gap with
Barrick in terms of annual production. In fact, guidance from both companies for the 2018-22 period suggest that Newmont will overtake Barrick as the
largest gold producer over the next few years. In its 2018 guidance, Barrick reduced its production forecasts, targeting 4.5 – 5.5 million ounces of gold
for 2018 and 4.2 – 4.6 million ounces per year for the 2019-22 period. Newmont, meanwhile, expects that it will produce 4.9 – 5.4 million ounces for
2018 and 4.6 – 5.1 million ounces for the 2019-22 period.
Source: Various sources, MUFG Union Bank Strategic Research
Mining Monitor | 12 March 2018 26
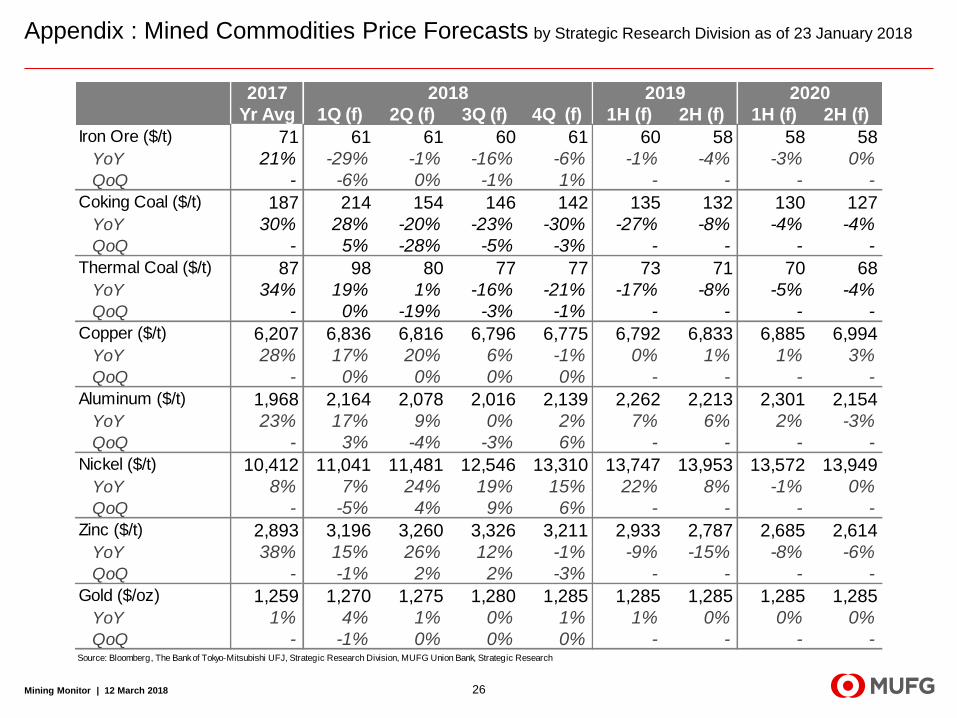
Appendix : Mined Commodities Price Forecasts by Strategic Research Division as of 23 January 2018
2017
Yr Avg 1Q (f) 2Q (f) 3Q (f) 4Q (f) 1H (f) 2H (f) 1H (f) 2H (f)
Iron Ore ($/t) 71 61 61 60 61 60 58 58 58
YoY 21% -29% -1% -16% -6% -1% -4% -3% 0%
QoQ - -6% 0% -1% 1% - - - -
Coking Coal ($/t) 187 214 154 146 142 135 132 130 127
YoY 30% 28% -20% -23% -30% -27% -8% -4% -4%
QoQ - 5% -28% -5% -3% - - - -
Thermal Coal ($/t) 87 98 80 77 77 73 71 70 68
YoY 34% 19% 1% -16% -21% -17% -8% -5% -4%
QoQ - 0% -19% -3% -1% - - - -
Copper ($/t) 6,207 6,836 6,816 6,796 6,775 6,792 6,833 6,885 6,994
YoY 28% 17% 20% 6% -1% 0% 1% 1% 3%
QoQ - 0% 0% 0% 0% - - - -
Aluminum ($/t) 1,968 2,164 2,078 2,016 2,139 2,262 2,213 2,301 2,154
YoY 23% 17% 9% 0% 2% 7% 6% 2% -3%
QoQ - 3% -4% -3% 6% - - - -
Nickel ($/t) 10,412 11,041 11,481 12,546 13,310 13,747 13,953 13,572 13,949
YoY 8% 7% 24% 19% 15% 22% 8% -1% 0%
QoQ - -5% 4% 9% 6% - - - -
Zinc ($/t) 2,893 3,196 3,260 3,326 3,211 2,933 2,787 2,685 2,614
YoY 38% 15% 26% 12% -1% -9% -15% -8% -6%
QoQ - -1% 2% 2% -3% - - - -
Gold ($/oz) 1,259 1,270 1,275 1,280 1,285 1,285 1,285 1,285 1,285
YoY 1% 4% 1% 0% 1% 1% 0% 0% 0%
QoQ - -1% 0% 0% 0% - - - -Source: Bloomberg, The Bank of Tokyo-Mitsubishi UFJ, Strategic Research Division, MUFG Union Bank, Strategic Research
20202018 2019

Disclaimer
Mining Monitor | 12 March 2018 27
This report is intended only for information purposes and is not intended to constitute an offer or solicitation to buy or sell securities or any
other products. Contents of the report are information as at publish date and are subject to change without notice. This report has not been
prepared to provide legal, taxational, financial, market-judgmental, or any other advises on propriety of any transactions. In taking any
action, each reader is requested to act on the basis of his or her own judgment upon consulting certified lawyers, accountants or other
professionals regarding the accuracy, validity and reliability of information appeared in this report.
Bank of Tokyo-Mitsubishi UFJ is regulated by the Financial Services Authority.
No part of this publication may be reproduced, stored in a retrieval system or transmitted without the prior written permission of The Bank
of Tokyo-Mitsubishi UFJ Limited.
Copyright© 2018 The Bank of Tokyo-Mitsubishi UFJ, Ltd. All rights reserved.
Publisher:The Bank of Tokyo-Mitsubishi UFJ, Strategic Research Division
2-7-1, Marunouchi, Chiyoda-ku, Tokyo 100-8388, Japan
Contact details for inquiries : Shino Yamamoto
(TEL:03-3240-7935、e-mail: [email protected])