Embed Size (px)
Citation preview
The final publication is available at link.springer.comSpringer Nature SharedIt: http://rdcu.be/udmt
Mining Social Media to Inform Peatland Fire and HazeDisaster Management
Mark Kibanov · Gerd Stumme ·Imaduddin Amin · Jong Gun Lee
Abstract Peatland fires and haze events are disasters with national, regional, andinternational implications. The phenomena lead to direct damage to local assets, aswell as broader economic and environmental losses. Satellite imagery is still the mainand often the only available source of information for disaster management. In thisarticle, we test the potential of social media to assist disaster management. To thisend, we compare insights from two datasets: fire hotspots detected via NASA satel-lite imagery and almost all GPS-stamped tweets from Sumatra Island, Indonesia,posted during 2014. Sumatra Island is chosen as it regularly experiences a significantnumber of haze events, which affect citizens in Indonesia as well as in nearby coun-tries including Malaysia and Singapore. We analyse temporal correlations betweenthe datasets and their geo-spatial interdependence. Furthermore, we show how Twit-ter data reveals changes in users’ behavior during severe haze events. Overall, wedemonstrate that social media are a valuable source of complementary and supple-mentary information for haze disaster management. Based on our methodology andfindings, an analytics tool to improve peatland fire and haze disaster management bythe Indonesian authorities is under development.
M. Kibanov, G. StummeKnowledge & Data Engineering GroupITeG Research CenterUniversity of Kassel, GermanyE-mail: kibanov, [email protected]
I. Amin, J.G. LeePulse Lab JakartaUN Global PulseUnited NationsE-mail: imaduddin.amin, [email protected]
arX
iv:1
706.
0540
6v2
[cs
.SI]
2 A
ug 2
017

2 Mark Kibanov et al.
1 Introduction
Peatland fires and their associated haze events are slow onset but medium impactdisasters. At times the fires occur when several environmental conditions meet, butmost fires are man-made disasters resulting from – predominantly illegal – agricul-tural practices, e. g., conversion often forests and peatland into palm oil plantationsthrough slash-and-burn techniques [17]. The impact of these activities span environ-mental (e. g., accelerated deforestation by up to 62% [23]) and economic losses, butthe associated haze events also seriously affect local residents’ health. When suchfires, in particular peat fires, produce haze, wide areas can be affected within a rel-atively short period of time. If the haze severity level is low, the Government of In-donesia advises its citizens to reduce their outdoor activities. If the level is high,residents are asked to evacuate the affected area, because haze generated by peatlandfires may lead to various health issues [1],[14]. Dense haze, including a case in In-donesia on October 20, 2015 as shown in the image below reduces the visibility toless than 100 meters (and in rare instances to less than 20-30 meters) and leads theclosure of airports and schools. Haze is not only a national issue for Indonesia, butalso an international issue, as it affects Singapore and Malaysia.
“Riau extends haze emergency status’’ (Source - Jakarta Post1)
In order to respond to a fire or haze event, a disaster management authority needsfire hotspot information along with (static) baseline information, including an es-timate of the affected population and data on the available facilities. Fire hotspots(henceforth referred to as ‘hotspot’ or ‘hotspots’) are identified relatively efficientlyfrom satellite imagery using a classification algorithm. Due to the limited resourcesavailable to public authorities, more efficient and effective approaches to disastermanagement are welcome, including through the generation of new information.
In this article, we investigate the opportunities that social media offer for im-proved management of peatland fire and haze disasters. Specifically we analyse Twit-ter as the primary data source and use hotspot and air quality data to further interpretand verify the results of our analysis. Our objective is not the evaluation of informa-
1http://www.thejakartapost.com/news/2015/10/20/riau- extends-haze-emergency-status.html(accessed on Jan 12, 2016)
Mining Social Media to Inform Peatland Fire and Haze Disaster Management 3
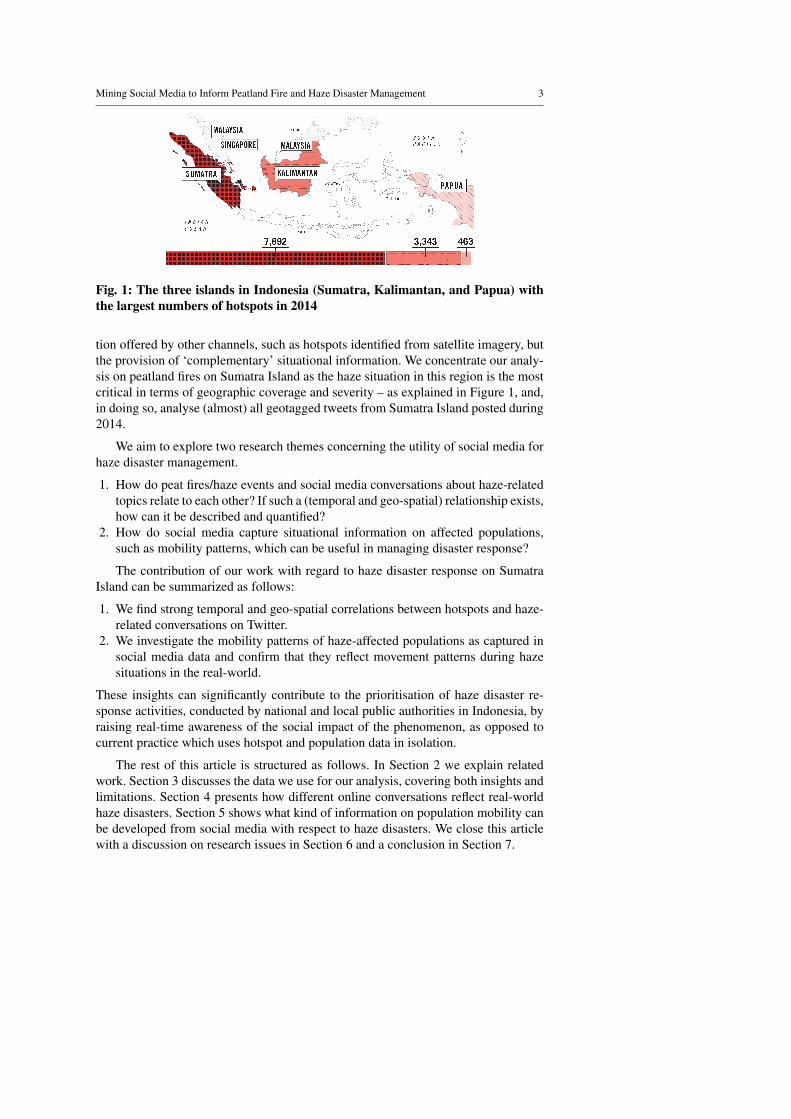
Fig. 1: The three islands in Indonesia (Sumatra, Kalimantan, and Papua) withthe largest numbers of hotspots in 2014
tion offered by other channels, such as hotspots identified from satellite imagery, butthe provision of ‘complementary’ situational information. We concentrate our analy-sis on peatland fires on Sumatra Island as the haze situation in this region is the mostcritical in terms of geographic coverage and severity – as explained in Figure 1, and,in doing so, analyse (almost) all geotagged tweets from Sumatra Island posted during2014.
We aim to explore two research themes concerning the utility of social media forhaze disaster management.
1. How do peat fires/haze events and social media conversations about haze-relatedtopics relate to each other? If such a (temporal and geo-spatial) relationship exists,how can it be described and quantified?
2. How do social media capture situational information on affected populations,such as mobility patterns, which can be useful in managing disaster response?
The contribution of our work with regard to haze disaster response on SumatraIsland can be summarized as follows:
1. We find strong temporal and geo-spatial correlations between hotspots and haze-related conversations on Twitter.
2. We investigate the mobility patterns of haze-affected populations as captured insocial media data and confirm that they reflect movement patterns during hazesituations in the real-world.
These insights can significantly contribute to the prioritisation of haze disaster re-sponse activities, conducted by national and local public authorities in Indonesia, byraising real-time awareness of the social impact of the phenomenon, as opposed tocurrent practice which uses hotspot and population data in isolation.
The rest of this article is structured as follows. In Section 2 we explain relatedwork. Section 3 discusses the data we use for our analysis, covering both insights andlimitations. Section 4 presents how different online conversations reflect real-worldhaze disasters. Section 5 shows what kind of information on population mobility canbe developed from social media with respect to haze disasters. We close this articlewith a discussion on research issues in Section 6 and a conclusion in Section 7.

4 Mark Kibanov et al.
2 Related Work
We focus on two groups of related work – studies of how social media can be used toassist disaster management and research about data mining studies on forest fires.
Social Media and Disasters: A vast body of research exists on social media and itspotential reflection of real-world phenomena. We consider the literature that demon-strates how social media relate to different disasters.
Carley et al. [12] discuss the usage of Twitter for disaster management in In-donesia. This work makes two important contributions relevant for the current arti-cle. First, the viability of using Twitter data for disaster management is demonstrated;second, the paper provides a baseline for Twitter use to support disaster management.
The potential application of social media to disaster and crisis management isattracting the research community’s attention either as a tool or as a source of data,e.g., for the creation of crisis maps. Oz and Bisgin [30] made a social-media based re-search about attribution of responsibility (e.g., how users assign political responsibil-ity) regarding Flint water crisis. Gao et al. [15] consider social-media-based crowd-sourced maps with data from external sources as a powerful tool in humanitarianassistance and disaster relief. Goolsby [16] describes how social media can be usedas crisis management platform to create crisis maps for different agencies. Middle-ton et al. [28] propose a social media crisis-mapping platform, where real-time crisismaps are generated based on statistical analysis of tweet streams matched to areas atrisk. Cresci et al. [13] propose a crisis mapping system that overcomes some limi-tations of other systems: they introduce an SVM-based damage detection approach,and describe a new geoparsing technique to perform a better geolocation of socialmedia messages.
Imran et al. [19] provide an overview of existing and proposed methods and sys-tems to retrieve information about emergencies from social media, such as Crisis-Tracker [33] and TweetTracker [26]. Furthermore, Imran et al. suggest a platformto collect human annotations in order to maintain automatic supervised classifiersfor social media messages [20] and describe automatic methods for extracting brief,self-contained information items from social media, which are relevant to disaster re-sponse [21]. Abel et al. [7] propose the ’Twitcident’, a system for filtering, searchingand analyzing information about real-world incidents or crises. A number of systemsare implemented and deployed for special kinds of disasters: Avvenuti et al. [9][10]describe the design, implementation and deployment of social media based systemfor detection and damage assessment of earthquakes in Italy. The system is able todetect outbraking seismic events with low occurrences of false positives. Cameron etal. [11] describe ESA-AWTM – a system deployed for trial by the Australian Gov-ernment. This tool formalises the usage of Twitter by the Crisis Coordination Center,replacing an ad-hoc fashion monitoring of social media.
Following studies focus rather on algorithmical aspects of social media for dis-aster management, rather than on system architecture or implementation. Rogsta-dius [32] discusses different aspects of possibilities for enhanced disaster situationalawareness using social media. Sakaki et al. [34] present how social media can beutilised as an early warning system with regard to earthquake events. Krstajic et
Mining Social Media to Inform Peatland Fire and Haze Disaster Management 5
al. [24] show not only how natural disasters and man-made catastrophes can be de-tected using Twitter, but also how semantic aspects of such events can be represented.Schulz et al. [36] explore the possibilities of detection of small scale incidents usingmicroblogs. Mandel et al. [27] made a demographic analysis of online sentiment dur-ing a hurricane, particularly focusing on the level of concern disaggregated by gender.Morstatter et al. [29] address the problem of finding (non-geotagged) tweets that orig-inate from a crisis region. Zhang and Vucetic [38] propose an improved method toidentify disaster-related tweets using a semi-supervised approach with an unlabeledcorpus of tweets.
Disaster damage assessment is another important topic in context of disaster man-agement: Kryvasheyeu et al. [25] examine the online activity of different areas before,during and after Hurricane Sandy. They demonstrate that per-capita Twitter activitystrongly correlates with the per-capita economic damage inflicted by the hurricane.
Forest Fires/Haze and Data Mining: The following works contribute to the forestfires issue, applying data mining methods to different aspects of this emergency. Wedo not address in detail the topic of forest fire detection using satellite imagery as thistopic is not in focus of current work, but we note that usage of satellite imagery forforest fires detection is pretty well studied; e.g., Jaiswal et al. [22] describe how forestfire risk zones can be mapped using satellite imagery and geographic informationsystems.
A number of studies present novel data mining methods for haze-related issues.Sakr et al. [35] presents a model to predict forest fires risks using data on previousweather conditions with the best results having been achieved using support vectormachines and a Gaussian kernel function. Iliadis [18] introduce a decision supportsystem for long-term forest fire risk estimation, based on fuzzy algebra. The systemwas applied in Greece but, according to authors, can be used on a global basis. Si-tanggang and Ismail [37] suggest a classification model for hotspot occurrences usinga decision tree model C4.5 algorithm, which achieves an accuracy of 63%. The forestfire data from the Rokan Hilir district on Sumatra Island, Indonesia was used in thatresearch.
Prasetyo et al. [31] used Twitter and Foursquare data to analyze public percep-tions of haze in Singapore. In particular, their analysis showed that (1) social mediausers focus significantly on the haze problem and (2) the problem has a substantialemotional and behavioral impact. The UN presented the first feasibility study [5] forsupporting peat fire and haze disaster management using social media.
Overall, there are a lot of publications describing different aspects of social mediaas an assistance tool for disaster management at different scales. Some researchersapplied data analysis and mining techniques to forest and peatland fires data.
In this article, we concentrate on peatland fires in Indonesia. This disaster occursperiodically and has a huge impact on environment and lives of millions of people. Incontrast to previous works, we consider the dataset of (almost) all geotagged tweetsand all hotspots during one year on Sumatra Island. We created four rich taxonomiesfor identification of different topics related to haze and peatland fires. Furthermore,one of the main focuses of our work is to estimate whether social media can be
6 Mark Kibanov et al.
used for estimation of users’ behaviour w.r.t. Twitter and mobility. To the best of theauthors’ knowledge, those aspects were not covered in previous works.
3 Data Set
We use two main datasets: twitter data from Sumatra Island and hotspots on SumatraIsland detected by National Aeronautics and Space Administration (NASA) satellites.In this section, we describe the data, its basic characteristics and its limitations.
3.1 Fire Hotspots and Twitter Data
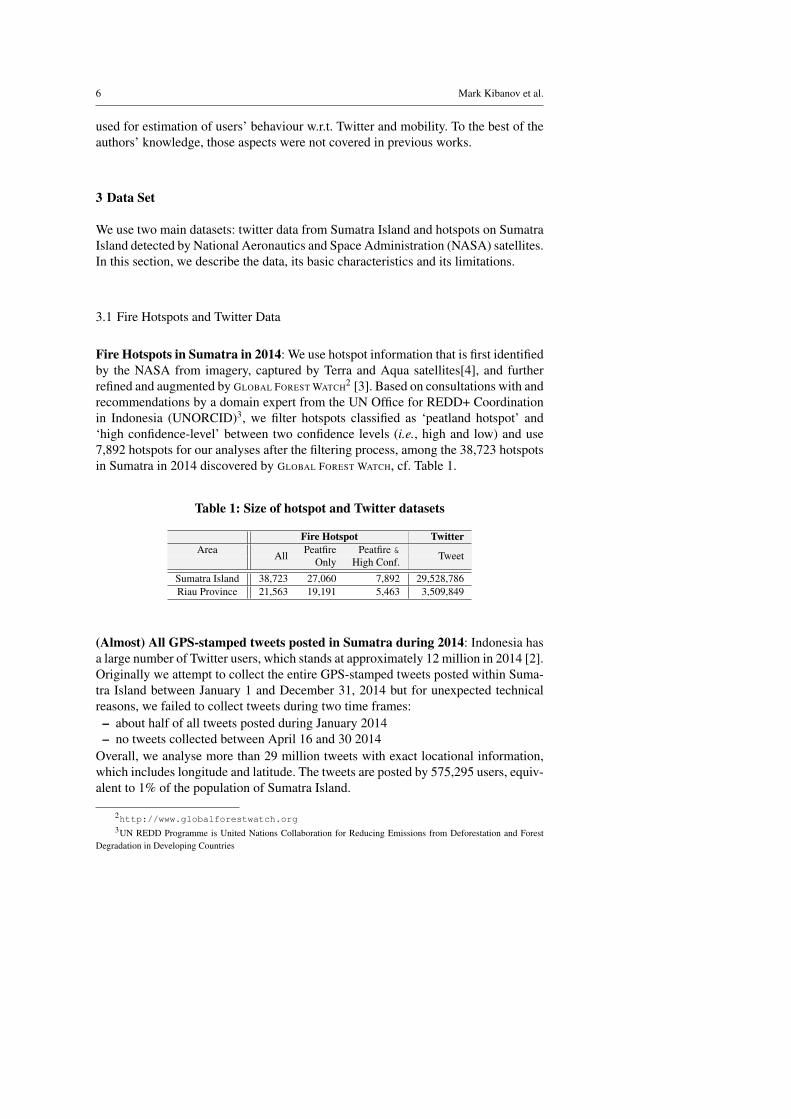
Fire Hotspots in Sumatra in 2014: We use hotspot information that is first identifiedby the NASA from imagery, captured by Terra and Aqua satellites[4], and furtherrefined and augmented by GLOBAL FOREST WATCH2 [3]. Based on consultations with andrecommendations by a domain expert from the UN Office for REDD+ Coordinationin Indonesia (UNORCID)3, we filter hotspots classified as ‘peatland hotspot’ and‘high confidence-level’ between two confidence levels (i.e., high and low) and use7,892 hotspots for our analyses after the filtering process, among the 38,723 hotspotsin Sumatra in 2014 discovered by GLOBAL FOREST WATCH, cf. Table 1.
Table 1: Size of hotspot and Twitter datasets
Fire Hotspot TwitterPeatfire Peatfire &Area All Only High Conf. Tweet
Sumatra Island 38,723 27,060 7,892 29,528,786Riau Province 21,563 19,191 5,463 3,509,849
(Almost) All GPS-stamped tweets posted in Sumatra during 2014: Indonesia hasa large number of Twitter users, which stands at approximately 12 million in 2014 [2].Originally we attempt to collect the entire GPS-stamped tweets posted within Suma-tra Island between January 1 and December 31, 2014 but for unexpected technicalreasons, we failed to collect tweets during two time frames:– about half of all tweets posted during January 2014– no tweets collected between April 16 and 30 2014
Overall, we analyse more than 29 million tweets with exact locational information,which includes longitude and latitude. The tweets are posted by 575,295 users, equiv-alent to 1% of the population of Sumatra Island.
2http://www.globalforestwatch.org3UN REDD Programme is United Nations Collaboration for Reducing Emissions from Deforestation and Forest
Degradation in Developing Countries

Mining Social Media to Inform Peatland Fire and Haze Disaster Management 7
Jan Feb Mar Apr May Jun Jul Aug Sep Oct Nov Dec
North SumatraSouth SumatraWest SumatraRiauLampungRiau IslandsBangka−BelitungJambiBengkuluAceh
Months
020
0040
0060
0080
0010
000
Num
ber
of H
otsp
ots
(a)
Weeks
020
040
060
080
010
0012
00N
umbe
r of
Hot
spot
s
Jan Feb Mar Apr May Jun Jul Aug Sep Oct Nov Dec
(b)
1 3 5 7 9 11 13 15 17 19 21 23 25 27 29 31
Days
010
020
030
040
050
060
070
0N
umbe
r of
Hot
spot
s
Sumatra Island(incl. Riau Province)Riau Province
(c)
Jan Feb Mar Apr May Jun Jul Aug Sep Oct Nov Dec
North SumatraSouth SumatraWest SumatraRiauLampungRiau IslandsBangka−BelitungJambiBengkuluAceh
Months
Num
ber
of T
wee
ts (
in th
ousa
nds)
010
0020
0030
0040
00
(d)
Fig. 2: Basic characteristics of hotspot and tweet datasets - (a) Monthly hotspots,by province, on Sumatra in 2014, (b) weekly hotspots on Sumatra in 2014, (c)daily hotspots on Sumatra island and in Riau province in March 2014, and (d)monthly tweets by province of Sumatra in 2014 (a) and (d) are best viewed incolor)
3.2 Basic characteristics
Background: Sumatra Island is an area heavily affected by peatland fire and hazeevents, as shown in Figure 1. The central and southern parts of the island experiencemore haze than other areas and in particular, Riau province is recognised as the mosthaze prone area, not only based on the total yearly hotspots, as shown in Figure 2(a),but also based on the number of haze situations reported in the media.
Hotspots: Among other interesting observations, about 5,500 high confidence peatfire hotspots are detected in Riau Province during 2014, while the number of highconfidence peat fire hotspots across Sumatra stands at 7,892 in 2014, which meansalmost 70% of high confidence peat fires take place on less than 19% of the island

8 Mark Kibanov et al.
area, namely Riau province. This leads us to a further investigation, namely of theeffects of haze on the behaviors of people who live in Riau province, the results ofwhich will be discussed in Section 5. It is worth mentioning that there are two mainfire periods on Sumatra Island in 2014: between February and March, and betweenJune and November as shown in Figures 2(a) and 2(b). In particular, Figure 2(b), theweekly hotspot dynamics shows a similar pattern to the monthly pattern provided inFigure 2(a). However, we can find it is similar to monthly dynamics, but there aresome less severely affected weeks in June, July and October and strong irregularityin different scales. Moreover, when we have a close look at hotspots dynamic inMarch, the worst month in 2014 (c.f. Figure 2(c), we find that the hotspots almostdisappeared after evacuation announcement but then emerged again after one week.
Tweets: Comparing Figure 2(d) and Figure 2(a) highlight that the dynamics patternfrom Twitter use in general is different from the patterns of hotspots. The usage ofTwitter on Sumatra Island decreases towards the end of 2014, and the distribution oftweets among the different provinces remains stable during the year.
3.3 Data limitations
This section briefly elaborates four limitations of social media data, the first twoconcern inherent limitations of social media and the other two concern the limitationsof our data in particular. First, the digital divide may introduce a limitation, in thatsocial media data connected to urban areas are considerably denser compared withrural areas and in that the cost of smart phones limits the participation of less affluentcohorts of society. Secondly, there may be some bias connected to the characteristicsof users of social media in that we largely ’hear’ the opinions of younger or moreextrovert users. Thirdly, the number of unique users from our dataset (about 500,000users) equates to approximately 1% of the entire population of Sumatra island; it thusmay also limit our ability to abstract or generalise based on our findings. Fourthly,due to technical issues, our data are incomplete, specifically in January and April2014.
It is, however, worth noting that a key objective of this work is to test the potentialof social media as a complementary data source which can be used to inform human-itarian efforts. The aim is not to produce statistics solely from social media but tosense in near real-time signals on the behaviors of affected populations, which couldbetter inform decision-making and improve the targeting of humanitarian response.We expect that the missing data will not affect the validity of our analysis becausethe missing periods are predominantly outside of the observed haze seasons.
4 Temporal and spatial analysis
In this section, we investigate the temporal and spatial characteristics of tweets relatedto haze and for that, prepare four different datasets by developing four taxonomies re-lated to haze to identify four different haze-related topics, i.e., haze-general, haze-hashtag,haze-impact, and haze-health. We extend a simple taxonomy used for a feasibility
Mining Social Media to Inform Peatland Fire and Haze Disaster Management 9
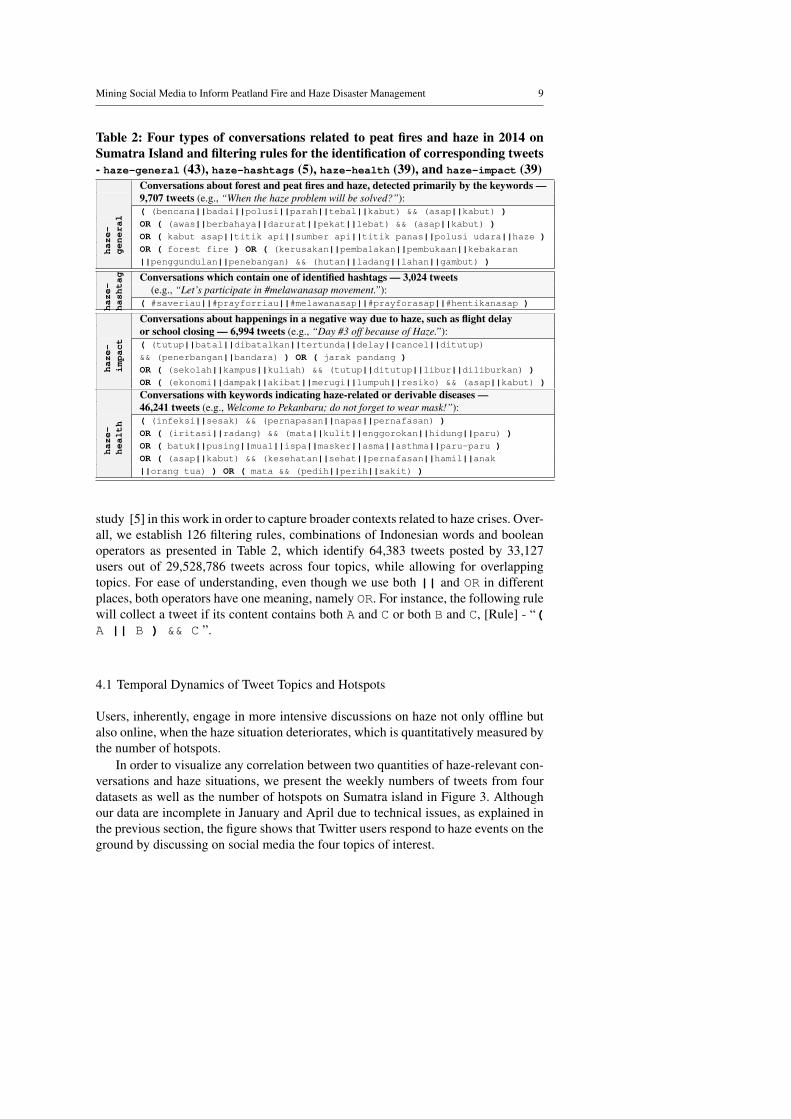
Table 2: Four types of conversations related to peat fires and haze in 2014 onSumatra Island and filtering rules for the identification of corresponding tweets- haze-general (43), haze-hashtags (5), haze-health (39), and haze-impact (39)
Conversations about forest and peat fires and haze, detected primarily by the keywords —9,707 tweets (e.g., “When the haze problem will be solved?”):( (bencana||badai||polusi||parah||tebal||kabut) && (asap||kabut) )OR ( (awas||berbahaya||darurat||pekat||lebat) && (asap||kabut) )OR ( kabut asap||titik api||sumber api||titik panas||polusi udara||haze )OR ( forest fire ) OR ( (kerusakan||pembalakan||pembukaan||kebakaranh
aze-
general
||penggundulan||penebangan) && (hutan||ladang||lahan||gambut) )
Conversations which contain one of identified hashtags — 3,024 tweets(e.g., “Let’s participate in #melawanasap movement.”):
haze-
hashtag
( #saveriau||#prayforriau||#melawanasap||#prayforasap||#hentikanasap )
Conversations about happenings in a negative way due to haze, such as flight delayor school closing — 6,994 tweets (e.g., “Day #3 off because of Haze.”):( (tutup||batal||dibatalkan||tertunda||delay||cancel||ditutup)&& (penerbangan||bandara) ) OR ( jarak pandang )OR ( (sekolah||kampus||kuliah) && (tutup||ditutup||libur||diliburkan) )h
aze-
impact
OR ( (ekonomi||dampak||akibat||merugi||lumpuh||resiko) && (asap||kabut) )Conversations with keywords indicating haze-related or derivable diseases —46,241 tweets (e.g., Welcome to Pekanbaru; do not forget to wear mask!”):( (infeksi||sesak) && (pernapasan||napas||pernafasan) )OR ( (iritasi||radang) && (mata||kulit||enggorokan||hidung||paru) )OR ( batuk||pusing||mual||ispa||masker||asma||asthma||paru-paru )OR ( (asap||kabut) && (kesehatan||sehat||pernafasan||hamil||anak
haze-
health
||orang tua) ) OR ( mata && (pedih||perih||sakit) )
study [5] in this work in order to capture broader contexts related to haze crises. Over-all, we establish 126 filtering rules, combinations of Indonesian words and booleanoperators as presented in Table 2, which identify 64,383 tweets posted by 33,127users out of 29,528,786 tweets across four topics, while allowing for overlappingtopics. For ease of understanding, even though we use both || and OR in differentplaces, both operators have one meaning, namely OR. For instance, the following rulewill collect a tweet if its content contains both A and C or both B and C, [Rule] - “(A || B ) && C ”.
4.1 Temporal Dynamics of Tweet Topics and Hotspots
Users, inherently, engage in more intensive discussions on haze not only offline butalso online, when the haze situation deteriorates, which is quantitatively measured bythe number of hotspots.
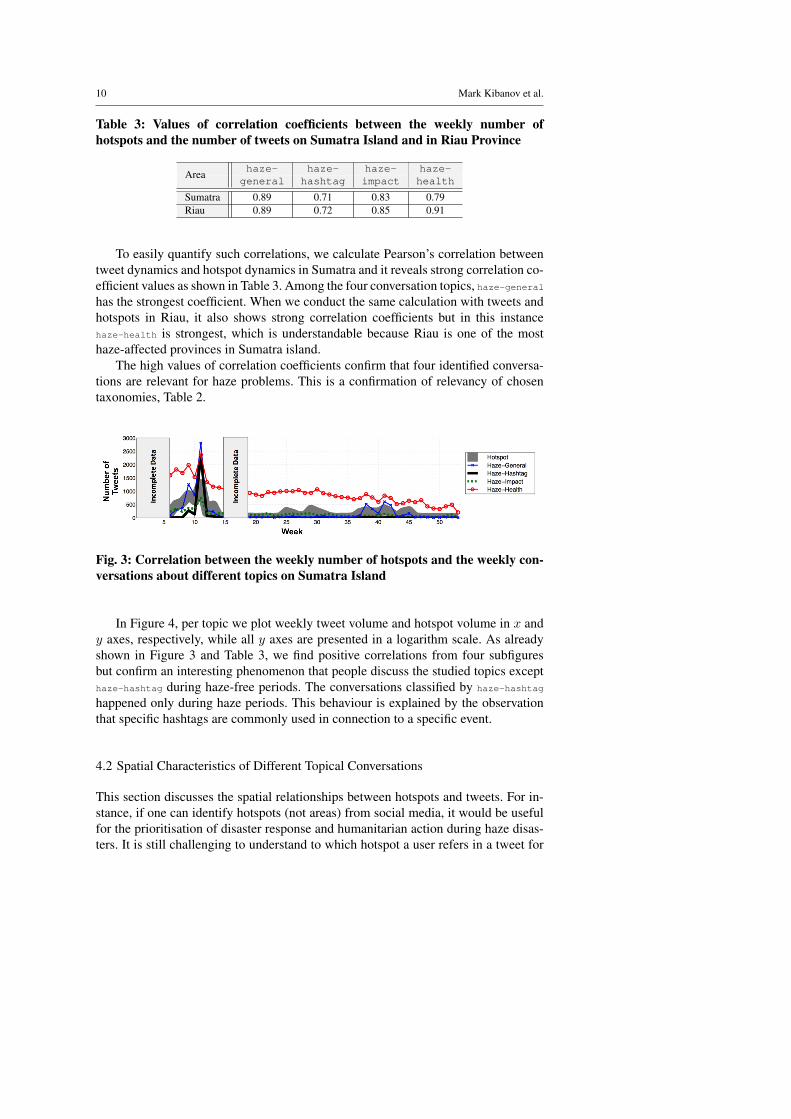
In order to visualize any correlation between two quantities of haze-relevant con-versations and haze situations, we present the weekly numbers of tweets from fourdatasets as well as the number of hotspots on Sumatra island in Figure 3. Althoughour data are incomplete in January and April due to technical issues, as explained inthe previous section, the figure shows that Twitter users respond to haze events on theground by discussing on social media the four topics of interest.
10 Mark Kibanov et al.
Table 3: Values of correlation coefficients between the weekly number ofhotspots and the number of tweets on Sumatra Island and in Riau Province
haze- haze- haze- haze-Areageneral hashtag impact health
Sumatra 0.89 0.71 0.83 0.79Riau 0.89 0.72 0.85 0.91
To easily quantify such correlations, we calculate Pearson’s correlation betweentweet dynamics and hotspot dynamics in Sumatra and it reveals strong correlation co-efficient values as shown in Table 3. Among the four conversation topics, haze-generalhas the strongest coefficient. When we conduct the same calculation with tweets andhotspots in Riau, it also shows strong correlation coefficients but in this instancehaze-health is strongest, which is understandable because Riau is one of the mosthaze-affected provinces in Sumatra island.
The high values of correlation coefficients confirm that four identified conversa-tions are relevant for haze problems. This is a confirmation of relevancy of chosentaxonomies, Table 2.
Fig. 3: Correlation between the weekly number of hotspots and the weekly con-versations about different topics on Sumatra Island
In Figure 4, per topic we plot weekly tweet volume and hotspot volume in x andy axes, respectively, while all y axes are presented in a logarithm scale. As alreadyshown in Figure 3 and Table 3, we find positive correlations from four subfiguresbut confirm an interesting phenomenon that people discuss the studied topics excepthaze-hashtag during haze-free periods. The conversations classified by haze-hashtag
happened only during haze periods. This behaviour is explained by the observationthat specific hashtags are commonly used in connection to a specific event.
4.2 Spatial Characteristics of Different Topical Conversations
This section discusses the spatial relationships between hotspots and tweets. For in-stance, if one can identify hotspots (not areas) from social media, it would be usefulfor the prioritisation of disaster response and humanitarian action during haze disas-ters. It is still challenging to understand to which hotspot a user refers in a tweet for

Mining Social Media to Inform Peatland Fire and Haze Disaster Management 11
●
●
●
●●
●
●●
●
●
●
●●
●
●
●●
●●●
●
●
●
●
●
●
●●
●●
●●●●●
●
●
●
●
●
●
●
●
●
●
●
●
●
●
●●
0 200 400 600 800 1000 1200
510
5020
010
00
Number of Hotspots
Num
ber o
f Con
vers
taio
ns (l
og)
at
(a) haze-general
●
●
●
●
●
●●
●
●
●●
●
● ●
●
●
●●
●
●
●
●
●
●
●
0 200 400 600 800 1000 1200
15
5050
0
Number of Hotspots
Num
ber o
f Con
vers
taio
ns (l
og)
at(b) haze-hashtag
●
●
●
●
●
●
●
●
●●
●
●
●
●●
●
●
●●
●
●
●●
●
●
●
●●
●●
●
●
●●
●●
●
●
●
●
●
●
●●
●●
●
●
●
●
●
0 200 400 600 800 1000 1200
5010
020
050
0
Number of Hotspots
Num
ber o
f Con
vers
taio
ns (l
og)
at
(c) haze-impact
●
●
●●
●
●
●
●
●
●
●
●
●●
●
●
●
●
●
●
●●● ●●
●
● ●
●
●
●
●●●
●●
●
●
●
●
●
●
●
●
●
●
●
●
●
●
●
0 200 400 600 800 1000 1200
500
1000
1500
2500
Number of Hotspots
Num
ber o
f Con
vers
taio
ns (l
og)
at
(d) haze-health
Fig. 4: Number of detected hotspots per week vs. number of conversations (log-scaled)
many reasons. We investigate spatial characteristics using a simple mapping processbased on the distance between the position of a tweet and a hotspot. This still allowsfor interesting insights on spatial characteristics.
We start with an analysis of the corresponding or nearest hotspot of each tweet.The users usually discuss haze and its derived problems such as impact, rather thanhotspots themselves, as hotspots exist far away and are invisible. However, thosehotspots are the origin of the problem. Since people who live closer to a hotspot willbe affected by haze than ones who live farther, we use a simple model that consid-ers the distance from tweets to their nearest hotspot and analyse the correspondingor nearest hotspot of each tweet. Let us say that, given a hotspot h, its popularitypopularity(h) denotes the number of tweets correspondent to h when the hotspot andtweets are identified and posted at the same day, respectively.
12 Mark Kibanov et al.
Popularity0 200 400 600 800 1000
050
100
150
200
250
300
Fre
quen
cy
(a) haze-general
Popularity0 200 400 600 800 1000
020
4060
80F
requ
ency
(b) haze-hashtag
Popularity0 50 100 150 200
050
100
150
Fre
quen
cy
(c) haze-impact
Popularity0 100 200 300 400 500
020
4060
8010
012
014
0F
requ
ency
(d) haze-health
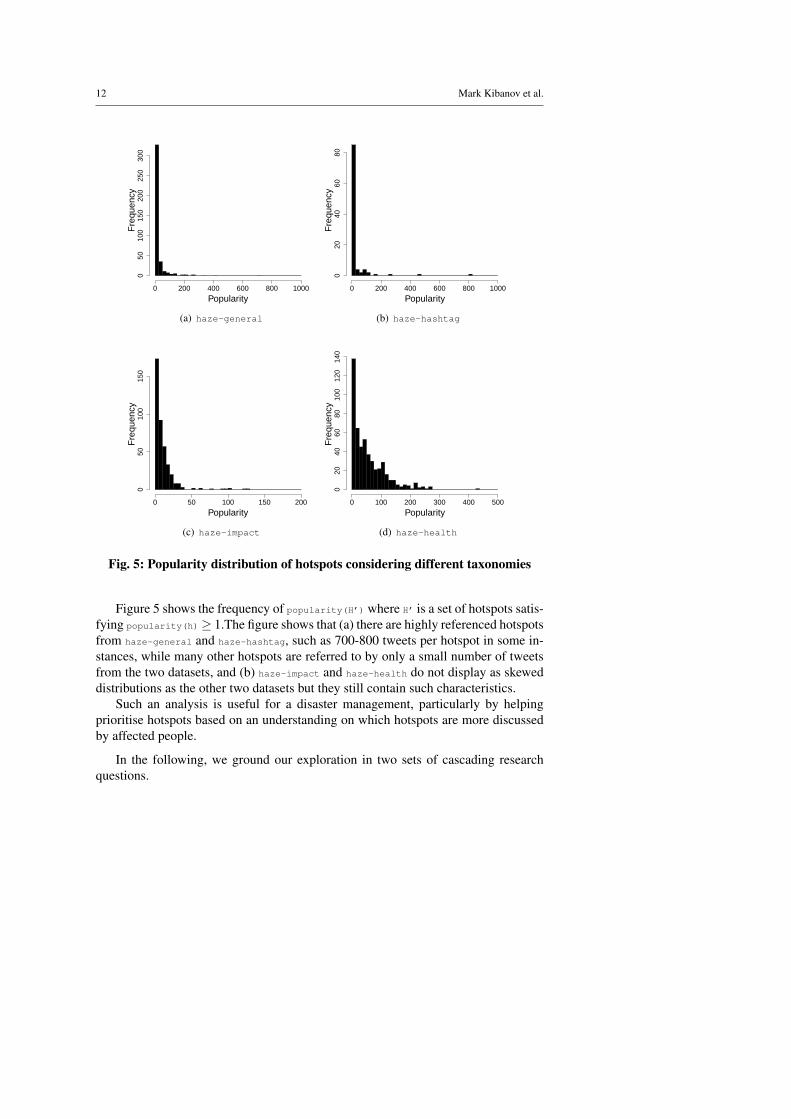
Fig. 5: Popularity distribution of hotspots considering different taxonomies
Figure 5 shows the frequency of popularity(H’) where H’ is a set of hotspots satis-fying popularity(h)≥ 1.The figure shows that (a) there are highly referenced hotspotsfrom haze-general and haze-hashtag, such as 700-800 tweets per hotspot in some in-stances, while many other hotspots are referred to by only a small number of tweetsfrom the two datasets, and (b) haze-impact and haze-health do not display as skeweddistributions as the other two datasets but they still contain such characteristics.
Such an analysis is useful for a disaster management, particularly by helpingprioritise hotspots based on an understanding on which hotspots are more discussedby affected people.
In the following, we ground our exploration in two sets of cascading researchquestions.
Mining Social Media to Inform Peatland Fire and Haze Disaster Management 13
Distance (in km)
Pro
babi
lity
0 500 1000 1500
02x
10−6
4x10
−66x
10−6
8x10
−610
−5 All Tweetshaze−generalhaze−hashtag
(a) haze-general / -hashtag
Distance (in km)
Pro
babi
lity
0 500 1000 1500
02x
10−6
4x10
−66x
10−6
8x10
−610
−5 All Tweetshaze−impacthaze−health
(b) haze-impact / -health
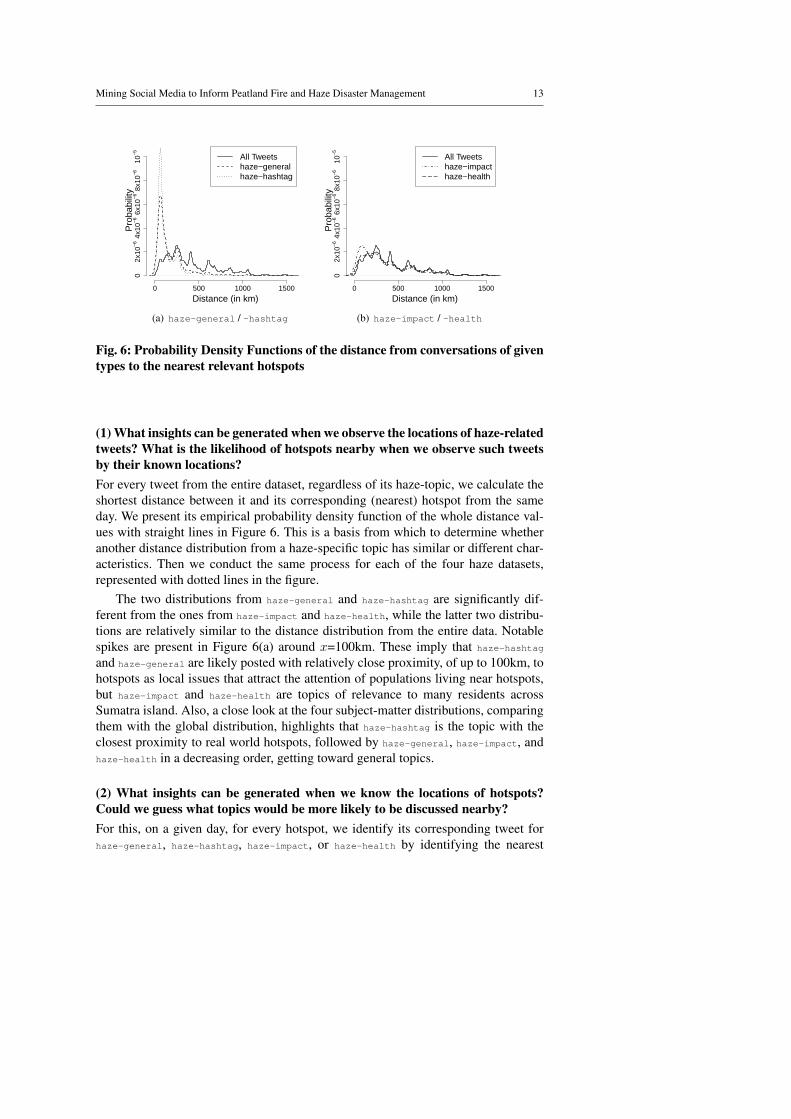
Fig. 6: Probability Density Functions of the distance from conversations of giventypes to the nearest relevant hotspots
(1) What insights can be generated when we observe the locations of haze-relatedtweets? What is the likelihood of hotspots nearby when we observe such tweetsby their known locations?For every tweet from the entire dataset, regardless of its haze-topic, we calculate theshortest distance between it and its corresponding (nearest) hotspot from the sameday. We present its empirical probability density function of the whole distance val-ues with straight lines in Figure 6. This is a basis from which to determine whetheranother distance distribution from a haze-specific topic has similar or different char-acteristics. Then we conduct the same process for each of the four haze datasets,represented with dotted lines in the figure.
The two distributions from haze-general and haze-hashtag are significantly dif-ferent from the ones from haze-impact and haze-health, while the latter two distribu-tions are relatively similar to the distance distribution from the entire data. Notablespikes are present in Figure 6(a) around x=100km. These imply that haze-hashtag
and haze-general are likely posted with relatively close proximity, of up to 100km, tohotspots as local issues that attract the attention of populations living near hotspots,but haze-impact and haze-health are topics of relevance to many residents acrossSumatra island. Also, a close look at the four subject-matter distributions, comparingthem with the global distribution, highlights that haze-hashtag is the topic with theclosest proximity to real world hotspots, followed by haze-general, haze-impact, andhaze-health in a decreasing order, getting toward general topics.
(2) What insights can be generated when we know the locations of hotspots?Could we guess what topics would be more likely to be discussed nearby?For this, on a given day, for every hotspot, we identify its corresponding tweet forhaze-general, haze-hashtag, haze-impact, or haze-health by identifying the nearest

14 Mark Kibanov et al.
Distance (in km)0 200 400 600 800 1000 1200
05x
10−6
1x10
−51.
5x10
−5P
roba
bilit
y
haze−generalNull Model
(a) haze-general
Distance (in km)0 500 1000 1500
02x
10−6
4x10
−66x
10−6
8x10
−6P
roba
bilit
y
haze−hashtagNull Model
(b) haze-hashtag
Distance (in km)
Pro
babi
lity
0 200 400 600 800
02x
10−6
4x10
−66x
10−6
8x10
−610
−5
haze−impactNull Model
(c) haze-impact
Distance (in km)
Pro
babi
lity
0 50 100 150 200 250 300
05x
10−6
1x10
−51.
5x10
−5
haze−healthNull Model
(d) haze-health
Fig. 7: Probability Density Functions of the distance from relevant hotspots tothe nearest conversations of given types
tweet. We present the distance distribution between each hotspot and correspondingtweet along with null models in Figure 7 presented in Probability Density Functions.Note that this differs from the previous section where we investigated, given a tweet,how far it is located to its nearest hotspot.
As a null model for a haze-specific topic (for instance haze-general), for eachdate we randomly select a number of tweets, of the same magnitude as the size of thehaze-specific topic compared to the total tweets posted at the same date. For instance,if n tweets from given category (e. g.,haze-general) and m hotspots were detectedon a given day, we choose n random tweets T from the whole dataset and computedistances from the hotspots to the nearest tweets from T . The final null model for atopic is built from multiple random processes (1,000 times). Numbers of tweets ofeach category is different on different days, so each haze-specific topic may have itsown null model.
Mining Social Media to Inform Peatland Fire and Haze Disaster Management 15
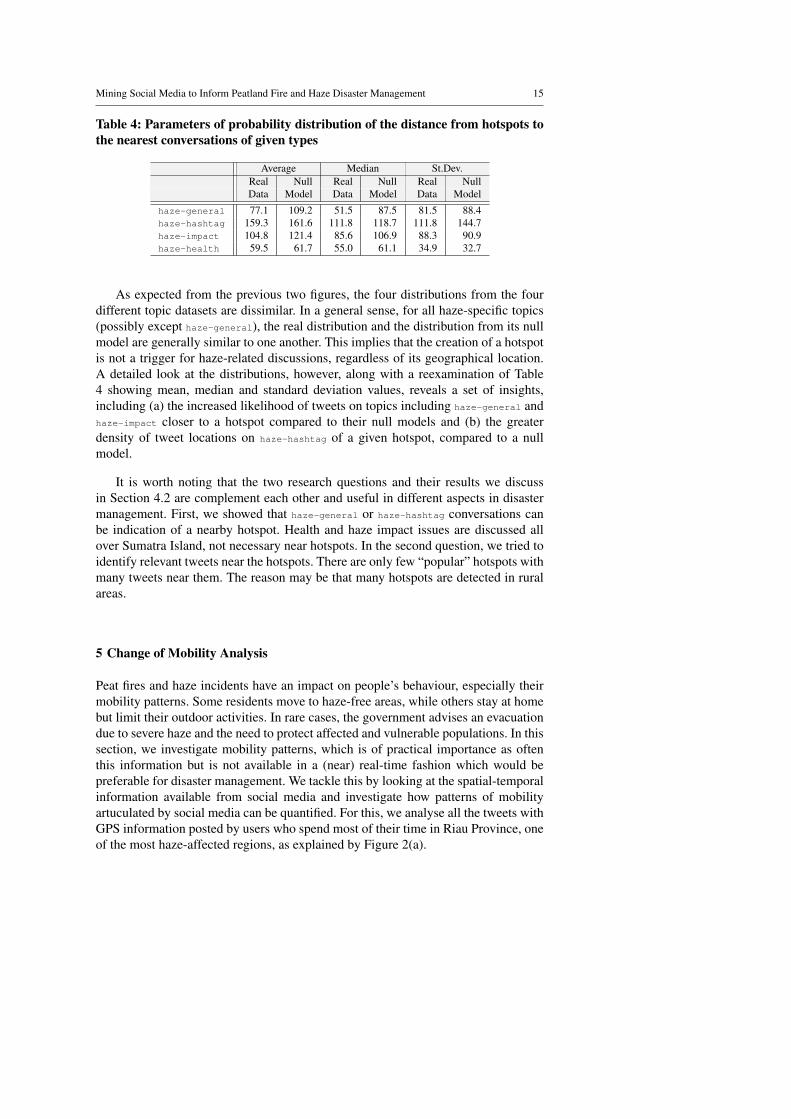
Table 4: Parameters of probability distribution of the distance from hotspots tothe nearest conversations of given types
Average Median St.Dev.Real Null Real Null Real NullData Model Data Model Data Model
haze-general 77.1 109.2 51.5 87.5 81.5 88.4haze-hashtag 159.3 161.6 111.8 118.7 111.8 144.7haze-impact 104.8 121.4 85.6 106.9 88.3 90.9haze-health 59.5 61.7 55.0 61.1 34.9 32.7
As expected from the previous two figures, the four distributions from the fourdifferent topic datasets are dissimilar. In a general sense, for all haze-specific topics(possibly except haze-general), the real distribution and the distribution from its nullmodel are generally similar to one another. This implies that the creation of a hotspotis not a trigger for haze-related discussions, regardless of its geographical location.A detailed look at the distributions, however, along with a reexamination of Table4 showing mean, median and standard deviation values, reveals a set of insights,including (a) the increased likelihood of tweets on topics including haze-general andhaze-impact closer to a hotspot compared to their null models and (b) the greaterdensity of tweet locations on haze-hashtag of a given hotspot, compared to a nullmodel.
It is worth noting that the two research questions and their results we discussin Section 4.2 are complement each other and useful in different aspects in disastermanagement. First, we showed that haze-general or haze-hashtag conversations canbe indication of a nearby hotspot. Health and haze impact issues are discussed allover Sumatra Island, not necessary near hotspots. In the second question, we tried toidentify relevant tweets near the hotspots. There are only few “popular” hotspots withmany tweets near them. The reason may be that many hotspots are detected in ruralareas.
5 Change of Mobility Analysis
Peat fires and haze incidents have an impact on people’s behaviour, especially theirmobility patterns. Some residents move to haze-free areas, while others stay at homebut limit their outdoor activities. In rare cases, the government advises an evacuationdue to severe haze and the need to protect affected and vulnerable populations. In thissection, we investigate mobility patterns, which is of practical importance as oftenthis information but is not available in a (near) real-time fashion which would bepreferable for disaster management. We tackle this by looking at the spatial-temporalinformation available from social media and investigate how patterns of mobilityartuculated by social media can be quantified. For this, we analyse all the tweets withGPS information posted by users who spend most of their time in Riau Province, oneof the most haze-affected regions, as explained by Figure 2(a).
16 Mark Kibanov et al.
5.1 Mobility in General
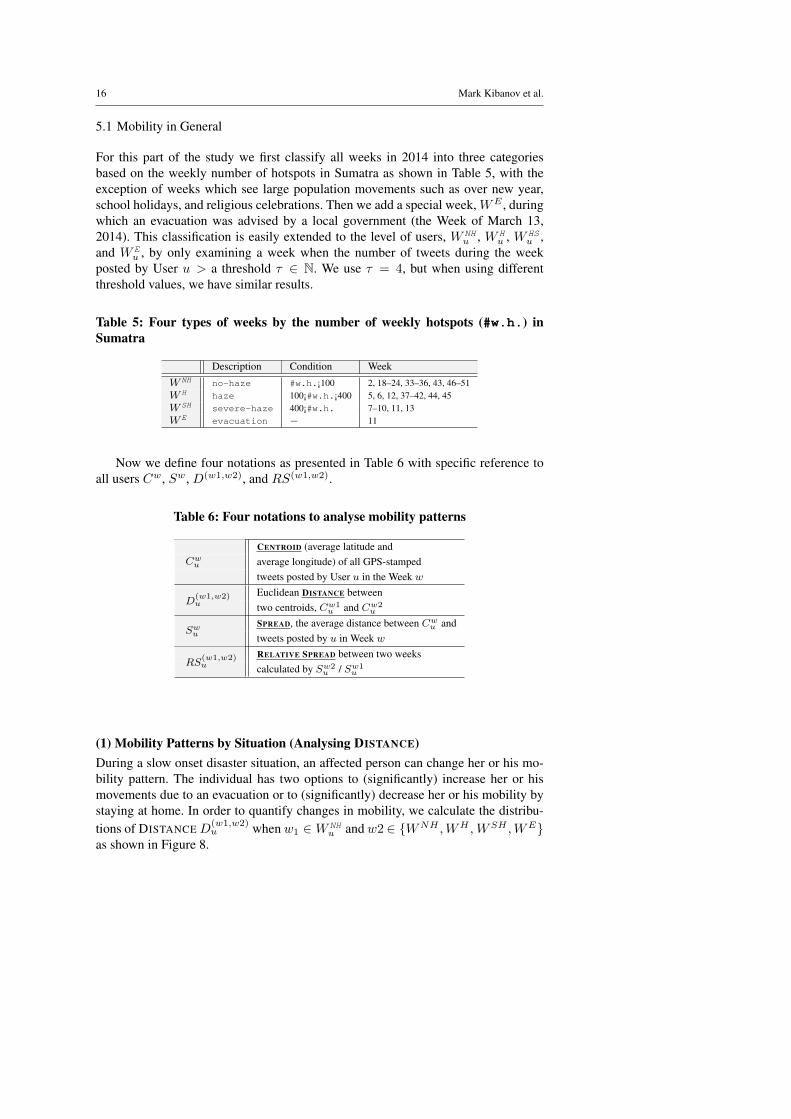
For this part of the study we first classify all weeks in 2014 into three categoriesbased on the weekly number of hotspots in Sumatra as shown in Table 5, with theexception of weeks which see large population movements such as over new year,school holidays, and religious celebrations. Then we add a special week,WE , duringwhich an evacuation was advised by a local government (the Week of March 13,2014). This classification is easily extended to the level of users, W NH
u , W Hu , W HS
u ,and W E
u , by only examining a week when the number of tweets during the weekposted by User u > a threshold τ ∈ N. We use τ = 4, but when using differentthreshold values, we have similar results.
Table 5: Four types of weeks by the number of weekly hotspots (#w.h.) inSumatra
Description Condition Week
W NH no-haze #w.h.¡100 2, 18–24, 33–36, 43, 46–51W H haze 100¡#w.h.¡400 5, 6, 12, 37–42, 44, 45W SH severe-haze 400¡#w.h. 7–10, 11, 13W E evacuation − 11
Now we define four notations as presented in Table 6 with specific reference toall users Cw, Sw, D(w1,w2), and RS(w1,w2).
Table 6: Four notations to analyse mobility patterns
CENTROID (average latitude andaverage longitude) of all GPS-stampedCw
u
tweets posted by User u in the Week w
Euclidean DISTANCE betweenD
(w1,w2)u two centroids, Cw1
u and Cw2u
SPREAD, the average distance between Cwu and
Swu tweets posted by u in Week w
RELATIVE SPREAD between two weeksRS
(w1,w2)u calculated by Sw2
u / Sw1u
(1) Mobility Patterns by Situation (Analysing DISTANCE)During a slow onset disaster situation, an affected person can change her or his mo-bility pattern. The individual has two options to (significantly) increase her or hismovements due to an evacuation or to (significantly) decrease her or his mobility bystaying at home. In order to quantify changes in mobility, we calculate the distribu-tions of DISTANCE D
(w1,w2)u when w1 ∈W NH
u and w2 ∈ {WNH ,WH , WSH ,WE}as shown in Figure 8.

Mining Social Media to Inform Peatland Fire and Haze Disaster Management 17
0.1 1 10 100 10000
0.1
0.2
0.3
0.4
0.5
0.6
0.7
0.8
0.9
1
Distance (km, log scale)
Cum
ulat
ive
Den
sity
Fun
ctio
n (C
DF)
WNH − No HazeWH − HazeWSH − Severe Haze
WNH
WSH
(a) CDF
0.1 0.2 0.3 0.40.5 1 2 3 4 5 100
1%
2%
3%
4%
5%
Distance (km)
Prob
abilit
y
WNH − No HazeWH − HazeWSH − Severe Haze
(b) Histogram when Distance ≤ 10km
100 200 300 400 500 600 700 800 900 1,000
0.01%
0.1%
1%
10%
Distance between two centroid positions (km)
Com
plim
enta
ry C
umul
ativ
eD
ensi
ty F
unct
ion
(CC
DF)
WNH − No HazeWH − HazeWSH − Severe HazeWE − Severe Haze & Evacuation
WH
WH
WE
WSH
(c) CCDF when Distance ≥ 100km
Fig. 8: Distributions of the numbers of users classified by the distance betweentwo centroid positions per situation
Figure 8(a) shows the overall distriburion of D(w1,w2)u using Cumulative Density
Functions (CDFs) for three cases except w2 ∈ WE . Overall people tend to movefurther during a severe haze period, while mobility patterns during periods of (light)haze and no haze are very similar, as implied by the observation that the two distri-
18 Mark Kibanov et al.
butions, WNH and WH , are similar to each other while the distribution for WSH isstretched toward the x-axis in the positive direction.
Considering smaller order mobility of up to 10km, shown in Figure 8(b), we seethat during the haze free weeks (w2 ∈ WNH ) residents make more short-distancemovements than during the weeks with haze, w2 ∈ {WH ,WSH}.
From the tails of the distance distributions in Figure 8(c), an investigation of longdistance movement patterns shows a tendency that some people significantly increasetheir mobility by hundreds of kilometers during evacuation periods and severe hazew2 ∈ {WSH ,WE}, while there is no significant difference between the (light) hazeand no haze periods, w2 ∈ {WNH ,WH}.
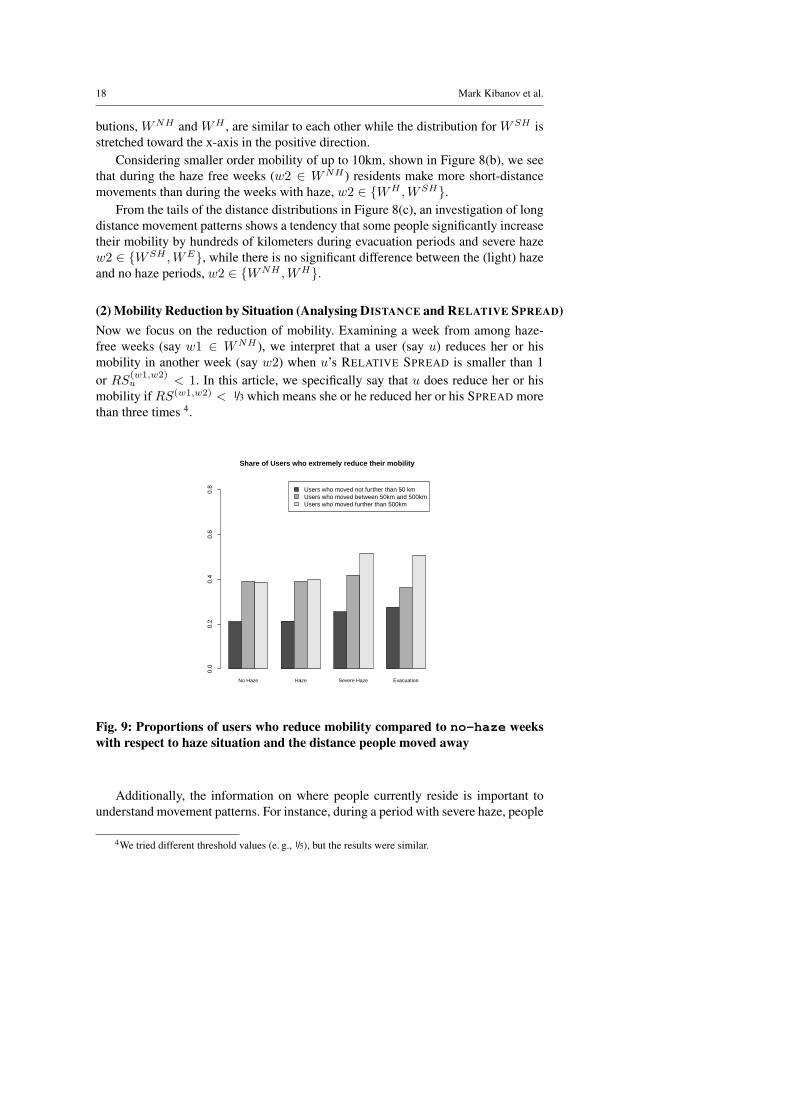
(2) Mobility Reduction by Situation (Analysing DISTANCE and RELATIVE SPREAD)Now we focus on the reduction of mobility. Examining a week from among haze-free weeks (say w1 ∈ WNH ), we interpret that a user (say u) reduces her or hismobility in another week (say w2) when u’s RELATIVE SPREAD is smaller than 1or RS(w1,w2)
u < 1. In this article, we specifically say that u does reduce her or hismobility if RS(w1,w2) < 1/3 which means she or he reduced her or his SPREAD morethan three times 4.
No Haze Haze Severe Haze Evacuation
Users who moved not further than 50 kmUsers who moved between 50km and 500kmUsers who moved further than 500km
Share of Users who extremely reduce their mobility
0.0
0.2
0.4
0.6
0.8
Fig. 9: Proportions of users who reduce mobility compared to no-haze weekswith respect to haze situation and the distance people moved away
Additionally, the information on where people currently reside is important tounderstand movement patterns. For instance, during a period with severe haze, people
4We tried different threshold values (e. g., 1/5), but the results were similar.

Mining Social Media to Inform Peatland Fire and Haze Disaster Management 19
who stay in an affected area may display a different pattern of mobility reductionwhen compared to people who have already evacuated from the area.
Figure 9 summarises people’s mobility behavior changes given two differentweeks in different circumstances, classified by DISTANCE D(w1,w2) and our haze/non-haze scenarios. Of note, the baseline weeks remain as the haze-free week scenario(i.e., w1 ∈WNH ). In other words, we measure, for a given user, to what extent shereduces her mobility in a haze-free week, a haze week and a severe haze week, com-pared to a baseline haze-free week. For instance, the very first bar shows that about20% of users, out of the users who move less than 50km in two haze-free weeks,reduce their mobility, although their mobility patterns are studied in two haze-freeweeks. It means that overall about 20% of users exhibit their mobility patterns withina wide range of variation, even when they still remain in a city (e.g. within a 50kmradius).
This figure shows a couple of interesting points. First, considering people whodo not move far from their previous location, the probability that they noticeably de-crease their mobility (i.e. by a factor of three) is higher during severe haze weeksand evacuation periods (about 25% and 27%, respectively) than during haze freeand moderate haze weeks (about 21%). A similar result will be discussed in Sec-tion 5.2-(2). Second, people that move far away, similar to the above, also reducetheir mobility in the haze and evacuation periods (about 51.4% and 50.6%, respec-tively) compared to the no haze or moderate haze periods (about 38-39%) but theproportion is much larger. The above may imply that although some people move faraway (e.g., more than 500km), expecting fresh air, their movement patterns in theirnew location are decreased. One possible explanation is that moving to an new areanaturally reduces mobility due to the unfamiliarity of the surroundings.
5.2 Mobility Patterns with Ground-truth Situational Data in Riau
The importance of this section is based on a close interpretation of mobility-relatedinformation revealed from social media and real-world situations including air qual-ity, local context such as infrastructure-based connectivity, and people’s custom be-haviors, to qualitatively assess the potential of social media as a complementary datasource. With this purpose, we analyse mobility patterns, taking into account the ad-ministrative boundaries in Riau province, of a set of users (838 users) whose homelocations are identified as Pekanbaru, the capital city of Riau province and the citywith the largest populations in Riau province5 , as well as their tweets (109,096 GPS-stamped tweets).
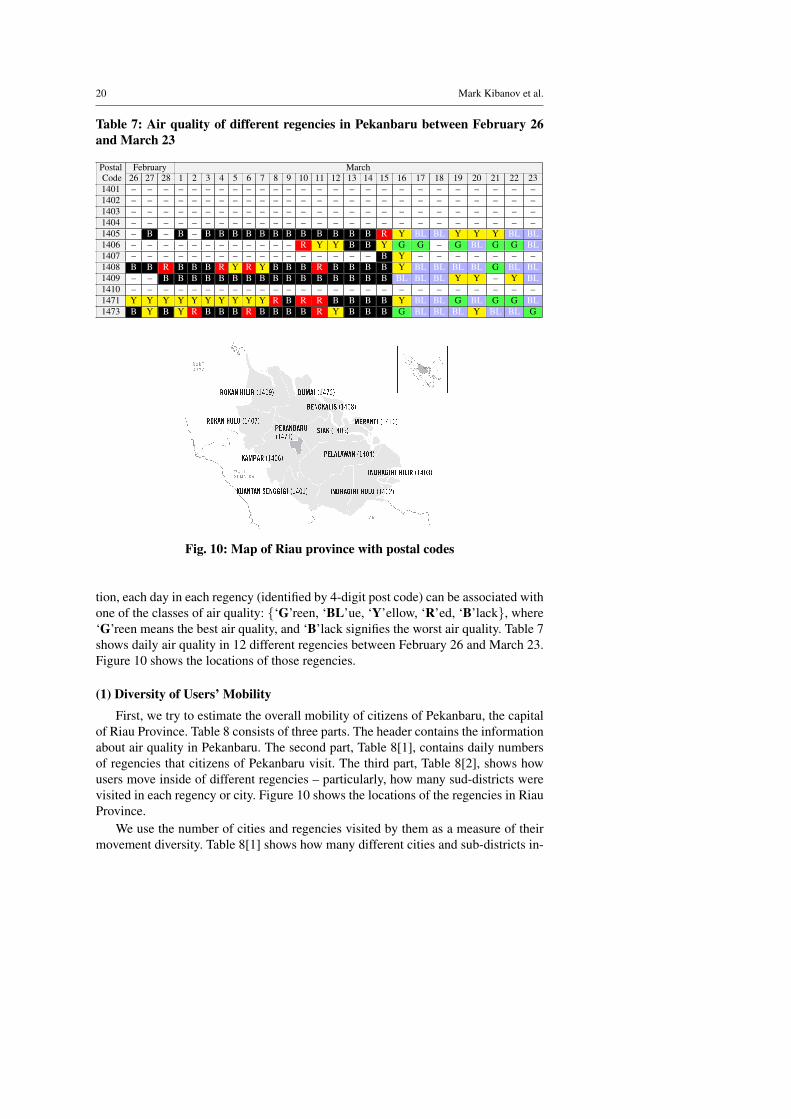
Riau consists of 12 cities and regencies, each of which is identified by a 4-digitpost code; a regency or a city consists of sub-districts. For a detailed study, in thissection, we limit the timespan to include February 26 and March 23, which is exactlywhen the information on air quality, officially published by the Indonesian NationalBoard for Disaster Management [6], is available6. Based on the air quality informa-
5Indonesian Central Bureau of Statisticshttp://riau.bps.go.id/linkTabelStatis/view/id/210
6http://www.menlh.go.id/DATA/ispu riau.PDF
20 Mark Kibanov et al.
Table 7: Air quality of different regencies in Pekanbaru between February 26and March 23
Postal February MarchCode 26 27 28 1 2 3 4 5 6 7 8 9 10 11 12 13 14 15 16 17 18 19 20 21 22 231401 – – – – – – – – – – – – – – – – – – – – – – – – – –1402 – – – – – – – – – – – – – – – – – – – – – – – – – –1403 – – – – – – – – – – – – – – – – – – – – – – – – – –1404 – – – – – – – – – – – – – – – – – – – – – – – – – –1405 – B – B – B B B B B B B B B B B B R Y BL BL Y Y Y BL BL1406 – – – – – – – – – – – – R Y Y B B Y G G – G BL G G BL1407 – – – – – – – – – – – – – – – – – B Y – – – – – – –1408 B B R B B B R Y R Y B B B R B B B B Y BL BL BL BL G BL BL1409 – – B B B B B B B B B B B B B B B B BL BL BL Y Y – Y BL1410 – – – – – – – – – – – – – – – – – – – – – – – – – –1471 Y Y Y Y Y Y Y Y Y Y R B R R B B B B Y BL BL G BL G G BL1473 B Y B Y R B B B R B B B B R Y B B B G BL BL BL Y BL BL G
Fig. 10: Map of Riau province with postal codes
tion, each day in each regency (identified by 4-digit post code) can be associated withone of the classes of air quality: {‘G’reen, ‘BL’ue, ‘Y’ellow, ‘R’ed, ‘B’lack}, where‘G’reen means the best air quality, and ‘B’lack signifies the worst air quality. Table 7shows daily air quality in 12 different regencies between February 26 and March 23.Figure 10 shows the locations of those regencies.
(1) Diversity of Users’ MobilityFirst, we try to estimate the overall mobility of citizens of Pekanbaru, the capital
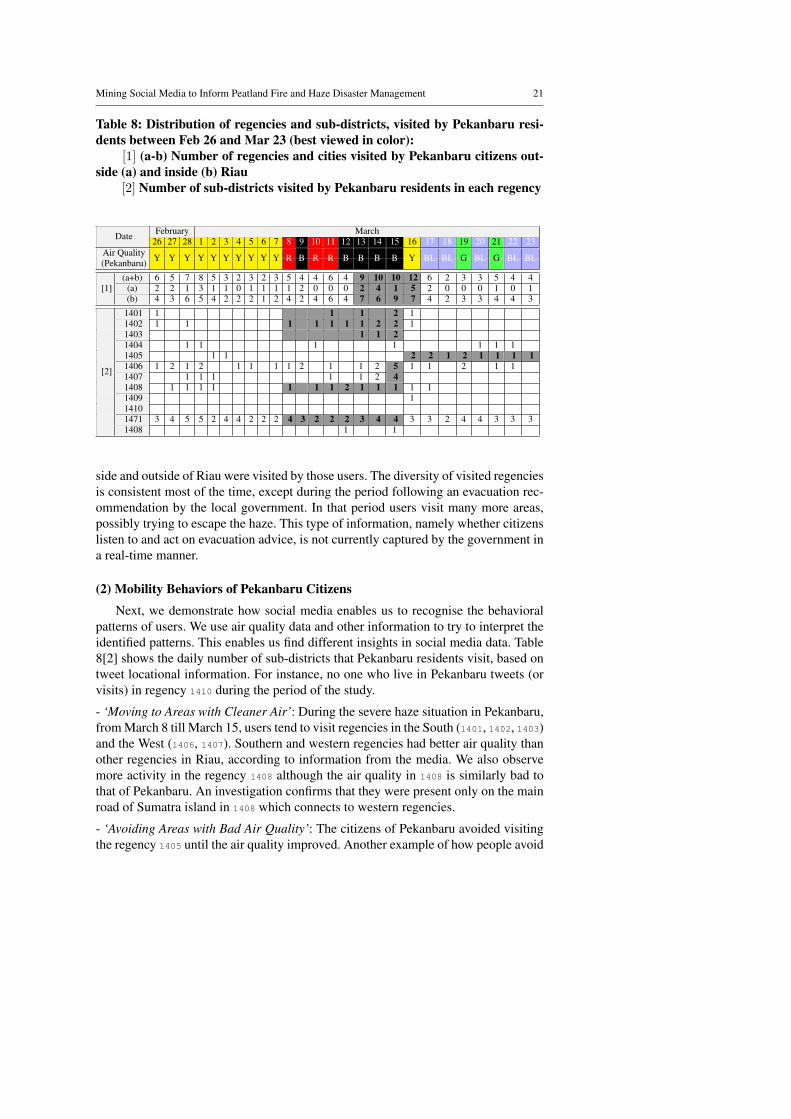
of Riau Province. Table 8 consists of three parts. The header contains the informationabout air quality in Pekanbaru. The second part, Table 8[1], contains daily numbersof regencies that citizens of Pekanbaru visit. The third part, Table 8[2], shows howusers move inside of different regencies – particularly, how many sud-districts werevisited in each regency or city. Figure 10 shows the locations of the regencies in RiauProvince.
We use the number of cities and regencies visited by them as a measure of theirmovement diversity. Table 8[1] shows how many different cities and sub-districts in-
Mining Social Media to Inform Peatland Fire and Haze Disaster Management 21
Table 8: Distribution of regencies and sub-districts, visited by Pekanbaru resi-dents between Feb 26 and Mar 23 (best viewed in color):
[1] (a-b) Number of regencies and cities visited by Pekanbaru citizens out-side (a) and inside (b) Riau
[2] Number of sub-districts visited by Pekanbaru residents in each regency
February MarchDate 26 27 28 1 2 3 4 5 6 7 8 9 10 11 12 13 14 15 16 17 18 19 20 21 22 23Air Quality(Pekanbaru) Y Y Y Y Y Y Y Y Y Y R B R R B B B B Y BL BL G BL G BL BL
(a+b) 6 5 7 8 5 3 2 3 2 3 5 4 4 6 4 9 10 10 12 6 2 3 3 5 4 4[1] (a) 2 2 1 3 1 1 0 1 1 1 1 2 0 0 0 2 4 1 5 2 0 0 0 1 0 1
(b) 4 3 6 5 4 2 2 2 1 2 4 2 4 6 4 7 6 9 7 4 2 3 3 4 4 3
1401 1 1 1 2 11402 1 1 1 1 1 1 1 2 2 11403 1 1 21404 1 1 1 1 1 1 11405 1 1 2 2 1 2 1 1 1 11406 1 2 1 2 1 1 1 1 2 1 1 2 5 1 1 2 1 1[2] 1407 1 1 1 1 1 2 41408 1 1 1 1 1 1 1 2 1 1 1 1 11409 114101471 3 4 5 5 2 4 4 2 2 2 4 3 2 2 2 3 4 4 3 3 2 4 4 3 3 31408 1 1
side and outside of Riau were visited by those users. The diversity of visited regenciesis consistent most of the time, except during the period following an evacuation rec-ommendation by the local government. In that period users visit many more areas,possibly trying to escape the haze. This type of information, namely whether citizenslisten to and act on evacuation advice, is not currently captured by the government ina real-time manner.
(2) Mobility Behaviors of Pekanbaru Citizens
Next, we demonstrate how social media enables us to recognise the behavioralpatterns of users. We use air quality data and other information to try to interpret theidentified patterns. This enables us find different insights in social media data. Table8[2] shows the daily number of sub-districts that Pekanbaru residents visit, based ontweet locational information. For instance, no one who live in Pekanbaru tweets (orvisits) in regency 1410 during the period of the study.
- ‘Moving to Areas with Cleaner Air’: During the severe haze situation in Pekanbaru,from March 8 till March 15, users tend to visit regencies in the South (1401, 1402, 1403)and the West (1406, 1407). Southern and western regencies had better air quality thanother regencies in Riau, according to information from the media. We also observemore activity in the regency 1408 although the air quality in 1408 is similarly bad tothat of Pekanbaru. An investigation confirms that they were present only on the mainroad of Sumatra island in 1408 which connects to western regencies.
- ‘Avoiding Areas with Bad Air Quality’: The citizens of Pekanbaru avoided visitingthe regency 1405 until the air quality improved. Another example of how people avoid

22 Mark Kibanov et al.
areas affected by haze are the regencies 1409 and 1473. These regencies were affectedby haze during the recommended evacuation period, and users also avoid these areasduring that period of time.
2/26 3/8 3/13 3/17 3/230
100
200
300
400
500
1 sub−district2 sub−districts3 sub−districts4+ sub−districts
gggg BLUEGYellow R B R R B B B B Y BLUEG BL
Evacua
&on
Fig. 11: Number of users who visit one, two, three, or over four sub-districts perday in Pekanbaru
- ‘Limited Mobility in Pekanbaru’: According to the Table 8[2], regency 1471 hasnot shown an outstanding dynamical change of the number of sub-districts, while atendency is observed that people limited mobility before and during the severe hazeperiod. For a closer look, we count the number of users who posted in one, two, three,and more than four sub-districts in regency 1471. In Figure 11, we find a tendencythat the number of users who visit one sub-district per day increases and the numberof users who visit two more sub-districts slightly decreases during the severe hazeperiod, and especially after the evacuation order.
5.3 Additional Information related to Mobility Patterns
In this section, we study mobility patterns by analyzing tweets posted by the usersused in previous section, from two different angles, what (possibly) people say andwhat (possibly) people do. Concerning what people say, we collect and analyze thedynamics of tweets over time mentioning two words, ’home’ (rumah) and ’evacua-tion’ (evakuasi, ngungsi). Regarding what people do, we identify two lists of tweetsposted (i) by Foursquare7 and (ii) using web browsers, instead of via a mobile appli-cation, which is part of the meta-information of a tweet, and present its dynamics inFigure 12. Again similar to the results discussed in Section 5, this does not aim toquantify the exact number of people who stay in or evacuate from affected areas butaims to understand whether this information could show any tendency or behaviourchange.
First, two thin lines, depicted in red, show what people say. There are peaksaround March 13 when the government advised residents to evacuate. The two thicker
7http://foursquare.com

Mining Social Media to Inform Peatland Fire and Haze Disaster Management 23
0 1 3 5 7 9 11 13 15 17 19 21 230
50
100
150
200
250
300
"Home" "Evacuation" Web Browser Foursquare
Fig. 12: Numbers of tweets that (a) mention ‘home’ or ‘evacuation’ or (b) areposted using web browsers or from FOURSQUARE
lines, depicted in black, signify behaviour. The number of tweets posted by regularweb browsers clearly increases around March 13, while the number of Foursquarecheck-in around the same period of time slightly decreases. We would be able to ref-erence this information to better understand haze-affected residents’ behaviors andto complement existing and new types of information for disaster response, but thisshould be further validated and evaluated which we leave for future research.
6 Discussion - Applications, Challenges, and Collaborations
We have mined and analysed social media to test its potential to address a real-worldproblem, namely the need to provide (near) real-time situational information on peat-land fire and haze disasters in Indonesia, as complementary information. Meanwhilewe validated our approach and methods with secondary information, such as quanti-tative data, namely hotspot and air quality, contextual information, including typicalevacuation behaviors led by geographical characteristics, and qualitative discussions,namely consultations with officials involved in humanitarian activities in Indonesia,despite limited access to disaster-related data due to the nature of haze disasters. Inthis chapter, we discuss applications and challenges, by examining other informationneeds in local and global contexts, briefly explaining a platform we are building forpolicy-makers based on the results of this analysis, and reviewing research challengesfor the attention of the research community.
(1) Information NeedsHumanitarian action can be characterised by three stages, before , during and after anevent, where the before stage involves disaster preparedness and the development ofearly warning systems, the during stage deals with humanitarian needs during a par-ticular disaster, and the after stage is related to disaster recovery [8]. Even thoughdata and information exist and are commonly used throughout all states8 such as apopulation distribution as baseline information, different sets of data and information
8For instance, IASC Guidelines Common Operational Datasets (CODs) in Disaster Preparedness and Response(Visit - www.humanitarianresponse.info)

24 Mark Kibanov et al.
are required at each stage. Recently social media has been investigated in both anactive mode as a tool for collective knowledge, for instance to map affected areas,assess damage and disseminate information quickly, and in a passive mode such asmining tweets in a humanitarian theatre, for instance to improve an early warningsystem and better understand supply and demand, as we mentioned in Section 2.
Moreover, last year the United Nations adopted the Sendai Framework9, a non-binding agreement for Disaster Risk Reduction as the successor of the Hyogo Frame-work, to better prepare for different natural disasters by providing global guidelines.This framework encourages national disaster management authorities to prioritise na-tional policy agendas for understanding disaster risks and to strengthen disaster riskgovernance. But some countries, including some developing countries, are experi-encing difficulties in implementing aspects of the guidelines, due in part to missinginformation, some of which, our and other research suggests to extract or mine fromnew digital data sources including social media.
(2) A system in progressThroughout this article we see that social media can provide useful information, suchas a better understand of residents’ behavioral changes over time. Section 4 addressesopportunities for before , during and after haze disasters, and Section 5 shows op-portunities for during and after haze disasters. We consulted with officials who havebeen involved in haze disasters who confirmed that this type of information will beuseful for disaster management, but its utility requires further clarification and has tobe improved upon taking into account inputs from local and national governments aswell as UN agencies. Pulse Lab Jakarta is currently building a system to collect, ana-lyze and visualize relevant data and information including from social media, whichwas discussed in this article, not only for providing complementary and supplemen-tary information about haze and peatland fires, but also for assisting in the coordina-tion process between different public bodies, who maintain different datasets relevantto disaster response.
(3) A common research agendaIn this article, we presented the results of analysis connected to a specific disaster,namely haze on the scale witnessed in Indonesia, but from limited angles, for exampleconversations and mobility patterns, while analyzing GPS-stamped social media data.When we broaden the scope to other types of disasters and their associated researchangles and new types of information, many more practical and theoretical researchquestions arise, but few have been addressed to date by the research community.Social media is a data source that many researchers have recently used for quantitativeand qualitative studies of human beings and societies. Clearly, using social media ina passive mode is a task with many challenges, such as whether mined information iscorrect or not, but we see many opportunities to help (potentially) affected people anddisaster management authorities across all three stages of humanitarian action. Thisarticle aims to share these findings with the research community but more importantlyalso aims to refresh this area among researchers and request a collaboration between
9http://www.unisdr.org/we/coordinate/sendai-framework

Mining Social Media to Inform Peatland Fire and Haze Disaster Management 25
the research community and the humanitarian sector. UN Global Pulse wishes tofoster a stronger link between domain specific challenges and research methods fromother disciplines.
7 Summary and Future Work
Haze and peatland fires remain a near annual disaster in Indonesia and South-EastAsia. As the phenomenon affects millions of citizens in Indonesia and beyond, dis-aster management needs significant improvement. We propose to use social media(Twitter) for haze disaster management by extracting complementary and supple-mentary information. We showed how users of Twitter react to haze emergencies andfound correlations between the public discourse on Twitter and peat fire hotspots. Wealso showed how it is possible to understand the changes in users’ travel patterns dur-ing haze periods using social media. We demonstrated that, despite some limitations,social media data can be used to inform disaster management at different stages ofan emergency. We aim to encourage additional work and research in this field. Con-cerning our own research agenda, we hope to extend our data sources and to offerdata-driven solutions for the management of haze disasters.
Acknowledgement
We thank Johan Kieft from UN environment who provided insight about haze dis-asters in Indonesia and George Hodge from Pulse Lab Jakarta for his assistance.Furthermore, we acknowledge the use of FIRMS data and imagery from the Land,Atmosphere Near real-time Capability for EOS (LANCE) system operated by theNASA/GSFC/Earth Science Data and Information System (ESDIS) with funding pro-vided by NASA/HQ.
References
1. Impact of Haze on Health, Singapore Government, Health Promotion Board. Retrieved September 15,2015: http://hpb.gov.sg/hopportal/health-article/hpb051226.
2. Indonesia: number of Twitter users 2014–2019, emarketer. Retrieved January 30:http://www.statista.com/statistics/186337/number-of-mobile-broadband-subscriptions-worldwide-since-2005/.
3. NASA Active Fires, NASA FIRMS. Retrieved August 20, 2015: www.globalforestwatch.org.4. NASA Fire Information for Resource Management System (FIRMS). Retrieved August 20, 2015:
earthdata.nasa.gov/data/near-real-time-data/firms.5. Feasibility Study: Supporting Forest and Peat Fire Management Using Social Media. Technical Re-
port 10, UN Global Pulse, 2014.6. Karhutla riau - ini pembakaran bukan kebakaran. Gema BNPB Ketangguhan Bangsa Dalam Meng-
hadapi Bencana, 5, May 2014.7. F. Abel, C. Hauff, G.-J. Houben, R. Stronkman, and K. Tao. Semantics + Filtering + Search = Twitci-
dent. Exploring Information in Social Web Streams. In Proceedings of the 23rd ACM Conference onHypertext and Social Media, HT ’12, pages 285–294, New York, NY, USA, 2012. ACM.
8. S. Amin and M. Goldstein. Data Against Natural Disasters: Establishing Effective Systems for Relief,Recovery, and Reconstruction. The World Bank, 2008.

26 Mark Kibanov et al.
9. M. Avvenuti, S. Cresci, A. Marchetti, C. Meletti, and M. Tesconi. EARS (Earthquake Alert and ReportSystem): A Real Time Decision Support System for Earthquake Crisis Management. In Proceedingsof the 20th ACM SIGKDD International Conference on Knowledge Discovery and Data Mining, KDD’14, pages 1749–1758, New York, NY, USA, 2014. ACM.
10. M. Avvenuti, S. Cresci, M. N. L. Polla, A. Marchetti, and M. Tesconi. Earthquake emergency man-agement by social sensing. In 2014 IEEE International Conference on Pervasive Computing andCommunications Workshops (PERCOM Workshops), pages 587–592, Mar. 2014.
11. M. A. Cameron, R. Power, B. Robinson, and J. Yin. Emergency Situation Awareness from Twitter forCrisis Management. In Proceedings of the 21st International Conference on World Wide Web, WWW’12 Companion, pages 695–698, New York, NY, USA, 2012. ACM.
12. K. M. Carley, M. Malik, M. Kowalchuk, J. Pfeffer, and P. Landwehr. Twitter Usage in Indonesia.Technical report, Institute for Software Research, School of Computer Science, Carnegie Mellon Uni-versity, Pittsburgh, PA 15213, Dec. 2015.
13. S. Cresci, A. Cimino, F. DellOrletta, and M. Tesconi. Crisis Mapping During Natural Disasters viaText Analysis of Social Media Messages. In J. Wang, W. Cellary, D. Wang, H. Wang, S.-C. Chen,T. Li, and Y. Zhang, editors, Web Information Systems Engineering WISE 2015, number 9419 inLecture Notes in Computer Science, pages 250–258. Springer International Publishing, Nov. 2015.DOI: 10.1007/978-3-319-26187-4 21.
14. E. Frankenberg, D. McKee, and D. Thomas. Health consequences of forest fires in Indonesia. De-mography, 42(1):109–129, Feb. 2005.
15. H. Gao, G. Barbier, and R. Goolsby. Harnessing the Crowdsourcing Power of Social Media forDisaster Relief. IEEE Intelligent Systems, 26(3):10–14, 2011.
16. R. Goolsby. Social Media As Crisis Platform: The Future of Community Maps/Crisis Maps. ACMTrans. Intell. Syst. Technol., 1(1):7:1–7:11, Oct. 2010.
17. P. Holmgren. Fire and haze in Riau: Looking beyond the hotspots. Retrieved September 15, 2015:http://www.eco-business.com/opinion/fire-and-haze-riau-looking-beyond-hotspots/.
18. L. S. Iliadis. A decision support system applying an integrated fuzzy model for long-term forest firerisk estimation. Environmental Modelling & Software, 20(5), May 2005.
19. M. Imran, C. Castillo, F. Diaz, and S. Vieweg. Processing Social Media Messages in Mass Emergency:A Survey. ACM Comput. Surv., 47(4):67:1–67:38, June 2015.
20. M. Imran, C. Castillo, J. Lucas, P. Meier, and S. Vieweg. AIDR: Artificial Intelligence for DisasterResponse. In Proceedings of the 23rd International Conference on World Wide Web, WWW ’14Companion, pages 159–162, Republic and Canton of Geneva, Switzerland, 2014. International WorldWide Web Conferences Steering Committee.
21. M. Imran, S. Elbassuoni, C. Castillo, F. Daz, and P. Meier. Extracting information nuggets fromdisaster- Related messages in social media. In F. F. T. Comes and 10th International ISCRAM Con-ference on Information Systems for Crisis Response and Management, editors, ISCRAM 2013 Con-ference Proceedings 10th International Conference on Information Systems for Crisis Response andManagement, pages 791–801, KIT, Baden-Baden, 2013. Karlsruher Institut fur Technologie.
22. R. K. Jaiswal, S. Mukherjee, K. D. Raju, and R. Saxena. Forest fire risk zone mapping from satelliteimagery and GIS. International Journal of Applied Earth Observation and Geoinformation, 4(1):1–10, Aug. 2002.
23. D.-H. Kim, J. O. Sexton, and J. R. Townshend. Accelerated deforestation in the humid tropics fromthe 1990s to the 2000s. Geophys. Res. Lett., 42(9):3495–3501, May 2015.
24. M. Krstajic, C. Rohrdantz, M. Hund, and A. Weiler. Getting There First: Real-Time Detection ofReal-World Incidents on Twitter. The 2nd Workshop on Interactive Visual Text Analytics: Task-Driven Analysis of Social Media Content, 2012.
25. Y. Kryvasheyeu, H. Chen, N. Obradovich, E. Moro, P. Van Hentenryck, J. Fowler, and M. Cebrian.Rapid assessment of disaster damage using social media activity. Science Advances, 2(3):e1500779–e1500779, Mar. 2016.
26. S. Kumar, G. Barbier, M. A. Abbasi, and H. Liu. TweetTracker: An Analysis Tool for Humanitarianand Disaster Relief. In Proceedings of the Fifth International AAAI Conference on Weblogs and SocialMedia, ICWSM ’11, Menlo Park, California, USA, 2011. AAAI Press.
27. B. Mandel, A. Culotta, J. Boulahanis, D. Stark, B. Lewis, and J. Rodrigue. A Demographic Analysisof Online Sentiment During Hurricane Irene. In Proceedings of the Second Workshop on Language inSocial Media, LSM ’12, pages 27–36, Stroudsburg, PA, USA, 2012. Association for ComputationalLinguistics.
28. S. E. Middleton, L. Middleton, and S. Modafferi. Real-Time Crisis Mapping of Natural DisastersUsing Social Media. IEEE Intelligent Systems, 29(2):9–17, Mar. 2014.

Mining Social Media to Inform Peatland Fire and Haze Disaster Management 27
29. F. Morstatter, N. Lubold, H. Pon-Barry, J. Pfeffer, and H. Liu. Finding Eyewitness Tweets DuringCrises. In Proceedings of the ACL 2014 Workshop on Language Technologies and ComputationalSocial Science, pages 23–27, Baltimore, MD, USA, June 2014. Association for Computational Lin-guistics.
30. T. Oz and H. Bisgin. Attribution of Responsibility and Blame Regarding a Man-made Disaster:#FlintWaterCrisis. In Workshop Social Web for Disaster Management, Indianapolis, USA, Oct. 2016.
31. P. K. Prasetyo, M. Gao, E.-P. Lim, and C. N. Scollon. Social Sensing for Urban Crisis Management:The Case of Singapore Haze. In Social Informatics, number 8238 in Lecture Notes in ComputerScience, pages 478–491. Springer International Publishing, 2013.
32. J. Rogstadius. Enhancing Disaster Situational Awareness Through Scalable Curation of Social Media.PhD thesis, Universidade da Madeira, Madeira, 2014.
33. J. Rogstadius, M. Vukovic, C. Teixeira, V. Kostakos, E. Karapanos, and J. Laredo. CrisisTracker:Crowdsourced social media curation for disaster awareness. IBM Journal of Research and Develop-ment, 57(5):4:1–4:13, Sept. 2013.
34. T. Sakaki, M. Okazaki, and Y. Matsuo. Earthquake Shakes Twitter Users: Real-time Event Detectionby Social Sensors. In Proceedings of the 19th International Conference on World Wide Web, WWW’10, pages 851–860, New York, NY, USA, 2010. International World Wide Web Conferences SteeringCommittee.
35. G. Sakr, I. Elhajj, G. Mitri, and U. Wejinya. Artificial intelligence for forest fire prediction. In 2010IEEE/ASME International Conference on Advanced Intelligent Mechatronics, AIM ’10. Institute ofElectrical & Electronics Engineers (IEEE), 2010.
36. A. Schulz, P. Ristoski, and H. Paulheim. I See a Car Crash: Real-Time Detection of Small ScaleIncidents in Microblogs. In The Semantic Web: ESWC 2013 Satellite Events, number 7955 in LectureNotes in Computer Science, pages 22–33. Springer Berlin Heidelberg, 2013.
37. I. S. Sitanggang and M. H. Ismail. Classification model for hotspot occurrences using a decision treemethod. Geomatics, Natural Hazards and Risk, 2(2):111–121, June 2011.
38. S. Zhang and S. Vucetic. Semi-supervised Discovery of Informative Tweets During the EmergingDisasters. In Workshop Social Web for Disaster Management, Indianapolis, USA, Oct. 2016.

28 Mark Kibanov et al.
Appendix
Table 9: English translation of the filtering rules for the identification of corre-sponding tweets, see Table 2
Conversations about forest and peat fires and haze, detected primarily by the keywords —9,707 tweets (e.g., “When the haze problem will be solved?”):( (disaster||storm||pollution||severe||thick||fog) && (haze)∗)OR ( (danger||alert||emergency||strong||heavy) && (haze)∗)OR ( haze||fire spot||fire source||hotspot||air pollution||haze†)OR ( forest fire†) OR ( (damage||logging‖||open||fireh
aze-
general
||deforestation||logging‖) && (forest||field||land||peat) )
Conversations which contain one of identified hashtags — 3,024 tweets(e.g., “Let’s participate in #melawanasap movement.”):
haze-
hashtag
( #saveriau||#prayforriau||#melawanasap||#prayforasap||#hentikanasap )
Conversations about happenings in a negative way due to haze, such as flight delayor school closing — 6,994 tweets (e.g., “Day #3 off because of haze.”):( (close||cancel||cacelled||delay||delay†||cancel†||closed)&& (flight||airport) ) OR ( visibility )OR ( (school||college||university) && (closed||close||leave||left) )h
aze-
impact
OR ( (economy||impact||effect||loss||down||risk) && (haze)∗)Conversations with keywords indicating haze-related or derivable diseases —46,241 tweets (e.g., Welcome to Pekanbaru; do not forget to wear mask!”):( (infection||stertorous) && (respiratory||breath||breathing) )OR ( (irritation||inflammation) && (eye||skin||throat||nose||lungs‡) )OR ( cough||headache||sick||ari§||mask||asthma||asthma†||lungs‡)OR ( (haze)∗&& (health||healthy||breath||pregnant||child
haze-
health
||elderly) ) OR ( eye && (sore||irritate||acute)¶)
∗“Kabut asap” is translated as “haze”. Both words “kabut” and “asap” are also often used to describehaze. However, if used not together, both words also may have further meanings.†These keywords were originally used in English.‖Both words “pembalakan” and “penebangan” are synonymous and mean “logging”.‡“Paru-paru” is translated as “lungs”. Sometimes, the word “paru” is translated as “lungs” as well.
The word “paru” is ambiguous unless it is put in context with further words, such as “infection”.§ARI stands for Acute Respiratory Infection. We used the abbreviation ISPA (Infeksi Saluran Per-
nafasan Akut) which is commonly used by Indonesian Twitter users.¶All three terms “pedih”, “perih”, “sakit” describe the eye sore.