Embed Size (px)
Citation preview

Issue 79 | November 2019
Minister Didiza Hails the Signing Of the Poultry Master Plan Which Aims To Create More Jobs South Africa’s utilization of the
United States’ AGOA and GSP preferential regimes during 2018
How South Africa’s agricultural sector benefiting from the SADC EPA
2
FOREWORD
Welcome to the seventy-ninth (79th) issue of the Trade Probe publication produced under the Markets and Economic Research Centre (MERC) of the National Agricultural Marketing Council (NAMC). The purpose of this issue is to provide a detailed analysis of the opportunities that might exist in the market and also look at specific products that have a potential increase in the market share. The focus of this issue is to analyse various trade agreements signed or negotiated by South Africa to assess the benefits on the agricultural sector and also explore whether South Africa is utilising or underutilising the trade agreement that is currently running. The trade agreement that is discussed include South Africa’s utilisation of AGOA; and also looked on SADC-EPA if South Africa’s agriculture is benefiting. The objective of the publication is to inform policymakers, producers, traders and other stakeholders about the market opportunities and potential products demanded in the local and foreign markets.
THIS ISSUE OF TRADE PROBE COVERS THE FOLLOWING TOPICS:
Trade Analysis1. Where is South Africa’s agriculture with regards to the African Growth Opportunity Act?2. South Africa’s utilisation of the United States’ AGOA and GSP preferential regimes during 2018: A
case of agricultural products3. How the South African agricultural sector is benefiting from the SADC-EU Economic Partnership Agreement4. Potential of SACU-India preferential trade agreement on South Africa’s agricultural trade
Trade Opportunities5. Market opportunities for South Africa’s maize in Asia6. South Africa’s avocado (HS 080440) gains market access in the European market7. South Africa’s grapes get market opportunities in Africa
Trade News8. Minister Didiza hails the signing of the poultry master plan, which aims to create more jobs9. Importation of regulated agricultural products into the Republic of South Africa during the festive season10. Update on the establishment of the agreement and the status of ACFTA negotiations on phase II.
CONTRIBUTORS:Dr Sifiso NtombelaDr Moses LubingaMr Lucius PhalengMs Fezeka MatebeniMs Onele Tshitiza Mr Thabile NkunjanaMs Pamela MatyoloMs Zosuliwe Kala

3
Trade agreements between countries have been around for centuries. They solidify the trade relationships between countries, in which they stipulate the commitments that they have agreed upon, hold each other accountable and ensure mutual benefit of either country. Countries have links with one other in order to foster cross-border trade, investments and development, to contribute to the development of the lives of their citizens. South Africa is no stranger to trade agreements since it became a democratic country and an open economy post-1994. Such agreements have allowed local businesses to trade in foreign countries and foreign investors to invest in South Africa, creating employment and achieving economic growth. Not all trade agreements come without contention in their implementation, especially when it no longer benefits a country or if another violates the provisions of such conditions as stated in the law. Still, they do have the potential to develop an economy through market access and the benefits can often outweigh the losses. This article seeks to look at the African Growth Opportunity Act of 2000 (AGOA) with the United States of America (USA) in the last ten years and analyse whether it has contributed to the agricultural industry’s trade in South Africa. Agriculture in the context of this article means products under HS code 1-24, 31, 41-43 and 44 unless otherwise stated.
BackgroundThe African Growth Opportunity Act (AGOA) was established in May 2000 to give preferential access to 48 sub-Saharan African countries into the USA market through lower tariffs or no tariffs on some products along 6500 tariff lines with the
goal “to promote stable and sustainable economic growth and development in sub-Saharan Africa” (AGOA, 2000). The USA saw the legislation as an opportunity to encourage trade and investment in sub-Saharan African countries and increase market access into the USA through trade preferences and reduced tariff and non-tariff barriers. The legislation was initially to end in 2008 but was then amended to extend to 2015, and recently extended to 2025. In order for a country to be included as a beneficiary, the President of the USA determines whether the country meets the requirements set out in the Act and other USA trade laws. A country must also be eligible for the United States Generalized System of Preferences (GSP) where its criteria are similar to the AGOA, although complying with the GSP does not guarantee eligibility with the AGOA. The criteria to be eligible according to section 104 of the Act, consists amongst others that the sub-Saharan country has established or made continual progress in implementing a market-based economy where property rights are also protected and the government does not interfere with the economy; the rule of law; eliminating barriers to trade and investment for the USA including resolving trade and investment disputes; economic policies that seek to benefit the welfare of the citizens and develop the economy; combat corruption; protect human rights; and not compromise or support activities that harm the USA. The President of the USA can review the eligibility of each country and further terminate the designation of a country if they deem it is not meeting the requirements.
Where is South Africa’s agriculture with regards to the African Growth Opportunity Act?
By Onele Tshitiza
TRADE ANALYSIS
Author: Ms Onele Tshitiza is an economist under the Trade Research Unit at the National Agricultural Marketing Council. She can be contacted at [email protected] or (012) 341 1115.
TRADE ANALYSIS
4
Has the agreement contributed positively to the South African agricultural industry?According to a report by the Department of International Relations and Cooperation of South Africa (2016), the total tariff revenue that South African exporters were relieved of paying as a result of AGOA was about R2 billion in 2014 and agriculture, in particular, was relieved of paying duties amounting to about R86.3 million. Moreover, a report by Condon & Stern (2011) to investigate the effectiveness of AGOA in increasing trade from least developing countries (LCDs) found that only apparel exports from a small number of LCDs had significant positive gains from AGOA as the coverage was limited. However, the authors argued that in order for most LCDs to have significant positive gains, a full duty-free quota-free access to the USA for all the LCDs, as well as non-restrictive rules of origin, especially on agricultural commodities that were not covered by the AGOA preferences at the time, would likely benefit LCDs. Notably, South Africa exported R84.1 billion worth of products to the USA in 2018, of which R5.1 billion was from agriculture. South Africa imported R72.7 billion worth of products from the USA and agriculture made up R4.1 billion. This means that South Africa had a positive trade balance against the USA in 2018. Some of the top performers of specific agricultural products that have been exported to the
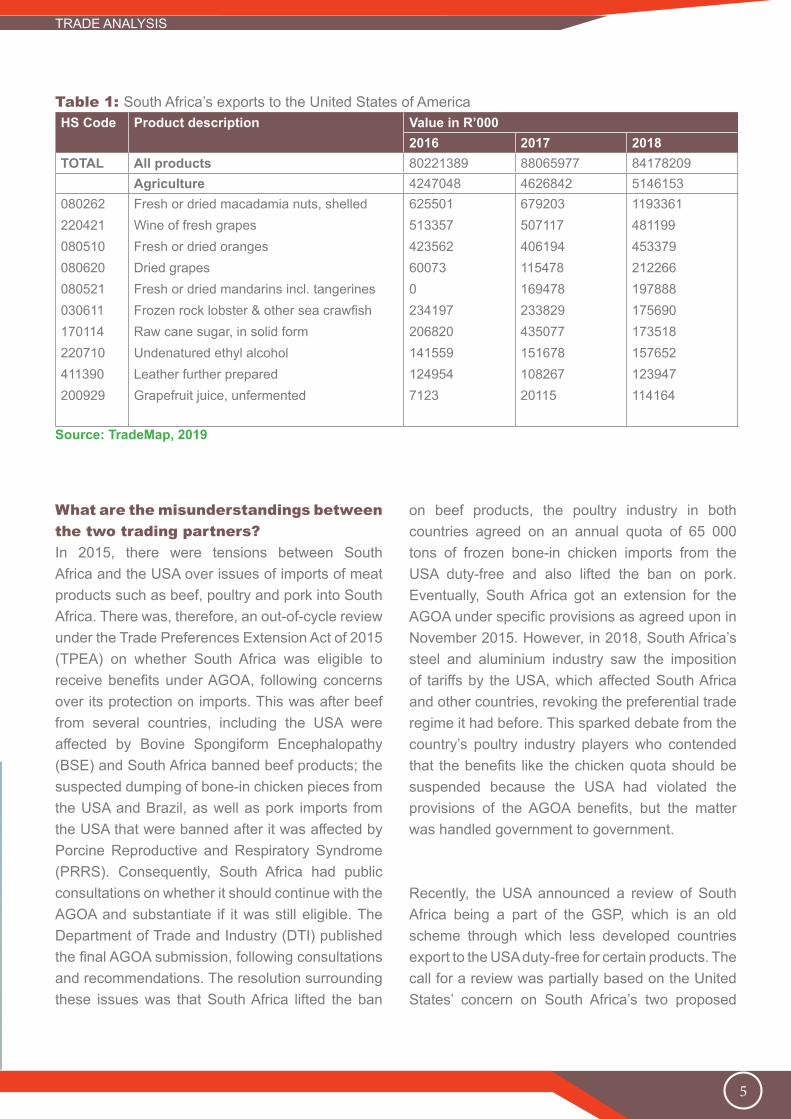
United States of America in the last ten years are wines of fresh grapes, fresh or dried oranges, dried grapes, frozen rock lobster, under-natured ethyl alcohol and leather further prepared after tanning or crusting. Noteworthy is that macadamia nuts have surpassed all these other products in terms of value, although data shows they started trading in 2012. Shelled fresh or dried macadamia nuts exports were worth the largest value in agricultural products in 2018, with a value of R1.19 billion, followed by wine of fresh grapes valued at R481.1 million and fresh or dried oranges (R453.3 million). The data also shows that dried mandarins, including tangerines and satsumas, started being recorded in 2017 and had a value of R169.4 million and R197.8 million in 2018. Raw sugar cane (HS code 170114) is also a case study where export data started showing exports to the USA in 2014, where South Africa exported R266 million worth of sugar and a jump to R435 million in 2017. However, by 2018, the value of raw sugar exports to the USA dropped to R173.5 million. South Africa faces zero ad valorem tariffs on macadamia nuts, while it faces a 19 % tariff rate on raw cane sugar. This is possibly related to the tariffs of the South African sugar industry, which, according to ITC data, charges an estimated average of 51% duty from several countries.
TRADE ANALYSIS
5
Table 1: South Africa’s exports to the United States of AmericaHS Code Product description Value in R’000
2016 2017 2018TOTAL All products 80221389 88065977 84178209
Agriculture 4247048 4626842 5146153080262220421080510080620080521030611170114220710411390200929
Fresh or dried macadamia nuts, shelledWine of fresh grapesFresh or dried orangesDried grapesFresh or dried mandarins incl. tangerinesFrozen rock lobster & other sea crawfishRaw cane sugar, in solid formUndenatured ethyl alcoholLeather further preparedGrapefruit juice, unfermented
6255015133574235626007302341972068201415591249547123
67920350711740619411547816947823382943507715167810826720115
1193361481199453379212266197888175690173518157652123947114164
Source: TradeMap, 2019
What are the misunderstandings between the two trading partners?In 2015, there were tensions between South Africa and the USA over issues of imports of meat products such as beef, poultry and pork into South Africa. There was, therefore, an out-of-cycle review under the Trade Preferences Extension Act of 2015 (TPEA) on whether South Africa was eligible to receive benefits under AGOA, following concerns over its protection on imports. This was after beef from several countries, including the USA were affected by Bovine Spongiform Encephalopathy (BSE) and South Africa banned beef products; the suspected dumping of bone-in chicken pieces from the USA and Brazil, as well as pork imports from the USA that were banned after it was affected by Porcine Reproductive and Respiratory Syndrome (PRRS). Consequently, South Africa had public consultations on whether it should continue with the AGOA and substantiate if it was still eligible. The Department of Trade and Industry (DTI) published the final AGOA submission, following consultations and recommendations. The resolution surrounding these issues was that South Africa lifted the ban
on beef products, the poultry industry in both countries agreed on an annual quota of 65 000 tons of frozen bone-in chicken imports from the USA duty-free and also lifted the ban on pork. Eventually, South Africa got an extension for the AGOA under specific provisions as agreed upon in November 2015. However, in 2018, South Africa’s steel and aluminium industry saw the imposition of tariffs by the USA, which affected South Africa and other countries, revoking the preferential trade regime it had before. This sparked debate from the country’s poultry industry players who contended that the benefits like the chicken quota should be suspended because the USA had violated the provisions of the AGOA benefits, but the matter was handled government to government.
Recently, the USA announced a review of South Africa being a part of the GSP, which is an old scheme through which less developed countries export to the USA duty-free for certain products. The call for a review was partially based on the United States’ concern on South Africa’s two proposed
TRADE ANALYSIS
6
bills on Intellectual Property (IP) protection and enforcement. These bills are the Performers Protection Amendment Bill and the Copyright Amendment Bill, which the USA says could see American companies lose money if South Africa loosens its copyright laws. This is because part of the GSP and AGOA agreement is to also protect the USA’s interests, in this case, intellectual property. The two bills are not finalised yet and the discussions are ongoing. The deliberations concerning any trade issues raised are always handled officially by the two governments and the appropriate channels followed in order to ensure that both countries are aligned and trade disputes are resolved in due time. This becomes important so that any uncertainty is limited and affected role players are assured of a clear way forward.
ConclusionThe world has become well-integrated and cross-border trade has become increasingly important to help achieve economic growth in a country. The African Growth Opportunity Act opened up the USA market for the South African economy and the returns have been substantial. In 2018, South Africa had a positive trade balance of R11.4 billion from trading products with the USA. Positive trade relations and communication are important to ensure that parties involved uphold their end of the agreement. It is through these positive interactions that South Africa and the United States of America have maintained good relations and resolved their differences. The results have been that both economies have gained from trading with each other in one way or another. Tariff barriers for both countries were reduced through AGOA, like South Africa being relieved of approximately R2 billion in tariffs. The AGOA has therefore achieved some of its objectives and continues to facilitate further trade and investment between the two countries.
TRADE ANALYSIS
7
The United States of America (USA) is a key export market, worth approximately R84.2 billion of a number of products from South Africa, both agricultural and non-agricultural. South Africa’s exports benefit from the preferential treatment under two regimes - the African Trade and Opportunities Act (AGOA) and the Generalized System of Preferences (GSP). It is noteworthy to say that to benefit from AGOA. A country should be eligible for the GSP system. Following the forthcoming review of South Africa’s eligibility for duty-free access into the USA, there is much uncertainty of likely outcome. However, if the country seizes to be eligible for the GSP system, South Africa is bound to be negatively affected with regards to the number of products that should access the market duty-free. This implies that South Africa’s exports into the USA will be subjected to a general duty as any other product from other countries, hence the likelihood of stiff competition in the market.
With that brief insight into the current status, it is prudent for South Africa to assess the degree to which the country has been or is utilising the
preferential regimes to gain access into the US market. In this article, the focus is on agricultural imports into the USA for the previous year (2018). The assessment is based on the utilisation rate by import value. By definition, the utilisation rate refers to the ratio of USA’s agricultural imports under either AGOA or GSP preference to imports eligible under all of these regimes. Simply put, it is the extent to which South Africa uses existing preference(s) – AGOA and GSP.
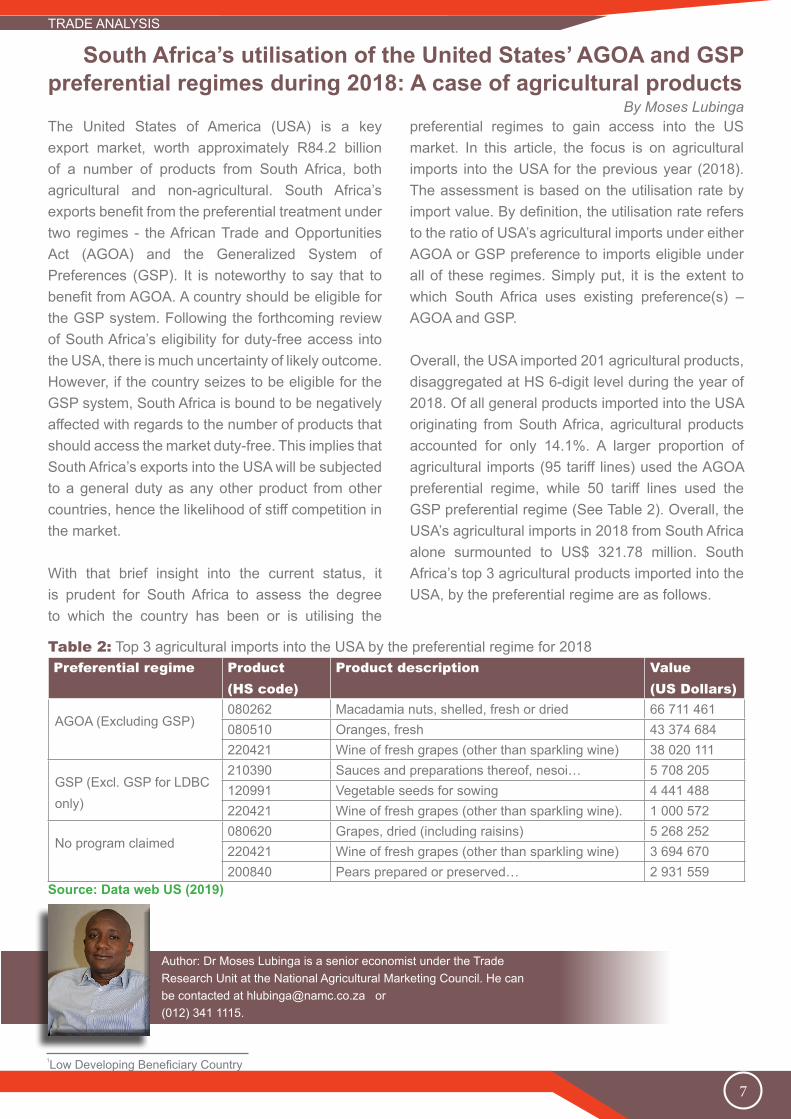
Overall, the USA imported 201 agricultural products, disaggregated at HS 6-digit level during the year of 2018. Of all general products imported into the USA originating from South Africa, agricultural products accounted for only 14.1%. A larger proportion of agricultural imports (95 tariff lines) used the AGOA preferential regime, while 50 tariff lines used the GSP preferential regime (See Table 2). Overall, the USA’s agricultural imports in 2018 from South Africa alone surmounted to US$ 321.78 million. South Africa’s top 3 agricultural products imported into the USA, by the preferential regime are as follows.
South Africa’s utilisation of the United States’ AGOA and GSP preferential regimes during 2018: A case of agricultural products By Moses Lubinga
Table 2: Top 3 agricultural imports into the USA by the preferential regime for 2018Preferential regime Product
(HS code)Product description Value
(US Dollars)
AGOA (Excluding GSP)080262 Macadamia nuts, shelled, fresh or dried 66 711 461080510 Oranges, fresh 43 374 684220421 Wine of fresh grapes (other than sparkling wine) 38 020 111
GSP (Excl. GSP for LDBC only)
210390 Sauces and preparations thereof, nesoi… 5 708 205120991 Vegetable seeds for sowing 4 441 488220421 Wine of fresh grapes (other than sparkling wine). 1 000 572
No program claimed080620 Grapes, dried (including raisins) 5 268 252220421 Wine of fresh grapes (other than sparkling wine) 3 694 670200840 Pears prepared or preserved… 2 931 559
Source: Data web US (2019)
Author: Dr Moses Lubinga is a senior economist under the Trade Research Unit at the National Agricultural Marketing Council. He can be contacted at [email protected] or (012) 341 1115.
TRADE ANALYSIS
1Low Developing Beneficiary Country

8
Although a number of agricultural products are eligible for the various preferential regimes, it is not uncommon to find that some imports into the USA don’t necessarily use the regimes. In 2018, 56 tariff lines were imported into the USA under no special preferential regime (See Table 2) and those products were valued at US$26.92 million. Hence, it’s upon this that utilisation rates are computed for the preferential regimes as presented in Table 3.
Table 3: South Africa’s utilisation rates of preferential regimes granted by the USA in 2018Preferential regime Utilisation rate
AGOA (Excluding GSP) 85%GSP (excluding GSP for LDBC only) 7%Overall (AGOA & GSP) 92%
Source: Author’s own calculations.
It is eminent that South Africa’s agricultural exports into the USA utilise 85% of the AGOA preferential regime, while only 7% is utilized in the case of the GSP. However, given the overlapping nature of these regimes, coupled with the fact that an exporter is at liberty to choose the most preferred regime, an overall utilisation rate was also computed and found to be 92%. The high utilisation rate may be associated with the nature of South Africa’s agricultural products destined for the USA. A larger proportion of the products is not highly processed, thereby implying that the costly and tedious process of meeting the strict rules of origin, which are emphasised by the preferential regimes may not necessarily be a deterrent factor for South Africa’s agricultural products to gain access into the UDSA markets. In conclusion, South Africa makes good use of the preferential regimes, most especially AGOA. Therefore, given the looming review process for South Africa’s eligibility for the GSP and indirectly AGOA; and should the undesirable situation (South Africa becoming ineligible for the preferential treatment) arises, the agricultural sector is bound to lose from the few but rewarding tariff lines from which it benefits at the moment.
TRADE ANALYSIS
9
The European Union (EU) is the major trading partner for most African countries. Its special relationship with Sub-Saharan Africa, as well as with the countries of the Caribbean and the Pacific, dates back to 1963 when the European Economic Community (EEC) was established. Before the conclusion in Cotonou in 2000, there was an intensive public debate. Negotiations started in September 1998 between African, Caribbean and Pacific countries (ACPS) with the European Union (EU). This agreement was successfully negotiated and signed in Cotonou on 23 June 2000 for 20 years (2000-2020). The ACP-EU partnership was designed to establish a comprehensive development and political and economic and trade cooperation.
The ACP-EU does not only introduce a trade pillar; they are organised on regional integration, face challenges aligned to meet the SDGs and debate
on the future of EU-ACP trade relationship. An agreement between a stronger economy and a weaker economy is designed to stimulate economic development in the weaker nation while providing real benefits to the stronger as well. They serve to maintain peace between nations in diverse areas of the world and to increase the standard of living for families in lesser developed nations. Therefore, the article aims to highlight if South Africa is utilising or underutilising the SADC-EPA arrangement looking at untapped potential.
The EPA with SADC was signed in June 2016 to design a comprehensive partnership agreement that will cover trade goods and serves, investment, competition, intellectual property and public procurement and other development with the provision that it will boost the economy between the EU and SADC. EU offered duty and quota-free access to Botswana, Eswatini, Lesotho, Mozambique and Namibia, except for arms and ammunition. However, the EU offered South Africa full liberalisation of 95% of tariff lines, partial liberalisation of around 3% of tariff lines (mostly of agricultural products) and excludes from liberalisation about 2% of tariff lines (Tralac, 2018). Furthermore, SACU countries were offered 85% of their tariff lines, partially 13% of their tariff lines and exclude from liberalisation 2%. In return, the EU has been granted tariff quota by SACU on selected tariff lines in the field of pork, offal,
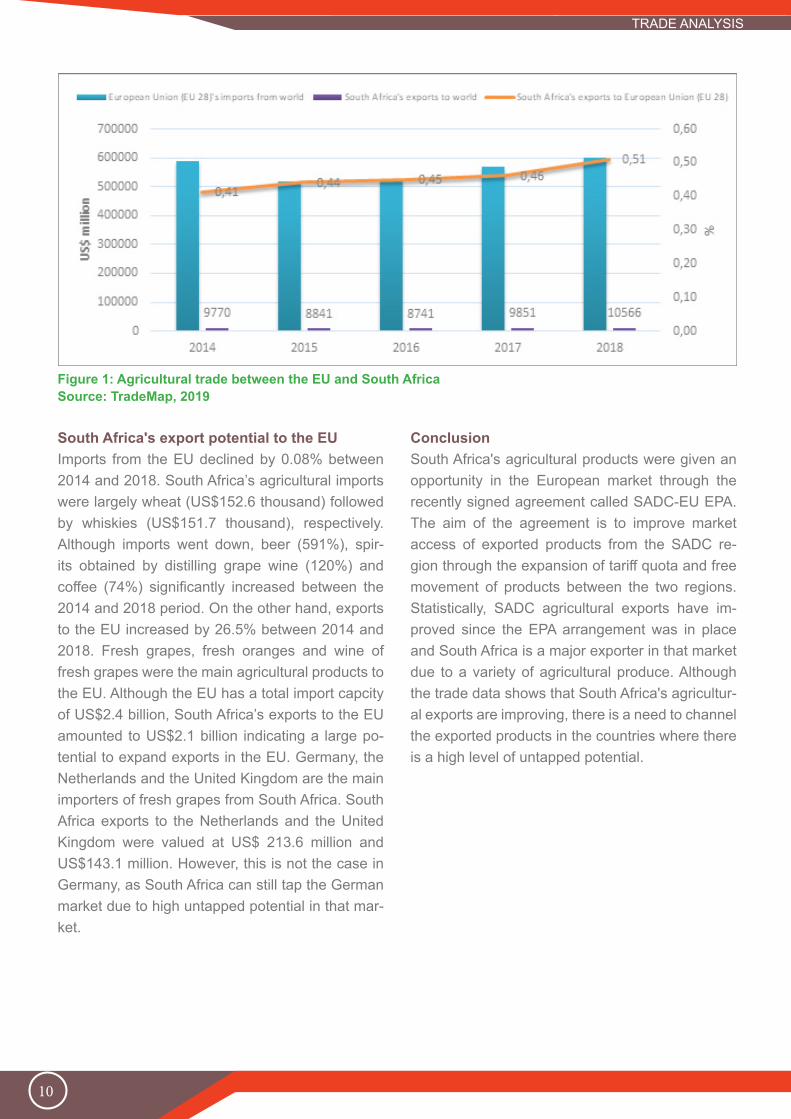
butter, cheese, cereals and ice cream and its fish exports. Agriculture is also one of the sectors that benefit from EPA with improved market access and agricultural provisions. Exports from South Africa to the EU have increased between the period 2014 and 2018. This shows a great market potential for South Africa. Although the EU is the largest market destination for South African agricultural exports, it contributed 0.51% to the EU agricultural imports in 2018. South African agricultural exports to the EU was dominated by table grapes, oranges and wine by US$397 million, US$265 million and US$253 million respectively. EU imports amount to the value of US$600.9 billion in 2018, while South Africa’s exports to the world were recorded at US$10.6 billion.
How the South African agricultural sector is benefiting from the SADC Economic Partnership Agreement
By Fezeka Matebeni
SADC EPA market opportunity as compared to TDCA
TRADE ANALYSIS
Author: Ms Fezeka Matebeni is an economist under the Agro Food Chain Unit at the National Agricultural Marketing Council. he can be contacted at [email protected] or (012) 341 1115.
10
Figure 1: Agricultural trade between the EU and South AfricaSource: TradeMap, 2019
South Africa's export potential to the EUImports from the EU declined by 0.08% between 2014 and 2018. South Africa’s agricultural imports were largely wheat (US$152.6 thousand) followed by whiskies (US$151.7 thousand), respectively. Although imports went down, beer (591%), spir-its obtained by distilling grape wine (120%) and coffee (74%) significantly increased between the 2014 and 2018 period. On the other hand, exports to the EU increased by 26.5% between 2014 and 2018. Fresh grapes, fresh oranges and wine of fresh grapes were the main agricultural products to the EU. Although the EU has a total import capcity of US$2.4 billion, South Africa’s exports to the EU amounted to US$2.1 billion indicating a large po-tential to expand exports in the EU. Germany, the Netherlands and the United Kingdom are the main importers of fresh grapes from South Africa. South Africa exports to the Netherlands and the United Kingdom were valued at US$ 213.6 million and US$143.1 million. However, this is not the case in Germany, as South Africa can still tap the German market due to high untapped potential in that mar-ket.
ConclusionSouth Africa's agricultural products were given an opportunity in the European market through the recently signed agreement called SADC-EU EPA. The aim of the agreement is to improve market access of exported products from the SADC re-gion through the expansion of tariff quota and free movement of products between the two regions. Statistically, SADC agricultural exports have im-proved since the EPA arrangement was in place and South Africa is a major exporter in that market due to a variety of agricultural produce. Although the trade data shows that South Africa's agricultur-al exports are improving, there is a need to channel the exported products in the countries where there is a high level of untapped potential.
TRADE ANALYSIS

11
The preferential trade agreement (PTA) between SACU and India is aimed at boosting south-south trade in a targeted manner and it is more focused on tariff preferences approach compared to free trade agreement (FTA). Negotiations on the SACU-India PTA had commenced in 2007 and progress was made on the legal texts of the main agreement, safeguard and dispute settlement provisions. However, the India-SACU preferential trade agreement is being negotiated and so far, four rounds have been held. The first round of technical discussions for India-SACU PTA took place in Pretoria on 5-6 October 2007, second round of PTA negotiations at Walvis Bay, Namibia on 21-22 Feb. 2008, 3rd round at New Delhi on 25–27 November 2008 and 4th round of negotiations was held in Pretoria on 7-8 October 2009. During the 3rd round of negotiations a Memorandum of Understanding (MOU), a framework mechanism to facilitate negotiations, was also signed on 26 November 2008 by the representatives of India and SACU. During the 4th round of negotiations, India submitted to SACU its initial tariff preference request list and also provided draft SPS & TBT texts to SACU for consideration. The two sides also discussed the text of the agreement, including annexure relating to safeguarding measures and dispute settlement. Market access requests were exchanged in 2011, but concerns had been raised that certain requests from India were in the sensitive clothing sector. (DTI, 2019).
According to WTO, the SACU and India were to negotiate and conclude a PTA. However, there has been little progress in the negotiations. India has on several occasions proposed that SACU agree to an average of preference of 70%. SACU’s consolidated response resulted in a 10% average, very much below what had been proposed. The SACU-India PTA negotiations are still underway. This article aims to assess if the agreement will provide additional secured market access for South Africa’s agricultural goods, giving special treatment in favour of goods exported from South Africa. South Africa is an agricultural country with a good potential to export commodities such as fruits, grains and livestock products to India
The Rooibos Industry adheres to the Agricultural Product Standards Act, 119 of 1990, to regulate the production and export of rooibos and rooibos mixtures of safe rooibos. The Act specifies the type of rooibos to be exported, as well as the quality and the requirements regarding the packing, marking and labelling of rooibos and rooibos mixtures. Through the Perishable Products Export Control Board (PPECB) of South Africa, consumers are assured that rooibos that is exported is safe and has passed the plant health and safety inspection and is certified to be free of bacteria and other impurities. The industry further adheres to the labour laws of South Africa and other international standards in order to export and be recognised by international markets.
Potential of SACU-India preferential trade agreement on South Africa’s agricultural trade
By Lucius Phaleng
Author: Mr Lucius Phaleng is an economist under the Trade Research Unit at the National Agricultural Marketing Council. he can be contacted at [email protected] or (012) 341 1115.
TRADE ANALYSIS
12
Status of agriculture in IndiaAgriculture is the primary source of livelihood for about 58% of India’s population and due to its immense potential for value addition, it has increased its contribution to world food trade every year. The Indian food processing industry accounts for 32% of the country’s total food market, one of the largest industries in India and is ranked fifth in terms of production, consumption, export and expected growth. Digital Innovation in agriculture is one of the major trends to look out for economic growth. Currently, the government is striving hard to streamline its policies, creating necessary infrastructure and commercialising this innovation for the betterment of the masses. India produces more grain crops as compared to other forms of crops.
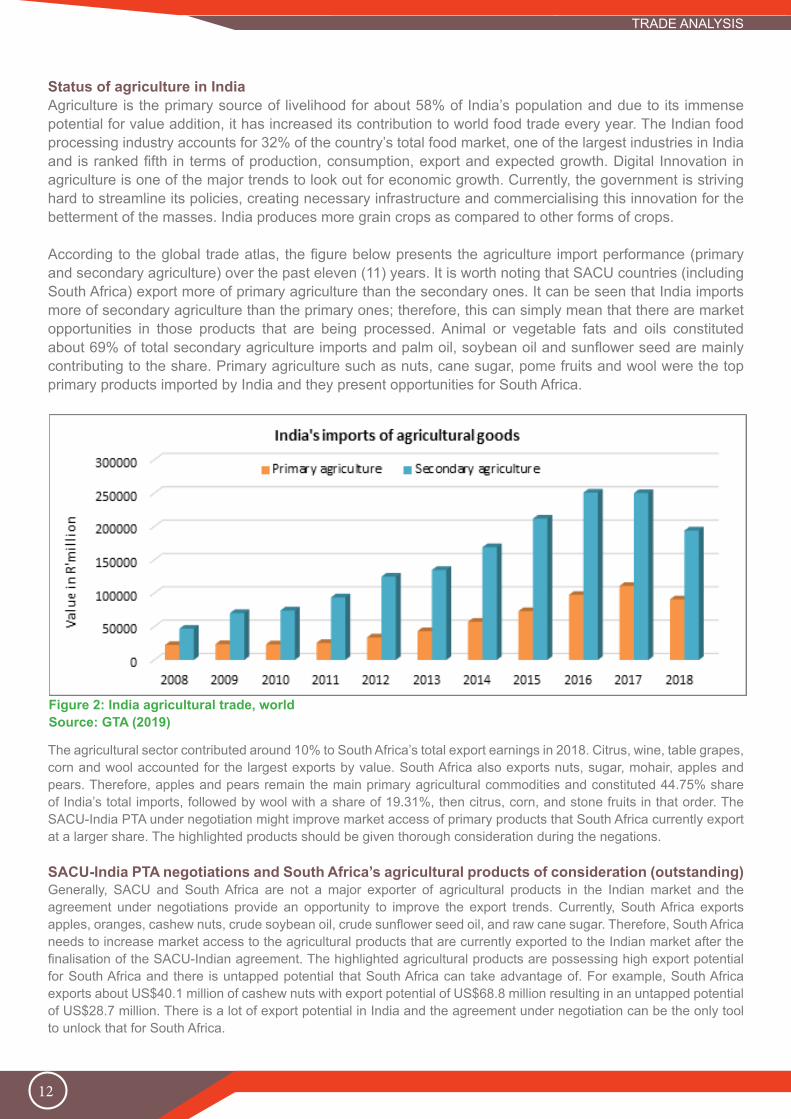
According to the global trade atlas, the figure below presents the agriculture import performance (primary and secondary agriculture) over the past eleven (11) years. It is worth noting that SACU countries (including South Africa) export more of primary agriculture than the secondary ones. It can be seen that India imports more of secondary agriculture than the primary ones; therefore, this can simply mean that there are market opportunities in those products that are being processed. Animal or vegetable fats and oils constituted about 69% of total secondary agriculture imports and palm oil, soybean oil and sunflower seed are mainly contributing to the share. Primary agriculture such as nuts, cane sugar, pome fruits and wool were the top primary products imported by India and they present opportunities for South Africa.
Figure 2: India agricultural trade, worldSource: GTA (2019)
The agricultural sector contributed around 10% to South Africa’s total export earnings in 2018. Citrus, wine, table grapes, corn and wool accounted for the largest exports by value. South Africa also exports nuts, sugar, mohair, apples and pears. Therefore, apples and pears remain the main primary agricultural commodities and constituted 44.75% share of India’s total imports, followed by wool with a share of 19.31%, then citrus, corn, and stone fruits in that order. The SACU-India PTA under negotiation might improve market access of primary products that South Africa currently export at a larger share. The highlighted products should be given thorough consideration during the negations.
SACU-India PTA negotiations and South Africa’s agricultural products of consideration (outstanding)Generally, SACU and South Africa are not a major exporter of agricultural products in the Indian market and the agreement under negotiations provide an opportunity to improve the export trends. Currently, South Africa exports apples, oranges, cashew nuts, crude soybean oil, crude sunflower seed oil, and raw cane sugar. Therefore, South Africa needs to increase market access to the agricultural products that are currently exported to the Indian market after the finalisation of the SACU-Indian agreement. The highlighted agricultural products are possessing high export potential for South Africa and there is untapped potential that South Africa can take advantage of. For example, South Africa exports about US$40.1 million of cashew nuts with export potential of US$68.8 million resulting in an untapped potential of US$28.7 million. There is a lot of export potential in India and the agreement under negotiation can be the only tool to unlock that for South Africa.
TRADE ANALYSIS

13
Figure 3: World’s top 10 maize exporters.Source: ITC, 2019
Grains are the cornerstone of almost every food we consume all around the world and this can be either through direct consumption or through other forms of food. Close to half of total caloric requirements are obtained from grains. Tons of grains are consumed all over the world, but only maize, wheat and rice are majorly used for human consumption as they account for 94% of all cereals (Ranum et al., 2014). Other than for food purposes, maize, for example, is used as animal feed, for seed and industrial purposes as well as to generate ethanol for alcohol production and fuel for cars. Asian countries produce various agricultural products, of which most are majorly used for domestic consumption while the surplus is exported. Like the rest of the world, most important cereals and grains form a major part of agricultural products such as rice, wheat, maize; soybeans and barley are produced across Asia. Nevertheless, most of these products are imported to Asian countries despite them producing those, due to high demand. Asia is the third most important market for all South Africa’s agricultural exports commanding 25% of the share of agricultural exports in 2018 after
Africa, which stood at 39% of export share in 2018. Wool, fruit, grains, beverages, vegetables and meat were major products exported to Asia. However, this section will focus on exploring market opportunities for South Africa’s yellow maize within the Asian countries. A global perspective on maize tradeProductivity and efficiency determine which country loses its share in the global market as it has been experienced in the past. Figure 3 presents the leading global exporters of maize over the past three years. Data from the United States department of agriculture shows that the USA (48.26 million tons) is by far the biggest maize exporter in the world followed by Brazil at 36 million tons, Argentina at 33.50 million tons and Ukraine at 30 million tons, in that order, among others. Canada’s production has been affected negatively by snow in recent times and this was also reported for 2019 by the Council of Canadian Academies. South Africa’s drought presents uncertainty for 2019/2020 season.
Market opportunities for South Africa’s maize in Asia By Thabile Nkunjana
TRADE OPPORTUNITIES
14
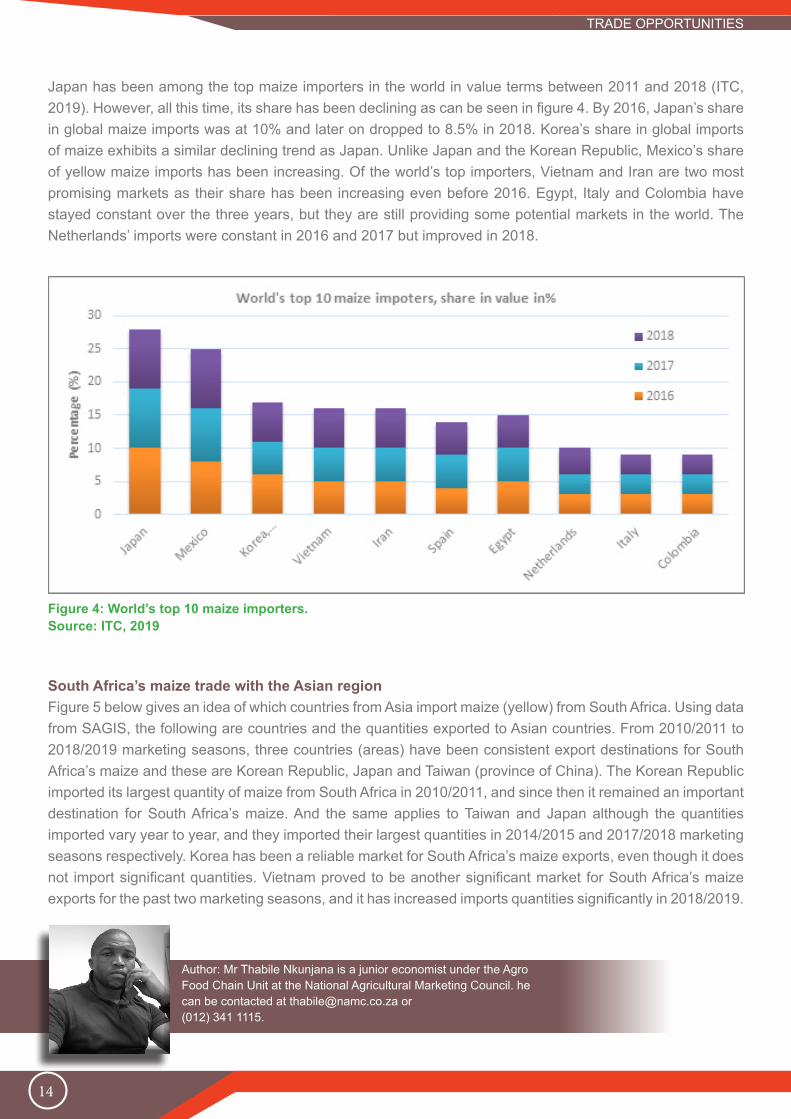
Japan has been among the top maize importers in the world in value terms between 2011 and 2018 (ITC, 2019). However, all this time, its share has been declining as can be seen in figure 4. By 2016, Japan’s share in global maize imports was at 10% and later on dropped to 8.5% in 2018. Korea’s share in global imports of maize exhibits a similar declining trend as Japan. Unlike Japan and the Korean Republic, Mexico’s share of yellow maize imports has been increasing. Of the world’s top importers, Vietnam and Iran are two most promising markets as their share has been increasing even before 2016. Egypt, Italy and Colombia have stayed constant over the three years, but they are still providing some potential markets in the world. The Netherlands’ imports were constant in 2016 and 2017 but improved in 2018.
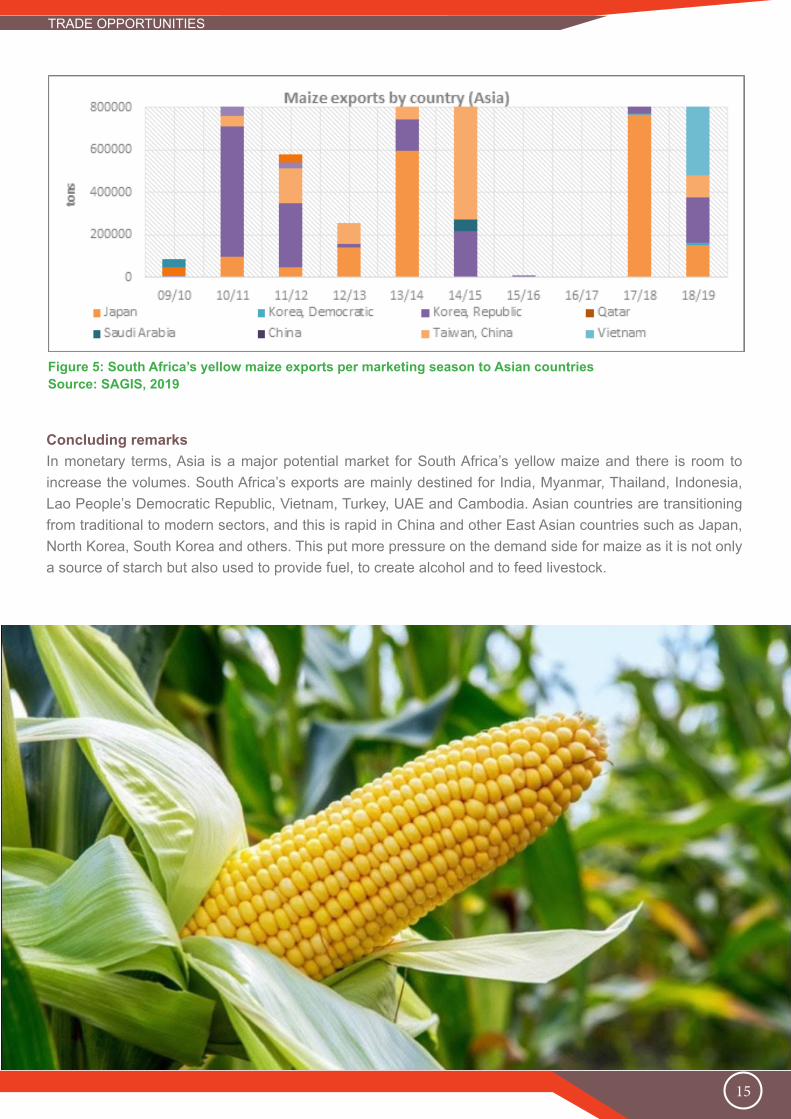
South Africa’s maize trade with the Asian regionFigure 5 below gives an idea of which countries from Asia import maize (yellow) from South Africa. Using data from SAGIS, the following are countries and the quantities exported to Asian countries. From 2010/2011 to 2018/2019 marketing seasons, three countries (areas) have been consistent export destinations for South Africa’s maize and these are Korean Republic, Japan and Taiwan (province of China). The Korean Republic imported its largest quantity of maize from South Africa in 2010/2011, and since then it remained an important destination for South Africa’s maize. And the same applies to Taiwan and Japan although the quantities imported vary year to year, and they imported their largest quantities in 2014/2015 and 2017/2018 marketing seasons respectively. Korea has been a reliable market for South Africa’s maize exports, even though it does not import significant quantities. Vietnam proved to be another significant market for South Africa’s maize exports for the past two marketing seasons, and it has increased imports quantities significantly in 2018/2019.
Figure 4: World’s top 10 maize importers.Source: ITC, 2019
Author: Mr Thabile Nkunjana is a junior economist under the Agro Food Chain Unit at the National Agricultural Marketing Council. he can be contacted at [email protected] or (012) 341 1115.
TRADE OPPORTUNITIES
15
Concluding remarksIn monetary terms, Asia is a major potential market for South Africa’s yellow maize and there is room to increase the volumes. South Africa’s exports are mainly destined for India, Myanmar, Thailand, Indonesia, Lao People’s Democratic Republic, Vietnam, Turkey, UAE and Cambodia. Asian countries are transitioning from traditional to modern sectors, and this is rapid in China and other East Asian countries such as Japan, North Korea, South Korea and others. This put more pressure on the demand side for maize as it is not only a source of starch but also used to provide fuel, to create alcohol and to feed livestock.
Figure 5: South Africa’s yellow maize exports per marketing season to Asian countriesSource: SAGIS, 2019
TRADE OPPORTUNITIES

16
Avocado has become one of the world’s trendiest fruits and a favourite “superfood” in recent years. This trend continues to grow as consumers develop new healthy eating habits. Avocado is known for its bountiful benefits as the food is packed with a high level of vitamins, minerals, antioxidants and other photo-chemicals. It is ranked as the 6th most imported fruit in the world after bananas, grapes, apples, oranges and almonds (ITC, 2018). Approximately 76% of avocados are produced in America, 11% in Africa, 9% in Asia and 2% in both Europe and South Pacific. So far, Mexico is the world’s largest producer and exporter of avocados with an approximation of 1.5 million tons out of global production of 3.2 million tons as of 2018. In Africa, the largest producers of avocado include South Africa with approximately 170 000 tons and Kenya with an estimation of 80 000 tons.
Global perspective of AvocadoTable 4 illustrates the world’s leading importers of avocados between 2014 and 2018 measured in thousand tons. The imports of avocados have increased significantly by 63% between 2014 and 2018. The United States is ranked as the largest importer of avocado accounting for 42% share globally, followed by the Netherlands (10%), France (6%), Spain (5%), UK (5%), Canada (4%), Germany (4%), Japan (3%) and China (2%). China had an overwhelming growth rate of 979% between 2014 and 2018. Reports indicated that China’s demand for avocados has been increasing steadily in the last few years fueled by the rising middle class and changing dietary patterns.
Importers Imported quantity in '000 tons Share % Growth %2014 2018 2018 2014-2018
World 1 530 2 500 100 63United States of AmericaNetherlandsFranceSpainUnited KingdomCanadaGermanyJapanChina
72914312053536138584
1 03825815712911894937444
42106554432
4280311451215414729979
South Africa’s avocado (HS 080440) gains market access in the European market By Zosuliwe Kala
TRADE OPPORTUNITIES
Source: TradeMap (2019)
Author: Ms Zosuliwe Kala is a junior economist under the Trade Research Unit at the National Agricultural Marketing Council. She can be contacted at [email protected] or (012) 341 1115.

17
Table 5 shows the world’s leading exporters of avocados between 2014 and 2018 measured in thousand tons. Global avocado exports s increased by 72% from 1.4 million tons in 2014 to 2.4 million tons in 2018. It is worth noting that the top ten exporters of avocados accounted for 92% of the world’s exports in 2018. By quantity, Mexico was the world’s largest exporter of avocados accounting for 45% share in 2018, followed by Peru (15%), the Netherlands (10%), Chile (4%), and Spain (4%). Out of all the top 10 leading exporters, South Africa and Kenya were the only African countries exporting avocados, accounting for 4% and 3% respectively. Between 2014 and 2018 South Africa’s exports increased by 36%, thereby ranked the 6th largest exporter in 2018.
Table 5: World’s leading exporters of avocado (HS 080440) Importers Exported quantity in '000 tons Share % Growth %
2014 2018 2018 2014-2018World 1 415 2 432 100 72MexicoPeruNetherlandsChileSpainSouth AfricaKenyaUnited States of AmericaDominican RepublicColombia
64917910711274662937192
1 0923592461331088972683630
4515105443311
68101130194635
1488489
1400Source: TradeMap (2019)
South Africa’s exports of avocados to European countries. South Africa holds a prominent place in the product’s global export market. As the world and its consumers have grown more health-conscious, the demand for avocados has risen, causing a rise in the income generated from South Africa’s avocado exports. Europe is the main export market accounting for 94% of the total of South Africa’s avocado exports. With Europe, the Netherlands constituted 68% of SA’s exports, followed by United Kingdom (16.6%), Spain (5.9%), Russian Federation (1.8%) and Portugal (1%) respectively.
Figure 6: Leading importers from Europe of Avocados exported by South AfricaSource: TradeMap (2019)
TRADE OPPORTUNITIES
18
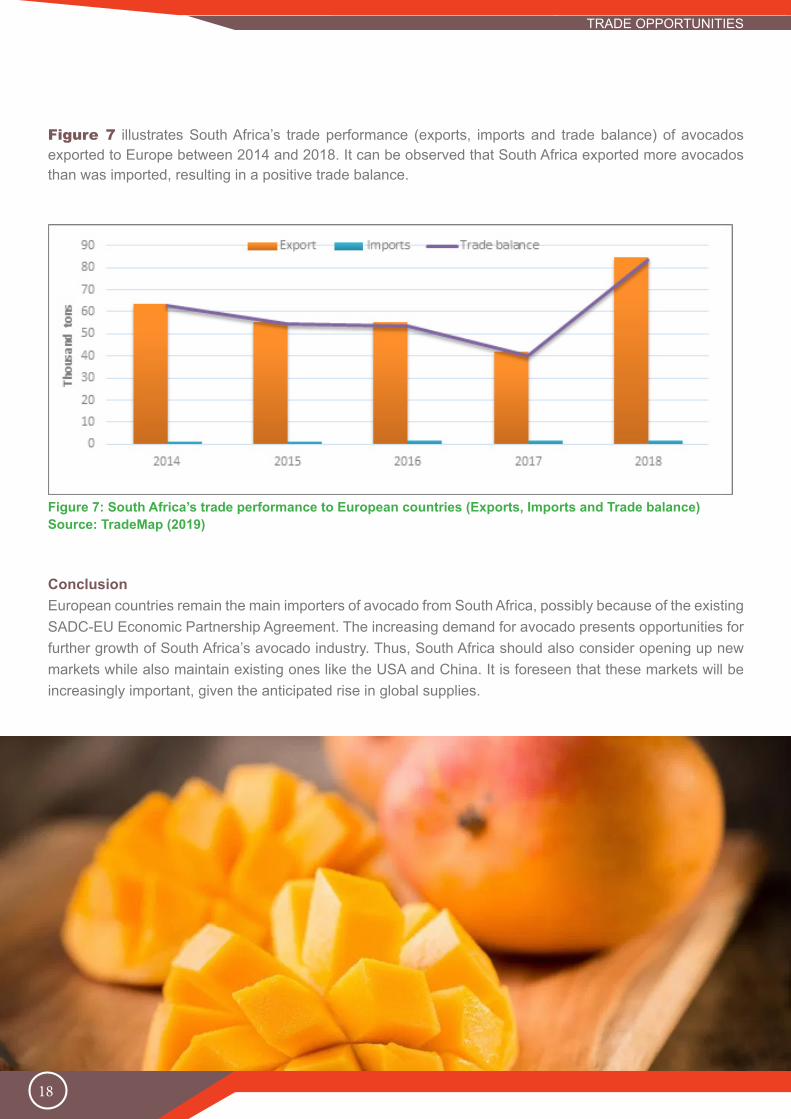
Figure 7 illustrates South Africa’s trade performance (exports, imports and trade balance) of avocados exported to Europe between 2014 and 2018. It can be observed that South Africa exported more avocados than was imported, resulting in a positive trade balance.
ConclusionEuropean countries remain the main importers of avocado from South Africa, possibly because of the existing SADC-EU Economic Partnership Agreement. The increasing demand for avocado presents opportunities for further growth of South Africa’s avocado industry. Thus, South Africa should also consider opening up new markets while also maintain existing ones like the USA and China. It is foreseen that these markets will be increasingly important, given the anticipated rise in global supplies.
Figure 7: South Africa’s trade performance to European countries (Exports, Imports and Trade balance)Source: TradeMap (2019)
TRADE OPPORTUNITIES

19
Figure 8: Production of grapes from 2008 to 2017 in the world, Africa, and in South Africa.Source: FAO, 2019
Grapes are one of the most worldwide cultivated crops with roughly about 75 million tons produced each year. In Africa, South Africa is the leading producer of grapes and ranked 11th in the world, followed by Tunisia, Libya, Algeria, Morocco, and Egypt. Over the past years, there was a greater demand for African grapes in China and India. In 2018 African grapes exports increased from 3.3% to 3.9% of the global output (Sandrey, 2018). For many years South Africa has been producing grapes, primarily for export markets and the industry has grown rapidly from year to year (Ron Sandrey, 2018). About 50% of South Africa’s grapes exports are destined for the European Union and about 25% are exported to the United Kingdom (UK) alone. In South Africa, the Western Cape is the largest producing area of grapes commanding over 80% of all grapes while other producing areas include Northern Cape, Limpopo, Eastern Cape, Free State and Mpumalanga (DAFF, 2012). The purpose of this profile is to present the production of the grapes, trade patterns and market opportunities that may exist on the African continent.
Production of grapes in the world, Africa and South AfricaFigure 8 shows a detailed analysis of the world, Africa, and South Africa’s trends as well as the percentage change of grapes production over a period of ten years (2008 to 2017). The most outstanding level of production was in 2013, during which 193 million tons and 108.54 million tons of grapes were produced worldwide and in South Africa, respectively. However, Africa’s grape production showed a high increase in 2017. As depicted in the graph, South Africa’s percentage change for the grapes industry has been growing steadily as compared to the global and Africa’s percentage changes, with only 2008, 2012, and 2014 with having a negative percentage change. Both global and Africa’s percentage change has been negative and in some other years has been becoming less negative, implying a slower growth rate. During 2017, global and Africa’s production estimated at 171 million tons and 131, 41 million tons respectively show improvement as compared in the previous year, whereas the production in South Africa recorded a slight decline.
Market profile for South Africa’s Grapes exports: A case of Africa
By Pamela Matyolo
TRADE OPPORTUNITIES
20
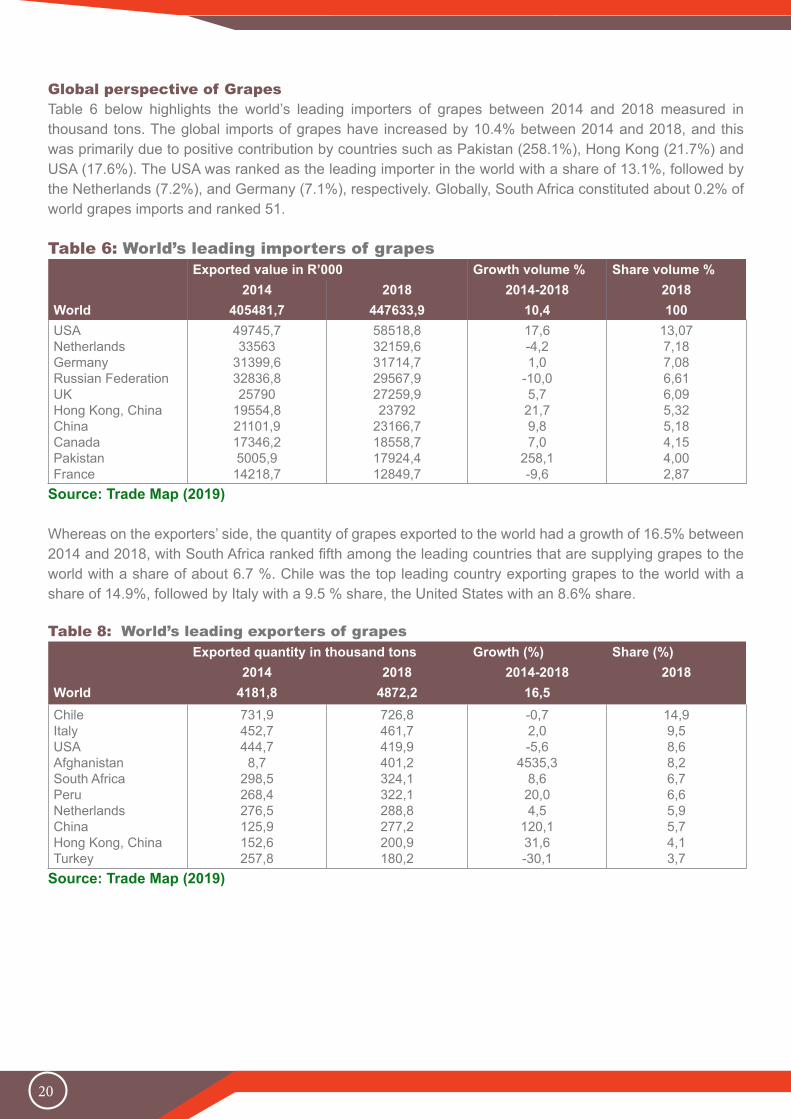
Global perspective of GrapesTable 6 below highlights the world’s leading importers of grapes between 2014 and 2018 measured in thousand tons. The global imports of grapes have increased by 10.4% between 2014 and 2018, and this was primarily due to positive contribution by countries such as Pakistan (258.1%), Hong Kong (21.7%) and USA (17.6%). The USA was ranked as the leading importer in the world with a share of 13.1%, followed by the Netherlands (7.2%), and Germany (7.1%), respectively. Globally, South Africa constituted about 0.2% of world grapes imports and ranked 51.
Table 6: World’s leading importers of grapes Exported value in R’000 Growth volume % Share volume %
2014 2018 2014-2018 2018World 405481,7 447633,9 10,4 100USANetherlandsGermanyRussian FederationUKHong Kong, ChinaChinaCanadaPakistanFrance
49745,733563
31399,632836,825790
19554,821101,917346,25005,9
14218,7
58518,832159,631714,729567,927259,923792
23166,718558,717924,412849,7
17,6-4,21,0
-10,05,7
21,79,87,0
258,1-9,6
13,077,187,086,616,095,325,184,154,002,87
Source: Trade Map (2019)
Whereas on the exporters’ side, the quantity of grapes exported to the world had a growth of 16.5% between 2014 and 2018, with South Africa ranked fifth among the leading countries that are supplying grapes to the world with a share of about 6.7 %. Chile was the top leading country exporting grapes to the world with a share of 14.9%, followed by Italy with a 9.5 % share, the United States with an 8.6% share.
Table 8: World’s leading exporters of grapesExported quantity in thousand tons Growth (%) Share (%)
2014 2018 2014-2018 2018World 4181,8 4872,2 16,5ChileItalyUSAAfghanistanSouth AfricaPeruNetherlandsChinaHong Kong, ChinaTurkey
731,9452,7444,7
8,7298,5268,4276,5125,9152,6257,8
726,8461,7419,9401,2324,1322,1288,8277,2200,9180,2
-0,72,0-5,6
4535,38,6
20,04,5
120,131,6-30,1
14,99,58,68,26,76,65,95,74,13,7
Source: Trade Map (2019)
21
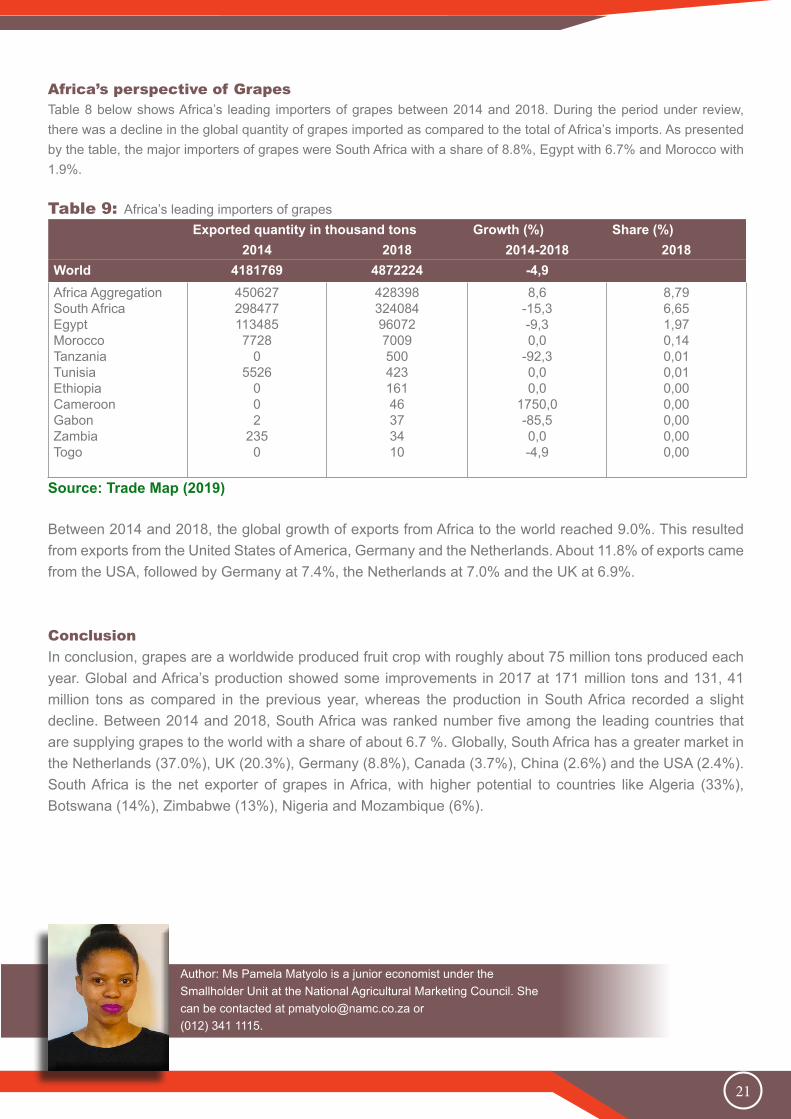
Africa’s perspective of GrapesTable 8 below shows Africa’s leading importers of grapes between 2014 and 2018. During the period under review, there was a decline in the global quantity of grapes imported as compared to the total of Africa’s imports. As presented by the table, the major importers of grapes were South Africa with a share of 8.8%, Egypt with 6.7% and Morocco with 1.9%.
Table 9: Africa’s leading importers of grapesExported quantity in thousand tons Growth (%) Share (%)
2014 2018 2014-2018 2018World 4181769 4872224 -4,9Africa AggregationSouth AfricaEgyptMoroccoTanzaniaTunisiaEthiopiaCameroonGabonZambiaTogo
4506272984771134857728
05526
002
2350
42839832408496072700950042316146373410
8,6-15,3-9,30,0
-92,30,00,0
1750,0-85,50,0-4,9
8,796,651,970,140,010,010,000,000,000,000,00
Source: Trade Map (2019)
Between 2014 and 2018, the global growth of exports from Africa to the world reached 9.0%. This resulted from exports from the United States of America, Germany and the Netherlands. About 11.8% of exports came from the USA, followed by Germany at 7.4%, the Netherlands at 7.0% and the UK at 6.9%.
ConclusionIn conclusion, grapes are a worldwide produced fruit crop with roughly about 75 million tons produced each year. Global and Africa’s production showed some improvements in 2017 at 171 million tons and 131, 41 million tons as compared in the previous year, whereas the production in South Africa recorded a slight decline. Between 2014 and 2018, South Africa was ranked number five among the leading countries that are supplying grapes to the world with a share of about 6.7 %. Globally, South Africa has a greater market in the Netherlands (37.0%), UK (20.3%), Germany (8.8%), Canada (3.7%), China (2.6%) and the USA (2.4%). South Africa is the net exporter of grapes in Africa, with higher potential to countries like Algeria (33%), Botswana (14%), Zimbabwe (13%), Nigeria and Mozambique (6%).
Author: Ms Pamela Matyolo is a junior economist under the Smallholder Unit at the National Agricultural Marketing Council. She can be contacted at [email protected] or (012) 341 1115.

22
TRADE NEWS
Agriculture, Land Reform and Rural Development Minister, Ms. Thoko Didiza, MP has welcomed the signing of the Poultry Sector Master Plan during the 2nd inaugural South African Investment Conference in Johannesburg. The Minister believes that the plan will provide a framework for a determined effort to grow jobs in the industry through a number of measures that will be implemented over a number of years. The plan has been developed in a close partnership between government and a number of stakeholders in the industry; drawn from poultry producers, farmers, processors, exporters, importers and organised labour. “Significantly, it sets out a new joint vision across the value-chain, identifies five pillars that underpin the vision and creates a Poultry Sector Master Plan Council to monitor and drive implementation of the pillars” said Minister Didiza. After signing the Masterplan with all stakeholders Minister Didiza said; “to support the outcomes of the Masterplan, chicken producers are committing R1.5 billion in fresh investment in their own production facilities within the next four years towards the investment drive. This is expected to result in nearly 4 000 additional jobs in the production
of chicken in pursuit of these outcomes.” In addition she said, we expect R1.7 billion of investment in the establishment of 50 commercial scale contract farmers - this investment will be supported by the industry and various government agencies.
The Poultry Sector Masterplan seeks to address challenges through a combined strategy which will: 1. Continue to increase the consumption of chicken in absolute terms, and on a per capita basis; 2. Ensure that locally produced product makes up an increasingly larger proportion of consumption over time; 3. Expand the industry by increasing capacity at all stages of the value chain – manufacturing of feed, farming of chickens and processing of poultry product – thereby increasing fixed investment, employment and the value of output; 4. In order to achieve this, government and industry will work together to revamp our certification systems so that we are able to meet the requirements of the major importing countries; 5. Increase the level of black participation and particularly ownership across the value chain and increase employment and worker share-ownership in the sector.
Minister Didiza Hails The Signing Of The Poultry Master Plan Which Aims To Create More Jobs
By-DALRRD https://www.daff.gov.za/docs/media/Media%20statement%20on%20signing%20of%20the%20poultry%20master%20plan%20which%20aims%20to%20create%20more%20jobs.pdf

23
TRADE NEWS
The Department of Agriculture, Land Reform & Rural Development (DALRRD) is making a friendly call to all international travellers who will be visiting South Africa during the festive season, or returning to South Africa after the holidays, to comply with the country’s import requirements for agricultural and related regulated products/ articles. Compliance will assist our country in preventing and minimising the potential risk of introducing alien invasive species, foreign pests and diseases that could be associated with imported plants, plant products, animals, animal products and other regulated goods. South Africa, like any other country, has a crucial mandate and sovereign right to protect its territory, biodiversity and economy against harm, thus it regulates importation
of animals and animal products, liquor products, plants and plant products, honey and honey products as well as any other potentially harmful materials from other countries into its territory. This is in accordance with the country’s relevant legislation, which is aimed at preventing the introduction, establishment and spread of pests and diseases from other parts of the world. Once a quarantine pest or disease is introduced into the country, it is difficult and expensive to control and manage it, thus prevention is imperative. Furthermore, the importation of certain liquor products with an alcohol content of more than 1% into the country for drinking purposes is restricted, except on the authority of an import certificate issued by DALRRD.
Importation of agricultural regulated products into the Republic of South Africa during the festive season
By DALRRDhttps://www.daff.gov.za/docs/media/Media%20release%20on%20the%20Importation%20of%20Agricultural%20Reg-ulated%20Products%20into.pdf

24
The Specialized Technical Committee recommendations were adopted during the AU Summit in February 2019, which gave a concrete mandate to the African Union Commission, in cooperation with African Union member States, ECA and all relevant stakeholders, to develop a comprehensive African Union Digital Trade and Digital Economy Development Strategy, to be presented for adoption during the summit scheduled for January 2020. In 2020, it is planned that the sub-programme will scale up its pilot project on informal cross-border trade and apply the methodology to other corridors and regions on the continent, with the ultimate goal of developing a single continental framework for informal cross-border trade data collection in the context of implementation and monitoring of the Agreement Establishing the African Continental Free Trade Area. In 2020, sub-programme 2 proposes to explore the possibility of a research project on the structural and policy underpinnings required to facilitate the emergence of an African Customs Union to support the implementation of the Agreement Establishing the African Continental Free Trade Area.
A new work programme that is focused on assessing the human rights and inclusivity implications of the trade and climate change nexus will be launched in the context of the partnership of ECA with OHCHR and the Friedrich-Ebert-Stiftung. In the context of the AfCFTA, this work stream will further focus on strategies for green industrialization and technological leapfrogging to ensure a low carbon and sustainable growth trajectory for member States. The findings are expected to provide cutting-edge and innovative contributions to the climate change policy debate and the United Nations Climate Change Conference – 26th Conference of the Parties in 2020. The digital trade and digital economy work stream will engage more deeply in the themes of e-commerce in free trade agreements and support the implementation of the African Union Digital Trade and Digital Economy Strategy. The work stream will also support preparations across the continent for multilateral and plurilateral e-commerce negotiations through a study on the practical issues of e-commerce entrepreneurship to identify African interests and possible negotiating positions.
Update on the establishment of the agreement and the status of ACFTA negotiations on phase II.
By Tralachttps://www.tralac.org/documents/news/3061-afcfta-an-update-on-the-establishment-of-the-agreement-and-the-sta-tus-of-negotiations-on-phase-ii-uneca-october-2019/file.html

25
REFERENCES
African Growth and Opportunity Act Info. 2019. AGOA FAQs. Available at: https://agoa.info/about-agoa/faq.html#text_
legislation
African Growth and Opportunity Act Info. 2019. US announces a review of South Africa’s place in its biggest preferen-
tial trade scheme (GSP). Available at: https://agoa.info/news/article/15680-us-announces-a-review-of-south-africa-s-
place-in-its-biggest-preferential-trade-scheme-gsp.html
Condon N, Stern M (2010) The effectiveness of African Growth and Opportunity Act (AGOA) in increasing trade from
Least Developed Countries: a systematic review. London: EPPI-Centre, Social Science Research Unit, Institute of Ed-
ucation, University of London.
Council, A. R. (2014). Hemp. Retrieved November 16, 2018, from http://www.arc.agric.za/arc-iic/Pages/Hemp.aspx
DAFF. (2016). A PROFILE OF THE SOUTH AFRICAN MAIZE MARKET. Pretoria: Department of Agriculture, forestry
and fisheries.
Department of Agriculture, F. a. (2012). Grapes. Pretoria: Department of Agriculture, Forestry and Fisheries.
FAO. (2009). Sheep and goats for diverse products and profits. Rome: Food and Agriculture Organization of the Unit-
ed Nations.
FAO. (n.d.). Grapes production. Retrieved November 12, 2019, from http://www.fao.org/faostat/en/#data/QC
FAO. (n.d.). Hemp crop production. Retrieved November 6, 2018, from http://www.fao.org/fao.org/faostat/en/#data/QD
Government, S. A. (2019). South African Government. Retrieved November 15, 2019, from Explore Gov.za: https://
www.gov.za/about-sa/agriculture
Group, O. B. (2019). Agriculture in Africa 2019: Special Report.
History, S. s. (nd). Steps in processing bast fibers. Retrieved November 10, 2018, from https://sites.google.com/site/
suesscienceandhistory/home/the-early-history-of-hemp-processing/processingbastfibers
ITC .2018. Available online: http://www.intracen.org/news/Avocado-global-trades-golden-fruit/
Land Bank. 2019. Prospects of South Africa’s avocado exports. Available online: https://www.bizcommunity.com/Arti-
cle/196/741/188574.html
Khumalo S. 2018. SA poultry industry takes on US chicken quota as court case brews. Published on Fin24 (Media24)
(17 September 2018). Available at: https://agoa.info/news/article/15522-poultry-industry-takes-on-us-chicken-quota-as-
court-case-brews.html
Maps, I. T. (n.d.). Exports and Imports of grapes. Retrieved November 15, 2019, from https://trademap.org
Marcus, E. S. (2002). Retrieved 11 15, 2018, from https://www.hort.purdue.edu/newcrop/ncnu02/v5-284.html
Nations, F. a. (2016). Table and dried grapes.
Ranum, P,Pena-Rosas, JP AND Garcia-Casal, M, 2014. Global maize production, Utilization, and consumption.
Roets, M., & Kirsten, J. F. (2005). Commercialisation of goat production in South Africa. Small Ruminant Research,
Volume 60, Issues 1-2, pp 187–196.
Sandrey, R. (2018, December 22). African production and exports of grapes and grape products in perspective. Re-
trieved November 14, 2019, from Building capacity to help Africa trade better: https://www.tralac.org/publications/arti-

26
cle/13894-african-production-and-exports-of-grapes-and-grape-products-in-perspective.html
Shah, T. R., Prasad, K., & Kumar, P. (2016). Maize—A potential source of human nutrition and health: A review. Co-
gent Food & Agriculture , 1-9.
TradeMaps, I. (2018). Exports and imports of hemp crop. Retrieved November 10, 2018, from https://trademap.org
The Department of International Relations and Cooperation. 2016. What are the benefits of AGOA for South African
exporters? Available at: https://pmg.org.za/files/160224AGOA.pptx
The Department of Trade and Industry Republic of South Africa. 2015. Post-Hearing Statement by the Department of
Trade and Industry on Behalf of the Government of the Republic of South Africa On the Occasion of the Out-of-Cycle
Review for Africa Growth and Opportunity Act (AGOA). Available at: https://agoa.info/images/documents/5797/finalpos-
thearingagoasubmissiongovernmentofsouthafrica-12august2015s-3.pdf
For correspondence:
Dr. Sifiso [email protected]+27 (0) 12 341 1115
For article contribution to the Trade Probe:Mr. Lucius Phaleng
[email protected]+27 (0) 12 341 1115
Designed byMr Sylvester Moatshe
[email protected]+27 (0) 341 1115
© 2019. Published by the National Agricultural Marketing Council (NAMC).DISCLAIMER
Information contained in this document results from research funded wholly or in part by the NAMC acting in good faith. Opinions, attitudes and points of view expressed herein do not necessarily reflect the official position or policies
of the NAMC. The NAMC makes no claims, promises or guarantees about the accuracy, completeness or adequacy of the contents of this document and expressly disclaims liability for errors and omissions regarding the contents thereof. No warranty of any kind, implied, expressed or statutory, including but not limited to the warranties of no infringement of third-party rights, title, merchantability, fitness for a particular purpose or freedom from computer virus, is given with respect to the contents of this document in hardcopy, electronic format or electronic links thereto. Any reference made to a specific product, process or service by trade name, trademark, manufacturer or other commercial commodity or
entity is for information purposes only and does not imply approval, endorsement or favouring by the NAMC.
1
ISSUE 75 | NOVEMBER 2018
Supporting and growing the milk industrySigned Protocol offers an excellent opportunity for Lucerne hay exportersConsumer preferences & climate alters the composition of fruit productionTrade profile of unmanufactured
tobacco