Embed Size (px)
Citation preview

AUTHOR(S): SIGNATURE(S):
STATEMENT OF WORK - CASH PAYMENTS EVENT NUMBER(S)/DATE(S):
NOTICE OF WORK PERMIT NUMBER(S)/DATE(S): YEAR OF WORK:
PROPERTY NAME:
CLAIM NAME(S) (on which the work was done):
COMMODITIES SOUGHT:
MINERAL INVENTORY MINFILE NUMBER(S), IF KNOWN:
NTS/BCGS:MINING DIVISION:
LATITUDE: o ' " LONGITUDE: o ' "
OWNER(S):1) 2)
OPERATOR(S) [who paid for the work]:1) 2)
MAILING ADDRESS:
TYPE OF REPORT [type of survey(s)]: TOTAL COST:
PROPERTY GEOLOGY KEYWORDS (lithology, age, stratigraphy, structure, alteration, mineralization, size and attitude):
REFERENCES TO PREVIOUS ASSESSMENT WORK AND ASSESSMENT REPORT NUMBERS:
Ministry of Energy, Mines & Petroleum ResourcesMining & Minerals DivisionBC Geological Survey
Assessment ReportTitle Page and Summary
(at centre of work)
MAILING ADDRESS:
Next Page
A. Walcott, P. Walcott
5603602
Nov. 21st - Dec 7th, 2015
Getty
218508,218509,218510,208511,221561-221582,
221585 543766,758882,759482,759522,766082,1011732
Copper, Molybdenum
092INW040
092I055Kamloops
50 33 121 02
Getty Copper Inc.
Getty Copper Inc.
Geophysical, Induced Polarization 96,999.80
Highland Valley, Copper, Guichon Batholith, Triassic
28084,28072,24692,32370,24476
1000 Austin Avenue
Coquitlam, B.C.

GEOLOGICAL (scale, area)
Ground, mapping
Photo interpretation
GEOPHYSICAL (line-kilometres)Ground
Magnetic
Electromagnetic
Induced Polarization
Radiometric
Seismic
Other
Airborne
GEOCHEMICAL(number of samples analysed for...)
Soil
Silt
Rock
Other
DRILLING(total metres; number of holes, size)
Core
Non-core
RELATED TECHNICAL
Sampling/assaying
Petrographic
Mineralographic
Metallurgic
PROSPECTING (scale, area)
PREPARATORY / PHYSICAL
Line/grid (kilometres)
(scale, area)
Legal surveys (scale, area)
Road, local access (kilometres)/trail
Topographic/Photogrammetric
Trench (metres)
Underground dev. (metres)
Other
TYPE OF WORK INTHIS REPORT
EXTENT OF WORK(IN METRIC UNITS)
ON WHICH CLAIMS PROJECT COSTSAPPORTIONED
(incl. support)
TOTAL COST:
(scale, area)
Line/grid (kilometres)
PROSPECTING (scale, area)
Metallurgic
Mineralographic
Petrographic
Sampling/assaying
Non-core
Core
Other
Rock
Silt
Soil
Airborne
Other
Seismic
Radiometric
Induced Polarization
Electromagnetic
Magnetic
Photo interpretation
Ground, mapping
96,999.80
96,999.80543766,759482,218510,221565-6616000 m

EVENT #5603602
AN ASSESSMENT REPORT
ON
INDUCED POLARIZATION SURVEYING
GETTY PROPERTY LOGAN LAKE AREA, BRITISH COLUMBIA
KAMLOOPS M.D. 50 33’N, 121 02’W
NTS 92I/ 10 & 11
Claims: 218508,218509,218510,208511,221561-221582,221585 543766,758882,759482,759522,766082,1011732
Work Dates: November 20th, - December 8th , 2015
FOR
GETTY COPPER INC. COQUITLAM, BRITISH COLUMBIA
BY
ALEXANDER WALCOTT, B.Sc PETER E. WALCOTT, P.Eng.
PETER E. WALCOTT & ASSOCIATES LIMITED
Coquitlam, British Columbia
AUGUST 2016

Peter E. Walcott & Associates Limited 2015 Induced Polarization Survey Geophysical Services Ge tty Property, B.C.
2
TABLE OF CONTENTS , Page INTRODUCTION…………………………………………………………….. 3 PROPERTY, LOCATION AND ACCESS…………………………………... 4 PREVIOUS WORK………………………………………………………….. 7 REGIONAL AND PROPERTY GEOLOGY………………………………... 8 PURPOSE…………………………………………………………………….. 10 SURVEY SPECIFICATIONS……………………………………………….. 11 DISCUSSION OF RESULTS………………………………………………… 13 SUMMARY, CONCLUSIONS & RECOMMENDATIONS………………… 17 APPENDIX I Cost of Project Personnel Employed on Project Certification Claim List References ACCOMPANYING MAPS Claim and Location Map Scale1:100,000 Detail Claim and Line Location Map Scale 1:10,000 Contours of Total Field Intensity with 2015 IP Lines Scale 1:10,000 2D Inverted Sections
3250N, 3500N, 4000N, 4500N, 5000N, 5500N Scale 1:10,000

Peter E. Walcott & Associates Limited 2015 Induced Polarization Survey Geophysical Services Ge tty Property, B.C.
3
INTRODUCTION. Between November 21st and December 7th, 2015, Peter E. Walcott & Associates Limited undertook induced polarization surveying over parts the Getty property, located in the Highland Valley of British Columbia, for Getty Copper Inc. The survey consisted of 6 east west orientated traverses, spaced between 250 m and 500 meters apart, for a total of some 16 line kilometers of deep penetrating induced polarization (IP) surveying. Additional traverses planned had to be abandoned due to access issues due to heavy snow fall. The survey was designed to augment the historic Titan 24 survey carried out over the Getty North and South deposits in 2010, in addition to attempting to define a target at depth proximal to the historic drill GL96-08, which intercepted elevated copper and molybdenum mineralization at depth.

Peter E. Walcott & Associates Limited 2015 Induced Polarization Survey Geophysical Services Ge tty Property, B.C.
4
PROPERTY LOCATION AND ACCESS The Getty property is located some 20 kilometres northwest of the community of Logan Lake, British Columbia. Access to the core of the property is obtained from Logan Lake, via highway 97C, and then by utilizing a network of logging roads.
Property Location Map

Peter E. Walcott & Associates Limited 2015 Induced Polarization Survey Geophysical Services Ge tty Property, B.C.
5
PROPERTY LOCATION AND ACCESS con’t
Line and Property Claim Location Map

Peter E. Walcott & Associates Limited 2015 Induced Polarization Survey Geophysical Services Ge tty Property, B.C.
6
PROPERTY LOCATION AND ACCESS con’t
Line and Claim Location Map

Peter E. Walcott & Associates Limited 2015 Induced Polarization Survey Geophysical Services Ge tty Property, B.C.
7
PREVIOUS WORK. The Getty Property and surrounding areas has been the subject of numerous exploration campaigns over the past 100 years. Well documented exploration programs conducted over the property have consisted of prospecting, geological mapping, geochemical samples, geophysics, and diamond drilling. The author would refer the reader to the BC Ministry of Energy and Mines – Assessment Report Indexing System (ARIS) http://www.empr.gov.bc.ca/mining/geoscience/aris for the historic public reports.

Peter E. Walcott & Associates Limited 2015 Induced Polarization Survey Geophysical Services Ge tty Property, B.C.
8
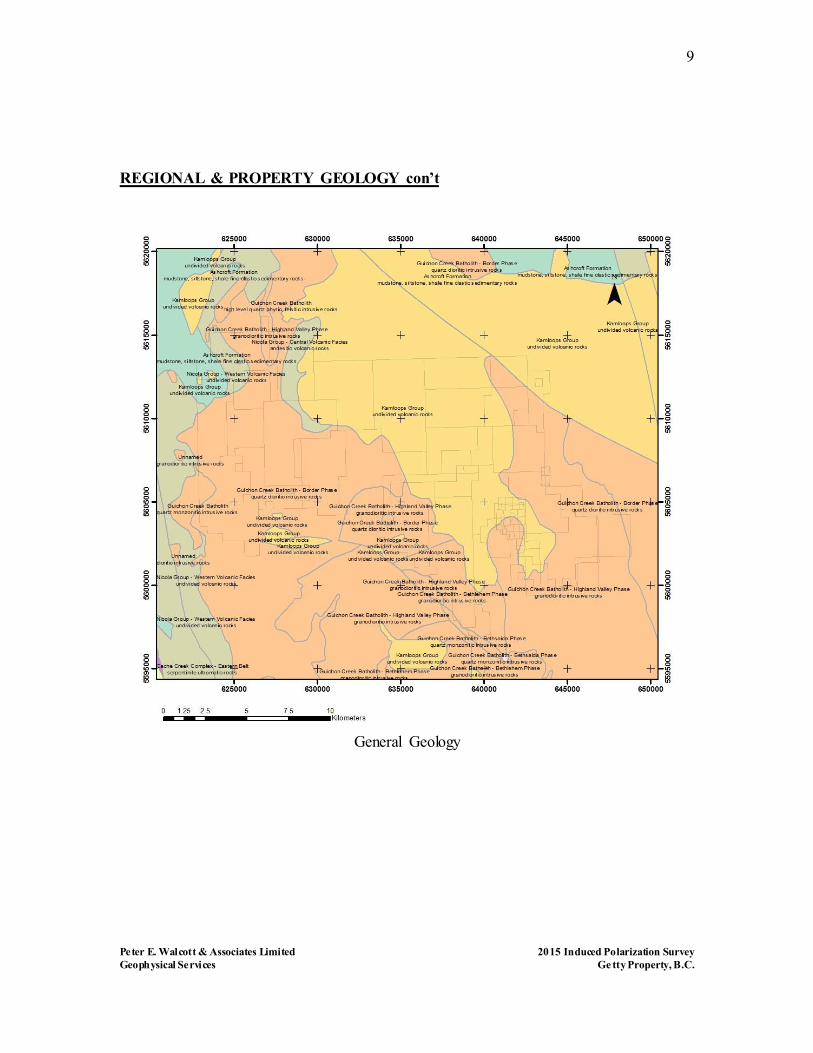
REGIONAL & PROPERTY GEOLOGY The Highland Valley is underlain by the Guchion Creek Batholith. This complex hosts a number of BC’s rich copper and molybdenum deposits, such as the Valley and Lornex. The Guichon Creek Batholith is composed of multiple intrusive phases, which can be distinguished by both composition and texture. These semi concentric phases are orientated in a north northwesterly orientation, stemming from a root some 8 kilometers down as interpreted form historic gravity data. The author would refer the reader to the numerous geological papers written about this prolific mining district for a detailed overview. The Getty property covers the northern extent of the late Triassic Guichon Creek Batholith. The intrusive rocks ranges in composition ranging from diorite to granodiorite, respective of the phase of emplacement. The property is also underlain by Tertiary sediments and Kamloops Group volcanics dominantly in the north eastern portion of the property.

Peter E. Walcott & Associates Limited 2015 Induced Polarization Survey Geophysical Services Ge tty Property, B.C.
9
REGIONAL & PROPERTY GEOLOGY con’t
General Geology

Peter E. Walcott & Associates Limited 2015 Induced Polarization Survey Geophysical Services Ge tty Property, B.C.
10
PURPOSE. The survey was designed to augment and expand on a previously conducted Titan 24 IP survey, proximal to the Getty West zone. The survey was also designed to test the thickness of volcanic cover to the north over Forge Mountain.

Peter E. Walcott & Associates Limited 2015 Induced Polarization Survey Geophysical Services Ge tty Property, B.C.
11
SURVEY SPECIFICATIONS. The Induced Polarization Survey. The induced polarization (IP) survey was conducted using a pulse type system, the principal components of which were manufactured by Instrumentation GDD of Quebec, Canada. The system consists basically of three units, a receiver (GDD), transmitter (GDD) and a motor generator (Honda). On this survey two transmitters used in series providing a maximum of 8.6 kw d.c. to the ground, obtains their power from two 7.5 kw 60 c.p.s. alternators driven by Honda 14 h.p. gasoline engines. The cycling rate of the transmitter is 2 seconds “current-on” and 2 seconds “current-off” with the pulses reversing continuously in polarity. The data recorded in the field consists of careful measurements of the current (I) in amperes flowing through the current electrodes C1 and C2, the primary voltages (V) appearing between any two potential electrodes, P1 through P5, during the “current-on” part of the cycle, and the apparent chargeability, (Ma) presented as a direct readout in millivolts per volt using a 200 millisecond delay and a 1000 millisecond sample window by the receiver, a digital receiver controlled by a micro-processor – the sample window is actually the total of twenty individual windows of 50 millisecond widths – at any time. The apparent resistivity (a) in ohm metres is proportional to the ratio of the primary voltage and the measured current, the proportionality factor depending on the geometry of the array used. The chargeability and resistivity are called apparent as they are values which that portion of the earth sampled would have if it were homogeneous. As the earth sampled is usually inhomogeneous the calculated apparent chargeability and resistivity are functions of the actual chargeability and resistivity of the rocks. The surveying was carried out using the “pole-dipole” / “dipole-pole” method of survey. With the pre-laid receiver array remaining stationary, the current C1 is moved along the survey lines at a spacing of “a” (the dipole) apart, while the second current electrode, C2, is kept constant at “infinity”. As the current (C1) is injected between the respective potential electrodes, and the receiving array is stationary, both pole-dipole and dipole-pole geometries can be measured with the maximum “n” separation, a function of the length of the receiver array which on this survey was “n” = 19.5, depending on the injection placement.
Peter E. Walcott & Associates Limited 2015 Induced Polarization Survey Geophysical Services Ge tty Property, B.C.
12
SURVEY SPECIFICATIONS cont. The distance, “na” between C1 and the nearest potential electrode generally controls the depth to be explored by the particular separation, “n”, traverse. On this survey a 100 metre dipole separation was utilized. On this survey a total of some 16 kilometres of survey traverses were completed. Horizontal control. The horizontal positions of the stations were recorded using a Garmin GPSmap 60CSx. Data Presentation. The data are presented as individual pseudo section plots of apparent resistivity and apparent chargeability at a scale of 1:10,000 generated using Geosoft Oasis Montaj. 2D inversions of both resistivity and chargeability modelled, using Res2DInv, are also presented at a scale of 1:10,000.

Peter E. Walcott & Associates Limited 2015 Induced Polarization Survey Geophysical Services Ge tty Property, B.C.
13
DISCUSSION OF RESULTS. The 2015 Induced Polarization survey carried on over parts of the Getty Copper property yielded a number of targets of potential interest, solely on the three southern lines, while the three northern lines exhibited no IP response. The lines were positioned to augment the existing deep IP coverage from the earlier Titan 24 survey. Line 3250 was re-read to allow for leveling between the two respective data datasets for future modelling.
Line Location Map with Airborne Magnetics

Peter E. Walcott & Associates Limited 2015 Induced Polarization Survey Geophysical Services Ge tty Property, B.C.
14
DISCUSSION OF RESULTS con’t. Anomaly cA is centered at 40400E on line 3250. This anomaly continues north through to Line 4000N at 40300E where it narrows and appears to truncate, potentially associated with a merging of two weak magnetic trends as seen above. This chargeability is dominantly associated with a higher resistivity unit overlying a flat lying resistivity low. The anomaly is situated within a magnetic low and appears to track the western flank of a weak magnetic feature.
Section 5603250N – Modelled Chargeability
This anomaly has been partially drill tested some 400 meters to the south. Hole 96GL-07 intercepted a broad zone of Tertiary volcanics in the bottom of the hole on the eastern flank of the anomaly within a resistivity low.

Peter E. Walcott & Associates Limited 2015 Induced Polarization Survey Geophysical Services Ge tty Property, B.C.
15
DISCUSSION OF RESULTS con’t.
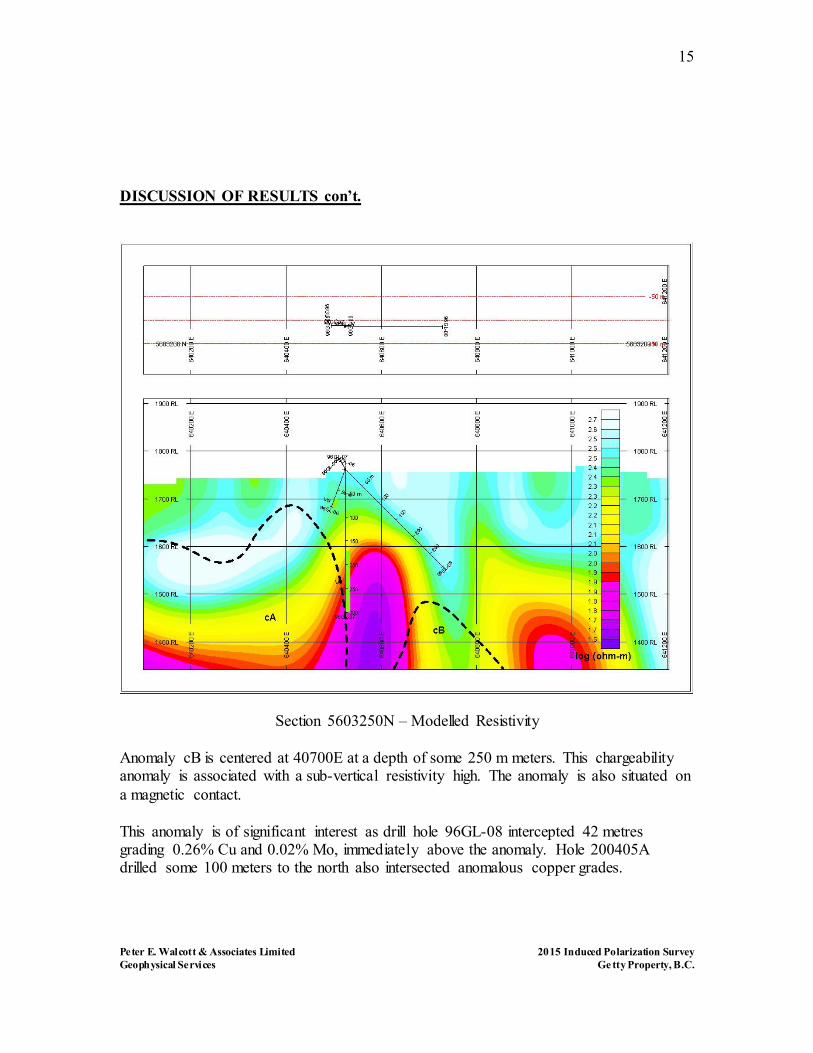
Section 5603250N – Modelled Resistivity
Anomaly cB is centered at 40700E at a depth of some 250 m meters. This chargeability anomaly is associated with a sub-vertical resistivity high. The anomaly is also situated on a magnetic contact. This anomaly is of significant interest as drill hole 96GL-08 intercepted 42 metres grading 0.26% Cu and 0.02% Mo, immediately above the anomaly. Hole 200405A drilled some 100 meters to the north also intersected anomalous copper grades.

Peter E. Walcott & Associates Limited 2015 Induced Polarization Survey Geophysical Services Ge tty Property, B.C.
16
DISCUSSION OF RESULTS con’t. While anomaly cB does not appear to track through line 3500N, a weak feature does appear on Line 4000N on strike and is potentially the same anomaly. The lack of the chargeability response on Line 3500N could be due to an EW magnetic feature observed in the 2015 airborne magnetic survey.

Peter E. Walcott & Associates Limited 2015 Induced Polarization Survey Geophysical Services Ge tty Property, B.C.
17
SUMMARY, CONCLUSIONS & RECOMMENDATIONS. Between November 21st and December 7th, 2015, Peter E. Walcott & Associates Limited undertook induced polarization surveying over parts Getty property, located in the Logan Lake area of British Columbia, for Getty Copper Inc. The survey consisted of 6 east west orientated traverses, spaced between 250 m and 500 meters apart for a total of some 16 line kilometers of deep penetrating induced polarization surveying. The survey was hampered with access issues due to heavy snows, this limiting the program. The survey was designed to augment existing Titan 24 IP coverage conducted in 2010 over the Getty North and Getty South deposits, and to attempt to define targets in the Getty West zone. The survey identified and confirmed two chargeability targets proximal to the Getty West; Anomaly cA a broad anomaly, which has been partially drill tested south to the south with no significant results; Anomaly cB a deep chargeability anomaly where two historic drill holes yielded elevated copper grades proximal to the anomaly. This anomaly is of significant interest. A detailed review of all drill logs, and potential re-logging of holes within the Getty West zone should be undertaken by a geologist experienced in the Highland Valley exploration. Physical property measurement should also be undertaken, in order to understand better understand the geophysical response of the respective units. A full 3D inversion merging both the Titan and Walcott deep penetrating IP should be undertaken, and the results of the above exercises merged into a 3D compilation, prior to drill testing. Respectfully submitted, PETER E. WALCOTT & ASSOCIATES LTD. Alexander Walcott, B.Sc. Peter E. Walcott, P.Eng. Geophysicist Geophysicist Coquitlam, B.C. August 2016

Peter E. Walcott & Associates Limited 2015 Induced Polarization Survey Geophysical Services Ge tty Property, B.C.
18
APPENDIX I

Peter E. Walcott & Associates Limited 2015 Induced Polarization Survey Geophysical Services Ge tty Property, B.C.
19
COST OF PROJECT. Peter E. Walcott & Associates Limited undertook the survey on a daily basis providing a six man crew, IP equipment, GPS, altimeters and a 4x4 truck for a total of $66,750.00. Accommodation and fuel were billed at $ 11,068.64, while mobilization costs of $3,500.00 were incurred, so that the total cost of services provided was $ 88,818.64. A further 10% management and administration fee was accrued by Getty Copper, thus a total cost of $96,999.804 was incurred on this project.

Peter E. Walcott & Associates Limited 2015 Induced Polarization Survey Geophysical Services Ge tty Property, B.C.
20
PERSONNEL EMPLOYED ON PROJECT. Name Occupation Address Dates Peter E. Walcott Geophysicist Unit 111- 17,
Fawcett Rd. Coquitlam, B.C. V3K 6V2
Alexander Walcott
"
"
Marek Welz “
Nov. 20th – Dec 8th, 2015
Patrick Young “ “ Tom Kocan
Geophysical
Operator
“ Matt Magee “ “ Chris Roe
“
“

Peter E. Walcott & Associates Limited 2015 Induced Polarization Survey Geophysical Services Ge tty Property, B.C.
21
CERTIFICATION. I, Peter E. Walcott, of 605 Rutland Court, Coquitlam, British Columbia, hereby certify that:
1. I am a graduate of the University of Toronto in 1962 with a B.A.Sc. in Engineering Physics, Geophysics Option.
2. I have been practicing my profession for the last fifty four years.
3. I am a member of the Association of Professional Engineers of British
Columbia and Ontario.
4. I hold no interest, direct or indirect, in the property, nor do I expect to receive any.
Peter E. Walcott, P.Eng. Coquitlam, B.C. August 2016

Peter E. Walcott & Associates Limited 2015 Induced Polarization Survey Geophysical Services Ge tty Property, B.C.
22
CERTIFICATION. I, Alexander Walcott, of 38-181 Ravine Dr., Port Moody, British Columbia, hereby certify that:
1. I am a graduate of the University of Alberta with a B.Sc. Earth Sciences Major, with a Physics Minor.
2. I have been active in mineral exploration for the past 20 years. 3. I hold no interest, direct or indirect, in the property, nor do I expect to
receive any.
Alexander Walcott Coquitlam, B.C. August 2016

Peter E. Walcott & Associates Limited 2015 Induced Polarization Survey Geophysical Services Ge tty Property, B.C.
23
CLAIM LIST
Title
Number
Claim
Name
Owner Issue Date
Good To
Date
Status
Area
(ha)
218508 GETTY #80 133231 100% 1989/jun/10 2020/may/12 GOOD 25.00
218509 GETTY #81 133231 100% 1989/jun/10 2020/may/12 GOOD 25.00
218510
GETTY #82
FR. 133231 100% 1989/jun/10 2020/may/12 GOOD 25.00
218511
GETTY #83 FR.
133231 100% 1989/jun/10 2020/may/12 GOOD 25.00
221561 GETTY #1 133231 100% 1974/aug/06 2020/may/12 GOOD 25.00
221562 GETTY #2 133231 100% 1974/aug/06 2020/may/12 GOOD 25.00
221563 GETTY #3 133231 100% 1974/aug/16 2020/may/12 GOOD 25.00
221564 GETTY #4 133231 100% 1974/aug/16 2020/may/12 GOOD 25.00
221565 GETTY #5 133231 100% 1974/aug/16 2020/may/12 GOOD 25.00
221566 GETTY #6 133231 100% 1974/aug/16 2020/may/12 GOOD 25.00
221567 GETTY #7 133231 100% 1974/aug/16 2020/may/12 GOOD 25.00
221568 GETTY #8 133231 100% 1974/aug/16 2020/may/12 GOOD 25.00
221569 GETTY #9 133231 100% 1974/jul/16 2020/may/12 GOOD 25.00
221570 GETTY #10 133231 100% 1974/aug/16 2020/may/12 GOOD 25.00
221571 GETTY #11 133231 100% 1974/aug/16 2020/may/12 GOOD 25.00
221572 GETTY #12 133231 100% 1974/aug/16 2020/may/12 GOOD 25.00
221573 GETTY #13 133231 100% 1974/aug/16 2020/may/12 GOOD 25.00
221574 GETTY #14 133231 100% 1974/aug/16 2020/may/12 GOOD 25.00
221575 GETTY #15 133231 100% 1974/aug/16 2020/may/12 GOOD 25.00
221576 GETTY #16 133231 100% 1974/aug/16 2020/may/12 GOOD 25.00
221577 GETTY #17 133231 100% 1974/aug/16 2020/may/12 GOOD 25.00
221578 GETTY #18 133231 100% 1974/aug/16 2020/may/12 GOOD 25.00
221579 GETTY #19 133231 100% 1974/aug/16 2020/may/12 GOOD 25.00
221580 GETTY #20 133231 100% 1974/aug/16 2020/may/12 GOOD 25.00
221581 GETTY #21 133231 100% 1974/aug/16 2020/may/12 GOOD 25.00
221582 GETTY #22 133231 100% 1974/aug/16 2020/may/12 GOOD 25.00
221583 GETTY #23 133231 100% 1974/aug/16 2020/may/12 GOOD 25.00
221584 GETTY #24 133231 100% 1974/aug/16 2020/may/12 GOOD 25.00

Peter E. Walcott & Associates Limited 2015 Induced Polarization Survey Geophysical Services Ge tty Property, B.C.
24
221585
GETTY A
FR 133231 100% 1974/aug/16 2020/may/12 GOOD 25.00
332395 BRAM 2 133231 100% 1994/nov/08 2017/may/15 GOOD 500.00
347448 GETTY #95 133231 100% 1996/jun/16 2017/may/15 GOOD 400.00
352941
GETTY
#113 133231 100% 1996/dec/04 2017/may/15 GOOD 25.00
412799
GETTY 2405
133231 100% 2004/jul/17 2017/may/15 GOOD 25.00
412800
GETTY
2406 133231 100% 2004/jul/17 2017/may/15 GOOD 25.00
519232
GETTY
SOUTH1 133231 100% 2005/aug/22 2017/may/15 GOOD 123.22
519235
GETTY
SOUTH 2 133231 100% 2005/aug/22 2018/may/31 GOOD 82.13
519237
GETTY
SOUTH 3 133231 100% 2005/aug/22 2017/may/15 GOOD 164.31
526953 GSOUTH 1 133231 100% 2006/feb/02 2018/may/31 GOOD 143.75
543766
GETTY
WEST 133231 100% 2006/oct/22 2017/may/15 GOOD 307.92
614103 133231 100% 2009/aug/01 2017/may/15 GOOD 164.14
614104 133231 100% 2009/aug/01 2017/may/15 GOOD 102.55
614123 133231 100% 2009/aug/01 2017/may/15 GOOD 204.89
616307 GWEN 133231 100% 2009/aug/08 2017/may/15 GOOD 20.49
621143
THE
BRIED'SG&G 133231 100% 2009/aug/18 2017/may/15 GOOD 348.44
640843 133231 100% 2009/sep/25 2017/may/15 GOOD 41.06
757822 133231 100% 2010/apr/26 2017/may/15 GOOD 1538.95
757882 133231 100% 2010/apr/26 2017/may/15 GOOD 1660.28
757902 133231 100% 2010/apr/26 2017/may/15 GOOD 1229.67
757962 133231 100% 2010/apr/26 2017/may/15 GOOD 1579.46
758022 133231 100% 2010/apr/26 2017/may/15 GOOD 1107.68
758222 133231 100% 2010/apr/26 2017/may/15 GOOD 1517.28
758422 133231 100% 2010/apr/26 2017/may/15 GOOD 1313.52
758483 133231 100% 2010/apr/26 2017/may/15 GOOD 20.51
758842 133231 100% 2010/apr/27 2017/may/15 GOOD 512.31
758882 133231 100% 2010/apr/27 2017/may/15 GOOD 1663.04
758902 133231 100% 2010/apr/27 2017/may/15 GOOD 553.68
758963 133231 100% 2010/apr/27 2017/may/15 GOOD 840.83
759302 133231 100% 2010/apr/27 2017/may/15 GOOD 1003.86
759342 133231 100% 2010/apr/27 2017/may/15 GOOD 574.41
759362 133231 100% 2010/apr/27 2017/may/15 GOOD 839.82

Peter E. Walcott & Associates Limited 2015 Induced Polarization Survey Geophysical Services Ge tty Property, B.C.
25
759402 133231 100% 2010/apr/27 2017/may/15 GOOD 942.97
759422 133231 100% 2010/apr/27 2017/may/15 GOOD 553.56
759482 133231 100% 2010/apr/27 2017/may/15 GOOD 615.55
759522 133231 100% 2010/apr/27 2017/may/15 GOOD 902.90
759562 133231 100% 2010/apr/27 2017/may/15 GOOD 1108.66
759702 133231 100% 2010/apr/28 2017/may/15 GOOD 164.38
759802 133231 100% 2010/apr/28 2017/may/15 GOOD 20.54
766082 133231 100% 2010/may/03 2020/may/12 GOOD 41.04
768142 BLU 133231 100% 2010/may/05 2017/may/15 GOOD 40.95
768162 133231 100% 2010/may/05 2017/may/15 GOOD 512.45
844516 133231 100% 2011/jan/26 2017/may/15 GOOD 20.51
917949 133231 100% 2011/oct/18 2017/may/15 GOOD 246.09
920784 133231 100% 2011/oct/21 2017/may/15 GOOD 246.23
937922 133231 100% 2011/dec/19 2017/may/15 GOOD 266.70
1011732 133231 100% 2012/aug/02 2017/may/15 GOOD 266.71
1011733 133231 100% 2012/aug/02 2017/may/15 GOOD 205.10
1011734 133231 100% 2012/aug/02 2017/may/15 GOOD 41.03
1027750 GETTY BT1 133231 100% 2014/apr/22 2017/may/15 GOOD 840.43
1027751 GETTY BT2 133231 100% 2014/apr/22 2017/may/15 GOOD 737.65
1027752 GETTY BT3 133231 100% 2014/apr/22 2017/may/15 GOOD 409.80
1033130 133231 100% 2015/jan/05 2017/may/15 GOOD 82.00

Peter E. Walcott & Associates Limited 2015 Induced Polarization Survey Geophysical Services Ge tty Property, B.C.
26
REFERENCES. Ager, C.A, McMillan, W.J., Ulrych, T.J, Bulletin 62: Gravity, Magnetics and Geology of the Guichon Creek Batholith, 1972 British Columbia Department of Mines and Petroleum Resources Bond, L., Graden, R. – Diamond Drilling Report on the Highland Valley Copper Getty Copper Option, 2005, BC Assessment Report 28084 Evans, G. Hewson, C. – 2005 Assessment Report, Geological Mapping, Line Cutting and Induced Polarization Geophysics on the Getty Copper Option, 2005, BC Assessment Report 28072 Geoscience BC, - Quest South Airborne Gravity Dataset, 2010 Northcote, K.E., Bulletin 56: Geology and Geochronology of the Guichon Creek Batholith, 1969 British Columbia Department of Mines and Petroleum Resources Perry, Bruce J, - Report on Diamond Drilling At The Getty North (Krain), Getty South( Trojan (South Seas), and Getty West (Transvaal) Areas, Highland Valley, 1996, BC Assessment Report 24692 Tournerie, B., Verweerd, A. , Metcalfe, J. – Titan 24 DC/IP/MT Survey Geophysical Report, Getty Project, 2011, BC Assessment Report 32370 Walcott, Peter E., - A Geophysical Report on Induced Polarization Surveying, Getty Property, 1996, BC. Assessment Report 24476

EVENT #5603602
AN ASSESSMENT REPORT
ON
INDUCED POLARIZATION SURVEYING
GETTY PROPERTY LOGAN LAKE AREA, BRITISH COLUMBIA
KAMLOOPS M.D. 50 33’N, 121 02’W
NTS 92I/ 10 & 11
Claims: 218508,218509,218510,208511,221561-221582,221585 543766,758882,759482,759522,766082,1011732
Work Dates: November 20th, - December 8th , 2015
FOR
GETTY COPPER INC. COQUITLAM, BRITISH COLUMBIA
BY
ALEXANDER WALCOTT, B.Sc PETER E. WALCOTT, P.Eng.
PETER E. WALCOTT & ASSOCIATES LIMITED
Coquitlam, British Columbia
AUGUST 2016

Peter E. Walcott & Associates Limited 2015 Induced Polarization Survey Geophysical Services Ge tty Property, B.C.
2
TABLE OF CONTENTS , Page INTRODUCTION…………………………………………………………….. 3 PROPERTY, LOCATION AND ACCESS…………………………………... 4 PREVIOUS WORK………………………………………………………….. 7 REGIONAL AND PROPERTY GEOLOGY………………………………... 8 PURPOSE…………………………………………………………………….. 10 SURVEY SPECIFICATIONS……………………………………………….. 11 DISCUSSION OF RESULTS………………………………………………… 13 SUMMARY, CONCLUSIONS & RECOMMENDATIONS………………… 17 APPENDIX I Cost of Project Personnel Employed on Project Certification Claim List References ACCOMPANYING MAPS Claim and Location Map Scale1:100,000 Detail Claim and Line Location Map Scale 1:10,000 Contours of Total Field Intensity with 2015 IP Lines Scale 1:10,000 2D Inverted Sections
3250N, 3500N, 4000N, 4500N, 5000N, 5500N Scale 1:10,000

Peter E. Walcott & Associates Limited 2015 Induced Polarization Survey Geophysical Services Ge tty Property, B.C.
3
INTRODUCTION. Between November 21st and December 7th, 2015, Peter E. Walcott & Associates Limited undertook induced polarization surveying over parts the Getty property, located in the Highland Valley of British Columbia, for Getty Copper Inc. The survey consisted of 6 east west orientated traverses, spaced between 250 m and 500 meters apart, for a total of some 16 line kilometers of deep penetrating induced polarization (IP) surveying. Additional traverses planned had to be abandoned due to access issues due to heavy snow fall. The survey was designed to augment the historic Titan 24 survey carried out over the Getty North and South deposits in 2010, in addition to attempting to define a target at depth proximal to the historic drill GL96-08, which intercepted elevated copper and molybdenum mineralization at depth.

Peter E. Walcott & Associates Limited 2015 Induced Polarization Survey Geophysical Services Ge tty Property, B.C.
4
PROPERTY LOCATION AND ACCESS The Getty property is located some 20 kilometres northwest of the community of Logan Lake, British Columbia. Access to the core of the property is obtained from Logan Lake, via highway 97C, and then by utilizing a network of logging roads.
Property Location Map

Peter E. Walcott & Associates Limited 2015 Induced Polarization Survey Geophysical Services Ge tty Property, B.C.
5
PROPERTY LOCATION AND ACCESS con’t
Line and Property Claim Location Map

Peter E. Walcott & Associates Limited 2015 Induced Polarization Survey Geophysical Services Ge tty Property, B.C.
6
PROPERTY LOCATION AND ACCESS con’t
Line and Claim Location Map

Peter E. Walcott & Associates Limited 2015 Induced Polarization Survey Geophysical Services Ge tty Property, B.C.
7
PREVIOUS WORK. The Getty Property and surrounding areas has been the subject of numerous exploration campaigns over the past 100 years. Well documented exploration programs conducted over the property have consisted of prospecting, geological mapping, geochemical samples, geophysics, and diamond drilling. The author would refer the reader to the BC Ministry of Energy and Mines – Assessment Report Indexing System (ARIS) http://www.empr.gov.bc.ca/mining/geoscience/aris for the historic public reports.

Peter E. Walcott & Associates Limited 2015 Induced Polarization Survey Geophysical Services Ge tty Property, B.C.
8
REGIONAL & PROPERTY GEOLOGY The Highland Valley is underlain by the Guchion Creek Batholith. This complex hosts a number of BC’s rich copper and molybdenum deposits, such as the Valley and Lornex. The Guichon Creek Batholith is composed of multiple intrusive phases, which can be distinguished by both composition and texture. These semi concentric phases are orientated in a north northwesterly orientation, stemming from a root some 8 kilometers down as interpreted form historic gravity data. The author would refer the reader to the numerous geological papers written about this prolific mining district for a detailed overview. The Getty property covers the northern extent of the late Triassic Guichon Creek Batholith. The intrusive rocks ranges in composition ranging from diorite to granodiorite, respective of the phase of emplacement. The property is also underlain by Tertiary sediments and Kamloops Group volcanics dominantly in the north eastern portion of the property.
Peter E. Walcott & Associates Limited 2015 Induced Polarization Survey Geophysical Services Ge tty Property, B.C.
9
REGIONAL & PROPERTY GEOLOGY con’t
General Geology

Peter E. Walcott & Associates Limited 2015 Induced Polarization Survey Geophysical Services Ge tty Property, B.C.
10
PURPOSE. The survey was designed to augment and expand on a previously conducted Titan 24 IP survey, proximal to the Getty West zone. The survey was also designed to test the thickness of volcanic cover to the north over Forge Mountain.

Peter E. Walcott & Associates Limited 2015 Induced Polarization Survey Geophysical Services Ge tty Property, B.C.
11
SURVEY SPECIFICATIONS. The Induced Polarization Survey. The induced polarization (IP) survey was conducted using a pulse type system, the principal components of which were manufactured by Instrumentation GDD of Quebec, Canada. The system consists basically of three units, a receiver (GDD), transmitter (GDD) and a motor generator (Honda). On this survey two transmitters used in series providing a maximum of 8.6 kw d.c. to the ground, obtains their power from two 7.5 kw 60 c.p.s. alternators driven by Honda 14 h.p. gasoline engines. The cycling rate of the transmitter is 2 seconds “current-on” and 2 seconds “current-off” with the pulses reversing continuously in polarity. The data recorded in the field consists of careful measurements of the current (I) in amperes flowing through the current electrodes C1 and C2, the primary voltages (V) appearing between any two potential electrodes, P1 through P5, during the “current-on” part of the cycle, and the apparent chargeability, (Ma) presented as a direct readout in millivolts per volt using a 200 millisecond delay and a 1000 millisecond sample window by the receiver, a digital receiver controlled by a micro-processor – the sample window is actually the total of twenty individual windows of 50 millisecond widths – at any time. The apparent resistivity (a) in ohm metres is proportional to the ratio of the primary voltage and the measured current, the proportionality factor depending on the geometry of the array used. The chargeability and resistivity are called apparent as they are values which that portion of the earth sampled would have if it were homogeneous. As the earth sampled is usually inhomogeneous the calculated apparent chargeability and resistivity are functions of the actual chargeability and resistivity of the rocks. The surveying was carried out using the “pole-dipole” / “dipole-pole” method of survey. With the pre-laid receiver array remaining stationary, the current C1 is moved along the survey lines at a spacing of “a” (the dipole) apart, while the second current electrode, C2, is kept constant at “infinity”. As the current (C1) is injected between the respective potential electrodes, and the receiving array is stationary, both pole-dipole and dipole-pole geometries can be measured with the maximum “n” separation, a function of the length of the receiver array which on this survey was “n” = 19.5, depending on the injection placement.

Peter E. Walcott & Associates Limited 2015 Induced Polarization Survey Geophysical Services Ge tty Property, B.C.
12
SURVEY SPECIFICATIONS cont. The distance, “na” between C1 and the nearest potential electrode generally controls the depth to be explored by the particular separation, “n”, traverse. On this survey a 100 metre dipole separation was utilized. On this survey a total of some 16 kilometres of survey traverses were completed. Horizontal control. The horizontal positions of the stations were recorded using a Garmin GPSmap 60CSx. Data Presentation. The data are presented as individual pseudo section plots of apparent resistivity and apparent chargeability at a scale of 1:10,000 generated using Geosoft Oasis Montaj. 2D inversions of both resistivity and chargeability modelled, using Res2DInv, are also presented at a scale of 1:10,000.

Peter E. Walcott & Associates Limited 2015 Induced Polarization Survey Geophysical Services Ge tty Property, B.C.
13
DISCUSSION OF RESULTS. The 2015 Induced Polarization survey carried on over parts of the Getty Copper property yielded a number of targets of potential interest, solely on the three southern lines, while the three northern lines exhibited no IP response. The lines were positioned to augment the existing deep IP coverage from the earlier Titan 24 survey. Line 3250 was re-read to allow for leveling between the two respective data datasets for future modelling.
Line Location Map with Airborne Magnetics

Peter E. Walcott & Associates Limited 2015 Induced Polarization Survey Geophysical Services Ge tty Property, B.C.
14
DISCUSSION OF RESULTS con’t. Anomaly cA is centered at 40400E on line 3250. This anomaly continues north through to Line 4000N at 40300E where it narrows and appears to truncate, potentially associated with a merging of two weak magnetic trends as seen above. This chargeability is dominantly associated with a higher resistivity unit overlying a flat lying resistivity low. The anomaly is situated within a magnetic low and appears to track the western flank of a weak magnetic feature.
Section 5603250N – Modelled Chargeability
This anomaly has been partially drill tested some 400 meters to the south. Hole 96GL-07 intercepted a broad zone of Tertiary volcanics in the bottom of the hole on the eastern flank of the anomaly within a resistivity low.
Peter E. Walcott & Associates Limited 2015 Induced Polarization Survey Geophysical Services Ge tty Property, B.C.
15
DISCUSSION OF RESULTS con’t.
Section 5603250N – Modelled Resistivity
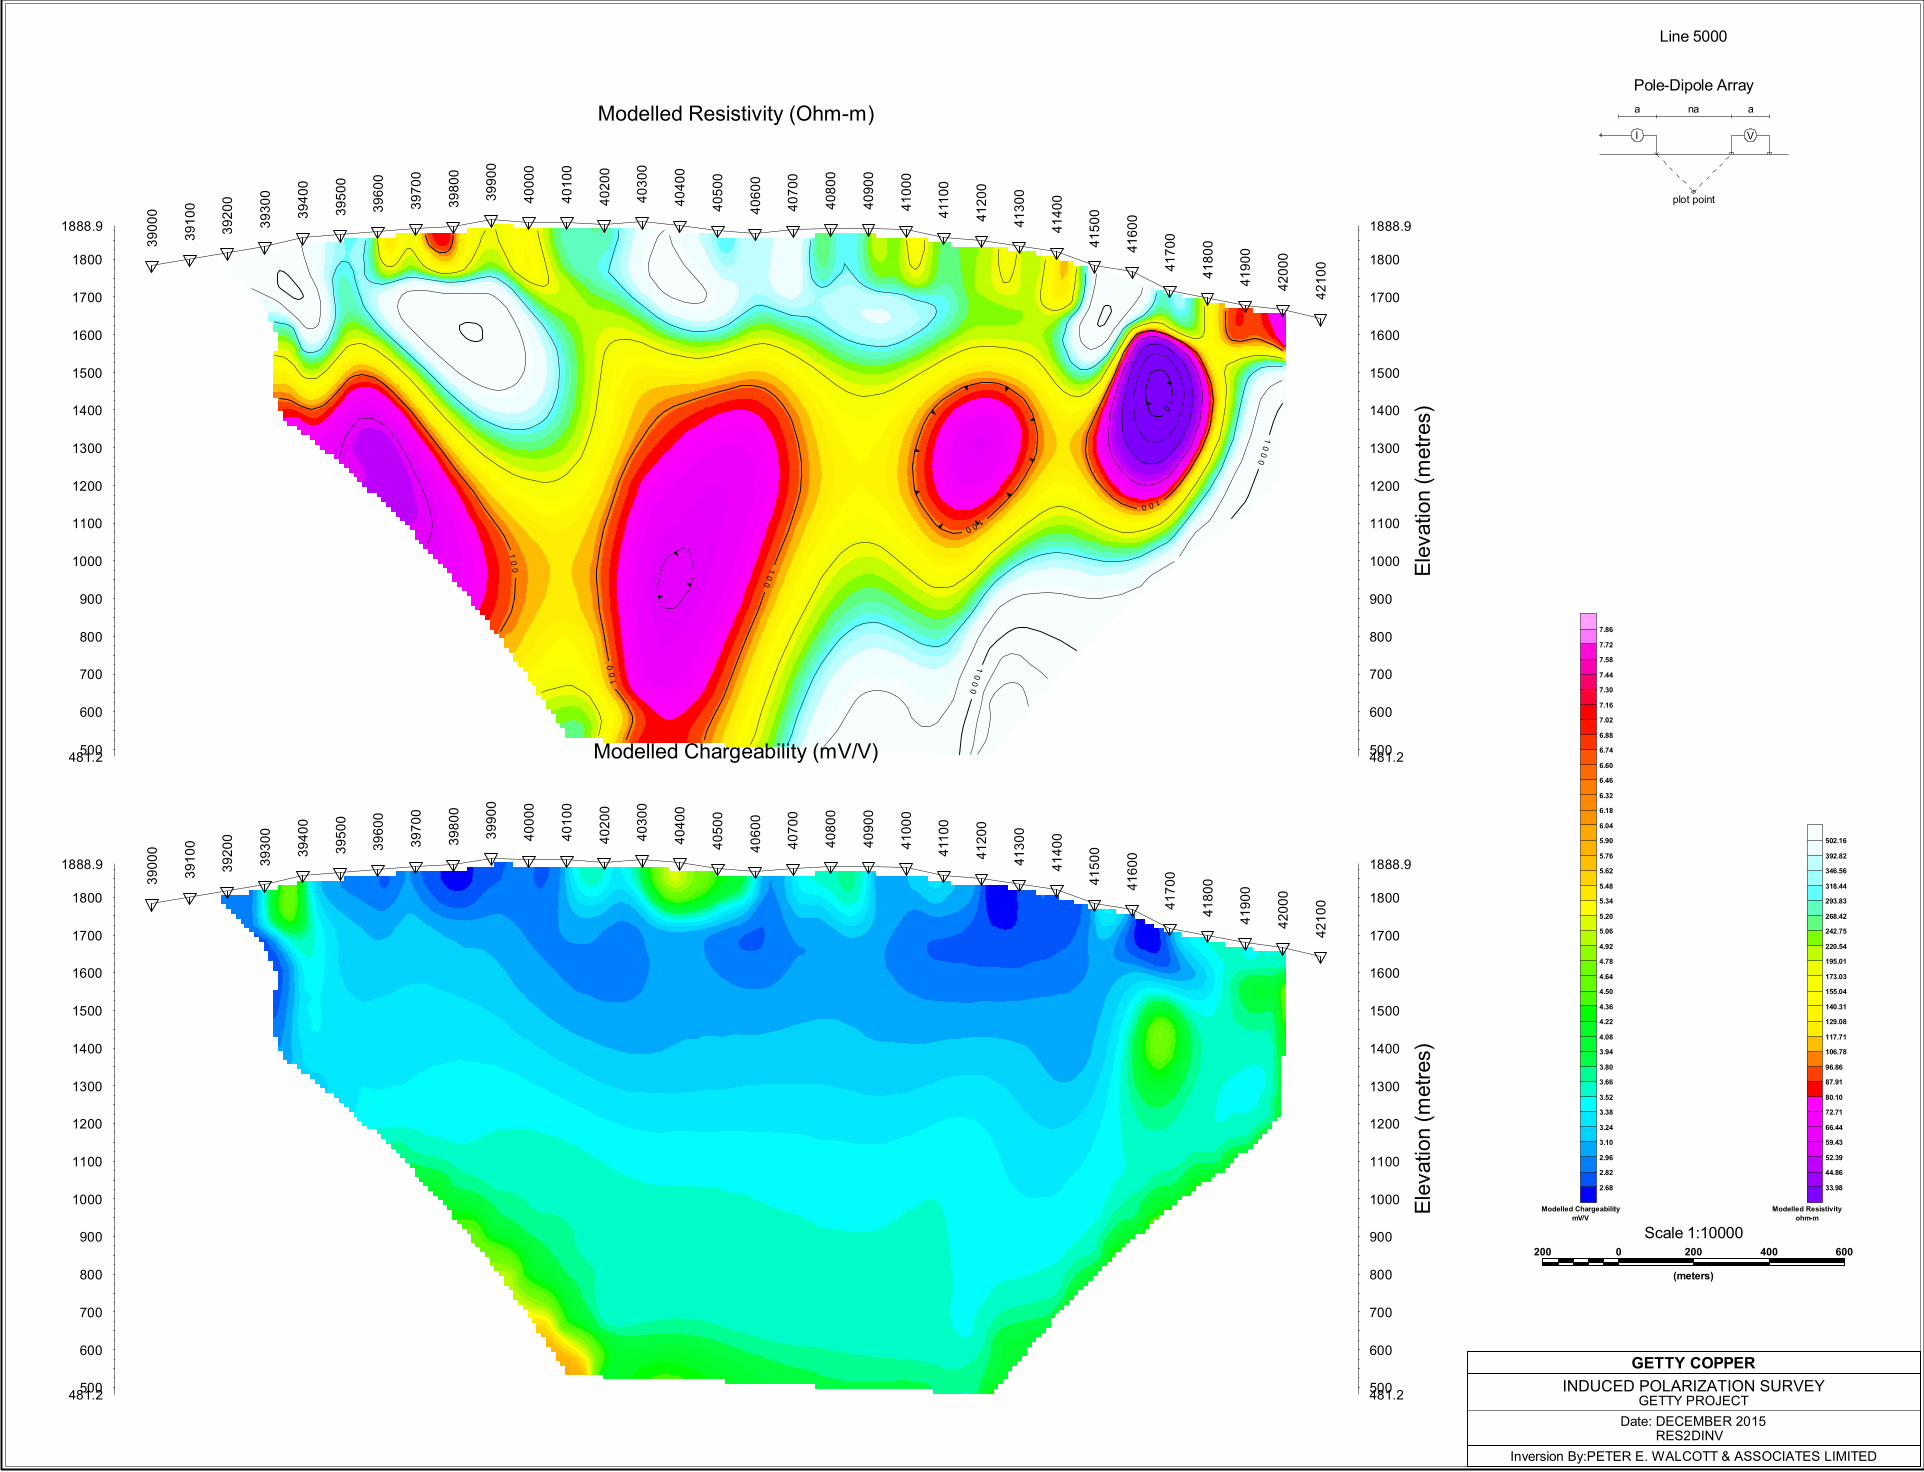
Anomaly cB is centered at 40700E at a depth of some 250 m meters. This chargeability anomaly is associated with a sub-vertical resistivity high. The anomaly is also situated on a magnetic contact. This anomaly is of significant interest as drill hole 96GL-08 intercepted 42 metres grading 0.26% Cu and 0.02% Mo, immediately above the anomaly. Hole 200405A drilled some 100 meters to the north also intersected anomalous copper grades.

Peter E. Walcott & Associates Limited 2015 Induced Polarization Survey Geophysical Services Ge tty Property, B.C.
16
DISCUSSION OF RESULTS con’t. While anomaly cB does not appear to track through line 3500N, a weak feature does appear on Line 4000N on strike and is potentially the same anomaly. The lack of the chargeability response on Line 3500N could be due to an EW magnetic feature observed in the 2015 airborne magnetic survey.

Peter E. Walcott & Associates Limited 2015 Induced Polarization Survey Geophysical Services Ge tty Property, B.C.
17
SUMMARY, CONCLUSIONS & RECOMMENDATIONS. Between November 21st and December 7th, 2015, Peter E. Walcott & Associates Limited undertook induced polarization surveying over parts Getty property, located in the Logan Lake area of British Columbia, for Getty Copper Inc. The survey consisted of 6 east west orientated traverses, spaced between 250 m and 500 meters apart for a total of some 16 line kilometers of deep penetrating induced polarization surveying. The survey was hampered with access issues due to heavy snows, this limiting the program. The survey was designed to augment existing Titan 24 IP coverage conducted in 2010 over the Getty North and Getty South deposits, and to attempt to define targets in the Getty West zone. The survey identified and confirmed two chargeability targets proximal to the Getty West; Anomaly cA a broad anomaly, which has been partially drill tested south to the south with no significant results; Anomaly cB a deep chargeability anomaly where two historic drill holes yielded elevated copper grades proximal to the anomaly. This anomaly is of significant interest. A detailed review of all drill logs, and potential re-logging of holes within the Getty West zone should be undertaken by a geologist experienced in the Highland Valley exploration. Physical property measurement should also be undertaken, in order to understand better understand the geophysical response of the respective units. A full 3D inversion merging both the Titan and Walcott deep penetrating IP should be undertaken, and the results of the above exercises merged into a 3D compilation, prior to drill testing. Respectfully submitted, PETER E. WALCOTT & ASSOCIATES LTD. Alexander Walcott, B.Sc. Peter E. Walcott, P.Eng. Geophysicist Geophysicist Coquitlam, B.C. August 2016

Peter E. Walcott & Associates Limited 2015 Induced Polarization Survey Geophysical Services Ge tty Property, B.C.
18
APPENDIX I

Peter E. Walcott & Associates Limited 2015 Induced Polarization Survey Geophysical Services Ge tty Property, B.C.
19
COST OF PROJECT. Peter E. Walcott & Associates Limited undertook the survey on a daily basis providing a six man crew, IP equipment, GPS, altimeters and a 4x4 truck for a total of $66,750.00. Accommodation and fuel were billed at $ 11,068.64, while mobilization costs of $3,500.00 were incurred, so that the total cost of services provided was $ 88,818.64. A further 10% management and administration fee was accrued by Getty Copper, thus a total cost of $96,999.804 was incurred on this project.

Peter E. Walcott & Associates Limited 2015 Induced Polarization Survey Geophysical Services Ge tty Property, B.C.
20
PERSONNEL EMPLOYED ON PROJECT. Name Occupation Address Dates Peter E. Walcott Geophysicist Unit 111- 17,
Fawcett Rd. Coquitlam, B.C. V3K 6V2
Alexander Walcott
"
"
Marek Welz “
Nov. 20th – Dec 8th, 2015
Patrick Young “ “ Tom Kocan
Geophysical
Operator
“ Matt Magee “ “ Chris Roe
“
“

Peter E. Walcott & Associates Limited 2015 Induced Polarization Survey Geophysical Services Ge tty Property, B.C.
21
CERTIFICATION. I, Peter E. Walcott, of 605 Rutland Court, Coquitlam, British Columbia, hereby certify that:
1. I am a graduate of the University of Toronto in 1962 with a B.A.Sc. in Engineering Physics, Geophysics Option.
2. I have been practicing my profession for the last fifty four years.
3. I am a member of the Association of Professional Engineers of British
Columbia and Ontario.
4. I hold no interest, direct or indirect, in the property, nor do I expect to receive any.
Peter E. Walcott, P.Eng. Coquitlam, B.C. August 2016
Peter E. Walcott & Associates Limited 2015 Induced Polarization Survey Geophysical Services Ge tty Property, B.C.
22
CERTIFICATION. I, Alexander Walcott, of 38-181 Ravine Dr., Port Moody, British Columbia, hereby certify that:
1. I am a graduate of the University of Alberta with a B.Sc. Earth Sciences Major, with a Physics Minor.
2. I have been active in mineral exploration for the past 20 years. 3. I hold no interest, direct or indirect, in the property, nor do I expect to
receive any.
Alexander Walcott Coquitlam, B.C. August 2016

Peter E. Walcott & Associates Limited 2015 Induced Polarization Survey Geophysical Services Ge tty Property, B.C.
23
CLAIM LIST
Title
Number
Claim
Name
Owner Issue Date
Good To
Date
Status
Area
(ha)
218508 GETTY #80 133231 100% 1989/jun/10 2020/may/12 GOOD 25.00
218509 GETTY #81 133231 100% 1989/jun/10 2020/may/12 GOOD 25.00
218510
GETTY #82
FR. 133231 100% 1989/jun/10 2020/may/12 GOOD 25.00
218511
GETTY #83 FR.
133231 100% 1989/jun/10 2020/may/12 GOOD 25.00
221561 GETTY #1 133231 100% 1974/aug/06 2020/may/12 GOOD 25.00
221562 GETTY #2 133231 100% 1974/aug/06 2020/may/12 GOOD 25.00
221563 GETTY #3 133231 100% 1974/aug/16 2020/may/12 GOOD 25.00
221564 GETTY #4 133231 100% 1974/aug/16 2020/may/12 GOOD 25.00
221565 GETTY #5 133231 100% 1974/aug/16 2020/may/12 GOOD 25.00
221566 GETTY #6 133231 100% 1974/aug/16 2020/may/12 GOOD 25.00
221567 GETTY #7 133231 100% 1974/aug/16 2020/may/12 GOOD 25.00
221568 GETTY #8 133231 100% 1974/aug/16 2020/may/12 GOOD 25.00
221569 GETTY #9 133231 100% 1974/jul/16 2020/may/12 GOOD 25.00
221570 GETTY #10 133231 100% 1974/aug/16 2020/may/12 GOOD 25.00
221571 GETTY #11 133231 100% 1974/aug/16 2020/may/12 GOOD 25.00
221572 GETTY #12 133231 100% 1974/aug/16 2020/may/12 GOOD 25.00
221573 GETTY #13 133231 100% 1974/aug/16 2020/may/12 GOOD 25.00
221574 GETTY #14 133231 100% 1974/aug/16 2020/may/12 GOOD 25.00
221575 GETTY #15 133231 100% 1974/aug/16 2020/may/12 GOOD 25.00
221576 GETTY #16 133231 100% 1974/aug/16 2020/may/12 GOOD 25.00
221577 GETTY #17 133231 100% 1974/aug/16 2020/may/12 GOOD 25.00
221578 GETTY #18 133231 100% 1974/aug/16 2020/may/12 GOOD 25.00
221579 GETTY #19 133231 100% 1974/aug/16 2020/may/12 GOOD 25.00
221580 GETTY #20 133231 100% 1974/aug/16 2020/may/12 GOOD 25.00
221581 GETTY #21 133231 100% 1974/aug/16 2020/may/12 GOOD 25.00
221582 GETTY #22 133231 100% 1974/aug/16 2020/may/12 GOOD 25.00
221583 GETTY #23 133231 100% 1974/aug/16 2020/may/12 GOOD 25.00
221584 GETTY #24 133231 100% 1974/aug/16 2020/may/12 GOOD 25.00

Peter E. Walcott & Associates Limited 2015 Induced Polarization Survey Geophysical Services Ge tty Property, B.C.
24
221585
GETTY A
FR 133231 100% 1974/aug/16 2020/may/12 GOOD 25.00
332395 BRAM 2 133231 100% 1994/nov/08 2017/may/15 GOOD 500.00
347448 GETTY #95 133231 100% 1996/jun/16 2017/may/15 GOOD 400.00
352941
GETTY
#113 133231 100% 1996/dec/04 2017/may/15 GOOD 25.00
412799
GETTY 2405
133231 100% 2004/jul/17 2017/may/15 GOOD 25.00
412800
GETTY
2406 133231 100% 2004/jul/17 2017/may/15 GOOD 25.00
519232
GETTY
SOUTH1 133231 100% 2005/aug/22 2017/may/15 GOOD 123.22
519235
GETTY
SOUTH 2 133231 100% 2005/aug/22 2018/may/31 GOOD 82.13
519237
GETTY
SOUTH 3 133231 100% 2005/aug/22 2017/may/15 GOOD 164.31
526953 GSOUTH 1 133231 100% 2006/feb/02 2018/may/31 GOOD 143.75
543766
GETTY
WEST 133231 100% 2006/oct/22 2017/may/15 GOOD 307.92
614103 133231 100% 2009/aug/01 2017/may/15 GOOD 164.14
614104 133231 100% 2009/aug/01 2017/may/15 GOOD 102.55
614123 133231 100% 2009/aug/01 2017/may/15 GOOD 204.89
616307 GWEN 133231 100% 2009/aug/08 2017/may/15 GOOD 20.49
621143
THE
BRIED'SG&G 133231 100% 2009/aug/18 2017/may/15 GOOD 348.44
640843 133231 100% 2009/sep/25 2017/may/15 GOOD 41.06
757822 133231 100% 2010/apr/26 2017/may/15 GOOD 1538.95
757882 133231 100% 2010/apr/26 2017/may/15 GOOD 1660.28
757902 133231 100% 2010/apr/26 2017/may/15 GOOD 1229.67
757962 133231 100% 2010/apr/26 2017/may/15 GOOD 1579.46
758022 133231 100% 2010/apr/26 2017/may/15 GOOD 1107.68
758222 133231 100% 2010/apr/26 2017/may/15 GOOD 1517.28
758422 133231 100% 2010/apr/26 2017/may/15 GOOD 1313.52
758483 133231 100% 2010/apr/26 2017/may/15 GOOD 20.51
758842 133231 100% 2010/apr/27 2017/may/15 GOOD 512.31
758882 133231 100% 2010/apr/27 2017/may/15 GOOD 1663.04
758902 133231 100% 2010/apr/27 2017/may/15 GOOD 553.68
758963 133231 100% 2010/apr/27 2017/may/15 GOOD 840.83
759302 133231 100% 2010/apr/27 2017/may/15 GOOD 1003.86
759342 133231 100% 2010/apr/27 2017/may/15 GOOD 574.41
759362 133231 100% 2010/apr/27 2017/may/15 GOOD 839.82

Peter E. Walcott & Associates Limited 2015 Induced Polarization Survey Geophysical Services Ge tty Property, B.C.
25
759402 133231 100% 2010/apr/27 2017/may/15 GOOD 942.97
759422 133231 100% 2010/apr/27 2017/may/15 GOOD 553.56
759482 133231 100% 2010/apr/27 2017/may/15 GOOD 615.55
759522 133231 100% 2010/apr/27 2017/may/15 GOOD 902.90
759562 133231 100% 2010/apr/27 2017/may/15 GOOD 1108.66
759702 133231 100% 2010/apr/28 2017/may/15 GOOD 164.38
759802 133231 100% 2010/apr/28 2017/may/15 GOOD 20.54
766082 133231 100% 2010/may/03 2020/may/12 GOOD 41.04
768142 BLU 133231 100% 2010/may/05 2017/may/15 GOOD 40.95
768162 133231 100% 2010/may/05 2017/may/15 GOOD 512.45
844516 133231 100% 2011/jan/26 2017/may/15 GOOD 20.51
917949 133231 100% 2011/oct/18 2017/may/15 GOOD 246.09
920784 133231 100% 2011/oct/21 2017/may/15 GOOD 246.23
937922 133231 100% 2011/dec/19 2017/may/15 GOOD 266.70
1011732 133231 100% 2012/aug/02 2017/may/15 GOOD 266.71
1011733 133231 100% 2012/aug/02 2017/may/15 GOOD 205.10
1011734 133231 100% 2012/aug/02 2017/may/15 GOOD 41.03
1027750 GETTY BT1 133231 100% 2014/apr/22 2017/may/15 GOOD 840.43
1027751 GETTY BT2 133231 100% 2014/apr/22 2017/may/15 GOOD 737.65
1027752 GETTY BT3 133231 100% 2014/apr/22 2017/may/15 GOOD 409.80
1033130 133231 100% 2015/jan/05 2017/may/15 GOOD 82.00

Peter E. Walcott & Associates Limited 2015 Induced Polarization Survey Geophysical Services Ge tty Property, B.C.
26
REFERENCES. Ager, C.A, McMillan, W.J., Ulrych, T.J, Bulletin 62: Gravity, Magnetics and Geology of the Guichon Creek Batholith, 1972 British Columbia Department of Mines and Petroleum Resources Bond, L., Graden, R. – Diamond Drilling Report on the Highland Valley Copper Getty Copper Option, 2005, BC Assessment Report 28084 Evans, G. Hewson, C. – 2005 Assessment Report, Geological Mapping, Line Cutting and Induced Polarization Geophysics on the Getty Copper Option, 2005, BC Assessment Report 28072 Geoscience BC, - Quest South Airborne Gravity Dataset, 2010 Northcote, K.E., Bulletin 56: Geology and Geochronology of the Guichon Creek Batholith, 1969 British Columbia Department of Mines and Petroleum Resources Perry, Bruce J, - Report on Diamond Drilling At The Getty North (Krain), Getty South( Trojan (South Seas), and Getty West (Transvaal) Areas, Highland Valley, 1996, BC Assessment Report 24692 Tournerie, B., Verweerd, A. , Metcalfe, J. – Titan 24 DC/IP/MT Survey Geophysical Report, Getty Project, 2011, BC Assessment Report 32370 Walcott, Peter E., - A Geophysical Report on Induced Polarization Surveying, Getty Property, 1996, BC. Assessment Report 24476

55
96
00
05
60
00
00
56
04
00
05
60
80
00
56
12
00
05
61
60
00
55
96
00
05
60
00
00
56
04
00
05
60
80
00
56
12
00
05
61
60
00
618000 620000 622000 624000 626000 628000 630000 632000 634000 636000 638000 640000 642000 644000 646000 648000 650000 652000 654000
618000 620000 622000 624000 626000 628000 630000 632000 634000 636000 638000 640000 642000 644000 646000 648000 650000 652000 654000
2000 0 2000 4000 6000
(meters)
Scale 1:100000
GETTY COPPER INC.INDUCED POLARIZATION SURVEY
LINE LOCATION
GETTY PROPERTYLOGAN LAKE AREA, B.C.
DECEMBER 2015
PETER E. WALCOTT & ASSOCIATES LIMITED

200 0 200 400 600
(meters)
NAD83(CSRS) / UTM zone 10N
Scale 1:10000
GETTY COPPER INC.
INDUCED POLARIZATION SURVEYCLAIM AND LINE LOCATION MAP
GETTY PROPERTYLOGAN LAKE AREA, B.C.
DECEMBER 2015
PETER E. WALCOTT & ASSOCIATES LIMITED
L3250 N L3250 N
L4000 N L4000 N
L3500 N L3500 N
L5000 N L5000 N
L5500 N L5500 N
L4500 N L4500 N
56
03
50
05
60
40
00
56
04
50
05
60
50
00
56
05
50
0
56
03
50
05
60
40
00
56
04
50
05
60
50
00
56
05
50
0
639000 639500 640000 640500 641000 641500 642000
639000 639500 640000 640500 641000 641500 642000
38950
39050
39150
39250
39300
39350
39400
39450
39500
39550
39600
39650
39700
39750
39800
39850
39900
39950
40000
40050
40100
40150
40200
40250
40300
40350
40400
40450
40500
40550
40600
40650
40700
40750
40800
40850
40900
40950
41000
41050
41100
41150
41200
41250
41300
41350
41450
41550
41650
38950
39050
39150
39250
39300
39350
39400
39450
39500
39550
39600
39650
39700
39750
39800
39850
39900
39950
40000
40050
40100
40150
40200
40250
40300
40350
40400
40450
40500
40550
40600
40650
40700
40750
40800
40850
40900
40950
41000
41050
41100
41150
41200
41250
41300
38950
39050
39150
39250
39300
39350
39400
39450
39500
39550
39600
39650
39700
39750
39900
39950
40000
40050
40100
40150
40200
40250
40300
40350
40450
40650
40700
40750
40800
40850
40900
40950
41000
41050
41100
41150
41200
41250
41300
39300
39350
39400
39450
39500
39550
39600
39650
39700
39750
39800
39850
39900
39950
40000
40050
40100
40150
40200
40250
40300
40350
40400
40450
40500
40550
40600
40650
40700
40750
40800
40850
40900
40950
41000
41050
41100
41150
41200
41250
41300
41300
41350
41400
41450
41500
41550
41600
41650
41700
41750
41800
41850
41900
41950
42000
42050
42150
38850
38950
39050
39150
39250
39300
39350
39400
39450
39500
39550
39600
39650
39700
39750
39800
39850
39900
39950
40000
40050
40100
40150
40200
40250
40300
40350
40400
40450
40500
40550
40600
40650
40700
40750
40800
40850
40900
40950
41000
41050
41100
41150
41200
41250
41300
41350
41400
41450
41500
41550
41600
41650
41700
41750
41800
41850
41900
41950
42000
42050
42150
38950
39050
39150
39250
39300
39350
39400
39450
39500
39550
39600
39650
39700
39750
39800
39850
39900
39950
40000
40050
40100
40150
40200
40250
40300
40350
40400
40450
40500
40550
40600
40650
40700
40750
40800
40850
40900
40950
41000
41050
41100
41150
41200
41250
41300
41350
41450
41550
41625

200 0 200 400 600
(meters)
NAD83(CSRS) / UTM zone 10N
Scale 1:10000
GETTY COPPER INC.
INDUCED POLARIZATION SURVEYLINE LOCATION on TMI (nT)
GETTY PROPERTYLOGAN LAKE AREA, B.C.
DECEMBER 2015
PETER E. WALCOTT & ASSOCIATES LIMITED
54881.2
55026.5
55105.4
55161.3
55209.0
55250.9
55287.1
55319.8
55348.3
55374.9
55399.9
55424.5
55447.2
55470.5
55493.8
55516.2
55538.1
55559.7
55582.2
55604.0
55625.0
55646.7
55669.0
55691.5
55715.2
55740.6
55766.5
55794.9
55826.5
55860.0
55896.4
55938.1
55987.0
56044.4
56116.6
56206.4
56332.2
56576.8
nT
L3250 N L3250 N
L4000 N L4000 N
L3500 N L3500 N
L5000 N L5000 N
L5500 N L5500 N
L4500 N L4500 N
56
03
50
05
60
40
00
56
04
50
05
60
50
00
56
05
50
0
56
03
50
05
60
40
00
56
04
50
05
60
50
00
56
05
50
0
639000 639500 640000 640500 641000 641500 642000
639000 639500 640000 640500 641000 641500 642000
38950
39050
39150
39250
39300
39350
39400
39450
39500
39550
39600
39650
39700
39750
39800
39850
39900
39950
40000
40050
40100
40150
40200
40250
40300
40350
40400
40450
40500
40550
40600
40650
40700
40750
40800
40850
40900
40950
41000
41050
41100
41150
41200
41250
41300
41350
41450
41550
41650
38950
39050
39150
39250
39300
39350
39400
39450
39500
39550
39600
39650
39700
39750
39800
39850
39900
39950
40000
40050
40100
40150
40200
40250
40300
40350
40400
40450
40500
40550
40600
40650
40700
40750
40800
40850
40900
40950
41000
41050
41100
41150
41200
41250
41300
38950
39050
39150
39250
39300
39350
39400
39450
39500
39550
39600
39650
39700
39750
39900
39950
40000
40050
40100
40150
40200
40250
40300
40350
40450
40650
40700
40750
40800
40850
40900
40950
41000
41050
41100
41150
41200
41250
41300
39300
39350
39400
39450
39500
39550
39600
39650
39700
39750
39800
39850
39900
39950
40000
40050
40100
40150
40200
40250
40300
40350
40400
40450
40500
40550
40600
40650
40700
40750
40800
40850
40900
40950
41000
41050
41100
41150
41200
41250
41300
41300
41350
41400
41450
41500
41550
41600
41650
41700
41750
41800
41850
41900
41950
42000
42050
42150
38850
38950
39050
39150
39250
39300
39350
39400
39450
39500
39550
39600
39650
39700
39750
39800
39850
39900
39950
40000
40050
40100
40150
40200
40250
40300
40350
40400
40450
40500
40550
40600
40650
40700
40750
40800
40850
40900
40950
41000
41050
41100
41150
41200
41250
41300
41350
41400
41450
41500
41550
41600
41650
41700
41750
41800
41850
41900
41950
42000
42050
42150
38950
39050
39150
39250
39300
39350
39400
39450
39500
39550
39600
39650
39700
39750
39800
39850
39900
39950
40000
40050
40100
40150
40200
40250
40300
40350
40400
40450
40500
40550
40600
40650
40700
40750
40800
40850
40900
40950
41000
41050
41100
41150
41200
41250
41300
41350
41450
41550
41625

GETTY COPPER
INDUCED POLARIZATION SURVEYGETTY PROJECT
Date: DECEMBER 2015RES2DINV
Inversion By:PETER E. WALCOTT & ASSOCIATES LIMITED
200 0 200 400 600
(meters)
Scale 1:10000
Line 3250
Pole-Dipole Array
VI
a na a
plot point
1.79
2.42
2.80
3.10
3.34
3.54
3.73
3.90
4.05
4.20
4.34
4.47
4.60
4.72
4.84
4.96
5.07
5.19
5.30
5.42
5.53
5.65
5.76
5.88
6.00
6.13
6.25
6.38
6.52
6.67
6.82
6.99
7.18
7.39
7.63
7.92
8.30
8.93
Modelled Chargeability
mV/V
33.98
44.86
52.39
59.43
66.44
72.71
80.10
87.91
96.86
106.78
117.71
129.08
140.31
155.04
173.03
195.01
220.54
242.75
268.42
293.83
318.44
346.56
392.82
502.16
Modelled Resistivity
ohm-m
800
900
1000
1100
1200
1300
1400
1500
1600
1700
735.5
1763.17
800
900
1000
1100
1200
1300
1400
1500
1600
1700
735.5
1763.17
Modelled Chargeability (mV/V)
Ele
vation (
metr
es)
39
00
0
39
10
0
39
20
0
39
30
0
39
40
0
39
50
0
39
60
0
39
70
0
39
80
0
39
90
0
40
00
0
40
10
0
40
20
0
40
30
0
40
40
0
40
50
0
40
60
0
40
70
0
40
80
0
40
90
0
41
00
0
411
00
41
20
0
41
30
0
41
40
0
41
50
0
41
60
0
cA
cB
800
900
1000
1100
1200
1300
1400
1500
1600
1700
735.5
1763.17
800
900
1000
1100
1200
1300
1400
1500
1600
1700
735.5
1763.17
Modelled Resistivity (Ohm-m)
Ele
vation (
metr
es)
1 0 0
10
0
00
1
100
100
39
00
0
39
10
0
39
20
0
39
30
0
39
40
0
39
50
0
39
60
0
39
70
0
39
80
0
39
90
0
40
00
0
40
10
0
40
20
0
40
30
0
40
40
0
40
50
0
40
60
0
40
70
0
40
80
0
40
90
0
41
00
0
411
00
41
20
0
41
30
0
41
40
0
41
50
0
41
60
0

GETTY COPPER
INDUCED POLARIZATION SURVEYGETTY PROJECT
Date: DECEMBER 2015RES2DINV
Inversion By:PETER E. WALCOTT & ASSOCIATES LIMITED
200 0 200 400 600
(meters)
Scale 1:10000
Line 3500
Pole-Dipole Array
VI
a na a
plot point
2.68
2.82
2.96
3.10
3.24
3.38
3.52
3.66
3.80
3.94
4.08
4.22
4.36
4.50
4.64
4.78
4.92
5.06
5.20
5.34
5.48
5.62
5.76
5.90
6.04
6.18
6.32
6.46
6.60
6.74
6.88
7.02
7.16
7.30
7.44
7.58
7.72
7.86
Modelled Chargeability
mV/V
33.98
44.86
52.39
59.43
66.44
72.71
80.10
87.91
96.86
106.78
117.71
129.08
140.31
155.04
173.03
195.01
220.54
242.75
268.42
293.83
318.44
346.56
392.82
502.16
Modelled Resistivity
ohm-m
800
900
1000
1100
1200
1300
1400
1500
1600
1700
741.22
1795
800
900
1000
1100
1200
1300
1400
1500
1600
1700
741.22
1795
Modelled Chargeability (mV/V)
Ele
vation (
metr
es)
39
00
0
39
10
0
39
20
0
39
30
0
39
40
0
39
50
0
39
60
0
39
70
0
39
80
0
39
90
0
40
00
0
40
10
0
40
20
0
40
30
0
40
40
0
40
50
0
40
60
0
40
70
0
40
80
0
40
90
0
41
00
0
411
00
41
20
0
41
30
0
41
40
0
41
50
0
41
60
0
cA
800
900
1000
1100
1200
1300
1400
1500
1600
1700
741.22
1795
800
900
1000
1100
1200
1300
1400
1500
1600
1700
741.22
1795
Modelled Resistivity (Ohm-m)
Ele
vation (
metr
es)
1 0 0
10
0
100
00
1
39
00
0
39
10
0
39
20
0
39
30
0
39
40
0
39
50
0
39
60
0
39
70
0
39
80
0
39
90
0
40
00
0
40
10
0
40
20
0
40
30
0
40
40
0
40
50
0
40
60
0
40
70
0
40
80
0
40
90
0
41
00
0
411
00
41
20
0
41
30
0
41
40
0
41
50
0
41
60
0

GETTY COPPER
INDUCED POLARIZATION SURVEYGETTY PROJECT
Date: DECEMBER 2015RES2DINV
Inversion By:PETER E. WALCOTT & ASSOCIATES LIMITED
100 0 100 200 300 400 500 600 700
(meters)
Scale 1:10000
Line 4000
Pole-Dipole Array
VI
a na a
plot point
2.68
2.82
2.96
3.10
3.24
3.38
3.52
3.66
3.80
3.94
4.08
4.22
4.36
4.50
4.64
4.78
4.92
5.06
5.20
5.34
5.48
5.62
5.76
5.90
6.04
6.18
6.32
6.46
6.60
6.74
6.88
7.02
7.16
7.30
7.44
7.58
7.72
7.86
Modelled Chargeability
mV/V
33.98
44.86
52.39
59.43
66.44
72.71
80.10
87.91
96.86
106.78
117.71
129.08
140.31
155.04
173.03
195.01
220.54
242.75
268.42
293.83
318.44
346.56
392.82
502.16
Modelled Resistivity
ohm-m
900
1000
1100
1200
1300
1400
1500
1600
1700
1800
1900
804.28
1941.19
900
1000
1100
1200
1300
1400
1500
1600
1700
1800
1900
804.28
1941.19
Modelled Chargeability (mV/V)
Ele
vation (
metr
es)
39
10
0
39
20
0
39
30
0
39
40
0
39
50
0
39
60
0
39
70
0
39
80
0
39
90
0
40
00
0
40
10
0
40
20
0
40
30
0
40
40
0
40
50
0
40
60
0
40
70
0
40
80
0
40
90
0
41
00
0
411
00
41
20
0
41
30
0
41
40
0
41
50
0
41
60
0
cA
cB
900
1000
1100
1200
1300
1400
1500
1600
1700
1800
1900
804.28
1941.19
900
1000
1100
1200
1300
1400
1500
1600
1700
1800
1900
804.28
1941.19
Modelled Resistivity (Ohm-m)
Ele
vation (
metr
es)
10
0
0 0 1
100
39
10
0
39
20
0
39
30
0
39
40
0
39
50
0
39
60
0
39
70
0
39
80
0
39
90
0
40
00
0
40
10
0
40
20
0
40
30
0
40
40
0
40
50
0
40
60
0
40
70
0
40
80
0
40
90
0
41
00
0
411
00
41
20
0
41
30
0
41
40
0
41
50
0
41
60
0

GETTY COPPER
INDUCED POLARIZATION SURVEYGETTY PROJECT
Date: DECEMBER 2015RES2DINV
Inversion By:PETER E. WALCOTT & ASSOCIATES LIMITED
200 0 200 400 600
(meters)
Scale 1:10000
Line 4500
Pole-Dipole Array
VI
a na a
plot point
2.68
2.82
2.96
3.10
3.24
3.38
3.52
3.66
3.80
3.94
4.08
4.22
4.36
4.50
4.64
4.78
4.92
5.06
5.20
5.34
5.48
5.62
5.76
5.90
6.04
6.18
6.32
6.46
6.60
6.74
6.88
7.02
7.16
7.30
7.44
7.58
7.72
7.86
Modelled Chargeability
mV/V
33.98
44.86
52.39
59.43
66.44
72.71
80.10
87.91
96.86
106.78
117.71
129.08
140.31
155.04
173.03
195.01
220.54
242.75
268.42
293.83
318.44
346.56
392.82
502.16
Modelled Resistivity
ohm-m
900
1000
1100
1200
1300
1400
1500
1600
1700
1800
1900
818.28
1941.55
900
1000
1100
1200
1300
1400
1500
1600
1700
1800
1900
818.28
1941.55
Modelled Chargeability (mV/V)
Ele
vation (
metr
es)
39
00
0
39
10
0
39
20
0
39
30
0
39
40
0
39
50
0
39
60
0
39
70
0
39
80
0
39
90
0
40
00
0
40
10
0
40
20
0
40
30
0
40
40
0
40
50
0
40
60
0
40
70
0
40
80
0
40
90
0
41
00
0
411
00
41
20
0
41
30
0
41
40
0
41
50
0
41
60
0
900
1000
1100
1200
1300
1400
1500
1600
1700
1800
1900
818.28
1941.55
900
1000
1100
1200
1300
1400
1500
1600
1700
1800
1900
818.28
1941.55
Modelled Resistivity (Ohm-m)
Ele
vation (
metr
es)
00
1
100
10
0
10
0
00
1
39
00
0
39
10
0
39
20
0
39
30
0
39
40
0
39
50
0
39
60
0
39
70
0
39
80
0
39
90
0
40
00
0
40
10
0
40
20
0
40
30
0
40
40
0
40
50
0
40
60
0
40
70
0
40
80
0
40
90
0
41
00
0
411
00
41
20
0
41
30
0
41
40
0
41
50
0
41
60
0
GETTY COPPER
INDUCED POLARIZATION SURVEYGETTY PROJECT
Date: DECEMBER 2015RES2DINV
Inversion By:PETER E. WALCOTT & ASSOCIATES LIMITED
200 0 200 400 600
(meters)
Scale 1:10000
Line 5000
Pole-Dipole Array
VI
a na a
plot point
2.68
2.82
2.96
3.10
3.24
3.38
3.52
3.66
3.80
3.94
4.08
4.22
4.36
4.50
4.64
4.78
4.92
5.06
5.20
5.34
5.48
5.62
5.76
5.90
6.04
6.18
6.32
6.46
6.60
6.74
6.88
7.02
7.16
7.30
7.44
7.58
7.72
7.86
Modelled Chargeability
mV/V
33.98
44.86
52.39
59.43
66.44
72.71
80.10
87.91
96.86
106.78
117.71
129.08
140.31
155.04
173.03
195.01
220.54
242.75
268.42
293.83
318.44
346.56
392.82
502.16
Modelled Resistivity
ohm-m
500
600
700
800
900
1000
1100
1200
1300
1400
1500
1600
1700
1800
481.2
1888.9
500
600
700
800
900
1000
1100
1200
1300
1400
1500
1600
1700
1800
481.2
1888.9
Modelled Chargeability (mV/V)
Ele
vation (
metr
es)
39
00
0
39
10
0
39
20
0
39
30
0
39
40
0
39
50
0
39
60
0
39
70
0
39
80
0
39
90
0
40
00
0
40
10
0
40
20
0
40
30
0
40
40
0
40
50
0
40
60
0
40
70
0
40
80
0
40
90
0
41
00
0
411
00
41
20
0
41
30
0
41
40
0
41
50
0
41
60
0
41
70
0
41
80
0
41
90
0
42
00
0
42
10
0
500
600
700
800
900
1000
1100
1200
1300
1400
1500
1600
1700
1800
481.2
1888.9
500
600
700
800
900
1000
1100
1200
1300
1400
1500
1600
1700
1800
481.2
1888.9
Modelled Resistivity (Ohm-m)
Ele
vation (
metr
es)0
1
10
0
10
0
00
1
0 01
0 0 1
00
01
00
01
39
00
0
39
10
0
39
20
0
39
30
0
39
40
0
39
50
0
39
60
0
39
70
0
39
80
0
39
90
0
40
00
0
40
10
0
40
20
0
40
30
0
40
40
0
40
50
0
40
60
0
40
70
0
40
80
0
40
90
0
41
00
0
411
00
41
20
0
41
30
0
41
40
0
41
50
0
41
60
0
41
70
0
41
80
0
41
90
0
42
00
0
42
10
0

GETTY COPPER
INDUCED POLARIZATION SURVEYGETTY PROJECT
Date: DECEMBER 2015RES2DINV
Inversion By:PETER E. WALCOTT & ASSOCIATES LIMITED
200 0 200 400 600
(meters)
Scale 1:10000
Line 5500
Pole-Dipole Array
VI
a na a
plot point
2.68
2.82
2.96
3.10
3.24
3.38
3.52
3.66
3.80
3.94
4.08
4.22
4.36
4.50
4.64
4.78
4.92
5.06
5.20
5.34
5.48
5.62
5.76
5.90
6.04
6.18
6.32
6.46
6.60
6.74
6.88
7.02
7.16
7.30
7.44
7.58
7.72
7.86
Modelled Chargeability
mV/V
33.98
44.86
52.39
59.43
66.44
72.71
80.10
87.91
96.86
106.78
117.71
129.08
140.31
155.04
173.03
195.01
220.54
242.75
268.42
293.83
318.44
346.56
392.82
502.16
Modelled Resistivity
ohm-m
500
600
700
800
900
1000
1100
1200
1300
1400
1500
1600
1700
1800
451.03
1838.96
500
600
700
800
900
1000
1100
1200
1300
1400
1500
1600
1700
1800
451.03
1838.96
Modelled Chargeability (mV/V)
Ele
vation (
metr
es)
38
90
0
39
00
0
39
10
0
39
20
0
39
30
0
39
40
0
39
50
0
39
60
0
39
70
0
39
80
0
39
90
0
40
00
0
40
10
0
40
20
0
40
30
0
40
40
0
40
50
0
40
60
0
40
70
0
40
80
0
40
90
0
41
00
0
411
00
41
20
0
41
30
0
41
40
0
41
50
0
41
60
0
41
70
0
41
80
0
41
90
0
42
00
0
42
10
0
500
600
700
800
900
1000
1100
1200
1300
1400
1500
1600
1700
1800
451.03
1838.96
500
600
700
800
900
1000
1100
1200
1300
1400
1500
1600
1700
1800
451.03
1838.96
Modelled Resistivity (Ohm-m)
Ele
vation (
metr
es)
0 0 1
001
00
1
100
00
1
00
1
100
38
90
0
39
00
0
39
10
0
39
20
0
39
30
0
39
40
0
39
50
0
39
60
0
39
70
0
39
80
0
39
90
0
40
00
0
40
10
0
40
20
0
40
30
0
40
40
0
40
50
0
40
60
0
40
70
0
40
80
0
40
90
0
41
00
0
411
00
41
20
0
41
30
0
41
40
0
41
50
0
41
60
0
41
70
0
41
80
0
41
90
0
42
00
0
42
10
0

55
96
00
05
60
00
00
56
04
00
05
60
80
00
56
12
00
05
61
60
00
55
96
00
05
60
00
00
56
04
00
05
60
80
00
56
12
00
05
61
60
00
618000 620000 622000 624000 626000 628000 630000 632000 634000 636000 638000 640000 642000 644000 646000 648000 650000 652000 654000
618000 620000 622000 624000 626000 628000 630000 632000 634000 636000 638000 640000 642000 644000 646000 648000 650000 652000 654000
2000 0 2000 4000 6000
(meters)
Scale 1:100000
GETTY COPPER INC.INDUCED POLARIZATION SURVEY
LINE LOCATION
GETTY PROPERTYLOGAN LAKE AREA, B.C.
DECEMBER 2015
PETER E. WALCOTT & ASSOCIATES LIMITED

200 0 200 400 600
(meters)
NAD83(CSRS) / UTM zone 10N
Scale 1:10000
GETTY COPPER INC.
INDUCED POLARIZATION SURVEYCLAIM AND LINE LOCATION MAP
GETTY PROPERTYLOGAN LAKE AREA, B.C.
DECEMBER 2015
PETER E. WALCOTT & ASSOCIATES LIMITED
L3250 N L3250 N
L4000 N L4000 N
L3500 N L3500 N
L5000 N L5000 N
L5500 N L5500 N
L4500 N L4500 N
56
03
50
05
60
40
00
56
04
50
05
60
50
00
56
05
50
0
56
03
50
05
60
40
00
56
04
50
05
60
50
00
56
05
50
0
639000 639500 640000 640500 641000 641500 642000
639000 639500 640000 640500 641000 641500 642000
38950
39050
39150
39250
39300
39350
39400
39450
39500
39550
39600
39650
39700
39750
39800
39850
39900
39950
40000
40050
40100
40150
40200
40250
40300
40350
40400
40450
40500
40550
40600
40650
40700
40750
40800
40850
40900
40950
41000
41050
41100
41150
41200
41250
41300
41350
41450
41550
41650
38950
39050
39150
39250
39300
39350
39400
39450
39500
39550
39600
39650
39700
39750
39800
39850
39900
39950
40000
40050
40100
40150
40200
40250
40300
40350
40400
40450
40500
40550
40600
40650
40700
40750
40800
40850
40900
40950
41000
41050
41100
41150
41200
41250
41300
38950
39050
39150
39250
39300
39350
39400
39450
39500
39550
39600
39650
39700
39750
39900
39950
40000
40050
40100
40150
40200
40250
40300
40350
40450
40650
40700
40750
40800
40850
40900
40950
41000
41050
41100
41150
41200
41250
41300
39300
39350
39400
39450
39500
39550
39600
39650
39700
39750
39800
39850
39900
39950
40000
40050
40100
40150
40200
40250
40300
40350
40400
40450
40500
40550
40600
40650
40700
40750
40800
40850
40900
40950
41000
41050
41100
41150
41200
41250
41300
41300
41350
41400
41450
41500
41550
41600
41650
41700
41750
41800
41850
41900
41950
42000
42050
42150
38850
38950
39050
39150
39250
39300
39350
39400
39450
39500
39550
39600
39650
39700
39750
39800
39850
39900
39950
40000
40050
40100
40150
40200
40250
40300
40350
40400
40450
40500
40550
40600
40650
40700
40750
40800
40850
40900
40950
41000
41050
41100
41150
41200
41250
41300
41350
41400
41450
41500
41550
41600
41650
41700
41750
41800
41850
41900
41950
42000
42050
42150
38950
39050
39150
39250
39300
39350
39400
39450
39500
39550
39600
39650
39700
39750
39800
39850
39900
39950
40000
40050
40100
40150
40200
40250
40300
40350
40400
40450
40500
40550
40600
40650
40700
40750
40800
40850
40900
40950
41000
41050
41100
41150
41200
41250
41300
41350
41450
41550
41625
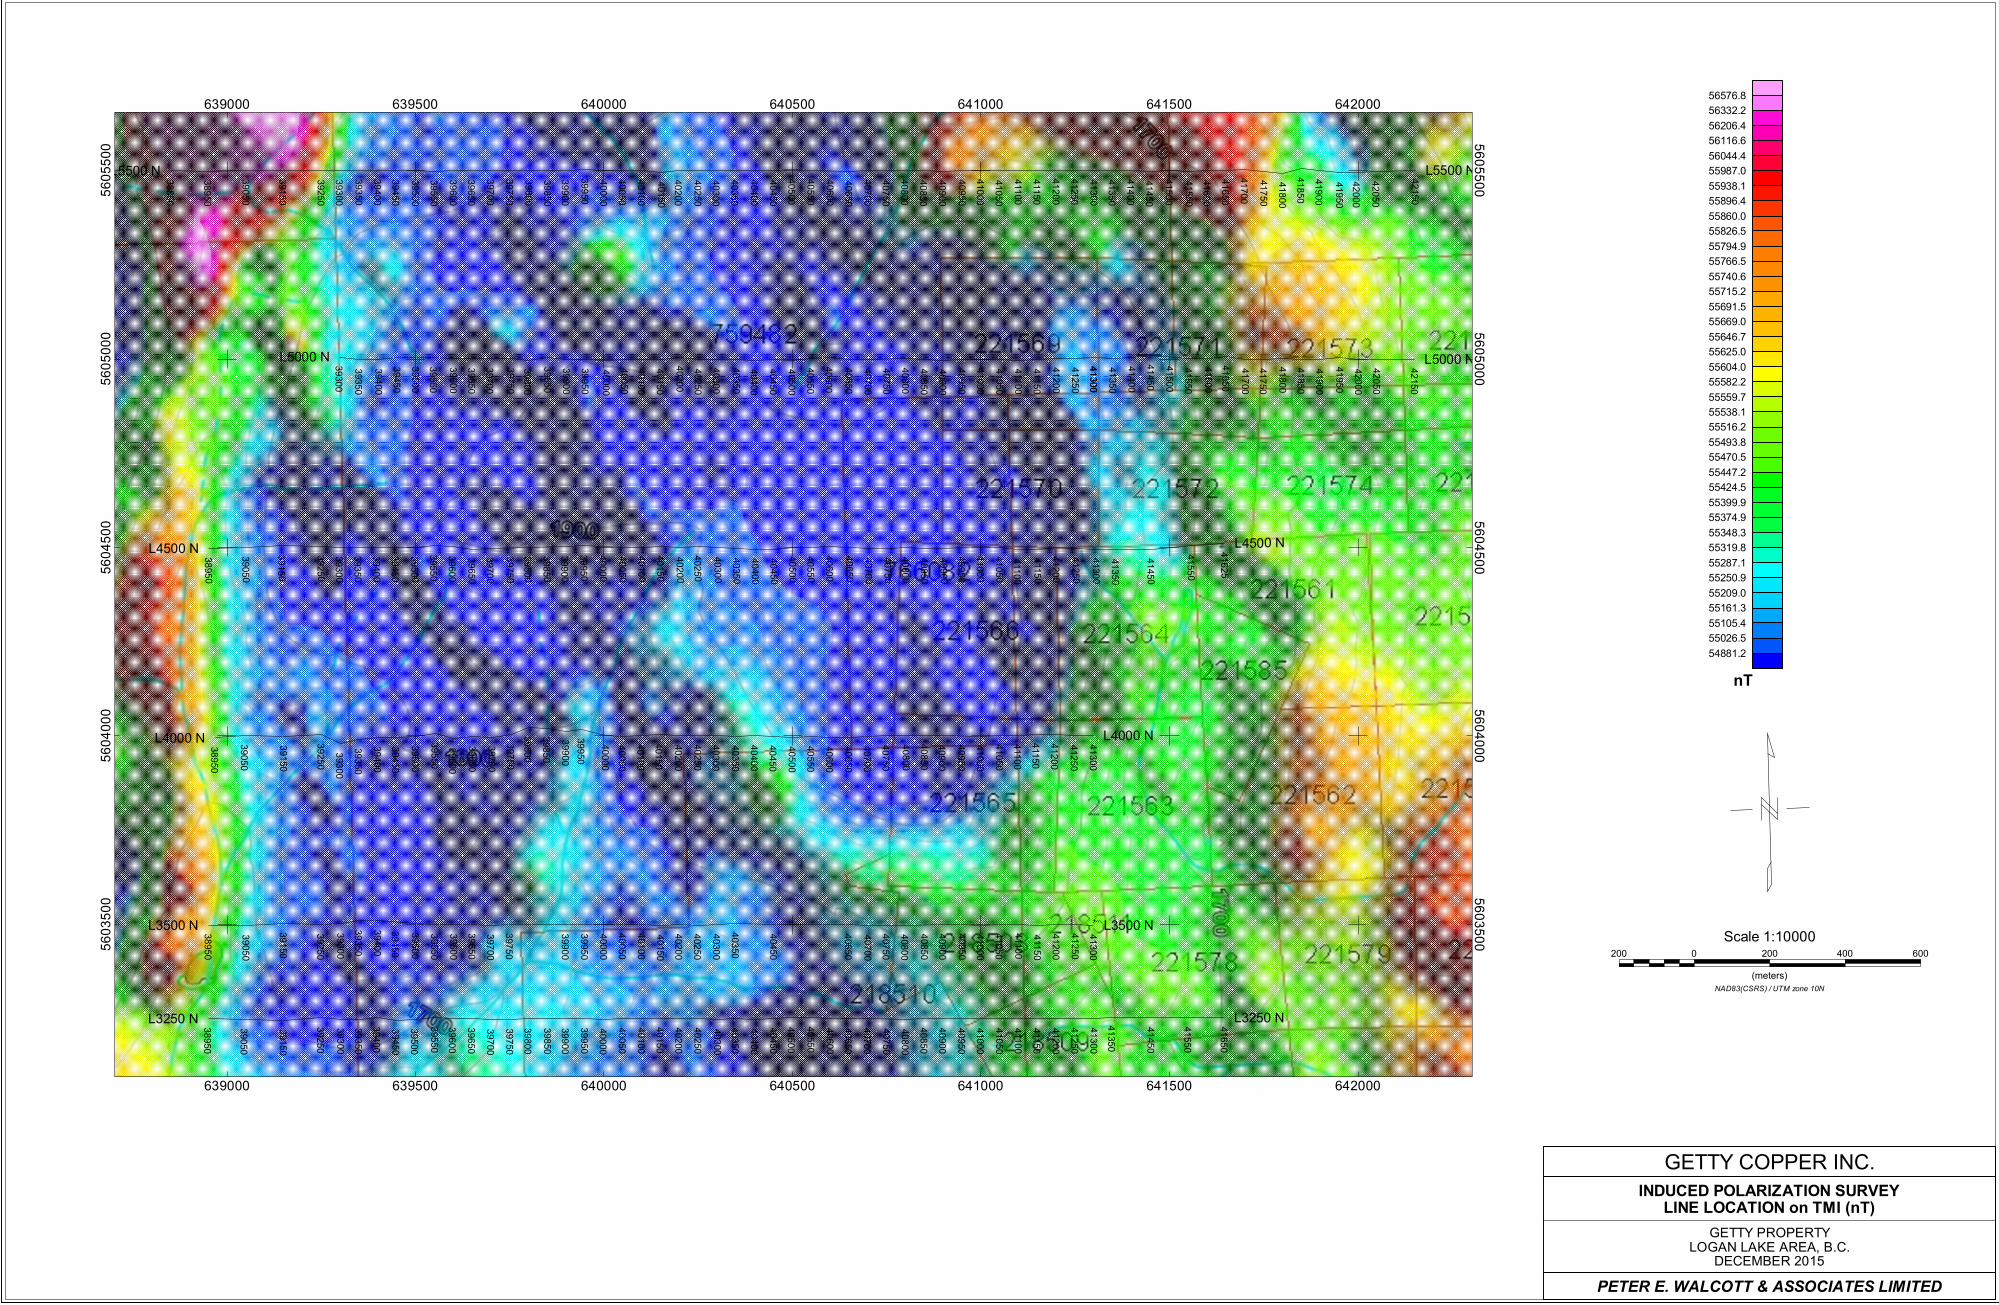
200 0 200 400 600
(meters)
NAD83(CSRS) / UTM zone 10N
Scale 1:10000
GETTY COPPER INC.
INDUCED POLARIZATION SURVEYLINE LOCATION on TMI (nT)
GETTY PROPERTYLOGAN LAKE AREA, B.C.
DECEMBER 2015
PETER E. WALCOTT & ASSOCIATES LIMITED
54881.2
55026.5
55105.4
55161.3
55209.0
55250.9
55287.1
55319.8
55348.3
55374.9
55399.9
55424.5
55447.2
55470.5
55493.8
55516.2
55538.1
55559.7
55582.2
55604.0
55625.0
55646.7
55669.0
55691.5
55715.2
55740.6
55766.5
55794.9
55826.5
55860.0
55896.4
55938.1
55987.0
56044.4
56116.6
56206.4
56332.2
56576.8
nT
L3250 N L3250 N
L4000 N L4000 N
L3500 N L3500 N
L5000 N L5000 N
L5500 N L5500 N
L4500 N L4500 N
56
03
50
05
60
40
00
56
04
50
05
60
50
00
56
05
50
0
56
03
50
05
60
40
00
56
04
50
05
60
50
00
56
05
50
0
639000 639500 640000 640500 641000 641500 642000
639000 639500 640000 640500 641000 641500 642000
38950
39050
39150
39250
39300
39350
39400
39450
39500
39550
39600
39650
39700
39750
39800
39850
39900
39950
40000
40050
40100
40150
40200
40250
40300
40350
40400
40450
40500
40550
40600
40650
40700
40750
40800
40850
40900
40950
41000
41050
41100
41150
41200
41250
41300
41350
41450
41550
41650
38950
39050
39150
39250
39300
39350
39400
39450
39500
39550
39600
39650
39700
39750
39800
39850
39900
39950
40000
40050
40100
40150
40200
40250
40300
40350
40400
40450
40500
40550
40600
40650
40700
40750
40800
40850
40900
40950
41000
41050
41100
41150
41200
41250
41300
38950
39050
39150
39250
39300
39350
39400
39450
39500
39550
39600
39650
39700
39750
39900
39950
40000
40050
40100
40150
40200
40250
40300
40350
40450
40650
40700
40750
40800
40850
40900
40950
41000
41050
41100
41150
41200
41250
41300
39300
39350
39400
39450
39500
39550
39600
39650
39700
39750
39800
39850
39900
39950
40000
40050
40100
40150
40200
40250
40300
40350
40400
40450
40500
40550
40600
40650
40700
40750
40800
40850
40900
40950
41000
41050
41100
41150
41200
41250
41300
41300
41350
41400
41450
41500
41550
41600
41650
41700
41750
41800
41850
41900
41950
42000
42050
42150
38850
38950
39050
39150
39250
39300
39350
39400
39450
39500
39550
39600
39650
39700
39750
39800
39850
39900
39950
40000
40050
40100
40150
40200
40250
40300
40350
40400
40450
40500
40550
40600
40650
40700
40750
40800
40850
40900
40950
41000
41050
41100
41150
41200
41250
41300
41350
41400
41450
41500
41550
41600
41650
41700
41750
41800
41850
41900
41950
42000
42050
42150
38950
39050
39150
39250
39300
39350
39400
39450
39500
39550
39600
39650
39700
39750
39800
39850
39900
39950
40000
40050
40100
40150
40200
40250
40300
40350
40400
40450
40500
40550
40600
40650
40700
40750
40800
40850
40900
40950
41000
41050
41100
41150
41200
41250
41300
41350
41450
41550
41625

GETTY COPPER
INDUCED POLARIZATION SURVEYGETTY PROJECT
Date: DECEMBER 2015RES2DINV
Inversion By:PETER E. WALCOTT & ASSOCIATES LIMITED
200 0 200 400 600
(meters)
Scale 1:10000
Line 3250
Pole-Dipole Array
VI
a na a
plot point
1.79
2.42
2.80
3.10
3.34
3.54
3.73
3.90
4.05
4.20
4.34
4.47
4.60
4.72
4.84
4.96
5.07
5.19
5.30
5.42
5.53
5.65
5.76
5.88
6.00
6.13
6.25
6.38
6.52
6.67
6.82
6.99
7.18
7.39
7.63
7.92
8.30
8.93
Modelled Chargeability
mV/V
33.98
44.86
52.39
59.43
66.44
72.71
80.10
87.91
96.86
106.78
117.71
129.08
140.31
155.04
173.03
195.01
220.54
242.75
268.42
293.83
318.44
346.56
392.82
502.16
Modelled Resistivity
ohm-m
800
900
1000
1100
1200
1300
1400
1500
1600
1700
735.5
1763.17
800
900
1000
1100
1200
1300
1400
1500
1600
1700
735.5
1763.17
Modelled Chargeability (mV/V)
Ele
vation (
metr
es)
39
00
0
39
10
0
39
20
0
39
30
0
39
40
0
39
50
0
39
60
0
39
70
0
39
80
0
39
90
0
40
00
0
40
10
0
40
20
0
40
30
0
40
40
0
40
50
0
40
60
0
40
70
0
40
80
0
40
90
0
41
00
0
411
00
41
20
0
41
30
0
41
40
0
41
50
0
41
60
0
cA
cB
800
900
1000
1100
1200
1300
1400
1500
1600
1700
735.5
1763.17
800
900
1000
1100
1200
1300
1400
1500
1600
1700
735.5
1763.17
Modelled Resistivity (Ohm-m)
Ele
vation (
metr
es)
1 0 0
10
0
00
1
100
100
39
00
0
39
10
0
39
20
0
39
30
0
39
40
0
39
50
0
39
60
0
39
70
0
39
80
0
39
90
0
40
00
0
40
10
0
40
20
0
40
30
0
40
40
0
40
50
0
40
60
0
40
70
0
40
80
0
40
90
0
41
00
0
411
00
41
20
0
41
30
0
41
40
0
41
50
0
41
60
0

GETTY COPPER
INDUCED POLARIZATION SURVEYGETTY PROJECT
Date: DECEMBER 2015RES2DINV
Inversion By:PETER E. WALCOTT & ASSOCIATES LIMITED
200 0 200 400 600
(meters)
Scale 1:10000
Line 3500
Pole-Dipole Array
VI
a na a
plot point
2.68
2.82
2.96
3.10
3.24
3.38
3.52
3.66
3.80
3.94
4.08
4.22
4.36
4.50
4.64
4.78
4.92
5.06
5.20
5.34
5.48
5.62
5.76
5.90
6.04
6.18
6.32
6.46
6.60
6.74
6.88
7.02
7.16
7.30
7.44
7.58
7.72
7.86
Modelled Chargeability
mV/V
33.98
44.86
52.39
59.43
66.44
72.71
80.10
87.91
96.86
106.78
117.71
129.08
140.31
155.04
173.03
195.01
220.54
242.75
268.42
293.83
318.44
346.56
392.82
502.16
Modelled Resistivity
ohm-m
800
900
1000
1100
1200
1300
1400
1500
1600
1700
741.22
1795
800
900
1000
1100
1200
1300
1400
1500
1600
1700
741.22
1795
Modelled Chargeability (mV/V)
Ele
vation (
metr
es)
39
00
0
39
10
0
39
20
0
39
30
0
39
40
0
39
50
0
39
60
0
39
70
0
39
80
0
39
90
0
40
00
0
40
10
0
40
20
0
40
30
0
40
40
0
40
50
0
40
60
0
40
70
0
40
80
0
40
90
0
41
00
0
411
00
41
20
0
41
30
0
41
40
0
41
50
0
41
60
0
cA
800
900
1000
1100
1200
1300
1400
1500
1600
1700
741.22
1795
800
900
1000
1100
1200
1300
1400
1500
1600
1700
741.22
1795
Modelled Resistivity (Ohm-m)
Ele
vation (
metr
es)
1 0 0
10
0
100
00
1
39
00
0
39
10
0
39
20
0
39
30
0
39
40
0
39
50
0
39
60
0
39
70
0
39
80
0
39
90
0
40
00
0
40
10
0
40
20
0
40
30
0
40
40
0
40
50
0
40
60
0
40
70
0
40
80
0
40
90
0
41
00
0
411
00
41
20
0
41
30
0
41
40
0
41
50
0
41
60
0

GETTY COPPER
INDUCED POLARIZATION SURVEYGETTY PROJECT
Date: DECEMBER 2015RES2DINV
Inversion By:PETER E. WALCOTT & ASSOCIATES LIMITED
100 0 100 200 300 400 500 600 700
(meters)
Scale 1:10000
Line 4000
Pole-Dipole Array
VI
a na a
plot point
2.68
2.82
2.96
3.10
3.24
3.38
3.52
3.66
3.80
3.94
4.08
4.22
4.36
4.50
4.64
4.78
4.92
5.06
5.20
5.34
5.48
5.62
5.76
5.90
6.04
6.18
6.32
6.46
6.60
6.74
6.88
7.02
7.16
7.30
7.44
7.58
7.72
7.86
Modelled Chargeability
mV/V
33.98
44.86
52.39
59.43
66.44
72.71
80.10
87.91
96.86
106.78
117.71
129.08
140.31
155.04
173.03
195.01
220.54
242.75
268.42
293.83
318.44
346.56
392.82
502.16
Modelled Resistivity
ohm-m
900
1000
1100
1200
1300
1400
1500
1600
1700
1800
1900
804.28
1941.19
900
1000
1100
1200
1300
1400
1500
1600
1700
1800
1900
804.28
1941.19
Modelled Chargeability (mV/V)
Ele
vation (
metr
es)
39
10
0
39
20
0
39
30
0
39
40
0
39
50
0
39
60
0
39
70
0
39
80
0
39
90
0
40
00
0
40
10
0
40
20
0
40
30
0
40
40
0
40
50
0
40
60
0
40
70
0
40
80
0
40
90
0
41
00
0
411
00
41
20
0
41
30
0
41
40
0
41
50
0
41
60
0
cA
cB
900
1000
1100
1200
1300
1400
1500
1600
1700
1800
1900
804.28
1941.19
900
1000
1100
1200
1300
1400
1500
1600
1700
1800
1900
804.28
1941.19
Modelled Resistivity (Ohm-m)
Ele
vation (
metr
es)
10
0
0 0 1
100
39
10
0
39
20
0
39
30
0
39
40
0
39
50
0
39
60
0
39
70
0
39
80
0
39
90
0
40
00
0
40
10
0
40
20
0
40
30
0
40
40
0
40
50
0
40
60
0
40
70
0
40
80
0
40
90
0
41
00
0
411
00
41
20
0
41
30
0
41
40
0
41
50
0
41
60
0

GETTY COPPER
INDUCED POLARIZATION SURVEYGETTY PROJECT
Date: DECEMBER 2015RES2DINV
Inversion By:PETER E. WALCOTT & ASSOCIATES LIMITED
200 0 200 400 600
(meters)
Scale 1:10000
Line 4500
Pole-Dipole Array
VI
a na a
plot point
2.68
2.82
2.96
3.10
3.24
3.38
3.52
3.66
3.80
3.94
4.08
4.22
4.36
4.50
4.64
4.78
4.92
5.06
5.20
5.34
5.48
5.62
5.76
5.90
6.04
6.18
6.32
6.46
6.60
6.74
6.88
7.02
7.16
7.30
7.44
7.58
7.72
7.86
Modelled Chargeability
mV/V
33.98
44.86
52.39
59.43
66.44
72.71
80.10
87.91
96.86
106.78
117.71
129.08
140.31
155.04
173.03
195.01
220.54
242.75
268.42
293.83
318.44
346.56
392.82
502.16
Modelled Resistivity
ohm-m
900
1000
1100
1200
1300
1400
1500
1600
1700
1800
1900
818.28
1941.55
900
1000
1100
1200
1300
1400
1500
1600
1700
1800
1900
818.28
1941.55
Modelled Chargeability (mV/V)
Ele
vation (
metr
es)
39
00
0
39
10
0
39
20
0
39
30
0
39
40
0
39
50
0
39
60
0
39
70
0
39
80
0
39
90
0
40
00
0
40
10
0
40
20
0
40
30
0
40
40
0
40
50
0
40
60
0
40
70
0
40
80
0
40
90
0
41
00
0
411
00
41
20
0
41
30
0
41
40
0
41
50
0
41
60
0
900
1000
1100
1200
1300
1400
1500
1600
1700
1800
1900
818.28
1941.55
900
1000
1100
1200
1300
1400
1500
1600
1700
1800
1900
818.28
1941.55
Modelled Resistivity (Ohm-m)
Ele
vation (
metr
es)
00
1
100
10
0
10
0
00
1
39
00
0
39
10
0
39
20
0
39
30
0
39
40
0
39
50
0
39
60
0
39
70
0
39
80
0
39
90
0
40
00
0
40
10
0
40
20
0
40
30
0
40
40
0
40
50
0
40
60
0
40
70
0
40
80
0
40
90
0
41
00
0
411
00
41
20
0
41
30
0
41
40
0
41
50
0
41
60
0

GETTY COPPER
INDUCED POLARIZATION SURVEYGETTY PROJECT
Date: DECEMBER 2015RES2DINV
Inversion By:PETER E. WALCOTT & ASSOCIATES LIMITED
200 0 200 400 600
(meters)
Scale 1:10000
Line 5000
Pole-Dipole Array
VI
a na a
plot point
2.68
2.82
2.96
3.10
3.24
3.38
3.52
3.66
3.80
3.94
4.08
4.22
4.36
4.50
4.64
4.78
4.92
5.06
5.20
5.34
5.48
5.62
5.76
5.90
6.04
6.18
6.32
6.46
6.60
6.74
6.88
7.02
7.16
7.30
7.44
7.58
7.72
7.86
Modelled Chargeability
mV/V
33.98
44.86
52.39
59.43
66.44
72.71
80.10
87.91
96.86
106.78
117.71
129.08
140.31
155.04
173.03
195.01
220.54
242.75
268.42
293.83
318.44
346.56
392.82
502.16
Modelled Resistivity
ohm-m
500
600
700
800
900
1000
1100
1200
1300
1400
1500
1600
1700
1800
481.2
1888.9
500
600
700
800
900
1000
1100
1200
1300
1400
1500
1600
1700
1800
481.2
1888.9
Modelled Chargeability (mV/V)
Ele
vation (
metr
es)
39
00
0
39
10
0
39
20
0
39
30
0
39
40
0
39
50
0
39
60
0
39
70
0
39
80
0
39
90
0
40
00
0
40
10
0
40
20
0
40
30
0
40
40
0
40
50
0
40
60
0
40
70
0
40
80
0
40
90
0
41
00
0
411
00
41
20
0
41
30
0
41
40
0
41
50
0
41
60
0
41
70
0
41
80
0
41
90
0
42
00
0
42
10
0
500
600
700
800
900
1000
1100
1200
1300
1400
1500
1600
1700
1800
481.2
1888.9
500
600
700
800
900
1000
1100
1200
1300
1400
1500
1600
1700
1800
481.2
1888.9
Modelled Resistivity (Ohm-m)
Ele
vation (
metr
es)0
1
10
0
10
0
00
1
0 01
0 0 1
00
01
00
01
39
00
0
39
10
0
39
20
0
39
30
0
39
40
0
39
50
0
39
60
0
39
70
0
39
80
0
39
90
0
40
00
0
40
10
0
40
20
0
40
30
0
40
40
0
40
50
0
40
60
0
40
70
0
40
80
0
40
90
0
41
00
0
411
00
41
20
0
41
30
0
41
40
0
41
50
0
41
60
0
41
70
0
41
80
0
41
90
0
42
00
0
42
10
0

GETTY COPPER
INDUCED POLARIZATION SURVEYGETTY PROJECT
Date: DECEMBER 2015RES2DINV
Inversion By:PETER E. WALCOTT & ASSOCIATES LIMITED
200 0 200 400 600
(meters)
Scale 1:10000
Line 5500
Pole-Dipole Array
VI
a na a
plot point
2.68
2.82
2.96
3.10
3.24
3.38
3.52
3.66
3.80
3.94
4.08
4.22
4.36
4.50
4.64
4.78
4.92
5.06
5.20
5.34
5.48
5.62
5.76
5.90
6.04
6.18
6.32
6.46
6.60
6.74
6.88
7.02
7.16
7.30
7.44
7.58
7.72
7.86
Modelled Chargeability
mV/V
33.98
44.86
52.39
59.43
66.44
72.71
80.10
87.91
96.86
106.78
117.71
129.08
140.31
155.04
173.03
195.01
220.54
242.75
268.42
293.83
318.44
346.56
392.82
502.16
Modelled Resistivity
ohm-m
500
600
700
800
900
1000
1100
1200
1300
1400
1500
1600
1700
1800
451.03
1838.96
500
600
700
800
900
1000
1100
1200
1300
1400
1500
1600
1700
1800
451.03
1838.96
Modelled Chargeability (mV/V)
Ele
vation (
metr
es)
38
90
0
39
00
0
39
10
0
39
20
0
39
30
0
39
40
0
39
50
0
39
60
0
39
70
0
39
80
0
39
90
0
40
00
0
40
10
0
40
20
0
40
30
0
40
40
0
40
50
0
40
60
0
40
70
0
40
80
0
40
90
0
41
00
0
411
00
41
20
0
41
30
0
41
40
0
41
50
0
41
60
0
41
70
0
41
80
0
41
90
0
42
00
0
42
10
0
500
600
700
800
900
1000
1100
1200
1300
1400
1500
1600
1700
1800
451.03
1838.96
500
600
700
800
900
1000
1100
1200
1300
1400
1500
1600
1700
1800
451.03
1838.96
Modelled Resistivity (Ohm-m)
Ele
vation (
metr
es)
0 0 1
001
00
1
100
00
1
00
1
100
38
90
0
39
00
0
39
10
0
39
20
0
39
30
0
39
40
0
39
50
0
39
60
0
39
70
0
39
80
0
39
90
0
40
00
0
40
10
0
40
20
0
40
30
0
40
40
0
40
50
0
40
60
0
40
70
0
40
80
0
40
90
0
41
00
0
411
00
41
20
0
41
30
0
41
40
0
41
50
0
41
60
0
41
70
0
41
80
0
41
90
0
42
00
0
42
10
0


![State Environmental Planning Policy (Mining, … - Mining Petroleum Production...State Environmental Planning Policy (Mining, Petroleum Production and Extractive Industries) 2007 [2007-65]](https://img.pdfslide.net/doc/110x75/5aea10be7f8b9a66258b8d32/state-environmental-planning-policy-mining-mining-petroleum-productionstate.jpg)