Embed Size (px)
Citation preview
MINISTRY OF MINES AND ENERGY
BARRIER REMOVAL TO NAMIBIAN RENEWABLE ENERGY PROGRAMME (NAMREP)
FINAL REPORT
ASSESSMENT OF FEASIBILITY FOR THE
REPLACEMENT OF ELECTRICAL W ATER HEATERS W ITH SOLAR W ATER HEATERS
AUGUST 2005
Prepared by:
P O Box 1900
Windhoek Namibia
Tel +264 - 61 – 224 725 Fax +264 - 61 – 233 207
Email [email protected]

Table of Contents
1 Executive summary .................................. .................................................................1 2 Review of previous studies......................... ..............................................................4 2.1 Overview of studies ..................................................................................................4 2.2 Key barriers previously identified .............................................................................4
2.2.1 High capital cost of SWH...................................................................................4 2.2.2 Low electricity tariffs ..........................................................................................5 2.2.3 Lack of awareness ............................................................................................5 2.2.4 Other barriers ....................................................................................................5
2.3 Impact of previous studies........................................................................................5 3 Present status of solar water heating .............. ........................................................7 3.1 SWH status internationally and in the region ...........................................................7
3.1.1 International perspectives .................................................................................7 3.1.2 Botswana...........................................................................................................7 3.1.3 Zimbabwe..........................................................................................................8 3.1.4 Republic of South Africa....................................................................................8
3.2 Water heating in Namibia .........................................................................................9 3.3 SWH status in Namibia...........................................................................................10 3.4 SWH industry..........................................................................................................10
3.4.1 SWH Importers................................................................................................10 3.4.2 SWH Installers.................................................................................................12
3.5 Consumer satisfaction with SWH ...........................................................................13 3.5.1 Domestic..........................................................................................................13 3.5.2 Institutional ......................................................................................................14 3.5.3 Non-users of SWH systems ............................................................................15
3.6 Stakeholder considerations ....................................................................................15 3.6.1 NamPower.......................................................................................................15 3.6.2 Regional Electricity Distributors / Local Authorities.........................................16 3.6.3 MME ................................................................................................................16 3.6.4 MET.................................................................................................................17 3.6.5 NHE.................................................................................................................17 3.6.6 Department of Works ......................................................................................19 3.6.7 Public sector ....................................................................................................19 3.6.8 Consultants .....................................................................................................20 3.6.9 Financiers and valuators .................................................................................20 3.6.10 SWH Importers................................................................................................20 3.6.11 SWH Installers.................................................................................................21 3.6.12 Developers ......................................................................................................21
3.7 Review of standards and test facilities ...................................................................22 4 Establishing the case for solar water heating...... .................................................23 4.1 Solar energy as a resource in Namibia ..................................................................23 4.2 Micro-economic perspective...................................................................................23
4.2.1 Comparative cost-benefit analysis of SWH for the consumer.........................23 4.2.2 Sensitivity analysis ..........................................................................................31 4.2.3 Life cycle costing tool ......................................................................................34
4.3 Macro-economic perspective for Namibia ..............................................................37 4.3.1 Energy and demand for electrical water heating.............................................37 4.3.2 Potential for energy and demand saving.........................................................37 4.3.3 Benefit of SWH to Namibia..............................................................................39 4.3.4 Green house gas emissions............................................................................39 4.3.5 Potential for local manufacture/assembly of SWH..........................................40
5 The way forward.................................... ...................................................................42 5.1 Past, present and future perspective......................................................................42
5.1.1 Economic barriers ...........................................................................................42 5.1.2 Access to finance ............................................................................................42 5.1.3 Market status...................................................................................................42 5.1.4 Government support........................................................................................42 5.1.5 Awareness.......................................................................................................42 5.1.6 Promotion of SWH...........................................................................................43
5.2 Proposed strategy ..................................................................................................45 5.2.1 Promotion of SWH through lobby activities.....................................................45
5.2.2 Approved certified systems .............................................................................46 5.2.3 Quality of installation .......................................................................................47 5.2.4 SWH life cycle costing tool ..............................................................................47 5.2.5 Further measures for promotion of SWH ........................................................47
6 References ......................................... .......................................................................48 Annexure A1 List of SWH Importers .............................. ............................................50 Annexure A2 List of some SWH Installers ........................ ........................................51 Annexure A3 Database of SWH equipment available in Namibia ..... ......................52 Annexure A4 List of SWH Standards .............................. ...........................................53 Annexure A5 Life Cycle Costing Graphs.......................... .........................................54 Annexure A6 Life Cycle Costing Tool............................ ............................................57 Annexure A7 Scenario Development ............................... ..........................................71 Annexure A8 Terms of Reference ................................. .............................................72
Table of Figures Table 3.1: Level of SWH penetration in selected countries 7 Table 3.2: Typical energy source choices for domestic water heating 9 Figure 3.1: Imported quantities of SWH 11 Figure 3.2: Distribution of imported SWH by Type and Capacity 11 Figure 3.3: Sample trend of SWH installations in previous five years 12 Figure 3.4: Distribution of SWH installations sample by sector 12 Figure 3.5: Comparison between quantity of imported SWH and sample of installations 13 Table 4.1: Basic input parameters for LCC 24 Table 4.2: Electricity tariffs for some of Namibia’s towns: 2004/2005 25 Table 4.3: Scenario of anticipated real electricity tariff escalation 26 Figure 4.1: Typical percentage breakdown of the LCC of a 200litre, 2.8m2 SWH: Windhoek
pre-payment 27 Figure 4.2: Percentage breakdown of the LCC of a 180litre, 2m2 SWH: Windhoek pre-
payment 27 Figure 4.3: Typical percentage breakdown of the LCC of a 150 litre EWH: Windhoek pre-
payment 28 Table 4.4: LCC for SWH and EWH on pre-payment tariff for a 5 person middle income
household with years to breakeven point 28 Figure 4.4: Pre-payment tariff versus years to breakeven for the reference case 29 Figure 4.5: Present value savings over 15 years when using a SWH compared to an EWH 30 Table 4.5: LCC for SWH and EWH on credit metering tariff with years to breakeven point 30 Figure 4.6: Credit metering tariff vs. years to breakeven for the reference case 31 Figure 4.7: Sensitivity of Years to Breakeven to daily hot water consumption 32 Figure 4.8: Sensitivity of Years to Breakeven to tariff escalation 33 Figure 4.9: Sensitivity of Years to Breakeven to discount rate 33 Figure 4.10: Input parameters to LCC [with name of spreadsheet page in brackets] 34 Figure 4.11: The ‘MAIN’ page of the LCC Analysis tool 35 Figure 4.12: Recurring costing inputs into LCC tool 35 Table 4.6 : Three scenarios for growth in SWH adoption 37 Figure 4.13: SWH market penetration scenarios 38 Figure 4.14: SWH maximum demand reduction scenarios 39 Figure 4.15: SWH energy reduction scenarios 39 Table 4.7: Namibia’s electrical energy sources 40 Table 4.8: Green house gas abatement estimates for displaced EWH. 40 Figure A5 - 1: LCC for Gobabis and Katima Mulilo 54 Figure A5 - 2: LCC for Keetmanshoop and Khorixas 54 Figure A5 - 3: LCC for Lüderitz and Mariental 54 Figure A5 - 4: LCC for Ondangwa and Oshakati 55 Figure A5 - 5: LCC for Outjo and Rehoboth 55 Figure A5 - 6: LCC for Rundu and Swakopmund 55 Figure A5 - 7: LCC for Tsumeb and Walvis Bay 56 Figure A5 - 8: LCC for Windhoek 56

ABBREVIATIONS CDM Clean Development Mechanism CO2 Carbon Dioxide DRFN Desert Research Foundation of Namibia EE Energy Efficiency EWH Electric Water Heater GDP Gross Domestic Product GHG Green House Gas GTZ Gezellschaft für Technische Zusammenarbeit GW Gigawatt GWh Gigawatt-hour HFO Heavy Fuel Oil IEA International Energy Agency ISO International Standards Organisation kW Kilowatt kWh Kilowatt-hour LCC Life Cycle Costing LPG Liquid Petroleum Gas MME Ministry of Mines and Energy MW Megawatt MWh Megawatt-hour NamPower Namibia Power Corporation NAMREP Namibia Renewable Energy Programme NHE PPA
National Housing Enterprise Power Purchase Agreement
RE Renewable Energy REC Renewable Energy Certificates RED Regional Electricity Distributor REEE Renewable Energy and Energy Efficiency REEE 2/98 Technical & Micro-economic Comparison between SWH and
Electrical storage water heaters REEE 5/99 Simulation and Monitoring of Solar and Electric Water Heating
Systems REEE 6/99 Phase 1 – Promotion and Macro-Economic Analysis of Solar
Water Heating in Namibia SABS South African Bureau of Standards SANS South African National Standard SAPP Southern African Power Pool SWH Solar Water Heater TREC Tradable Renewable Energy Certificates UNDP United Nations Development Programme USD US Dollar ZESA Zimbabwe Electricity Supply Authority

Assessment of feasibility for the replacement of el ectrical water heaters with solar water heaters
Final Report – August 2005
Page 1
1 Executive summary This study, commissioned by the Ministry of Mines and Energy, represents a review of the solar water heater (SWH) industry in Namibia. This follows on previous studies performed during 1999, which contributed to the overall increase in knowledge on SWH with reference to Namibia. The main barriers to an increased uptake in SWH technology are still financial (high capital cost with low electricity tariffs) coupled with a lack of awareness. The technical problems of a lack of certification of systems remains, despite continued efforts in South African and Botswana to implement certification test facilities. Five imported products with total sales of just over 200 units represents the present market for SWH per annum. The total market penetration of SWH in Namibia is estimated at 2.3% of formal housing or 3,200 systems of which approximately 2,100 are domestic installations. In the 1999 study two main products were identified, one of which has since fallen away. Sales of SWH have grown by 16% over the last 5 years. Nevertheless the SWH market remains too small for local manufacture to be likely to be viable in the short term. Indications are that users of SWH are generally very satisfied with the technology. A recent trend seems to be that specialist installers are losing market share to normal plumbers who are increasingly installing solar water heaters. This is a positive development, as SWH should increasingly be perceived as a standard plumbing installation. It is apparent that major increases in electricity tariffs are on the way, as a result of the lack of generation capacity within the region coupled with the fact that the SAPP tariff expires in July 2006. The exact nature and extent of the tariff increase is not possible to predict at present. Increasing tariffs will act as a natural driver to promote solar water heater sales. The recent extension of the solar revolving fund to SWH by the Ministry of Mines and Energy means that the previous barrier of a lack of capital to finance the installation of a SWH has been alleviated. A life cycle costing (LCC) tool was developed as part of this project, and simulations for a “standard” Namibian household of 5 persons, using 30 litres of hot water per day, were performed for 15 urban centres in Namibia. The results show a reduction in the duration to breakeven point between electrical water heaters (EWH) and SWH compared with 1999. The following tables highlight this:

Assessment of feasibility for the replacement of el ectrical water heaters with solar water heaters
Final Report – August 2005
Page 2
Table 1.1: LCC for SWH and EWH on pre-payment tari ff for a 5-person middle-income household with years to breakeven point
No Town
Pre-payment
Tariff LCC of SWH LCC of EWHBreakeven
year
REEE 5/99 breakeven
year[N$] [N$]
1 Gobabis 87.06 18,497 54,203 3.5 62 Tsumeb 82.83 18,557 52,148 3.7 63 Outjo 77.00 18,510 49,220 4.0 64 Swakopmund 65.00 18,510 47,976 4.15 Lüderitz 63.25 18,603 47,051 4.36 Oshakati 65.69 18,603 43,676 4.7 157 Rehoboth 65.15 18,497 43,328 4.78 Walvis Bay 55.00 18,510 42,287 4.89 Windhoek 61.18 18,312 41,217 4.9 11.510 Ondangwa 62.00 18,603 41,845 4.911 Rundu 62.00 18,603 41,845 4.912 Katima Mulilo 62.00 18,620 41,858 5.013 Keetmanshoop 61.00 18,557 41,313 5.0 1014 Mariental 47.10 18,510 34,379 6.415 Khorixas 37.00 18,557 29,401 8.2
Table 1.2: LCC for SWH and EWH on credit metering tariff with years to breakeven point
No Town
Credit metering
Tariff LCC of SWH LCC of EWHBreakeven
year
REEE 5/99 breakeven
year[N$] [N$]
1 Gobabis 71.15 18,497 46,306 4.3 82 Tsumeb 63.66 18,557 42,633 4.8 12.53 Keetmanshoop 61.00 18,557 41,313 5.0 124 Ondangwa 61.00 18,603 41,348 5.05 Rundu 61.00 18,603 41,348 5.06 Lüderitz 50.82 18,603 39,980 5.37 Outjo 56.00 18,510 38,796 5.4 13.58 Oshakati 54.71 18,603 38,226 5.6 149 Walvis Bay 45.16 18,510 36,690 5.9 1010 Swakopmund 44.00 18,510 36,030 6.011 Katima Mulilo 50.00 18,620 35,901 6.112 Rehoboth 43.28 18,497 32,473 7.013 Otjiwarongo 41.25 18,497 31,465 7.3 15+14 Mariental 39.40 18,510 30,557 7.715 Okahandja 35.00 18,497 28,363 8.6 15+16 Windhoek 30.95 18,312 26,212 9.2 15+17 Khorixas 31.00 18,557 26,423 9.2
The reasons for the improvement in the breakeven point since the 1999 study are ascribed to: • Real (above inflation) increase in tariffs • Real cost reduction in SWH systems (5-10%) • Slightly different sizing of SWH systems used in this study. • Larger collector size to the previous study, with little or no cost implication. • Anticipation of escalation of electricity tariffs.

Assessment of feasibility for the replacement of el ectrical water heaters with solar water heaters
Final Report – August 2005
Page 3
Sensitivity analysis shows that life cycle costing is very sensitive to hot water consumption (or sizing of SWH systems), while it is less sensitive to changes in discount rate and tariff escalation. In addition to the breakeven analysis, the report highlights that by incorporating the initial SWH cost into housing loans, the breakeven point from the perspective of the consumer is zero years, as immediate cash flow benefits accrue to the homeowner. In terms of green house gas emissions, each 200-litre SWH which replaces a 150-litre EWH will reduce CO2 emissions of 1.72 tons per annum, equivalent to US$17.20 of carbon trading credits. Domestic electrical water heaters consume between 8-12% of Namibia’s electrical energy, while they contribute approximately 22% or about 100MW of the peak demand. The potential for energy and demand savings offered by SWH was simulated by looking at three scenarios: A business-as-usual base case of 16% annual compound growth from the present 2.3% SWH penetration in the domestic water heating market. Scenario 1 Replacement of 1% of existing EWH plus SWH for 20% of all new housing Scenario 2 Replacement of 2% of existing EWH plus SWH for 40% of all new housing Scenario 3 Replacement of 5% of existing EWH plus SWH for 60% of all new housing Of these, scenario 2 was chosen as a valid target. With aggressive promotion efforts this scenario will result in a 31% penetration of 36,815 domestic SWH units over 10 years, resulting in 2.6% energy savings of 96GWh per annum and 5% maximum demand savings of 31MW. The report recommends the targeted, aggressive promotion of SWH technology through direct lobby activities to the following interest groups:
• National Housing Enterprise – who contribute 300 housing units per annum. • Government through the Department of Works – to ensure Government support of its own
renewable energy policy • Financial services sector – to ensure that SWH are seen as suitable for financing through
housing loans • Suppliers and installers – who must provide training and their own awareness creation • Consultants – to convince the construction professionals of the viability of SWH • Industry • General public awareness creation
The report further recommends that:
• A mechanism must be established to ensure that only quality systems are installed according to an established code of practise.
• The SWH life cycle costing tool must be supplied to relevant stakeholders. • The feasibility of CDM and TRECs should be investigated. • A demonstration of SWH at the Namibian coast is required in order to counter negative
perceptions in this area.

Assessment of feasibility for the replacement of el ectrical water heaters with solar water heaters
Final Report – August 2005
Page 4
2 Review of previous studies
2.1 Overview of studies Previous studies have contributed substantially to the understanding of SWH. These include: • REEE 2/98 Technical and Micro-Economic Comparison between Solar Water Heaters and
Electrical Storage Water Heaters, MME, GTZ, Emcon • REEE 5/99 Simulation and Monitoring of Solar and Electric Water Heating Systems, MME,
Emcon • REEE 6/99 Promotion and Macro-Economic Analysis of Solar Water Heating in Namibia,
MME, DRFN The REEE 2/98 study covered the following: • A product directory of SWH and EWH, including costs and performance data. • Review, development and procurement of simulation software for SWH and EWH systems. • A review of test procedures for SWH systems. • Analysis of monitored data of hot water consumption of typical household types. • Graphical comparison of the life cycle costs of typical applications of SWH and EWH in nine
Namibian towns. The REEE 5/99 study covered the following: • Extension of the EWH simulation software (GEYSMIX) previously developed under REEE2. • Generation of input data for the SWH simulation software T*SOL. • Completion of analysis of data of hot water consumption from 10 urban households. • Propose a strategy for information dissemination of the simulation software. • Recommendations regarding future procurement policies for water heating devices by
government and other bodies. • Preparation of detailed life cycle costing for water heating systems, with emphasis on 9 towns
in Namibia. The REEE 6/99 study covered the following: • Establishment of a database of stakeholders, creation of an information pamphlet and SWH
product guide. • An analysis of the macro-economic impact of a national SWH programme. • Strategy and framework for an implementation programme.
2.2 Key barriers previously identified The main barrier to the general uptake of solar water heating is financial coupled with a lack of awareness. The initial capital cost of SWH is high compared with EWH while electricity tariffs are cheap. If it is left open to a free market system, uninformed consumers will continue to adopt the lowest initial cost EWH solutions. The barriers and some suggested mitigating strategies are summarised below.
2.2.1 High capital cost of SWH The initial costs of SWH systems are too onerous for households to manage. Actions proposed in mitigation: • Subsidisation • Provision of low interest finance

Assessment of feasibility for the replacement of el ectrical water heaters with solar water heaters
Final Report – August 2005
Page 5
• Expansion of the market to achieve economies of scale • Identification of lower cost SWH products
2.2.2 Low electricity tariffs At present, the domestic electricity tariffs in Namibia are among the lowest in the world, which has traditionally made it difficult for renewable energy technologies to compete in the urban environment. In general there was little incentive to save energy. It is predicted by the electricity supply industry that electricity tariffs will increase substantially in the near future as a consequence of investments required for new capacity in Namibia and the Southern African region and also as the externalities of (primarily) carbon-based energy supply options are quantified and incorporated in the costs of supply.
2.2.3 Lack of awareness Awareness amongst stakeholders and the general public is poor in the following areas: • Total lack of awareness of option of SWH • Lack of information on life cycle costs • Not aware of environmental impacts • Lack of awareness of SWH reliability, product life, long-term performance, quality and
enforceable performance guarantees.
2.2.4 Other barriers Other barriers identified include issues such as: • Technical Barriers
o No commonly accepted norms, standards and codes of practise o Lack of technical skills for installation and maintenance o Dependence on expensive imported products due to limited scope for local
manufacture • Capacity Barriers
o Limited skills of technical personnel and decision makers • Institutional Barriers
o Translation of policy into action o Lack of co-ordination within the RE industry
• Social Barriers o SWH considered inferior to EWH, o SWH considered technology for the poor/ rich only.
2.3 Impact of previous studies While the reports outlined above provided substantial contributions to the overall knowledge on the SWH sector, little appears to have changed since completion of REEE 6/99 in January 2001. The present SWH situation can be described as “business as usual” with limited growth reported by the SWH sector in recent years. The reasons for the lack of progress are possibly: • The lack of a champion – no institutional ownership of the benefits of an expanded SWH
programme • A lack of political will engendered for SWH, resulting in no definitive policy decisions and thus
little implementation of SWH promotion measures.

Assessment of feasibility for the replacement of el ectrical water heaters with solar water heaters
Final Report – August 2005
Page 6
• Unconvincing arguments for microeconomics of SWH. REEE 5/99 established that the financial viability ranged to 5 to 15 years, depending on the tariff.

Assessment of feasibility for the replacement of el ectrical water heaters with solar water heaters
Final Report – August 2005
Page 7
3 Present status of solar water heating
3.1 SWH status internationally and in the region
3.1.1 International perspectives The study REEE6 outlined lessons for Namibia from established markets in other countries, but particularly South Africa, Cyprus, Israel and Greece. The most important lessons may be summarised as:
• A small SWH market (such as Namibia) will be self-sustaining only under special conditions.
• Low average income suggests that high quality (hence expensive) SWH will not necessarily achieve good market penetration to sustain an industry.
• High quality systems with long lifetime reduce the important replacement market. • As the South African market is not expanding too rapidly, regional market development is
likely to be slow. In the medium term the South African market for domestic SWH might grow rapidly based on national and metropolitan programmes.
• For Namibia to have access to export markets, it will have to produce a high quality product at low cost. The high cost of transport to non-regional export markets will count against local production. Local production will not have time to develop a high quality product by trial and error.
The reasons for high penetration of SWH into each country are listed in Table 3.1.
Table 3.1: Level of SWH penetration in selected co untries
Country Domestic SWH
Penetration Reasons/Drivers
Cyprus 91% • No own energy resource other than solar • High cost of electricity • Subsidy to certified suppliers of 50-60% of installed cost
Israel 85%
• Lack of fossil fuels • High cost of electricity • Legislation in 1980 made SWH mandatory for buildings
lower than 27m • Lower quality, hence cheaper systems on the market
Greece 15% • Government supported advertising campaign 1984-1986 • Low interest loans and tax credits were available
3.1.2 Botswana Botswana is similar to Namibia in terms of population, size and solar resource. This makes Botswana an interesting and valid comparison to Namibia. Botswana is arguably the regional leader in penetration of SWH per capita, as SWH has been promoted by numerous government initiatives since the 1970’s. For example, during the 1980s the Botswana Housing Corporation made it mandatory that housing provided by them was provided with SWH. While this created a vibrant SWH industry it also introduced less reputable players. A flood of poor quality equipment and poor installation practices meant that many SWH systems failed fairly early, and SWH thus gained a bad reputation. Allegations of corruption and fraud also surfaced during this time. This policy was stopped around 1990.

Assessment of feasibility for the replacement of el ectrical water heaters with solar water heaters
Final Report – August 2005
Page 8
A lull then ensued in the SWH industry, from which the Botswana market is only starting to recover now. Nevertheless, the awareness of SWH remains high, and more reputable and reliable players in the SWH industry have managed to survive and prosper. As a result of this, Botswana has learned that not only good equipment, but also the quality of the installation is crucial. Even a good SWH product, when installed incorrectly, will not work. As a result the Botswana Bureau of Standards has developed an on-site test method to check SWH installations on site. The Botswana Ministry of Minerals, Energy and Water Affairs, Energy Affairs Division is in the process of motivating a policy to make it mandatory for government housing in Botswana to be provided with SWH from about 2006. The Botswana Technology Centre is in the process of setting up a test rig for SHW systems. There are at least two local SWH manufacturers, who also install, in Botswana:
o Solar Power +267 391 2915 Mr Abignari o Solar Touch +267 392 4220 Mr Tragic
The manufacturers report that demand in Botswana is mainly government driven. There is good local demand to the extent that the local manufacturers do not find it necessary to consider the export market. Due to the high saline content of water in Botswana, indirect SWH systems are the preferred technology, despite the higher capital cost of such systems. Botswana electricity is based 100% on fossil fuel and it imports approximately 60% of its electrical energy.
3.1.3 Zimbabwe In Zimbabwe, water heating in high income electrified housing and commerce is by electric storage water heaters, while electric stoves are used in lower income electrified households. Unelectrified households use woodfuel and/or paraffin for water heating. Zimbabwe imports approximately 60% of its electricity requirements. Maximum demand exceeded 2GWh in 1999. Approximately US$ 5m to US$ 7m is required monthly for electricity imports and regional suppliers have classified ZESA1 as an “interruptible customer” because of delayed payments. ZESA has been forced to load shed consumers and this severely affected industrial, mining and agricultural production. The consequences have been inflationary pressures and huge economic losses. (4). Estimates place the number of installed SWH systems at approximately 4,000 domestic SWH among approximately 200,000 EWH or 2%. (4)
3.1.4 Republic of South Africa According to REEE6 and Cawood and Morris(5) (2002), the RSA market could be classified as a failed market which collapsed in the 1980s. SWH in RSA has no tangible government support and has been relatively dormant since the 1980s. The reasons for the collapse are given as: • The general reduction in disposable income of middle class households. • The lack of institutional and financial support for SWH and renewables. • The reduction in the real costs of grid electricity.
1 ZESA – Zimbabwe Electricity Supply Authority

Assessment of feasibility for the replacement of el ectrical water heaters with solar water heaters
Final Report – August 2005
Page 9
Nevertheless, RSA had 19 manufacturers of SWH systems in 2001 (Cawood, et al, 2002). Of these, only six manufactured medium temperature glazed SWH systems. The domestic SWH market in 2001 was estimated at 13,000 m²/annum, which was approximately half of what it was 12 years ago. Market penetration was less than 1%. The barriers to adoption of SWH technology in RSA are virtually identical to those in Namibia.
3.2 Water heating in Namibia Water heating in Namibia covers a range of practices dependent on the sector, socio-economic factors, practicality and logistical considerations. Domestic water heating The following table indicates the typical energy source choices for domestic water heating depending on circumstances.
Table 3.2: Typical energy source choices for domes tic water heating
Category Housing type Low
income Middle income
High income
Traditional homesteads No water heating Biomass LP gas Rural
unelectrified Commercial farms Biomass LP Gas, paraffin Biomass, LP Gas
Traditional homesteads No water heating Biomass, paraffin LP gas, EWH Rural
electrified Commercial farms Biomass Biomass, LP gas
Biomass, LP gas, EWH, SWH
Urban unelectrified
Informal housing No water heating - -
Urban Electrified
Formal housing No water heating, electrical hotplate
EWH SWH, EWH, LP gas
In rural communities, the collection of biomass contributes to deforestation, while the biomass is essentially free. On commercial farms, even high-income individuals often continue to use biomass in so-called “donkey” boilers even if grid power is available. Commercial and Institutional water heating Energy sources for commercial and institutional water heating in Namibia includes: electrical, solar, diesel, HFO (heavy fuel oil), LP gas, coal and paraffin. Commercial includes the private sector, but particularly industry, mining and tourism. Institutional includes all government institutions and special institutions such as old-age homes. In areas where grid power is not available, institutional use of SWH is well established. This includes rural health clinics, police stations and other facilities. In urban areas some examples of energy use in hospital facilities are: Keetmanshoop Hospital: Coal boilers used to generate steam for calorifiers. Windhoek Central Hospital: Diesel boilers used to generate steam for calorifiers. RC Private Hospital, Windhoek Solar/paraffin/electrical hybrid
Assessment of feasibility for the replacement of el ectrical water heaters with solar water heaters
Final Report – August 2005
Page 10
Where commercial and institutional facilities have grid electricity on a 3-tier tariff which includes maximum demand charges, experience has shown that SWH or solar assisted water heating is extremely viable with a very short payback, typically within 2-4 years. Despite this, many urban commercial facilities do not take advantage of solar water heating, probably as a result of a lack of awareness either of the technology or the economic benefits.
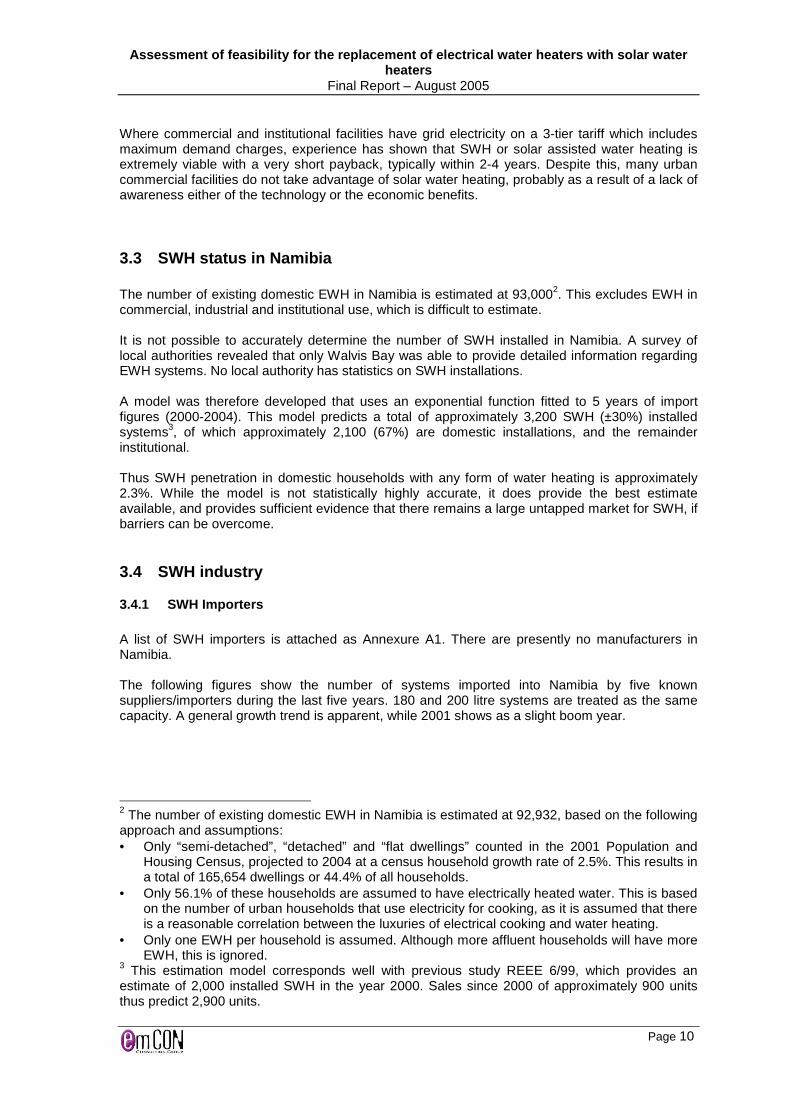
3.3 SWH status in Namibia The number of existing domestic EWH in Namibia is estimated at 93,0002. This excludes EWH in commercial, industrial and institutional use, which is difficult to estimate. It is not possible to accurately determine the number of SWH installed in Namibia. A survey of local authorities revealed that only Walvis Bay was able to provide detailed information regarding EWH systems. No local authority has statistics on SWH installations. A model was therefore developed that uses an exponential function fitted to 5 years of import figures (2000-2004). This model predicts a total of approximately 3,200 SWH (±30%) installed systems3, of which approximately 2,100 (67%) are domestic installations, and the remainder institutional. Thus SWH penetration in domestic households with any form of water heating is approximately 2.3%. While the model is not statistically highly accurate, it does provide the best estimate available, and provides sufficient evidence that there remains a large untapped market for SWH, if barriers can be overcome.
3.4 SWH industry
3.4.1 SWH Importers A list of SWH importers is attached as Annexure A1. There are presently no manufacturers in Namibia. The following figures show the number of systems imported into Namibia by five known suppliers/importers during the last five years. 180 and 200 litre systems are treated as the same capacity. A general growth trend is apparent, while 2001 shows as a slight boom year.
2 The number of existing domestic EWH in Namibia is estimated at 92,932, based on the following approach and assumptions: • Only “semi-detached”, “detached” and “flat dwellings” counted in the 2001 Population and
Housing Census, projected to 2004 at a census household growth rate of 2.5%. This results in a total of 165,654 dwellings or 44.4% of all households.
• Only 56.1% of these households are assumed to have electrically heated water. This is based on the number of urban households that use electricity for cooking, as it is assumed that there is a reasonable correlation between the luxuries of electrical cooking and water heating.
• Only one EWH per household is assumed. Although more affluent households will have more EWH, this is ignored.
3 This estimation model corresponds well with previous study REEE 6/99, which provides an estimate of 2,000 installed SWH in the year 2000. Sales since 2000 of approximately 900 units thus predict 2,900 units.

Assessment of feasibility for the replacement of el ectrical water heaters with solar water heaters
Final Report – August 2005
Page 11
Figure 3.1: Imported quantities of SWH
The following general conclusions can be drawn from this information: • Only one of the sampled importers is importing direct SWH systems, although these are
available from other manufacturers. Direct systems are mainly used for low cost housing, such as farm labour housing, but show declining sales.
• Indirect 300 litre SWH systems are clearly the most popular, representing about half of supplied systems.
• The indicated growth in sales is in excess of 16% per annum from 2000 to 2004. This is well above the economic growth rate of Namibia, which would indicate that demand and awareness is increasing. The reasons for this are expected to be economic coupled with increased awareness.
• The present market exceeds 200 SWH systems per annum.
100L, Indirect7%
150L, 160L Indirect21%
180L,200L Indirect27%
300L, Indirect38%
200L Direct7%
Figure 3.2: Distribution of imported SWH by Type a nd Capacity
0
50
100
150
200
250N
umbe
r of
sys
tem
s
200L Direct 13 20 16 7 3
100L, Indirect 9 6 17 16 10
150L, 160L Indirect 29 43 18 33 61
180L,200L Indirect 26 60 51 49 45
300L, Indirect 43 63 59 80 88
Total All Systems 120 192 161 185 207
2000 2001 2002 2003 2004

Assessment of feasibility for the replacement of el ectrical water heaters with solar water heaters
Final Report – August 2005
Page 12
3.4.2 SWH Installers A list of experienced specialist SWH installers is provided in Annexure A2. As more plumbers are installing SWH, this list is not intended to be complete, but does provide an indication of a trend which indicates more active, qualified and motivated installers of SWH. The following figure shows the number of SWH installations from a sample of five specialist installers over the last five years. While the sample is statistically insignificant, as all installers were not canvassed, some general trends can be inferred: • Approximately 67% of installations are domestic, with most of these (52%) in urban centres.
Institutional and commercial installations account for approximately 33% of installations. • The present adoption of SWH technology therefore appears to be predominantly from the
urban market, in cases where purchasers believe in the technology and can afford them.
Figure 3.3: Sample trend of SWH installations in p revious five years
Urban Domestic52%
Rural Domestic15%
Commercial & Institutional
33%
Figure 3.4: Distribution of SWH installations samp le by sector
0
20
40
60
80
100
120
140
160
Sam
ple
No
of S
WH
inst
alle
d
Urban Domestic 49 58 54 53 35
Rural Domestic 12 25 5 17 13
Commercial & Institutional 32 51 25 40 12
Total 93 134 84 110 60
2000 2001 2002 2003 2004

Assessment of feasibility for the replacement of el ectrical water heaters with solar water heaters
Final Report – August 2005
Page 13
A comparison between imported SWH systems and the sample installation data is presented in Figure 3.5. From this comparison we infer that: • The boom in 2001 is evident from both sets of data. It is not clear what this boom is attributed
to. • The installation figures do not follow the imported system growth trend. This may indicate that
the number of installers of SWH is increasing and that more installations are being performed by conventional plumbers and less by specialists only. This is a positive situation, which indicates that plumbers are increasingly accepting SWH as a standard item of equipment.
Figure 3.5: Comparison between quantity of importe d SWH and sample of installations
3.5 Consumer satisfaction with SWH
3.5.1 Domestic A total of eight domestic users of SWH systems were surveyed to gauge consumer satisfaction and perceptions. The information from this limited sample reveals:
• Response to satisfaction ratings were: o Very Satisfied 6 o Satisfied 2 o Dissatisfied 0
• Two systems were direct, while the rest were indirect. • All indicated that their SWH satisfied their hot water requirements, although many were
forced to switch on the backup element in winter. • The oldest system from the survey was installed in 1998, thus a present age of 7 years. • The respondent’s perception of the repayment period ranged from 1.5 years to 10 years. • No maintenance or operational problems were registered. One institution that uses both
EWH and SWH indicated that they have noticed no difference in maintenance requirements between the two solutions.
0
50
100
150
200
250
Num
ber
Installed 93 134 84 110 60
Imported 120 192 161 185 207
2000 2001 2002 2003 2004

Assessment of feasibility for the replacement of el ectrical water heaters with solar water heaters
Final Report – August 2005
Page 14
This limited survey indicates that domestic users of SWH systems are satisfied with the technology.
3.5.2 Institutional Ten institutional users of SWH systems were surveyed. This included 8 accommodation facilities (Hotels, lodges, old age home, educational institution), a hospital and Police facilities. The survey revealed that:
• Response to satisfaction ratings were: o Very Satisfied 5
CASE STUDY – ARANDIS SOLAR WATER HEATING Rossing Uranium mine installed and maintained approximately 1,000 SWH on all housing in Arandis during the early 1980s. Arandis therefore represents approximately 50% of existing domestic SWH installations in Namibia. These early 150-180 litre direct (Solahart and SolEnergy) systems consist of a brass tank and collector panels. The present systems are essentially still the same original equipment. No backup elements are installed although the storage tanks make provision for them. With the transfer of Arandis to the Namibian Government after Independence and the establishment of the Arandis Town Council, some housing has been sold to private owners, while many remain the property of the Town Council and are rented. According to the Town Council approximately half of the 1,000 systems are still operational and there are no serious quality of service complaints. The problems experienced with the systems are:
• Corrosion failure of some of the brass tanks (after 25 years) • Failure of the valves, which is reported to be the predominant fault
Both private owners and tenants are responsible for the cost of maintenance of the SWH systems. The Arandis Town Council assists residents with the maintenance, against payment for their services. While most private home owners do maintain their systems, tenants either cannot afford to have the regulating valves replaced or do not wish to invest in a rented property. When SWH systems fail, some of the occupants replace them with electrical water heaters. This probably has to do with the high cost of SWH and/or the perception that EWH are a better technology. The important lessons from the Arandis case are:
• Good quality SWH systems (even older technology) have a long lifetime. • The failure of many of the SWH systems is not related to SWH technology (the same
valves are used for SWH and EWH) • Many low-income users cannot afford the maintenance overheads of hot water
systems (EWH and SWH). If this is the case, they cannot afford a hot water system. • The perception of EWH as being a superior technology or being more affordable
persists. Perhaps the solar revolving fund or a suitable dono r should consider assisting the Arandis Town Council with financing of the spares n ecessary for the maint enance of the SWH systems in Arandis?

Assessment of feasibility for the replacement of el ectrical water heaters with solar water heaters
Final Report – August 2005
Page 15
o Satisfied 5 o Dissatisfied 0
• All systems are indirect systems. • The SWH satisfied their hot water requirements, although some need to use their backup
element during winter. • Some systems were installed in the early 1990’s, and have thus been operational for
approximately 15 years without problems. • Two respondents noted problems with the Siemens systems. There were complaints that
these systems failed through corrosion (tank failure) and that spares were not readily available. Siemens systems are no longer available on the Namibian market.
• While most respondents did not have an idea of the repayment period, they do believe that they are saving substantially on their energy costs.
Previous experience with life cycle costing of SWH systems for institutional users has shown that the repayment of investment generally occurs within 2-3 years for consumers who have a 3-tier electricity tariff (Basic, consumption, maximum demand). The survey shows that institutional users are generally very satisfied with SWH technology.
3.5.3 Non-users of SWH systems A total of 12 domestic (3) and institutional (9) non-users were surveyed to obtain an indication of awareness. The results can be summarised as follows:
• Nine (75%) of the respondents have never considered SWH. • All use electricity for water heating except one using diesel boilers. • Nine (75%) of the respondents are satisfied with their hot water systems. Those who are
not satisfied have water pressure, cost or power tripping problems. A general perception encountered amongst non-users surveyed is that people consider solar water heaters to be a technology applicable to off-grid applications. Ten (83%) of the respondents are not aware of their water heating costs, and in most cases the respondents are end users who were not involved in the selection of water heating systems.
3.6 Stakeholder considerations
3.6.1 NamPower NamPower as electricity generator and bulk distributor is a key stakeholder. It may be argued that as NamPower stands to lose revenue in the face of the implementation of RE and EE initiatives, they would in general be reluctant to support the uptake of RE technologies. However, the utility would benefit from deferred investments in generation, transmission and distribution infrastructure due the reduction in ADMD. NamPower has indicated, however, that it is supportive of renewable energy technologies, particularly if it is to the benefit of Namibia as a whole. In the light of the fact that the SAPP tariff agreement expires on 1 July 2006 and the fact that spare generation capacity in the region is rapidly shrinking, it is anticipated that the new tariffs will increase substantially, not only for Namibia, but also for the whole region. The level of increase will depend on many factors that still have to be negotiated, such as capacity allocation to Namibia, feasibility of other imports, final cost of Kudu development (being cost-plus), among others.

Assessment of feasibility for the replacement of el ectrical water heaters with solar water heaters
Final Report – August 2005
Page 16
The present tariff structure4 is can be very broadly described as follows: Capacity: approximately N$ 60/kW/month Energy : approximately 7.6 c/kWh Combined: approximately 15.77 c/kWh As indication of tariff prices to come, the long range marginal cost for new coal-fired generation capacity in South Africa is in excess of 0,26 ZAR/kWh5. Note that this excludes the externalities of coal (and nuclear)-based electricity generation. These externalities amount to more than 0,10 ZAR/kWh in 19966. The increased tariffs will be a hybrid of the various costs. At the time of writing the period over which the tariff increases will be phased in is not known.
3.6.2 Regional Electricity Distributors / Local Aut horities Traditionally, local authorities derived a large proportion of their revenue from electricity sales. As RE and EE measures potentially reduce the revenue earned by local authorities, it may be expected that they will show little support for SWH implementation. The Walvis Bay Municipality has taken the initiative to conduct an in-house comparative investigation between and EWH and SWH with backup element. Unfortunately the test is being performed on a commercial property which will not provide data related to a domestic hot water consumption pattern. Local supply authorities are in the process of being converted into REDs. Large-scale and rapid RE and EE implementation may have an inflationary impact. However, the uptake of SWH technology will be gradual, and it is anticipated that this would result in a slowing of demand and energy growth rather than a decrease. The economy of scale, access to in-house expertise and efficiency aspects of REDs as opposed to local authorities should result in a reduction in the cost of distribution. This should have a deflationary impact on tariffs. Therefore the implementation of RE programmes should not pose a threat to RED revenue. The transfer of electricity distribution to REDs should result in the rationalisation of tariff structures across Namibia, which will assist in simplifying SWH evaluations.
3.6.3 MME The Directorate of Energy in the Ministry of Mines and Energy has the responsibility of implementing the government’s energy policy, which includes the policy in respect of renewable energy, where it is to the benefit of Namibia. The white paper on energy policy states that “Government will facilitate adequate financing schemes for renewable energy applications”. The Ministry of Mines and Energy has as a result established the solar revolving fund to assist with the financing of the capital costs of renewable energy systems. The fund was initially applied mainly for PV solar home systems, but all RE technologies have recently been included, which includes SWH systems.
4 NamPower 5 NIRP (2004), National Integrated Resouce Plan for South Africa, National Electricity Regulator, South Africa. 6 Van Horen, C 1996, Counting the social costs: electricity and externalities in South Africa, Elan Press and UCT Press, Cape Town.

Assessment of feasibility for the replacement of el ectrical water heaters with solar water heaters
Final Report – August 2005
Page 17
As SWH have only recently been added to the solar revolving fund finance scheme, and new administrators of the fund were recently appointed, data regarding SWH financing are not available yet. [Note for draft report – add some data if available from MME]. The general finance terms are interest at 5% over a five-year period, payable monthly. The cost of administration of the solar revolving fund together with low interest rates and risk of default on payment means that the fund is not self-sustainable, and this therefore represents a subsidy of RE systems.
3.6.4 MET The Ministry of Environment and Tourism (MET) is an important stakeholder, and was one of the original proponents of this study. The interest of the MET is primarily in terms of climate change as a result of global warning.
3.6.5 NHE The NHE constructs approximately 300 houses per annum. Core houses range in price from N$60,000 to N$100,000 and the installation of EWH are optional. Conventional housing ranges in price from N$100,000 to N$250,000 and are provided with EWH only. Approximately 150 new houses per year are provided with EWH. The NHE does compete with private developers, and NHE housing must therefore compete in terms of price. While the NHE is aware of SWH technology, so far the high input cost of SWH was not considered in the interest of purchasers. Nevertheless the NHE is open to considering the technology. It is therefore prudent for the MME to assist and advise the NHE on SWH technology. If the provision of SWH for NHE housing were compulsory, then the market for SWH would immediately grow by about 150 systems per annum, or 43%.

Assessment of feasibility for the replacement of el ectrical water heaters with solar water heaters
Final Report – August 2005
Page 18
CASE STUDY – NHE HOUSING WITH SWH OR EWH? Typical finance terms for an NHE house are 11.5% interest over a 20-year period. A comparison of cumulative cash flow to a N$100,000 NHE house over 20 years is shown in the figure below. This shows the following:
• Financing of the SWH via the solar revolving fund of the MME (5% interest, 5 years) is the lowest life cycle cost option, but has a higher cash-flow requirement during the first 5 years which is the most difficult time for a new home owner.
• The inclusion of the SWH cost in the financing of the house is the next lowest cost option.
• The total cost to the homeowner for the EWH is the highest. • The SWH included in the home loan is N$51,400 cheaper over 25 years than the
EWH option (in present value).
0
50,000
100,000
150,000
200,000
250,000
300,000
0 5 10 15 20 25
Year
Cum
ulat
ive
Cos
ts N
$
SWH financed with RE fund SWH financed via home loan Standard House with EWH
The monthly cash-flow for the homeowner in the first year for these options looks like this. Item EWH Home loan SWH Revolving SWH Home loan payment to NHE 836.44 920.08 836.44 Electricity consumed by EWH 127.00 Revolving fund loan repayment 188.71 Total monthly expense 963.44 920.08 1,025.15
Conclusion: The financing of a SWH via the NHE ho me loan is the best option for an entry-level home owner. The assumptions made for this analysis are:
• Difference in capital cost of N$10,000 between EWH and SWH. • “Standard household” consisting of 5 persons using 30 litres/person/day. • 150 litre EWH, 200 litre SWH. • 2004/2005 prepayment electricity tariff for Windhoek of N$0.5775/kWh. • Annual escalation of electrical tariff of 4%. • Solar revolving fund terms of 5%, 5 years. • Maintenance costs on SWH and EWH are ignored as these are similar. • Lifetime of EWH is assumed to be 10 years and SWH 25 years. • Backup element in SWH not connected.

Assessment of feasibility for the replacement of el ectrical water heaters with solar water heaters
Final Report – August 2005
Page 19
3.6.6 Department of Works The Department of Works in the Ministry of Works, Transport and Communication, is the government agency responsible for major capital works and the maintenance of government facilities. The Department of Works does not have a specific policy on solar water heating. The Department engages the services of consulting engineers, and based on the design and recommendations of consultants the Department of Works implements EWH or SWH solutions. It is the perception at the Department of Works at present that SWH is a rural solution where there is no grid connection and not necessarily an urban solution for water heating. A Chief Engineer with the Department of Works indicated that in his opinion the following steps would contribute to increased adoption of SWH: • Train people that will be able to install SWH • Put in place incentive schemes for SWH • Raise public awareness on SWH • Do comparative studies of the two systems and calculate repayment time.
3.6.7 Public sector A brief telephonic survey of government institutions revealed that there is little awareness of SWH, and no particular policy in respect of SWH for Government facilities. The following Ministries were canvassed: • Ministry of Agriculture, Water and Forestry • Ministry of Education • Ministry of Fisheries • Ministry of Foreign Affairs • Ministry of Defence • Ministry of Trade and Industry • Ministry of Health and Social Services This survey revealed the following:
• While some Ministries indicate that they rely on the Department of Works to advise them on the choice of technology, other Ministries say that they will not be dictated to by the Department of Works, which is essentially only administering their capital projects. Many Ministries referred us to the Department of Works for their opinion on the matter.
• One Ministry pointed out a difference in policy between head office and regional offices, and that decentralisation means that regional offices use the technology that they are more comfortable with.
• In some cases Ministries are opposed to SWH technology, as a result of a perception of lower quality of service or perceived maintenance problems. This is often a personal preference of the individual interviewed.
It is clear that Government awareness and practical implementation of RE technologies is lacking at present. A problem with Government budgetary and procurement policy is the conflict between capital and recurring (operation and maintenance) expenditure. Decisions are often made based on lowest first (capital) cost, rather than life cycle costs. This is probably the case because life cycle costing is difficult and budget limitations place more emphasis on capital costs, to the detriment of recurring costs. The choice of EWH over SWH with their difference in life cycle costs is a typical example of short-term thinking with expensive long-term consequences.

Assessment of feasibility for the replacement of el ectrical water heaters with solar water heaters
Final Report – August 2005
Page 20
3.6.8 Consultants Consultants in the construction industry (Architects, Quantity Surveyors and Consulting Engineers) specify and recommend RE technology depending on their own personal preferences, awareness and experiences. As both the public and private sectors employ Consultants for capital development projects, the impact of their decisions and awareness of RE technologies is crucial. Special attention should be given to ensuring that this group is aware of Government policy and the micro-economic and environmental impacts in this regard.
3.6.9 Financiers and valuators A survey of commercial banks revealed that while commercial finance for the installation of SWH would be considered, in practise it would be more appropriate for SWH systems to be financed via mortgage bonds. One bank indicated that SWH are considered fixtures and would therefore only be financed via a home loan. Financial institutions grant loans based on the income and thus ability of the purchaser to service the loan. Financial institutions, however, are not aware that the use of a SWH also improves the home-owners ability to pay, as a result of an improved personal cash-flow situation. This must be communicated to the banking industry. Financial institutions employ valuators to assess the value of a property, according to which mortgage bond loan terms are based. A survey of three valuators employed by local commercial banks for their valuations, revealed the following: • None of the valuators knew the cost of a SWH system. This lack of awareness is indicative of
the general level of awareness and because there are few installed SWH systems. • The method that valuators would use to assess the value of SWH differed from:
o The replacement cost of a SWH reduced to a per m² rate. o The difference between EWH and SWH installation.
• One valuator indicated that the value of a SWH would depend on the market segment of the property. A SWH would add more value to a property in a high-income area and less in a low-income area. The valuator explained this was as a result of the affordability of the house, and that in a low-income area the awareness of SWH value was lower.
It is therefore clear that, at present, valuators do not consider SWH in their valuations.
3.6.10 SWH Importers The importers of SWH systems stand to benefit from an improvement in the uptake of technology, and therefore have a direct interest in the industry. As an improved SWH market is in the interest of both suppliers and the MME, these two key stakeholders should co-operate in the promotion of SWH. Despite the small market in Namibia, it is interesting to note that five importers are presently active, and that the quality of SWH systems is considered good. The fact that mainly good quality indirect systems form the larger portion of the market is an indication that SWH are mainly supplied to high-income domestic users and institutional users who can afford the high capital costs.

Assessment of feasibility for the replacement of el ectrical water heaters with solar water heaters
Final Report – August 2005
Page 21
The SWH product offering in Namibia has evolved since REEE2/98 from 2 to 5 SWH products that are actively supported and represented in Namibia, while the Siemens product has been withdrawn from the Namibian market as a result of quality problems. 1999 SWH available in Namibia per REEE 2/98 Solahart, Siemens 2005 SWH available in Namibia Solahart (Australia), SunTank (South Africa), Exstream (South Africa), Megasun (Greece), Solardome (South Africa). Suppliers have indicated their willingness to assist with training in the proper installation of their systems.
3.6.11 SWH Installers Specialist installers report a shrinking market. This is assumed to be as a result of the fact that plumbers are increasingly installing SWH systems, which is an indication that the perceptions of SWH as a specialist installation is waning as more plumbers become confident with their installation. This process should be encouraged, as SWH should become part of the repertoire of any qualified plumbing artisan. Vocational training centres and suppliers must be encouraged to provide training and information regarding SWH system installation and maintenance. The installers interviewed indicated that: • Users of both SWH and EWH systems are not aware of preventative maintenance procedures
such as the regular scheduled replacement of anodes, control valves and electrical elements. In practise, repairs are only performed when systems no longer operate. Preventative maintenance will go a long way to ensuring increased service life of both SWH and EWH.
• Quality of installation is a major factor in the effectiveness of SWH systems. Many systems are poorly installed, and this results in poor performance, reduced lifetime and ultimately a poor image for SWH technology.
• Installers confirmed problems with the Siemens units in the field. In one case, the Namibian Police have a team of ex-combatants who are successfully installing SWH in the field after minimal training.
3.6.12 Developers Private housing developers contribute substantially to the housing supply, particularly with the present housing boom resulting from low interest rates in urban growth areas such as Windhoek, Ongwediva, Walvis Bay and Swakopmund. All developers that we interviewed install EWH in their new developments. They consider SWH technology too expensive, and do not install these as they are in a highly competitive market. Homebuyers do not demand SWH. Because of the high volumes, some developers purchase EWH at extremely low cost.

Assessment of feasibility for the replacement of el ectrical water heaters with solar water heaters
Final Report – August 2005
Page 22
3.7 Review of standards and test facilities A number of SWH system performance test methods were identified by REEE2. Standards applicable to SWH are listed under Annexure A4. National standards are a barrier to free trade and common standards such as ISO should therefore be adopted as far as possible. A test facility for Namibia is not considered justified at present, given the small market. There are no test facilities to test the thermal performance of SWH in the region. The SABS in South Africa can test all of the mechanical aspects, they do not have a facility for the thermal efficiency tests, and are investigating this. The Central Energy Fund has ordered a containerised test system from Europe, which will become operational at the Tshwane Technical University during 2006. The Botswana Technology Centre is presently establishing a test facility. Use should rather be made of these regional facilities and certification according to standards compatible with the appropriate ISO standards. Many countries require national certification in order to become eligible for subsidy or tax breaks. In the light of lessons learned in the 1970s and 1980s, Namibia must ensure a form of certification in order to ensure that good quality SWH equipment is imported, in order to protect consumers and the reputation of the industry. Certification by other countries should be considered, in order to avoid the costly requirements for local certification. Importantly, the quality of installation is crucial to the long-term durability and performance of SWH systems – regardless of the certification and quality of supply of materials – and this is something which should be implemented in Namibia. Key actions would include:
• Reviewing the Codes of Practice for Installation of SWH systems which are currently used (or under development) in Botswana and South Africa.
• Adopting an appropriate Code for Namibia • Training of plumbers and building inspectors • Awareness for mortgage lenders, developers, architects, engineers and customers • Monitoring, evaluation and reporting of performance over time

Assessment of feasibility for the replacement of el ectrical water heaters with solar water heaters
Final Report – August 2005
Page 23
4 Establishing the case for solar water heating
4.1 Solar energy as a resource in Namibia It is well established that the solar energy resource for the whole of Namibia is excellent and that it is among the countries with the highest levels of solar irradiance. The resource furthermore has a high level of predictability for most part of the year. The solar energy resource is quantified in REEE 1/987 and listed for various towns in REEE 5/99.
4.2 Micro-economic perspective
4.2.1 Comparative cost-benefit analysis of SWH for the consumer This section presents a comparative economic analysis by comparing a basic indirect SWH to an EWH, taking into account all cost items, electricity consumption and tariffs, for a number of Namibian towns. A similar analysis was performed in study REEE 5/99 and comparisons are made to establish how the market has changed since the year 2000. The reference case in this study is comparing a 200 litre indirect SWH with back-up element connected to a 150 litre EWH. As per census data the average household size is “5.3” people8. For the purpose of this study a 5 person household has been selected.
4.2.1.1 Approach
In order to compare the SWH option with the EWH option a lifecycle costing approach is used. This approach allows systems offering the same quality of service, to be compared on an equal basis by reducing all future costs, which occur at different intervals of the systems life, to one value, referred to as the Life Cycle Cost (LCC) of a system/project. Future costs include operating costs (electricity consumption), maintenance costs (materials such as elements, anodes, pressure valves) and replacements (storage tank, solar collector if applicable). In order to bring all costs into today’s value, future costs are reduced to present value using a discount rate. The discount rate is equivalent to a bank investment rate. The life cycle costing performed here makes use of the constant dollar approach, which therefore excludes inflation. The discount rate, the loan rate and the escalation rates used in this analysis are therefore real rates, exclusive of inflation.
4.2.1.2 Inputs
Basic input parameters The Table 4.1 below lists the parameters used for the life cycle costing.
7 REEE1/98, Assessment of solar and wind resources in Namibia, Directorate of Energy: Ministry of Mines & Energy, Namibia 8 Namibia census data: 2001

Assessment of feasibility for the replacement of el ectrical water heaters with solar water heaters
Final Report – August 2005
Page 24
Table 4.1: Basic input parameters for LCC
Parameters Value Unit Project life 15 years Inflation rate 3.5 % Real discount rate 3 % Real loan rate 6 % Carbon credits 65 N$/ton Indirect Solar Water Heater: 100litre, 1.5sqm collector, complete, installed
9,660 N$
Indirect Solar Water Heater: 150litre, 2.1sqm collector, complete, installed
11,960 N$
Indirect Solar Water Heater: 180litre, 2sqm collector, complete, installed
12,535 N$
Indirect Solar Water Heater: 200litre, 2.8sqm collector, complete, installed
13,570 N$
Indirect Solar Water Heater: 250litre, 3.5sqm collector, complete, installed
17,250 N$
Indirect Solar Water Heater: 300litre, 4sqm collector, complete, installed
19,780 N$
Electrical Water Heater: 100 litre 3,350 N$ Electrical Water Heater: 150 litre 3,500 N$ Electrical Water Heater: 200 litre 4,650 N$ Electrical Water Heater: 250 litre 6,750 N$ Shipping to towns Range per kg Maintenance: Anode replacement 500 N$/3 years Maintenance: Element replacement 500 N$/5 years Maintenance: Pressure valve replacement
750 N$/5 years
Hot water consumption: Middle income household
30 litres/person/day
Water temperature differential: Inland 38 °C Water temperature differential: Coast 44 °C Daily average solar irradiation: Inland 6.5 kWh/sqm/day Daily average solar irradiation: Coast 6.0 kWh/sqm/day Solar collector efficiency 65 % Electrical heating efficiency 95 % SWH: Thermal storage losses: Inland 60 W/h at 150 litre EWH: Thermal storage losses: Inland 80 W/h at 150 litre Thermal energy losses: Coast Add 10 % SWH storage tank over sizing factor 30 %
All cost items are inclusive of VAT. The inflation rates for the last years were 3.9% (2004), 7.3% (2003), 11.3% (2002), 9.3% (2001) and 9.25% (2000). Indications are that the 2005 inflation rate is in the region of 3.5% (averaged over the first months). The rate for carbon credits is currently about USD 10 per ton per annum of carbon emitted. The spreadsheet LCC tool allows the use of carbon credits. However, since the carbon credit market in Namibia is fairly small and the CDM requirements are non-trivial, it is unlikely that these funds will be accessed in the near future. The LCC tool allows a year to be specified in which carbon credits should commence. In this evaluation the carbon credits have not been activated due to the anticipated barrier to access although this will hopefully change in the future.

Assessment of feasibility for the replacement of el ectrical water heaters with solar water heaters
Final Report – August 2005
Page 25
It is assumed that the main water consumption in a domestic household is for showering (bathing will be more). A water saving shower head provides 6 litres of water per minute (assuming an acceptable pressure of 2bar or more) while a standard showerhead uses up to 11 litres per minute. A five minute shower therefore consumes in the range of 30 to 55 litres of blended water, assumed to be at a temperature of 45°C. Blending ho t water at 60°C with cold water at 20°C to get 45°C blended water results in a ratio 62.5 to 3 7.5. It is then further assumed that the average showerhead will provide 10 litres per minute and that a middle income household will consume 50 litres of hot water per person per day. This results in hot water consumption of 31 litres per person per day or for this study rounded to 30 litres per person per day. It is further assumed that a low income household will consume 20 litres of hot water per person per day and a high income household will consume 40 litres of hot water per person per day. Hot water consumption is a sizing parameter and based on the aforementioned consumption rates, it is clear that a low income household of five persons would use a smaller SWH compared to a high income household, else this will lead to ineffective use of the SWH in a low income household leading to longer breakeven periods. The model used differentiates between inland and coastal towns through level of irradiance and through cold water inlet temperature. Tariffs The current tariffs for a number of Namibian towns are listed in Table 4.2.
Table 4.2: Electricity tariffs for some of Namibia ’s towns: 2004/2005
Pre-pay Credit meters
No TownEnergy charge
Energy charge
Fixed charge: 25A
[c/kWh] [c/kWh] [N$/month]
1 Gobabis 87.06 71.15 40.652 Katima Mulilo 62.00 50.00 56.253 Keetmanshoop 61.00 61.00 50.004 Khorixas 37.00 31.00 24.255 Lüderitz 63.25 50.82 60.456 Mariental 47.10 39.40 29.937 Okahandja none 35.00 86.008 Ondangwa 62.00 61.00 50.009 Oshakati 65.69 54.71 65.0010 Otjiwarongo none 41.25 104.4511 Outjo 77.00 56.00 61.7512 Rehoboth 65.15 43.28 45.3813 Rundu 62.00 61.00 50.0014 Swakopmund 65.00 44.00 97.2015 Tsumeb 82.83 63.66 73.4516 Walvis Bay 55.00 45.16 64.7917 Windhoek 61.18 30.95 125.85
Note: The City of Windhoek tariffs are for the year 2005/2006.
The average real tariff increase over the last 5 years is 1% per annum. Oshakati, Windhoek and Gobabis had above inflation rate increases, while Keetmanshoop and Tsumeb had less then inflation rate increases.
Assessment of feasibility for the replacement of el ectrical water heaters with solar water heaters
Final Report – August 2005
Page 26
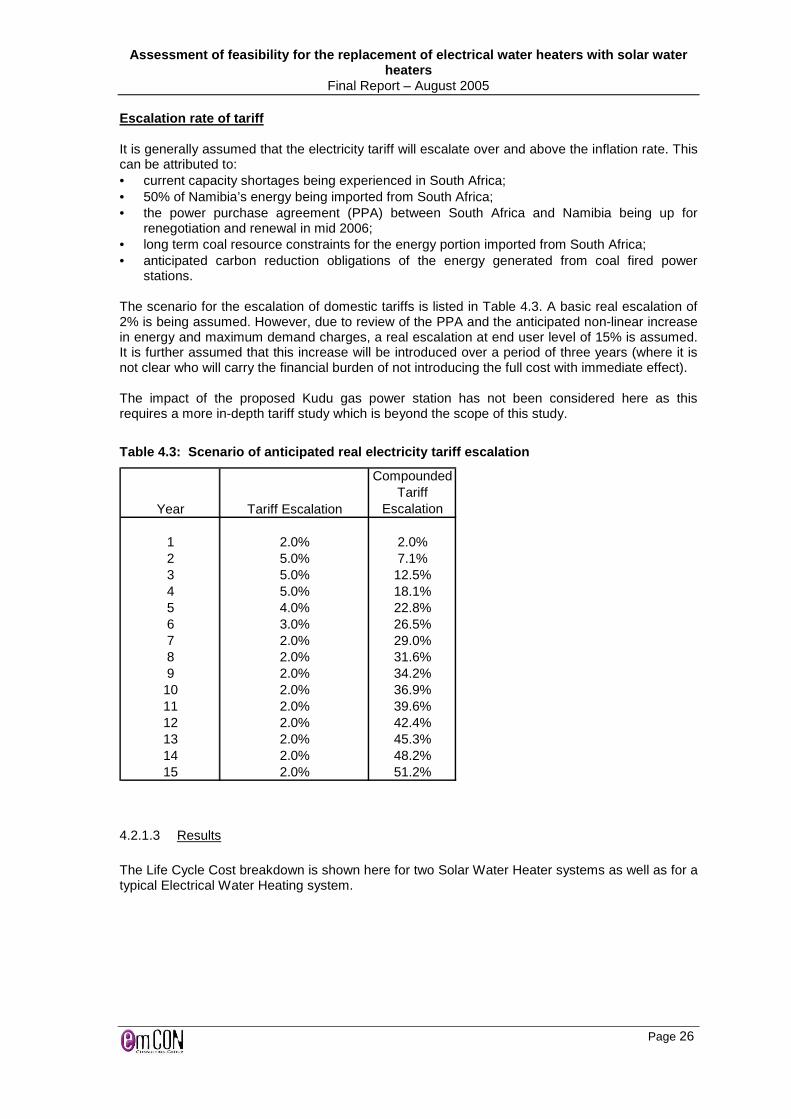
Escalation rate of tariff It is generally assumed that the electricity tariff will escalate over and above the inflation rate. This can be attributed to: • current capacity shortages being experienced in South Africa; • 50% of Namibia’s energy being imported from South Africa; • the power purchase agreement (PPA) between South Africa and Namibia being up for
renegotiation and renewal in mid 2006; • long term coal resource constraints for the energy portion imported from South Africa; • anticipated carbon reduction obligations of the energy generated from coal fired power
stations. The scenario for the escalation of domestic tariffs is listed in Table 4.3. A basic real escalation of 2% is being assumed. However, due to review of the PPA and the anticipated non-linear increase in energy and maximum demand charges, a real escalation at end user level of 15% is assumed. It is further assumed that this increase will be introduced over a period of three years (where it is not clear who will carry the financial burden of not introducing the full cost with immediate effect). The impact of the proposed Kudu gas power station has not been considered here as this requires a more in-depth tariff study which is beyond the scope of this study.
Table 4.3: Scenario of anticipated real electricit y tariff escalation
Year Tariff Escalation
Compounded Tariff
Escalation
1 2.0% 2.0%2 5.0% 7.1%3 5.0% 12.5%4 5.0% 18.1%5 4.0% 22.8%6 3.0% 26.5%7 2.0% 29.0%8 2.0% 31.6%9 2.0% 34.2%10 2.0% 36.9%11 2.0% 39.6%12 2.0% 42.4%13 2.0% 45.3%14 2.0% 48.2%15 2.0% 51.2%
4.2.1.3 Results
The Life Cycle Cost breakdown is shown here for two Solar Water Heater systems as well as for a typical Electrical Water Heating system.

Assessment of feasibility for the replacement of el ectrical water heaters with solar water heaters
Final Report – August 2005
Page 27
Initial74%
Maintenance26%
Figure 4.1: Typical percentage breakdown of the LCC of a 200litre, 2.8m 2 SWH: Windhoek pre-payment
The back-up element in a 200 litre SWH with a 2.8 m2 collector used for 5 person household consuming 30 litres of hot water per person per day will not consume any significant electricity (possibly over longer periods of inclement weather, which is not being modelled here) and therefore has zero operating costs since the collector area is sufficient for the hot water consumption requirements. This is shown in Figure 4.1. If for example a smaller SWH is selected for the same operating conditions then the electrical backup element will start consuming electricity, especially during the winter months. This is shown for a 180 litre SWH with a 2 m2 collector in Figure 4.2. Here the operating cost make up 16% of the total LCC of the system.
Initial61%
Maintenance23%
Operating16%
Figure 4.2: Percentage breakdown of the LCC of a 18 0litre, 2m2 SWH: Windhoek pre-payment
In both cases, as expected, the initial cost makes up the bulk of the cost of a Solar Water Heater system. In the case of the EWH, the operating cost represents the bulk of the hot water service costs while the initial capital cost is small (around 10%).
Assessment of feasibility for the replacement of el ectrical water heaters with solar water heaters
Final Report – August 2005
Page 28
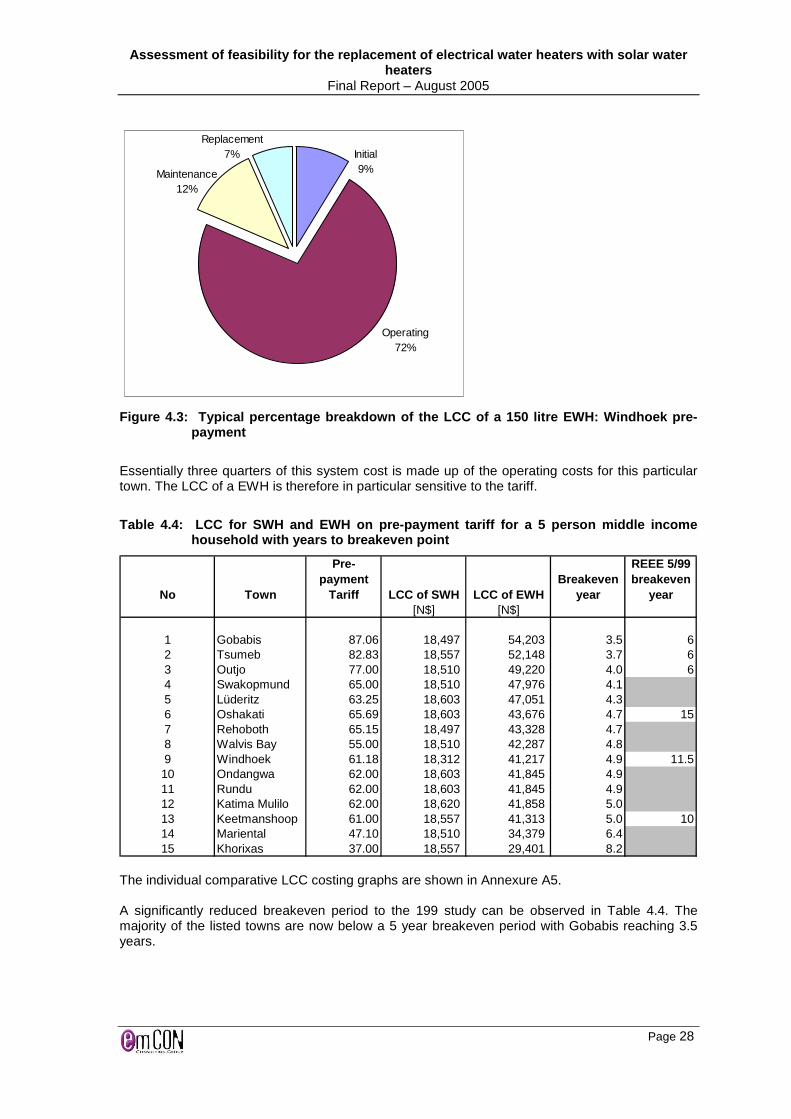
Replacement7% Initial
9%Maintenance12%
Operating72%
Figure 4.3: Typical percentage breakdown of the LC C of a 150 litre EWH: Windhoek pre-payment
Essentially three quarters of this system cost is made up of the operating costs for this particular town. The LCC of a EWH is therefore in particular sensitive to the tariff.
Table 4.4: LCC for SWH and EWH on pre-payment tari ff for a 5 person middle income household with years to breakeven point
No Town
Pre-payment
Tariff LCC of SWH LCC of EWHBreakeven
year
REEE 5/99 breakeven
year[N$] [N$]
1 Gobabis 87.06 18,497 54,203 3.5 62 Tsumeb 82.83 18,557 52,148 3.7 63 Outjo 77.00 18,510 49,220 4.0 64 Swakopmund 65.00 18,510 47,976 4.15 Lüderitz 63.25 18,603 47,051 4.36 Oshakati 65.69 18,603 43,676 4.7 157 Rehoboth 65.15 18,497 43,328 4.78 Walvis Bay 55.00 18,510 42,287 4.89 Windhoek 61.18 18,312 41,217 4.9 11.510 Ondangwa 62.00 18,603 41,845 4.911 Rundu 62.00 18,603 41,845 4.912 Katima Mulilo 62.00 18,620 41,858 5.013 Keetmanshoop 61.00 18,557 41,313 5.0 1014 Mariental 47.10 18,510 34,379 6.415 Khorixas 37.00 18,557 29,401 8.2
The individual comparative LCC costing graphs are shown in Annexure A5. A significantly reduced breakeven period to the 199 study can be observed in Table 4.4. The majority of the listed towns are now below a 5 year breakeven period with Gobabis reaching 3.5 years.
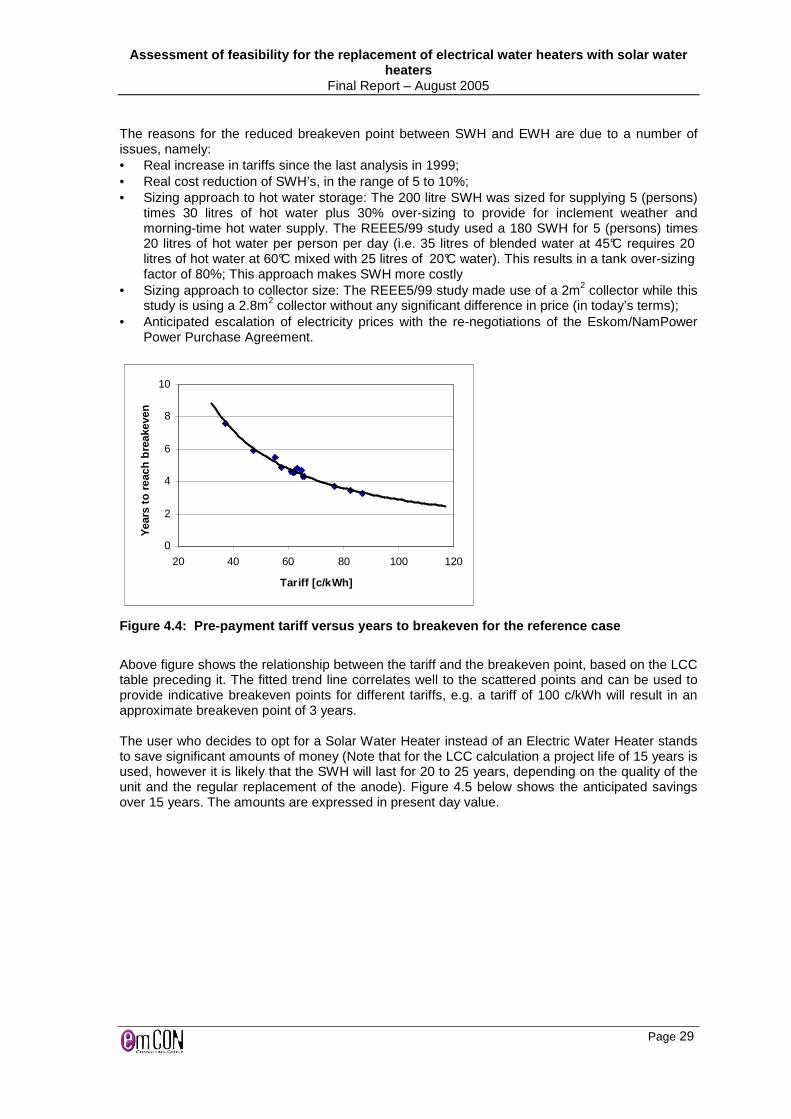
Assessment of feasibility for the replacement of el ectrical water heaters with solar water heaters
Final Report – August 2005
Page 29
The reasons for the reduced breakeven point between SWH and EWH are due to a number of issues, namely: • Real increase in tariffs since the last analysis in 1999; • Real cost reduction of SWH’s, in the range of 5 to 10%; • Sizing approach to hot water storage: The 200 litre SWH was sized for supplying 5 (persons)
times 30 litres of hot water plus 30% over-sizing to provide for inclement weather and morning-time hot water supply. The REEE5/99 study used a 180 SWH for 5 (persons) times 20 litres of hot water per person per day (i.e. 35 litres of blended water at 45°C requires 20 litres of hot water at 60°C mixed with 25 litres of 20°C water). This results in a tank over-sizing factor of 80%; This approach makes SWH more costly
• Sizing approach to collector size: The REEE5/99 study made use of a 2m2 collector while this study is using a 2.8m2 collector without any significant difference in price (in today’s terms);
• Anticipated escalation of electricity prices with the re-negotiations of the Eskom/NamPower Power Purchase Agreement.
0
2
4
6
8
10
20 40 60 80 100 120
Tariff [c/kWh]
Yea
rs to
reac
h br
eake
ven
Figure 4.4: Pre-payment tariff versus years to bre akeven for the reference case
Above figure shows the relationship between the tariff and the breakeven point, based on the LCC table preceding it. The fitted trend line correlates well to the scattered points and can be used to provide indicative breakeven points for different tariffs, e.g. a tariff of 100 c/kWh will result in an approximate breakeven point of 3 years. The user who decides to opt for a Solar Water Heater instead of an Electric Water Heater stands to save significant amounts of money (Note that for the LCC calculation a project life of 15 years is used, however it is likely that the SWH will last for 20 to 25 years, depending on the quality of the unit and the regular replacement of the anode). Figure 4.5 below shows the anticipated savings over 15 years. The amounts are expressed in present day value.

Assessment of feasibility for the replacement of el ectrical water heaters with solar water heaters
Final Report – August 2005
Page 30
-5,000
10,00015,00020,00025,00030,00035,00040,000
Gobab
is
Tsum
ebOut
jo
Swakop
mun
d
Lüde
ritz
Oshak
ati
Rehob
oth
Wal
vis B
ay
Win
dhoe
k
Ondan
gwa
Rundu
Katim
a M
ulilo
Keetm
ansh
oop
Mar
ienta
l
Khorix
as
Pre
sent
val
ue s
avin
gs [N
$]
Figure 4.5: Present value savings over 15 years wh en using a SWH compared to an EWH
Clearly the savings are significant while the service standard, i.e. the ability to provide hot water reliably, between an Electric water heater and a Solar Water Heater are the same. The years to reach breakeven under the credit metering tariff scheme are shown in Table 4.5 below. Due to the structure of this tariff (two-tier), the breakeven between SWH and EWH occurs at a later stage than in the case of pre-payment metering since the electricity saving through the SWH only has an impact on the energy revenue part of the tariff and not on the basic charges.
Table 4.5: LCC for SWH and EWH on credit metering tariff with years to breakeven point
No Town
Credit metering
Tariff LCC of SWH LCC of EWHBreakeven
year
REEE 5/99 breakeven
year[N$] [N$]
1 Gobabis 71.15 18,497 46,306 4.3 82 Tsumeb 63.66 18,557 42,633 4.8 12.53 Keetmanshoop 61.00 18,557 41,313 5.0 124 Ondangwa 61.00 18,603 41,348 5.05 Rundu 61.00 18,603 41,348 5.06 Lüderitz 50.82 18,603 39,980 5.37 Outjo 56.00 18,510 38,796 5.4 13.58 Oshakati 54.71 18,603 38,226 5.6 149 Walvis Bay 45.16 18,510 36,690 5.9 1010 Swakopmund 44.00 18,510 36,030 6.011 Katima Mulilo 50.00 18,620 35,901 6.112 Rehoboth 43.28 18,497 32,473 7.013 Otjiwarongo 41.25 18,497 31,465 7.3 15+14 Mariental 39.40 18,510 30,557 7.715 Okahandja 35.00 18,497 28,363 8.6 15+16 Windhoek 30.95 18,312 26,212 9.2 15+17 Khorixas 31.00 18,557 26,423 9.2
Users could reduce the circuit breaker rating of their connection to reduce costs of the basic charge. This however is not feasible as the user may want to activate the backup element of their SWH.

Assessment of feasibility for the replacement of el ectrical water heaters with solar water heaters
Final Report – August 2005
Page 31
0
2
4
6
8
10
20 30 40 50 60 70 80
Tariff [c/kWh]
Yea
rs to
reac
h br
eake
ven
Figure 4.6: Credit metering tariff vs. years to br eakeven for the reference case
Due to the lower tariffs, this graph extends to the left hand side, with a resulting increase in the years to breakeven compared to Figure 4.4 (note that Figure 4.4 and Figure 4.6 superimpose in the tariff range of 40 t0 70 c/kWh).
4.2.2 Sensitivity analysis The sensitivity analysis is conducted to highlight variables that have significant impact on the Life Cycle Cost of SWH and EWH. LCC results where sensitive input variables have a high degree of uncertainty therefore need to reflect that uncertainty (e.g. the actual average hot water consumption figures in a household). The following variables are investigated:
• Water consumption per person (SWH sizing) • Discount rate • Tariff escalation
The sensitivity is conducted for the Windhoek case, as that is the largest potential market.
4.2.2.1 Hot water consumption rate
Hot water consumption is estimated at 30 litres per person per day for a middle-income household (20 litres for a low income and 40 litres per person per day for a high income). There was no quantitative data available to backup these consumption figures and only one data set from the REEE5/99 study of 1999 making a sensitivity analysis of this parameter vital. This parameter therefore relies on assumptions and experience data.

Assessment of feasibility for the replacement of el ectrical water heaters with solar water heaters
Final Report – August 2005
Page 32
4.0
5.0
6.0
7.0
8.0
9.0
10.0
0 10 20 30 40 50 60
Actual w ater consumption[litres per person per day]
Bre
akev
en [y
ears
]
-40%
-20%
0%
20%
40%
60%
80%
Per
cent
age
chan
ge in
br
eake
ven
Breakeven
Change
Ref
ere
nce
case
Figure 4.7: Sensitivity of Years to Breakeven to d aily hot water consumption
Figure 4.7 shows a significant impact on the Years to breakeven if the hot water consumption deviates significantly from the assumed hot water consumption. The U & V-shaped curves also highlight two impacts:
1) If the SWH system is oversized (i.e. area to the left of the reference case line) then the years to breakeven increases and
2) 2) if the SWH is undersized, then increasing electricity consumption results in an ineffective hot water solution (i.e. the SWH becomes an expensive EWH as the hot water consumption exceeds the consumption rate that the SWH was sized for).
The V-shape of the ‘percentage change’ curve shows that the change in Years to Breakeven is linear to each side of the minimum. However it also shows through the steeper gradient of the line that the impact of under-sizing (to the right of the minimum) is more significant than the impact of over-sizing (to the left of the minimum). This suggests that a SWH should rather be sized too large than too small. The sensitivity analysis demonstrates that water consumption is a critical (sizing) parameter, which needs to be assessed as accurately as possible. Hence low income households should choose a smaller SWH for the same number of persons staying in the household in order to shorten the repayment period. The same holds true for the technical performance of the SWH, e.g. collector efficiency, and for the operating conditions, e.g. irradiance levels. These parameters impact on the sizing of the SWH and if incorrectly assessed will result in an increase of the Years to Breakeven.
4.2.2.2 Tariff escalation
The tariff levels impact on the operating costs of the EWH and thus on the breakeven point between SWH and EWH. The southern African region is known for low tariff levels with the result that the use of SWH’s in the past has not been encouraged due to poor financial viability. However due to recent tariff increases as well as the renegotiations of the Power Purchase Agreement in the near future significant changes, in excess of inflation, are being predicted by the industry.

Assessment of feasibility for the replacement of el ectrical water heaters with solar water heaters
Final Report – August 2005
Page 33
4.4
4.6
4.8
5.0
5.2
5.4
5.6
0% 2% 4% 6%
Tariff escalation (constant over project life)
Bre
akev
en [y
ears
]
-8%
-4%
0%
4%
8%
12%
16%
Per
cent
age
chan
ge in
br
eake
ven
Breakeven ChangeR
efer
enc
eca
se
Figure 4.8: Sensitivity of Years to Breakeven to t ariff escalation
Figure 4.8 shows that changes in tariff escalation impact linearly on the Years to Breakeven and that an increase in escalation of 1% will result in a 3% reduction of the Years to Breakeven. The anticipated escalation for the reference case (which is not a constant escalation per annum but is a percentage determined per annum based on the anticipated developments around the ESKOM PPA with Namibia) is at an average escalation of 4%. Should this actually be an overestimation and in fact found to be zero, then Years to Breakeven would actually increase by about 12%.
4.2.2.3 Real discount rate
The reference case assumes a real discount rate of 3%, based on current bank interest rates and current inflation rates.
3.5
4.0
4.5
5.0
5.5
6.0
6.5
0% 2% 4% 6% 8% 10%
Discount rate
Bre
akev
en [y
ears
]
-10%
-5%
0%
5%
10%
15%
20%
Per
cent
age
chan
ge in
br
eake
ven
Breakeven Change
Ref
ere
nce
case
Figure 4.9: Sensitivity of Years to Breakeven to d iscount rate
Figure 4.9 shows that higher discount rates result in an increase in the Years to Breakeven. This is to be expected since most of the EWH costs are in the future (operating costs) and will be discounted at a higher rate. The impact is linear and for every percent increase in the discount rate the increase in Years to Breakeven is about 2.8%.

Assessment of feasibility for the replacement of el ectrical water heaters with solar water heaters
Final Report – August 2005
Page 34
4.2.3 Life cycle costing tool The Life Cycle Cost Analysis Tool is a spreadsheet-based tool which enables a comparative analysis of the LCC of Solar Water Heaters and Electrical Water Heaters. The tool has been developed for Namibia and therefore makes use of:
• Namibian solar resource and temperature data; • SWH and EWH units offered in the Namibian market (only indirect SWH systems have
been considered in this analysis); and • Namibian towns with relevant tariff and distance from the capital (shipping cost).
Life Cycle Costing
Irradiance- Nominal - [Global &
Energy]
Watertemperature
[Global &Energy]
Capital cost[Pricing]
Discountrate
[Global]Project
life[Global]
Maintenance &Replacement costs -
Intervals[Main]
Number of personsper hot water system
[Main]
Hot water perperson per day
[Main]
Efficiency& Losses[Global &Energy]
Storagesize
[Pricing]
Collectorsize
[Pricing]
Shipping cost:Distance to town& system weight
[Towns]
Tariffescalation
[Global]
Tariff[Tariff]
Carbon Credits- Optional -
[Global]
Figure 4.10: Input parameters to LCC [with name of spreadsheet page in brackets]
Figure 4.10 displays the different elements which impact on the result of the Life Cycle Costing [as well as the spreadsheet page on which the parameter is defined of used].

Assessment of feasibility for the replacement of el ectrical water heaters with solar water heaters
Final Report – August 2005
Page 35
Figure 4.11: The ‘MAIN’ page of the LCC Analysis t ool
For single sets of results, the LCC tool can be operated from a single page, i.e. the ‘MAIN’ page, provided that the costing and tariff data are up to date. That page allows selection of town, tariff type, number of persons, average hot water per person per day, selection of SWH and EWH. The resulting Life Cycle Costs are displayed on that page, with a cumulative LCC graph and the calculated intersection between the SWH and the EWH hot water supply option. Refer to Figure 4.11. Sections under the cost inputs of the ‘MAIN’ page can be expanded to show maintenance and replacement costs and at which interval they occur. Refer to Figure 4.12.
Figure 4.12: Recurring costing inputs into LCC too l
User-friendly features of this tool are:
• calculation of the breakeven point between the SWH and the EWH systems selected (rather then this figure having to be read off a graph);
• Cost inputs to the life cycle calculations are “driven” through a cost and cost occurrence interval table (instead of entering the cost figures into the relevant years in which are occur). This makes it simple to effect changes in these intervals without having to go into the LCC sheet and paste and delete cost figures;
• Use of drop down menus for selection – e.g. the town, the tariff type, the SWH, the EWH;

Assessment of feasibility for the replacement of el ectrical water heaters with solar water heaters
Final Report – August 2005
Page 36
• Main input drivers and the key outputs one spreadsheet page; • Allowing “use” of the backup element in the SWH, i.e. if a SWH is undersized (either the
collector or storage) then this will result in the back-up element being activated in this particular system;
• That data such as prices and tariffs can be updated in the relevant background page of the tool.
A detailed description for each of the spreadsheet pages can be found under ‘User info’ in the spreadsheet. This is a financial model and not a scientific model, i.e. its use is to determine the Life Cycle Cost of SWH and EWH and to calculate the breakeven point, being the year from which a SWH will become cheaper to operate than a EWH. In order to arrive at these results a number of scientific calculations have to be made, some of which are based on assumptions (stated in the LCC tool) or on generic data sets (e.g. inland and coastal water temperatures, irradiance levels, EWH and SWH storage tank losses, efficiency of solar collector etc). These parameters vary from the actual figures which is acceptable as the tool should be used to indicate a trend in the LCC analysis between SWH and EWH rather than analyse to any technical performance aspects.

Assessment of feasibility for the replacement of el ectrical water heaters with solar water heaters
Final Report – August 2005
Page 37
4.3 Macro-economic perspective for Namibia
4.3.1 Energy and demand for electrical water heatin g The average 5-person household, consuming 30 litres hot water per person per day, will consume approximately 10kWh per day to heat this water. This represents a cost to this “typical household” of between N$165.00 to N$261.00 per month depending on the local tariff. Energy consumption for EWH is estimated at between 8-12% of total electrical energy kWh sold during 2004, based on approximately 93,000 households. Based on an average electrical element rating of 2.5 kW and a diversity factor of 0.5, domestic EWH represents 116MW maximum demand. Windhoek and Walvis Bay have load control systems (ripple control), which reduce the contribution of domestic EWH at times of peak load. The City of Windhoek has ripple control with an estimated connected load of about 25 MW, which allows peak reduction of approximately 11MW. Walvis Bay estimates that their load control system switches approximately 4 MW at peak times. Accounting for load control, domestic EWH represents about 100 MW peak load or about 22% of Namibian peak maximum demand9.
4.3.2 Potential for energy and demand saving The sales information for the last five years shows a 16% annual growth rate in SWH sales. This is taken as the business-as-usual base case, and from this an additional three scenarios have been developed based on the anticipated proportion of new houses and replacement of existing EWH systems with SWH, as follows:
Table 4.6 : Three scenarios for growth in SWH adopt ion
Scenario Scenario description Number of SWH over 10 years10 Penetration Business-as-usual 16% annual compound growth 10,496 9% Scenario 1 20% new housing, 1% replacement 17,736 15% Scenario 2 40% new housing, 2% replacement 36,815 31% Scenario 3 60% new housing, 5% replacement 70,835 60% The future drivers of SWH sales are expected to be higher electrical tariffs and lower SWH costs coupled with aggressive marketing and awareness creation. Scenario 2 is expected to be the highest achievable goal, obtaining a penetration of approximately 30% in 10 years. Scenario 3 would probably require legislative intervention.
9 Source: NamPower 2004 Annual Report. Namibian Maximum Demand 461MW including Skorpion Mine. 10 Calculated based on census housing figures for formal housing, applying a 2.5% annual growth rate in formal housing provision. E.g. For scenario 2, an annual simulation calculates 2% of all existing housing converted to SWH, while 40% of all new housing is assumed to be provided with SWH.

Assessment of feasibility for the replacement of el ectrical water heaters with solar water heaters
Final Report – August 2005
Page 38
The penetration of SWH into the market is represented by a polynomial curve, showing a slow initial uptake, followed by a period of rapid acceleration, followed by a slowing of penetration as the potential market becomes saturated. The Business-as-usual and Scenario 2 curves are shown in the following figure.
Figure 4.13: SWH market penetration scenarios
Based on these two scenarios, the maximum demand growth of Namibia will be slowed from an assumed base case growth rate of 3% per annum as shown in the following figures. This analysis shows that the anticipated reduction in maximum demand with an aggressive marketing campaign will be approximately 5% (31MW) after 10 years, with a reduction in energy consumption of approximately 2.6% (96 GWh).
0%
5%
10%
15%
20%
25%
30%
35%
0 1 2 3 4 5 6 7 8 9 10
Years
Per
cent
age
dom
estic
SW
H m
arke
t pe
netr
atio
n
Aggressively Promoted Business-as-usual
460
480
500
520
540
560
580
600
620
0 1 2 3 4 5 6 7 8 9 10
Years
Max
imum
Dem
and
in M
W
0%
5%
10%
15%
20%
MD Business-as-usual MD Aggressive Promotion % MD Saving

Assessment of feasibility for the replacement of el ectrical water heaters with solar water heaters
Final Report – August 2005
Page 39
Figure 4.14: SWH maximum demand reduction scenarios
Figure 4.15: SWH energy reduction scenarios
4.3.3 Benefit of SWH to Namibia Namibia is a net importer of its energy requirements, with approximately 53% of electrical energy being imported. Nampower’s budget for imported electrical power for the current financial year is N$ 91 million. This includes both consumption and demand charges. This represents approximately 0.5% of GDP. With the planned construction of the Kudu Gas Power Station of approximately 600MW scheduled to come on line in 2009, Namibia will become an exporter of electrical energy, until such time that demand in Namibia again exceeds supply. Any reduction in energy and demand will be to the benefit of Namibia’s balance of payments, both as an energy importer and exporter. It is estimated that a 31% penetration of SWH (as indicated above in scenario 2) for domestic water heating will result in a reduction of cost of imported electrical energy of approximately N$15 million per annum (present value), which represents 16% of present day cost of electrical energy imports. As the import tariffs are anticipated to increase above the rate of inflation, the predicted dollar savings will increase substantially.
4.3.4 Green house gas emissions Green House Gas (GHG) emissions are largely responsible for the earth’s global warming. A number of gasses contribute to the Greenhouse effect. In terms of energy generation through coal fired power stations, the Green House Gases are11 CO2, CH4 and N2O. 11 Reference: Ret Screen International [www.retscreen.net]
2,700,000
2,900,000
3,100,000
3,300,000
3,500,000
3,700,000
3,900,000
0 1 2 3 4 5 6 7 8 9 10
Years
Ann
ual E
nerg
y C
onsu
med
in M
Wh
0%
5%
10%
15%
Energy Business-as-usual Energy Aggressive Promotion % Energy Saving

Assessment of feasibility for the replacement of el ectrical water heaters with solar water heaters
Final Report – August 2005
Page 40
At an approximate efficiency of 35%, a coal-fired power station emits 1.069 tons of CO2 per MWh of electricity generated. Namibia’s energy consumption, approximately 2,945 GWh per annum, stems from the following sources:
Table 4.7: Namibia’s electrical energy sources
Source Energy Consumption Percentage NamPower 1379 GWh 47% Eskom 1423 GWh 48% ZESCO 9 GWh 0.3% ZESA 87 GWh 3% STEM 47 GWh 2%
South Africa’s coal fired power stations contribute 92% to South Africa’s energy mix which means that approximately 44% of the energy consumed in Namibia is generated by coal fired power stations. Therefore each MWh of energy consumed in Namibia re sults in 0.472 tons of CO 2 emissions . The Clean Development Mechanism (CDM) provides a route to access finance through the carbon trading markets, which ties into GHG emission targets as set by the Kyoto protocol. A 200 litre SWH would displace a 150 litre electrical water heater and approximately 10kWh of energy consumption per day. This results in a reduction of electricity consumption of 3.65MWh per annum, equivalent to an abatement of 1.72 tons per annum. At the current trading value of CO2, USD 10 per ton, this would provide a constant revenue stream over the SWH system life, equivalent to USD 17.2 per annum per SWH. The overall picture of the estimated present and possible future green house gas abatements from the displacement of EWH by SWH in Namibia is presented in Table 4.8.
Table 4.8: Green house gas abatement estimates for displaced EWH.
Scenario No SWH
displacing EWH Abatement
Tons CO 2/annum Tradeable value
USD Present situation 3,200 5,514 55,138 Future prediction at 31% penetration 36,815 63,434 634,343 Tapping into the CDM regulated carbon market is however not a minor issue as the transaction costs for smaller markets, such as Namibia may offset the anticipated benefits. This must be observed over time and as precedents for similar programmes under similar conditions become available, the carbon markets should be considered for Namibia.
4.3.5 Potential for local manufacture/assembly of S WH Some individuals have considered local manufacture/assembly of SWH in the past, but have found that the market was too small and the risks too high. Twelve suppliers/installers/investors were interviewed, some of whom requested confidentiality of information. Those who have or are considering local manufacture are not aware of incentives and regional trade regulations or find these confusing. The perceived main risks to local production are the following: • Very small and uncertain local market, at least initially • Perceived trade barriers to export within the region

Assessment of feasibility for the replacement of el ectrical water heaters with solar water heaters
Final Report – August 2005
Page 41
• Competition with regional manufacturers already in production • Competition from high quality imported systems • Time to develop a new product of suitable quality and obtain certification • Access to investment capital • Resource requirements • Incentives for local manufacture/assembly are not clear (e.g. Tax incentives, trade barrier
removal, subsidy, financing support) While local manufacture/assembly of SWH will be to the benefit of Namibia, care must be taken to ensure satisfactory quality. A low quality product will not find acceptance in the local market, nor will it be exportable, while it will give SWH a bad reputation. While local or regional manufacture/assembly should result in lower-cost, shorter-life SWH systems, these compete with high-quality, high-cost, longer-life imported systems from outside the region. It is probable that a market exists for both types of system; the lower-cost systems will satisfy the medium-income domestic market, while higher-quality systems will be more readily adopted by the institutional and higher-income domestic market. It is believed that local manufacture/assembly will follow organically if the local SWH market is aggressively expanded with government support, appropriate, clear incentives are provided, and regional and international trade barriers (such as there may be) are lowered. Scenario 2 represents a market of 36,800 SWH systems as opposed to business-as-usual with a market of 10,500 SWH systems over 10 years. This translates to a three-fold increase in the market, which substantially improves the potential for local manufacture. Under the business-as-usual scenario and in the absence of any undertaking from government to adopt SWH it is unlikely that local manufacture will be viable or attractive to private investors. The promotion of SWH uptake will be best served by maintaining a good balance between imported systems and local manufacture, if local manufacture is commenced.

Assessment of feasibility for the replacement of el ectrical water heaters with solar water heaters
Final Report – August 2005
Page 42
5 The way forward
5.1 Past, present and future perspective
5.1.1 Economic barriers The micro-economic analysis shows that solar water heating has changed substantially from the situation sketched in REEE 5/99 in that the previous economic barriers of high capital cost combined with low electricity costs have softened to the extent that the break-even period for domestic SWH has dropped substantially mainly because:
• The cost of SWH equipment has reduced in real terms (or increased below inflation) • Electricity tariffs in general show an increase above inflation. This trend is expected to
continue as the shortage in generation capacity with the SAPP accelerates electricity tariff escalation
These trends mean that adoption of SWH is becoming more economically viable for the domestic market, while experience shows that it is economically viable for institutional consumers on a 3-tier tariff.
5.1.2 Access to finance The previous barrier of a lack of capital to finance the acquisition of SWH has been resolved through the micro-financing possibilities via the RE micro-finance scheme. In addition to this, financial institutions should be encouraged to allow consumers to finance SWH systems via their home loan mortgage finance. Essentially, if a consumer can afford the cash flow to pay for electrical water heating, they can afford solar water heating.
5.1.3 Market status The present SWH market is dominated by imported, larger, indirect systems of good quality. This indicates that the present demand is mainly high-income households and institutional consumers, and that this market has matured. The small market in Namibia has so far ensured that poor quality technology could not survive. If SWH uptake increases, the possibility exists that poor quality SWH equipment is placed on the market as a result of the increased demand. Specific action must be taken to prevent this from jeopardising the expanding SHW market. The application of a suitable mechanism to ensure appropriate standards of equipment and installation is therefore essential.
5.1.4 Government support As economic forces now tend to support the adoption of SWH, the promotion of this RET will not require legislative intervention. Rather with Government support in compliance with the Energy Policy, SWH uptake may be expected to improve as a result of natural market forces.
5.1.5 Awareness

Assessment of feasibility for the replacement of el ectrical water heaters with solar water heaters
Final Report – August 2005
Page 43
The barrier of lack of awareness still remains as the largest barrier to the uptake of SWH. While this study shows that the micro-economic situation is more viable than previously determined, this information must reach the various stakeholders. This barrier has to date not been dealt with effectively.
5.1.6 Promotion of SWH Various measures to promote the uptake of SWH were proposed in REEE 6/99. These proposals are outlined here together with the present recommendation for each: • Institutional – Support for the White Paper on energy policy. This remains valid. • Legislative – Legislation or planning guidelines at local government level were recommended
to ensure that all new houses are equipped with a solar water heating system. This prescriptive approach is not recommended in the short term by this study, as it will most likely require substantial time and encounter political resistance. Legislation should, however, be considered in the medium to long term.
• Economic – Reduce the cost of SWH systems by: o Encouraging use of SADC products – This is happening naturally. o Long term financing with low interest loans – This has been implemented. o Provide direct subsidies in the form of rebates – The present scenario is that:
� SWH are being indirectly subsidised via low interest loans scheme. While a lower cost subsidy mechanism would be to subsidise at the point of importation, SWH systems have decreased in real terms since 1999. Subsidy is therefore not considered necessary at this stage.
• Technical – The previous recommendations included: o Provide subsidised/free testing and reporting. We recommend that manufacturers
must arrange for their certification to approved standards. o Improve confidence in the quality of SADC-sourced products. We recommend that
manufacturers are responsible for proving their products. o Provide guidelines for sizing and codes of practise for installation. This is still required
and the micro-economic tool forms part of this solution. • Cultural – Provide counselling to reduce the negative perceptions and impacts of SWH
systems. Awareness marketing to counter negative perceptions and experiences is still crucial. The following beliefs persist:
� SWH does not work at the coast. � SWH is difficult and expensive to maintain. � SWH is a specialist installation. � The repayment period is very long. � SWH is an inferior technology to EWH. � Conversion from EWH to SWH is difficult and awkward.
• Education/awareness – The recommendations include: o Awareness campaigns to planning and design professionals to reduce bad projects
and uninformed decisions. This is still valid. o Promotion to the public. This is still valid.
Additional mechanisms or strategies to ensure the “ aggressive” promotion of SWH include the following: • The opportunity of certifying and trading the ‘non-energy’ benefits of hot water which
supplied in a distributed manner at the point of use by means of Tradable Renewable Energy Certificates (TRECs) should be actively explored. TRECs have been used effectively in Australia since 2000/1. This is not considered appropriate for Namibia at this stage because of the immature RE environment and small scale of the Namibian market. It may become more feasible if and when a SADC-wide implementation system can be established.

Assessment of feasibility for the replacement of el ectrical water heaters with solar water heaters
Final Report – August 2005
Page 44
• The feasibility of implementation of CDM for Namibia should be investigated. The example of the Kuyasa Project in Khayelitsha, Cape Town12 has established a precedent for SWH CDM projects.
12 See the South African projects page on http://www.southsouthnorth.org/

Assessment of feasibility for the replacement of el ectrical water heaters with solar water heaters
Final Report – August 2005
Page 45
5.2 Proposed strategy
5.2.1 Promotion of SWH through lobby activities The promotion of SWH technology should be led by the Ministry of Mines and Energy, who must see to it that all stakeholders are fully informed of the issues surrounding SWH. To achieve this the MME should appoint an official within the Ministry (or an external person) as the national co-ordinator for SWH in Namibia. This National SWH co-ordinator should have a budget to meet stakeholders and co-ordinate the national strategy. National Housing Enterprise NHE must be convinced that SWH technology is to the benefit of their Clients. If the installation of SWH is not obligatory for NHE housing, it should at least be an option that is presented clearly to all NHE Clients. The NHE should be assisted in developing the necessary promotion tools. Department of Works The Department of Works must be convinced of the financial viability of SWH by means of a presentation which includes case studies. The objective should be that all future government capital projects and hot water system replacement programmes must use or at the least consider SWH before any other solution. Public Sector All line Ministries must be convinced of the benefits of SWH technology. The objective must be that the appropriate planning and facilities and operational management personnel in Ministries should accept SWH as a mature technology and a Government priority. Financial Sector The financial sector must be lobbied to ensure that financing for SWH systems is available to homebuyers. A presentation to the relevant managerial staff of the commercial banks is proposed. The key messages are that in the context of global climate change houses with SWH systems will enjoy increasingly higher comparative values and, also, that home loan clients with SWH systems will also, on a comparative basis, have increasingly higher disposable incomes to service home loan repayments. Suppliers and Installers The current status of the SWH industry must be communicated to the suppliers of SWH systems, so that they may assist with promotion within their own industry. The MME must lobby the various vocational training centres to ensure that appropriate, quality training on SWH installation practise is provided both to present plumbing trainees and for upgrading of skills of existing plumbers through public training courses. Consultants Consultants must be made aware of the status of the SWH industry and the promotion of the technology. This must be achieved by means of dissemination of information and provision of the tool. As it is usually difficult to obtain the attendance of consultants at a seminar, this should be achieved by means of a printed/e-mailed newsletter to all members of the NIA, NIQS and ACEN.

Assessment of feasibility for the replacement of el ectrical water heaters with solar water heaters
Final Report – August 2005
Page 46
Industry Specific industrial and institutional sectors must be targeted to provide them with the necessary information and access to the life-cycle costing tool in order to assist them in making informed decisions. The institutions that should be targeted include:
• The Manufacturers Association of Namibia • The Hospitality Association of Namibia (HAN) • The mining industry
Public Awareness Public awareness of SWH technology must be promoted via the media. This can consist of regular articles relating to the technology such as the economics, case studies and products on the market, published through a variety of print and electronic media. Promotion of public awareness will require substantial effort and must be sustained over a long period of time in order to ensure results. The Ministry of Mines and Energy must fund this activity and should find a suitable agency or individual to perform this task. Public awareness will be promoted well if NAMREP organises a peaceful march on State House, complete with banners, toyi-toying participants and the Police brass band. Housing developers No direct action is proposed. If the public awareness campaign is sufficiently thorough, private housing developers will be forced to install SWH as a result of public demand. NamPower, Local Authorities and REDs No specific action is proposed.
5.2.2 Approved certified systems A suitable mechanism is necessary to ensure that only quality systems are installed. Acceptable certification of SWH performance must consist of the appropriate Australian, ISO and SANS standards. Test certificates from the respective test authorities will have to be provided. The certification tests must be investigated against each other for compatibility. It must be noted that a certification facility does not yet exist in Southern Africa. It is reported that a facility in South Africa will be operational in mid 2006. Because certification procedures take 2 – 3 years to be implemented and become accepted, a two stage approach is suggested, namely: 1. A short term approach for QA which relies on a proven track record, a code of practice for
installation and performance bonds 2. A longer term approach which relies on the more conventional use of certified products and
the code of practice for installation An interim list of approved systems should therefore be drawn up until such time that certification can be arranged. The following is proposed: • The MME should prepare and maintain a list of approved systems. Systems should only be on
the approved list if they have the necessary certification in terms of thermal and mechanical performance. In addition, any new SWH systems should have a proven track record, either in Namibia or elsewhere in the world.
• Public sector institutions (Government Ministries, Parastatals, NHE) must only install certified systems. Only indirect systems should be used in the public sector.

Assessment of feasibility for the replacement of el ectrical water heaters with solar water heaters
Final Report – August 2005
Page 47
• The micro financing scheme must only finance approved certified systems. • All awareness creation programmes should only promote approved certified systems. • An existing, appropriate code of practise for the installation of SWH systems must be
identified and promoted via the training institutions and suppliers.
5.2.3 Quality of installation The quality of installation of SWH must be promoted through a training programme for installers. The objective should be to promote SWH as a standard plumbing installation, in the same way as EWH.
5.2.4 SWH life cycle costing tool The SWH life cycle costing tool must be supplied to relevant stakeholders. The tool should be made available as a web based tool for public use. This will enable the background data to be regularly updated and the tool refined and adapted to changing circumstances without having to redistribute it. Promotion of a web-tool should be part of the general promotion activity.
5.2.5 Further measures for promotion of SWH The following activities are recommended for further action. • The feasibility of the implementation of CDM and TRECs in Namibia should be investigated in
detail to determine the mechanisms involved and if the Namibian RE industry can benefit from this.
• The solar revolving fund must be monitored on a continuous basis and adapted to changing circumstances where necessary.
• A demonstration of the applicability of SWH technology at the Namibian coast is required to counter the perception that SWH are not of value at the coast.

Assessment of feasibility for the replacement of el ectrical water heaters with solar water heaters
Final Report – August 2005
Page 48
6 References (1) Emcon (1998), REEE 2/98 Technical and Micro-Economic Comparison between Solar Water
Heaters and Electrical Storage Water Heaters, MME, GTZ (2) Emcon (1999), REEE 5/99 Simulation and Monitoring of Solar and Electric Water Heating
Systems, MME (3) DRFN (1999), REEE 6/99 Promotion and Macro-Economic Analysis of Solar Water Heating in
Namibia, MME (4) Batidzirai B (May 2004), Potential for solar water heating in Zimbabwe, Department of
Science, Technology & Society, Utrecht University, The Netherlands (5) Cawood W & Morris GJ (2002), Baseline study – solar energy in South Africa, capacity
building in energy efficiency and renewable energy, Department of Minerals and Energy, South Africa
(6) 2001 Population and Housing Census, National Report, Basic Analysis with highlights, Central Bureau of Statistics, National Planning Commission. July 2003.

Assessment of feasibility for the replacement of el ectrical water heaters with solar water heaters
Final Report – August 2005
Page 49
ANNEXURES

Assessment of feasibility for the replacement of el ectrical water heaters with solar water heaters
Final Report – August 2005
Page 50
Annexure A1 List of SWH Importers Excel Hardware & Services C.C Product: Megasun Contact Person: Heiner Dörgeloh Helmut Angula St, P O Box 40, Omaruru Tel: 064-570185 Fax: 064-570486 Cell: 081 1273366 E-mail: [email protected] Web: www.megasun-solar.com NEC – Engineering Sales & Services (Pty) Ltd. Product: Solahart Contact Person: Nico Brückner 21 Joule St Southern industria, P O Box 5052, Windhoek Tel: 061-236720 Fax: 061-232673 Cell: 081 1244740 E-mail: [email protected] Web: www.solahart.com.au Web: www.namencor.com.na Pupkewitz Megatech Product: Extream Solarstream Contact Person: Wilfried Lakemeier 1 Edison St, Ausspannplatz, P O Box 40726, Windhoek Tel: 061-374450 Fax: 061-374451 Cell: 081 1275917 E-mail: [email protected] Soltec C.C. Product: Solardome Contact Person: Heinrich Steuber 51 Marconi St, Southern industria, P O Box 315, Windhoek Tel: 061-235646 Fax: 061-250460 Cell: 081 1243056 E-mail: [email protected] Web: www.solardome.co.za Suntank Product: Suntank Contact Person: Udo Kutz 83 Strand St, P O Box 3855, Vineta, Swakopmund Tel: 064-401009 Fax: 064-400009 Cell: 081 1288343 E-mail: [email protected] Web: www.suntank.com

Assessment of feasibility for the replacement of el ectrical water heaters with solar water heaters
Final Report – August 2005
Page 51
Annexure A2 List of some SWH Installers Note that this list does not represent all installers of SWH in Namibia. Soltec CC Contact Person: Heinrich Steuber 51 Marconi St, Southern industria, P O Box 315, Windhoek Tel: 061-235646 Fax: 061-250460 Cell: 081 1243056 E-mail: [email protected] Sun Tank Contact Person: Udo Kutz 83 Strand St, P O Box 3855, Vineta, Swakopmund Tel: 064-401009 Fax: 064-400009 Cell: 081 1288343 E-mail: [email protected] Solar Age Namibia (Pty) Ltd Contact Person: Conrad Roedern 2 Jeppe St, Northern industria, P O Box 9987, Windhoek Tel: 061-215809 Fax: 061-215793 E-mail: [email protected] Orujaveze-Solar C.C. Contact Person: Peter Ackermann 9 Bachstreet, Windhoek West, P O Box 2409, Windhoek Tel: 061-260338 Fax: 061-260338 Cell: 081 1275409 E-mail: [email protected] Excel Hardware & Services C.C. Contact Person: Heiner Dörgeloh Helmut Angula St P O Box 40, Omaruru Tel: 064-570185/570485 Fax: 064-570486 Cell: 081 1273366 E-mail: [email protected] NEC – Engineering Sales & Services (Pty) Ltd. Contact Person: Nico Brückner 21 Joule St, Southern industria, P O Box 5052, Windhoek Tel: 061-236720 Fax: 061-232673 E-mail: [email protected] Web: www.namencor.com.na

Assessment of feasibility for the replacement of el ectrical water heaters with solar water heaters
Final Report – August 2005
Page 52
Annexure A3 Database of SWH equipment available in Namibia

Assessment of feasibility for the replacement of el ectrical water heaters with solar water heaters
Final Report – August 2005
Page 53
Annexure A4 List of SWH Standards
Standard Source Description Type
ASHRAE 93-1986 USAMethods of Testing to determine the thermal performance of solar collectors
Test method
ASHRAE 95-1987 USAMethods of Testing to determine the thermal performance of solar domestic water heating systems
Test method
AS 2813 – 1985 AustraliaSolar water heaters – Method of test for thermal performance – Simulator method
Test method
AS 2984 – 1987 AustraliaSolar water heaters – Method of test for thermal performance – Outdoor test method
Test method
ELOT 879-90 GreeceTest methods for solar domestic hot water systems [Essentially the same as ISO 9459-2]
Test method
SABS 1307 RSAStandard specification for domestic solar water heaters. (Sets out various test methods and compliance requirements for SWH)
Standard specificationCertification
SABS Method 1210:1992 RSATest method (Specifies how the mechanical strength tests should be conducted for SABS 1307)
Test method
SABS Method 1211:1992 RSADomestic solar water heaters – thermal performance (Sets out various thermal performance tests. Based on ISO 9459-2)
Test method
SABS 0106:1972 RSACode of Practise for installation of SWH (In serious need of updating)
Code
SABS 151:2002 RSAFixed electric storage water heaters (SABS 1307 refers to this standard for electrical elements and ancilliary components)
ISO 9459-1: 1993 ISOSolar heating – Domestic water heating systems – Part 1: Performance rating procedure using indoor test methods
Test method
ISO 9459-2:1995 ISO
Solar heating – Domestic water heating systems – Part 2: Outdoor test methods for system performance characterization and yearly performance prediction of solar-only systems.
Test method
ISO 9459-3:1997 ISO
Solar heating – Domestic water heating systems – Part 3: Performance test for solar plus supplementary systems [Essentially based on AS 2984-1987]
Test method
ISO 9459-4: ISOSolar heating - Domestic water heating systems - Part 4: Procedure for characterising annual system performance
Procedure
ISO 9459-5: ISO
Solar heating - Domestic water heating systems - Part 5: System performance characterisation by means of whole-system tests and computer simulation
Test method

Assessment of feasibility for the replacement of el ectrical water heaters with solar water heaters
Final Report – August 2005
Page 54
Annexure A5 Life Cycle Costing Graphs The comparative Life Cycle Costing graphs for a 200 litre SWH and a 150 litre EWH operating under a pre-payment tariff are presented in this Annexure.
0
10
20
30
40
50
60
0 3 6 9 12 15Operating life [years]
Cum
mul
ativ
eLi
fe C
ycle
Cos
ting
[1,0
00 N
$]
SWH EWH
05
1015202530354045
0 3 6 9 12 15Operating life [years]
Cum
mul
ativ
eLi
fe C
ycle
Cos
ting
[1,0
00 N
$]
SWH EWH
Figure A5 - 1: LCC for Gobabis and Katima Mulilo
05
1015202530354045
0 3 6 9 12 15Operating life [years]
Cum
mul
ativ
eLi
fe C
ycle
Cos
ting
[1,0
00 N
$]
SWH EWH
0
5
10
15
20
25
30
35
0 3 6 9 12 15Operating life [years]
Cum
mul
ativ
eLi
fe C
ycle
Cos
ting
[1,0
00 N
$]
SWH EWH
Figure A5 - 2: LCC for Keetmanshoop and Khorixas
0
10
20
30
40
50
0 3 6 9 12 15Operating life [years]
Cum
mul
ativ
eLi
fe C
ycle
Cos
ting
[1,0
00 N
$]
SWH EWH
0
5
1015
20
25
30
35
40
0 3 6 9 12 15Operating life [years]
Cum
mul
ativ
eLi
fe C
ycle
Cos
ting
[1,0
00 N
$]
SWH EWH
Figure A5 - 3: LCC for Lüderitz and Mariental

Assessment of feasibility for the replacement of el ectrical water heaters with solar water heaters
Final Report – August 2005
Page 55
05
1015202530354045
0 3 6 9 12 15Operating life [years]
Cum
mul
ativ
eLi
fe C
ycle
Cos
ting
[1,0
00 N
$]SWH EWH
0
10
20
30
40
50
0 3 6 9 12 15Operating life [years]
Cum
mul
ativ
eLi
fe C
ycle
Cos
ting
[1,0
00 N
$]
SWH EWH
Figure A5 - 4: LCC for Ondangwa and Oshakati
0
10
20
30
40
50
60
0 3 6 9 12 15Operating life [years]
Cum
mul
ativ
eLi
fe C
ycle
Cos
ting
[1,0
00 N
$]
SWH EWH
0
10
20
30
40
50
0 3 6 9 12 15Operating life [years]
Cum
mul
ativ
eLi
fe C
ycle
Cos
ting
[1,0
00 N
$]
SWH EWH
Figure A5 - 5: LCC for Outjo and Rehoboth
05
1015202530354045
0 3 6 9 12 15Operating life [years]
Cum
mul
ativ
eLi
fe C
ycle
Cos
ting
[1,0
00 N
$]
SWH EWH
0
10
20
30
40
50
60
0 3 6 9 12 15Operating life [years]
Cum
mul
ativ
eLi
fe C
ycle
Cos
ting
[1,0
00 N
$]
SWH EWH
Figure A5 - 6: LCC for Rundu and Swakopmund

Assessment of feasibility for the replacement of el ectrical water heaters with solar water heaters
Final Report – August 2005
Page 56
0
10
20
30
40
50
60
0 3 6 9 12 15Operating life [years]
Cum
mul
ativ
eLi
fe C
ycle
Cos
ting
[1,0
00 N
$]SWH EWH
05
1015202530354045
0 3 6 9 12 15Operating life [years]
Cum
mul
ativ
eLi
fe C
ycle
Cos
ting
[1,0
00 N
$]
SWH EWH
Figure A5 - 7: LCC for Tsumeb and Walvis Bay
05
1015202530354045
0 3 6 9 12 15Operating life [years]
Cum
mul
ativ
eLi
fe C
ycle
Cos
ting
[1,0
00 N
$]
SWH EWH
Figure A5 - 8: LCC for Windhoek
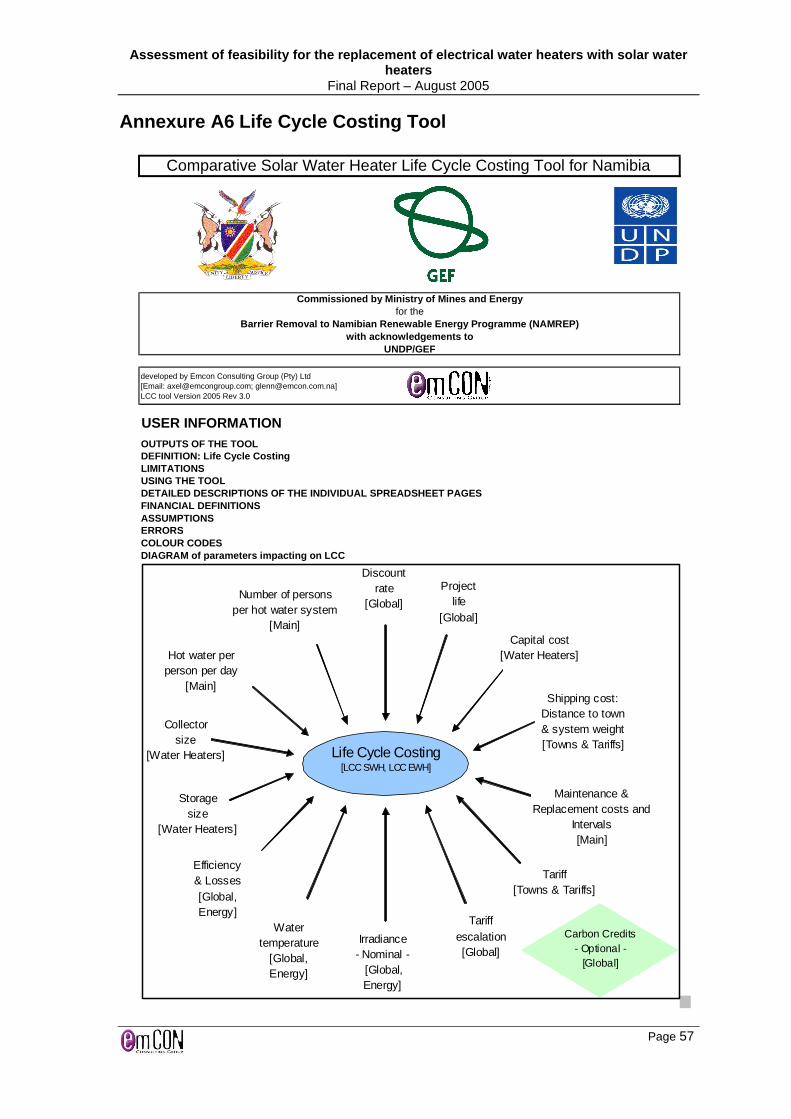
Assessment of feasibility for the replacement of el ectrical water heaters with solar water heaters
Final Report – August 2005
Page 57
Annexure A6 Life Cycle Costing Tool
Comparative Solar Water Heater Life Cycle Costing Tool for Namibia
Commissioned by Ministry of Mines and Energyfor the
Barrier Removal to Namibian Renewable Energy Programm e (NAMREP)with acknowledgements to
UNDP/GEF
developed by Emcon Consulting Group (Pty) Ltd[Email: [email protected]; [email protected]]LCC tool Version 2005 Rev 3.0
USER INFORMATIONOUTPUTS OF THE TOOLDEFINITION: Life Cycle CostingLIMITATIONSUSING THE TOOLDETAILED DESCRIPTIONS OF THE INDIVIDUAL SPREADSHEET PAGESFINANCIAL DEFINITIONSASSUMPTIONSERRORSCOLOUR CODESDIAGRAM of parameters impacting on LCC
Life Cycle Costing[LCC SWH, LCC EWH]
Irradiance- Nominal - [Global,Energy]
Watertemperature
[Global,Energy]
Capital cost[Water Heaters]
Discountrate
[Global]
Projectlife
[Global]
Maintenance &Replacement costs and
Intervals[Main]
Number of personsper hot water system
[Main]
Hot water perperson per day
[Main]
Efficiency& Losses[Global,Energy]
Storagesize
[Water Heaters]
Collectorsize
[Water Heaters]
Shipping cost:Distance to town& system weight[Towns & Tariffs]
Tariffescalation[Global]
Tariff[Towns & Tariffs]
Carbon Credits- Optional -
[Global]

Assessment of feasibility for the replacement of el ectrical water heaters with solar water heaters
Final Report – August 2005
Page 58
Comparative Solar Water Heater Life Cycle Costing Tool for Namibia
USER INFORMATIONOUTPUTS OF THE TOOL
Life Cycle Cost(EWH), presents the results graphically, calculates the years to breakeven between the SWH & the EWH and the savings compared to the EWH LCC.The LCC includes all costs (Capex: WATER HEATERS; Recurring cost: MAIN, Transport: TOWNS & TARIFFS) incurred over the life time of the project (GLOBAL) and is based on:
• an average annual irradiance level where upto four climate zones (GLOBAL) can be defined;• on a inlet water temperature (GLOBAL) - has impact on the energy required to heat water;• the applicable electricity tariff (TOWNS & TARIFF)• the anticipated tariff escalation - linear or non-linear (GLOBAL)
The tool will yield the most accurate financial results when systems are well matched to the needs they are meeting. An undersized collector of a SWH system will lead to electricity consumption of the system. Avoid undersizing the SWH storage as this will lead to inaccurate results.Financing Scenarios The cash flows for three financing scenarios are presented, being:1) SWH capex financed through the Namibian Solar Revolving Fund versus an existing EWH installation (i.e. no
capex for EWH);2) SWH capex and EWH capex financed through a home loan;3) SWH capex financed through the home loan versus an existing EWH installation (i.e. no capex for EWH);
For each of the financing scenario , the annual cash flow, the cumulative cash flow and the net cash flow (difference between SWH and EWH) is shown graphically.
Some of the spreadsheet areas are protected to avoid unintentional changes to cells that may not be changed. Password: swh. Some of the calculation pages are hidden in order to keep the data "clutter" to a minimum.
DEFINITION: Life Cycle CostingThe Life Cycle Costing includes all future costs such as operation, maintenance and replacements cost which are reduced to their present value and added to the initial capital cost in order to provide a fair basis for comparison between renewable and non-renewable energy supply options. Refer to the LCC diagram at the bottom of this page for an overview of the parameters impacting on the LCC result and where they are defined in the spreadsheet.
LIMITATIONSThe tool can be used to show LCC costing trends under current and future anticipated tariff conditions, as well as cash flow projections for the financing scenarios listed. The tool is not recommended to calculate technical performance aspects (use RETSCREEN for that purpose). The calculations are estimated around a standard household with a non-specific draw-off profile (no draw-off profile over the day can be specified), average Namibian irradiance and inlet water temperature settings (e.g. modelling average irradiance with winter month rains cannot be modelled without some minor
USING THE TOOLWhile all the information is complete and up-to-date, the LCC tool can be "driven" from the 'MAIN' sheet, where Town, Tariff type, hot water consumption, SWH system and EWH system can be selected. This will yield the LCC for SWH and EWH, the years to breakeven and provide results for the financing scenarios. All information relating to the selections is taken from tables in other spreadhseet pages. The energy consumption for the SWH and the EWH (inland or coast) and the Life Cycle Cost is calculated in the background.Recurring costs and their intervals can be adjusted under Cost inputs (Click on'+' on left side of page).The tool only considers indirect SWH systems here. The efficiencies have to be added to the SWH table if both direct and indirect systems are to be modelled this is not a major effort).Project life, interest rates, inflation rate, tariff escalation rates can be adjusted in the 'GLOBAL ' page if required.Comments have been used to indicate the source of the data or how a particular value was arrived at.

Assessment of feasibility for the replacement of el ectrical water heaters with solar water heaters
Final Report – August 2005
Page 59
Comparative Solar Water Heater Life Cycle Costing Tool for Namibia
USER INFORMATIONDETAILED DESCRIPTIONS OF THE INDIVIDUAL SPREADSHEET PAGES
SHEET: MAINHere the main conditions are selected for each of the hot water system comparison. Select Town, Tariff category, SWH model, EWH model, number of people, hot water usage here. The energy required for each system is calculated in the background and brought to the 'MAIN' page to be multiplied with the tariff for the town selected. This figure becomes the operating costs of the system. A SWH with a "small" collector will start consuming energy resulting in an operating cost for the SWH. Hot water systems which are well matched are critical for a fair comparison.You can edit replacement and maintenance costs under Cost Inputs: Recurring costs (click on the '+' sign at the side) as well as the intervals at which they occur. Note that the spreadsheet will suppress the occurrence of a recurring cost (such as an anode, element & pressure valve replacement, i.e. RC3 to RC5) in the year that a full system replacement occurs (RC2). This is suppressed in Line 19 & Line 18 of the LCC SWH and the LCC EWH with an IF statement respectively Present Value Savings are calculated by subtracting the SWH LCC from the EWH LCC to yield the savings accumulated over the project life of the water heating system. The percentage expresses the savings as seen from the EWH Two messages are flagged (bottom right hand side):a) Warning that the storage of the SWH is undersized, leading to activation of backup element & more uncertainty in the main results.b) Data which is either not available (e.g. some towns do not have a pre-payment tariff; undefined systems/towns) or data whichThe reference case for Namibia is for a 5 person middle income household (30 litres of 60°C hot water per person per
SHEET: Financing scenariosThis sheet is divided into five sections: The Input monitor, which shows what has been selected, the inputs for the Solar Revolving Fund and the Home Loan and the three financing scenarios as listed previoiusly.The financing scenarios are based on cash flow calculations which include the anticipated nominal tariff escalation rate and the inflation rate.To view the scenarios, click the '+' at the left side of the sheet. For each of the financing scenario, the annual cash flow, the cumulative cash flow and the net (difference between SWH and EWH) cash flow is shown graphically. The detailed calculations can be viewed in the next data level.Note that the comparisons for the home loan are conducted on a 20 year basis.
SHEET: DEFINEThis sheet provides a simple method to add additional Namibian towns as well as additional hot water systems. Be sure to provide the complete set of information with the correct units. The efficiency used for the collector irradiation to heat conversion efficiency is 65%, i.e. a glass covered collector is to be used.
SHEET: GlobalThis sheet contains variables which are used throughout the sheet and are usually not frequently changed.The main financial variables which are defined here are the project life, the nominal discount rate, the nominal loan rate, the escalation rate and the inflation rate. The real rates are calculated based on these figures.Changing any of the values in the blue fields will result in global changes in all the life cycle costing sheets.Irradiance levels and inlet water temperature for four zones can be entered here.Global technical parameters: Efficiencies, heat losses and temperature set points are defined here.Escalation: A choice can be made between linear tariff escalation or non-linear, per annum escalation. The table is further below. The real escalation is entered into a table and the compounded escalation is calculated in the next column.Carbon credits: The details for carbon credits calculation can be activated and ungrouped. The carbon mitigation is based on the Namibian case.
SHEETS: Towns & Tariffs and Water HeatersThis is the data used for LCC and represents current 2005 data in terms of tariffs, capital cost, system makes and models, and transport cost.

Assessment of feasibility for the replacement of el ectrical water heaters with solar water heaters
Final Report – August 2005
Page 60
Comparative Solar Water Heater Life Cycle Costing Tool for Namibia
USER INFORMATIONDETAILED DESCRIPTIONS OF THE INDIVIDUAL SPREADSHEET PAGES
SHEET: LCC SWH & LCC EWH (Hidden)These two sheets do the life cycle costing calculation, up to a maximum of 25 years. Escalation of tariff is included in the operating cost line, general escalation is included in the next line and the remaining rows are for recurring costs. The third and 4th row from the bottom are for residual value (only allows a residual value at the end of project life) and for carbon credits (LCC SWH only). The carbon credits are not reduced to Present Value, since technically speaking, this money is seen as an income which occurs during the lifetime of the SWH. The value of carbon credits in the future is difficult to
SHEET: Breakeven (Hidden)This sheet calculates the breakeven point by finding the intersection between the cumulative LCC cost of the SWH and the EWH selected. Through calculating the gradient between each year, the year where the curves intersect is selected to provide an accurate measure of the breakeven point.
SHEET: Energy (Hidden)Here the energy consumption is calculated for four climate zones, based on average solar irradiation and based on average inlet water temperature (based on figures from REEE5/99). Together with number of persons, average use of hot water per person, geyser volume and solar collector size, the electrical energy for the EWH and the SWH is calculated.A SWH with undersized strage tank is compensated by increasing the required energy linearly until water consumption plus over-sizing of storage tank factor is reached, i.e. should a SWH tank be sized smaller then the total daily use (number of users times hot water per person per day) plus the tank over sizing factor, then the energy required through the backup element is calculated linearly through the ratio of the design versus actual tank size. Refer page to 'Energy',
SHEET: Summary, Graph & Sensitivity (Hidden)These sheets tabulate and graphically represent results for the LCC comparison which were used in the study commissioned by MME. The sheets are hidden.
Notes on formulae's usedThe LOOKUP formula was initially used to draw information out of the 'Towns & Tariff' and the 'Pricing' pages. However, this formula requires that the information is sorted in alphabetical order, which will not be the case if new information is added under the 'DEFINE' page (unless we ask you to sort the whole lot after you added information which would make things more complicated again). It was therefore necessary to utilise other Excel functions:
MATCH - Looks up a value in an array and returns the row number. Note that the '0' as the last parameter defines that an exact match needs to be found, instead of the closest match ('1' or '-1'). This is what also solves the issue of non INDEX - Returns the value from a single cell in an array, where the row (from MATCH above) and the column (fixed)
The formulae's are interlinked to replace the standard Lookup formulae.

Assessment of feasibility for the replacement of el ectrical water heaters with solar water heaters
Final Report – August 2005
Page 61
Comparative Solar Water Heater Life Cycle Costing Tool for Namibia
USER INFORMATIONFINANCIAL DEFINITIONSAll costs are in Namibian dollars inclusive of VAT .All Life Cycle Costing calculations are done in constant 2005 dollars (exclusive of inflation).The Financing Scenarios are calculated in current dollars (inclusive of inflation).A choice can be made between linear tariff escalation or non-linear (discrete, entered per annum) escalation (GLOBAL). For the non-linear escalation the values for each year are entered into a table and the compounded escalation is calculated in the next column. The real escalation in tariff for Namibia is estimated to reach a peak of 5% for a period of three years and then taper off to 2% per annum. This is based on the anticipated increase in the Eskom sales to Namibia.General escalation (GLOBAL), RC1 in the recurring costs tables in the MAIN page, is linear and will occur over the whole project life. The general escalation is not used for the Namibian model (there are no anticipated escalation/descalations for SWH on a micro-economic scale).Escalation is defined as the percentage price increase (positive) / decrease (negative) over and above the inflation/deflation rate. The nominal escalation rate includes the inflation rate, while the real escalation rate exlcudes the Real rate and inflationThe real discount rate, real loan rate and the real escalation rate are calculated by subtracting the inflation rate from the current rates. This is not quite correct. For the record: For example, the real discount rate is equal to ((1 + nominal discount rate)/(1 + inflation rate) - 1). The difference however is so small and the interest ranges quite "large" that a
ASSUMPTIONSAverage water consumption is 30 litres per person per day (Middle income household).Hot water consumption: 6 litres/min blended water (water saving shower head) to 11 lit/min blended water (standard shower head). This translates to 30 to 55 litres for a five minute shower.The angle of tilt is assumed to be selected optimally across Namibia. The irradiance levels which are stated in the spreadsheet are the irradiance levels at angle of tilt.
ERRORSUndersizing the hot water storage tank will lead to errors in the energy consumption and will lead to larger LCC
COLOUR CODESUser can enter data in these cells: Contain numerical valuesHighlighted cells to indicate essential informationContain either empirical or system sizing dataThese cells form named ranges (one dimesional)These cells form named arrays (two dimesional)EMCON: Areas under construction, uncertainties about the selected values, are highlighted in yellowEMCON: Marked for deletion
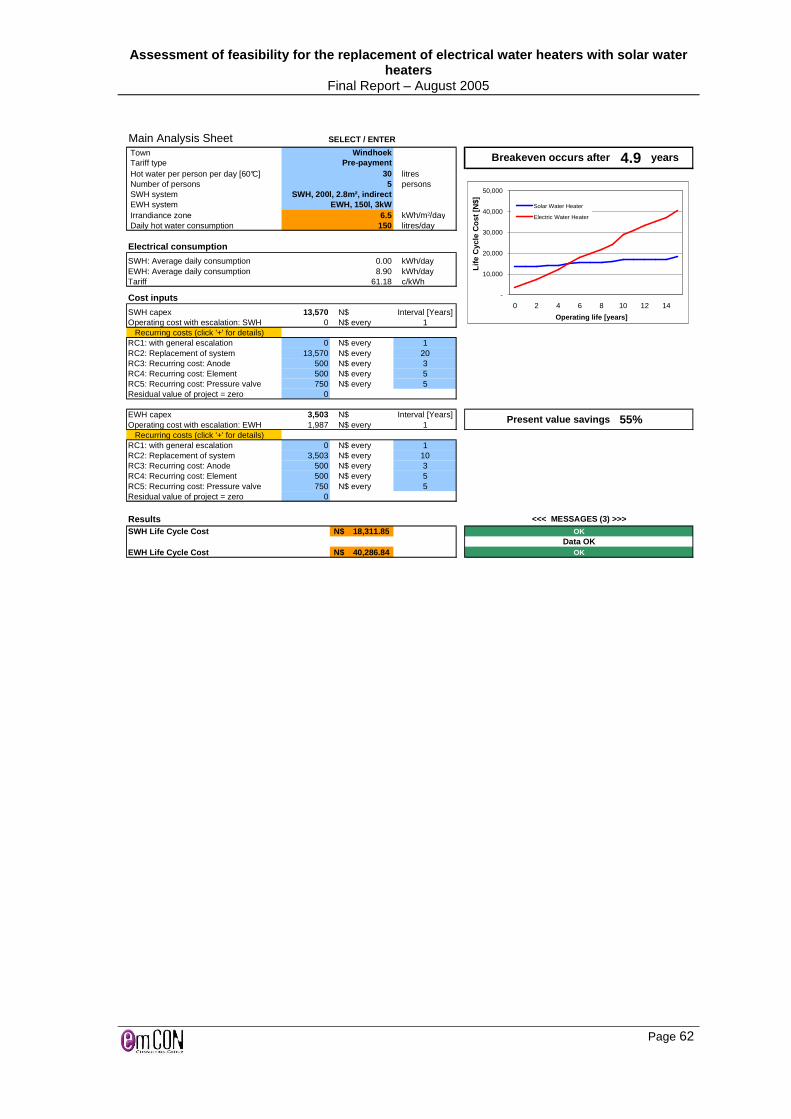
Assessment of feasibility for the replacement of el ectrical water heaters with solar water heaters
Final Report – August 2005
Page 62
Main Analysis Sheet SELECT / ENTER
TownTariff typeHot water per person per day [60°C] litresNumber of persons personsSWH systemEWH systemIrrandiance zone kWh/m²/dayDaily hot water consumption litres/day
Electrical consumption
SWH: Average daily consumption 0.00 kWh/dayEWH: Average daily consumption 8.90 kWh/dayTariff 61.18 c/kWh
Cost inputs
SWH capex 13,570 N$ Interval [Years]Operating cost with escalation: SWH 0 N$ every 1
Recurring costs (click '+' for details)RC1: with general escalation 0 N$ every 1RC2: Replacement of system 13,570 N$ every 20RC3: Recurring cost: Anode 500 N$ every 3RC4: Recurring cost: Element 500 N$ every 5RC5: Recurring cost: Pressure valve 750 N$ every 5Residual value of project = zero 0
EWH capex 3,503 N$ Interval [Years]Operating cost with escalation: EWH 1,987 N$ every 1
Recurring costs (click '+' for details)RC1: with general escalation 0 N$ every 1RC2: Replacement of system 3,503 N$ every 10RC3: Recurring cost: Anode 500 N$ every 3RC4: Recurring cost: Element 500 N$ every 5RC5: Recurring cost: Pressure valve 750 N$ every 5Residual value of project = zero 0
ResultsSWH Life Cycle Cost 18,311.85N$
EWH Life Cycle Cost 40,286.84N$ OKData OK
yearsBreakeven occurs after
Present value savings 55%
OK
<<< MESSAGES (3) >>>
SWH, 200l, 2.8m², indirectEWH, 150l, 3kW
150
4.9WindhoekPre-payment
305
6.5
-
10,000
20,000
30,000
40,000
50,000
0 2 4 6 8 10 12 14
Operating life [years]
Life
Cyc
le C
ost [
N$] Solar Water Heater
Electric Water Heater

Assessment of feasibility for the replacement of el ectrical water heaters with solar water heaters
Final Report – August 2005
Page 63
Financing scenariosINPUT MONITORTown Windhoek SWH selected SWH, 200l, 2.8m², indirectTariff type Pre-payment SWH capital costTariff rate 61.18 c/kWh EWH selected EWH, 150l, 3kWHot water consumption per day 150 lit/day EWH capital cost
INPUTS TO FINANCING SCENARIOSSolar Revolving Fund (SRF) inputs Home Loan (HL) inputs
SRF loan rate srf_rate 5% 10.0%SRF deposit srf_deposit 5% 0%SRF repayment period srf_period 5 years 20 years
Scenario 1: Capital cost of SWH financed thru SRF; EWH installation in existenceApplication: Household to convert exisiting EWH (no capital cost) to SWH(Click '+' to view Scenario 1 details)
Scenario 2: Capital cost of SWH and EWH financed th ru Home Loan NOTE: Project Life = Home loan period = 20 yearsApplication: New home - NHE perspective(Click '+' to view Scenario 2 details)
Scenario 3: Capital cost of SWH financed thru Home loan; EWH installation in existence Set short term home loan period: 10 yearsApplication: Household to convert exising EWH (zero capital cost) to SWH by addingthe capital cost to the home loan & fall in with th e remaining loan repayment period.(Click '+' to view Scenario 3 details)
13,570N$
3,503N$
HL rateHL depositHL repayment period
hl_ratehl_deposithl_period

Assessment of feasibility for the replacement of el ectrical water heaters with solar water heaters
Final Report – August 2005
Page 64
Financing scenariosINPUT MONITORTown Windhoek SWH selected SWH, 200l, 2.8m², indirectTariff type Pre-payment SWH capital costTariff rate 61.18 c/kWh EWH selected EWH, 150l, 3kWHot water consumption per day 150 lit/day EWH capital cost
INPUTS TO FINANCING SCENARIOSSolar Revolving Fund (SRF) inputs Home Loan (HL) inputs
SRF loan rate srf_rate 5% 10.0%SRF deposit srf_deposit 5% 0%SRF repayment period srf_period 5 years 20 years
Scenario 1: Capital cost of SWH financed thru SRF; EWH installation in existenceApplication: Household to convert exisiting EWH (no capital cost) to SWH(Click '+' to view Scenario 1 details)
(Click '+' to view calculation details)
SOLAR WATER HEATER CASH FLOW Year: 0 1 2 3 4 5 6 7 8 9 10Loan repayments: Revolving fund: 5 years 679 2,836 2,836 2,836 2,836 2,836 - - - - - Operating cost with escalation: SWH - - - - - - - - - - RC1: with general escalation - - - - - - - - - - RC2: Replacement of system - - - - - - - - - - RC3: Recurring cost: Anode - - 562 - - 633 - - 712 - RC4: Recurring cost: Element - - - - 608 - - - - 740 RC5: Recurring cost: Pressure valve - - - - 912 - - - - 1,110
SWH: Annual cash flow 679 2,836 2,836 3,398 2,836 4,357 633 - - 712 1,850 SWH: Cumulative cash flow 679 3,514 6,350 9,748 12,584 16,941 17,574 17,574 17,574 18,285 20,135
ELECTRIC WATER HEATER CASH FLOWExisting EWH - no capital cost - - Operating cost with escalation: EWH 2,107 2,296 2,503 2,728 2,946 3,153 3,342 3,542 3,755 3,980 RC1: with general escalation - - - - - - - - - - RC2: Replacement of system - - - - - - - - - 5,185 RC3: Recurring cost: Anode - - 562 - - 633 - - 712 - RC4: Recurring cost: Element - - - - 608 - - - - 740 RC5: Recurring cost: Pressure valve - - - - 912 - - - - 1,110
EWH: Annual cash flow - 2,107 2,296 3,065 2,728 4,467 3,785 3,342 3,542 4,467 11,015 EWH: Cumulative cash flow - 2,107 4,403 7,468 10,197 14,664 18,449 21,791 25,333 29,800 40,815
Year: 0 1 2 3 4 5 6 7 8 9 10
SWH Loan part 679 2,836 2,836 2,836 2,836 2,836 - - - - - SWH Cash part - - - 562 - 1,521 633 - - 712 1,850
SWH: Annual cash flow 679 2,836 2,836 3,398 2,836 4,357 633 - - 712 1,850 SWH: Cumulative cash flow 679 3,514 6,350 9,748 12,584 16,941 17,574 17,574 17,574 18,285 20,135
EWH Loan part - - - - - - - - - - - EWH Cash part - 2,107 2,296 3,065 2,728 4,467 3,785 3,342 3,542 4,467 11,015
EWH: Annual cash flow - 2,107 2,296 3,065 2,728 4,467 3,785 3,342 3,542 4,467 11,015 EWH: Cumulative cash flow - 2,107 4,403 7,468 10,197 14,664 18,449 21,791 25,333 29,800 40,815
Net cash flow between SWH & EWH Annual -679 -1,408 -1,947 -2,280 -2,388 -2,277 876 4,218 7,760 11,515 20,680 Monthly -57 -117 -162 -190 -199 -190 73 351 647 960 1,723
13,570N$
3,503N$
HL rateHL depositHL repayment period
hl_ratehl_deposithl_period
Cash flowSWH: Solar Revolving Fund
EWH: Existing
-
2,000
4,000
6,000
8,000
10,000
12,000
0 2 4 6 8 10 12 14Year
Ann
ual c
ash
flow
[N
$/an
num
]
SWH EWH
Cash flowSWH: Solar Revolving Fund
EWH: Existing
-10,00020,00030,00040,00050,00060,00070,00080,000
0 2 4 6 8 10 12 14Year
Cum
ulat
ive
cash
flo
w [N
$]
SWH EWH
Cumulative savings betweenSWH: Solar Revolving Fund &
EWH: Existing
-10,000
-
10,000
20,000
30,000
40,000
50,000
0 2 4 6 8 10 12 14
Year
Sav
ings
: EW
H -
S
WH
[N$]

Assessment of feasibility for the replacement of el ectrical water heaters with solar water heaters
Final Report – August 2005
Page 65
Financing scenariosINPUT MONITORTown Windhoek SWH selected SWH, 200l, 2.8m², indirectTariff type Pre-payment SWH capital costTariff rate 61.18 c/kWh EWH selected EWH, 150l, 3kWHot water consumption per day 150 lit/day EWH capital cost
INPUTS TO FINANCING SCENARIOSSolar Revolving Fund (SRF) inputs Home Loan (HL) inputs
SRF loan rate srf_rate 5% 10.0%SRF deposit srf_deposit 5% 0%SRF repayment period srf_period 5 years 20 years
Scenario 2: Capital cost of SWH and EWH financed th ru Home Loan NOTE: Project Life = Home loan period = 20 yearsApplication: New home - NHE perspective(Click '+' to view Scenario 2 details)
(Click '+' to view calculation details)
SOLAR WATER HEATER CASH FLOW Year: 0 1 2 3 4 5 6 7 8 9 10Home Loan repayment: SWH - 1,449 1,449 1,449 1,449 1,449 1,449 1,449 1,449 1,449 1,449 Operating cost with escalation: SWH - - - - - - - - - - RC1: with general escalation - - - - - - - - - - RC2: Replacement of system - - - - - - - - - - RC3: Recurring cost: Anode - - 562 - - 633 - - 712 - RC4: Recurring cost: Element - - - - 608 - - - - 740 RC5: Recurring cost: Pressure valve - - - - 912 - - - - 1,110
SWH: Annual cash flow - 1,449 1,449 2,011 1,449 2,970 2,082 1,449 1,449 2,161 3,299 SWH: Cumulative cash flow - 1,449 2,898 4,910 6,359 9,328 11,410 12,859 14,308 16,469 19,768
ELECTRIC WATER HEATER CASH FLOWHome Loan repayment: EWH - 374 374 374 374 374 374 374 374 374 374 Operating cost with escalation: EWH 2,107 2,296 2,503 2,728 2,946 3,153 3,342 3,542 3,755 3,980 RC1: with general escalation - - - - - - - - - - RC2: Replacement of system - - - - - - - - - 5,185 RC3: Recurring cost: Anode - - 562 - - 633 - - 712 - RC4: Recurring cost: Element - - - - 608 - - - - 740 RC5: Recurring cost: Pressure valve - - - - 912 - - - - 1,110
EWH: Annual cash flow - 2,481 2,670 3,439 3,102 4,841 4,159 3,716 3,916 4,841 11,389 EWH: Cumulative cash flow - 2,481 5,151 8,590 11,693 16,534 20,693 24,409 28,325 33,166 44,555
Year: 0 1 2 3 4 5 6 7 8 9 10
SWH Loan part - 1,449 1,449 1,449 1,449 1,449 1,449 1,449 1,449 1,449 1,449 SWH Cash part - - - 562 - 1,521 633 - - 712 1,850
SWH: Annual cash flow - 1,449 1,449 2,011 1,449 2,970 2,082 1,449 1,449 2,161 3,299 SWH: Cumulative cash flow - 1,449 2,898 4,910 6,359 9,328 11,410 12,859 14,308 16,469 19,768
EWH Loan part - 374 374 374 374 374 374 374 374 374 374 EWH Cash part - 2,107 2,296 3,065 2,728 4,467 3,785 3,342 3,542 4,467 11,015
EWH: Annual cash flow - 2,481 2,670 3,439 3,102 4,841 4,159 3,716 3,916 4,841 11,389 EWH: Cumulative cash flow - 2,481 5,151 8,590 11,693 16,534 20,693 24,409 28,325 33,166 44,555
Net cash flow between SWH & EWH Annual - 1,032 2,253 3,681 5,334 7,205 9,283 11,550 14,017 16,697 24,787 Monthly - 86 188 307 445 600 774 963 1,168 1,391 2,066
13,570N$
3,503N$
HL rateHL depositHL repayment period
hl_ratehl_deposithl_period
Cash flowSWH & EWH: Home Loan
-5,000
10,00015,00020,00025,00030,00035,00040,000
0 4 8 12 16 20Year
Ann
ual c
ash
flow
[N
$/an
num
]
SWH EWH
Cash flowSWH & EWH: Home Loan
-
20,000
40,000
60,000
80,000
100,000
120,000
140,000
0 4 8 12 16 20Year
Cum
ulat
ive
cash
flow
[N
$]
SWH EWH
Cumulative savings betweenSWH & EWH: Home Loan
-
10,000
20,000
30,000
40,000
50,000
60,000
70,000
0 4 8 12 16 20Year
Sav
ings
: EW
H -
SW
H
[N$]

Assessment of feasibility for the replacement of el ectrical water heaters with solar water heaters
Final Report – August 2005
Page 66
Financing scenariosINPUT MONITORTown Windhoek SWH selected SWH, 200l, 2.8m², indirectTariff type Pre-payment SWH capital costTariff rate 61.18 c/kWh EWH selected EWH, 150l, 3kWHot water consumption per day 150 lit/day EWH capital cost
INPUTS TO FINANCING SCENARIOSSolar Revolving Fund (SRF) inputs Home Loan (HL) inputs
SRF loan rate srf_rate 5% 10.0%SRF deposit srf_deposit 5% 0%SRF repayment period srf_period 5 years 20 years
Scenario 3: Capital cost of SWH financed thru Home loan; EWH installation in existence Set short term home loan period: 10 yearsApplication: Household to convert exising EWH (zero capital cost) to SWH by addingthe capital cost to the home loan & fall in with th e remaining loan repayment period.(Click '+' to view Scenario 3 details)
(Click '+' to view calculation details)
SOLAR WATER HEATER CASH FLOW Year: 0 1 2 3 4 5 6 7 8 9 10Loan repayments: Revolving fund: SWH - 2,008 2,008 2,008 2,008 2,008 2,008 2,008 2,008 2,008 2,008 Operating cost with escalation: SWH - - - - - - - - - - RC1: with general escalation - - - - - - - - - - RC2: Replacement of system - - - - - - - - - - RC3: Recurring cost: Anode - - 562 - - 633 - - 712 - RC4: Recurring cost: Element - - - - 608 - - - - 740 RC5: Recurring cost: Pressure valve - - - - 912 - - - - 1,110
SWH: Annual cash flow - 2,008 2,008 2,570 2,008 3,529 2,640 2,008 2,008 2,719 3,858 SWH: Cumulative cash flow - 2,008 4,015 6,585 8,593 12,122 14,762 16,770 18,777 21,497 25,355
ELECTRIC WATER HEATER CASH FLOWExisting EWH - no capital cost - - - - - - - - - - - Operating cost with escalation: EWH 2,107 2,296 2,503 2,728 2,946 3,153 3,342 3,542 3,755 3,980 RC1: with general escalation - - - - - - - - - - RC2: Replacement of system - - - - - - - - - 5,185 RC3: Recurring cost: Anode - - 562 - - 633 - - 712 - RC4: Recurring cost: Element - - - - 608 - - - - 740 RC5: Recurring cost: Pressure valve - - - - 912 - - - - 1,110
EWH: Annual cash flow - 2,107 2,296 3,065 2,728 4,467 3,785 3,342 3,542 4,467 11,015 EWH: Cumulative cash flow - 2,107 4,403 7,468 10,197 14,664 18,449 21,791 25,333 29,800 40,815
Year: 0 1 2 3 4 5 6 7 8 9 10
SWH Loan part - 2,008 2,008 2,008 2,008 2,008 2,008 2,008 2,008 2,008 2,008 SWH Cash part - - - 562 - 1,521 633 - - 712 1,850
SWH: Annual cash flow - 2,008 2,008 2,570 2,008 3,529 2,640 2,008 2,008 2,719 3,858 SWH: Cumulative cash flow - 2,008 4,015 6,585 8,593 12,122 14,762 16,770 18,777 21,497 25,355
EWH Loan part - - - - - - - - - - - EWH Cash part - 2,107 2,296 3,065 2,728 4,467 3,785 3,342 3,542 4,467 11,015
EWH: Annual cash flow - 2,107 2,296 3,065 2,728 4,467 3,785 3,342 3,542 4,467 11,015 EWH: Cumulative cash flow - 2,107 4,403 7,468 10,197 14,664 18,449 21,791 25,333 29,800 40,815
Net cash flow between SWH & EWH Annual - 99 388 883 1,603 2,542 3,687 5,021 6,556 8,303 15,460 Monthly - 8 32 74 134 212 307 418 546 692 1,288
13,570N$
3,503N$
HL rateHL depositHL repayment period
hl_ratehl_deposithl_period
Cash flowSWH: Short-term Home Loan &
EWH: Existing
-5,000
10,00015,00020,00025,00030,00035,000
0 4 8 12 16 20Year
Ann
ual c
ash
flow
[N
$/an
num
]
SWH EWH
Cash flowSWH: Short-term home loan &
EWH: Existing
-
20,000
40,000
60,000
80,000
100,000
120,000
0 4 8 12 16 20Year
Cum
ulat
ive
cash
flo
w [N
$]
SWH EWH
Cumulative savings betweenSWH: Short-term home loan &
EWH: Existing
-10,00020,00030,00040,00050,00060,00070,000
0 4 8 12 16 20Year
Sav
ings
: EW
H -
S
WH
[N$]

Assessment of feasibility for the replacement of el ectrical water heaters with solar water heaters
Final Report – August 2005
Page 67
Define additional towns and additional Water Heatin g Systems here
New Town Pre-payment Tariff
Credit metering
Tariff
Distance from
Windhoek Freight costSelect Inland
or Coast[Enter name of town] [c/kWh] [c/kWh] [km] [N$/kg]
New town 1 - - - - InlandNew town 2 - - - - Zone 3New town 3 - - - - Coast
New Hot Water SystemCapital cost of system Accessories Installation
System Weight
Storage tank volume
Glazed collector
area excl VAT excl VAT excl VAT
[Enter "name" of SWH/EWH] [N$] [N$] [N$] [kg] [litres] [m²]
SWH 1 - undefined - - - - - - SWH 2 - undefined - - - - - - SWH 3 - undefined - - - - - -
EWH 1 - undefined - - - - - EWH 2 - undefined - - - - - EWH 3 - undefined - - - - -

Assessment of feasibility for the replacement of el ectrical water heaters with solar water heaters
Final Report – August 2005
Page 68
Global variablesProject life project_life 15 years
Ratesnominal discount rate = investment rate nominal_discount_rate 7.0%nominal loan rate nominal_loan_rate 10.0%inflation rate inflation_rate 4.0%nominal escalation rate: tariff nominal_esc_tariff 6.0%
Escalation trend: SELECT Non-linearnominal escalation rate: general nominal_esc_general 6.0%
real discount rate = investment rate real_discount_rate 3.0%real loan rate real_loan_rate 6.0%real escalation rate: tariff real_esc_tariff 2.0%real escalation rate: general real_esc_general 2.0%
VAT vat 15%
Climate zones for irradiance & inlet water temperat ures (click '+' to view)
Climate zone Name of zone
Average daily
irradianceInlet water
temperature[kWh/m²/day] [°C]
Zone 1: Inland 6.5 22Zone 2: Zone 2 6.0 20Zone 3: Zone 3 6.0 20Zone 4: Coast 5.5 16
Empirical values (click '+' to view)Solar collector efficiency solar_efficiency 65%Electrical heating efficiency heating_efficiency 95%SWH heat losses 60 W/hour at 150 litEWH heat losses 80 W/hour at 150 litHot water temperature hot_water_temp 60 °COversized SWH storage tank oversize_tank 30%
Table for non-linear real tariff escalation per ann um (click '+' to view)
Year Real Tariff Escalation
Compounded real Tariff Escalation
Compounded nominal Tariff
Escalation
1 2.0% 2.0% 6.0%2 5.0% 7.1% 15.5%3 5.0% 12.5% 25.9%4 5.0% 18.1% 37.3%5 4.0% 22.8% 48.3%6 3.0% 26.5% 58.6%7 2.0% 29.0% 68.2%8 2.0% 31.6% 78.2%9 2.0% 34.2% 88.9%10 2.0% 36.9% 100.3%11 2.0% 39.6% 112.3%12 2.0% 42.4% 125.0%13 2.0% 45.3% 138.5%14 2.0% 48.2% 152.8%15 2.0% 51.2% 168.0%

Assessment of feasibility for the replacement of el ectrical water heaters with solar water heaters
Final Report – August 2005
Page 69
Global variables
Carbon credits (click '+' to view) NoneActivate after carbon_start 3 yearsCarbon per kWh of coal fired power generated 1.069 tons/MWhEskom energy mix: Coal vs Total 92%Total import from SA 48%Coal content of Namibia's energy mix 44%Carbon per MWh in Namibia carbon_per_MWh 0.472 tons/MWhCarbon credits carbon_rate 65 N$/ton
Historical inflation development (Namibia)Year Rate Compounded
1999 8.60% 8.60%2000 9.25% 18.65%2001 9.30% 29.68%2002 11.31% 44.35%2003 7.30% 54.88%2004 3.91% 60.94%
Inflation rate for 20052005 Jan 5.3%2005 Feb 2.5%2005 Mar 1.7%2005 Apr 1.6%
Average 2.78%

Assessment of feasibility for the replacement of el ectrical water heaters with solar water heaters
Final Report – August 2005
Page 70
Lookup table: Town & tariff related informationName of range: towns_array
Pre-payment Credit metering
No Town Tariff Tariff
Fixed charge:
25A
Distance from
WindhoekFreight
costIrradiance
zoneSWH electrical consumption
EWH electrical consumption
[c/kWh] [c/kWh] [N$/month] [km] [N$/kg] [kWh/day] [kWh/day]
1 Gobabis 87.06 71.15 40.65 200 1.40 Inland 0.00 8.902 Katima Mulilo 62.00 50.00 56.25 1200 2.33 Inland 0.00 8.903 Keetmanshoop 61.00 61.00 50.00 450 1.85 Inland 0.00 8.904 Khorixas 37.00 31.00 24.25 460 1.85 Inland 0.00 8.905 Lüderitz 63.25 50.82 60.45 820 2.20 Coast 0.00 10.006 Mariental 47.10 39.40 29.93 260 1.50 Inland 0.00 8.907 Okahandja none 35.00 86.00 70 1.40 Inland 0.00 8.908 Ondangwa 62.00 61.00 24.25 670 2.20 Inland 0.00 8.909 Oshakati 65.69 54.71 65.00 710 2.20 Inland 0.00 8.9010 Otjiwarongo none 41.25 104.45 250 1.40 Inland 0.00 8.9011 Outjo 77.00 56.00 61.75 320 1.50 Inland 0.00 8.9012 Rehoboth 65.15 43.28 45.38 90 1.40 Inland 0.00 8.9013 Rundu 62.00 61.00 24.25 700 2.20 Inland 0.00 8.9014 Swakopmund 65.00 44.00 97.20 360 1.50 Coast 0.00 10.0015 Tsumeb 82.83 63.66 73.45 430 1.85 Inland 0.00 8.9016 Walvis Bay 55.00 45.16 64.79 390 1.50 Coast 0.00 10.0017 Windhoek 61.18 30.95 125.85 0 0.00 Inland 0.00 8.9018 New town 1 0.00 0.00 0.00 0.00 Inland 0.00 8.9019 New town 2 0.00 0.00 0.00 0.00 Zone 3 0.00 9.3020 New town 3 0.00 0.00 0.00 0.00 Coast 0.00 10.00
Shipping costsFurther from
Whk then Cost per kg[km] [N$/kg]251 1.40400 1.50600 1.85850 2.20
1250 2.33
Costing for hot water systems
Generic systemsIndirect, glased collector System Accessories Installation Capex Weight
Storage volume
High efficiency collector Element
excl VAT excl VAT excl VAT incl VATName of range: swh_range [N$] [N$] [N$] [N$] [kg] [litres] [sqm] [kW]
SWH, 100l, 1.5m², indirect 6,900 - 1,500 9,660 90 100 1.5 2 SWH, 150l, 2.1m², indirect 8,900 - 1,500 11,960 100 150 2.1 3 SWH, 180l, 2m², indirect 9,400 - 1,500 12,535 106 180 2.0 1.8 SWH, 200l, 2.8m², indirect 10,000 - 1,800 13,570 115 200 2.87 3 SWH, 250l, 3.5m², indirect 13,200 - 1,800 17,250 137 250 3.47 4 SWH, 300l, 4m², indirect 15,200 - 2,000 19,780 164 300 4.0 2.4 SWH, 300l, 4.5m², indirect 14,700 - 2,000 19,205 155 300 4.5 4 SWH, 450l, 6.3m², indirect 21,100 - 2,300 26,910 228 450 6.3 ?SWH 1 - undefined - - - - - - - SWH 2 - undefined - - - - - - - SWH 3 - undefined - - - - - - -
Name of range: ewh_range
EWH, 100l, 2kW 1,565 350 1,000 3,353 40 100 2 EWH, 150l, 3kW 1,696 350 1,000 3,503 50 150 3 EWH, 200l, 4kW 2,696 350 1,000 4,653 60 200 4 EWH, 250l, 4kW 4,522 350 1,000 6,753 70 250 4 EWH 1 - undefined - - - - - - EWH 2 - undefined - - - - - - EWH 3 - undefined - - - - - -

Assessment of feasibility for the replacement of el ectrical water heaters with solar water heaters
Final Report – August 2005
Page 71
Annexure A7 Scenario Development

Assessment of feasibility for the replacement of el ectrical water heaters with solar water heaters
Final Report – August 2005
Page 72
Annexure A8 Terms of Reference

Assessment of feasibility for the replacement of el ectrical water heaters with solar water heaters
Final Report – August 2005
Page 73
NAMIBIA REPUBLIC OF NAMIBIA
MINISTRY OF ENVIRONMENT AND TOURISM and
MINISTRY OF MINES AND ENERGY
TERMS OF REFERENCE FOR THE ASSESSMENT OF THE TECHNICAL AND ECONOMIC FEASIBILITY FOR THE REPLACEMENT OF ELECTRIC WATER H EATERS WITH SOLAR
WATER HEATERS BACKGROUND Namibia ratified the United Nations Framework Convention on Climate Change (UNFCCC) in 1995 and became legally obligated to adopt and implement policies and measures designed to mitigate the effects of climate change and to adapt to such changes. The Ministry of Environment and Tourism (MET) is the government agency responsible for the coordination and implementation of climate policies and measures with respect to the fulfillment of the country’s obligations under the convention. Present global energy consumption pattern, which is largely based on the use of fossil fuels (oil, coal and gas), is widely regarded as the major source of the excessive emissions of the Greenhouse gases that are giving rise to the problem of Climate Change. The Initial National Communication (INC) of Namibia presented to the UNFCCC in 2002 estimated total energy consumption in 1993 at approximately 46 621 TJ (terajoules). Some 78% of this energy was imported as petroleum products, electricity and coal. The balance (22%) is made up by biomass fuel (mostly wood), which is the primary energy source for 60% of the population. The transport sector is the major consumer of energy in Namibia. Electricity consumption by sector is as follows: urban households 52%, mining 39%, agriculture and water supply 3% and industry and commerce 6%. The hydroelectric plant at Ruacana with a capacity of 240 MW generates most of Namibia’s locally produced electricity. The rest of electricity (about 200MW) is imported from South Africa, where it is primarily produced from coal. The city of Windhoek and other urban areas are the major users of electricity for domestic purposes. Most residences require heated water for domestic use during the winter months as well as other times of the year. Hospitals, hotels and other such institutions also require heated water on an all year basis. The most popular source of heat of water is from electric heaters. The use of electricity to heat water is not only costly for the individual households but it is also powered by generation of electricity from petroleum or coal-based sources, thus directly or indirectly contributing to the global GHG emissions. With its high number of sunshine hours, Namibia is very well suited to exploit the benefits of solar power. This is supported by the government’s White Paper on Energy Policy (Ministry of Mines and Energy), which emphasizes the diversification of energy resources through the use of such sources of energy as natural gas and renewable energy, including solar, in development applications. However, renewable energy source is currently under-utilized due to the existence of a number of barriers. The GEF/UNDP/MME Barrier Removal to Namibian Renewable Energy Programme (NAMREP), based in the MME, has identified five major barriers, viz., Capacity Building, Institutional, Financial, Technical

Assessment of feasibility for the replacement of el ectrical water heaters with solar water heaters
Final Report – August 2005
Page 74
and Public Awareness, which inhibit the development and use of solar energy on a wide-scale in Namibia. By removing the barriers, NAMREP aims to develop a sustainable market for solar energy technologies. The conversion and/or replacement of domestic and institutional electric water heaters with solar powered heaters is an option that has been studied in the past for its life-cycle economic costs and benefits for the City of Windhoek and various towns. These studies have resulted in generally positive recommendations in favor of the use of solar water heaters for most of the towns. These studies are sensitive to electricity tariffs. These have undergone substantial revisions since the studies were conducted and are likely to be quite different once the current power purchase agreement with South Africa comes to an end. The INC concluded that the climatic conditions in Namibia were very favorable for the utilization of alternative sources of energy such solar energy. It further suggested that the costs of these technologies are high and therefore promotional efforts would be needed in the form of initial grants to mobilize the production, distribution and use of such technologies. More research would also be needed to identify the most suitable technology and location for support industries and services. There is thus a need to undertake a new cost benefit analysis of solar versus electric water heaters using current as well as projected electricity tariffs in future. This will form the basis on which to take (or not take) appropriate steps towards influencing GRN policies and to undertake promotional efforts. The economic costs/benefits of the options are to be examined against the alternative of importing electricity. The purpose of this terms of reference is to determine the economic potential for the use of and to assess the potential for the adoption of solar technology for water heating for domestic and institutional purposes in Windhoek and other urban areas. The consultancy will also identify barriers to adoption of solar water heating technology and assess public’s willingness to adopt and use solar water heaters. THE TASK The Namibia Climate Change Committee (NCCC), chaired by the Ministry of Environment and Tourism (MET) and the Directorate of Energy of the Ministry of Mines and Energy (MME) through the Namibian Renewable Energy Program (NAMREP), with the support of the Global Environment Facility and the United Nations Development Program require the services of consultant, an institution or consortium to determine the current status of solar water heaters (SWH) utilization in Namibia and to conduct an assessment of the potential for using SWH in place of conventional electric water heaters in homes and institutions. Consultants, institutions or consortia with capabilities and experience in the fields of the energy conservation, water heating systems and economic social analysis are encouraged to apply. The selected entity must demonstrate a thorough understanding of and familiarity with the subject matter as well as practical experience in the field. Specific Tasks The selected consultant, institution or consortium must demonstrate capabilities and experience in the energy conservation, alternate energy systems, water heating systems as well as economic analysis. The activities to be undertaken will result in three major outputs as follows: 1. Review and analysis of the current ownership, use and distribution of electric and solar water
heaters in Windhoek and other urban centers; 2. Recommendations on possible mechanisms to be applied for implementing an economic and
socially beneficial program to facilitate the use of SWH in Namibia; and 3. Pre-feasibility assessment of the potential for local assembly/manufacture of solar water
heaters

Assessment of feasibility for the replacement of el ectrical water heaters with solar water heaters
Final Report – August 2005
Page 75
At a minimum the selected consultant, institution or consortium will do the following: 1. Determine the extent and distribution of electric and solar water heater use in households and
institutions in Windhoek and other urban centers. This should also include data on the number of installations done annually over the past five years;
2. Review possible types of solar water heaters based on efficiency, cost, size of household, etc. that could replace existing electrical heaters in Windhoek and other urban areas. Suppliers and dealers should be identified and consulted;
3. Consult with key stakeholders such as Municipalities, Nampower, Ministry of Mines and Energy, Ministry of Finance, Ministry of Trade and Industry, private sector businesses, entrepreneurs, and financial institutions;
4. Determine the potential for adoption and the conditions under which adoption will be enhanced among households and institutions. This should also include determination of present levels of satisfaction by current users of SWH;
5. Conduct a comparative cost benefit analysis (life-cycle costs) of electric versus solar powered water heaters taking into consideration the current electricity tariffs as applicable in different urban areas. Also conduct this analysis for three projected electricity tariffs (high, most likely and low) for the year 2010.
6. Determine the potential for partial or full assembly/manufacture of solar powered heaters in Namibia including potential private sector other entity participation;
7. Review financial and economic incentives, government policies such as tax concessions, and financing models that could facilitate adoption of solar water heaters;
8. Explore potential development assistance opportunities that could facilitate or assist with the adoption of solar water heaters, including local and overseas financial sources;
9. Indicate how and by how much the application of solar heaters vs electric heaters will decrease GHG emissions; and
10. Based on the above, make recommendations that decision makers and other could use. The selected consultant, institution or consortium will also be responsible for the facilitation of a workshop/seminar where findings, conclusions and recommendations will be presented to stakeholders. Inputs from stakeholders will be incorporated into the final report where applicable. The workshop will be coordinated by the NCCC and the NAMREP with respect to issuing invitations, logistics and venue working in consultation with the consultants. In order to build local capacity in this field, the selected consultant will be required to guide a graduate student in the completion of a master’s degree thesis using the data and information generated by this study. The student will be part of the investigating team and will conduct research required for the fulfillment of the requirements for a thesis. The selected institution or consortium will be responsible for the development of a plan of implementation to be agreed with the NCCC and NAMREP before implementation commences. This plan could include but is not limited to the following:
o Development of work plan, including methodology, to be agreed with the NCCC and NAMREP o Data requirements and personnel/information sources and key stakeholders to be consulted o Field visits and data collection o Preparation and presentation of draft and final reports REPORTING The selected consultant, institution or consortium will report to the Director of the Directorate of Environmental Affairs, in his capacity as Chair of the NCCC, and to the Director of Energy of the Ministry of Mines and Energy and will be responsible for the preparation and delivery of a comprehensive report on the activities undertaken and completed within the terms of this consultancy. The report will include but is not limited to information on the geographic areas covered, institutions, data collected, findings and recommendations arising from the work. The report will include an executive summary, the body of the report and the annexes.

Assessment of feasibility for the replacement of el ectrical water heaters with solar water heaters
Final Report – August 2005
Page 76
Thirty (30) copies of a draft report will be presented for use by the NCCC and NAMREP for use at the workshop/seminar to be facilitated by the contractor. The draft report will be presented at least 10 working days before the workshop. The contractor will incorporate comments from interested parties, NAMREP and the NCCC into the final report. Twenty (20) bounded hard copies of the final report and two copies of the electronic version using appropriate software (preferably Microsoft Office) must be delivered to each of the Director of the DEA and Director of Energy upon completion of this assignment. DURATION It is expected that the implementation of this activity will be completed over a three-month period commencing in December 2004 and will not exceed twenty (20) actual working days. BUDGET The selected consultant, institution or consortium must submit a budget detailing estimated cost of the expected implementation of this activity. This budget must be in the form of a complete breakdown detailing costs of key personnel and the amount of time allocated to each key person, transportation, materials and other items. A payment schedule should also be included that links payments with performance milestones. Two copies of the budget should be submitted in the form of a financial proposal separately from the two copies of the technical proposal and in different envelopes. A fixed price contract will be entered into with the selected contractor. APPLICATIONS Interested institutions or consortia should submit a technical and a financial proposal in separate envelopes and in duplicate indicating their interest in and capability to implement the above work in sealed envelopes marked TECHNICAL PROPOSAL FOR THE REVIEW OF POTENTIAL FOR SOLAR WATER HEATING and FINANCIAL PROPOSAL FOR THE REVIEW OF POTENTIAL FOR SOLAR WATER HEATING respectively to the either of the following addresses by 3 DECEMBER, 2004: Ms. Catherine Odada Program Assistant UNDP Namibia 13th Floor Sanlam Building Private Bag 13329 Windhoek Email: [email protected] Tel: 061-204-6232 Or Permanent Secretary Attn: Leefa Ndilula or Veiko Nangolo 1st Floor, Ministry of Mines and Energy Building 1 Aviation Road, Eros Airport Private Bag 13297 Windhoek Email: [email protected] or [email protected] Tel: 061-2848170 Applications must state the period during which the bid shall be valid. No facsimile tender documents will be considered.