Embed Size (px)
Citation preview
MINISTRY OF TRADE, INDUSTRY & COOPERATIVES
3rd - 6th Floor, Farmers House Plot 6/8, Parliamentary AvenueP.O. Box 7103, Kampala-UGANDA.
Tel: +256 414 314 000 • +256 414 314 268 Fax: +256 414 341 247Email: [email protected] • www.mtic.go.ug
Uganda Diagnostic Trade Integration Study (DTIS) Update
Trade for LDC Development
Ministry of Trade,Industry and Co-operatives
The World Bank
UG
AN
DA D
IAG
NO
STIC TR
AD
E INTEG
RATIO
N STU
DY (D
TIS) UPD
ATE


Disclaimer:
This report, prepared for the Enhanced Integrated Framework, is a product of the staff of The World Bank.
The findings, interpretations, and conclusions expressed in this paper do not necessarily reflect the views of the Executive Directors of The World Bank or the governments they represent.
The World Bank does not guarantee the accuracy of the data included in this work. The boundaries, colors, denominations, and other information shown on any map in this work do not imply any judgment on the part of The World Bank concerning the legal status of any territory or the endorsement or acceptance of such boundaries.
UGANDA – GOVERNMENT FISCAL YEAR July 1 – June 30
CURRENCY EQUIVALENTS (Exchange Rate Effective as of April 23, 2013)
Currency Unit Uganda Shillings
US$1.00 = 2,575 UGS
Weights and Measures Metric System
ABBREVIATION AND ACRONYMS
ABDC Agri Business Development Component (ASPSII)
ADB African Development Bank
ADF Africa Development Foundation
AGOA African Growth and Opportunity Act
APEP Agricultural Productivity Enhancement Program (USAID) ASEAN Association of Southeast Asian Nations
ASPS Agricultural Sector Programme Support
ATAAS Agricultural Technology and Agribusiness Advisory Services Project
CAADP Comprehensive Africa Agriculture Development Program
CIAT International Centre for Tropical Agriculture
CICS The Competitive Climate Investment Strategy
COMESA Common Market for Eastern and Southern Africa
CPP Crop Protection Product
CSO Civil Society Organization
Danida Danish International Development Assistance
DfID Department for International Development (UK)
DPs Development Partners
DSIP Development Strategy and Investment Plan DTIS Diagnostic Trade Integration Study
EAC East African Community EACIs East African Community Institutes
EIF Enhanced Integrated Framework
EPA Economic Partnership Agreement
FAO Food and Agriculture Organization of the United Nations FDI Foreign Direct Investment
FEWS NET Famine Early Warning System Network (USAID)
FOODNET Food Network GATS General Agreement on Trade in Services
GoU Government of Uganda
GIZ Deutsche Gesellschaft für Internationale Zusammenarbeit
IDEA Investment in Developing Export Agriculture
IFAD International Fund for Agricultural Development IFC International Finance Corporation
IFDC International Fertilizer Development Corporation
IITA International Institute of Tropical Agriculture
IMF International Monetary Fund IUCEA Inter-‐University Council for East Africa
M&E Monitoring and Evaluation
MAAIF Ministry of Agriculture, Animal Industry & Fisheries
MAPS The Marketing and Agro Processing Strategy
MASGGA Masindi Seed & Grain Growers Association
MFI micro-‐finance institution MFN Most Favored Nations
MoFPED Ministry of Finance, Planning and Economic Development
MoU Memorandum of Understanding MRA Mutual Recognition Agreement
MTTI Ministry of Tourism, Trade and Industry
NAADS National Agricultural Advisory Services
NAARI Namulonge Agricultural and Animal Production Research Institute
NaCRRI National Crops Resources Research Institute
NARO National Agricultural Research Organization
NARS National Agricultural Research System
NASECO Nalweyo Seed Company
NDP National Development Plan
NEPAD New Partnership for African Development
NGO Non-‐Governmental Organization
NRI Natural Resources Institute
NSCS National Seed Certification Services
OECD Organization for Economic Community and Development
PEAP Poverty Eradication Action Plan
PFA Prosperity For All
PMA Plan for Modernization of Agriculture
PSFU Private Sector Foundation Uganda
RATES Regional Agricultural Trade Expansion Support (USAID)
RATIN Regional Agricultural Trade Intelligence Network
RDS Rural Development Strategy
SACCO Savings and Credit Co-‐operative
SCOPE Strengthening the Competitiveness of Private Enterprise (USAID)
SEAP Structured Engineers Apprenticeship Program
SG-‐2000 Sasakawa-‐Global 2000
SMCA Standards, Metrology, Conformity Assessment and Accreditation SME Small and Medium sized Enterprises
UBOS Uganda Bureau of Statistics
UCDA Uganda Coffee Development Authority
UCE Uganda Commodity Exchange
UCFA Uganda Commercial Farmers Association
UEPB Uganda Export Promotions Board
UGTL The Uganda Grain Traders Limited
UGX Uganda Shillings
UIPE Uganda Institute of Professional Engineers
UNADA Uganda National Agro-‐Input Dealers Association
UNBS Uganda National Bureau of Standards
UNCST Uganda National Council of Science and Technology
UNFEE Uganda National Farmers Federation
UNHS Uganda National Household Survey
USAID United States Agency for International Development
USTA Uganda Seed Trade Association
WB World Bank
WFP World Food Programme
WTO World Trade Organization
CONTENTS Executive Summary .......................................................................................................................................................... 10
Revised and updated action matrix ................................................................................................................................. 20
Chapter 1: Taking stock of developments since 2005 .................................................................................................... 25
1.1 Macroeconomics: Building on stability, bracing for the oil economy ................................................................. 25
1.1.1 Uganda’s “double lock” ................................................................................................................................ 25
1.1.2 The short-‐term outlook ................................................................................................................................. 25
1.1.3 The coming oil economy: Bracing for the Dutch Disease .............................................................................. 26
1.2 Mainstreaming trade in Uganda’s development strategy: DTIS implementation and impact .......................... 28
1.2.1 Trade in the Policy Process ............................................................................................................................ 28
1.2.2 Aid for Trade: A Rising Tide .......................................................................................................................... 32
1.2.3 Implementation of the DTIS Matrix ............................................................................................................... 38
1.2.3 Moving ahead ................................................................................................................................................ 46
Chapter 2: Leveraging regional integration for diversification and growth .................................................................. 49
2.1 Uganda’s export performance: Where do we stand? ......................................................................................... 49
2.2 Strengths, weaknesses, opportunities and threats ............................................................................................. 56
2.2.1 A resource-‐based look at Uganda’s strengths ............................................................................................... 56
2.2.2 Opportunities at the door: Regional trade growth and potential ................................................................. 60
2.3 Improving the incentives framework ................................................................................................................... 64
2.3.1 Making the Customs Union work for Uganda ............................................................................................... 65
2.3.2 Streamlining non-‐tariff measures .................................................................................................................. 71
Appendix 1 ............................................................................................................................................................. 80
Appendix 2 ............................................................................................................................................................. 81
Chapter 3: Logistics, From landlocked to regional hub .................................................................................................. 81
3.1 Transit infrastructure, a key policy issue ............................................................................................................. 81
3.2 Landlocked Perspective: Regional and International Connectivity .................................................................... 82
3.2.1 Northern Corridor ......................................................................................................................................... 82
3.2.2 Central Corridor ............................................................................................................................................. 84
3.3 Comparative Corridor Performance ..................................................................................................................... 88
3.3 Landlinked Vision: Uganda as a Regional Logistics Hub ...................................................................................... 90
3.3.1 Facilitating Bilateral Trade ............................................................................................................................. 91
3.3.2 Informal trade ............................................................................................................................................... 92
3.3.3 Facilitating Transit Trade ............................................................................................................................... 92
3.3.4 Developing a Regional Logistics Hub ............................................................................................................. 93
3.3.5 Logistics for Niche Exports ............................................................................................................................. 93
3.4 Regional Institutions and Policies ........................................................................................................................ 95
3.4.1 Engagement in Corridor Management .......................................................................................................... 95
3.4.2 Policy Harmonization ..................................................................................................................................... 97
3.4.3 Border Management ..................................................................................................................................... 97
3.4.4 Trucking ......................................................................................................................................................... 99
3.4.5 Freight Forwarding ...................................................................................................................................... 100
3.4.6 Storage Facilities .......................................................................................................................................... 100
Chapter 4: Trade facilitation—Making customs performance an asset ...................................................................... 102
4.1 Uganda Revenue Authority and Customs Department ..................................................................................... 102
4.2 Measures contributing to reduce the dwell time at the border posts ............................................................. 103
4.2.1 Interconnectability with neighboring countries Customs ICT systems ....................................................... 103
4.2.2 Pre-‐arrival facility ........................................................................................................................................ 104
4.2.3 Measures to prevent long stay ................................................................................................................... 104
4.2.5 Self-‐assessment ........................................................................................................................................... 105
4.2.6 Other (East Africa Community) ................................................................................................................... 106
4.3 Customs Modernization ..................................................................................................................................... 107
4.4 Information Technology ..................................................................................................................................... 107
4.4.1 Migration to ASYCUDA World ..................................................................................................................... 107
4.4.2 Direct Trade Input (DTI) and Full paper-‐less ................................................................................................ 107
4.4.3 Database system ......................................................................................................................................... 108
4.4.4 Customs Reconciliation System ................................................................................................................... 108
4.4.5 Work on Single Window .............................................................................................................................. 108
4.6 Other Customs Operations ................................................................................................................................. 110
4.6.1 Risk management principles and Compliance strategy ............................................................................... 110
4.6.2 Customs clearing agents .............................................................................................................................. 111
4.7 Cooperation with Other Border Agencies and the Private Sector .................................................................... 112
4.8 Infrastructure and Equipment ............................................................................................................................ 113
4.9 Management and Human Resources Issues ...................................................................................................... 114
Chapter 5: Services, the new frontier of exports ......................................................................................................... 115
5.1 Services: What is at stake ................................................................................................................................... 115
5.2 Uganda’s services performance and services trade policies ............................................................................. 115
5.3 Realizing Uganda’s Potential in Professional Services ...................................................................................... 121
5.3.1 The Market for Professionals ...................................................................................................................... 121
5.3.2 The Market for Professional Services .......................................................................................................... 124
5.3.3 Exports and imports of professional services in East Africa ....................................................................... 125
5.3.4 Factors accounting for the limited availability of professionals .................................................................. 127
5.3.5 Moving forward ........................................................................................................................................... 130
5.4 Toward a better regulatory framework ............................................................................................................. 134
Chapter 6: Making Uganda East Africa’s maize barn ................................................................................................... 135
6.1 Structure of the sector ....................................................................................................................................... 135
6.1.1 Background .................................................................................................................................................. 135
6.1.2 Production ................................................................................................................................................... 135
6.1.3 The Market for Maize .................................................................................................................................. 137
6.1.4 The Value Chain ........................................................................................................................................... 139
6.2 Structural Issues and their Policy Implications .................................................................................................. 142

6.2.1 Opportunities and Potential ........................................................................................................................ 142
6.3 Looking to the Future ......................................................................................................................................... 150
6.3.1 Policy Issues ................................................................................................................................................. 151
6.3.2 An Agenda for moving forward ................................................................................................................... 154
References ..................................................................................................................................................................... 163

List of figures
Figure 1: Government revenue and spending, as percent of GDP ................................................................................. 27 Figure 2: Trade and trade-‐related keywords in budget speeches, 2000-‐2011 .............................................................. 32 Figure 3: Where does aid for trade go? ......................................................................................................................... 33 Figure 4: The potential demand for aid for trade .......................................................................................................... 34 Figure 5: The allocation of aid for trade by country ....................................................................................................... 35 Figure 6: Trade and current-‐account balance ................................................................................................................ 49 Figure 7: Uganda’s exports and imports of goods & services, percent of GDP .............................................................. 49 Figure 8: EAC members service exports and imports, as percent of GDP ...................................................................... 50 Figure 9: Composition of service exports in Uganda and EAC partners, 2010 (percent of GDP) ................................... 50 Figure 10: Inward FDI flows (million U.S. dollars), Uganda and EAC partners, 2000-‐2010 ............................................. 51 Figure 11: Dollar exports of EAC countries: volume and price growth (percent), 2000-‐2010 ........................................ 51 Figure 12: Uganda’s export growth: Dollar prices and volumes ..................................................................................... 52 Figure 13: Export concentration: Uganda and comparators ........................................................................................... 53 Figure 14: Uganda’s export concentration, 2000-‐2010, in comparison .......................................................................... 53 Figure 15: Coffee’s share in exports: Uganda and comparators ..................................................................................... 54 Figure 16: Export diversification in the EAC .................................................................................................................... 54 Figure 17: The geographical structure of Uganda’s exports, 2000-‐2010 ........................................................................ 55 Figure 18: Number of active exporters ........................................................................................................................... 56 Figure 19: Uganda’s capital stock compared to the global distribution ......................................................................... 58 Figure 20: Uganda’s stock of human capital compared the global distribution ............................................................. 59 Figure 21: Uganda’s export portfolio and factor endowment ........................................................................................ 59 Figure 22: Intra-‐ and extra-‐EAC export growth, 2000-‐2010 ............................................................................................ 60 Figure 23: Share of EAC markets in Uganda’s exports, 1992-‐2010 ................................................................................. 61 Figure 24: Growth of EAC imports, by main products, 2005-‐2010: Uganda vs. other sources ....................................... 61 Figure 25: Growth of EAC imports, by main products, 2005-‐2010: Uganda vs. other sources ....................................... 62 Figure 26: The expansion of Uganda’s trade with South Sudan ..................................................................................... 63 Figure 27: Distribution of MFN tariff rates, before vs. after CET .................................................................................... 65 Figure 28: Is the CET regressive? ..................................................................................................................................... 67 Figure 29: Water in the CET? ........................................................................................................................................... 69 Figure 30: Lorenz curve for importing firms and for CET remissions .............................................................................. 70 Figure 31: Average CET remissions per dollar of imports, by firm size ........................................................................... 71 Figure 32: Number and categorization of NTBs identified in the EAC time-‐bound program .......................................... 72 Figure 33: Delays in cross-‐border operations in the EAC, 2005-‐2011 ............................................................................. 73 Figure 34: Share of imports covered by one or more NTM ............................................................................................ 75 Figure 35: Dissimilarity index of Uganda’s pattern of SPS measures and international best practices .......................... 77 Figure 36: The World Bank’s regulatory-‐review model .................................................................................................. 79 Figure 37: Uganda: Overseas Import Trade By Corridor ................................................................................................. 83 Figure 38: Transit Traffic Through Mombasa (1998 -‐ 2011) ........................................................................................... 83 Figure 39: Traffic evolution at Dar es Salaam ................................................................................................................. 84 Figure 40: Number of wagon-‐ferry voyages between Mwanza and Port Bell per month, 2009 .................................... 87 Figure 41: Exports from Uganda by Destination and by Type, 2010 ............................................................................... 92 Figure 42: Connectivity of Main Airports in East Africa .................................................................................................. 94 Figure 43: Change in Border Crossing Time at Malaba, 2011/12 .................................................................................... 98 Figure 44: Nationality of Trucks Crossing Malaba Border Post ....................................................................................... 99 Figure 45: Customs revenue collection by duty/tax (source: URA) .............................................................................. 102 Figure 46: Malaba inbound, delays by responsible party ............................................................................................. 105 Figure 47: Transit through Uganda by destination ....................................................................................................... 112 Figure 48: Services trade openness, 2005 ..................................................................................................................... 116 Figure 49: Services trade openness, 2010 ..................................................................................................................... 117 Figure 50: Services trade restrictiveness index, Uganda and EAC comparators ........................................................... 120 Figure 51: Breakdown of STRI by type of service .......................................................................................................... 120 Figure 52: Number of lawyers per 100,000 inhabitants ............................................................................................... 122 Figure 53: Number of accountants per 100,000 inhabitants ........................................................................................ 122
Figure 54: Availability of scientists and engineers ........................................................................................................ 123 Figure 55: Usage of Professional Services in Uganda, percent ..................................................................................... 125 Figure 56: Accounting Overall Regulation Index ........................................................................................................... 128 Figure 57: Legal Overall Regulation Index ..................................................................................................................... 128 Figure 58: Accounting – Overall Restrictiveness Index ................................................................................................. 129 Figure 59: Legal – Overall Regulation Index .................................................................................................................. 129 Figure 60: Volume and value of maize exports for Uganda: 2000-‐2010 ....................................................................... 138 Figure 61: Maize Value Chain ........................................................................................................................................ 140 List of Tables
Table 1: Aid for trade: Sectoral distribution of disbursements, 2009-‐April 2012 .................................................... 35 Table 2: Aid for trade: Total donor disbursements, 2009-‐April 2012 ...................................................................... 36 Table 3: Budget support: Disbursements, 2009-‐April 2012 ..................................................................................... 37 Table 4: DTIS action matrix implementation scorecard ........................................................................................... 38 Table 5: Uganda’s Doing Business performance, 2006-‐2012 ................................................................................... 41 Table 6: Government performance in trade-‐related sectors ................................................................................... 42 Table 7: ODA by donor ............................................................................................................................................. 45 Table 8: ODA by sector and executing agency ......................................................................................................... 45 Table 9: Volatility of export growth, volumes and prices, EAC countries ................................................................ 52 Table 10: Uganda’s trade complementarity index with EAC partners, 2000-‐2010 .................................................... 63 Table 11: CET revenue losses, by sector .................................................................................................................... 70 Table 12: Price-‐raising effect (ad-‐valorem equivalent) of SPS measures, selected products, .................................. 76 Table 13: Distances Between Main Ports on Lake Victoria ........................................................................................ 86 Table 14: Options for Increasing the Capacity of the Lake Rail Transport System ..................................................... 90 Table 15: Export from Uganda by Value (USD million), 2005-‐2008 ........................................................................... 91 Table 16: Maize and Beans Retail and Wholesale Prices, April, 2010 ........................................................................ 91 Table 17: Transit Declaration at Main Uganda/South Sudan Borders ....................................................................... 92 Table 18: Composition of Uganda’s GDP, 20011/12 and Annual Average Growth 2006/7-‐2011/12 ...................... 115 Table 19: Uganda’s cross border trade in services, 2010 ......................................................................................... 117 Table 20: Performance indicators for selected services sectors, Uganda and the EAC countries ........................... 118 Table 21: Foreign Professionals in Eastern and Southern Africa .............................................................................. 125 Table 22: Percentage of Firms that Export Professional Services ............................................................................ 126 Table 23: Maize Production in Uganda, 2004-‐2010 ................................................................................................. 136 Boxes
Box 1: A capital-‐intensive industry in Uganda: Cement ........................................................................................ 57 Box 2: Trade with South Sudan: Potential and constraints ................................................................................... 63 Box 3: The EPA, a threat on tariff revenue? .......................................................................................................... 66 Box 4: CET remissions and Uganda’s 2010/11 sugar crisis .................................................................................... 68 Box 5: Quality standards as an NTB: Ugandan butter in Rwanda ......................................................................... 74 Box 6: Uganda’s exports of education services ................................................................................................... 118 Box 7: Regulatory initiatives that could be used as a model by the COMESA countries ..................................... 132 Box 8: Professional Services Knowledge Platform .................................................... Error! Bookmark not defined. Box 9: Good agricultural practices ...................................................................................................................... 151 Box 10: Buffer Stocks: the Jinja complex ............................................................................................................... 158
10
Acknowledgements
At the request of the Government of Uganda, the World Bank took the leading role in the preparation of this DTIS Update. The task team leader of the report was Javier Suarez, and core members of the team were Olivier Cadot (overall write-‐up and trade diversification), Nora Dihel (services), Charles Kunaka (trade transit), James Joughin (maize), Tony Matsudaga (trade facilitation), and Richard Newfarmer (Action matrix implementation). Background papers and other inputs were also provided by Alan Asprilla, Marguerite Duponchel, and Sainabou Taal. Moreover, the analysis in the report greatly benefited from very helpful comments and feedback provided by Paul Brenton, Anton Dobrogonov, Mombert Hoppe, Jacques Morisset, and Rachel Sebudde, among others.
The DTIS update was elaborated in close cooperation with counterparts in the Ugandan government, including the EIF Coordinator Peter Elimu at the Ministry of Trade, Industry and Cooperatives (MTIC), and Alex Mukuluma, who assisted in obtaining critical customs data and updating the implementation status of Action Matrix projects. It was endorsed by Ugandan authorities and representatives of the private sector, civil society and donors during a validation workshop held in Kampala on June 7, 2013. The present version reflects feedback received from discussants and the floor during the workshop.
The DTIS update team would also like to thank the numerous stakeholders from the public and private sectors who provided helpful insights during the team missions undertaken in 2011 and early 2012. They include Mr. Silver Ojakol, Commissioner External Trade, Ministry of Trade; Ambassador Julius B. Onen, Permanent Secretary, Ministry of Trade, Industry and Cooperatives; Mr. Tisasirana Logina, Executive Director, National Planning Authority; Mr., Dhizaala Sanon Moses, Head, Research & Innovation, M&E; Mr. Awel Uwihanganyie, Secretary General, UNCCI; Mr. John Walugembe, Head, Partnerships and Projects, UNCCI; Mr. Andrew Matsiko, Policy and Trade Officer, UNCCI; Ms. Betty Walugere, Head, Finance and Administration, UNCCI; Dr. Jimmy Pat. Saamanya, Permanent Secretary, Ministry of Information, Communication and Technology; Mr. H.G.K Nyakoojo, Adviser, MTIC; Mr. Richard Kamajungo, Commissioner for Customs, Uganda Revenue Authority, represented by Mr. Deo Bitariho, Commissioner General; Mr. Alex Nakajjo, European Commission; Mr. Okudi Fred, Acting Director, PMA, Ministry of Agriculture, Animal Industries, and Fisheries; Mr. F. Kabagambe-‐Kaliisa; Mr. Godfrey Dhatemwa, Commissioner – Education Planning, Ministry of Education and Sports; Mr. William Babigumira, Deputy Executive Director, Uganda Export Promotion Board, Prof. Ddumba Ssentamu, Principal -‐ College of Business, Makerere University; James Mukasa Sebugenyi -‐President Uganda Law Society, Mark Omona-‐ Institute of Certified Public Accountants of Uganda; Jackson MUBANGIZI, President, Uganda Institution of Professional Engineers; Kenneth Ssenwogerere President Uganda Society of Architects; the Executive Director, Uganda Farmers Federation; Dr. Fred Muhumuza, Economic Adviser to the Minister; Mr. Keith Muhakanizi, Deputy Permanent Secretary to the Treasury, Ministry of Finance, Economic Planning and Development; Mr Vincent Kiwanuka, Program Officer, WFP; Mr. Alex Rwego, Manager, UCE; Mr. Chris Kaijuka, Managing Director, Afro-‐Kai; Mr Martin Fowler, Program Officer, USAID; Mr. Warwick Thomson, Trustee, Danida; Mr. Chris Baine, Executive Director, Coronoet Group; Mr. Eric Derks, Chief of Party, LEAD; Mr. Clive Drew, Agribusiness Director, aBi Trust; Mr. Henry Opolot, Commissioner Crops, MAAIF.
Clare Busingye and Noeline Kitonsa provided valuable administrative assistance. The team gratefully acknowledges the logistical and editing support provided by Noeline Kitonsa.
EXECUTIVE SUMMARY
1. The Government of the Republic of Uganda has requested an update of the 2006 DTIS1 and has asked the World Bank to take the leading role in this exercise. The update’s objectives are to (a) take stock of progress in the mainstreaming of trade in the National Development Plan and of the implementation of Action Matrix
1 Uganda’s Diagnostic Trade Integration Study (DTIS) was carried out in 2006 and its draft report validated in a national workshop in October 2006.
11
recommendations; (b) complement and deepen the analysis in selected areas; and (c) revise and update the Action Matrix to take account of the evolving context since 2006. The aim of the analysis is to assist the Government of Uganda in defining an overall competitiveness strategy for inclusive, job-‐creating export-‐led growth, and to further mainstream trade, in particular regional trade integration, into the general policy orientation defined by Uganda’s key policy documents, including the 2010 National Development Plan (NDP).
Three key messages emerge from the DTIS update:
2. Overall, Uganda has made great strides in mainstreaming trade policy in its National Development Plan and keeping the overall incentive framework favorable to export-‐led growth. A key challenge facing the authorities in the next five to ten years will be to strengthen this orientation and push it forward in the changing environment of an “oil economy”. The twin dangers facing Uganda in this context are (a) the “Dutch-‐disease”, a syndrome whereby real exchange-‐rate appreciation chokes export diversification, and (b) the “rent-‐seeking economy”, a syndrome of rivalry for oil rents that distracts from the pursuit of competitiveness, efficiency and social justice. Uganda needs to reinforce institutional and policy safeguards against both, by ensuring that oil revenue is invested to remove priority bottlenecks for the nonoil economy, that macroeconomic management successfully contains upward pressures on the real exchange rate, and that government action is submitted to strict transparency and accountability standards.
3. Export diversification in areas in which Uganda has a comparative advantage in the region, including in particular services, maize, and resource-‐based value-‐addition activities, will be crucial to generate inclusive, job-‐creating export growth. Realizing the country’s potential to supply regional markets in strategic sectors will require the emergence of an overall competitiveness strategy. Uganda has an array of sectoral and cross-‐cutting development plans in which trade is playing an increasingly central role. However the implementation of action matrices on the ground has been uneven, with completion rates around 50%; moreover, in spite of recent efforts, impact measurement remains elusive. Trade policy covers today a vast array of policies straddling an equally large number of government ministries and agencies, leading to fragmentation and a lack of focus. More attention needs to be given to coordination, implementation and follow-‐up. The MTIC can play a central role in the necessary coordination and monitoring effort by implementing the recommendations of Price Waterhouse Cooper’s 2004 Functional Analysis for improved effectiveness and, as recommended in the 2006 DTIS, focusing its limited resources on substantive issues relevant to national competitiveness, rather than deploying them in representation missions in various international fora.
4. Regional integration can be a key instrument to realize these objectives, provided that commitments are adhered to and that the regional agenda develops around the goal of an open, competitive single market in goods and services. Common policies such as the Common External Tariff (CET) and regional NTB monitoring mechanisms provide “anchors” for adopting a stable, predictable, and pro-‐trade policy environment in member States. However, they can play a useful commitment role only as long as they are not distorted by excessive protection via the sensitive list of products, loopholes such as frequent recourse to remissions in lieu of concerted discussion on lowering rates for inputs, or failure to act on identified NTBs. Only whole-‐hearted adherence to regional agendas and institutional mechanisms can bring the rewards of regionalism in terms of policy credibility and independence from special interests.
5. Building on the Government of Uganda’s strategic documents and the results of missions on the ground, the DTIS update provides practical, detailed guidance to achieve these objectives through in-‐depth analysis and an overall action matrix.
Making the DTIS update the catalyst of a national competitiveness strategy
6. Since 2006, the macroeconomic background to the DTIS has evolved substantially. Prudent macroeconomic management has successfully cooled down inflation driven by food prices in 2011; while price pressures remain strong, they have been contained without yielding to the temptation of resorting to export bans. However, stabilization has been achieved at the cost of relatively high interest rates (at least nominally) potentially slowing down investment and growth. The challenge facing monetary authorities today and in the future will be to maintain stability without choking growth.
12
7. Whereas the mobilization of fiscal resources for investment in pro-‐growth infrastructure has been so far relatively weak, the exploitation of oil reserves in Western Uganda should generate substantial and much-‐needed revenue, thus potentially relieving some of the most binding constraints to growth on the supply side.
8. However, it is also portent of numerous dangers to stability and the economy’s ability to diversify, in particular if the real exchange rate is allowed to appreciate, a syndrome known as the “Dutch disease”. While not new to Uganda as large inflows of aid have been shown to have similar effects, this issue will require careful management on the macro-‐policy and institutional sides.
9. The country has adopted in 2008 a best-‐practice framework for oil management, but earnest implementation will be key to success. Most important of all, oil management should be embedded in a clearly articulated national competitiveness strategy geared toward export diversification and job creation in the non-‐oil sector.
10. Significant progress has been made in mainstreaming export competitiveness and trade concerns in the country’s overall development strategy over the last five years, as recommended in the 2006 DTIS, and in the setting up of coordinating and monitoring mechanisms. The 2010 NDP is flanked by several trade-‐specific strategic documents including the 2007 National Trade Policy (NTP), the National Trade Sector Development Plan 2008/9-‐2012/13, the National Export Strategy (NES), and a number of sectoral plans. The NTP addresses broad cross-‐cutting issues pertinent to Uganda’s competitiveness, whereas the NTSDP identifies and prioritizes activities related to NTP implementation and the NES develops measures and strategies to implement broad NTP recommendations at the sectoral level. 11. Besides strategic policy documents, the government has also put in place institutional mechanisms to achieve coordination around agreed strategic plans and action matrices. The Committee on Competitiveness and Investment Climate Strategy (CICS), chaired by the PSs of the MTIC and MoFED, provides overall policy leadership and ensures the take-‐up of competitiveness-‐related issues at the higher echelons of government.
12. In addition, the Office of the Prime Minister established in 2009 a performance evaluation office to track implementation of government programs. The office publishes a Government Annual Performance Report covering the NDP as well as sectoral plans and timed so as to influence planning and budget decisions in the following fiscal year.
13. In the area of trade, this architecture has improved the country’s responsiveness to policy recommendations. Implementation of the DTIS’s action matrix stands today at about 50%, with export sectors (coffee, tea, horticulture and tourism) recording the highest rates of implementation.2 By contrast, the fish sector stands out for its poor implementation score, in spite of its importance in the country’s export basket and of the urgent need for a regulatory framework to ensure sustainability. High implementation rates are also observed for trade facilitation, as customs are no longer perceived by the private sector as a major obstacle to trade, and infrastructure, although much remains to be done here in particular in terms of energy.
14. Donors have supported Uganda in the implementation of trade reforms, with about one billion dollar disbursed between January 2009 and April 2012 in aid for trade (AfT).3 A quantitative cross-‐country study (Gamberoni and Newfarmer, 2010) showed Uganda standing out in 2006 as an “under-‐assisted” country in terms of AfT.
15. Against this background, key challenges ahead include:
• Reinforcing coordination and monitoring mechanisms such as the CICS and the Performance Evaluation Office, and endowing them with analytical capabilities, permanent budget resources, and a robust legal status;
• Reinforcing the MTIC’s own analytical capabilities and focusing on competitiveness-‐relevant issues, while continuing dialogue with donors to further mainstream trade issues in their own priorities;
2 It is difficult to put this performance in international comparison because so far no other country has put together the data needed for this kind of assessment. 3 Using the WTO’s broad definition of Aid for Trade.
13
• Reviewing factors behind low Action Matrix implementation rates in key areas such as fish, and disappointing results on the ground in areas such as coffee in spite of high implementation rates.
Building on Uganda’s strong trade performance 16. In spite of the recent widening of current-‐account deficits, Uganda’s underlying export performance is a strong one. Exports of goods and services represent over 20% of GDP, against only 10% a decade ago. Exports of commercial services have been particularly dynamic, although constrained by a deficient ICT infrastructure.
17. The country has also convinced foreign investors that it offers a favorable and stable investment climate, with inward FDI rising five-‐fold, from barely over $5 million at the beginning of the decade, to $25 million today, making Uganda the prime destination for foreign investment in the region.
18. Much of Uganda’s export growth has been volume-‐based rather than driven by commodity-‐price booms, and has translated into substantial export diversification, even though coffee still accounts for over 30% of total merchandise exports. Uganda’s diversification has been primarily toward resource-‐based value addition, a market trend that provides a good signal about what should be the objective of government efforts to build up the country’s manufacturing base.
19. Furthering Uganda’s nascent export diversification will require efforts in two directions:
• Building up the availability of critical inputs, including capital, capital-‐complementary infrastructure (energy, transportation, ICT), and semi-‐skilled & skilled manpower;
• Working at the policy level to leverage the potential of regional markets to provide outlets for Ugandan products.
20. Constraints on investment finance have prevented Uganda from building up a strong endowment in productive capital. The worldwide distribution of capital is becoming increasingly bipolar, with poorly-‐endowed countries “left on the road side” of global value chains and agglomeration forces. Uganda must work hard on lifting constraints to financial access for investment not to be among those. Constraints must be dealt with at all levels, from micro-‐investments by farmers to large ones by manufacturing firms. Also, the government should avoid the proliferation of situations where distorted incentives (e.g. high CET rates or non-‐tariff barriers) lead to investments in heavily capital-‐intensive facilities at suboptimal scales, mobilizing scarce capital and energy in sectors generating few jobs and unlikely to be Uganda’s comparative advantage; although it is equally true that every investment that “densifies” the local industrial fabric has positive spillovers.
21. The country also urgently needs to build up the employability of its workforce through vocational and technical training, as recognized by the National Export Strategy (NES), and this not only in oil-‐related activities. As recognized by the government, offering adequate skills will be crucial for Uganda to be able to build a credible fabric of potential subcontractors to the oil industry, which requires specialized skills; but skill-‐building is equally important in other sectors on which the pursuit of export diversification and job creation will depend.
22. Provided that supply-‐side constraints are progressively lifted, Uganda will be able to leverage substantial market opportunities in the region. Intra-‐regional trade has been growing vigorously in the East African Community (EAC), whose share in Ugandan exports has been rising from an average of 3% prior to 2000 to 14% at the outset of the global financial crisis. Not only have EAC markets provided a growing outlet for Uganda: the country has also been gaining substantial market share on those markets at the expense of both partners and outside sources.
23. Regional markets provide not just another outlet. New data from the Uganda Revenue Authority (URA) shows that they are breeding grounds for a new type of exporters with typically smaller scale and, most importantly, more diversified export portfolios than traditional commodity exporters. Thus, regional markets are key to nurturing new and inexperienced exporters and to diversifying the country’s export basket out of commodities. Statistical observations have been largely corroborated by anecdotal evidence gathered by the mission on the ground: value added activities are largely geared toward neighboring markets.
Improving the incentive framework
14
24. Statistical analysis carried out for the DTIS update using the so-‐called “gravity equation” suggests that, in spite of widespread concerns, the Common External Tariff (which involved higher average rates of protection than Uganda had before) may not have triggered large-‐scale trade diversion, although high rates compound with non-‐tariff barriers and transport costs to raise the cost of living for Ugandans.
25. The CET is regressive and has a significant impact on the cost of living of the poor. A quantitative analysis combining CET tariff rates with household expenditure patterns using Uganda’s household survey suggests that weighted-‐average customs duties on articles of current consumption are about 12% for households at the bottom of the income distribution but fall to less than 8% toward the top. Thus, the CET acts like a tax on the poor.
26. Moreover, the CET’s application has been haphazard as a result of Uganda’s heavy use of a loophole in Customs Union (CU) rules known as CET remissions. Remissions are granted in a fairly ad-‐hoc way, typically favoring large and established operators, and contribute to reduce CET revenue. A comparison of nominal CET revenue with collected revenue (from MFN sources) suggests substantial leaks that contribute to the weak mobilization of Uganda’s fiscal resources for pro-‐growth investments. In addition, remissions create frictions with Uganda’s EAC partners, distorting competition within the CU, and they negate crucial benefits from regionalism in terms of policy transparency and predictability. There is no doubt that agreeing to a common CET rate suitable both to coastal countries and to landlocked ones with high transportation costs is no easy task, and some sort of safety valve may well be needed. However adjustment mechanisms should be used only parsimoniously in order to preserve the gains from regionalism, and this does not seem to be the case presently.
27. Lastly, Uganda needs to cooperate with its EAC partners on improving the regulatory environment, including both non-‐tariff measures (NTMs) and their protectionist twins, non-‐tariff barriers (NTBs). Priority action areas include, inter alia:
• Strengthening SPS testing and verification capabilities and involving private labs in the process; • Working with EAC partners toward the mutual recognition of conformity-‐assessment procedures;
• Relentlessly working with the EAC Secretariat to strengthen the EAC NTB monitoring mechanisms by acting upon identification of barriers.
28. On paper, Uganda’s pattern of non-‐tariff measures (NTMs) is not excessively differentiated from international best practices, so there is no need for a radical revamp of its regulatory apparatus. However, on the ground, sanitary regulations cannot always be implemented credibly for lack of testing and verification capabilities. This being a widespread syndrome, the EAC lacks the common trust that would be needed for mutual recognition of conformity assessment procedures. State capabilities must be reinforced but most importantly, testing and verification must involve certified private labs with proven capabilities, while not creating statutory monopoly positions that would yet again raise export costs.
29. Uganda must also work with its partners to give a second wind to the EAC Secretariat’s efforts to tackle NTBs at the regional level. As the Secretariat, unlike the E.U. Commission, does not have enforcement powers, it is up to member states to cooperate with it on a voluntary basis. Numerous barriers remain and the monitoring mechanism itself is at risk of falling into redundancy as the private sector is increasingly discouraged of flagging issues when no action follows. Uganda being a landlocked country with indirect access to the sea would be one of the major beneficiaries of reduced NTBs, and should form coalitions with other landlocked countries to ensure progress in this area.
Pushing forward with EAC partners for smoother transit along corridors
30. As a landlocked country, Uganda faces higher trade and transport costs than its coastal partners in the EAC, and its Doing Business scores, while greatly improved over the last five years, still leave ample room for further improvement, in particular as regards the overall costs involved in importing and exporting operations. However, with the right policy choices, the rise in intra-‐regional trade in the EAC could allow it to leverage its central location to serve as a hub for logistics in general and distribution in particular. Indeed, while still suffering from its landlocked position, over recent years Uganda has begun to play a wider logistics role in the Great Lakes region. For instance, importers in South Sudan and DRC keep supplies in bonded facilities in Kampala and bring
15
them into either country when needed, with shorter lead times. As a result, Uganda has seen transit volumes grow, which in turn has led to the emergence of a distribution industry especially in Jinja and Kampala.
31. Maintaining and strengthening a competitive position as a logistics hub will require Uganda to make the right policy choices as alternative routes progressively improve in terms of security and costs for landlocked destinations such as South Sudan, Rwanda, Burundi and the DRC. Uganda has made significant progress in several areas as confirmed by the Logistics Performance Index (LPI) of 2010 (World Bank, 2010), which showed Uganda among the world’s top ten reformers over 2007-‐2010. The performance improvement is stronger than for Uganda’s immediate neighbors and underscores the impact of proactive trade and transport facilitation policies. Uganda made notable progress especially in improving its customs and trade infrastructure and systems. However, the country still ranks 66th in the world, suggesting that more needs to be done.
32. Reducing costs and improving logistics performance is not just about building infrastructure: It is also and most importantly about policy choices. Over the past decade, EAC member States have invested significantly in “hard” trade infrastructure, but more is still needed given the backlog. While much infrastructure rehabilitation and expansion has been financed by donors until now, in the medium term oil money may allow countries in the region to take control of the infrastructure agenda. In this perspective, institutional mechanisms must be strengthened, at both the national and inter-‐governmental levels, to oversee effectively the modernization of transit infrastructure.
33. Existing infrastructure gives Uganda access to the sea through two main corridors: The Northern Corridor connecting to the Port of Mombasa, and the Central Corridor connecting to the Port of Dar es Salaam. Improvements to the two corridors are critical to the trade competitiveness of the country in regional markets as well as for its overseas trade.
34. The Government of Uganda needs to make progress on reviving multimodal transportation on both corridors, especially on the Central corridor in order to reduce its vulnerability to monopoly positions on the Northern corridor. Efforts to rehabilitate rail links have been floundering for years, making road the dominant mode of transportation. This has substantially raised the cost of moving heavy bulk cargo such as cement and construction materials, raising the price of non-‐tradeables in Uganda and reducing its ability to export competitively bulk commodities like maize or coffee.
35. The Northern Corridor, which is the most important for Uganda, accounting for 98% and 80% of its import and export traffic respectively, would gain from investments in railways. Road infrastructure is either good or under improvement through ongoing rehabilitation projects in Kenya and Uganda. A narrow-‐gauge railway line runs parallel to the road, but with a very poor record in terms of service delivery. The governments of Kenya and Uganda have adopted a joint approach to the operational management of the interconnected system and attempted to attract private investors. So far, success has been limited, with rehabilitation remaining very incomplete and tonnage marginal. EAC member States plan to build a new high-‐capacity line with standard gauge, but plans suffer from under-‐funding and a chicken-‐and-‐egg problem as private investors want assurances of future traffic which cannot be proved unless the line is built and operated in a credible way.
36. The Central corridor, which is also predominantly a road one (the narrow-‐gauge railway line leading from Dar es Salaam to Lake Victoria is dysfunctional for reasons largely similar to those on the Northern corridor) has been declining in importance as far as Uganda is concerned. Its overall performance is low, and it is held down by the inefficiency of the port of Dar es Salaam, one of the costliest and least efficient in the region.
37. Uganda is an active player in inter-‐governmental corridor management bodies, but those bodies suffer from chronic underfunding and the funding issue must be tackled in order to move forward with the rehabilitation programs needed on both corridors. The situation has improved on the Northern corridor thanks to a tonnage levy collected by the Kenya Ports Authority on behalf of Uganda and other landlocked countries served by the corridor. Some policy mechanism must be put in place to ensure substantial participation by coastal countries as well and to make the mobilization of funds commensurate with the needs.
38. A number of other initiatives are planned or under way to make transit smoother on interstate corridors, including common customs bonds, interconnection of customs information systems, 24/7 operations at borders, and one-‐stop border posts. The Government of Uganda needs to push forward with its EAC partners for the full
16
deployment of these initiatives as well as to eliminate sticking points like un-‐harmonized axle-‐load regulations and informal payments at weigh bridges.
Building on a successful customs reform
39. EAC countries have put in place a number of joint trade-‐facilitation initiatives that have already delivered big dividends in terms of reduced trade costs, as demonstrated by ASYCUDA data. The modernization of Uganda’s border management is indeed often cited as a model, with border-‐post dwell times cut from three days to three hours. According to Uganda’s Uganda Revenue Authority (URA), five key elements have contributed to this success story:
• Interconnectability of Customs ICT systems with neighboring countries; • The pre-‐arrival facility; • Various measures to prevent long stay; • 24/7 operation; • Self-‐assessment by customs.
40. For instance, information sharing between EAC customs administrations through the Revenue Authority Digital Data Exchange System (RADDex) has both cut both the complication of transit procedures for traders and the workload of customs administration by eliminating the duplication of documentation checks along corridors. RADDex has also enabled a pre-‐arrival facility for declarations, although the facility has not been fully used by Uganda.
41. Key next steps include the adoption of a Single Window, on which the MTIC is coordinating work, and, in parallel—and without waiting for the Single Window’s implementation—the automation of all border posts through the adoption of flexible and user-‐friendly recent software. Streamlining and consolidating the operation of the One Stop Border posts will actually constitute a key building block to the operationalization of the Single Window.
42. Uganda’s customs currently use risk management through ASYCUDA’s built-‐in module. With technical assistance from donors, they should move on to more sophisticated risk-‐management software based on broader profiling characteristics in order to reduce inspection rates in line with the URA’s objectives.
43. Training efforts should also be pursued to improve the performance of clearing agents and lift the profession’s standards of competence and ethics in order to reduce both errors and fraud.
44. Finally, in order to make these gains sustainable and to engrain the right philosophy in day-‐to-‐day work practices and management strategy, trade facilitation should be mainstreamed in the URA’s mission, which is currently stated only in terms of revenue collection. Border committees have been established in Malaba, Katuna and Mpondwe among others.
An ambitious services agenda to be developed 45. Uganda’s 2010 services export performance was better than that of countries at similar levels of development, but this performance relies heavily on travel services. The country is only starting to diversify its services exports – for example, exports of non-‐traditional services such as other business services, computer and information services, and financial services are beginning to emerge; and anecdotal evidence on Uganda’s exports of education services suggests that the country is starting to take advantage of emerging opportunities in higher value added services sectors. Despite dynamic growth rates and positive developments, several services in Uganda remain underdeveloped with performance indicators below the East African average. This could translate into an important competitive disadvantage given that services are essential inputs for most economic activities.
46. To address these constraints, policy action is required in the areas of education, regulation, trade policy, and labor mobility. In professional services, in particular, the Government of Uganda needs to put in place an adequate regulatory framework to support the effective implementation of existing engagements. Decisions on the nature and pace of reform need to be informed by careful analysis and an understanding of good practices,
17
and a national regulatory-‐assessment mechanism covering education and professional services sectors should be put in place and a roadmap for action with concrete objectives and targets.
47. With the right policies and regulatory framework, Uganda can leverage regional integration to strengthen services sectors that provide key inputs to the economy and, at the same time, replicate the education services success story in other higher value added services.
48. Domestic policy reform should be complemented with international and regional cooperation (e.g. through WTO, EAC and COMESA services negotiations). Regulatory cooperation at the regional level has the potential to accelerate services reforms. For instance, sectoral agreements on the mutual recognition of professional qualifications could help with the development of adequate curricula for various professions, and provide guidance for employers, mentors and trainees regarding the practical experience requirements for professionals.
49. The Government of Uganda should work with regional bodies such as the IUCEA, the EABC, or the EAPSP to undertake in-‐depth, cross-‐country comparative assessments of professional qualifications (entry requirements, education and training, and practical experience requirements) and the regulations governing the professionals in each EAC member state. Such benchmarking exercises are necessary tools for the appropriate implementation of the negotiated Mutual Recognition Agreements of Professional Qualifications and Licensing Requirements (MRAs).
50. Uganda’s participation in the Professional Services Knowledge Platforms in East Africa and COMESA can help the country with the development of a meaningful reform program that includes the elimination of explicit barriers and regulatory, education and immigration reforms.
51. In sum, Uganda needs to engage in deep regulatory cooperation at the regional level and use multilateral trade liberalization and regional integration to reform and strengthen its professional services sectors. The government could engage with donors to secure technical and financial assistance to strengthen the capacity of regulatory organizations, and develop appropriate regulation.
Developing Uganda’s high-‐potential agricultural sector 52. The agricultural sector has been the object of much interest and support from the Government of Uganda, donors and NGOs. The DTIS update focuses on the maize sector, although the government should refrain from picking sectoral priorities and should rather work on lifting cross-‐cutting constraints to commercial agriculture’s development. Unlike most East, Central and Southern African countries, Uganda is not dependent on maize as the staple food; with domestic consumption below 15 kg/cap (against 90 kg in Kenya and well over 100 kg in several Southern African countries), it is still essentially a cash crop grown predominantly by small holder farmers for trade. Those producing on land holdings of between 0.2 and 0.5 ha are believed to account for up to 75 per cent of production and over 70 per cent of the marketable surplus.
53. Maize producers have four broad outlets: (i) The maize flour or posho market, which takes some 400,000 tons of low quality ungraded grain; (ii) Food relief purchases by the World Food Programme which reached over 150,000 tons of Grade 1 quality maize in 2010; (iii) The animal feed industry which could take as much as 100,000 tons (of bran), and; (iv) Exports to neighbouring countries which reached 166,000 tons in 2010.
54. Opportunities for the development of maize and other cash crops in Uganda are there. A growing urban population and changing preferences for maize among city dwellers and the young means there is a growing domestic base consuming posho. In addition, EAC countries are moving toward the establishment of a common maize market with over 130 million consumers. If production could be stepped up, Uganda would be able to supply more to this market and even play a key role in it.
55. In order to take advantage of this emergent market opportunity, the Government of Uganda needs to put renewed energy into maize-‐sector development plans, as numerous constraints still affect the country’s ability to respond to market signals. Regardless of farm size, yield levels stand at a low 1.0-‐1.8 tons/ha because of limited use of agricultural inputs in a traditional farming system. By comparison, yields on research stations can reach five tons/ha for OPVs and seven tons/ha for hybrids. Ugandan farmers use an average of one kg of nutrients

18
per ha of arable land compared to 35 kg in Kenya, 22 kg in Malawi and 13 kg in Tanzania which is related to the fact that fertilizers (also seeds and other chemicals) are some 50 per cent more expensive in Uganda than in Kenya.
56. The value chain is long and fragmented, with 2.5-‐3.0 million atomized, unorganized, unskilled small farming households, rural traders (estimated at some 1,000), local brewers, rural millers (estimated at 600), medium and large urban millers, wholesalers, retailers, food aid agencies, institutional buyers, exporters, urban dwellers and neighbouring/regional countries.
57. The future of maize agriculture boils down to success in attaining one objective: getting the maize industry onto a commercial footing. Positive commercialization experiences do exist in Uganda and lessons can be learned about how to move forward: the flowers & cuttings sector and the sugar and the tea estates are examples. There are also commercial operations in dairy, beef, poultry and even maize. Farmers need to engage in employing Good Agricultural Practices (GAP) in combination with improved genetic material. This alone has been demonstrated to result in a doubling of yields.
58. Small size impedes farmers’ capacity to scale up, as low returns restrict savings and re-‐investment, and, notwithstanding the problem of low input use, production itself is extremely variable due to unpredictable weather and small farmers’ vulnerability to the many shocks they experience.
59. As long as the scale of production remains low, other value chain activities will continue to be inefficient. Consolidators of maize will continue to have to cover large distances to bulk minimal quantities (incurring excessive handling and all the negative effects on quality that entails). The resulting post-‐harvest losses and high procurement costs are then passed down the chain to millers, exporters and consumers.
60. Consolidation, or bulking, of raw maize is necessary to create economic volumes for processing, retailing and export but bulking operations are expensive and require long term capital investments that cannot be justified without regular, high volume throughput. Farmers will only deliver a clean and dry product if they have an incentive to do so; when the market does not differentiate on the basis of quality, where the only buyers are small scale opportunistic traders, there is little or no premium for providing better product.
61. The Government of Uganda needs to work with donors on developing a supportive regulatory framework for emergent forms of ICT-‐based branchless banking in order to allow poor maize farmers access to cash and financing. The persistence of poor quality maize at the farm gate is a function of the poverty of the farmers and their need for immediate cash. With little or no liquidity, investments in technology to improve the grain are burdensome and not a high priority. And so the trade in small volumes of poor quality, wet, unclean maize continues, each delivery being consolidated into larger volumes of worsening quality maize. The high level of losses and the costs of handling, transporting and ultimately separating out the waste, often cited as above 30 per cent, drive up prices to consumers and keep farm gate prices low.
62. The lack of availability of finance is also a major check on progress in the industry. Productivity enhancing technology exists, land for purchase or rent exists (up to a point) and labour is available. What is really lacking is investment, either from farmers’ retained earnings or from appropriately structured financial products. The problem is the familiar one that commercial banks shy away from funding agriculture and agribusiness because of perceived low returns and high risks: weather, pests, diseases, fluctuating prices, political interference etc.
63. The Government of Uganda should step up work on the preparation of the new Maize Platform by getting stakeholders together, prioritizing issues and budgeting. Over the last ten years, considerable headway has been made. It is now time to accelerate this and build on the gains.
64. Although political will has waxed and waned in recent years, the government has the capacity to make a decisive contribution. As part of the Maize Platform process, implementation of already-‐existing policies should include:
• Implement the MAAIF Development Strategy and Investment Plan • Implement the Sanitary and Phyto-‐sanitary Agreements • Develop a coherent Food Security policy
19
• Begin the reforms of the numerous agricultural sector institutions that have long been slated: MAAIF, NSCS, Statistics, UCE.
65. New initiatives that the government can promote and facilitate others to undertake include:
• Convene the Maize Platform and define a sectoral plan with budgets, timing, and milestones, while clarifying the status of numerous pending bills
• Insist that all seed and other inputs provided by development and humanitarian assistance is up to standard and "certified" and discourage provision of seed on charitable terms, by NGOs, NAADS or others.
• Pursue farmer training programs on affordable technologies and support improvement of simple post-‐harvest practices;
• Develop and promote financing models for new technologies, from tarpaulins to driers and warehousing • Develop/allow more autonomy and reform at UCE and NSCS; • Improve feeder roads in main maize production districts
66. Ultimately, sustainable solutions will come from the industry and be based on commercial realities. Donors should facilitate this and avoid confusing the issue with other (legitimate) agendas such as poverty programs or support to farmers groups.
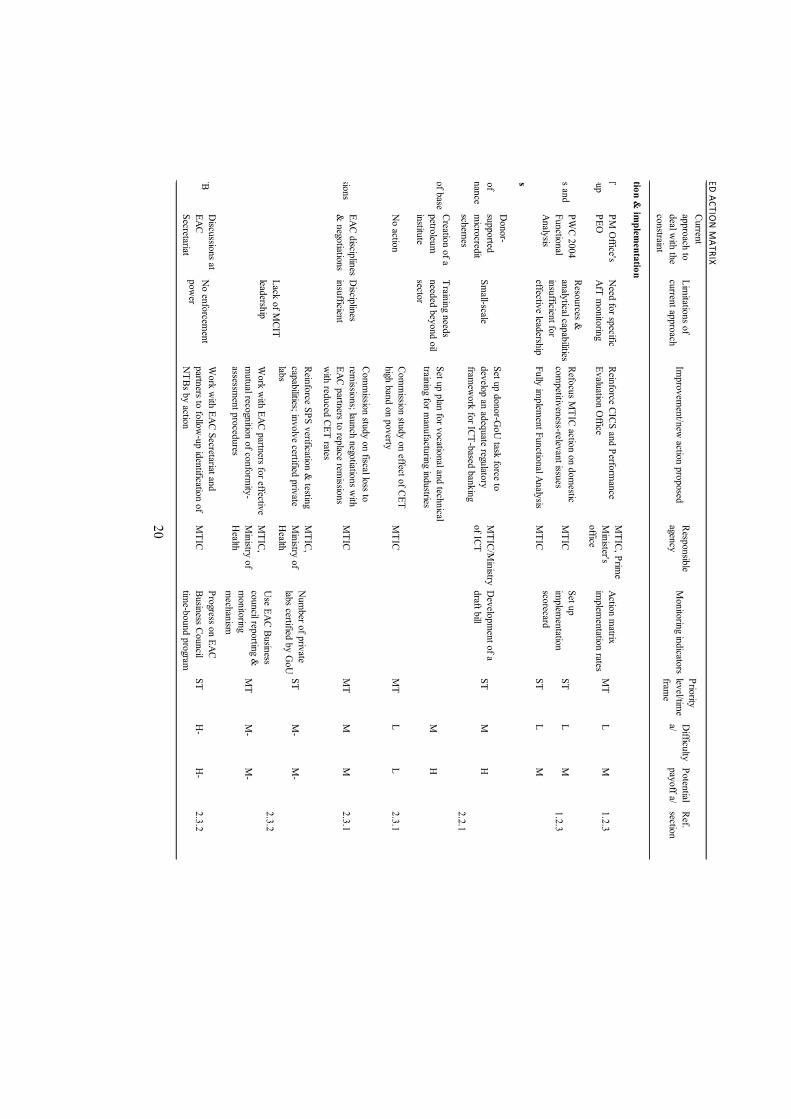
20 REVISED
AND UPD
ATED ACTIO
N M
ATRIX
Identified constraint
Current approach to deal w
ith the constraint
Limitations of
current approachIm
provement/new
action proposedResponsible agency
Monitoring indicators
Priority level/tim
e fram
e
Difficulty
a/Potential payoff a/
Ref. section
Trade-policy formulation &
implem
entation
Lack of visibility in AfT recom
mendations take-up
PM O
ffice's PEO
Need for specific
AfT monitoring
Reinforce CICS and Performance
Evaluation Office
MTIC, Prim
e M
inister's office
Action matrix
implem
entation ratesM
TL
M1.2.3
Refocus MTIC action on dom
estic com
petitiveness-relevant issues M
TIC ST
LM
Fully implem
ent Functional AnalysisM
TIC ST
LM
Trade-policy measures
Insufficient availability of investm
ent and trade finance
Donor-
supported m
icrocredit schem
es
Small-scale
Set up donor-GoU
task force to develop an adequate regulatory fram
ework for ICT-based banking
MTIC/M
inistry of ICT
Developm
ent of a draft bill
STM
H
Inadequate availability of base and technical skills
Creation of a petroleum
institute
Training needs needed beyond oil sector
Set up plan for vocational and technical training for m
anufacturing industriesM
H
Regressivity of CETN
o actionCom
mission study on effect of CET
high band on povertyM
TICM
TL
L2.3.1
Excessive use of remissions
EAC disciplines &
negotiationsD
isciplines insufficient
Comm
ission study on fiscal loss to rem
issions; launch negotiations with
EAC partners to replace remissions
with reduced CET rates
MTIC
MT
MM
2.3.1
Reinforce SPS verification & testing
capabilities; involve certified private labs
MTIC,
Ministry of
Health
Num
ber of private labs certified by G
oUST
M-
M-
Work w
ith EAC partners for effective m
utual recognition of conformity-
assessment procedures
MTIC,
Ministry of
Health
Use EAC Business
council reporting &
monitoring
mechanism
MT
M-
M-
Lack of progress in NTB
elimination
Discussions at
EAC Secretariat
No enforcem
ent pow
er
Work w
ith EAC Secretariat and partners to follow
-up identification of N
TBs by actionM
TICProgress on EAC Business Council tim
e-bound programST
H-
H-
2.3.2
MTIC lack of resources and
effectiveness
PWC 2004
Functional Analysis
Resources &
analytical capabilities insufficient for effective leadership
Set up im
plementation
scorecard1.2.3
2.2.1
Non-recognition of
conformity-assessm
ent procedures in EAC
Lack of MCIT
leadership2.3.2
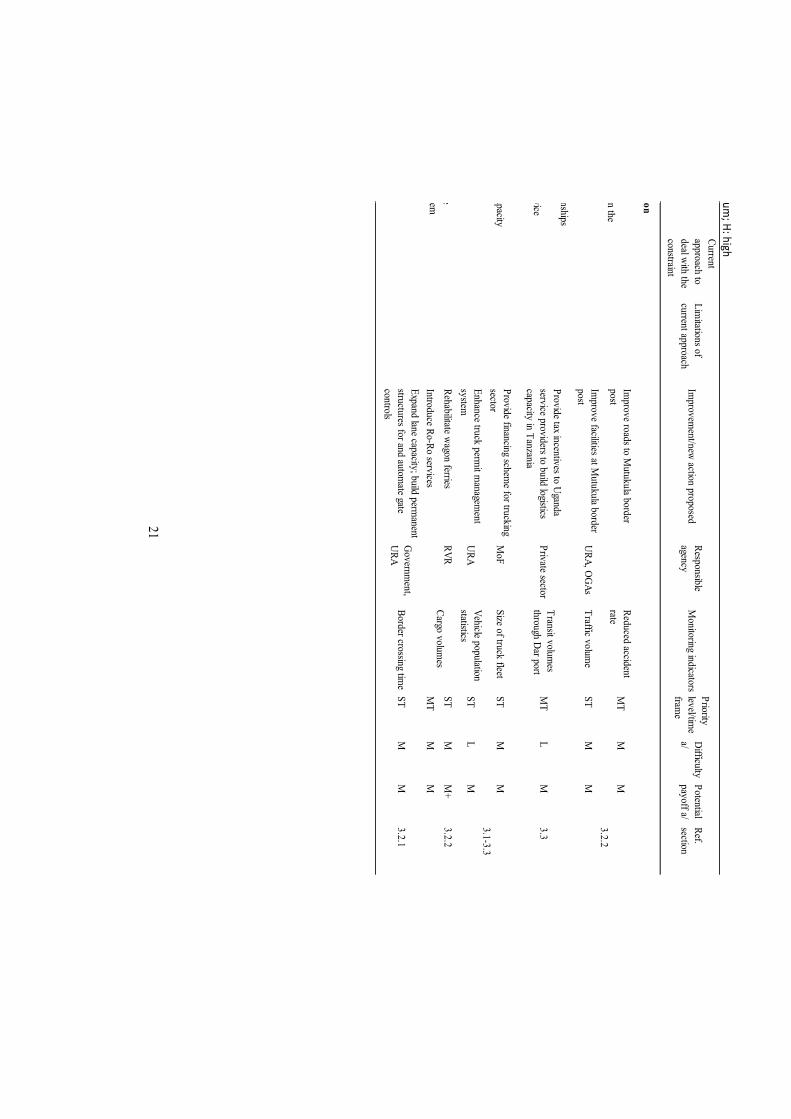
21 a/ L: low
; M: m
edium; H: high
Identified constraint
Current approach to deal w
ith the constraint
Limitations of
current approachIm
provement/new
action proposedResponsible agency
Monitoring indicators
Priority level/tim
e fram
e
Difficulty
a/Potential payoff a/
Ref. section
Transit and facilitation
Improve roads to M
utukula border post
Reduced accident rate
MT
M
M
Improve facilities at M
utukula border post
URA, O
GAs
Traffic volume
STM
M
Weak business relationships
between U
ganda and Tanzania logistics service providers
Provide tax incentives to Uganda
service providers to build logistics capacity in Tanzania
Private sectorTransit volum
es through D
ar portM
TL
M
3.3
Low road transport capacity
Provide financing scheme for trucking
sectorM
oFSize of truck fleet
STM
M
Poor truck permit
managem
ent systemEnhance truck perm
it managem
ent system
URA
Vehicle population statistics
STL
M
Rehabilitate wagon ferries
RVRST
MM
+3.2.2
Introduce Ro-Ro servicesM
TM
M
Congestion at Malaba
Expand lane capacity; build permanent
structures for and automate gate
controls
Governm
ent, U
RABorder crossing tim
eST
MM
3.2.1
3.1-3.3
High transport costs on the
Central Corridor3.2.2
Low capacity on Lake
Victoria transport systemCargo volum
es
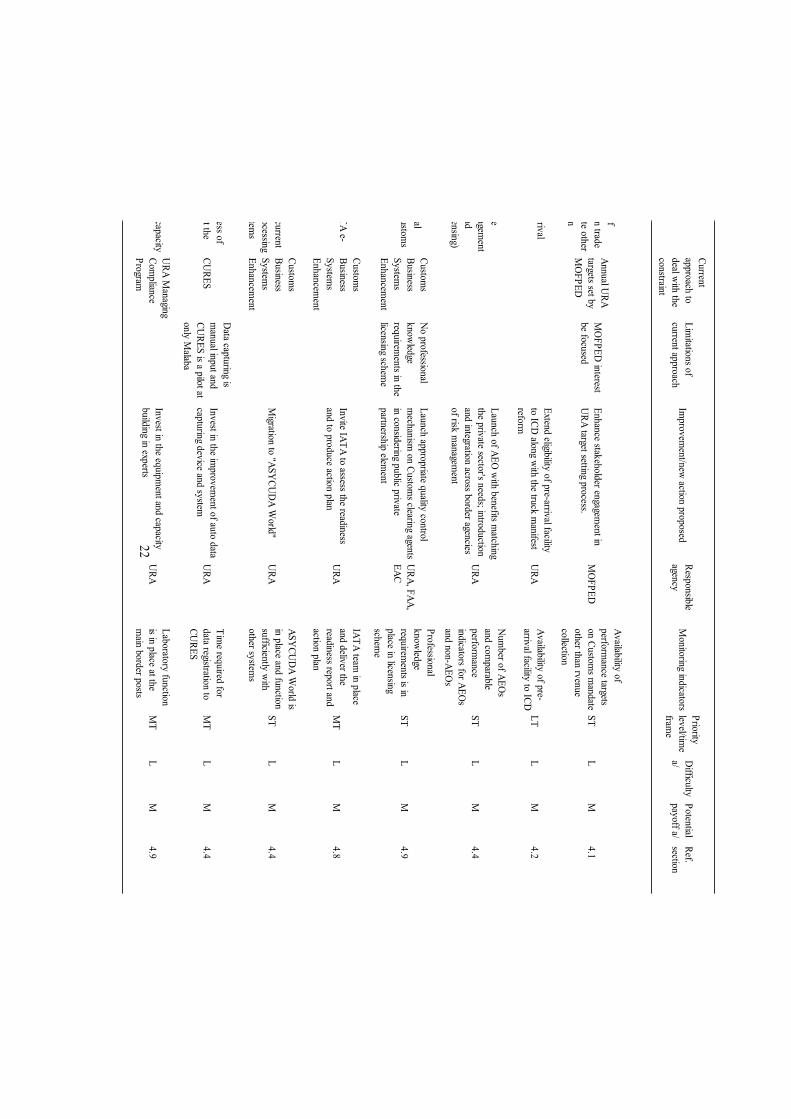
22 Identified constraint
Current approach to deal w
ith the constraint
Limitations of
current approachIm
provement/new
action proposedResponsible agency
Monitoring indicators
Priority level/tim
e fram
e
Difficulty
a/Potential payoff a/
Ref. section
Custom
s
Insufficient visibility of perform
ance targets on trade facilitation and m
andate other than revenue collection
Annual URA
targets set by M
OFPED
MO
FPED interest
be focusedEnhance stakeholder engagem
ent in U
RA target setting process. M
OFPED
Availability of perform
ance targets on Custom
s mandate
other than rvenue collection
STL
M4.1
Inavailability of pre-arrival facility in ICD
Extend eligibility of pre-arrival facility to ICD
along with the truck m
anifest reform
URA
Availability of pre-arrival facility to ICD
LTL
M4.2
Inadequate compliance
strategy and risk managem
ent (particularly, transit and bonded w
arehouse licensing)
Launch of AEO w
ith benefits matching
the private sector's needs; introduction and integration across border agencies of risk m
anagement
URA
Num
ber of AEOs
and comparable
performance
indicators for AEOs
and non-AEOs
STL
M4.4
Inadequate professional know
ledge in some Custom
s clearing agents
Customs
Business System
s Enhancem
ent
No professional
knowledge
requirements in the
licensing scheme
Launch appropriate quality control m
echanism on Custom
s clearing agents in considering public private partnership elem
ent
URA, FAA,
EAC
Professional know
ledge requirem
ents is in place in licensing schem
e
STL
M4.9
Consider applying IATA e-freight
Customs
Business System
s Enhancem
ent
Invite IATA to assess the readiness and to produce action plan
URA
IATA team in place
and deliver the readiness report and action plan
MT
LM
4.8
Difficulty in
interconnectavility of current Custom
s clearance processing system
with other system
s
Customs
Business System
s Enhancem
ent
Migration to "ASY
CUD
A World"
URA
ASYCU
DA W
orld is in place and function sufficiently w
ith other system
s
STL
M4.4
Slow registration process of
physical information at the
borderCU
RES
Data capturing is
manual input and
CURES is a pilot at
only Malaba
Invest in the improvem
ent of auto data capturing device and system
URA
Time required for
data registration to CU
RESM
TL
M4.4
Inadequate analytical capacity at the border
URA M
anaging Com
pliance Program
Invest in the equipment and capacity
building in expertsU
RALaboratory function is in place at the m
ain border postsM
TL
M4.9
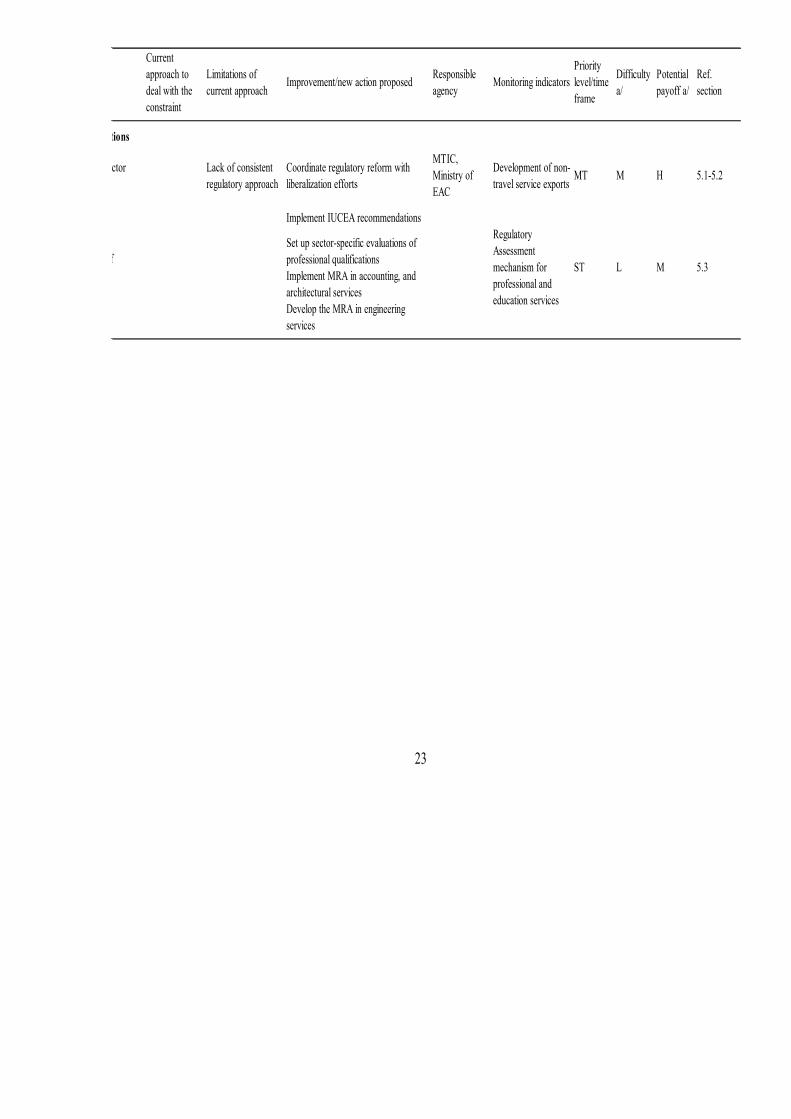
23
Identified constraint
Current approach to deal with the constraint
Limitations of current approach
Improvement/new action proposed Responsible agency
Monitoring indicatorsPriority level/time frame
Difficulty a/
Potential payoff a/
Ref. section
Service-trade regulations
Insufficient service-sector diversification
Lack of consistent regulatory approach
Coordinate regulatory reform with liberalization efforts
MTIC, Ministry of EAC
Development of non-travel service exports
MT M H 5.1-5.2
Implement IUCEA recommendations
Set up sector-specific evaluations of professional qualifications Implement MRA in accounting, and architectural services Develop the MRA in engineering services
Lack of recognition of professional degrees
Regulatory Assessment mechanism for professional and education services
ST M 5.3L
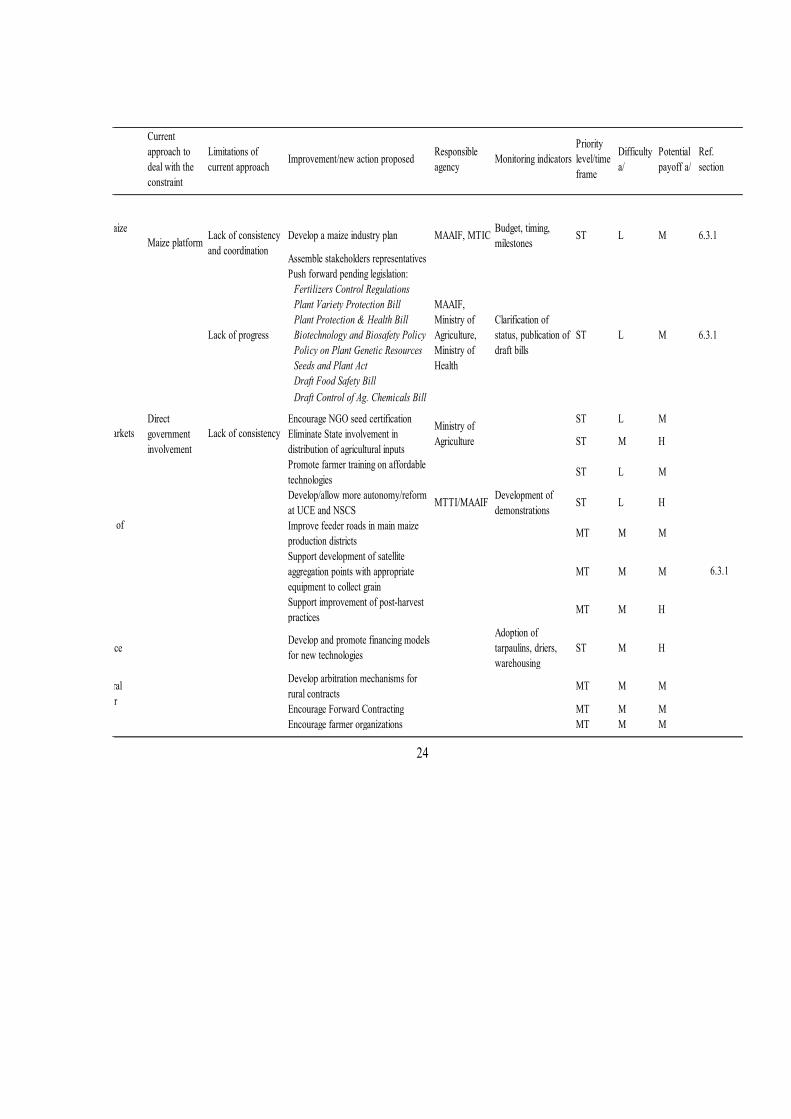
24
Identified constraint
Current approach to deal with the constraint
Limitations of current approach
Improvement/new action proposed Responsible agency
Monitoring indicatorsPriority level/time frame
Difficulty a/
Potential payoff a/
Ref. section
Maize sector
Develop a maize industry plan MAAIF, MTIC Budget, timing, milestones
ST L M 6.3.1
Assemble stakeholders representatives Push forward pending legislation:
Fertilizers Control RegulationsPlant Variety Protection BillPlant Protection & Health Bill
Lack of progress Biotechnology and Biosafety Policy Policy on Plant Genetic ResourcesSeeds and Plant ActDraft Food Safety BillDraft Control of Ag. Chemicals Bill
Encourage NGO seed certification ST L MEliminate State involvement in distribution of agricultural inputs
ST M H
Promote farmer training on affordable technologies
ST L M
Develop/allow more autonomy/reform at UCE and NSCS
MTTI/MAAIF Development of demonstrations
ST L H
Improve feeder roads in main maize production districts
MT M M
Support development of satellite aggregation points with appropriate equipment to collect grain
MT M M
Support improvement of post-harvest practices
MT M H
Unavailability of financeDevelop and promote financing models for new technologies
Adoption of tarpaulins, driers, warehousing
ST M H
Develop arbitration mechanisms for rural contracts
MT M M
Encourage Forward Contracting MT M MEncourage farmer organizations MT M M
Lack of visibility in maize sector strategy & implementation
Maize platform Lack of consistency and coordination
Low productivity/lack of incentives for quality production
Market failures & moral hazard in farmer/buyer relations
M 6.3.1
Distortions in input marketsDirect government involvement
Lack of consistency Ministry of Agriculture
Lack of progress in regulatory/legislative framework
MAAIF, Ministry of Agriculture, Ministry of Health
Clarification of status, publication of draft bills
ST L
6.3.1
25
CHAPTER 1: TAKING STOCK OF DEVELOPMENTS SINCE 2005
1.1 MACROECONOMICS: BUILDING ON STABILITY, BRACING FOR THE OIL ECONOMY
1. After rapid growth over the last two decades, Uganda faces challenging macroeconomic developments. Policy action to bring inflation under control was successful but costly in terms of growth. Taking care of macroeconomic imbalances will need to be carefully designed in order to avoid slamming the brakes on an economy that sorely needs growth with a population that grows at 3% a year.
2. Policy challenges will be compounded by the coming exploitation of oil fields in the Albertine region, which may trigger “Dutch-‐disease” syndromes including renewed inflation and real appreciation. In the medium to long run, well-‐designed policy initiatives will be needed in all areas (e.g. export promotion, infrastructure investment, services regulation) to promote diversification and job creation in the non-‐oil economy.
1.1.1 UGANDA’S “DOUBLE LOCK”
3. Uganda’s longstanding policy choice in favor of open markets has delivered strong performance over more than a decade. However, in the face of new challenges, including persistent poverty, social and spatial inequalities, and large cohorts of young people arriving each year on the labor market, the country’s export-‐led growth strategy is in search of a second wind. Frustration with insufficient per-‐capita growth may create a temptation to revert to old-‐style interventionist policies in order to force the pace. The Government of Uganda should resist such temptations and ensure, instead, that it provides the right conditions and incentives for the private sector to accumulate productive assets and take risks.
4. Over the last two decades, Uganda has achieved noteworthy economic growth supported by a prudent macroeconomic framework and consistent policy reforms. Real GDP growth averaged 7.4 percent per year over 2000-‐2010, up from 6.5 percent in the 1990s, in spite of the triple shock of oil price hikes, a prolonged drought with adverse effects on energy generation and agricultural production, and rising and volatile food prices. High growth has delivered substantial reductions in poverty from the crippling levels of the 1990s.
5. However, the country’s structural transformation and rising productivity in market-‐oriented agriculture have been spatially concentrated in the South, Central, and Western regions. In spite of its strong potential, the Northern region, affected by protracted conflicts, has been largely left aside, suffering a “double lock”—isolated within a country that is itself landlocked. Much of the country’s industrial activity is clustered around large towns and along transport corridors, in particular the industrial corridor stretching between the country’s major urban agglomerations—Mbarara, Masaka, Kampala, Jinja, and Mbale, closely following the distribution of infrastructure networks and markets.
6. As a result of spatially unequal development, welfare improvements over the last decade have eluded the Northern and Eastern regions while the rural-‐urban gap has widened. While poverty has strongly receded in the Southern regions, in the North and North East the reduction has been much weaker. Moreover, in spite of faster economic growth, the recent decade has recorded slower reductions in poverty, as aggregate GDP growth was partly absorbed by very high population growth rates.
1.1.2 THE SHORT-‐TERM OUTLOOK
7. The macroeconomic environment has recently become more challenging. The global financial crisis cut Uganda’s growth to 5.8% in 2009/10, two percentage points less than in 2008/09. Supported by a strong recovery in credit to the private sector and by faster growth in services, growth rebounded after the global financial crisis to an estimated 6.7 percent in 2010/11, but this rebound was accompanied by a sharp spike in inflation which topped 30 percent in October 2011. The inflation acceleration was triggered by food price rises resulting from drought in the Horn of Africa. In Uganda, this effect was compounded by the combination of an election-‐related loosening of the fiscal stance, sustained domestic demand, and a pass-‐through effect from the Ugandan shilling’s 20% depreciation over January-‐August 2011. Tight monetary policy and under execution of budget spending brought inflation under control down to 5 percent in November 2012, however, the tightened policy stance sharply slowed growth, to just below 3.5% for 2011/12.
26
8. The current-‐account balance has deteriorated markedly in recent years, from less than 8 percent of GDP in FY2008/09 to over 11 percent in 2011/12, owing mainly to large trade deficits. Moderate export growth, supported by regional demand (see Chapter 2), has been outpaced by strong import demand, notably for capital imports for infrastructure projects. This trend is expected to continue for the next 2-‐3 years as investments in the oil sector pick up, and should start to reverse once oil production and exports come on stream.
9. Persistent current account deficits have been financed by significant surpluses of the capital account,
fueled mainly by FDI and development-‐aid flows. Despite large fluctuations in the shilling’s nominal value, the real effective exchange rate has remained relatively stable in recent years, and so have the terms of trade. International reserve accumulation benefited from tight monetary policy and strong private capital inflows, and reserve cover is now close to 4 months of imports.
10. Uganda’s medium-‐term growth prospects remain solid and are projected at 7 percent for the next few years. In the medium term, growth is expected to be supported by increased activity in construction, transport, telecommunication services, financial services and the incipient oil industry. Increased demand from neighboring countries, including South Sudan, should also continue to foster agricultural and industrial production for regional markets.
1.1.3 THE COMING OIL ECONOMY: BRACING FOR THE DUTCH DISEASE
11. Important oil discoveries along the Albertine Rift in Western Uganda, with proven reserves of at least 800 million barrels and possibly up to 2 billion barrels. The potential revenue is considerable, as it could double government revenue within less than a decade. Production could rise to bbl 150,000-‐200,000 per day over a 25-‐year production period. Limited production of 10,000-‐20,000 barrels per day, primarily for domestic use, could start within two to three years, using rail and road transportation for delivery. Full-‐scale production (and the concomitant government revenue) could kick in within 5-‐7 years, once downstream infrastructure is in place.
12. Oil production will require several billion dollars of downstream infrastructure development. The government favors the construction of a refinery to serve the domestic and regional market. The oil companies are exploring a number of export options, including the construction of a pipeline through Uganda and Kenya to Mombasa and the possibility of exporting crude oil via rail and water through Kenya or Tanzania. Regardless of the path chosen, large infrastructure programs could generate employment and other economic opportunities but will also put pressure on government regulatory and oversight systems.
13. In 2008, Uganda adopted a new National Oil and Gas Policy in line with international practices in all important respects and calls for the establishment of several new institutions and structures.4 These include a Directorate of Petroleum to set and monitor policy; a Petroleum Authority to regulate the sector; a national oil company to hold the country’s direct investment in oil projects; and a Petroleum Fund under the management of the Central Bank to stabilize the revenue flow to the budget. Amendments to the Petroleum Act are being prepared, and revisions to the revenue code related to the fiscal regime for oil are under preparation. A division within the Ministry of Energy – the Petroleum Exploration and Production Department (PEPD) – has been established to manage developments in the petroleum sector.
14. Beyond governance and management issues, large-‐scale oil production raises a number of trade-‐relevant issues (World Bank 2010). First, Uganda’s oil resources are located in ecologically sensitive and valuable areas, as several of the exploration areas are within or border on national parks; this may have important implications for the environment and the country’s ability to get its tourism sector off the ground. The general framework for management of Uganda’s environmental resources is set out in the 1995 National Environment Act, which created the National Environment Management Authority (NEMA). This act also sets out the process by which companies are required to conduct Environmental Impact Assessments (EIAs), administered by NEMA. However, NEMA has little capacity to analyze EIAs and monitor the implementation of environmental requirements.
4 The Government of Uganda is receiving support from Norway under an Oil for Development Program to improve the institutional framework for management of oil resources.
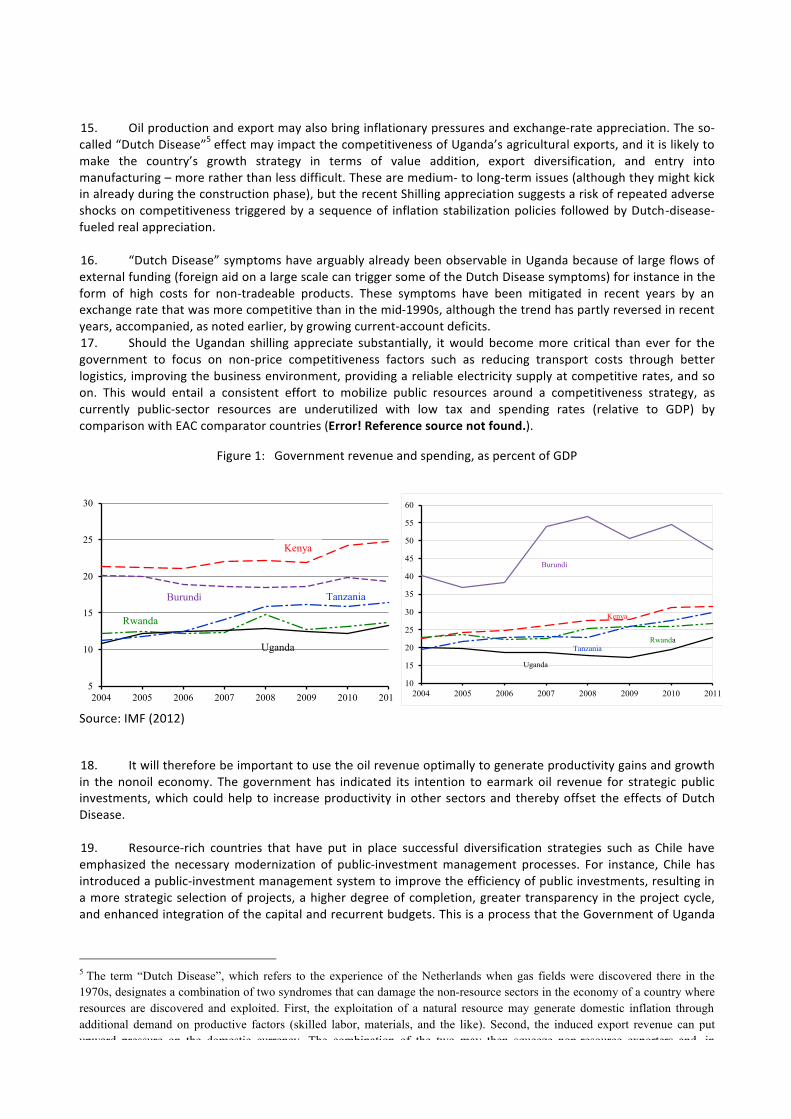
27
15. Oil production and export may also bring inflationary pressures and exchange-‐rate appreciation. The so-‐called “Dutch Disease”5 effect may impact the competitiveness of Uganda’s agricultural exports, and it is likely to make the country’s growth strategy in terms of value addition, export diversification, and entry into manufacturing – more rather than less difficult. These are medium-‐ to long-‐term issues (although they might kick in already during the construction phase), but the recent Shilling appreciation suggests a risk of repeated adverse shocks on competitiveness triggered by a sequence of inflation stabilization policies followed by Dutch-‐disease-‐fueled real appreciation.
16. “Dutch Disease” symptoms have arguably already been observable in Uganda because of large flows of external funding (foreign aid on a large scale can trigger some of the Dutch Disease symptoms) for instance in the form of high costs for non-‐tradeable products. These symptoms have been mitigated in recent years by an exchange rate that was more competitive than in the mid-‐1990s, although the trend has partly reversed in recent years, accompanied, as noted earlier, by growing current-‐account deficits. 17. Should the Ugandan shilling appreciate substantially, it would become more critical than ever for the government to focus on non-‐price competitiveness factors such as reducing transport costs through better logistics, improving the business environment, providing a reliable electricity supply at competitive rates, and so on. This would entail a consistent effort to mobilize public resources around a competitiveness strategy, as currently public-‐sector resources are underutilized with low tax and spending rates (relative to GDP) by comparison with EAC comparator countries (Error! Reference source not found.).
Figure 1: Government revenue and spending, as percent of GDP
5
10
15
20
25
30
2004 2005 2006 2007 2008 2009 2010 2011
Kenya
Burundi Tanzania
Rwanda
Uganda
10
15
20
25
30
35
40
45
50
55
60
2004 2005 2006 2007 2008 2009 2010 2011
Kenya
Burundi
TanzaniaRwanda
Uganda
Source: IMF (2012)
18. It will therefore be important to use the oil revenue optimally to generate productivity gains and growth in the nonoil economy. The government has indicated its intention to earmark oil revenue for strategic public investments, which could help to increase productivity in other sectors and thereby offset the effects of Dutch Disease.
19. Resource-‐rich countries that have put in place successful diversification strategies such as Chile have emphasized the necessary modernization of public-‐investment management processes. For instance, Chile has introduced a public-‐investment management system to improve the efficiency of public investments, resulting in a more strategic selection of projects, a higher degree of completion, greater transparency in the project cycle, and enhanced integration of the capital and recurrent budgets. This is a process that the Government of Uganda
5 The term “Dutch Disease”, which refers to the experience of the Netherlands when gas fields were discovered there in the 1970s, designates a combination of two syndromes that can damage the non-resource sectors in the economy of a country where resources are discovered and exploited. First, the exploitation of a natural resource may generate domestic inflation through additional demand on productive factors (skilled labor, materials, and the like). Second, the induced export revenue can put upward pressure on the domestic currency. The combination of the two may then squeeze non-resource exporters and, in extreme cases, “de-industrialize” the country.
28
should consider before oil money becomes available, as putting in place the right institutional safeguards to ensure value for money will take time and sustained capacity-‐building efforts.
20. Finally, the government may also want to consider how and if the country’s oil and gas resources can help to increase energy availability and to reduce its cost. While market forces should determine domestic pricing of petroleum products, it is nonetheless important to promote a competitive market so that efficiency gains are passed on to the consumers.
1.2 MAINSTREAMING TRADE IN UGANDA’S DEVELOPMENT STRATEGY: DTIS IMPLEMENTATION AND IMPACT
21. Trade has been a leading sector driving Uganda’s development. Between 1990 and the present, exports have grown six fold. In the period since 2006 (when the DTIS was first presented), exports have grown at nearly 13 percent per year, and the trade ratio as a share of GDP has risen from 39% to 58%, powering growth in the economy.
22. Policy changes, institutional progress, and development assistance have clearly played a role. For example, Uganda, when it joined the EAC, has progressively phased in the common external tariff. It has adopted substantial reforms of its customs, and managed to reduce paperwork for both importing and exporting activities. Finally, development assistance has averaged about [$500] annually since 2000.
1.2.1 TRADE IN THE POLICY PROCESS
23. If there has been one organizing objective of the aid for trade initiative, it is that governments in developing countries and donors alike have paid too little attention to using trade as an engine of growth, and that they have to give greater weight to trade into national policies and programs. Indeed, after the wave of trade liberalizations in the early 1990s, trade had largely fallen off the development agenda in the late 1990s. With the launch of the Doha Round in 2001, “mainstreaming trade” can be found with increasing frequency as an objective of country strategies of donors. In part, this responded to developing countries’ concerns that DDA-‐driven liberalization was insufficient for them to benefit from a multilateral trade deal; equal attention had to be paid for overcoming supply side constraints.
24. This concern reached a crescendo in the wake of the 2005 WTO Ministerial Meeting in Hong Kong, when aid for trade provisions were inserted into the ministerial declaration and a task force was set up the WTO to outline a program of monitoring. The WTO’s Aid for Trade taskforce reported in mid-‐2006, and proposed a definition of aid for trade and, together with the OECD, set up a monitoring system. Soon after, the donors augmented the resources of the old Integrated Framework program, and established the Enhanced Integrated Framework for LDCs in Geneva in May 2007. Since then, the WTO has hosted three “Global Aid for Trade Reviews” in Geneva, with the purpose of tracking progress in the mainstreaming of trade. Meanwhile, in Uganda, these same forces were laying the foundation for a greater effort to raise the profile of trade in the halls of decision-‐making.
Vision 2040 and National Development Plan 25. Uganda embeds trade policy formulation in an overall framework for policy making that weaves short-‐term action plans into a long term strategic approach to national development. Within a long-‐term vision that spans a 30 years period, with the objective of promoting Uganda to middle-‐income status by 2017, the overarching programmatic formulation has been the National Development Plan.
26. The latest NDP was produced in 2010 and covers the period 2010/11-‐2013/14. This document supersedes earlier comprehensive policy documents that were formally known as Poverty Eradication Action Plans (PEAPs). These had been produced on a three year cycle beginning in 1997. These were often linked to the Poverty Reduction Strategy Papers written to the donor community as part of the aid process. 27. In a chapter on Trade Development, the latest NDP contained a broader assessment of trade issues than had been the case in the earlier PEAPs. It outlined several constraints to trade growth: weak institutional framework (in which the PPP and SME policy framework were lacking as well as inadequate commercial laws), NTBs, high costs and limited access to business finance, shortages of entrepreneurial skills, inadequate infrastructure (both physical and standards), and inadequate data.
29
28. The NDP trade section sets out general objectives and associated strategies for implementation. Objectives include “improve the ‘doing business’ environment”, “nurture the private sector”, and “negotiate better market access”, and “improve the stock and quality of trade infrastructure” (particularly the major corridors), promoting “synergies between the production and trade sectors”; and “provide equal opportunity to women and other disadvantaged groups” (NDP, 166-‐169) . The NDP also contains a general framework, objectives and strategies for Uganda’s participation in EAC protocols (NDP, 340ff.).
29. Though the NDP came out in 2010, the trade development section was heavily informed by the National Trade Policy of August 2007 and its companion implementation strategy, the National Trade Sector Development Plan 2008/9-‐2012/13.
National Trade Policy and National Trade Sector Development Plan 2008/9-‐2012/13 30. Developing the National Trade Policy (NTP) was intended to remedy several shortcomings in the government’s treatment of trade prior to 2007. First, past efforts were seen as focusing excessively on export trade with little explicit effort to promote domestic trade – and this in turn was seen to lead to weak linkages between domestic and international trade, and a lack of attention to supply side constraints. Second, the NTP was designed to remedy a perceived lack of coordinated, complementary and support policies necessary for the effectiveness of trade policies. “For example, currently fiscal policy puts a lot of emphasis on revenue generation at the expense of trade facilitation and private sector development.” Trade was insufficiently integrated with sectoral policies in the production sectors. Third, an “overemphasis on liberalization based on the Washington consensus appears to have led to failure to realize that the process requires broader approach...”, one that entailed a more active government role in development of capacity to trade, especially enhancing private sector competitiveness. This in turn resulted in the underfunding of the Ministry responsible for trade, leaving it unable to give policy guidance and monitor implementation of activities under her mandate at the national level and through the District staff at the decentralized level. Finally, district offices charged with providing services to the private sector knew virtually nothing about regional and international trade agreements that could otherwise create new opportunities for businesses. Moreover, there were no forums to discuss trade policies with the private sector and other stakeholders, or to involve them in the Uganda Export Promotion Board (UEPB) and Uganda National Bureau of Standards (UNBS).
31. To fill these gaps, the government began preparing a trade policy strategy in 2004. Under the auspices of the Inter-‐Institutional Trade Committee (IITC), MTTI commissioned a consultant study to prepare an analysis of ways to remedy these perceive shortcomings. The background paper was discussed extensively within the Ministry and with other stakeholders. Out of this process came the first draft Trade Policy – and subsequent extensive consultation within government and with the private sector. This was discussed in October 2005 at the 1st National Trade Sector Review Conference, undertake with the support of the EU (an aid for trade effort that pre-‐dated the Hong Kong Ministerial of December that year). The process culminated in the 2nd National Trade Sector Review Conference (NTSRC) in 2006. 32. In parallel, with financing from the Integrated Framework Trust Fund (a donor financed program administered by the UNDP and precursor to the Enhanced Integrated Framework set up on 2007), the World Bank began a Diagnostic Trade Integration Study (DTIS) in late 2005. The DTIS mission produced a 300 page, two volume trade diagnosis. The DTIS team held consultations with the government, culminating in its validation conference held on October 2-‐4, 2006. These consultations and multiple reviews were taken into account in the preparation of the formal draft of the NTP that was subsequently submitted to MTTI and then to cabinet for approval.6
33. The National Trade Policy focused on enhancing the competitiveness of Uganda’s products and services; strengthening trade institutions; trade facilitation; improving market access; providing trade/market information to the business community; developing capacity for both domestic and foreign trade; and ensuring that the gains from growth in trade are equitably shared.
34. The NTP divided policies into domestic and foreign administrative domains. Domestic policy actions included proposed strengthening of selected commercial and/or trade laws, setting up a market information 6 This process is described in Silver Ojakol, 2008.
30
system to facilitate the collection and dissemination of trade information, launching Public-‐Private Sector Partnership program, among other things. These objectives were married with particular policy interventions, including preparation of commercial laws, ensuring adequate standards, efforts to substantially reduce shortages of products and services in one part of the country when they are available in another, as well as implementation of particular sectoral interventions, such as the Marketing and Agro-‐Processing Strategy (MAPS) of the Plan for Modernization of Agriculture (PMA). Finally, the NTP set out a policy framework to review the tax system to eliminate double taxation of goods crossing internal borders, review issuance of trade licenses to ease burdens on businesses, design strategies to promote value addition, production of high-‐value-‐low volume products, and niche marketing develop and implement a National Standards Policy, promote Uganda’s participation in the global value chain by encouraging the building of domestic value chain so as to enhance specialization and inter-‐firm networks in the country, and encouraging the use of local materials in the production process.7
35. External trade was to be focused on “ensuring effective integration of the economy into the regional economy and the multilateral trading system, enhancing national capacity to take advantage of the above, while minimizing the negative effects of globalization”. This meant “ensuring that what is produced domestically can be competitively traded at international level”; using trade negotiations to gain market access; and adapting Uganda’s economy to regional and global trade integration. More specifically, these objectives were to be accomplished by establishing a strengthened National Trade Negotiations Team (NTNT) led by the Minister responsible for Trade and responsible to the Permanent Secretary. The NTNT would involve the private sector in its negotiating positions, taking into consideration the views of the Inter-‐Institutional Trade Committee (IITC). The NTP formally constituted the IITC, with its representatives from the private sector, public sector, civil society and the academia, into the key policy formulating body producing recommendations to the NTNT, Ministry, and economic cabinet. It would maintain Trade Officers in Embassies/Missions that participate in various trade negotiations or are located in countries and/or regions in which Uganda has strategic trade interests. In parallel, the NTP established a Trade, Debt and Finance Committee to ensure reflection of the importance of trade in macroeconomic and monetary policies. 36. Finally, the NTP sought to create synergies and complementarities with other ministries, including linkages with other ministries, District Commercial Offices, and the private sector. Central to this was the formal establishment of the Inter-‐Institutional Trade Committee (IITC) under MTTI (see below), with the purposes of “deliberating on all trade and trade-‐related matters and make recommendations to the Ministry” (p. 19). This ranged from formulating policy and measures to enhance use of electronic commerce, protect intellectual property, encourage technological acquisition, improve learning of international languages, pursuing “macroeconomic policies and practices consistent with the country’s objective of increasing exports and enhancing competitiveness”, and promote SMEs. In realizing these synergies, the Ministry was to collaborate with all other relevant ministries.8
National Trade Sector Development Plan (NTSDP) 37. The first National Trade Sector Development Plan is the implementation plan for the NTP and covered 2008/9 – 2012/13. The Plan gives more detail on the policy actions contained in the National Trade Policy and gives a schedule of implementation plus the required financial resources. Overall, the cost of the Plan is Ushs 30.3771 billion (US$12.2 million9) over five years. The Plan identifies 13 thematic areas for intervention, including value chain management and value addition, private sector development, enhancement of trade negotiations capacity, pursuing regional bilateral, and multilateral arrangements, trade facilitation, development of entrepreneurial skills, promotion of electronic commerce, public-‐private partnership approach in trade policy, protection of intellectual property rights, and technology transfer.
38. The National Trade Sector Development Plan 2008/9-‐2012/13 identifies and sequences activities for implementation of the National Trade Policy over the next five years. It defines the short-‐, medium-‐ and long-‐term quantitative and qualitative targets, basic activities, and priority activities of the sector. Framed around three implementation matrices, collectively they show the scheduling of activities, implementation agencies, monitoring and evaluation framework and well as the monitoring and evaluation matrix which has specific annualized targets, and the costing matrix.
7 National Trade Policy, 2007: 10-14. 8 National Trade Policy, 2007: 14-21. 9 At exchange rates prevailing in June 2012, namely US$1 = UGX 2,483.
31
39. An annualized matrix of implementation brings out specific policy actions as contained in the National Trade Policy, points out activities to operationalize the respective policy actions, and a sequencing of activities by financial year taking into account logical flow and prioritization. A second matrix, drawn from the first, clearly brings out the instructional arrangements for implementation. It points out both the lead agency for implementation and the collaborating agency for implementation. This has been done taking into account institutional mandates and expertise. The matrix clearly brings out the important role of complementarities and synergies not only at policy level, but also at institutional level. The matrix also clearly brings out the public-‐private partnership approach which the Policy institutionalizes. These are key element of the National Trade Policy.
40. The Monitoring and Evaluation Framework Matrix specifies targets and responsible agency assigned the task of monitoring and reporting. Achieving these objectives began with the division and re-‐organization of the Ministry of Tourism, Trade and Industry in 2011, by dividing it into two -‐-‐ the Ministry of Trade, Industry and Cooperatives and the Ministry of Tourism, Wildlife and Heritage.
IITC and CICs 41. The Inter-‐Institutional Committee was established in the late 1990s under JITAP in MTTI to improve inter-‐ministerial coordination and establish a dialogue with the private sector. The Inter-‐Institutional Trade Committee (IITC) served as Uganda’s focal point for stakeholder consultations on issues of trade. The IITC is composed of some 50-‐60 representatives of private sector associations, Government ministries whose mandate intersect with the trade sector, civil society and academia.10 The IITC has sub-‐committees focusing on the WTO, ACP-‐EU, Regional Integration and Bilateral Initiatives, and Domestic Initiatives. In the early years, it suffered from lack of capacity, limited funding (primarily from donors), and limited scope of its mandate in that it was set up to focus on WTO issues.11
42. With the publication of the World Bank’s Doing Business Report, the Government created a new committee called, Competitiveness and Investment Climate Strategy (CICS). The CICS steering committee, chaired by the PSs for MTIC and MoFED, provides policy leadership to the group and is intended to be the channel into higher echelons of policy making. In practice, the CICS has focused primarily on private sector issues – including business licenses, commercial laws, etc. – and has spent little time on trade policy. Its primary guide to action appears to be the Doing Business surveys, a menu with only a half dozen, relatively minor issues associated with trade facilitation.12
The Planning Process has “Mainstreamed” Trade 43. There can be little doubt that, in the parlance of the development community, trade has “been mainstreamed” -‐ if by that we mean incorporation into the planning process. Said differently, the last half dozen years have seen a marked increase in government effort to promote trade. This took the form of high level concern for promoting trade directly and efforts to attack constraints to expanding trade. Indications of this abound:
10 Meeting attendees in 2008 included representatives of: Private Sector Foundation Uganda; Kampala City Traders Association; Uganda Manufacturers Association; Uganda Network of Businesses; Uganda National Farmers Federation; Uganda National Chamber of Commerce and Industry; SEATINI; National Agriculture Research Organization; Competitiveness and Investment Climate Strategy; Uganda Investment Authority; Uganda Revenue Authority; Uganda National Bureau of Standards; Uganda Exports Promotion Board; Makerere University Business School; Ministry of Agriculture Animal Industry and Fisheries; Ministry of Finance Planning Economic Development; Ministry of Information and Communication Technology; Ministry of Internal Affairs; Uganda Communications Commission; Cotton Development Organization; Uganda Local Governments Association; Ministry of Local Government; Uganda Law Reform Commission; Ministry of East African Community Affairs 11 See Nimrod Waniala “Trade Policy in Uganda” paper delivered at the PSF/Trade Policy Project, National Conference; November 29-30, 2000. 12 See the Minutes of the CICS, and the several “Progress Reports on the Implementation of the Doing Business in Uganda Reform Memo, 2009”.
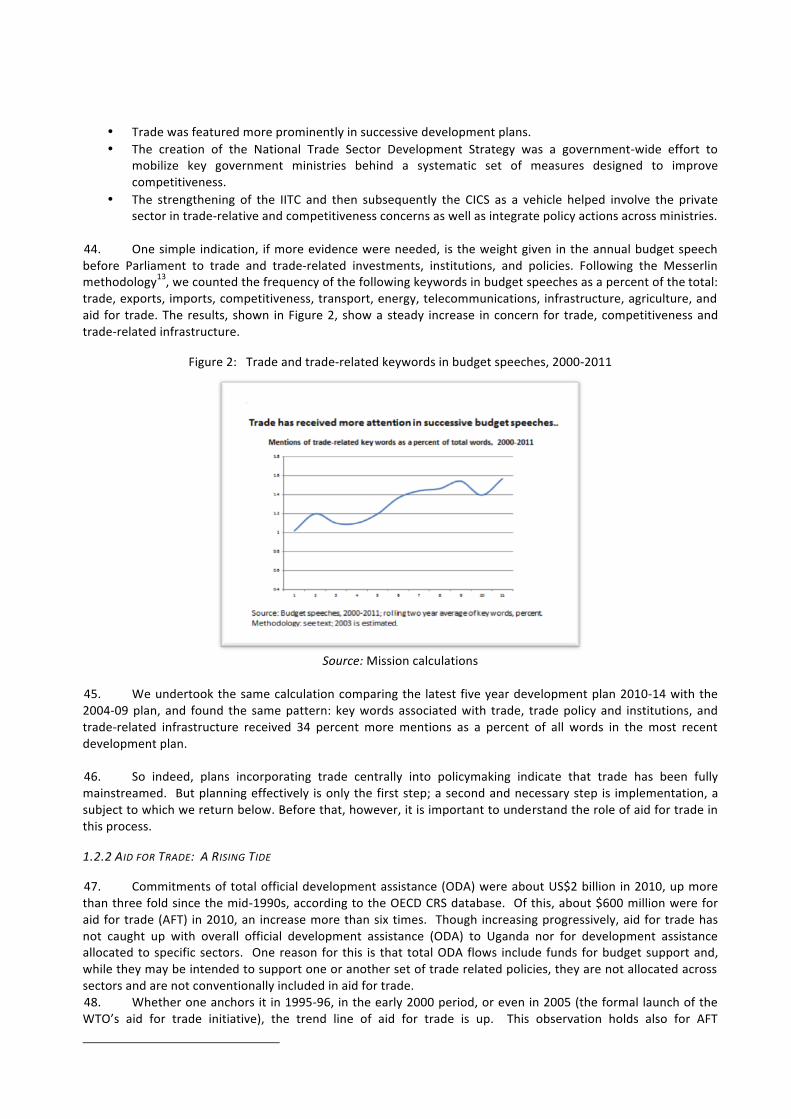
32
• Trade was featured more prominently in successive development plans. • The creation of the National Trade Sector Development Strategy was a government-‐wide effort to
mobilize key government ministries behind a systematic set of measures designed to improve competitiveness.
• The strengthening of the IITC and then subsequently the CICS as a vehicle helped involve the private sector in trade-‐relative and competitiveness concerns as well as integrate policy actions across ministries.
44. One simple indication, if more evidence were needed, is the weight given in the annual budget speech before Parliament to trade and trade-‐related investments, institutions, and policies. Following the Messerlin methodology13, we counted the frequency of the following keywords in budget speeches as a percent of the total: trade, exports, imports, competitiveness, transport, energy, telecommunications, infrastructure, agriculture, and aid for trade. The results, shown in Figure 2, show a steady increase in concern for trade, competitiveness and trade-‐related infrastructure.
Figure 2: Trade and trade-‐related keywords in budget speeches, 2000-‐2011
Source: Mission calculations
45. We undertook the same calculation comparing the latest five year development plan 2010-‐14 with the 2004-‐09 plan, and found the same pattern: key words associated with trade, trade policy and institutions, and trade-‐related infrastructure received 34 percent more mentions as a percent of all words in the most recent development plan.
46. So indeed, plans incorporating trade centrally into policymaking indicate that trade has been fully mainstreamed. But planning effectively is only the first step; a second and necessary step is implementation, a subject to which we return below. Before that, however, it is important to understand the role of aid for trade in this process.
1.2.2 AID FOR TRADE: A RISING TIDE
47. Commitments of total official development assistance (ODA) were about US$2 billion in 2010, up more than three fold since the mid-‐1990s, according to the OECD CRS database. Of this, about $600 million were for aid for trade (AFT) in 2010, an increase more than six times. Though increasing progressively, aid for trade has not caught up with overall official development assistance (ODA) to Uganda nor for development assistance allocated to specific sectors. One reason for this is that total ODA flows include funds for budget support and, while they may be intended to support one or another set of trade related policies, they are not allocated across sectors and are not conventionally included in aid for trade. 48. Whether one anchors it in 1995-‐96, in the early 2000 period, or even in 2005 (the formal launch of the WTO’s aid for trade initiative), the trend line of aid for trade is up. This observation holds also for AFT
13 This follows a methodology devised by Patrick Messerlin in work for the OECD.
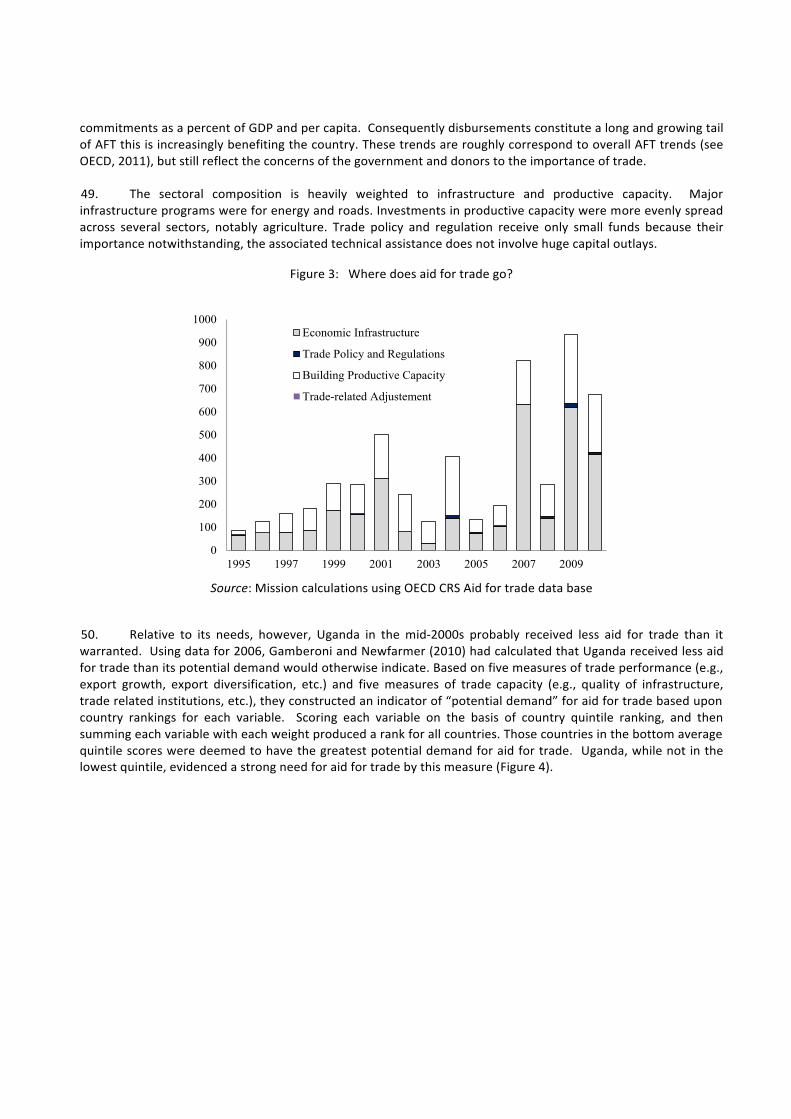
33
commitments as a percent of GDP and per capita. Consequently disbursements constitute a long and growing tail of AFT this is increasingly benefiting the country. These trends are roughly correspond to overall AFT trends (see OECD, 2011), but still reflect the concerns of the government and donors to the importance of trade.
49. The sectoral composition is heavily weighted to infrastructure and productive capacity. Major infrastructure programs were for energy and roads. Investments in productive capacity were more evenly spread across several sectors, notably agriculture. Trade policy and regulation receive only small funds because their importance notwithstanding, the associated technical assistance does not involve huge capital outlays.
Figure 3: Where does aid for trade go?
0
100
200
300
400
500
600
700
800
900
1000
1995 1997 1999 2001 2003 2005 2007 2009
Economic Infrastructure
Trade Policy and Regulations
Building Productive Capacity
Trade-related Adjustement
Source: Mission calculations using OECD CRS Aid for trade data base
50. Relative to its needs, however, Uganda in the mid-‐2000s probably received less aid for trade than it warranted. Using data for 2006, Gamberoni and Newfarmer (2010) had calculated that Uganda received less aid for trade than its potential demand would otherwise indicate. Based on five measures of trade performance (e.g., export growth, export diversification, etc.) and five measures of trade capacity (e.g., quality of infrastructure, trade related institutions, etc.), they constructed an indicator of “potential demand” for aid for trade based upon country rankings for each variable. Scoring each variable on the basis of country quintile ranking, and then summing each variable with each weight produced a rank for all countries. Those countries in the bottom average quintile scores were deemed to have the greatest potential demand for aid for trade. Uganda, while not in the lowest quintile, evidenced a strong need for aid for trade by this measure (Figure 4).
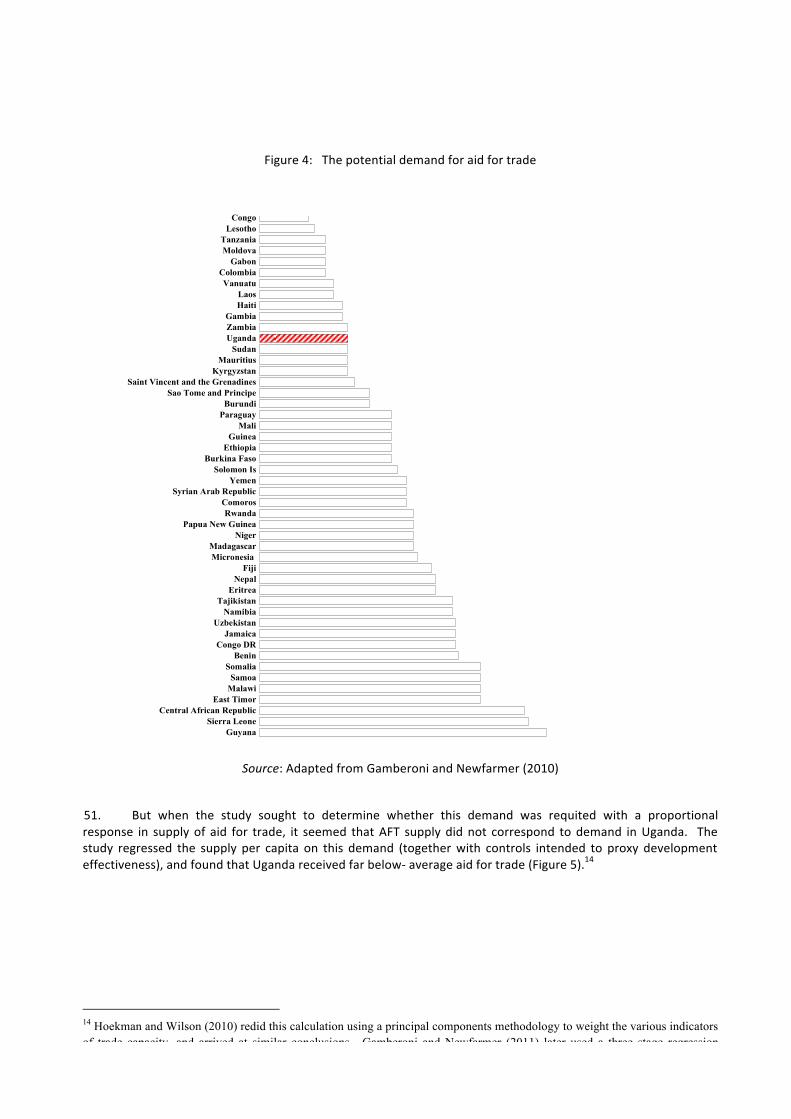
34
Figure 4: The potential demand for aid for trade
GuyanaSierra Leone
Central African RepublicEast Timor
MalawiSamoa
SomaliaBenin
Congo DRJamaica
UzbekistanNamibia
TajikistanEritrea
NepalFiji
MicronesiaMadagascar
NigerPapua New Guinea
RwandaComoros
Syrian Arab RepublicYemen
Solomon IsBurkina Faso
EthiopiaGuinea
MaliParaguay
BurundiSao Tome and Principe
Saint Vincent and the GrenadinesKyrgyzstan
MauritiusSudan
UgandaZambiaGambia
HaitiLaos
VanuatuColombia
GabonMoldovaTanzania
LesothoCongo
Source: Adapted from Gamberoni and Newfarmer (2010)
51. But when the study sought to determine whether this demand was requited with a proportional response in supply of aid for trade, it seemed that AFT supply did not correspond to demand in Uganda. The study regressed the supply per capita on this demand (together with controls intended to proxy development effectiveness), and found that Uganda received far below-‐ average aid for trade (Figure 5).14
14 Hoekman and Wilson (2010) redid this calculation using a principal components methodology to weight the various indicators of trade capacity, and arrived at similar conclusions. Gamberoni and Newfarmer (2011) later used a three stage regression procedure, and once again concluded the same.
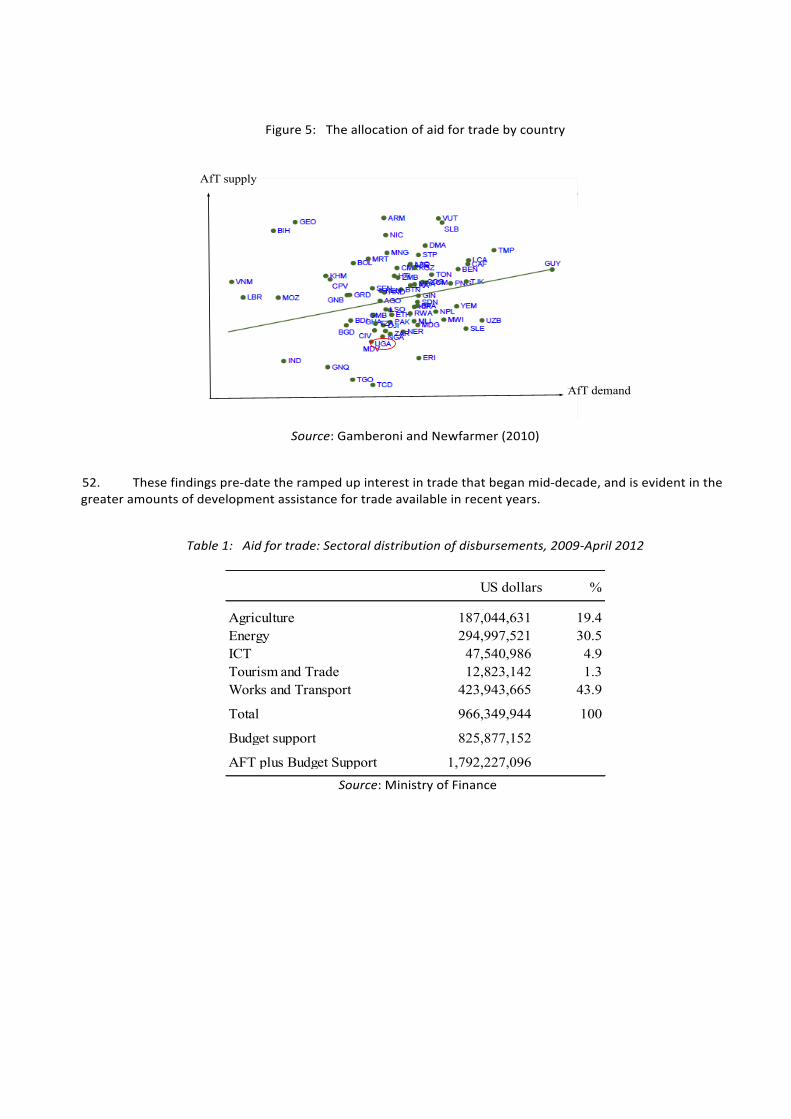
35
Figure 5: The allocation of aid for trade by country
AfT supply
AfT demand
Source: Gamberoni and Newfarmer (2010)
52. These findings pre-‐date the ramped up interest in trade that began mid-‐decade, and is evident in the greater amounts of development assistance for trade available in recent years.
Table 1: Aid for trade: Sectoral distribution of disbursements, 2009-‐April 2012
US dollars %
Agriculture 187,044,631 19.4Energy 294,997,521 30.5ICT 47,540,986 4.9Tourism and Trade 12,823,142 1.3Works and Transport 423,943,665 43.9
Total 966,349,944 100
Budget support 825,877,152
AFT plus Budget Support 1,792,227,096
Source: Ministry of Finance
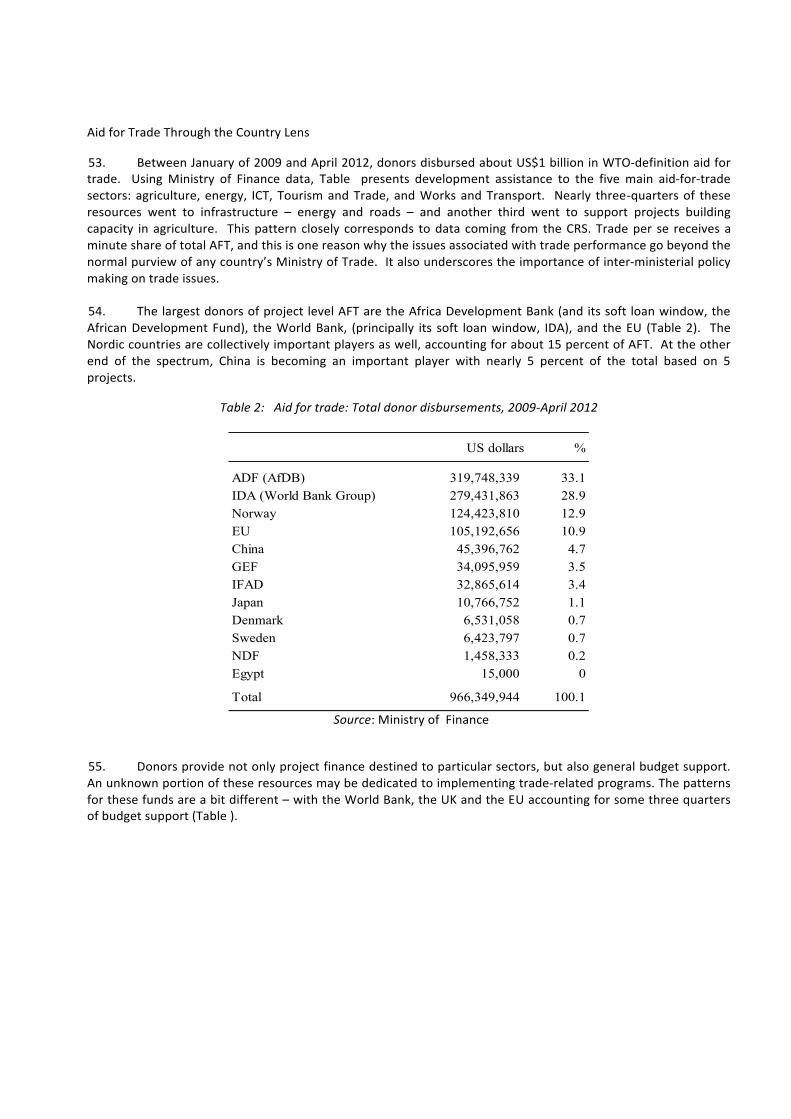
36
Aid for Trade Through the Country Lens
53. Between January of 2009 and April 2012, donors disbursed about US$1 billion in WTO-‐definition aid for trade. Using Ministry of Finance data, Table presents development assistance to the five main aid-‐for-‐trade sectors: agriculture, energy, ICT, Tourism and Trade, and Works and Transport. Nearly three-‐quarters of these resources went to infrastructure – energy and roads – and another third went to support projects building capacity in agriculture. This pattern closely corresponds to data coming from the CRS. Trade per se receives a minute share of total AFT, and this is one reason why the issues associated with trade performance go beyond the normal purview of any country’s Ministry of Trade. It also underscores the importance of inter-‐ministerial policy making on trade issues.
54. The largest donors of project level AFT are the Africa Development Bank (and its soft loan window, the African Development Fund), the World Bank, (principally its soft loan window, IDA), and the EU (Table 2). The Nordic countries are collectively important players as well, accounting for about 15 percent of AFT. At the other end of the spectrum, China is becoming an important player with nearly 5 percent of the total based on 5 projects.
Table 2: Aid for trade: Total donor disbursements, 2009-‐April 2012
US dollars %
ADF (AfDB) 319,748,339 33.1IDA (World Bank Group) 279,431,863 28.9Norway 124,423,810 12.9EU 105,192,656 10.9China 45,396,762 4.7GEF 34,095,959 3.5IFAD 32,865,614 3.4Japan 10,766,752 1.1Denmark 6,531,058 0.7Sweden 6,423,797 0.7NDF 1,458,333 0.2Egypt 15,000 0
Total 966,349,944 100.1
Source: Ministry of Finance
55. Donors provide not only project finance destined to particular sectors, but also general budget support. An unknown portion of these resources may be dedicated to implementing trade-‐related programs. The patterns for these funds are a bit different – with the World Bank, the UK and the EU accounting for some three quarters of budget support (Table ).
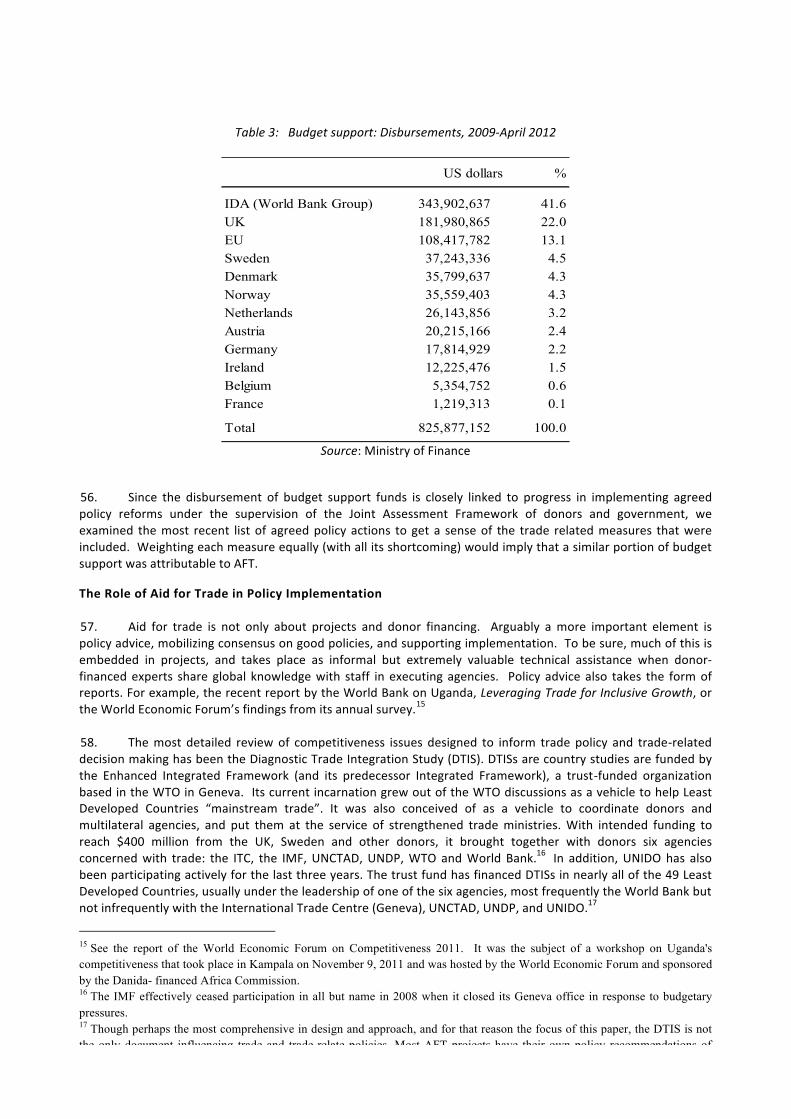
37
Table 3: Budget support: Disbursements, 2009-‐April 2012
US dollars %
IDA (World Bank Group) 343,902,637 41.6UK 181,980,865 22.0EU 108,417,782 13.1Sweden 37,243,336 4.5Denmark 35,799,637 4.3Norway 35,559,403 4.3Netherlands 26,143,856 3.2Austria 20,215,166 2.4Germany 17,814,929 2.2Ireland 12,225,476 1.5Belgium 5,354,752 0.6France 1,219,313 0.1
Total 825,877,152 100.0
Source: Ministry of Finance
56. Since the disbursement of budget support funds is closely linked to progress in implementing agreed policy reforms under the supervision of the Joint Assessment Framework of donors and government, we examined the most recent list of agreed policy actions to get a sense of the trade related measures that were included. Weighting each measure equally (with all its shortcoming) would imply that a similar portion of budget support was attributable to AFT.
The Role of Aid for Trade in Policy Implementation 57. Aid for trade is not only about projects and donor financing. Arguably a more important element is policy advice, mobilizing consensus on good policies, and supporting implementation. To be sure, much of this is embedded in projects, and takes place as informal but extremely valuable technical assistance when donor-‐financed experts share global knowledge with staff in executing agencies. Policy advice also takes the form of reports. For example, the recent report by the World Bank on Uganda, Leveraging Trade for Inclusive Growth, or the World Economic Forum’s findings from its annual survey.15
58. The most detailed review of competitiveness issues designed to inform trade policy and trade-‐related decision making has been the Diagnostic Trade Integration Study (DTIS). DTISs are country studies are funded by the Enhanced Integrated Framework (and its predecessor Integrated Framework), a trust-‐funded organization based in the WTO in Geneva. Its current incarnation grew out of the WTO discussions as a vehicle to help Least Developed Countries “mainstream trade”. It was also conceived of as a vehicle to coordinate donors and multilateral agencies, and put them at the service of strengthened trade ministries. With intended funding to reach $400 million from the UK, Sweden and other donors, it brought together with donors six agencies concerned with trade: the ITC, the IMF, UNCTAD, UNDP, WTO and World Bank.16 In addition, UNIDO has also been participating actively for the last three years. The trust fund has financed DTISs in nearly all of the 49 Least Developed Countries, usually under the leadership of one of the six agencies, most frequently the World Bank but not infrequently with the International Trade Centre (Geneva), UNCTAD, UNDP, and UNIDO.17
15 See the report of the World Economic Forum on Competitiveness 2011. It was the subject of a workshop on Uganda's competitiveness that took place in Kampala on November 9, 2011 and was hosted by the World Economic Forum and sponsored by the Danida- financed Africa Commission. 16 The IMF effectively ceased participation in all but name in 2008 when it closed its Geneva office in response to budgetary pressures. 17 Though perhaps the most comprehensive in design and approach, and for that reason the focus of this paper, the DTIS is not the only document influencing trade and trade-relate policies. Most AFT projects have their own policy recommendations of with their own list of actions (policy matrices or equivalent); moreover, reports coming from donors frequently have matrices.

38
59. The DTIS for Uganda completed in October 2006, provided a comprehensive analysis of the country’s trade performance, problems, potential and policies in two volumes. It analyzed in detail trade policy, regional issues, trade facilitation issues, standards as well as principal export products, including agricultural crops (coffee, tea, cotton), horticultural products, fish and tourism. From this was generated a matrix of policy actions presenting some 156 measures, together with notations of which agency was responsible and those that required some external assistance.
60. One measure of the effectiveness of this dimension of aid for trade is whether recommended policies met with agreement among the stakeholders, and whether they were implemented. We can do so in three ways: Implementation of the DTIS matrix, changes evident through the lens of the doing business indicators, and finally through the lens of the government’s own Annual Performance framework.
1.2.3 IMPLEMENTATION OF THE DTIS MATRIX
61. The DTIS matrix was finalized in October 2006 in a large validation workshop attended by many senior officials dealing with trade. At the meeting, while the specifics of the policy suggestions were not discussed in detail, there was broad consensus on the directions of the policy recommendations, if with considerable elaboration on some of the proposed measure and agreement to revise others.18 As a consequence, the final published matrix took a somewhat different form.
62. Since 2006, the government has undertaken many activities considered in the DTIS. The list of policy suggestion the policy matrix number 156 and span a wide array of issue areas. The EIF project unit in the Ministry of Trade Industry and Cooperatives up-‐dated the matrix to provide a status of implementation of the several actions. This had been done once before in June 2010.
63. The MTIC review of measure-‐by-‐measure implementation allowed us to get an approximate idea of the extent of implementation. We undertook an impressionistic exercise to discern where the strengths and weaknesses were in following up on policy recommendations. We gave a number to each of the recommendations based on the EIF description of the accomplishments in each categories. The scoring was simple and necessarily impressionistic:
• Fully implemented: 2 • Partially implement: 1 • No progress: 0 • No reported information: NR = 0
64. The results in Table show that an enormous amount of work has been done in the last five years. Of the 150 relevant policy recommendations (a few measures in the 2006 matrix were no longer relevant), some 94 had received high level attention and reported some progress. At the other end of the spectrum, there had been no movement in 31 of the actions. The EIF project unit in MTIC was unable to find any information for 25 of the recommendations.
65. Table uses the topic headings in the policy matrix as the basis of aggregating policy actions, so the rows may reflect the DTIS team’s conceptualization of the problems more than it does the implementing agencies responsibilities. In either case, looking at the right hand column where the analysis scales the scoring to 100 percent, some clear patterns emerge.
Table 4: DTIS action matrix implementation score card
The WTO when it does a Trade Policy Review also has a list of action items. Of late, the World Bank’s Doing Business Report has through the CICS committee spawned a more limited matrix. 18 See MTTI “The Private Sector as an Engine of Growth and Development; Making the Engine Work” Report of the Second National Trade Sector Review Conference and Diagnostic Trade Integration Study Validation Workshop” Oct. 2-4, 2006.
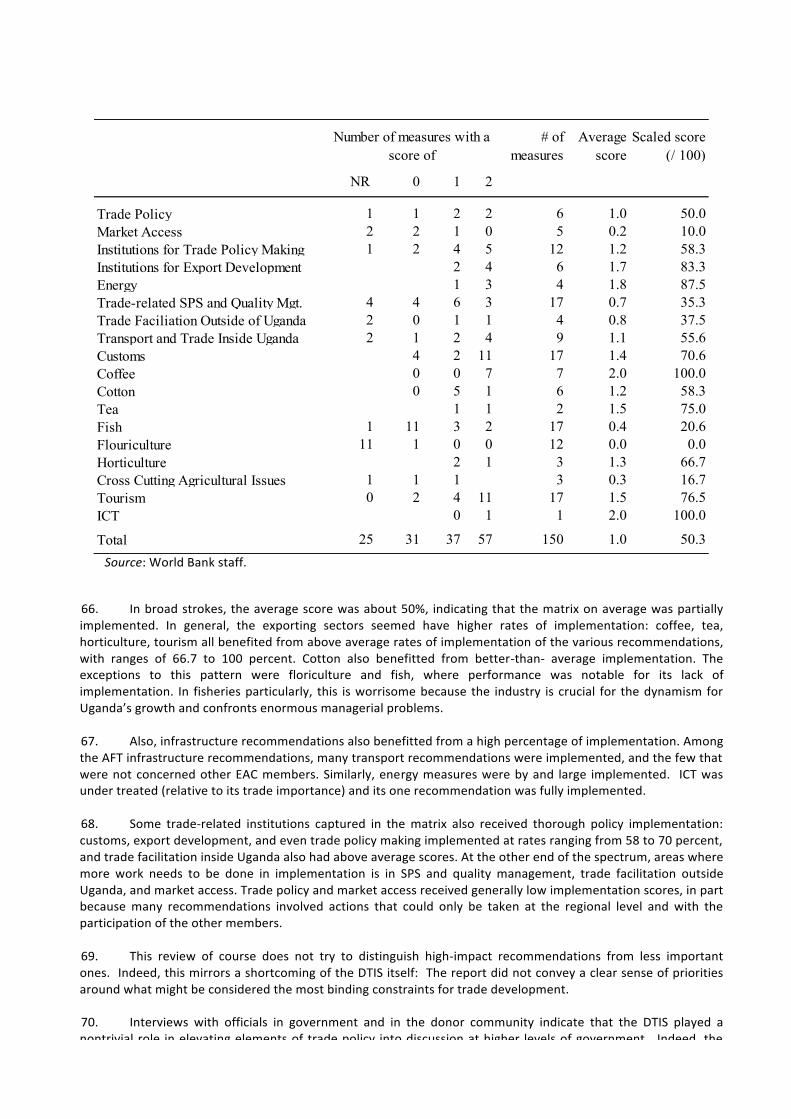
39
# of measures
Average score
Scaled score (/ 100)
NR 0 1 2
Trade Policy 1 1 2 2 6 1.0 50.0Market Access 2 2 1 0 5 0.2 10.0Institutions for Trade Policy Making 1 2 4 5 12 1.2 58.3Institutions for Export Development 2 4 6 1.7 83.3Energy 1 3 4 1.8 87.5Trade-related SPS and Quality Mgt. 4 4 6 3 17 0.7 35.3Trade Faciliation Outside of Uganda 2 0 1 1 4 0.8 37.5Transport and Trade Inside Uganda 2 1 2 4 9 1.1 55.6Customs 4 2 11 17 1.4 70.6Coffee 0 0 7 7 2.0 100.0Cotton 0 5 1 6 1.2 58.3Tea 1 1 2 1.5 75.0Fish 1 11 3 2 17 0.4 20.6Flouriculture 11 1 0 0 12 0.0 0.0Horticulture 2 1 3 1.3 66.7Cross Cutting Agricultural Issues 1 1 1 3 0.3 16.7Tourism 0 2 4 11 17 1.5 76.5ICT 0 1 1 2.0 100.0
Total 25 31 37 57 150 1.0 50.3
Number of measures with a score of
Source: World Bank staff.
66. In broad strokes, the average score was about 50%, indicating that the matrix on average was partially implemented. In general, the exporting sectors seemed have higher rates of implementation: coffee, tea, horticulture, tourism all benefited from above average rates of implementation of the various recommendations, with ranges of 66.7 to 100 percent. Cotton also benefitted from better-‐than-‐ average implementation. The exceptions to this pattern were floriculture and fish, where performance was notable for its lack of implementation. In fisheries particularly, this is worrisome because the industry is crucial for the dynamism for Uganda’s growth and confronts enormous managerial problems.
67. Also, infrastructure recommendations also benefitted from a high percentage of implementation. Among the AFT infrastructure recommendations, many transport recommendations were implemented, and the few that were not concerned other EAC members. Similarly, energy measures were by and large implemented. ICT was under treated (relative to its trade importance) and its one recommendation was fully implemented.
68. Some trade-‐related institutions captured in the matrix also received thorough policy implementation: customs, export development, and even trade policy making implemented at rates ranging from 58 to 70 percent, and trade facilitation inside Uganda also had above average scores. At the other end of the spectrum, areas where more work needs to be done in implementation is in SPS and quality management, trade facilitation outside Uganda, and market access. Trade policy and market access received generally low implementation scores, in part because many recommendations involved actions that could only be taken at the regional level and with the participation of the other members.
69. This review of course does not try to distinguish high-‐impact recommendations from less important ones. Indeed, this mirrors a shortcoming of the DTIS itself: The report did not convey a clear sense of priorities around what might be considered the most binding constraints for trade development.
70. Interviews with officials in government and in the donor community indicate that the DTIS played a nontrivial role in elevating elements of trade policy into discussion at higher levels of government. Indeed, the action matrix itself was subsumed – at least partially – into the yet more comprehensive National Trade Sector

40
Development Strategy issued in 2009 and its matrix of actions. A comparison between the two matrices reveals a strong overlap in policy recommendations. Roughly half of 156 measures in the DTIS can be found in some form in the NTDSP list of forward looking policies, if sometimes with less specificity. To be sure, the correspondence is not exact and many of the action items do not match. This is because the NTDSP actions are formulated more broadly than the DTIS; some DTIS measures are grouped implicitly in catch all phrases in the NTDSP such as “implementing the national export strategy”; and many of the sectoral actions were not included in the NTDSP, such as implementation of ASYCUDA, transit trade, fisheries policies, and trade facilitation measures.19 On the other hand, the NTDSP contains measures not covered in the DTIS, such as intellectual property rights.
71. At the same time, interviews suggested that because the DTIS did not have a champion at high levels of government, the report, though appreciated and incorporated into the thinking of practitioners and policy-‐makers, did not enjoy real ownership. The action matrix per se seems to have been comparatively marginal to the process of policy monitoring and implementation. Moreover, many of the activities included in the policy matrix were reportedly part of on-‐going AFT-‐supported projects, and these were being supervised by respective government agencies and donors as implementation occurred. To be sure, it has been up-‐dated on occasion – once in June 2010 and then again on the occasion of the DTIS Up-‐date Mission in August 2012 – it does not seem to serve the intended purpose of being an active guide for implementation monitored at regular intervals. The absence of regular monitoring, follow up and dialogue with the Ministries suggests that its role as guide to implementation has been only marginal, though possibly more important when incorporated into other matrices.
Implementing Doing Business Reforms 72. Uganda generally has done poorly by the “trading across border” measure of the Doing Business report. In 2012, it ranked 158 among some 183 countries. Moreover, its costs – as one would expect for a landlocked country – are substantially higher than Kenya and Tanzania measured by various indicators. The Doing Business team of the World Bank Group provided a report to the government in 2009. Because of its visibility and comparability with other countries, together with the efforts the World Bank invested to promote it, the government of Uganda like other countries has made improving its score a priority and used it to set some of the trade agenda.
73. In 2009, based on the Doing Business survey results, the World Bank prepared a memo suggesting six policy actions to improve it “trading across borders” score. These included:
• Allow electronic transmission of the Customs Declaration entry and attachments from Mombassa to
Kampala; • Adopt a uniform electronic customs program throughout the region; • Improve implementation of risk based inspections; • Extend working hours of border posts; • Harmonize documentation within the EAC; • Improve port infrastructure
74. In August, 2009, the government formed a task force to review the Doing Business indicators and implement the suggested reforms. By 2010, the government had made some progress on this agenda. Firms could have electronic transmission of customs declarations from Mombasa to Kampala; 80 percent of goods passing through Malaba were “green” channel with no inspection as part of a risk-‐based system; the government was testing a Comesa-‐based bond harmonization program; and Malaba was operating 24 hours and Katuna was open until 10 pm.20 The DFID-‐financed Trade Mark East Africa program was providing a steady stream of targeted assistance to the improvements of border posts.
75. Since then, the government has introduced self-‐evaluations of customs, post-‐clearance audits and the use of risk based analysis, and studied the time taken to clear at customs. It has introduced further automation of customs processes, so far 33 out of 34 border procedures are fully automated. It has introduced online transactions, enabling customs officers to operate at all hours of the day and week. In a project funded by the
19 This section is based on the analysis of Sai Taal. 20 See CICS “Steering committee Memorandum No 02/02/10 “Doing Business Reform”.

41
World Bank, it has piloted single window operations in Malaba and Katuna, and begun instituting single window operations in Busia, Mutukula and Mirama Hills boarders, as a part of region-‐wide effort to harmonize documents, uniform electronic customs programme and will allow electronic transmission of the Customs Declaration entries throughout the EAC region. It has created an Authorized Economic Operator Scheme to expedite custom processes for qualified traders. It is working with Trademark East Africa and the World Bank to up-‐grade the Uganda Revenue Authority’s customs software to ASYCUDA World. One persistent problem has been the unstable supply of electricity that inhibits operation of the interconnected system and creates unnecessary delays.21 Efforts of the government have also succeeded in improving its performance in the World Bank’s Logistics Performance Index.22
76. Enacting the recommended measures, however, has not produced the intended improvement in Uganda’s country ranking. Despite the considerable movement along this six point agenda and in the LPI, Uganda saw its ranking slip by one between 2011 and 2012, the only comparable period (Table 5). To its credit, the country has managed to improve in the all-‐ important variable of time to export and time to import. Even so, these gains in time have been offset by increases in the costs of moving containers. They may also reflect the fact that elements of the policy regime were in fact more important than those captured in the Doing Business report. These could include, for example, the rules restricting trucking competition.
Table 5: Uganda’s Doing Business performance, 2006-‐2012
2006 2007 2008 2009 2010 2011 2012
Rank - - - - - 157 158Export
Number of documents 12 12 7 7 7 7 7Time 42 42 39 39 37 37 37Cost (dollars per container) 1050 1050 2940 3090 3190 2780 2880
ImportNumber of documents 19 19 9 9 9 9 9Time 67 67 37 37 34 34 34Cost (dollars per container) 2945 2945 2990 3290 3390 2940 3015
Source: World Bank, World Development Indicators
Office of the Prime Minister: Government Performance Evaluation 77. While these reviews of the implementation of the DTIS and Doing Business recommendations are illuminating, they are not nearly as comprehensive as the government’s own performance evaluation system. The Office of the Prime Minister in 2009 established a performance evaluation office to track implementation of government programs. The office has established a relatively sophisticated tracking exercise to ascertain annually the pace of implementation. It publishes a Government Annual Performance Report, measuring what has been achieved, both in terms of outputs and outcomes, against what was planned at the beginning of the year. It relies on both the National Development Plans and sectoral plans, as well as the budget to assess the pace of implementation and results. The results framework is an elaborate process. Its purpose is to report to Cabinet where the government and its decentralized agencies have performed well or less well. It is timed to influence the planning and budgetary decisions in the subsequent financial year. The latest report was issued in January 2012, and covers the previous fiscal year July 2010-‐ June 2011.23
78. The report is refreshingly candid in its overall assessments. Some of its conclusions include: 21 See CICS “Progress Report on the Implementation of the Doing Business in Uganda Reform Memo 2009” April, 2012. 22 This index, constructed on the basis of surveys to freight forwarders, illuminates six dimensions of trade performance: customs, infrastructure, international shipments, logistics competence, tracking and tracing, and timeliness. The index shows an across the board set of improvements between 2007 and 2010 (results for Uganda in the 2012 survey have not been posted). The largest improvements are with customs and international shipments, though infrastructure and timeliness also improve. 23 Government of Uganda, Office of the Prime Minister Government Annual Performance Report 2010/11 GOU: January 2012.
42
• In its first year of implementation, the NDP achieved 60% of its annual targets; however, in 43% of all
indicators, data were not available, and thus precluded any form of assessment. • In defining a path to 2014/15 goals, 48% of NDP final targets are missing. Based solely on performance
indicators where trend data are available, 53% appear to be on track to achieve goals, a further 20% may be achieved if implementation is accelerated, and 27% are unlikely to be achieved at the current rate of implementation.
79. Two main conclusions stand out: “Firstly the NDP as a plan is not being consciously implemented. Public investments in some areas are aligned, while in other they are not. Less than planned is being invested in transport, health and energy, while more is going into security, justice, and public administration. Secondly, the macro-‐economic and financing strategies of the NDP are in divergence from economic reality in Uganda…” (2012: 6).
80. A novel feature of the OPM effort is to track agreed priority actions established in four separate constituency forums: The Presidential Investor Round Table (PRIT) brings together twice a year at the invitation of the President leading actors from the private and public sectors to put together a common agenda of policies. These are then tracked in the OPM monitoring exercise. Of the 115 actions of importance to the PIRT, 74% were found to be on track (though 3% had no data). Over 90% of the actions in the Works and Agriculture sectors were implemented, and 50% in Energy and Accountability Sectors were on track. Second, a Cabinet Retreat is held twice annually. The December 2010 meeting settled on 76 actions as especially important. Of these, 37% were achieved or on-‐track by the following June, while 46% were not. Works, Water and Environment achieved 60% of their actions; Justice Law and Order achieved none; Education did not provide any information.
81. Third, the Joint Assessment Framework (the JAF) provides a mechanism for the government and donors to agree on selected policies at the beginning of the year; implementation progress is judged at mid-‐year, and overall performance is one of the triggers of financial releases of the development partners, particularly for budget support. The JAF focuses primarily on frontline service delivery and public sector financial management. The government and JAF agreed on 94 actions at the start of the financial year; of these, about half (48%) were achieved by year-‐end. Works and Transport implemented some 67%, while the Health sector implemented only 30%.
82. Finally, after the election of the National Resistance Movement to another term in February 2011, OPM undertook an assessment of proposals in the party’s Manifesto to see which of the 167 specific proposals in the party’s Manifesto were already underway; these numbered 142. Of these, 59% were found to be making progress and being generally on-‐track against their targets, a further 13% were found to be off-‐track, while no data on progress was available for the remaining 28%. The most advanced sectors in terms of implementing existing priorities and actions were found to be the Security, ICT, and Justice, Law and Order sectors.
83. These general conclusions are relevant for the “aid for trade sectors”. Table 6 shows the summary statistics for five sectors reliant on aid for trade. In general, for these five sectors, performance equals or exceeds the reported implementation rates across the entire public sector. In a pattern evident from both the DTIS matrix and the Doing Business measures, performance is generally rated higher in infrastructure sectors than in policy and institutional reforms.
Table 6: Government performance in trade-‐related sectors
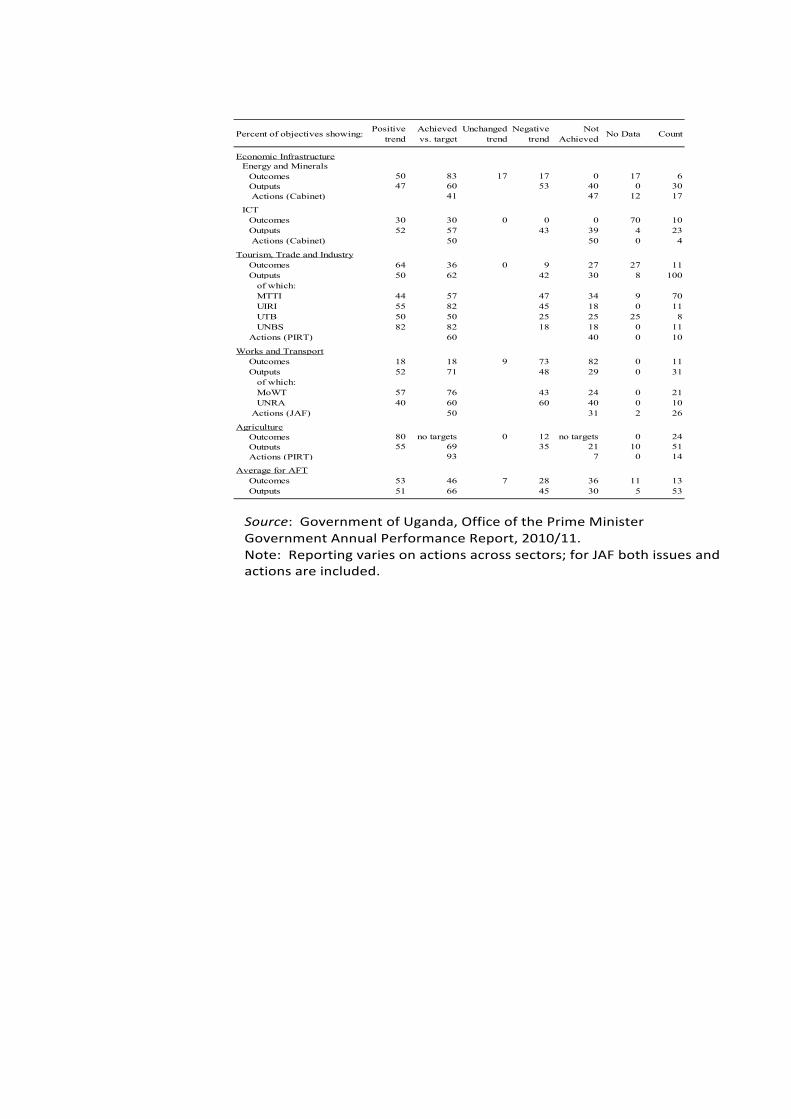
43
Percent of objectives showing: Positive trend
Achieved vs. target
Unchanged trend
Negative trend
Not Achieved No Data Count
Economic InfrastructureEnergy and Minerals
Outcomes 50 83 17 17 0 17 6 Outputs 47 60 53 40 0 30 Actions (Cabinet) 41 47 12 17
ICT Outcomes 30 30 0 0 0 70 10 Outputs 52 57 43 39 4 23 Actions (Cabinet) 50 50 0 4
Tourism, Trade and Industry Outcomes 64 36 0 9 27 27 11 Outputs 50 62 42 30 8 100 of which: MTTI 44 57 47 34 9 70 UIRI 55 82 45 18 0 11 UTB 50 50 25 25 25 8 UNBS 82 82 18 18 0 11 Actions (PIRT) 60 40 0 10
Works and Transport Outcomes 18 18 9 73 82 0 11 Outputs 52 71 48 29 0 31 of which: MoWT 57 76 43 24 0 21 UNRA 40 60 60 40 0 10 Actions (JAF) 50 31 2 26
Agriculture Outcomes 80 no targets 0 12 no targets 0 24 Outputs 55 69 35 21 10 51 Actions (PIRT) 93 7 0 14
Average for AFT Outcomes 53 46 7 28 36 11 13 Outputs 51 66 45 30 5 53
Source: Government of Uganda, Office of the Prime Minister Government Annual Performance Report, 2010/11. Note: Reporting varies on actions across sectors; for JAF both issues and actions are included.
44
Joint Assessment Framework 84. Arguably the most important, high-‐level forum for donor-‐government dialogue concerns budget support and the agreed actions that would trigger the non-‐project-‐related disbursements of funds in support of the portfolio of investments in the public investment budget. It is a useful barometer of the salience of aid of trade. The JAF since its inception has brought together some 11 donors – the World Bank, the European Union, Austria, Belgium, Denmark, Germany, Ireland, Netherlands, Norway, Sweden, and the United Kingdom – to provide collective budget support and monitor outcomes. The JAF was created to support the objective of the Government of Uganda to improve the efficiency of public spending on core public services. As such, it is a principal vehicle of donor coordination in providing developing assistance – particularly for the on-‐budget donors.
85. The agreed program of support in any years has been expressed as a matrix of the commitments the government has made to achieve both cross cutting indicator targets and actions as well as sector-‐specific indicators and actions. Cross-‐cutting issues concern the government’s commitment to six preconditions for development partner collaboration including core principles of peace and stability, democracy, human rights and rule of law / access to justice (Section I); to improving key elements of budget management (including level of funding, credibility, reporting, compliance, procurement, revenue generation, performance of civil services, corruption) (Section II); to selective targets and actions of budget performance in four sectors, health, education, transport and water and sanitation (Section III); and to mutual accountability through donor commitment to Paris Principles (Section IV).
86. In fact, only a small proportion of the indicators and actions agreed ex ante and monitored jointly by the government and donors relate to aid for trade. Of the four sectors monitored closely by donors, only transport is considered an “Aid for Trade” sector in the OECD/WTO definitions. Of the 161 agreed actions and indicators in the 200/2011 budget, 38 pertained to transport, an unusually high number. Half of the 38 were indicative targets on kilometers of roads maintained or improved to specified levels; the other half concerned actions associated with budget implementation, including levels of expenditure for subcategories of items. Budgeted expenditures for the four sectors, together with agriculture and energy, declined as a share of the overall budget from 59% to 53% in 2010/11 as expenditures on public administration and other areas increased, much associated with the election held in February 2011. Meeting transport indicative targets and actions were below average in the first two JAF periods, and above average in JAF3.
87. In the FY 2011/12 budget, the share of funding going to the four monitored sectors plus agriculture and Energy and Minerals increased to 57%, somewhat higher than the 2010/11 budget if marginally lower than the two preceding years. Driving the changes was a doubling in the size of the energy budget from 5.3% last year to 12.4 % in 2011/12.
88. Aid for trade is relatively less important to donors than are other issues, at least in this venue of donor-‐government interactions. This may indicate a different set of donor priorities in Geneva from donor priorities in-‐country. To be fair, improving budget management benefits all activities, including those subsumed in the aid for trade sectors. Still, in the dialogue on budget support – and arguably the most important that donors collectively conduct with the government -‐-‐ aid for trade is largely absent.
Donor Performance 89. A final feature of the OPM Performance Report worthy of note is the evaluation of donor performance against Paris Principles. Both the Government and many donors have formally subscribed to the OECD’s Paris Declaration to promote aid effectiveness. For FY2010/11, the government conducted its third survey of the Paris Declaration Monitoring Framework to measure progress against 15 pre-‐defined indicators. In 8 of 15 indicators, the survey revealed some improved performance, particularly in alignment with national priorities, better aid coordination, and avoidance of parallel systems for project implementation. Meanwhile, six indicators showed either no or a declining trend in performance. These included using country systems, increasing predictability of funds, and ensuring better use of result-‐oriented frameworks.
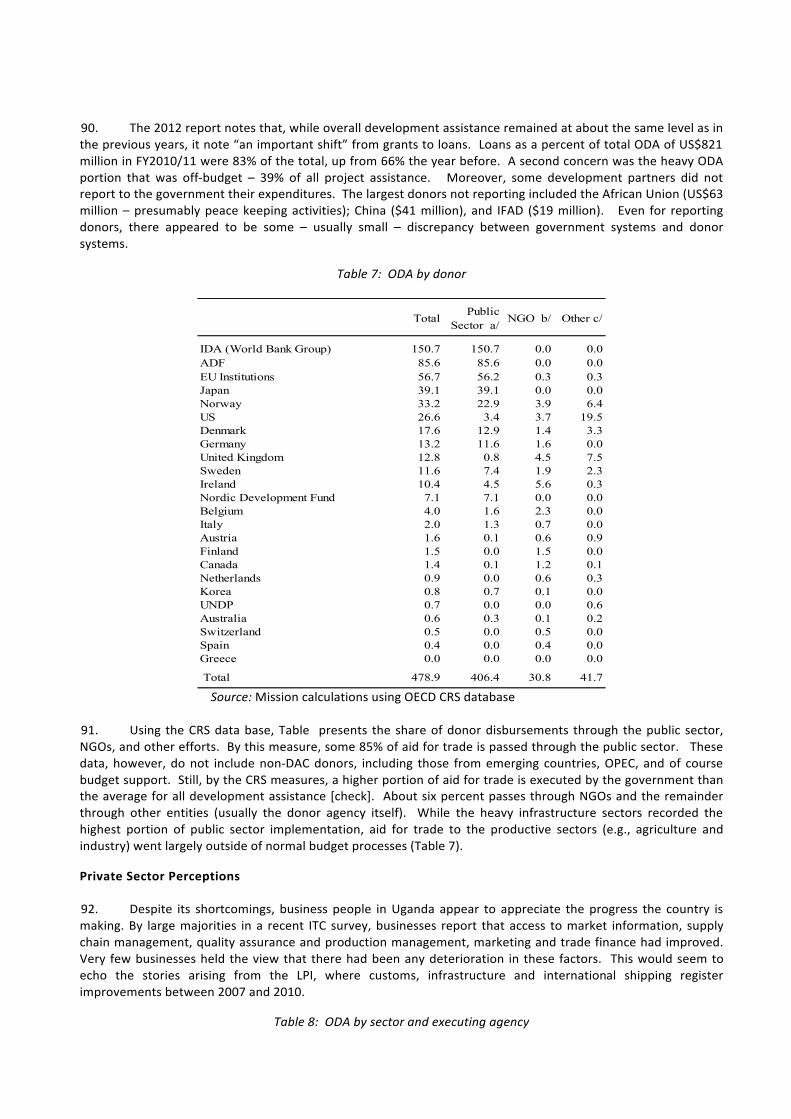
45
90. The 2012 report notes that, while overall development assistance remained at about the same level as in the previous years, it note “an important shift” from grants to loans. Loans as a percent of total ODA of US$821 million in FY2010/11 were 83% of the total, up from 66% the year before. A second concern was the heavy ODA portion that was off-‐budget – 39% of all project assistance. Moreover, some development partners did not report to the government their expenditures. The largest donors not reporting included the African Union (US$63 million – presumably peace keeping activities); China ($41 million), and IFAD ($19 million). Even for reporting donors, there appeared to be some – usually small – discrepancy between government systems and donor systems.
Table 7: ODA by donor
Total Public Sector a/ NGO b/ Other c/
IDA (World Bank Group) 150.7 150.7 0.0 0.0ADF 85.6 85.6 0.0 0.0EU Institutions 56.7 56.2 0.3 0.3Japan 39.1 39.1 0.0 0.0Norway 33.2 22.9 3.9 6.4US 26.6 3.4 3.7 19.5Denmark 17.6 12.9 1.4 3.3Germany 13.2 11.6 1.6 0.0United Kingdom 12.8 0.8 4.5 7.5Sweden 11.6 7.4 1.9 2.3Ireland 10.4 4.5 5.6 0.3Nordic Development Fund 7.1 7.1 0.0 0.0Belgium 4.0 1.6 2.3 0.0Italy 2.0 1.3 0.7 0.0Austria 1.6 0.1 0.6 0.9Finland 1.5 0.0 1.5 0.0Canada 1.4 0.1 1.2 0.1Netherlands 0.9 0.0 0.6 0.3Korea 0.8 0.7 0.1 0.0UNDP 0.7 0.0 0.0 0.6Australia 0.6 0.3 0.1 0.2Switzerland 0.5 0.0 0.5 0.0Spain 0.4 0.0 0.4 0.0Greece 0.0 0.0 0.0 0.0
Total 478.9 406.4 30.8 41.7 Source: Mission calculations using OECD CRS database
91. Using the CRS data base, Table presents the share of donor disbursements through the public sector, NGOs, and other efforts. By this measure, some 85% of aid for trade is passed through the public sector. These data, however, do not include non-‐DAC donors, including those from emerging countries, OPEC, and of course budget support. Still, by the CRS measures, a higher portion of aid for trade is executed by the government than the average for all development assistance [check]. About six percent passes through NGOs and the remainder through other entities (usually the donor agency itself). While the heavy infrastructure sectors recorded the highest portion of public sector implementation, aid for trade to the productive sectors (e.g., agriculture and industry) went largely outside of normal budget processes (Table 7).
Private Sector Perceptions 92. Despite its shortcomings, business people in Uganda appear to appreciate the progress the country is making. By large majorities in a recent ITC survey, businesses report that access to market information, supply chain management, quality assurance and production management, marketing and trade finance had improved. Very few businesses held the view that there had been any deterioration in these factors. This would seem to echo the stories arising from the LPI, where customs, infrastructure and international shipping register improvements between 2007 and 2010.
Table 8: ODA by sector and executing agency
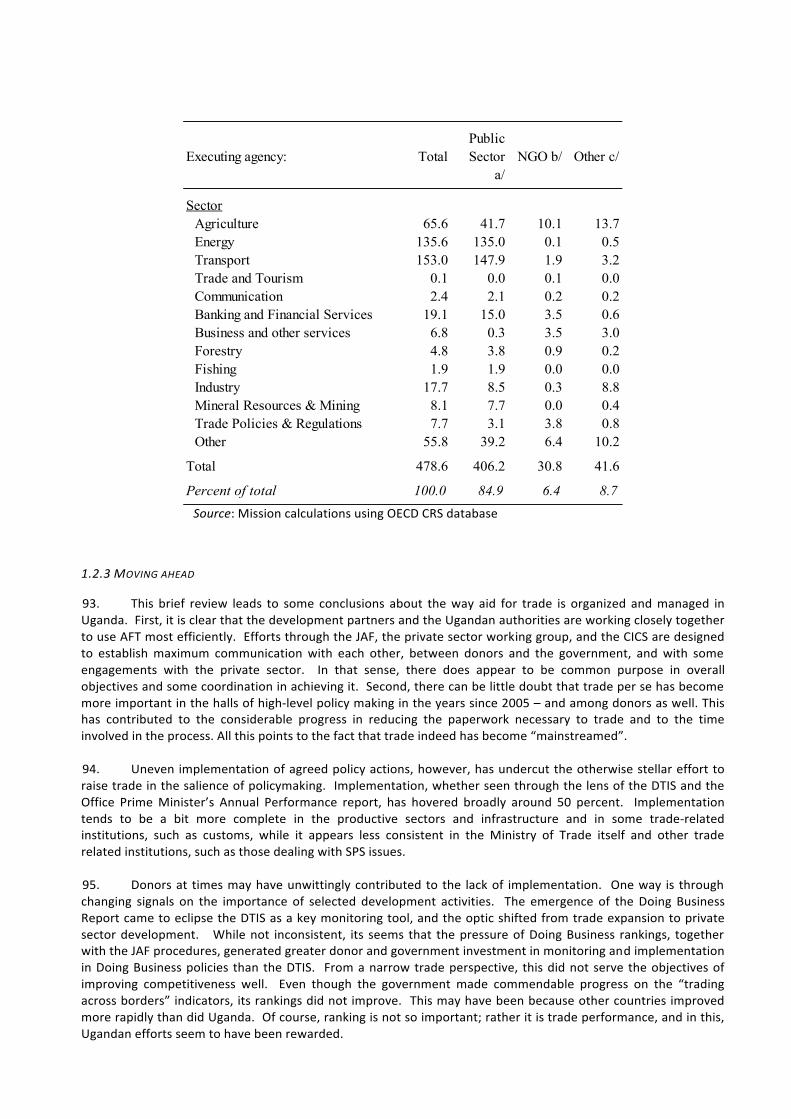
46
Executing agency: TotalPublic Sector
a/NGO b/ Other c/
SectorAgriculture 65.6 41.7 10.1 13.7Energy 135.6 135.0 0.1 0.5Transport 153.0 147.9 1.9 3.2Trade and Tourism 0.1 0.0 0.1 0.0Communication 2.4 2.1 0.2 0.2Banking and Financial Services 19.1 15.0 3.5 0.6Business and other services 6.8 0.3 3.5 3.0Forestry 4.8 3.8 0.9 0.2Fishing 1.9 1.9 0.0 0.0Industry 17.7 8.5 0.3 8.8Mineral Resources & Mining 8.1 7.7 0.0 0.4Trade Policies & Regulations 7.7 3.1 3.8 0.8Other 55.8 39.2 6.4 10.2
Total 478.6 406.2 30.8 41.6
Percent of total 100.0 84.9 6.4 8.7
Source: Mission calculations using OECD CRS database
1.2.3 MOVING AHEAD
93. This brief review leads to some conclusions about the way aid for trade is organized and managed in Uganda. First, it is clear that the development partners and the Ugandan authorities are working closely together to use AFT most efficiently. Efforts through the JAF, the private sector working group, and the CICS are designed to establish maximum communication with each other, between donors and the government, and with some engagements with the private sector. In that sense, there does appear to be common purpose in overall objectives and some coordination in achieving it. Second, there can be little doubt that trade per se has become more important in the halls of high-‐level policy making in the years since 2005 – and among donors as well. This has contributed to the considerable progress in reducing the paperwork necessary to trade and to the time involved in the process. All this points to the fact that trade indeed has become “mainstreamed”.
94. Uneven implementation of agreed policy actions, however, has undercut the otherwise stellar effort to raise trade in the salience of policymaking. Implementation, whether seen through the lens of the DTIS and the Office Prime Minister’s Annual Performance report, has hovered broadly around 50 percent. Implementation tends to be a bit more complete in the productive sectors and infrastructure and in some trade-‐related institutions, such as customs, while it appears less consistent in the Ministry of Trade itself and other trade related institutions, such as those dealing with SPS issues.
95. Donors at times may have unwittingly contributed to the lack of implementation. One way is through changing signals on the importance of selected development activities. The emergence of the Doing Business Report came to eclipse the DTIS as a key monitoring tool, and the optic shifted from trade expansion to private sector development. While not inconsistent, its seems that the pressure of Doing Business rankings, together with the JAF procedures, generated greater donor and government investment in monitoring and implementation in Doing Business policies than the DTIS. From a narrow trade perspective, this did not serve the objectives of improving competitiveness well. Even though the government made commendable progress on the “trading across borders” indicators, its rankings did not improve. This may have been because other countries improved more rapidly than did Uganda. Of course, ranking is not so important; rather it is trade performance, and in this, Ugandan efforts seem to have been rewarded.
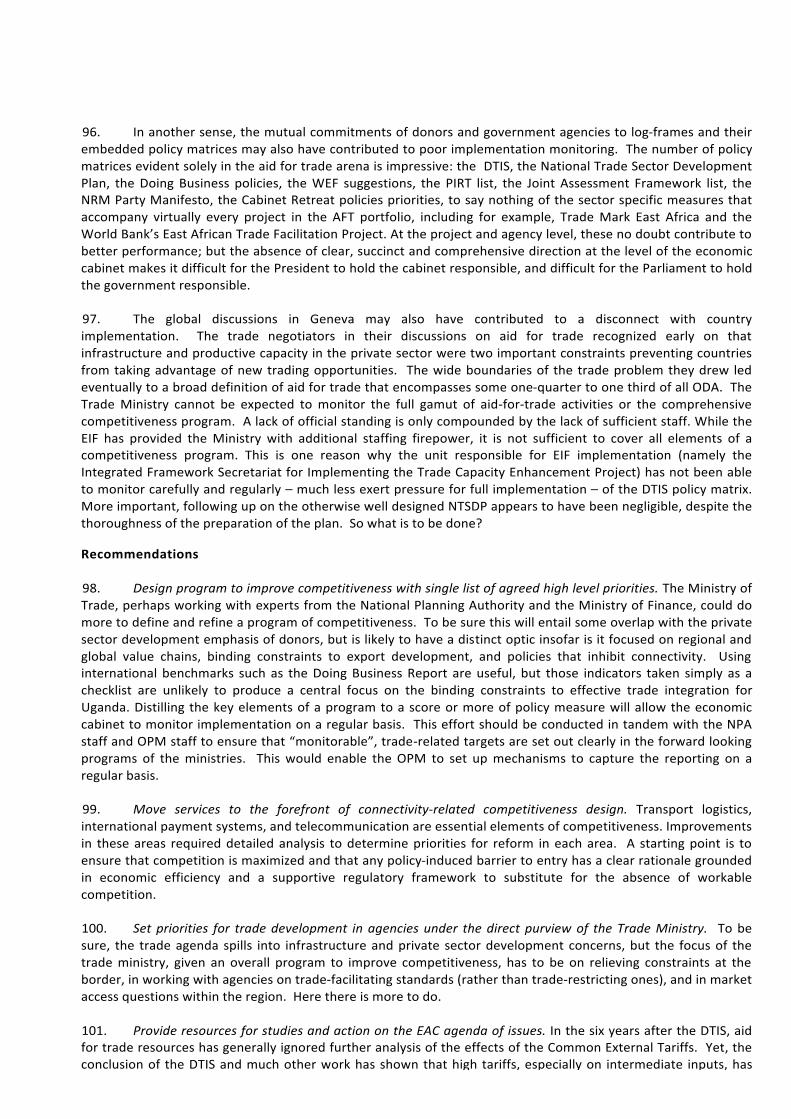
47
96. In another sense, the mutual commitments of donors and government agencies to log-‐frames and their embedded policy matrices may also have contributed to poor implementation monitoring. The number of policy matrices evident solely in the aid for trade arena is impressive: the DTIS, the National Trade Sector Development Plan, the Doing Business policies, the WEF suggestions, the PIRT list, the Joint Assessment Framework list, the NRM Party Manifesto, the Cabinet Retreat policies priorities, to say nothing of the sector specific measures that accompany virtually every project in the AFT portfolio, including for example, Trade Mark East Africa and the World Bank’s East African Trade Facilitation Project. At the project and agency level, these no doubt contribute to better performance; but the absence of clear, succinct and comprehensive direction at the level of the economic cabinet makes it difficult for the President to hold the cabinet responsible, and difficult for the Parliament to hold the government responsible.
97. The global discussions in Geneva may also have contributed to a disconnect with country implementation. The trade negotiators in their discussions on aid for trade recognized early on that infrastructure and productive capacity in the private sector were two important constraints preventing countries from taking advantage of new trading opportunities. The wide boundaries of the trade problem they drew led eventually to a broad definition of aid for trade that encompasses some one-‐quarter to one third of all ODA. The Trade Ministry cannot be expected to monitor the full gamut of aid-‐for-‐trade activities or the comprehensive competitiveness program. A lack of official standing is only compounded by the lack of sufficient staff. While the EIF has provided the Ministry with additional staffing firepower, it is not sufficient to cover all elements of a competitiveness program. This is one reason why the unit responsible for EIF implementation (namely the Integrated Framework Secretariat for Implementing the Trade Capacity Enhancement Project) has not been able to monitor carefully and regularly – much less exert pressure for full implementation – of the DTIS policy matrix. More important, following up on the otherwise well designed NTSDP appears to have been negligible, despite the thoroughness of the preparation of the plan. So what is to be done?
Recommendations 98. Design program to improve competitiveness with single list of agreed high level priorities. The Ministry of Trade, perhaps working with experts from the National Planning Authority and the Ministry of Finance, could do more to define and refine a program of competitiveness. To be sure this will entail some overlap with the private sector development emphasis of donors, but is likely to have a distinct optic insofar is it focused on regional and global value chains, binding constraints to export development, and policies that inhibit connectivity. Using international benchmarks such as the Doing Business Report are useful, but those indicators taken simply as a checklist are unlikely to produce a central focus on the binding constraints to effective trade integration for Uganda. Distilling the key elements of a program to a score or more of policy measure will allow the economic cabinet to monitor implementation on a regular basis. This effort should be conducted in tandem with the NPA staff and OPM staff to ensure that “monitorable”, trade-‐related targets are set out clearly in the forward looking programs of the ministries. This would enable the OPM to set up mechanisms to capture the reporting on a regular basis.
99. Move services to the forefront of connectivity-‐related competitiveness design. Transport logistics, international payment systems, and telecommunication are essential elements of competitiveness. Improvements in these areas required detailed analysis to determine priorities for reform in each area. A starting point is to ensure that competition is maximized and that any policy-‐induced barrier to entry has a clear rationale grounded in economic efficiency and a supportive regulatory framework to substitute for the absence of workable competition.
100. Set priorities for trade development in agencies under the direct purview of the Trade Ministry. To be sure, the trade agenda spills into infrastructure and private sector development concerns, but the focus of the trade ministry, given an overall program to improve competitiveness, has to be on relieving constraints at the border, in working with agencies on trade-‐facilitating standards (rather than trade-‐restricting ones), and in market access questions within the region. Here there is more to do.
101. Provide resources for studies and action on the EAC agenda of issues. In the six years after the DTIS, aid for trade resources has generally ignored further analysis of the effects of the Common External Tariffs. Yet, the conclusion of the DTIS and much other work has shown that high tariffs, especially on intermediate inputs, has undermined competitiveness. Yet, the cost of adding tariff protection to the already high implicit protection of
48
heavy transport costs is a drag on the economy that impedes the emergence of global value chains. For the first several years of Uganda’s membership in the EAC its producers were exempt from tariffs on selected items, many of which were intermediate inputs. Uganda’s privileged deferral of the CET is now set to expire and other members of the CET are pressing Uganda to increase its tariffs to the full duty rate. This would prejudice Uganda’s development as well as hurt the other landlocked countries of the EAC. Other regional issues also merit active Ugandan efforts in alliance with development partners and up-‐stream landlocked neighbors. These include the Port in Mombasa, the inefficient railways services through Kenya and Tanzania, and the numerous road blocks on the Northern Corridor.
102. Integrate trade concerns into the public investment program. New investment in roads, railways, airports, and telecommunication as well as intra-‐governmental communication and energy hold the key to efficient trade. However, using creation of trade potential as one optic through which to examine prospect projects would provide guidance to the Ministry of Finance and influence the context of the MTEF.
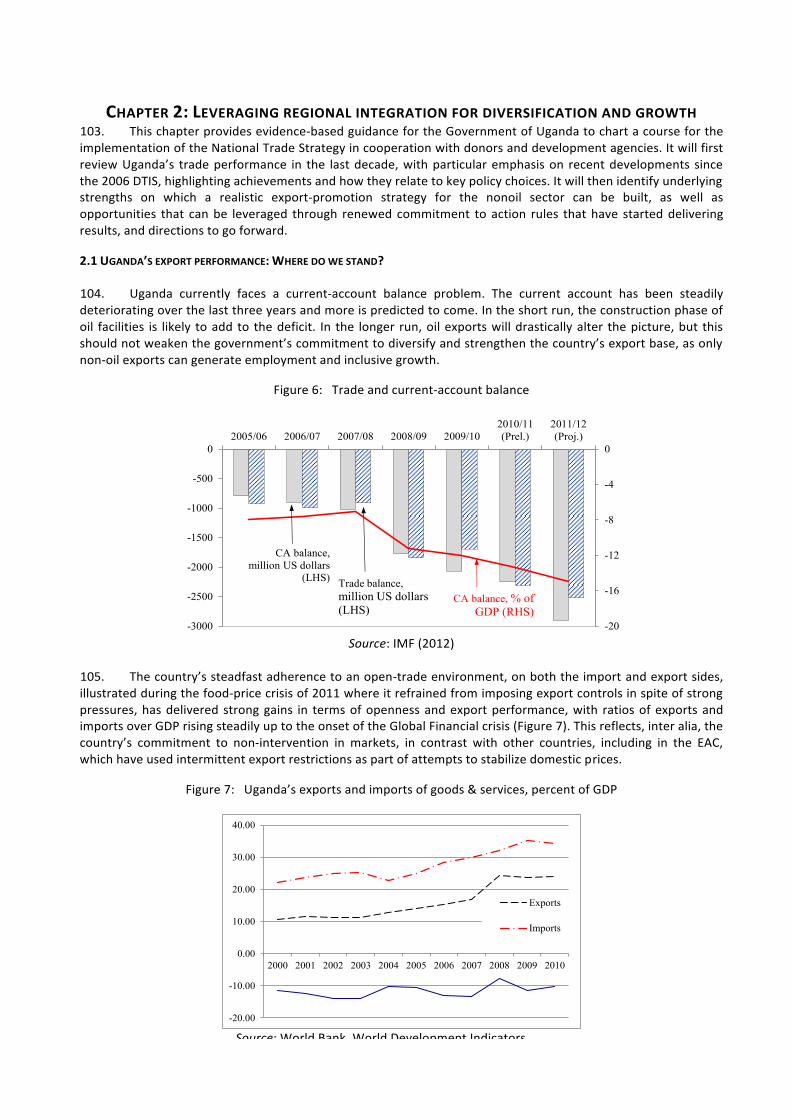
49
CHAPTER 2: LEVERAGING REGIONAL INTEGRATION FOR DIVERSIFICATION AND GROWTH 103. This chapter provides evidence-‐based guidance for the Government of Uganda to chart a course for the implementation of the National Trade Strategy in cooperation with donors and development agencies. It will first review Uganda’s trade performance in the last decade, with particular emphasis on recent developments since the 2006 DTIS, highlighting achievements and how they relate to key policy choices. It will then identify underlying strengths on which a realistic export-‐promotion strategy for the nonoil sector can be built, as well as opportunities that can be leveraged through renewed commitment to action rules that have started delivering results, and directions to go forward.
2.1 UGANDA’S EXPORT PERFORMANCE: WHERE DO WE STAND? 104. Uganda currently faces a current-‐account balance problem. The current account has been steadily deteriorating over the last three years and more is predicted to come. In the short run, the construction phase of oil facilities is likely to add to the deficit. In the longer run, oil exports will drastically alter the picture, but this should not weaken the government’s commitment to diversify and strengthen the country’s export base, as only non-‐oil exports can generate employment and inclusive growth.
Figure 6: Trade and current-‐account balance
-20
-16
-12
-8
-4
0
-3000
-2500
-2000
-1500
-1000
-500
02005/06 2006/07 2007/08 2008/09 2009/10
2010/11(Prel.)
2011/12(Proj.)
CA balance,million US dollars
(LHS) Trade balance, million US dollars (LHS)
CA balance, % of GDP (RHS)
Source: IMF (2012)
105. The country’s steadfast adherence to an open-‐trade environment, on both the import and export sides, illustrated during the food-‐price crisis of 2011 where it refrained from imposing export controls in spite of strong pressures, has delivered strong gains in terms of openness and export performance, with ratios of exports and imports over GDP rising steadily up to the onset of the Global Financial crisis (Figure 7). This reflects, inter alia, the country’s commitment to non-‐intervention in markets, in contrast with other countries, including in the EAC, which have used intermittent export restrictions as part of attempts to stabilize domestic prices.
Figure 7: Uganda’s exports and imports of goods & services, percent of GDP
-20.00
-10.00
0.00
10.00
20.00
30.00
40.00
2000 2001 2002 2003 2004 2005 2006 2007 2008 2009 2010
Exports
Imports
Source: World Bank, World Development Indicators
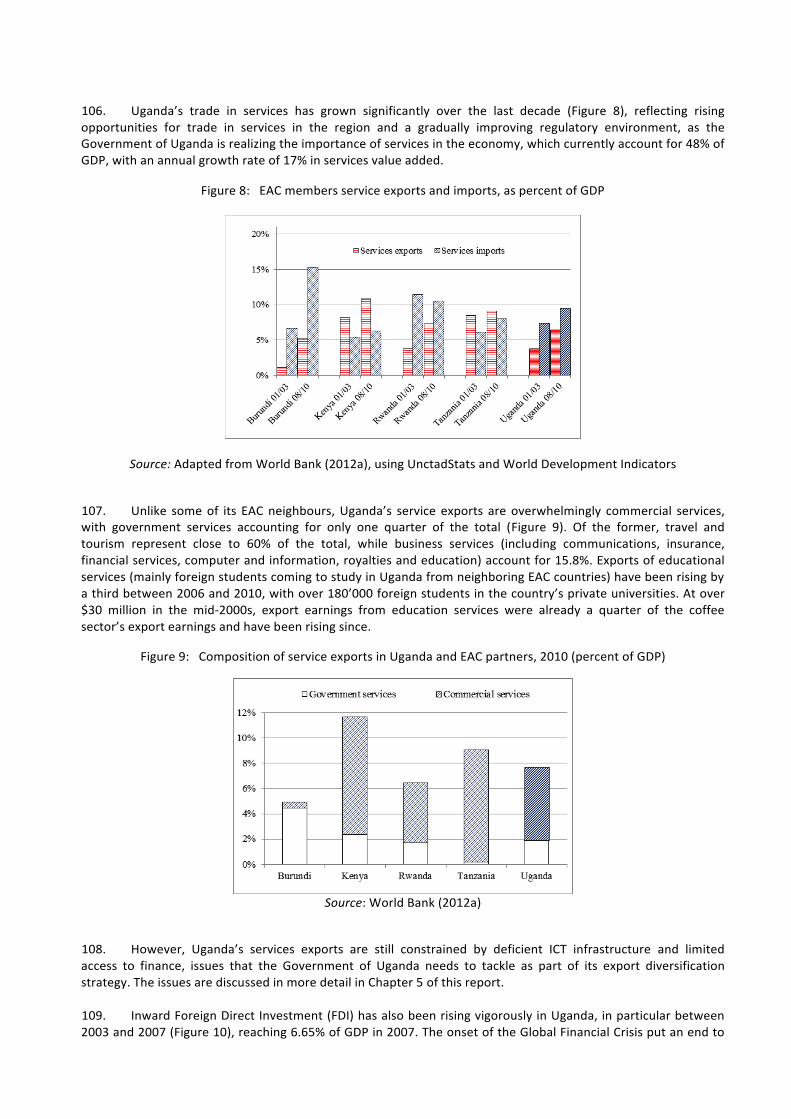
50
106. Uganda’s trade in services has grown significantly over the last decade (Figure 8), reflecting rising opportunities for trade in services in the region and a gradually improving regulatory environment, as the Government of Uganda is realizing the importance of services in the economy, which currently account for 48% of GDP, with an annual growth rate of 17% in services value added.
Figure 8: EAC members service exports and imports, as percent of GDP
Source: Adapted from World Bank (2012a), using UnctadStats and World Development Indicators
107. Unlike some of its EAC neighbours, Uganda’s service exports are overwhelmingly commercial services, with government services accounting for only one quarter of the total (Figure 9). Of the former, travel and tourism represent close to 60% of the total, while business services (including communications, insurance, financial services, computer and information, royalties and education) account for 15.8%. Exports of educational services (mainly foreign students coming to study in Uganda from neighboring EAC countries) have been rising by a third between 2006 and 2010, with over 180’000 foreign students in the country’s private universities. At over $30 million in the mid-‐2000s, export earnings from education services were already a quarter of the coffee sector’s export earnings and have been rising since.
Figure 9: Composition of service exports in Uganda and EAC partners, 2010 (percent of GDP)
Source: World Bank (2012a)
108. However, Uganda’s services exports are still constrained by deficient ICT infrastructure and limited access to finance, issues that the Government of Uganda needs to tackle as part of its export diversification strategy. The issues are discussed in more detail in Chapter 5 of this report.
109. Inward Foreign Direct Investment (FDI) has also been rising vigorously in Uganda, in particular between 2003 and 2007 (Figure 10), reaching 6.65% of GDP in 2007. The onset of the Global Financial Crisis put an end to the rise in inward flows, although they remained at their high level (about $25 million per year, far ahead of other
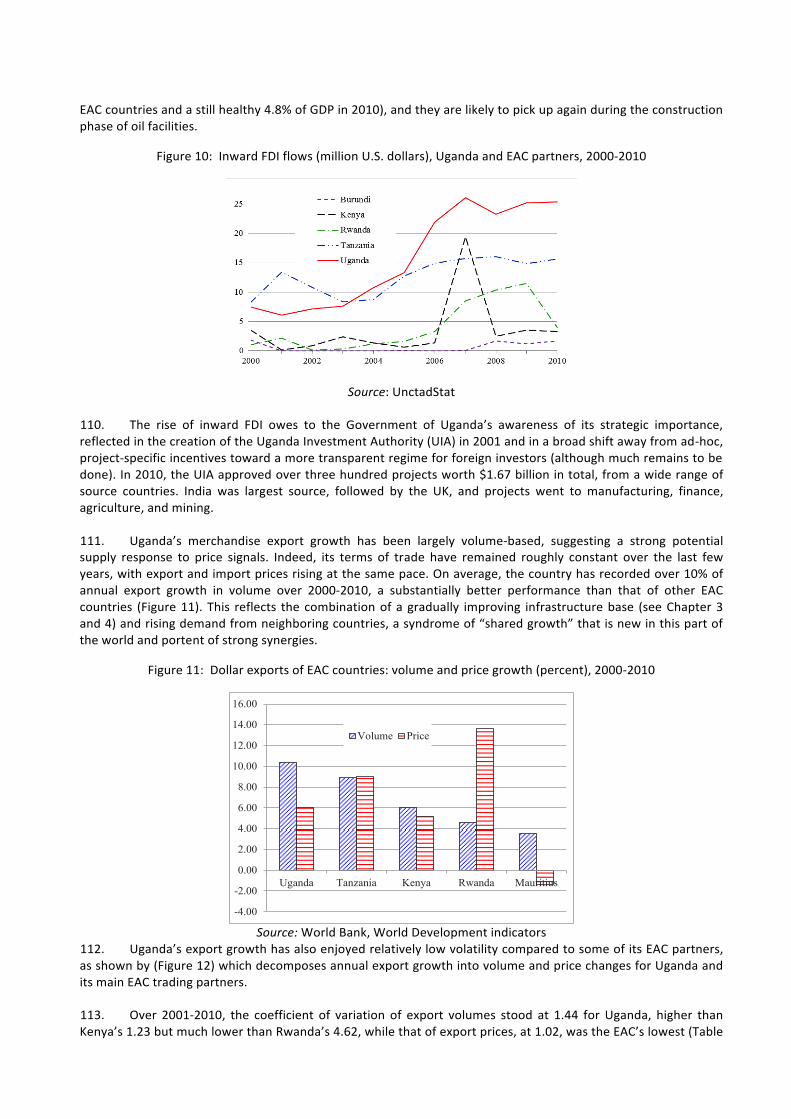
51
EAC countries and a still healthy 4.8% of GDP in 2010), and they are likely to pick up again during the construction phase of oil facilities.
Figure 10: Inward FDI flows (million U.S. dollars), Uganda and EAC partners, 2000-‐2010
Source: UnctadStat
110. The rise of inward FDI owes to the Government of Uganda’s awareness of its strategic importance, reflected in the creation of the Uganda Investment Authority (UIA) in 2001 and in a broad shift away from ad-‐hoc, project-‐specific incentives toward a more transparent regime for foreign investors (although much remains to be done). In 2010, the UIA approved over three hundred projects worth $1.67 billion in total, from a wide range of source countries. India was largest source, followed by the UK, and projects went to manufacturing, finance, agriculture, and mining.
111. Uganda’s merchandise export growth has been largely volume-‐based, suggesting a strong potential supply response to price signals. Indeed, its terms of trade have remained roughly constant over the last few years, with export and import prices rising at the same pace. On average, the country has recorded over 10% of annual export growth in volume over 2000-‐2010, a substantially better performance than that of other EAC countries (Figure 11). This reflects the combination of a gradually improving infrastructure base (see Chapter 3 and 4) and rising demand from neighboring countries, a syndrome of “shared growth” that is new in this part of the world and portent of strong synergies.
Figure 11: Dollar exports of EAC countries: volume and price growth (percent), 2000-‐2010
-4.00
-2.00
0.00
2.00
4.00
6.00
8.00
10.00
12.00
14.00
16.00
Uganda Tanzania Kenya Rwanda Mauritius
Volume Price
Source: World Bank, World Development indicators
112. Uganda’s export growth has also enjoyed relatively low volatility compared to some of its EAC partners, as shown by (Figure 12) which decomposes annual export growth into volume and price changes for Uganda and its main EAC trading partners.
113. Over 2001-‐2010, the coefficient of variation of export volumes stood at 1.44 for Uganda, higher than Kenya’s 1.23 but much lower than Rwanda’s 4.62, while that of export prices, at 1.02, was the EAC’s lowest (Table
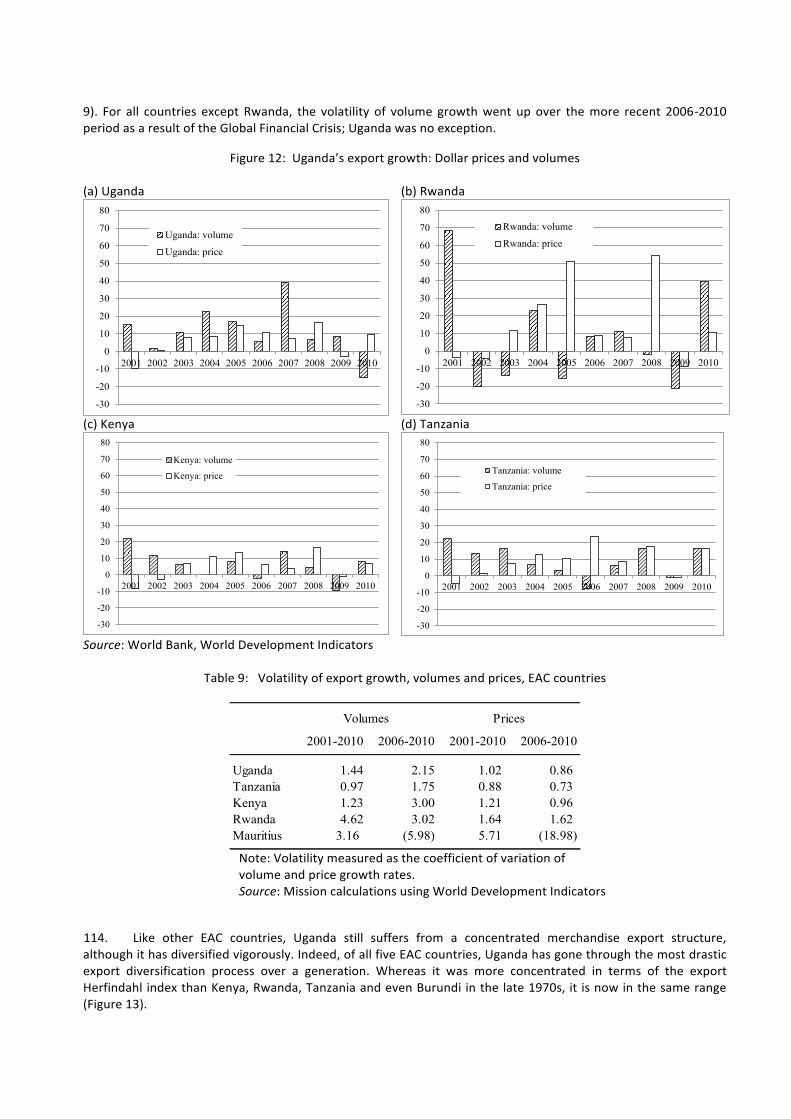
52
9). For all countries except Rwanda, the volatility of volume growth went up over the more recent 2006-‐2010 period as a result of the Global Financial Crisis; Uganda was no exception.
Figure 12: Uganda’s export growth: Dollar prices and volumes
(a) Uganda (b) Rwanda
-30
-20
-10
0
10
20
30
40
50
60
70
80
2001 2002 2003 2004 2005 2006 2007 2008 2009 2010
Uganda: volume
Uganda: price
-30
-20
-10
0
10
20
30
40
50
60
70
80
2001 2002 2003 2004 2005 2006 2007 2008 2009 2010
Rwanda: volume
Rwanda: price
(c) Kenya (d) Tanzania
-30
-20
-10
0
10
20
30
40
50
60
70
80
2001 2002 2003 2004 2005 2006 2007 2008 2009 2010
Kenya: volume
Kenya: price
-30
-20
-10
0
10
20
30
40
50
60
70
80
2001 2002 2003 2004 2005 2006 2007 2008 2009 2010
Tanzania: volume
Tanzania: price
Source: World Bank, World Development Indicators
Table 9: Volatility of export growth, volumes and prices, EAC countries
2001-2010 2006-2010 2001-2010 2006-2010
Uganda 1.44 2.15 1.02 0.86 Tanzania 0.97 1.75 0.88 0.73 Kenya 1.23 3.00 1.21 0.96 Rwanda 4.62 3.02 1.64 1.62 Mauritius 3.16 (5.98) 5.71 (18.98)
Volumes Prices
Note: Volatility measured as the coefficient of variation of volume and price growth rates. Source: Mission calculations using World Development Indicators
114. Like other EAC countries, Uganda still suffers from a concentrated merchandise export structure, although it has diversified vigorously. Indeed, of all five EAC countries, Uganda has gone through the most drastic export diversification process over a generation. Whereas it was more concentrated in terms of the export Herfindahl index than Kenya, Rwanda, Tanzania and even Burundi in the late 1970s, it is now in the same range (Figure 13).
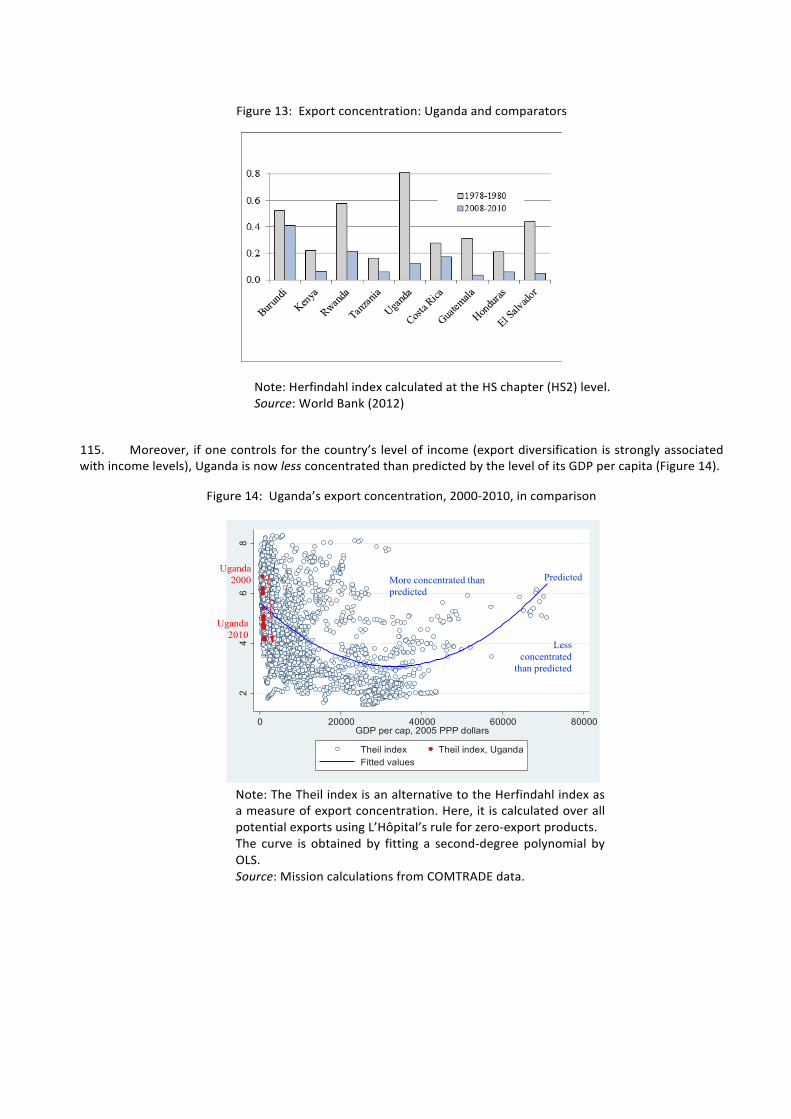
53
Figure 13: Export concentration: Uganda and comparators
Note: Herfindahl index calculated at the HS chapter (HS2) level. Source: World Bank (2012)
115. Moreover, if one controls for the country’s level of income (export diversification is strongly associated with income levels), Uganda is now less concentrated than predicted by the level of its GDP per capita (Figure 14).
Figure 14: Uganda’s export concentration, 2000-‐2010, in comparison
24
68
0 20000 40000 60000 80000GDP per cap, 2005 PPP dollars
Theil index Theil index, UgandaFitted values
More concentrated than predicted
Less concentrated
than predicted
Uganda 2000 Predicted
Uganda 2010
Note: The Theil index is an alternative to the Herfindahl index as a measure of export concentration. Here, it is calculated over all potential exports using L’Hôpital’s rule for zero-‐export products. The curve is obtained by fitting a second-‐degree polynomial by OLS. Source: Mission calculations from COMTRADE data.

54
Figure 15: Coffee’s share in exports: Uganda and comparators
Source: World Bank (2012)
116. Uganda’s diversification has allowed it to reduce, albeit partially, its dependence on unprocessed commodity exports. International experience shows that moving out of commodities is not necessarily accompanied by diversification; for instance, Costa Rica illustrated in the 1990s how moving into a high-‐tech sector (microprocessors) could raise export concentration rather than reducing it. However, in Uganda’s case, diversification has largely taken place out of commodities into higher-‐value primary products and light manufactures, showing how a central objective of the government has started to emerge thanks to existing policy choices. Whereas coffee still accounts for 31% of Uganda’s merchandise export value, at par with Rwanda (Figure 15), and making the country more dependent on coffee than many major Latin American producers, the share of commodities has been steadily shrinking in Uganda’s merchandise export portfolio.
117. As noted, Uganda’s diversification has been proceeding through an expansion into higher-‐value primary products, which are now the country’s second export category after commodities. In the EAC, only Rwanda has managed to reduce its dependence on commodities substantially more than Uganda. Policy should aim at furthering this trend of gradual transformation by creating the right conditions (Figure 16).
Figure 16: Export diversification in the EAC
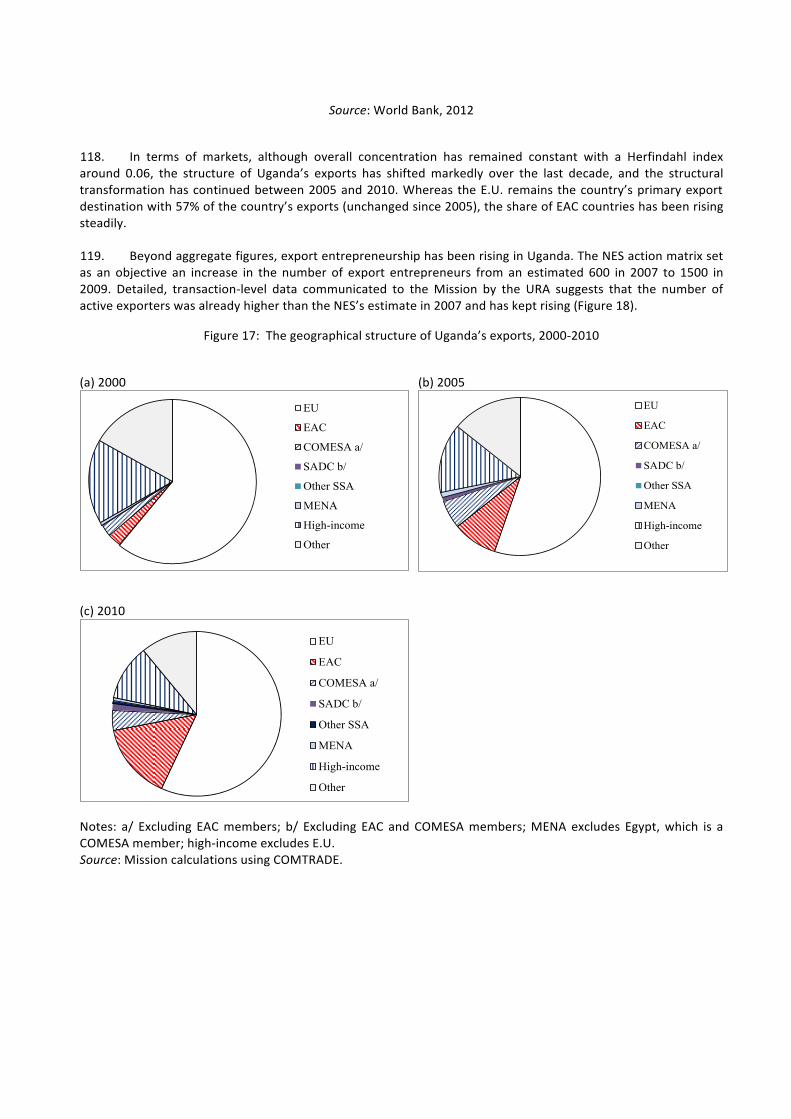
55
Source: World Bank, 2012
118. In terms of markets, although overall concentration has remained constant with a Herfindahl index around 0.06, the structure of Uganda’s exports has shifted markedly over the last decade, and the structural transformation has continued between 2005 and 2010. Whereas the E.U. remains the country’s primary export destination with 57% of the country’s exports (unchanged since 2005), the share of EAC countries has been rising steadily.
119. Beyond aggregate figures, export entrepreneurship has been rising in Uganda. The NES action matrix set as an objective an increase in the number of export entrepreneurs from an estimated 600 in 2007 to 1500 in 2009. Detailed, transaction-‐level data communicated to the Mission by the URA suggests that the number of active exporters was already higher than the NES’s estimate in 2007 and has kept rising (Figure 18).
Figure 17: The geographical structure of Uganda’s exports, 2000-‐2010
(a) 2000 (b) 2005
EU
EAC
COMESA a/
SADC b/
Other SSA
MENA
High-income
Other
EU
EAC
COMESA a/
SADC b/
Other SSA
MENA
High-income
Other
(c) 2010
EU
EAC
COMESA a/
SADC b/
Other SSA
MENA
High-income
Other
Notes: a/ Excluding EAC members; b/ Excluding EAC and COMESA members; MENA excludes Egypt, which is a COMESA member; high-‐income excludes E.U. Source: Mission calculations using COMTRADE.

56
Figure 18: Number of active exporters
0
500
1000
1500
2000
2500
3000
3500
2007 2009 2011
NES estimates/objectives
URA data
Source: Mission calculations using NES and URA data.
120. In sum, almost three decades of open-‐trade policies have allowed Uganda to: • Raise the share of trade in GDP, strengthening the power of exports to drive further growth and poverty
reduction; • Embark on a process of economic diversification out of unprocessed commodities, in which markets give
the right signal for a gradual, realistic countrywide strategy for export upgrading and value addition • Provide opportunities for a rising number of export entrepreneurs.
2.2 STRENGTHS, WEAKNESSES, OPPORTUNITIES AND THREATS
121. In order to move further out of unprocessed commodity exports, Uganda needs to build the supply base required for markets to react to price signals. Provided that this base gradually builds up, Uganda faces substantial export growth opportunities, in particular on regional markets.
2.2.1 A RESOURCE-‐BASED LOOK AT UGANDA’S STRENGTHS
122. In order to chart a map for effective export promotion, the Government of Uganda needs to have a clear view of the country’s underlying strengths. The theory of comparative advantage suggests that countries export successfully in sectors where they have the required combination of productive assets. For instance, countries with an abundant supply of labor such as Vietnam or Bangladesh can compete successfully in labor-‐intensive sectors like garments; countries with highly developed scientific education systems like India can compete successfully in skill-‐intensive sectors like programming services; countries with natural resources (say, favorable climates or large mineral resources) can compete successfully in resource-‐based sectors.
123. Uganda needs to maintain its attractiveness for foreign investors and accumulate productive capital in order to diversify its export base. In the last decade where worldwide capital endowment data is available (1997-‐2007), the worldwide distribution of capital has become increasingly bimodal, with a small group of richly capital-‐endowed countries further accumulating capital through agglomeration (the right-‐hand side hump in the brown curve in Figure 12) and a large number of poor countries failing to attract or accumulate capital. Up to the recent rise in inward FDI flows, Uganda suffered a near stagnation in its capital endowment with a stock of capital still below $1,000 per worker. By comparison, with a relatively similar level of income ($674 per capita in current U.S. dollars against $510 for Uganda), Bangladesh has $3,500 of capital per worker.
124. Diversifying into light, labor-‐intensive sectors like garment manufacturing, which could help reduce poverty and raise female employment, would require capital intensities ranging from $7,000 to $30,000, far beyond the country’s current endowment. Indeed, the NES reckons that “with respect to garments and textiles, Uganda’s competitive advantage has been questioned”. International experience suggests that in the fiercely competitive garment sector, competitive advantage requires a combination of low transport costs and high
57
shipping frequencies which would be difficult to achieve for Uganda given its indirect access to the sea through Mombasa, and a mixture of costly government incentives and social policies that may not even be desirable. 125. Moreover, high transportation costs and CET protection of the EAC market have led to investments in heavy industry with large capital requirements. For instance, an investment project currently underway to build a steel mill serving the country’s need for steel-‐based construction materials (H-‐beams and roofing materials) has a capital intensity of about $100,000 per worker, or a hundred times the country’s average endowment. Cement manufacturing, another input to the construction sector (cement, like steel, is very heavy and expensive to transport in a landlocked country like Uganda), is also heavily capital-‐intensive, with requirements as high as $100,000 of capital per worker. Whether such investments are economically sound or not is a difficult issue (see Box 1: A capital-‐intensive industry in Uganda: Cement).
Box 1: A capital-‐intensive industry in Uganda: Cement
The case of cement illustrates the trade-‐offs associated with trade policy in a key upstream sector. At over $200 per ton for 32.5 (low) grade, cement prices in Uganda are among the highest in the world, rivaling those in neighbouring DRC. The reason lies largely in logistics nightmares, discussed in detail in Chapter 3 of this report. Railway is not an option, as cement bags get wet staying for days in uncovered railway cars. Trucking takes 3-‐4 days and is expensive because the cargo is so heavy and Uganda’s trucking industry is small-‐scale and fragmented. As a result, cement prices rise a third from their $120 price in Mombasa. Two cement factories were built by the Government in the 1950s and 70s with assistance from Yugoslavia, but none operated at a profit. After privatization to Asian investors in the 1990s, Lafarge entered the market and now jointly manages through its local subsidiary, Hima cement, a facility in Kasese, 350 km West of Kampala. Half of the output (800KT per year) is exported to neighboring DRC and Rwanda, contributing to the country’s external balance, while some of Uganda’s domestic consumption is covered by rival cement maker Toro and the rest by imports from or through Kenya. Cement is not only capital-‐intensive (a recent expansion in production facilities involved an investment of $120 million for approximately 100 jobs, i.e. $120’000 of capital per worker); it is also energy-‐intensive, with energy accounting for 30-‐40% of operating costs. The problem with energy in Uganda is not just its cost but the unreliability of its supply. Because of these handicaps, cement manufacturing in Uganda is profitable only because of the 25% Common External Tariff (CET) rate. Indeed, the industry lobbied for a 35% rate. Protecting a heavy industry like cement with high tariffs when landlockedness already provides a strong natural protection is not necessarily the best use of scarce resources to foster inclusive growth. On one hand, as we saw cement is exported to neighboring countries, thus contributing to Uganda’s trade balance and export diversification. On the other hand, the cost of high cement prices is a burden for the construction industry, which is much more labor-‐intensive than the cement industry. For instance, $120 million (the cost of the new cement-‐production facility) invested in construction would have generated many more jobs than just one hundred, with more induced effect on poverty alleviation. Also, improvements in logistics and transportation may reduce the profitability of cement manufacturing by reducing the “natural” protection of high transport costs. Thus, in order to come up with a reasoned position on the CET rate on cement in EAC negotiations, the Government of Uganda needs to think strategically about its policy for the whole cluster of activities from clinker to cement to construction and associated services, in terms of multiple objectives (trade balance, employment, poverty, housing, and infrastructure). Source: Mission interviews
126. The Government of Uganda, together with the Bank of Uganda, needs to provide the right macroeconomic and credit-‐market environment for private investment to pick up. As discussed in Chapter 1, inflation stabilization has recently translated into high interest rates, penalizing investment and highlighting the need for prudent and predictable macroeconomic management. In addition, recent budget adjustments away from public capital expenditure may also penalize private investment inasmuch as public infrastructure and private capital are complementary inputs in the production process.
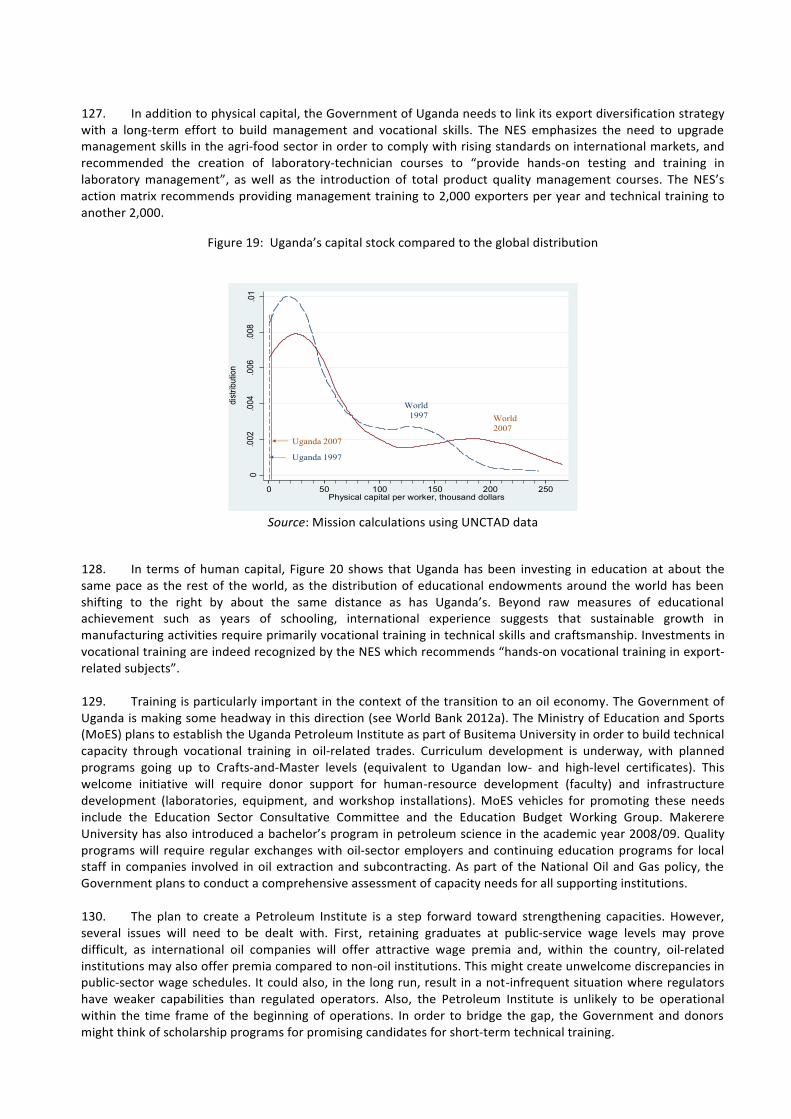
58
127. In addition to physical capital, the Government of Uganda needs to link its export diversification strategy with a long-‐term effort to build management and vocational skills. The NES emphasizes the need to upgrade management skills in the agri-‐food sector in order to comply with rising standards on international markets, and recommended the creation of laboratory-‐technician courses to “provide hands-‐on testing and training in laboratory management”, as well as the introduction of total product quality management courses. The NES’s action matrix recommends providing management training to 2,000 exporters per year and technical training to another 2,000.
Figure 19: Uganda’s capital stock compared to the global distribution
0.0
02.0
04.0
06.0
08.0
1
dist
ribut
ion
0 50 100 150 200 250Physical capital per worker, thousand dollars
Uganda 1997
World 1997 World
2007Uganda 2007
Source: Mission calculations using UNCTAD data
128. In terms of human capital, Figure 20 shows that Uganda has been investing in education at about the same pace as the rest of the world, as the distribution of educational endowments around the world has been shifting to the right by about the same distance as has Uganda’s. Beyond raw measures of educational achievement such as years of schooling, international experience suggests that sustainable growth in manufacturing activities require primarily vocational training in technical skills and craftsmanship. Investments in vocational training are indeed recognized by the NES which recommends “hands-‐on vocational training in export-‐related subjects”.
129. Training is particularly important in the context of the transition to an oil economy. The Government of Uganda is making some headway in this direction (see World Bank 2012a). The Ministry of Education and Sports (MoES) plans to establish the Uganda Petroleum Institute as part of Busitema University in order to build technical capacity through vocational training in oil-‐related trades. Curriculum development is underway, with planned programs going up to Crafts-‐and-‐Master levels (equivalent to Ugandan low-‐ and high-‐level certificates). This welcome initiative will require donor support for human-‐resource development (faculty) and infrastructure development (laboratories, equipment, and workshop installations). MoES vehicles for promoting these needs include the Education Sector Consultative Committee and the Education Budget Working Group. Makerere University has also introduced a bachelor’s program in petroleum science in the academic year 2008/09. Quality programs will require regular exchanges with oil-‐sector employers and continuing education programs for local staff in companies involved in oil extraction and subcontracting. As part of the National Oil and Gas policy, the Government plans to conduct a comprehensive assessment of capacity needs for all supporting institutions.
130. The plan to create a Petroleum Institute is a step forward toward strengthening capacities. However, several issues will need to be dealt with. First, retaining graduates at public-‐service wage levels may prove difficult, as international oil companies will offer attractive wage premia and, within the country, oil-‐related institutions may also offer premia compared to non-‐oil institutions. This might create unwelcome discrepancies in public-‐sector wage schedules. It could also, in the long run, result in a not-‐infrequent situation where regulators have weaker capabilities than regulated operators. Also, the Petroleum Institute is unlikely to be operational within the time frame of the beginning of operations. In order to bridge the gap, the Government and donors might think of scholarship programs for promising candidates for short-‐term technical training.
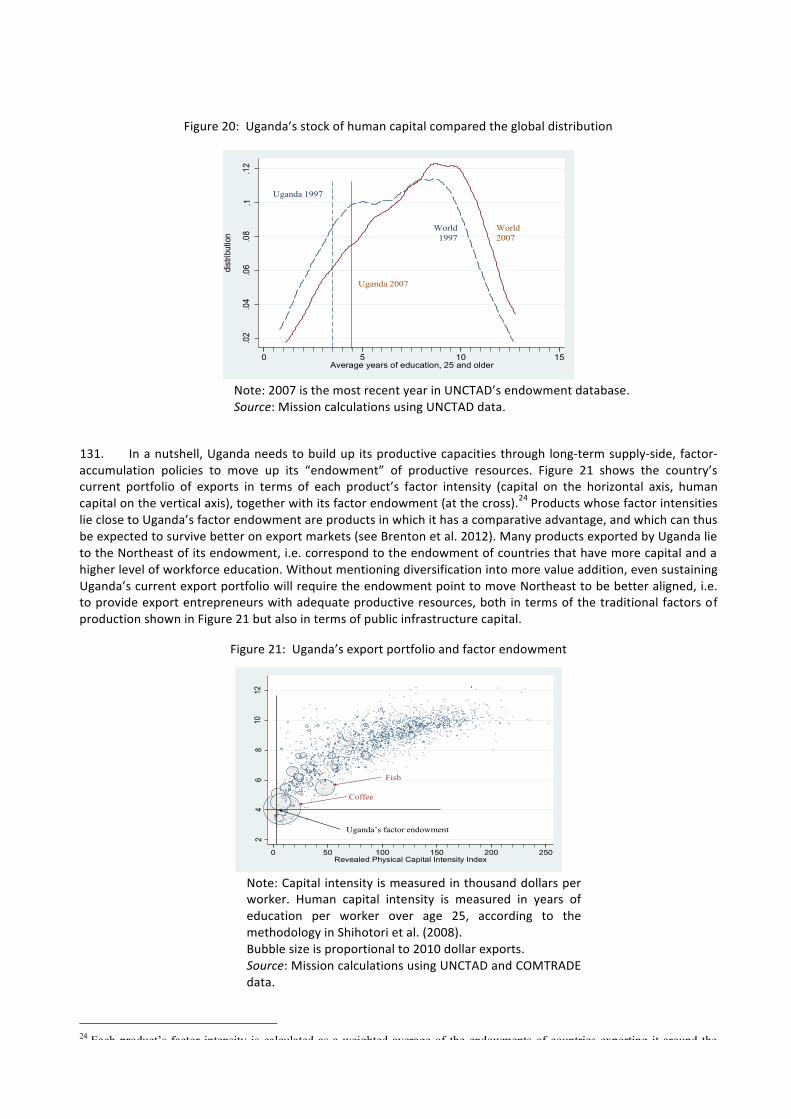
59
Figure 20: Uganda’s stock of human capital compared the global distribution
.02
.04
.06
.08
.1.1
2
dist
ribut
ion
0 5 10 15Average years of education, 25 and older
Uganda 1997
World 1997
World 2007
Uganda 2007
Note: 2007 is the most recent year in UNCTAD’s endowment database. Source: Mission calculations using UNCTAD data.
131. In a nutshell, Uganda needs to build up its productive capacities through long-‐term supply-‐side, factor-‐accumulation policies to move up its “endowment” of productive resources. Figure 21 shows the country’s current portfolio of exports in terms of each product’s factor intensity (capital on the horizontal axis, human capital on the vertical axis), together with its factor endowment (at the cross).24 Products whose factor intensities lie close to Uganda’s factor endowment are products in which it has a comparative advantage, and which can thus be expected to survive better on export markets (see Brenton et al. 2012). Many products exported by Uganda lie to the Northeast of its endowment, i.e. correspond to the endowment of countries that have more capital and a higher level of workforce education. Without mentioning diversification into more value addition, even sustaining Uganda’s current export portfolio will require the endowment point to move Northeast to be better aligned, i.e. to provide export entrepreneurs with adequate productive resources, both in terms of the traditional factors of production shown in Figure 21 but also in terms of public infrastructure capital.
Figure 21: Uganda’s export portfolio and factor endowment
24
68
1012
Reve
aled
Hum
an C
apita
l Inte
nsity
Inde
x
0 50 100 150 200 250Revealed Physical Capital Intensity Index
Uganda’s factor endowment
Coffee
Fish
Note: Capital intensity is measured in thousand dollars per worker. Human capital intensity is measured in years of education per worker over age 25, according to the methodology in Shihotori et al. (2008). Bubble size is proportional to 2010 dollar exports. Source: Mission calculations using UNCTAD and COMTRADE data.
24 Each product’s factor intensity is calculated as a weighted average of the endowments of countries exporting it around the world (see Shihotori et al. 2008 for details).
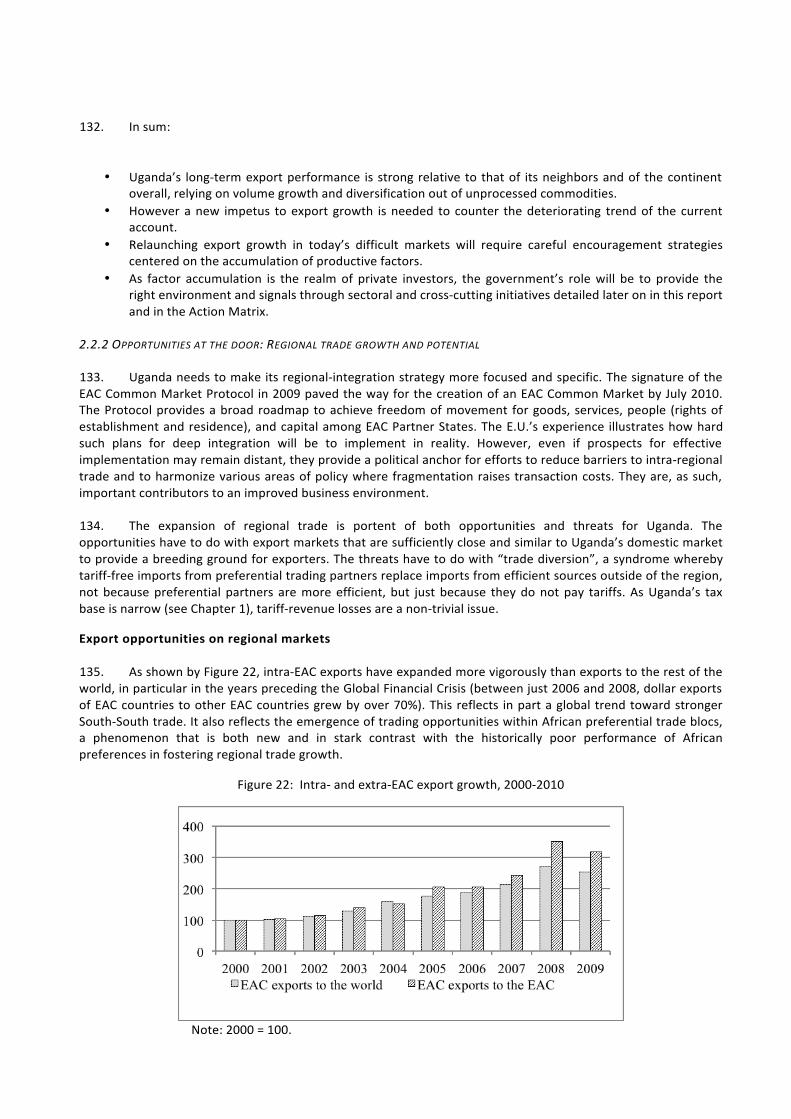
60
132. In sum:
• Uganda’s long-‐term export performance is strong relative to that of its neighbors and of the continent
overall, relying on volume growth and diversification out of unprocessed commodities. • However a new impetus to export growth is needed to counter the deteriorating trend of the current
account. • Relaunching export growth in today’s difficult markets will require careful encouragement strategies
centered on the accumulation of productive factors. • As factor accumulation is the realm of private investors, the government’s role will be to provide the
right environment and signals through sectoral and cross-‐cutting initiatives detailed later on in this report and in the Action Matrix.
2.2.2 OPPORTUNITIES AT THE DOOR: REGIONAL TRADE GROWTH AND POTENTIAL
133. Uganda needs to make its regional-‐integration strategy more focused and specific. The signature of the EAC Common Market Protocol in 2009 paved the way for the creation of an EAC Common Market by July 2010. The Protocol provides a broad roadmap to achieve freedom of movement for goods, services, people (rights of establishment and residence), and capital among EAC Partner States. The E.U.’s experience illustrates how hard such plans for deep integration will be to implement in reality. However, even if prospects for effective implementation may remain distant, they provide a political anchor for efforts to reduce barriers to intra-‐regional trade and to harmonize various areas of policy where fragmentation raises transaction costs. They are, as such, important contributors to an improved business environment.
134. The expansion of regional trade is portent of both opportunities and threats for Uganda. The opportunities have to do with export markets that are sufficiently close and similar to Uganda’s domestic market to provide a breeding ground for exporters. The threats have to do with “trade diversion”, a syndrome whereby tariff-‐free imports from preferential trading partners replace imports from efficient sources outside of the region, not because preferential partners are more efficient, but just because they do not pay tariffs. As Uganda’s tax base is narrow (see Chapter 1), tariff-‐revenue losses are a non-‐trivial issue.
Export opportunities on regional markets 135. As shown by Figure 22, intra-‐EAC exports have expanded more vigorously than exports to the rest of the world, in particular in the years preceding the Global Financial Crisis (between just 2006 and 2008, dollar exports of EAC countries to other EAC countries grew by over 70%). This reflects in part a global trend toward stronger South-‐South trade. It also reflects the emergence of trading opportunities within African preferential trade blocs, a phenomenon that is both new and in stark contrast with the historically poor performance of African preferences in fostering regional trade growth.
Figure 22: Intra-‐ and extra-‐EAC export growth, 2000-‐2010
Note: 2000 = 100. Source: World Bank (2012), from COMTRADE
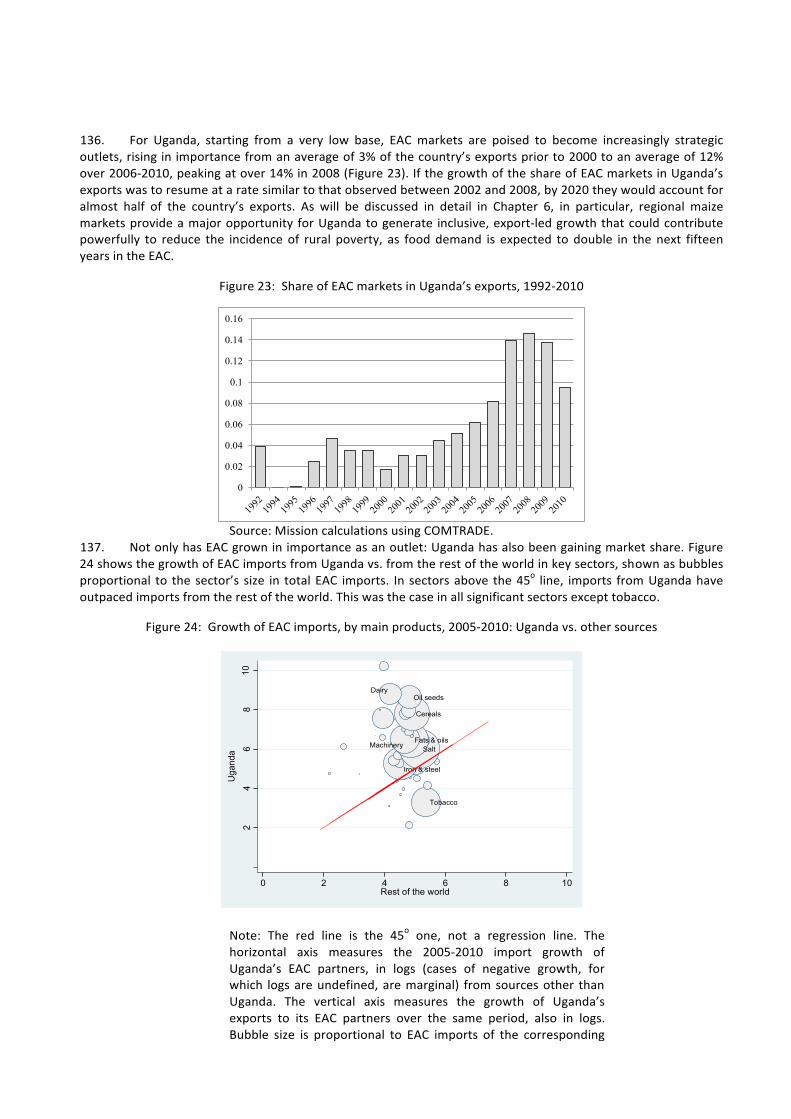
61
136. For Uganda, starting from a very low base, EAC markets are poised to become increasingly strategic outlets, rising in importance from an average of 3% of the country’s exports prior to 2000 to an average of 12% over 2006-‐2010, peaking at over 14% in 2008 (Figure 23). If the growth of the share of EAC markets in Uganda’s exports was to resume at a rate similar to that observed between 2002 and 2008, by 2020 they would account for almost half of the country’s exports. As will be discussed in detail in Chapter 6, in particular, regional maize markets provide a major opportunity for Uganda to generate inclusive, export-‐led growth that could contribute powerfully to reduce the incidence of rural poverty, as food demand is expected to double in the next fifteen years in the EAC.
Figure 23: Share of EAC markets in Uganda’s exports, 1992-‐2010
0
0.02
0.04
0.06
0.08
0.1
0.12
0.14
0.16
Source: Mission calculations using COMTRADE.
137. Not only has EAC grown in importance as an outlet: Uganda has also been gaining market share. Figure 24 shows the growth of EAC imports from Uganda vs. from the rest of the world in key sectors, shown as bubbles proportional to the sector’s size in total EAC imports. In sectors above the 45o line, imports from Uganda have outpaced imports from the rest of the world. This was the case in all significant sectors except tobacco.
Figure 24: Growth of EAC imports, by main products, 2005-‐2010: Uganda vs. other sources
Tobacco
Iron & steel
SaltFats & oils
Machinery
Cereals
Oil seedsDairy
24
68
10U
gand
a
0 2 4 6 8 10Rest of the world
Note: The red line is the 45o one, not a regression line. The horizontal axis measures the 2005-‐2010 import growth of Uganda’s EAC partners, in logs (cases of negative growth, for which logs are undefined, are marginal) from sources other than Uganda. The vertical axis measures the growth of Uganda’s exports to its EAC partners over the same period, also in logs. Bubble size is proportional to EAC imports of the corresponding
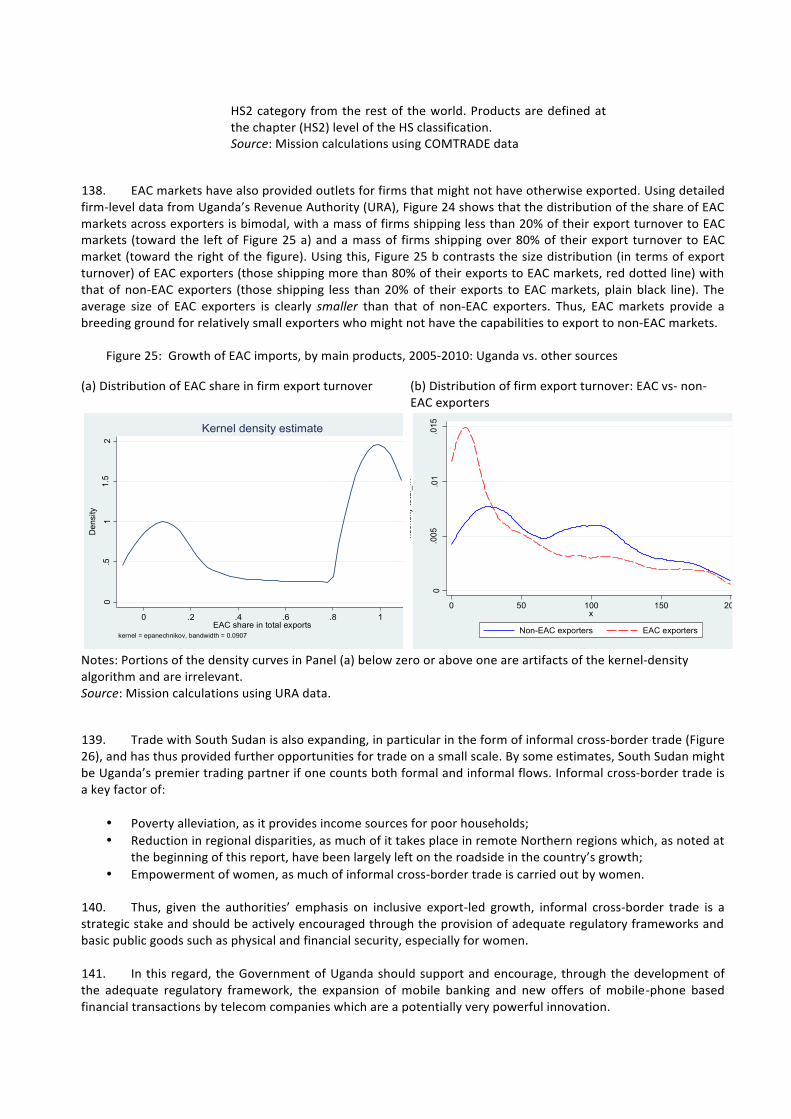
62
HS2 category from the rest of the world. Products are defined at the chapter (HS2) level of the HS classification. Source: Mission calculations using COMTRADE data
138. EAC markets have also provided outlets for firms that might not have otherwise exported. Using detailed firm-‐level data from Uganda’s Revenue Authority (URA), Figure 24 shows that the distribution of the share of EAC markets across exporters is bimodal, with a mass of firms shipping less than 20% of their export turnover to EAC markets (toward the left of Figure 25 a) and a mass of firms shipping over 80% of their export turnover to EAC market (toward the right of the figure). Using this, Figure 25 b contrasts the size distribution (in terms of export turnover) of EAC exporters (those shipping more than 80% of their exports to EAC markets, red dotted line) with that of non-‐EAC exporters (those shipping less than 20% of their exports to EAC markets, plain black line). The average size of EAC exporters is clearly smaller than that of non-‐EAC exporters. Thus, EAC markets provide a breeding ground for relatively small exporters who might not have the capabilities to export to non-‐EAC markets.
Figure 25: Growth of EAC imports, by main products, 2005-‐2010: Uganda vs. other sources
(a) Distribution of EAC share in firm export turnover (b) Distribution of firm export turnover: EAC vs-‐ non-‐EAC exporters
0.5
11.
52
Den
sity
0 .2 .4 .6 .8 1EAC share in total exports
kernel = epanechnikov, bandwidth = 0.0907
Kernel density estimate
0.0
05.0
1.0
15
kden
sity
tota
l_m
0 50 100 150 200x
Non-EAC exporters EAC exporters
Notes: Portions of the density curves in Panel (a) below zero or above one are artifacts of the kernel-‐density algorithm and are irrelevant. Source: Mission calculations using URA data.
139. Trade with South Sudan is also expanding, in particular in the form of informal cross-‐border trade (Figure 26), and has thus provided further opportunities for trade on a small scale. By some estimates, South Sudan might be Uganda’s premier trading partner if one counts both formal and informal flows. Informal cross-‐border trade is a key factor of:
• Poverty alleviation, as it provides income sources for poor households; • Reduction in regional disparities, as much of it takes place in remote Northern regions which, as noted at
the beginning of this report, have been largely left on the roadside in the country’s growth; • Empowerment of women, as much of informal cross-‐border trade is carried out by women.
140. Thus, given the authorities’ emphasis on inclusive export-‐led growth, informal cross-‐border trade is a strategic stake and should be actively encouraged through the provision of adequate regulatory frameworks and basic public goods such as physical and financial security, especially for women.
141. In this regard, the Government of Uganda should support and encourage, through the development of the adequate regulatory framework, the expansion of mobile banking and new offers of mobile-‐phone based financial transactions by telecom companies which are a potentially very powerful innovation.
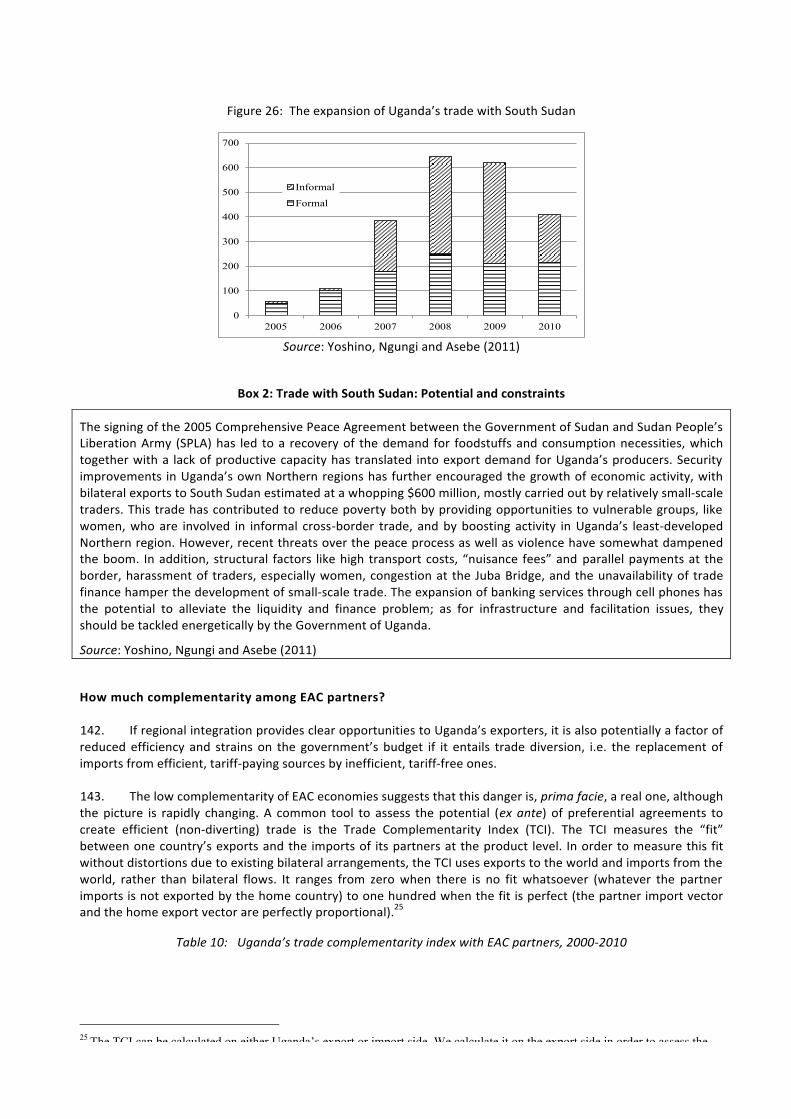
63
Figure 26: The expansion of Uganda’s trade with South Sudan
0
100
200
300
400
500
600
700
2005 2006 2007 2008 2009 2010
Informal
Formal
Source: Yoshino, Ngungi and Asebe (2011)
Box 2: Trade with South Sudan: Potential and constraints
The signing of the 2005 Comprehensive Peace Agreement between the Government of Sudan and Sudan People’s Liberation Army (SPLA) has led to a recovery of the demand for foodstuffs and consumption necessities, which together with a lack of productive capacity has translated into export demand for Uganda’s producers. Security improvements in Uganda’s own Northern regions has further encouraged the growth of economic activity, with bilateral exports to South Sudan estimated at a whopping $600 million, mostly carried out by relatively small-‐scale traders. This trade has contributed to reduce poverty both by providing opportunities to vulnerable groups, like women, who are involved in informal cross-‐border trade, and by boosting activity in Uganda’s least-‐developed Northern region. However, recent threats over the peace process as well as violence have somewhat dampened the boom. In addition, structural factors like high transport costs, “nuisance fees” and parallel payments at the border, harassment of traders, especially women, congestion at the Juba Bridge, and the unavailability of trade finance hamper the development of small-‐scale trade. The expansion of banking services through cell phones has the potential to alleviate the liquidity and finance problem; as for infrastructure and facilitation issues, they should be tackled energetically by the Government of Uganda.
Source: Yoshino, Ngungi and Asebe (2011)
How much complementarity among EAC partners? 142. If regional integration provides clear opportunities to Uganda’s exporters, it is also potentially a factor of reduced efficiency and strains on the government’s budget if it entails trade diversion, i.e. the replacement of imports from efficient, tariff-‐paying sources by inefficient, tariff-‐free ones.
143. The low complementarity of EAC economies suggests that this danger is, prima facie, a real one, although the picture is rapidly changing. A common tool to assess the potential (ex ante) of preferential agreements to create efficient (non-‐diverting) trade is the Trade Complementarity Index (TCI). The TCI measures the “fit” between one country’s exports and the imports of its partners at the product level. In order to measure this fit without distortions due to existing bilateral arrangements, the TCI uses exports to the world and imports from the world, rather than bilateral flows. It ranges from zero when there is no fit whatsoever (whatever the partner imports is not exported by the home country) to one hundred when the fit is perfect (the partner import vector and the home export vector are perfectly proportional).25
Table 10: Uganda’s trade complementarity index with EAC partners, 2000-‐2010
25 The TCI can be calculated on either Uganda’s export or import side. We calculate it on the export side in order to assess the value of potential market-access gains on partner markets in terms of fit with Uganda’s export capabilities.
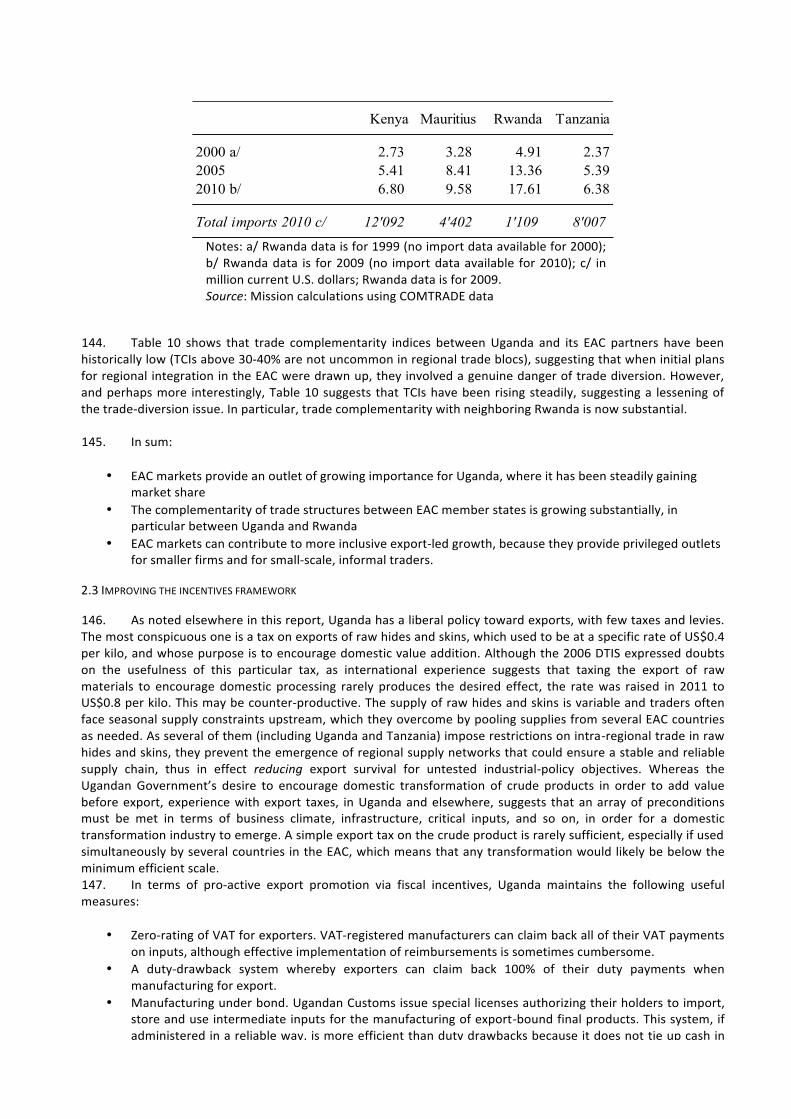
64
Kenya Mauritius Rwanda Tanzania
2000 a/ 2.73 3.28 4.91 2.372005 5.41 8.41 13.36 5.392010 b/ 6.80 9.58 17.61 6.38
Total imports 2010 c/ 12'092 4'402 1'109 8'007
Notes: a/ Rwanda data is for 1999 (no import data available for 2000); b/ Rwanda data is for 2009 (no import data available for 2010); c/ in million current U.S. dollars; Rwanda data is for 2009. Source: Mission calculations using COMTRADE data
144. Table 10 shows that trade complementarity indices between Uganda and its EAC partners have been historically low (TCIs above 30-‐40% are not uncommon in regional trade blocs), suggesting that when initial plans for regional integration in the EAC were drawn up, they involved a genuine danger of trade diversion. However, and perhaps more interestingly, Table 10 suggests that TCIs have been rising steadily, suggesting a lessening of the trade-‐diversion issue. In particular, trade complementarity with neighboring Rwanda is now substantial.
145. In sum:
• EAC markets provide an outlet of growing importance for Uganda, where it has been steadily gaining
market share • The complementarity of trade structures between EAC member states is growing substantially, in
particular between Uganda and Rwanda • EAC markets can contribute to more inclusive export-‐led growth, because they provide privileged outlets
for smaller firms and for small-‐scale, informal traders.
2.3 IMPROVING THE INCENTIVES FRAMEWORK
146. As noted elsewhere in this report, Uganda has a liberal policy toward exports, with few taxes and levies. The most conspicuous one is a tax on exports of raw hides and skins, which used to be at a specific rate of US$0.4 per kilo, and whose purpose is to encourage domestic value addition. Although the 2006 DTIS expressed doubts on the usefulness of this particular tax, as international experience suggests that taxing the export of raw materials to encourage domestic processing rarely produces the desired effect, the rate was raised in 2011 to US$0.8 per kilo. This may be counter-‐productive. The supply of raw hides and skins is variable and traders often face seasonal supply constraints upstream, which they overcome by pooling supplies from several EAC countries as needed. As several of them (including Uganda and Tanzania) impose restrictions on intra-‐regional trade in raw hides and skins, they prevent the emergence of regional supply networks that could ensure a stable and reliable supply chain, thus in effect reducing export survival for untested industrial-‐policy objectives. Whereas the Ugandan Government’s desire to encourage domestic transformation of crude products in order to add value before export, experience with export taxes, in Uganda and elsewhere, suggests that an array of preconditions must be met in terms of business climate, infrastructure, critical inputs, and so on, in order for a domestic transformation industry to emerge. A simple export tax on the crude product is rarely sufficient, especially if used simultaneously by several countries in the EAC, which means that any transformation would likely be below the minimum efficient scale. 147. In terms of pro-‐active export promotion via fiscal incentives, Uganda maintains the following useful measures:
• Zero-‐rating of VAT for exporters. VAT-‐registered manufacturers can claim back all of their VAT payments
on inputs, although effective implementation of reimbursements is sometimes cumbersome. • A duty-‐drawback system whereby exporters can claim back 100% of their duty payments when
manufacturing for export. • Manufacturing under bond. Ugandan Customs issue special licenses authorizing their holders to import,
store and use intermediate inputs for the manufacturing of export-‐bound final products. This system, if administered in a reliable way, is more efficient than duty drawbacks because it does not tie up cash in
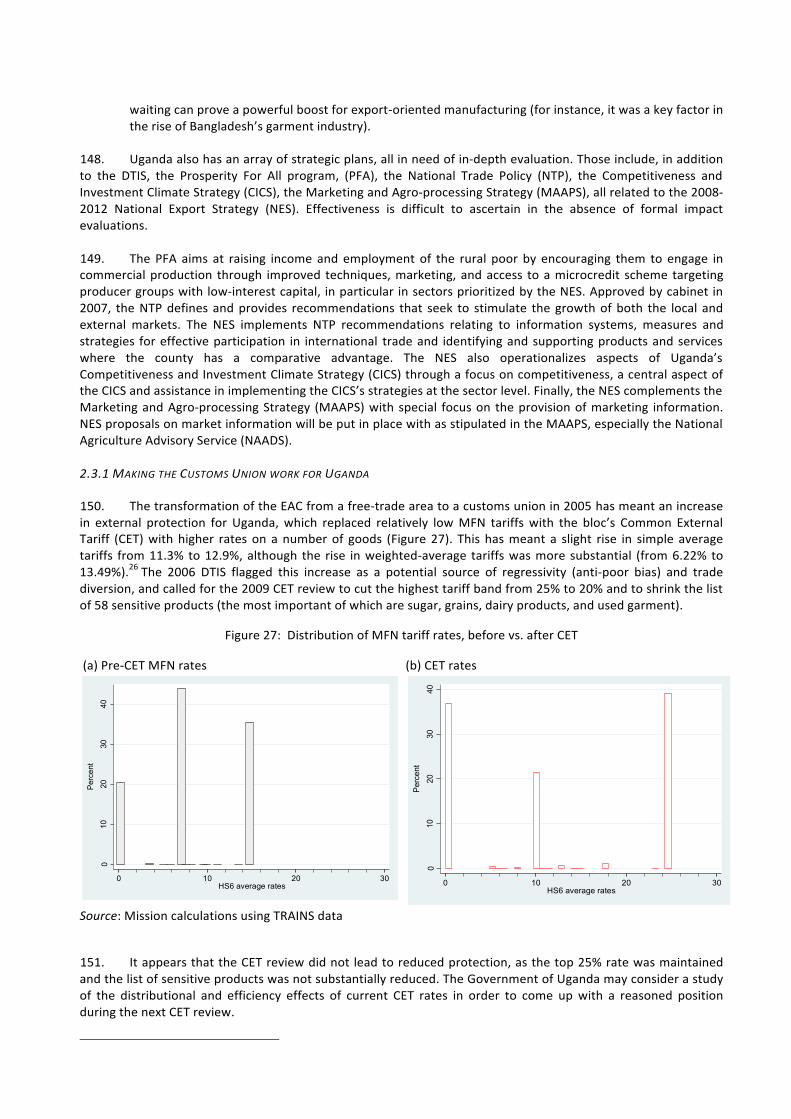
65
waiting can prove a powerful boost for export-‐oriented manufacturing (for instance, it was a key factor in the rise of Bangladesh’s garment industry).
148. Uganda also has an array of strategic plans, all in need of in-‐depth evaluation. Those include, in addition to the DTIS, the Prosperity For All program, (PFA), the National Trade Policy (NTP), the Competitiveness and Investment Climate Strategy (CICS), the Marketing and Agro-‐processing Strategy (MAAPS), all related to the 2008-‐2012 National Export Strategy (NES). Effectiveness is difficult to ascertain in the absence of formal impact evaluations.
149. The PFA aims at raising income and employment of the rural poor by encouraging them to engage in commercial production through improved techniques, marketing, and access to a microcredit scheme targeting producer groups with low-‐interest capital, in particular in sectors prioritized by the NES. Approved by cabinet in 2007, the NTP defines and provides recommendations that seek to stimulate the growth of both the local and external markets. The NES implements NTP recommendations relating to information systems, measures and strategies for effective participation in international trade and identifying and supporting products and services where the county has a comparative advantage. The NES also operationalizes aspects of Uganda’s Competitiveness and Investment Climate Strategy (CICS) through a focus on competitiveness, a central aspect of the CICS and assistance in implementing the CICS’s strategies at the sector level. Finally, the NES complements the Marketing and Agro-‐processing Strategy (MAAPS) with special focus on the provision of marketing information. NES proposals on market information will be put in place with as stipulated in the MAAPS, especially the National Agriculture Advisory Service (NAADS).
2.3.1 MAKING THE CUSTOMS UNION WORK FOR UGANDA
150. The transformation of the EAC from a free-‐trade area to a customs union in 2005 has meant an increase in external protection for Uganda, which replaced relatively low MFN tariffs with the bloc’s Common External Tariff (CET) with higher rates on a number of goods (Figure 27). This has meant a slight rise in simple average tariffs from 11.3% to 12.9%, although the rise in weighted-‐average tariffs was more substantial (from 6.22% to 13.49%).26 The 2006 DTIS flagged this increase as a potential source of regressivity (anti-‐poor bias) and trade diversion, and called for the 2009 CET review to cut the highest tariff band from 25% to 20% and to shrink the list of 58 sensitive products (the most important of which are sugar, grains, dairy products, and used garment).
Figure 27: Distribution of MFN tariff rates, before vs. after CET
(a) Pre-‐CET MFN rates (b) CET rates
010
2030
40Pe
rcen
t
0 10 20 30HS6 average rates
010
2030
40Pe
rcen
t
0 10 20 30HS6 average rates
Source: Mission calculations using TRAINS data
151. It appears that the CET review did not lead to reduced protection, as the top 25% rate was maintained and the list of sensitive products was not substantially reduced. The Government of Uganda may consider a study of the distributional and efficiency effects of current CET rates in order to come up with a reasoned position during the next CET review.
26 See World Bank (2006).
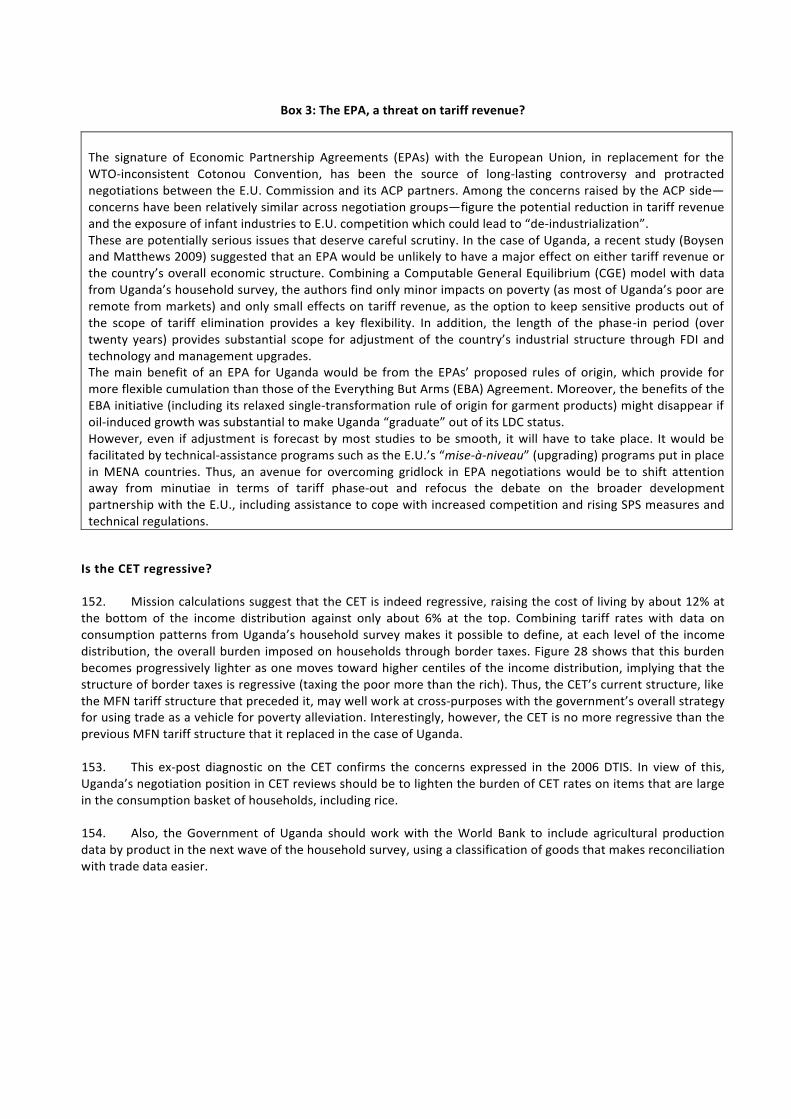
66
Box 3: The EPA, a threat on tariff revenue?
The signature of Economic Partnership Agreements (EPAs) with the European Union, in replacement for the WTO-‐inconsistent Cotonou Convention, has been the source of long-‐lasting controversy and protracted negotiations between the E.U. Commission and its ACP partners. Among the concerns raised by the ACP side—concerns have been relatively similar across negotiation groups—figure the potential reduction in tariff revenue and the exposure of infant industries to E.U. competition which could lead to “de-‐industrialization”. These are potentially serious issues that deserve careful scrutiny. In the case of Uganda, a recent study (Boysen and Matthews 2009) suggested that an EPA would be unlikely to have a major effect on either tariff revenue or the country’s overall economic structure. Combining a Computable General Equilibrium (CGE) model with data from Uganda’s household survey, the authors find only minor impacts on poverty (as most of Uganda’s poor are remote from markets) and only small effects on tariff revenue, as the option to keep sensitive products out of the scope of tariff elimination provides a key flexibility. In addition, the length of the phase-‐in period (over twenty years) provides substantial scope for adjustment of the country’s industrial structure through FDI and technology and management upgrades. The main benefit of an EPA for Uganda would be from the EPAs’ proposed rules of origin, which provide for more flexible cumulation than those of the Everything But Arms (EBA) Agreement. Moreover, the benefits of the EBA initiative (including its relaxed single-‐transformation rule of origin for garment products) might disappear if oil-‐induced growth was substantial to make Uganda “graduate” out of its LDC status. However, even if adjustment is forecast by most studies to be smooth, it will have to take place. It would be facilitated by technical-‐assistance programs such as the E.U.’s “mise-‐à-‐niveau” (upgrading) programs put in place in MENA countries. Thus, an avenue for overcoming gridlock in EPA negotiations would be to shift attention away from minutiae in terms of tariff phase-‐out and refocus the debate on the broader development partnership with the E.U., including assistance to cope with increased competition and rising SPS measures and technical regulations.
Is the CET regressive? 152. Mission calculations suggest that the CET is indeed regressive, raising the cost of living by about 12% at the bottom of the income distribution against only about 6% at the top. Combining tariff rates with data on consumption patterns from Uganda’s household survey makes it possible to define, at each level of the income distribution, the overall burden imposed on households through border taxes. Figure 28 shows that this burden becomes progressively lighter as one moves toward higher centiles of the income distribution, implying that the structure of border taxes is regressive (taxing the poor more than the rich). Thus, the CET’s current structure, like the MFN tariff structure that preceded it, may well work at cross-‐purposes with the government’s overall strategy for using trade as a vehicle for poverty alleviation. Interestingly, however, the CET is no more regressive than the previous MFN tariff structure that it replaced in the case of Uganda.
153. This ex-‐post diagnostic on the CET confirms the concerns expressed in the 2006 DTIS. In view of this, Uganda’s negotiation position in CET reviews should be to lighten the burden of CET rates on items that are large in the consumption basket of households, including rice.
154. Also, the Government of Uganda should work with the World Bank to include agricultural production data by product in the next wave of the household survey, using a classification of goods that makes reconciliation with trade data easier.
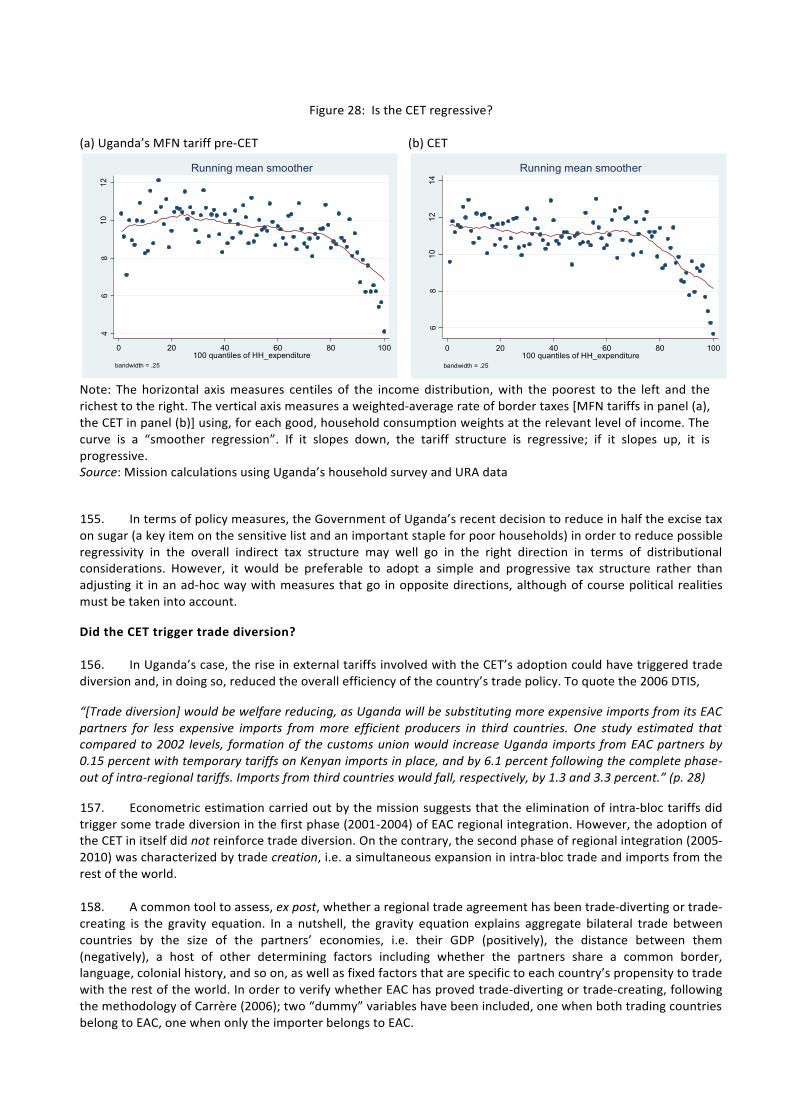
67
Figure 28: Is the CET regressive?
(a) Uganda’s MFN tariff pre-‐CET (b) CET
46
810
12
(mea
n) n
ewde
lta_m
fn
0 20 40 60 80 100100 quantiles of HH_expenditure
bandwidth = .25
Running mean smoother
68
1012
14
(mea
n) n
ewde
lta_m
fn
0 20 40 60 80 100100 quantiles of HH_expenditure
bandwidth = .25
Running mean smoother
Note: The horizontal axis measures centiles of the income distribution, with the poorest to the left and the richest to the right. The vertical axis measures a weighted-‐average rate of border taxes [MFN tariffs in panel (a), the CET in panel (b)] using, for each good, household consumption weights at the relevant level of income. The curve is a “smoother regression”. If it slopes down, the tariff structure is regressive; if it slopes up, it is progressive. Source: Mission calculations using Uganda’s household survey and URA data
155. In terms of policy measures, the Government of Uganda’s recent decision to reduce in half the excise tax on sugar (a key item on the sensitive list and an important staple for poor households) in order to reduce possible regressivity in the overall indirect tax structure may well go in the right direction in terms of distributional considerations. However, it would be preferable to adopt a simple and progressive tax structure rather than adjusting it in an ad-‐hoc way with measures that go in opposite directions, although of course political realities must be taken into account.
Did the CET trigger trade diversion? 156. In Uganda’s case, the rise in external tariffs involved with the CET’s adoption could have triggered trade diversion and, in doing so, reduced the overall efficiency of the country’s trade policy. To quote the 2006 DTIS,
“[Trade diversion] would be welfare reducing, as Uganda will be substituting more expensive imports from its EAC partners for less expensive imports from more efficient producers in third countries. One study estimated that compared to 2002 levels, formation of the customs union would increase Uganda imports from EAC partners by 0.15 percent with temporary tariffs on Kenyan imports in place, and by 6.1 percent following the complete phase-‐out of intra-‐regional tariffs. Imports from third countries would fall, respectively, by 1.3 and 3.3 percent.” (p. 28)
157. Econometric estimation carried out by the mission suggests that the elimination of intra-‐bloc tariffs did trigger some trade diversion in the first phase (2001-‐2004) of EAC regional integration. However, the adoption of the CET in itself did not reinforce trade diversion. On the contrary, the second phase of regional integration (2005-‐2010) was characterized by trade creation, i.e. a simultaneous expansion in intra-‐bloc trade and imports from the rest of the world.
158. A common tool to assess, ex post, whether a regional trade agreement has been trade-‐diverting or trade-‐creating is the gravity equation. In a nutshell, the gravity equation explains aggregate bilateral trade between countries by the size of the partners’ economies, i.e. their GDP (positively), the distance between them (negatively), a host of other determining factors including whether the partners share a common border, language, colonial history, and so on, as well as fixed factors that are specific to each country’s propensity to trade with the rest of the world. In order to verify whether EAC has proved trade-‐diverting or trade-‐creating, following the methodology of Carrère (2006); two “dummy” variables have been included, one when both trading countries belong to EAC, one when only the importer belongs to EAC.
• If only the first or both have a positive and significant effect on trade, EAC is trade-‐creating.
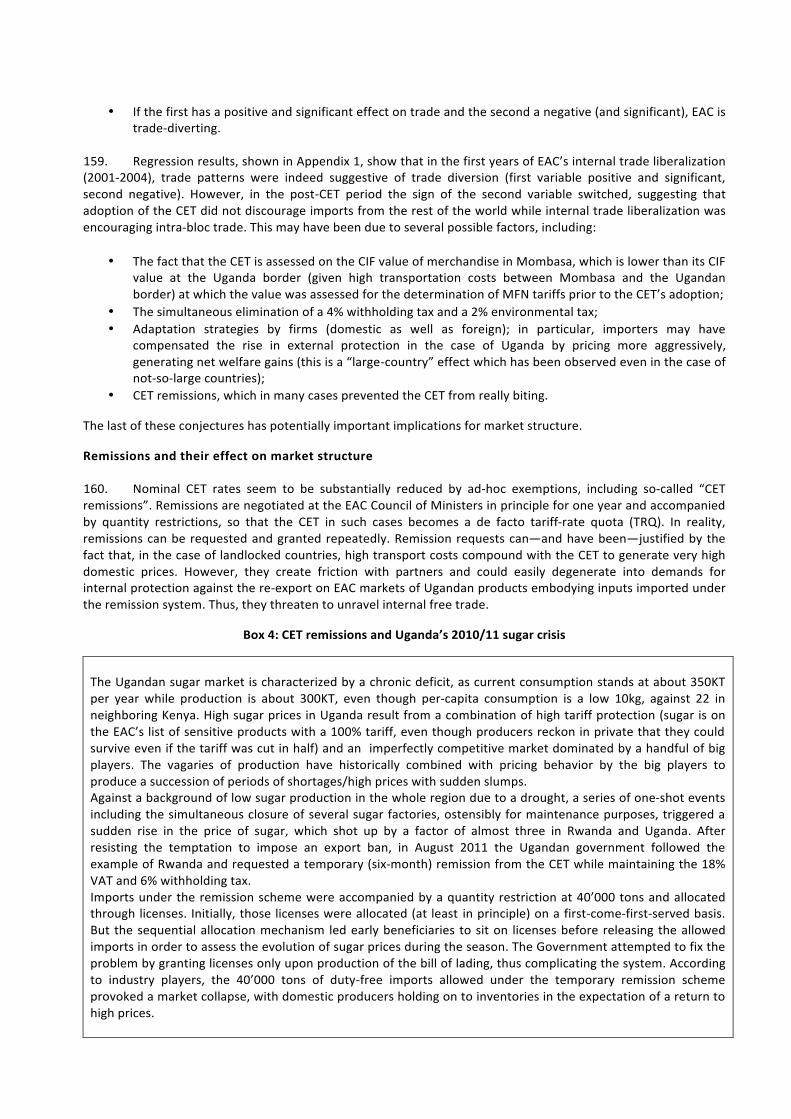
68
• If the first has a positive and significant effect on trade and the second a negative (and significant), EAC is trade-‐diverting.
159. Regression results, shown in Appendix 1, show that in the first years of EAC’s internal trade liberalization (2001-‐2004), trade patterns were indeed suggestive of trade diversion (first variable positive and significant, second negative). However, in the post-‐CET period the sign of the second variable switched, suggesting that adoption of the CET did not discourage imports from the rest of the world while internal trade liberalization was encouraging intra-‐bloc trade. This may have been due to several possible factors, including:
• The fact that the CET is assessed on the CIF value of merchandise in Mombasa, which is lower than its CIF
value at the Uganda border (given high transportation costs between Mombasa and the Ugandan border) at which the value was assessed for the determination of MFN tariffs prior to the CET’s adoption;
• The simultaneous elimination of a 4% withholding tax and a 2% environmental tax; • Adaptation strategies by firms (domestic as well as foreign); in particular, importers may have
compensated the rise in external protection in the case of Uganda by pricing more aggressively, generating net welfare gains (this is a “large-‐country” effect which has been observed even in the case of not-‐so-‐large countries);
• CET remissions, which in many cases prevented the CET from really biting.
The last of these conjectures has potentially important implications for market structure.
Remissions and their effect on market structure 160. Nominal CET rates seem to be substantially reduced by ad-‐hoc exemptions, including so-‐called “CET remissions”. Remissions are negotiated at the EAC Council of Ministers in principle for one year and accompanied by quantity restrictions, so that the CET in such cases becomes a de facto tariff-‐rate quota (TRQ). In reality, remissions can be requested and granted repeatedly. Remission requests can—and have been—justified by the fact that, in the case of landlocked countries, high transport costs compound with the CET to generate very high domestic prices. However, they create friction with partners and could easily degenerate into demands for internal protection against the re-‐export on EAC markets of Ugandan products embodying inputs imported under the remission system. Thus, they threaten to unravel internal free trade.
Box 4: CET remissions and Uganda’s 2010/11 sugar crisis
The Ugandan sugar market is characterized by a chronic deficit, as current consumption stands at about 350KT per year while production is about 300KT, even though per-‐capita consumption is a low 10kg, against 22 in neighboring Kenya. High sugar prices in Uganda result from a combination of high tariff protection (sugar is on the EAC’s list of sensitive products with a 100% tariff, even though producers reckon in private that they could survive even if the tariff was cut in half) and an imperfectly competitive market dominated by a handful of big players. The vagaries of production have historically combined with pricing behavior by the big players to produce a succession of periods of shortages/high prices with sudden slumps. Against a background of low sugar production in the whole region due to a drought, a series of one-‐shot events including the simultaneous closure of several sugar factories, ostensibly for maintenance purposes, triggered a sudden rise in the price of sugar, which shot up by a factor of almost three in Rwanda and Uganda. After resisting the temptation to impose an export ban, in August 2011 the Ugandan government followed the example of Rwanda and requested a temporary (six-‐month) remission from the CET while maintaining the 18% VAT and 6% withholding tax. Imports under the remission scheme were accompanied by a quantity restriction at 40’000 tons and allocated through licenses. Initially, those licenses were allocated (at least in principle) on a first-‐come-‐first-‐served basis. But the sequential allocation mechanism led early beneficiaries to sit on licenses before releasing the allowed imports in order to assess the evolution of sugar prices during the season. The Government attempted to fix the problem by granting licenses only upon production of the bill of lading, thus complicating the system. According to industry players, the 40’000 tons of duty-‐free imports allowed under the temporary remission scheme provoked a market collapse, with domestic producers holding on to inventories in the expectation of a return to high prices.
69
161. For instance, every year Uganda requests a CET remission on imports of paper, which it considers a raw material, whereas a CET rate of 10% is imposed, originally with the purpose of protecting a paper plant in the EAC, although the plant in question was shut down in the meantime. Quantity restrictions accompanying remissions are allocated through licenses at the firm level, often generating rent-‐seeking activities and speculation (see Box 4: CET remissions and Uganda’s 2010/11 sugar crisis).
162. In 2011, the CET remission on heavy trucks was maintained, the CET rate on refrigerators parts was reduced from 25% to 10%, as was that on food supplements. The CET was removed on premixes for animal feeds and waived for motorcycle ambulances (Deloitte 2012). Remissions on rice (from 75% to 35% for one year, on wheat grain from 50% to 0%, and on maize grain from 10% to 0%) have been published by Kenya (see Deloitte 2012) but it is not clear whether or not they are also applied by Uganda. One key problem with the remissions system is its lack of transparency.
163. URA data communicated to the mission on effective duty payments by importers suggest that, in 2011, the average duty rate paid on imports from MFN (non-‐EAC) countries was 4.51%. Using URA data, Figure 29 shows paid rates calculated as the amount of customs duty rates on import shipments from MFN origins27 relative to shipment value (in percentage, on the vertical axis) against nominal CET rates (also in percentage, on the horizontal axis). Bubble size is proportional to the value of firm-‐level imports. Few of the bubbles are along the 45o line where they ought to be if CET duties were as per the nominal tariff schedule. Instead, many lie along the horizontal axis, meaning that no tariff is paid at all even though imports are from MFN sources.
Figure 29: Water in the CET?
0.00
20.0
040
.00
60.0
0
Paid
rate
0.00 20.00 40.00 60.00Nominal CET rate
Source: Mission calculations using URA data
164. In 2011, the difference between nominal CET duties and collected duties was at least $147 million (without counting imports from the E.U.), of which about a third was in mineral products (including fuels), followed by prepared foodstuffs and base metals.
27 The EU was excluded from MFN origins given the unclear status of EPA implementation.
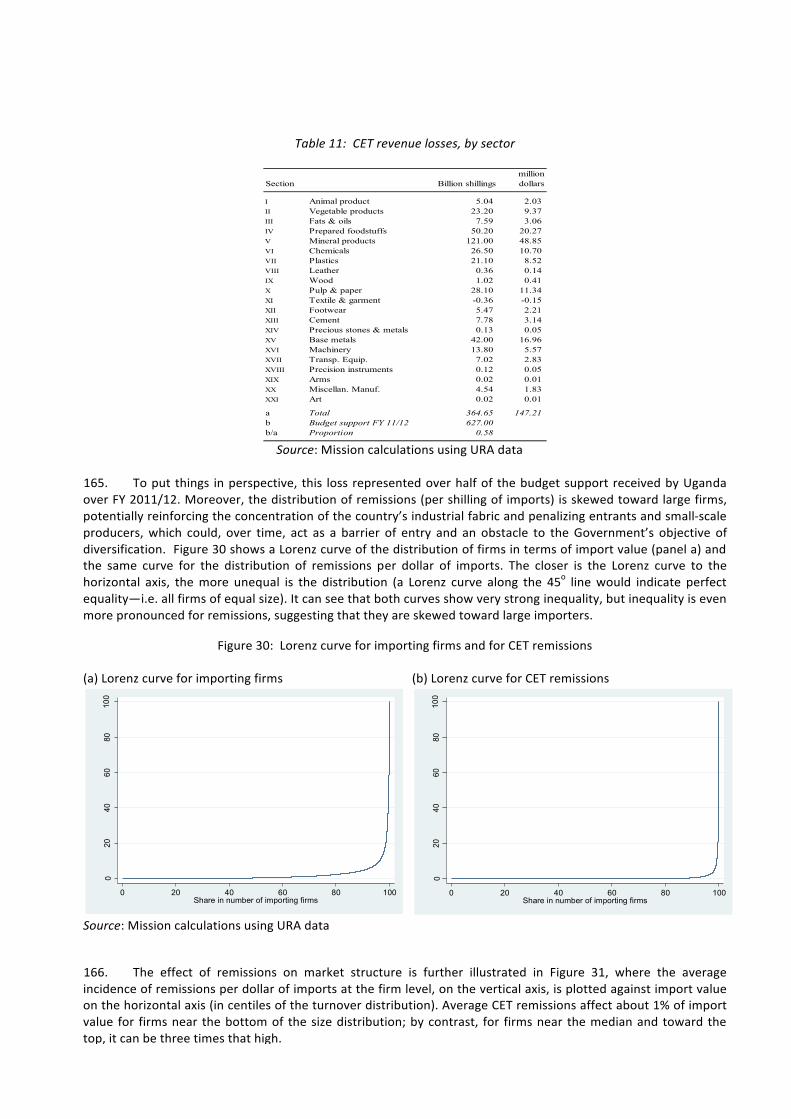
70
Table 11: CET revenue losses, by sector
Section Billion shillingsmillion dollars
I Animal product 5.04 2.03 II Vegetable products 23.20 9.37 III Fats & oils 7.59 3.06 IV Prepared foodstuffs 50.20 20.27 V Mineral products 121.00 48.85 VI Chemicals 26.50 10.70 VII Plastics 21.10 8.52 VIII Leather 0.36 0.14 IX Wood 1.02 0.41 X Pulp & paper 28.10 11.34 XI Textile & garment -0.36 -0.15 XII Footwear 5.47 2.21 XIII Cement 7.78 3.14 XIV Precious stones & metals 0.13 0.05 XV Base metals 42.00 16.96 XVI Machinery 13.80 5.57 XVII Transp. Equip. 7.02 2.83 XVIII Precision instruments 0.12 0.05 XIX Arms 0.02 0.01 XX Miscellan. Manuf. 4.54 1.83 XXI Art 0.02 0.01
a Total 364.65 147.21 b Budget support FY 11/12 627.00 b/a Proportion 0.58 Source: Mission calculations using URA data
165. To put things in perspective, this loss represented over half of the budget support received by Uganda over FY 2011/12. Moreover, the distribution of remissions (per shilling of imports) is skewed toward large firms, potentially reinforcing the concentration of the country’s industrial fabric and penalizing entrants and small-‐scale producers, which could, over time, act as a barrier of entry and an obstacle to the Government’s objective of diversification. Figure 30 shows a Lorenz curve of the distribution of firms in terms of import value (panel a) and the same curve for the distribution of remissions per dollar of imports. The closer is the Lorenz curve to the horizontal axis, the more unequal is the distribution (a Lorenz curve along the 45o line would indicate perfect equality—i.e. all firms of equal size). It can see that both curves show very strong inequality, but inequality is even more pronounced for remissions, suggesting that they are skewed toward large importers.
Figure 30: Lorenz curve for importing firms and for CET remissions
(a) Lorenz curve for importing firms (b) Lorenz curve for CET remissions
020
4060
8010
0
Shar
e in
tota
l im
ports
0 20 40 60 80 100Share in number of importing firms
020
4060
8010
0
Shar
e in
CET
rem
issi
ons
0 20 40 60 80 100Share in number of importing firms
Source: Mission calculations using URA data
166. The effect of remissions on market structure is further illustrated in Figure 31, where the average incidence of remissions per dollar of imports at the firm level, on the vertical axis, is plotted against import value on the horizontal axis (in centiles of the turnover distribution). Average CET remissions affect about 1% of import value for firms near the bottom of the size distribution; by contrast, for firms near the median and toward the top, it can be three times that high.
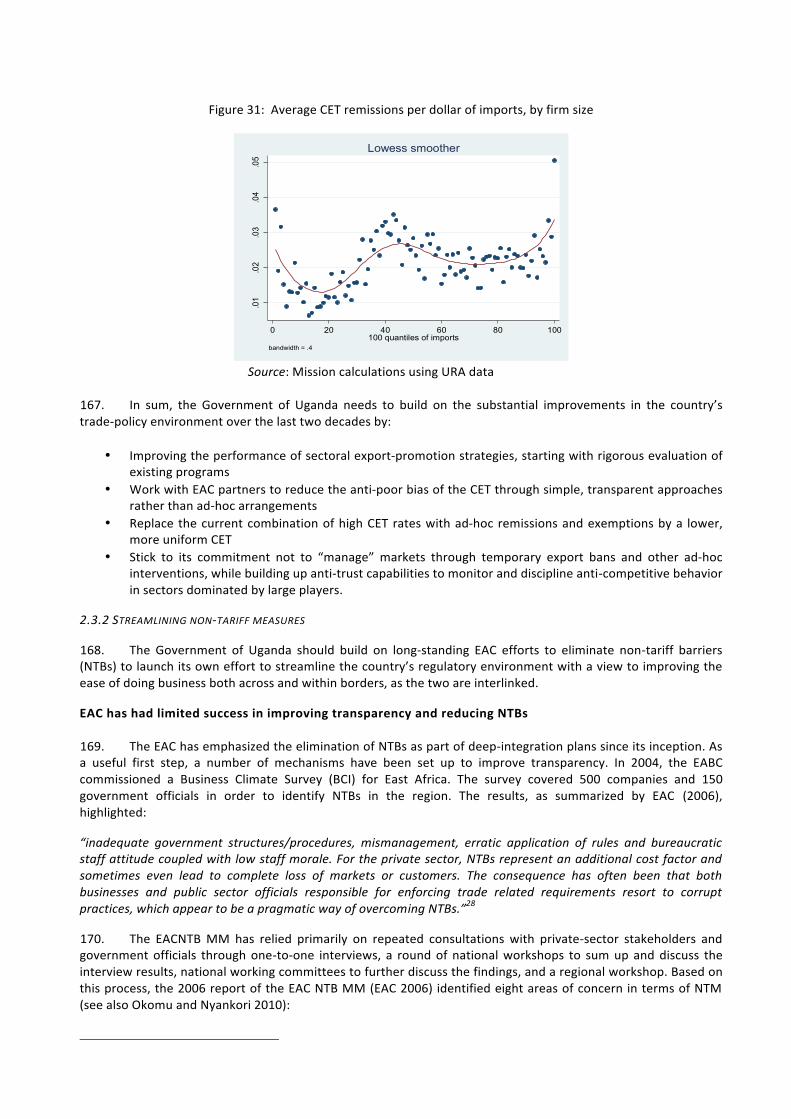
71
Figure 31: Average CET remissions per dollar of imports, by firm size
.01
.02
.03
.04
.05
Aver
age
CET
rem
issi
on p
er d
olla
r of i
mpo
rt
0 20 40 60 80 100100 quantiles of imports
bandwidth = .4
Lowess smoother
Source: Mission calculations using URA data
167. In sum, the Government of Uganda needs to build on the substantial improvements in the country’s trade-‐policy environment over the last two decades by:
• Improving the performance of sectoral export-‐promotion strategies, starting with rigorous evaluation of
existing programs • Work with EAC partners to reduce the anti-‐poor bias of the CET through simple, transparent approaches
rather than ad-‐hoc arrangements • Replace the current combination of high CET rates with ad-‐hoc remissions and exemptions by a lower,
more uniform CET • Stick to its commitment not to “manage” markets through temporary export bans and other ad-‐hoc
interventions, while building up anti-‐trust capabilities to monitor and discipline anti-‐competitive behavior in sectors dominated by large players.
2.3.2 STREAMLINING NON-‐TARIFF MEASURES
168. The Government of Uganda should build on long-‐standing EAC efforts to eliminate non-‐tariff barriers (NTBs) to launch its own effort to streamline the country’s regulatory environment with a view to improving the ease of doing business both across and within borders, as the two are interlinked.
EAC has had limited success in improving transparency and reducing NTBs 169. The EAC has emphasized the elimination of NTBs as part of deep-‐integration plans since its inception. As a useful first step, a number of mechanisms have been set up to improve transparency. In 2004, the EABC commissioned a Business Climate Survey (BCI) for East Africa. The survey covered 500 companies and 150 government officials in order to identify NTBs in the region. The results, as summarized by EAC (2006), highlighted:
“inadequate government structures/procedures, mismanagement, erratic application of rules and bureaucratic staff attitude coupled with low staff morale. For the private sector, NTBs represent an additional cost factor and sometimes even lead to complete loss of markets or customers. The consequence has often been that both businesses and public sector officials responsible for enforcing trade related requirements resort to corrupt practices, which appear to be a pragmatic way of overcoming NTBs.”28
170. The EACNTB MM has relied primarily on repeated consultations with private-‐sector stakeholders and government officials through one-‐to-‐one interviews, a round of national workshops to sum up and discuss the interview results, national working committees to further discuss the findings, and a regional workshop. Based on this process, the 2006 report of the EAC NTB MM (EAC 2006) identified eight areas of concern in terms of NTM (see also Okomu and Nyankori 2010):
28 EAC (2006), p. 3.
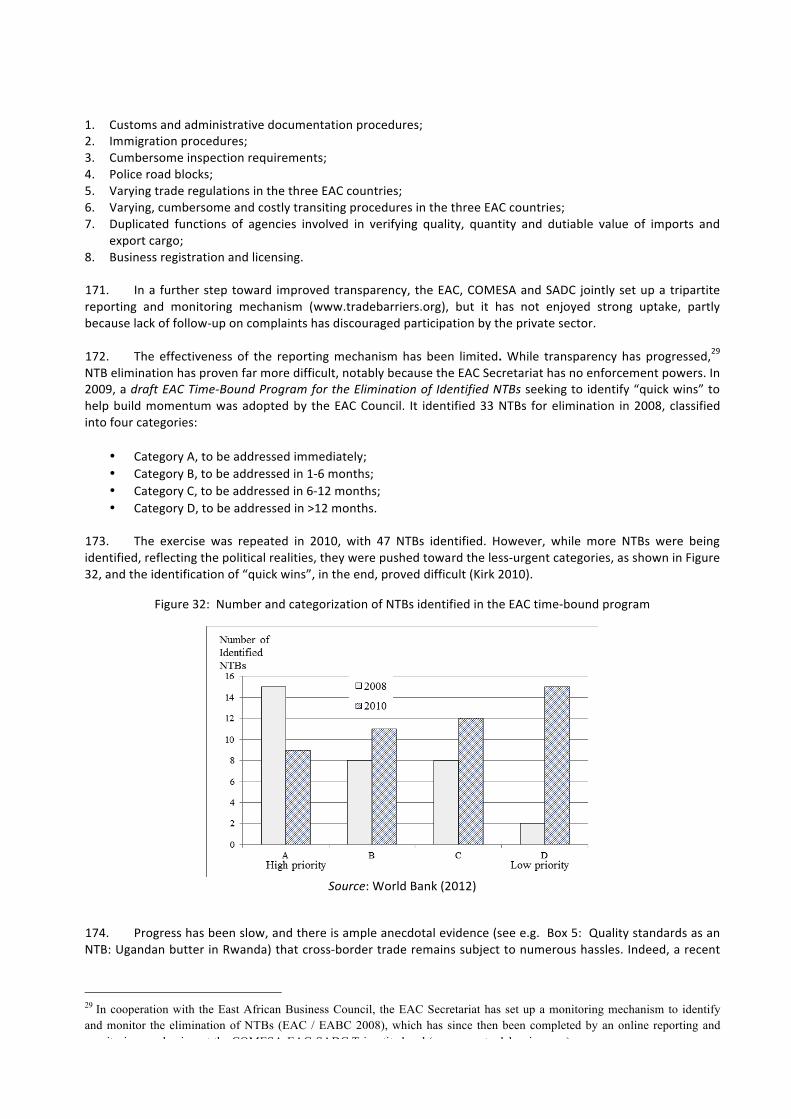
72
1. Customs and administrative documentation procedures; 2. Immigration procedures; 3. Cumbersome inspection requirements; 4. Police road blocks; 5. Varying trade regulations in the three EAC countries; 6. Varying, cumbersome and costly transiting procedures in the three EAC countries; 7. Duplicated functions of agencies involved in verifying quality, quantity and dutiable value of imports and
export cargo; 8. Business registration and licensing.
171. In a further step toward improved transparency, the EAC, COMESA and SADC jointly set up a tripartite reporting and monitoring mechanism (www.tradebarriers.org), but it has not enjoyed strong uptake, partly because lack of follow-‐up on complaints has discouraged participation by the private sector.
172. The effectiveness of the reporting mechanism has been limited. While transparency has progressed,29 NTB elimination has proven far more difficult, notably because the EAC Secretariat has no enforcement powers. In 2009, a draft EAC Time-‐Bound Program for the Elimination of Identified NTBs seeking to identify “quick wins” to help build momentum was adopted by the EAC Council. It identified 33 NTBs for elimination in 2008, classified into four categories:
• Category A, to be addressed immediately; • Category B, to be addressed in 1-‐6 months; • Category C, to be addressed in 6-‐12 months; • Category D, to be addressed in >12 months.
173. The exercise was repeated in 2010, with 47 NTBs identified. However, while more NTBs were being identified, reflecting the political realities, they were pushed toward the less-‐urgent categories, as shown in Figure 32, and the identification of “quick wins”, in the end, proved difficult (Kirk 2010).
Figure 32: Number and categorization of NTBs identified in the EAC time-‐bound program
Source: World Bank (2012)
174. Progress has been slow, and there is ample anecdotal evidence (see e.g. Box 5: Quality standards as an NTB: Ugandan butter in Rwanda) that cross-‐border trade remains subject to numerous hassles. Indeed, a recent
29 In cooperation with the East African Business Council, the EAC Secretariat has set up a monitoring mechanism to identify and monitor the elimination of NTBs (EAC / EABC 2008), which has since then been completed by an online reporting and monitoring mechanism at the COMESA-EAC-SADC Tripartite level (see: www.tradebarriers.org).
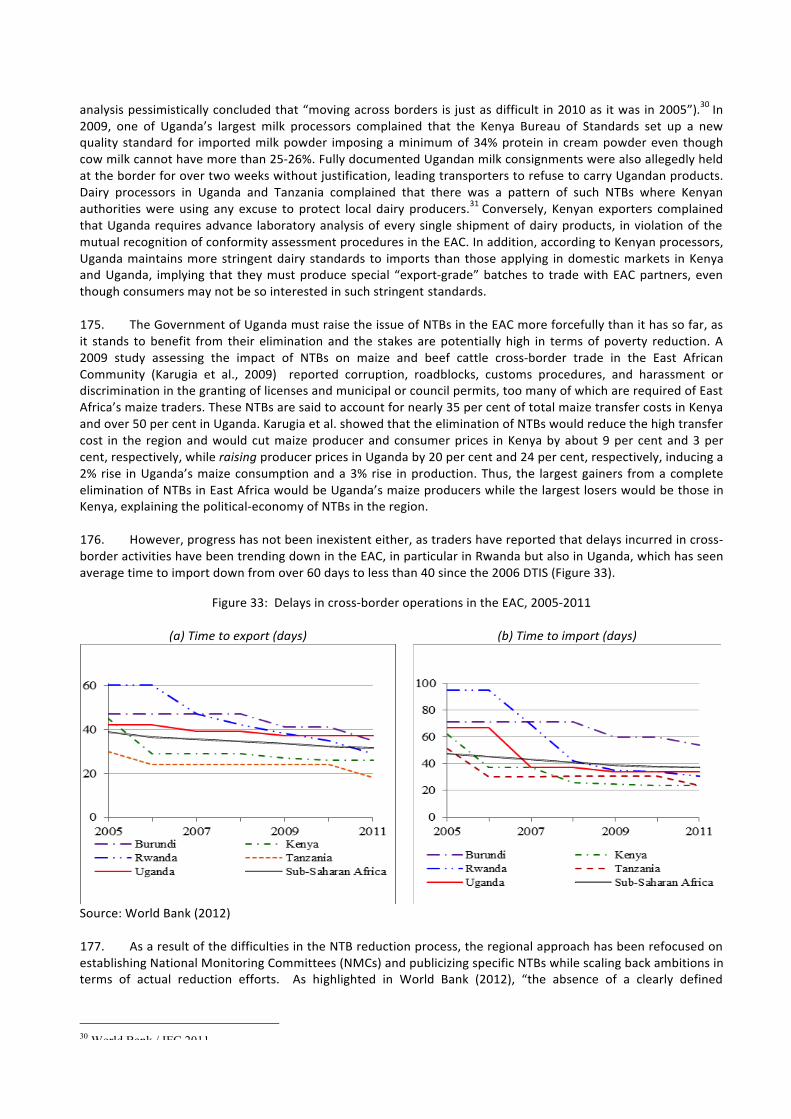
73
analysis pessimistically concluded that “moving across borders is just as difficult in 2010 as it was in 2005”).30 In 2009, one of Uganda’s largest milk processors complained that the Kenya Bureau of Standards set up a new quality standard for imported milk powder imposing a minimum of 34% protein in cream powder even though cow milk cannot have more than 25-‐26%. Fully documented Ugandan milk consignments were also allegedly held at the border for over two weeks without justification, leading transporters to refuse to carry Ugandan products. Dairy processors in Uganda and Tanzania complained that there was a pattern of such NTBs where Kenyan authorities were using any excuse to protect local dairy producers.31 Conversely, Kenyan exporters complained that Uganda requires advance laboratory analysis of every single shipment of dairy products, in violation of the mutual recognition of conformity assessment procedures in the EAC. In addition, according to Kenyan processors, Uganda maintains more stringent dairy standards to imports than those applying in domestic markets in Kenya and Uganda, implying that they must produce special “export-‐grade” batches to trade with EAC partners, even though consumers may not be so interested in such stringent standards.
175. The Government of Uganda must raise the issue of NTBs in the EAC more forcefully than it has so far, as it stands to benefit from their elimination and the stakes are potentially high in terms of poverty reduction. A 2009 study assessing the impact of NTBs on maize and beef cattle cross-‐border trade in the East African Community (Karugia et al., 2009) reported corruption, roadblocks, customs procedures, and harassment or discrimination in the granting of licenses and municipal or council permits, too many of which are required of East Africa’s maize traders. These NTBs are said to account for nearly 35 per cent of total maize transfer costs in Kenya and over 50 per cent in Uganda. Karugia et al. showed that the elimination of NTBs would reduce the high transfer cost in the region and would cut maize producer and consumer prices in Kenya by about 9 per cent and 3 per cent, respectively, while raising producer prices in Uganda by 20 per cent and 24 per cent, respectively, inducing a 2% rise in Uganda’s maize consumption and a 3% rise in production. Thus, the largest gainers from a complete elimination of NTBs in East Africa would be Uganda’s maize producers while the largest losers would be those in Kenya, explaining the political-‐economy of NTBs in the region.
176. However, progress has not been inexistent either, as traders have reported that delays incurred in cross-‐border activities have been trending down in the EAC, in particular in Rwanda but also in Uganda, which has seen average time to import down from over 60 days to less than 40 since the 2006 DTIS (Figure 33).
Figure 33: Delays in cross-‐border operations in the EAC, 2005-‐2011
(a) Time to export (days) (b) Time to import (days)
Source: World Bank (2012) 177. As a result of the difficulties in the NTB reduction process, the regional approach has been refocused on establishing National Monitoring Committees (NMCs) and publicizing specific NTBs while scaling back ambitions in terms of actual reduction efforts. As highlighted in World Bank (2012), “the absence of a clearly defined
30 World Bank / IFC 2011. 31 See Jensen and Keyser, 2012.
74
monitoring mechanism with time limits for action means each Partner State is responsible for voluntarily removing or reforming listed NTBs without being subject to possible sanctions for non-‐compliance.”
178. Given the limited progress made at the EAC-‐level, bilateral negotiations on NTB-‐removal have recently been initiated by member states, notably landlocked ones. For instance, in January 2012 Rwanda started discussions with Uganda on NTB matters. Meanwhile, transparency on NTMs in the EAC has improved with the collection of official NTM data in the EAC by the World Bank and UNCTAD (see Cadot and Malouche 2012).32
Box 5: Quality standards as an NTB: Ugandan butter in Rwanda
“A good example of how quality standards and laboratory testing requirements can militate against formal sector trade is the story of Uganda’s exports of butter to Rwanda. In this case, Rwanda’s only licensed trader bringing butter into the country decided to stop imports because of difficulties with recognition of Ugandan quality certificates and demands for additional laboratory tests by the Rwanda Bureau of Standards (RBS). According to the importer, this was because the batch numbers were not identical throughout each consignment since the butter was manufactured on different days. This problem also meant the trader could not obtain pre-‐clearance for the goods. As a result, the importer decided it would be easier to stop trading in butter and cancelled all orders with the Ugandan supplier. Despite this move, Ugandan butter remained on store shelves in Kigali. As explained by border officials, it is impractical to stop small consignments from crossing and many dairy products are brought into Rwanda in small quantities, sometimes in cool boxes but otherwise with no refrigeration or other kinds of quality control. Similar to how formal sector dairy chains have a difficult time competing with informal milk vendors in domestic markets this story shows that formal traders also have a difficult time competing with informal traders in the international market. While the efforts to regulate dairy trade and harmonize regional standards may seem like an obvious step towards an improved trade regime, therefore, such moves can actually have negative consequences for formal sector operators. While it is important to have a well-‐regulated trade system, the system must be cost competitive and simple to use in order to avoid creating further competitiveness constraints for formal dairy operators.”
Source: Jensen and Keyser (2012), p. 191.
NTMs vs. NTBs 179. Non-‐tariff measures are not bad things in general. Any society needs regulations to protect local and global public goods such as public health or the environment, and the fact that some of those regulations may raise business or trade costs does not make them illegitimate or contrary to WTO rules. In addition, as consumer incomes go up, concerns about food and environmental safety typically rise, leading to more widespread regulations of product attributes (sanitary and technical) and hence to heavier NTM coverage ratios.33
180. However, legitimate NTMs must be imposed only in response to what economists call a “market failure” such as a negative externality. NTMs which do not constitute appropriate responses to market failures are non-‐tariff barriers (NTBs) and may run afoul of WTO rules. Thus, whether a regulation is WTO-‐consistent or not provides a convenient test, although not a sufficient one, of whether it is an NTB or not. GATT Article VII (concerning customs valuation), the WTO’s Technical Barriers to Trade (TBT) and Sanitary and Phyto-‐Sanitary (SPS) agreements, and a number of rules on import-‐licensing procedures34 contain disciplines regarding NTBs. Their objective is to discourage “regulatory protectionism”, based on three basic principles: (i) non-‐discrimination, (ii) transparency, and (iii) proportionality.
181. The SPS and TBT agreements recognize the right of member states to adopt regulations that potentially affect trade with other member states, but impose three types of disciplines on those regulations:
• On the process of adoption of the measures and on their implementation:
32 The quantitative analysis in this report is largely based on that data. 33 The coverage ratio of NTMs is the proportion of imports covered by one or more NTM. 34 See Cadot, Maliszewska and Saez (2010).
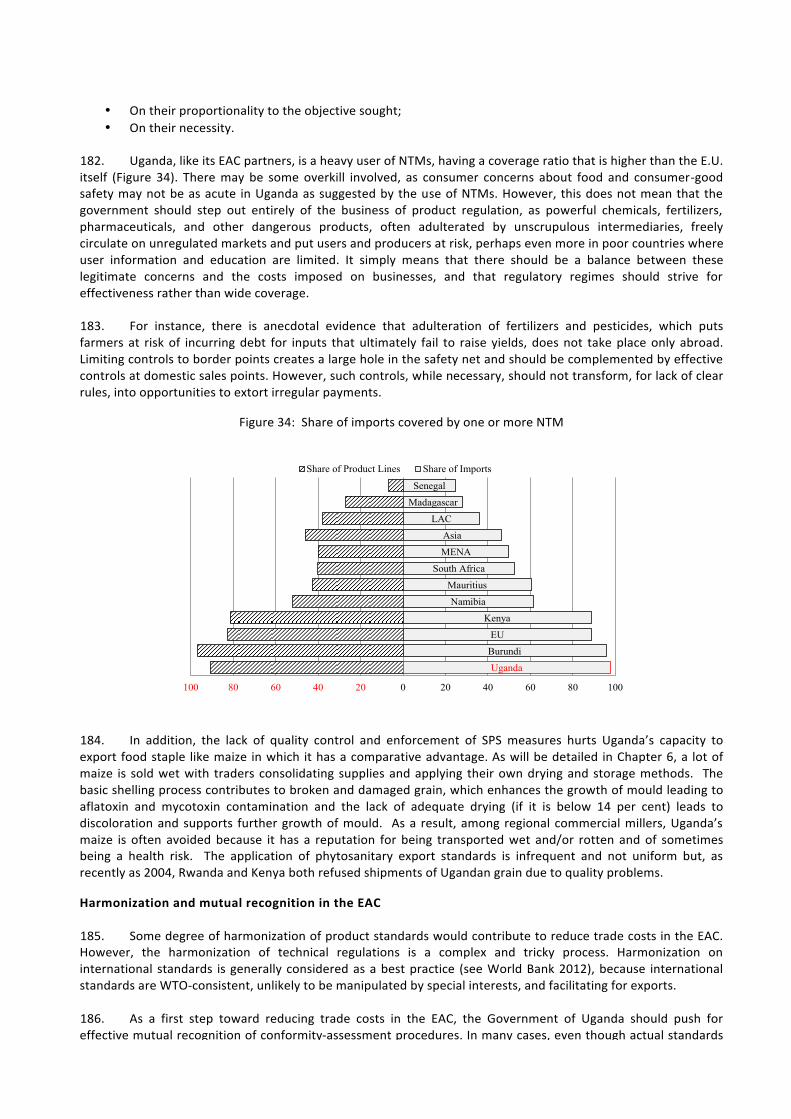
75
• On their proportionality to the objective sought; • On their necessity.
182. Uganda, like its EAC partners, is a heavy user of NTMs, having a coverage ratio that is higher than the E.U. itself (Figure 34). There may be some overkill involved, as consumer concerns about food and consumer-‐good safety may not be as acute in Uganda as suggested by the use of NTMs. However, this does not mean that the government should step out entirely of the business of product regulation, as powerful chemicals, fertilizers, pharmaceuticals, and other dangerous products, often adulterated by unscrupulous intermediaries, freely circulate on unregulated markets and put users and producers at risk, perhaps even more in poor countries where user information and education are limited. It simply means that there should be a balance between these legitimate concerns and the costs imposed on businesses, and that regulatory regimes should strive for effectiveness rather than wide coverage.
183. For instance, there is anecdotal evidence that adulteration of fertilizers and pesticides, which puts farmers at risk of incurring debt for inputs that ultimately fail to raise yields, does not take place only abroad. Limiting controls to border points creates a large hole in the safety net and should be complemented by effective controls at domestic sales points. However, such controls, while necessary, should not transform, for lack of clear rules, into opportunities to extort irregular payments.
Figure 34: Share of imports covered by one or more NTM
Uganda
Burundi
EU
Kenya
Namibia
Mauritius
South Africa
MENA
Asia
LAC
Madagascar
Senegal
100 80 60 40 20 0 20 40 60 80 100
Share of Product Lines Share of Imports
184. In addition, the lack of quality control and enforcement of SPS measures hurts Uganda’s capacity to export food staple like maize in which it has a comparative advantage. As will be detailed in Chapter 6, a lot of maize is sold wet with traders consolidating supplies and applying their own drying and storage methods. The basic shelling process contributes to broken and damaged grain, which enhances the growth of mould leading to aflatoxin and mycotoxin contamination and the lack of adequate drying (if it is below 14 per cent) leads to discoloration and supports further growth of mould. As a result, among regional commercial millers, Uganda’s maize is often avoided because it has a reputation for being transported wet and/or rotten and of sometimes being a health risk. The application of phytosanitary export standards is infrequent and not uniform but, as recently as 2004, Rwanda and Kenya both refused shipments of Ugandan grain due to quality problems.
Harmonization and mutual recognition in the EAC 185. Some degree of harmonization of product standards would contribute to reduce trade costs in the EAC. However, the harmonization of technical regulations is a complex and tricky process. Harmonization on international standards is generally considered as a best practice (see World Bank 2012), because international standards are WTO-‐consistent, unlikely to be manipulated by special interests, and facilitating for exports.
186. As a first step toward reducing trade costs in the EAC, the Government of Uganda should push for effective mutual recognition of conformity-‐assessment procedures. In many cases, even though actual standards are very close between EAC member states, conformity certificates are not accepted. Disciplining border and
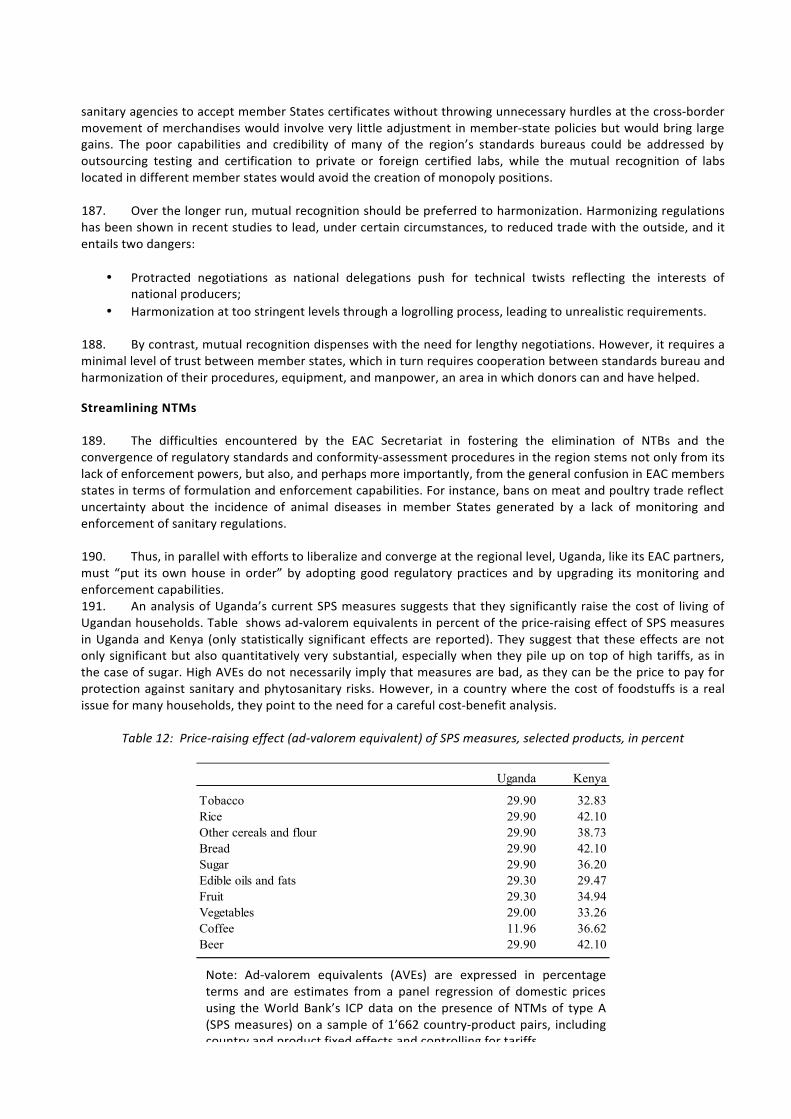
76
sanitary agencies to accept member States certificates without throwing unnecessary hurdles at the cross-‐border movement of merchandises would involve very little adjustment in member-‐state policies but would bring large gains. The poor capabilities and credibility of many of the region’s standards bureaus could be addressed by outsourcing testing and certification to private or foreign certified labs, while the mutual recognition of labs located in different member states would avoid the creation of monopoly positions.
187. Over the longer run, mutual recognition should be preferred to harmonization. Harmonizing regulations has been shown in recent studies to lead, under certain circumstances, to reduced trade with the outside, and it entails two dangers:
• Protracted negotiations as national delegations push for technical twists reflecting the interests of
national producers; • Harmonization at too stringent levels through a logrolling process, leading to unrealistic requirements.
188. By contrast, mutual recognition dispenses with the need for lengthy negotiations. However, it requires a minimal level of trust between member states, which in turn requires cooperation between standards bureau and harmonization of their procedures, equipment, and manpower, an area in which donors can and have helped.
Streamlining NTMs
189. The difficulties encountered by the EAC Secretariat in fostering the elimination of NTBs and the convergence of regulatory standards and conformity-‐assessment procedures in the region stems not only from its lack of enforcement powers, but also, and perhaps more importantly, from the general confusion in EAC members states in terms of formulation and enforcement capabilities. For instance, bans on meat and poultry trade reflect uncertainty about the incidence of animal diseases in member States generated by a lack of monitoring and enforcement of sanitary regulations.
190. Thus, in parallel with efforts to liberalize and converge at the regional level, Uganda, like its EAC partners, must “put its own house in order” by adopting good regulatory practices and by upgrading its monitoring and enforcement capabilities. 191. An analysis of Uganda’s current SPS measures suggests that they significantly raise the cost of living of Ugandan households. Table shows ad-‐valorem equivalents in percent of the price-‐raising effect of SPS measures in Uganda and Kenya (only statistically significant effects are reported). They suggest that these effects are not only significant but also quantitatively very substantial, especially when they pile up on top of high tariffs, as in the case of sugar. High AVEs do not necessarily imply that measures are bad, as they can be the price to pay for protection against sanitary and phytosanitary risks. However, in a country where the cost of foodstuffs is a real issue for many households, they point to the need for a careful cost-‐benefit analysis.
Table 12: Price-‐raising effect (ad-‐valorem equivalent) of SPS measures, selected products, in percent
Uganda Kenya
Tobacco 29.90 32.83Rice 29.90 42.10Other cereals and flour 29.90 38.73Bread 29.90 42.10Sugar 29.90 36.20Edible oils and fats 29.30 29.47Fruit 29.30 34.94Vegetables 29.00 33.26Coffee 11.96 36.62Beer 29.90 42.10
Note: Ad-‐valorem equivalents (AVEs) are expressed in percentage terms and are estimates from a panel regression of domestic prices using the World Bank’s ICP data on the presence of NTMs of type A (SPS measures) on a sample of 1’662 country-‐product pairs, including country and product fixed effects and controlling for tariffs. Source: Cadot and Gourdon (2012)
77
192. A quantitative analysis of the divergence of Uganda’s SPS measures from international best practice (IBP) suggests that the country is no outlier in terms of the application of those measures, and is in fact doing significantly better (closer to IBP) than neighboring Kenya. The result of the analysis is shown in Figure 35, which displays a dissimilarity index between the pattern of SPS measures applied at the product level Uganda vs. two IBP country groups used as benchmarks. Details of the index’s construction are given in Appendix 2. Uganda is in a group whose pattern of application of SPS measures at the product level is relatively close to IBP, although of course this only says that the Uganda tends to apply the same types of SPS measures to the same types of products as IBP countries, but says nothing about enforcement capabilities on the ground. It may even be that applying a sophisticated type of measure o a certain product is a good idea in a country with strong capabilities, but a bad one for a country with weak ones. Nonetheless, the convergence of regulatory patterns toward IBP, even if only on paper, is a first step toward improved regulatory governance.
193. However, application on the ground is still very weak. In the critical maize sector, the 2006 DTIS action matrix called for attention to be focused on establishing a coherent and agreed-‐upon vision for promoting and managing standards to improve export competitiveness and increase returns to primary producers, traders, and processors. Unfortunately very little progress if any has been achieved35.
Figure 35: Dissimilarity index of Uganda’s pattern of SPS measures and international best practices
-
10.00
20.00
30.00
40.00
50.00
60.00
70.00
KEN PHL SEN THA BGD MAR URY PRY UGA ARG IDN KAZ
Average distance to IBP
Average distance to middle income IBP
Note: Bar height measures the distance between the pattern of SPS measures at the product level for Uganda and that for two benchmarks, defined largely by data availability: A high-‐income best-‐practice group made of the E.U. and Japan, and a middle-‐income best-‐practice group made of Chile, Mexico and Mauritius. Source: Mission calculations using the UNCTAD/World Bank NTM database.
194. To be fair, and while limited Sanitary and Phyto-‐sanitary (SPS) capacity has undoubtedly constrained Uganda’s maize exports, a quick summary of the standards that are being called for shows why the issue is so daunting for the industry (DTIS, 2006):
• Food Safety: Microbiological standards, Limits on Pesticide residues, Mycotoxins • Plant Health: Fumigation requirements or restrictions • Quality or Technical Attributes: Quality grades, GMO labeling, Nutritional labels • Environment: Biosafety/GMO regulations, Codes for organic practices and certification
35 Two respondents who were there at the time recall the DTIS as stopping fairly suddenly with insufficient championing after the report came out. The process was exhausting and the report was huge and perhaps hard to digest. And, as time passed, there were always new priorities. There was clearly inadequate anchoring within GoU.
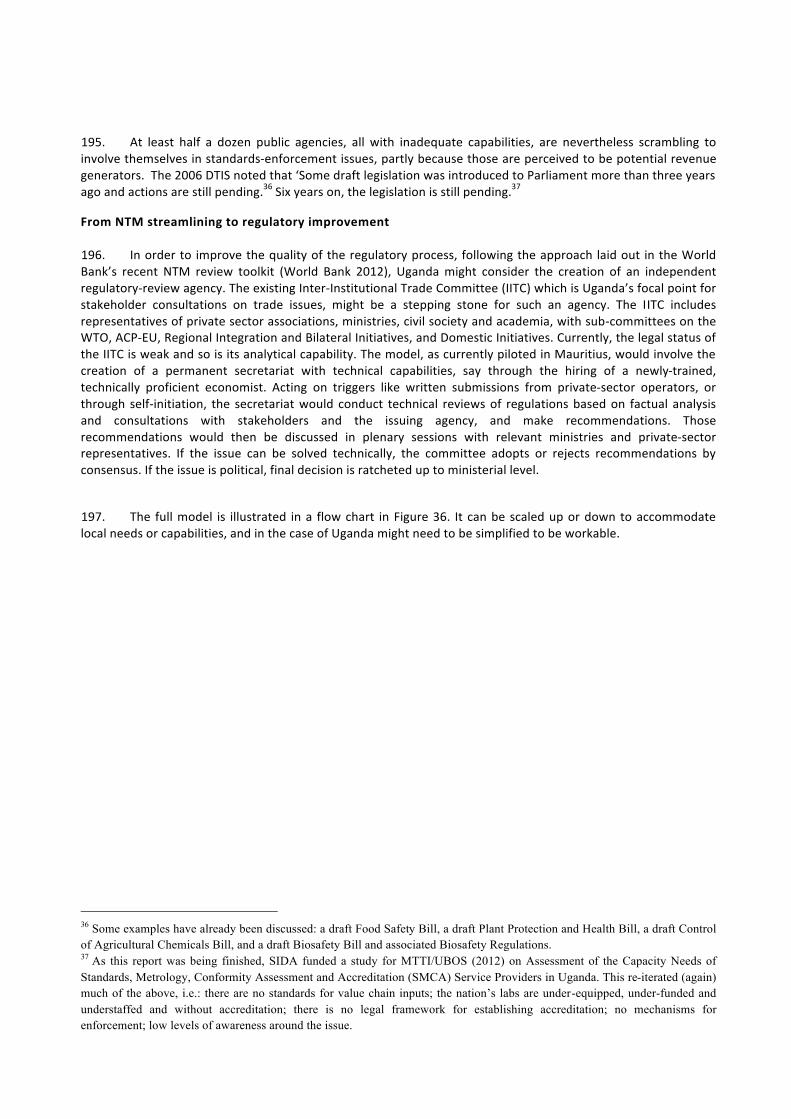
78
195. At least half a dozen public agencies, all with inadequate capabilities, are nevertheless scrambling to involve themselves in standards-‐enforcement issues, partly because those are perceived to be potential revenue generators. The 2006 DTIS noted that ‘Some draft legislation was introduced to Parliament more than three years ago and actions are still pending.36 Six years on, the legislation is still pending.37
From NTM streamlining to regulatory improvement 196. In order to improve the quality of the regulatory process, following the approach laid out in the World Bank’s recent NTM review toolkit (World Bank 2012), Uganda might consider the creation of an independent regulatory-‐review agency. The existing Inter-‐Institutional Trade Committee (IITC) which is Uganda’s focal point for stakeholder consultations on trade issues, might be a stepping stone for such an agency. The IITC includes representatives of private sector associations, ministries, civil society and academia, with sub-‐committees on the WTO, ACP-‐EU, Regional Integration and Bilateral Initiatives, and Domestic Initiatives. Currently, the legal status of the IITC is weak and so is its analytical capability. The model, as currently piloted in Mauritius, would involve the creation of a permanent secretariat with technical capabilities, say through the hiring of a newly-‐trained, technically proficient economist. Acting on triggers like written submissions from private-‐sector operators, or through self-‐initiation, the secretariat would conduct technical reviews of regulations based on factual analysis and consultations with stakeholders and the issuing agency, and make recommendations. Those recommendations would then be discussed in plenary sessions with relevant ministries and private-‐sector representatives. If the issue can be solved technically, the committee adopts or rejects recommendations by consensus. If the issue is political, final decision is ratcheted up to ministerial level.
197. The full model is illustrated in a flow chart in Figure 36. It can be scaled up or down to accommodate local needs or capabilities, and in the case of Uganda might need to be simplified to be workable.
36 Some examples have already been discussed: a draft Food Safety Bill, a draft Plant Protection and Health Bill, a draft Control of Agricultural Chemicals Bill, and a draft Biosafety Bill and associated Biosafety Regulations. 37 As this report was being finished, SIDA funded a study for MTTI/UBOS (2012) on Assessment of the Capacity Needs of Standards, Metrology, Conformity Assessment and Accreditation (SMCA) Service Providers in Uganda. This re-iterated (again) much of the above, i.e.: there are no standards for value chain inputs; the nation’s labs are under-equipped, under-funded and understaffed and without accreditation; there is no legal framework for establishing accreditation; no mechanisms for enforcement; low levels of awareness around the issue.
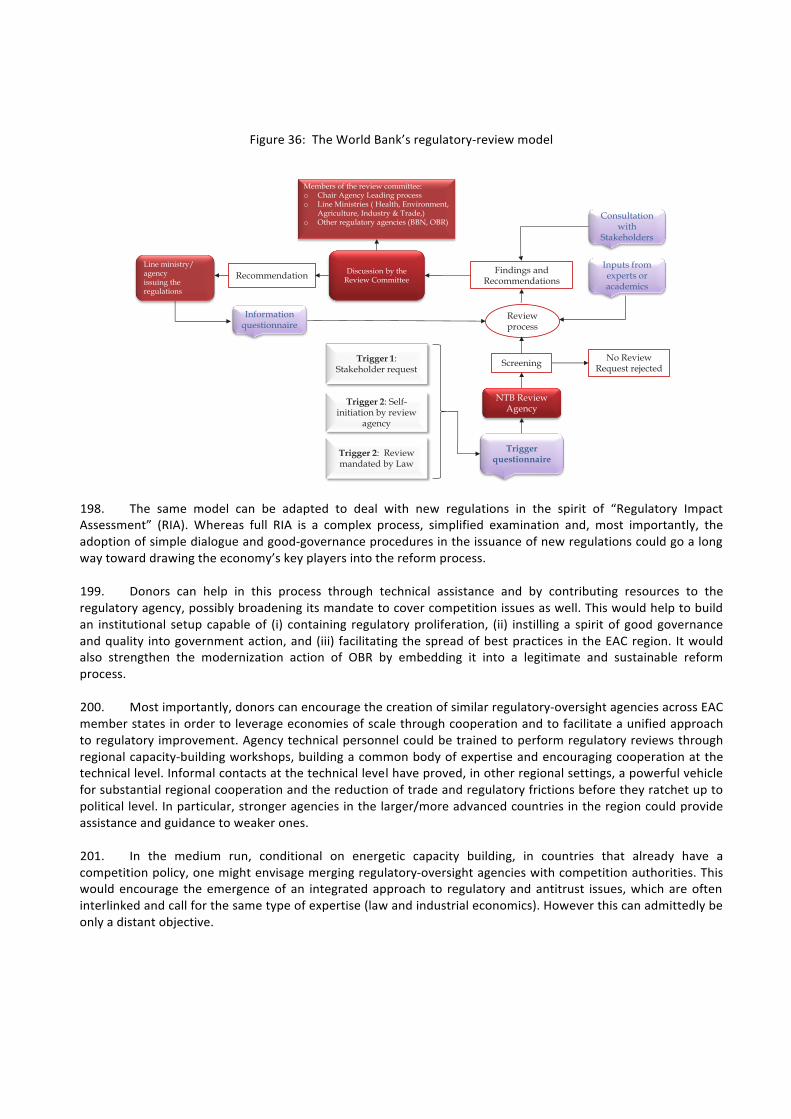
79
Figure 36: The World Bank’s regulatory-‐review model
Discussion by the Review Committee
Information questionnaire
Trigger 1: Stakeholder request
Trigger 2: Self-initiation by review
agency
Review process
Consultation with
Stakeholders
No Review Request rejected
NTB Review Agency
Line ministry/ agencyissuing the regulations
Recommendation
Trigger questionnaire
Screening
Findings and Recommendations
Trigger 2: Review mandated by Law
Inputs from experts or academics
Members of the review committee:o Chair Agency Leading processo Line Ministries ( Health, Environment,
Agriculture, Industry & Trade,)o Other regulatory agencies (BBN, OBR)
198. The same model can be adapted to deal with new regulations in the spirit of “Regulatory Impact Assessment” (RIA). Whereas full RIA is a complex process, simplified examination and, most importantly, the adoption of simple dialogue and good-‐governance procedures in the issuance of new regulations could go a long way toward drawing the economy’s key players into the reform process.
199. Donors can help in this process through technical assistance and by contributing resources to the regulatory agency, possibly broadening its mandate to cover competition issues as well. This would help to build an institutional setup capable of (i) containing regulatory proliferation, (ii) instilling a spirit of good governance and quality into government action, and (iii) facilitating the spread of best practices in the EAC region. It would also strengthen the modernization action of OBR by embedding it into a legitimate and sustainable reform process.
200. Most importantly, donors can encourage the creation of similar regulatory-‐oversight agencies across EAC member states in order to leverage economies of scale through cooperation and to facilitate a unified approach to regulatory improvement. Agency technical personnel could be trained to perform regulatory reviews through regional capacity-‐building workshops, building a common body of expertise and encouraging cooperation at the technical level. Informal contacts at the technical level have proved, in other regional settings, a powerful vehicle for substantial regional cooperation and the reduction of trade and regulatory frictions before they ratchet up to political level. In particular, stronger agencies in the larger/more advanced countries in the region could provide assistance and guidance to weaker ones.
201. In the medium run, conditional on energetic capacity building, in countries that already have a competition policy, one might envisage merging regulatory-‐oversight agencies with competition authorities. This would encourage the emergence of an integrated approach to regulatory and antitrust issues, which are often interlinked and call for the same type of expertise (law and industrial economics). However this can admittedly be only a distant objective.
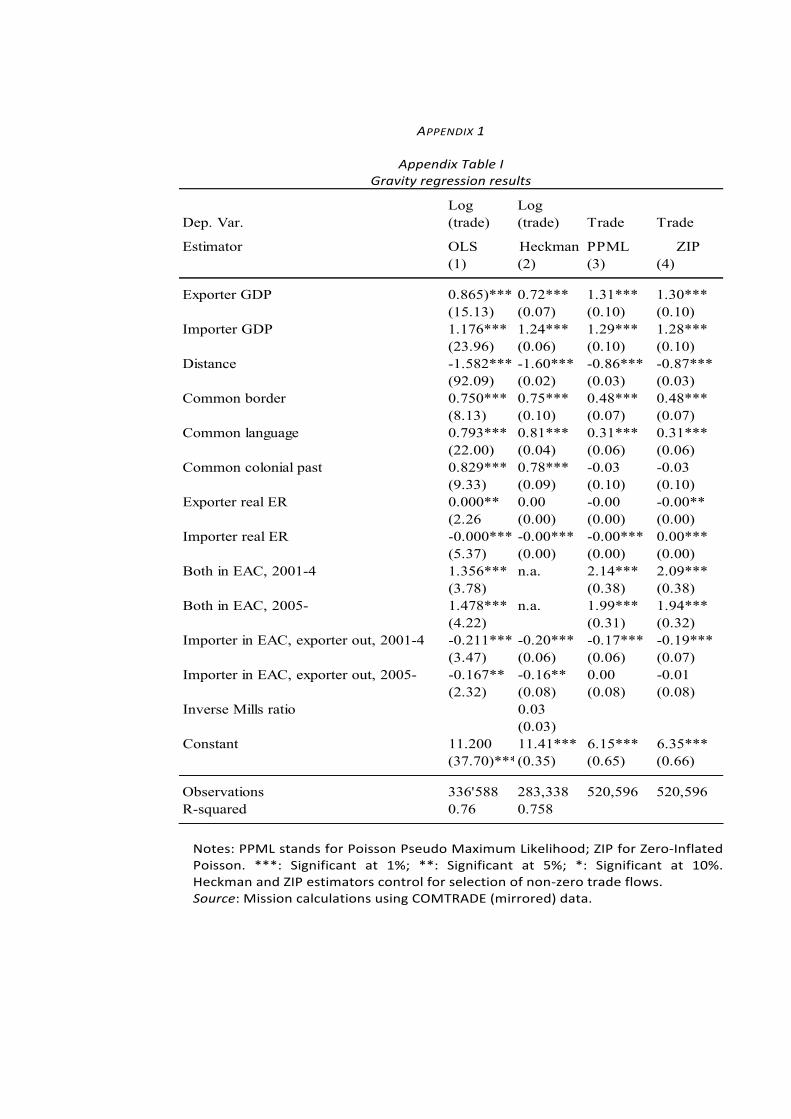
80
APPENDIX 1
Appendix Table I Gravity regression results
Dep. Var.Log (trade)
Log (trade) Trade Trade
Estimator OLS Heckman PPML ZIP(1) (2) (3) (4)
Exporter GDP 0.865)*** 0.72*** 1.31*** 1.30***(15.13) (0.07) (0.10) (0.10)
Importer GDP 1.176*** 1.24*** 1.29*** 1.28***(23.96) (0.06) (0.10) (0.10)
Distance -1.582*** -1.60*** -0.86*** -0.87***(92.09) (0.02) (0.03) (0.03)
Common border 0.750*** 0.75*** 0.48*** 0.48***(8.13) (0.10) (0.07) (0.07)
Common language 0.793*** 0.81*** 0.31*** 0.31***(22.00) (0.04) (0.06) (0.06)
Common colonial past 0.829*** 0.78*** -0.03 -0.03(9.33) (0.09) (0.10) (0.10)
Exporter real ER 0.000** 0.00 -0.00 -0.00**(2.26 (0.00) (0.00) (0.00)
Importer real ER -0.000*** -0.00*** -0.00*** 0.00***(5.37) (0.00) (0.00) (0.00)
Both in EAC, 2001-4 1.356*** n.a. 2.14*** 2.09***(3.78) (0.38) (0.38)
Both in EAC, 2005- 1.478*** n.a. 1.99*** 1.94***(4.22) (0.31) (0.32)
Importer in EAC, exporter out, 2001-4 -0.211*** -0.20*** -0.17*** -0.19***(3.47) (0.06) (0.06) (0.07)
Importer in EAC, exporter out, 2005- -0.167** -0.16** 0.00 -0.01(2.32) (0.08) (0.08) (0.08)
Inverse Mills ratio 0.03(0.03)
Constant 11.200 11.41*** 6.15*** 6.35***(37.70)***(0.35) (0.65) (0.66)
Observations 336'588 283,338 520,596 520,596R-squared 0.76 0.758
Notes: PPML stands for Poisson Pseudo Maximum Likelihood; ZIP for Zero-‐Inflated Poisson. ***: Significant at 1%; **: Significant at 5%; *: Significant at 10%. Heckman and ZIP estimators control for selection of non-‐zero trade flows. Source: Mission calculations using COMTRADE (mirrored) data.
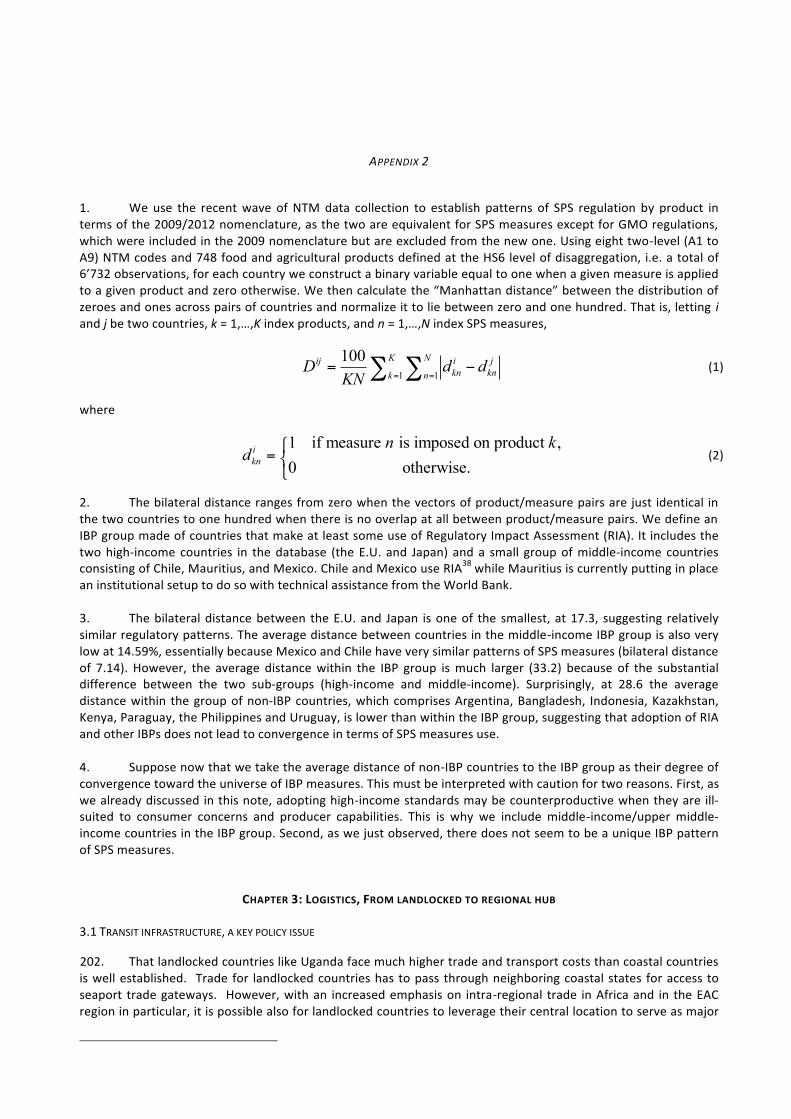
81
APPENDIX 2
1. We use the recent wave of NTM data collection to establish patterns of SPS regulation by product in terms of the 2009/2012 nomenclature, as the two are equivalent for SPS measures except for GMO regulations, which were included in the 2009 nomenclature but are excluded from the new one. Using eight two-‐level (A1 to A9) NTM codes and 748 food and agricultural products defined at the HS6 level of disaggregation, i.e. a total of 6’732 observations, for each country we construct a binary variable equal to one when a given measure is applied to a given product and zero otherwise. We then calculate the “Manhattan distance” between the distribution of zeroes and ones across pairs of countries and normalize it to lie between zero and one hundred. That is, letting i and j be two countries, k = 1,…,K index products, and n = 1,…,N index SPS measures,
1 1
100 K Nij i jkn knk n
D d dKN = =
= −∑ ∑ (1)
where
1 if measure is imposed on product ,0 otherwise.
ikn
n kd ⎧
= ⎨⎩
(2)
2. The bilateral distance ranges from zero when the vectors of product/measure pairs are just identical in the two countries to one hundred when there is no overlap at all between product/measure pairs. We define an IBP group made of countries that make at least some use of Regulatory Impact Assessment (RIA). It includes the two high-‐income countries in the database (the E.U. and Japan) and a small group of middle-‐income countries consisting of Chile, Mauritius, and Mexico. Chile and Mexico use RIA38 while Mauritius is currently putting in place an institutional setup to do so with technical assistance from the World Bank.
3. The bilateral distance between the E.U. and Japan is one of the smallest, at 17.3, suggesting relatively similar regulatory patterns. The average distance between countries in the middle-‐income IBP group is also very low at 14.59%, essentially because Mexico and Chile have very similar patterns of SPS measures (bilateral distance of 7.14). However, the average distance within the IBP group is much larger (33.2) because of the substantial difference between the two sub-‐groups (high-‐income and middle-‐income). Surprisingly, at 28.6 the average distance within the group of non-‐IBP countries, which comprises Argentina, Bangladesh, Indonesia, Kazakhstan, Kenya, Paraguay, the Philippines and Uruguay, is lower than within the IBP group, suggesting that adoption of RIA and other IBPs does not lead to convergence in terms of SPS measures use.
4. Suppose now that we take the average distance of non-‐IBP countries to the IBP group as their degree of convergence toward the universe of IBP measures. This must be interpreted with caution for two reasons. First, as we already discussed in this note, adopting high-‐income standards may be counterproductive when they are ill-‐suited to consumer concerns and producer capabilities. This is why we include middle-‐income/upper middle-‐income countries in the IBP group. Second, as we just observed, there does not seem to be a unique IBP pattern of SPS measures.
CHAPTER 3: LOGISTICS, FROM LANDLOCKED TO REGIONAL HUB
3.1 TRANSIT INFRASTRUCTURE, A KEY POLICY ISSUE
202. That landlocked countries like Uganda face much higher trade and transport costs than coastal countries is well established. Trade for landlocked countries has to pass through neighboring coastal states for access to seaport trade gateways. However, with an increased emphasis on intra-‐regional trade in Africa and in the EAC region in particular, it is possible also for landlocked countries to leverage their central location to serve as major
38 On Mexico’s experience, see Haddou (2012).
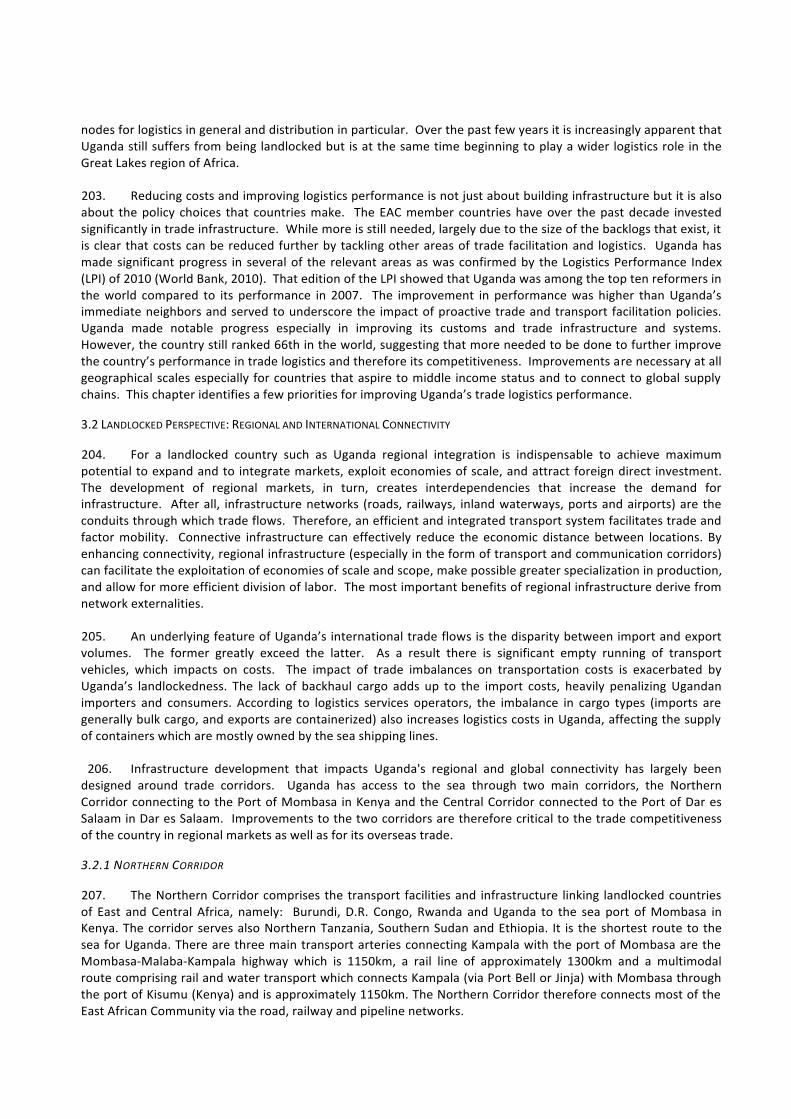
82
nodes for logistics in general and distribution in particular. Over the past few years it is increasingly apparent that Uganda still suffers from being landlocked but is at the same time beginning to play a wider logistics role in the Great Lakes region of Africa.
203. Reducing costs and improving logistics performance is not just about building infrastructure but it is also about the policy choices that countries make. The EAC member countries have over the past decade invested significantly in trade infrastructure. While more is still needed, largely due to the size of the backlogs that exist, it is clear that costs can be reduced further by tackling other areas of trade facilitation and logistics. Uganda has made significant progress in several of the relevant areas as was confirmed by the Logistics Performance Index (LPI) of 2010 (World Bank, 2010). That edition of the LPI showed that Uganda was among the top ten reformers in the world compared to its performance in 2007. The improvement in performance was higher than Uganda’s immediate neighbors and served to underscore the impact of proactive trade and transport facilitation policies. Uganda made notable progress especially in improving its customs and trade infrastructure and systems. However, the country still ranked 66th in the world, suggesting that more needed to be done to further improve the country’s performance in trade logistics and therefore its competitiveness. Improvements are necessary at all geographical scales especially for countries that aspire to middle income status and to connect to global supply chains. This chapter identifies a few priorities for improving Uganda’s trade logistics performance.
3.2 LANDLOCKED PERSPECTIVE: REGIONAL AND INTERNATIONAL CONNECTIVITY
204. For a landlocked country such as Uganda regional integration is indispensable to achieve maximum potential to expand and to integrate markets, exploit economies of scale, and attract foreign direct investment. The development of regional markets, in turn, creates interdependencies that increase the demand for infrastructure. After all, infrastructure networks (roads, railways, inland waterways, ports and airports) are the conduits through which trade flows. Therefore, an efficient and integrated transport system facilitates trade and factor mobility. Connective infrastructure can effectively reduce the economic distance between locations. By enhancing connectivity, regional infrastructure (especially in the form of transport and communication corridors) can facilitate the exploitation of economies of scale and scope, make possible greater specialization in production, and allow for more efficient division of labor. The most important benefits of regional infrastructure derive from network externalities.
205. An underlying feature of Uganda’s international trade flows is the disparity between import and export volumes. The former greatly exceed the latter. As a result there is significant empty running of transport vehicles, which impacts on costs. The impact of trade imbalances on transportation costs is exacerbated by Uganda’s landlockedness. The lack of backhaul cargo adds up to the import costs, heavily penalizing Ugandan importers and consumers. According to logistics services operators, the imbalance in cargo types (imports are generally bulk cargo, and exports are containerized) also increases logistics costs in Uganda, affecting the supply of containers which are mostly owned by the sea shipping lines.
206. Infrastructure development that impacts Uganda's regional and global connectivity has largely been designed around trade corridors. Uganda has access to the sea through two main corridors, the Northern Corridor connecting to the Port of Mombasa in Kenya and the Central Corridor connected to the Port of Dar es Salaam in Dar es Salaam. Improvements to the two corridors are therefore critical to the trade competitiveness of the country in regional markets as well as for its overseas trade.
3.2.1 NORTHERN CORRIDOR
207. The Northern Corridor comprises the transport facilities and infrastructure linking landlocked countries of East and Central Africa, namely: Burundi, D.R. Congo, Rwanda and Uganda to the sea port of Mombasa in Kenya. The corridor serves also Northern Tanzania, Southern Sudan and Ethiopia. It is the shortest route to the sea for Uganda. There are three main transport arteries connecting Kampala with the port of Mombasa are the Mombasa-‐Malaba-‐Kampala highway which is 1150km, a rail line of approximately 1300km and a multimodal route comprising rail and water transport which connects Kampala (via Port Bell or Jinja) with Mombasa through the port of Kisumu (Kenya) and is approximately 1150km. The Northern Corridor therefore connects most of the East African Community via the road, railway and pipeline networks.
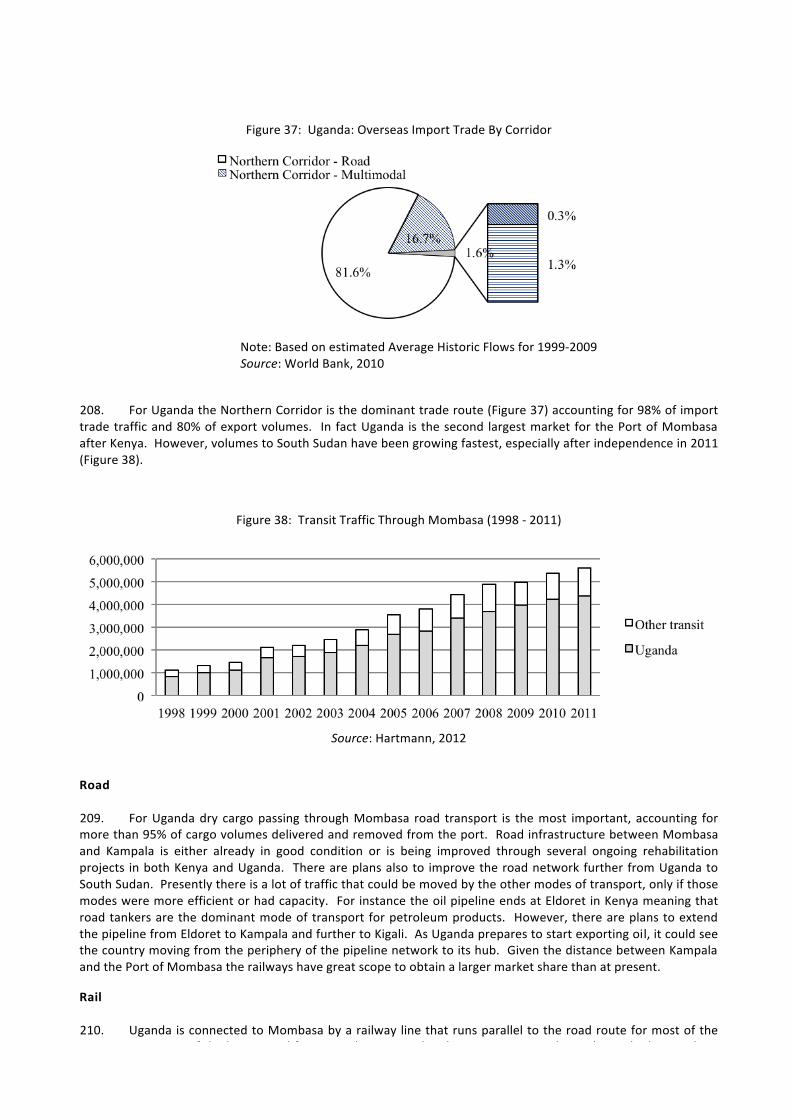
83
Figure 37: Uganda: Overseas Import Trade By Corridor
Note: Based on estimated Average Historic Flows for 1999-‐2009 Source: World Bank, 2010
208. For Uganda the Northern Corridor is the dominant trade route (Figure 37) accounting for 98% of import trade traffic and 80% of export volumes. In fact Uganda is the second largest market for the Port of Mombasa after Kenya. However, volumes to South Sudan have been growing fastest, especially after independence in 2011 (Figure 38).
Figure 38: Transit Traffic Through Mombasa (1998 -‐ 2011)
Source: Hartmann, 2012
Road 209. For Uganda dry cargo passing through Mombasa road transport is the most important, accounting for more than 95% of cargo volumes delivered and removed from the port. Road infrastructure between Mombasa and Kampala is either already in good condition or is being improved through several ongoing rehabilitation projects in both Kenya and Uganda. There are plans also to improve the road network further from Uganda to South Sudan. Presently there is a lot of traffic that could be moved by the other modes of transport, only if those modes were more efficient or had capacity. For instance the oil pipeline ends at Eldoret in Kenya meaning that road tankers are the dominant mode of transport for petroleum products. However, there are plans to extend the pipeline from Eldoret to Kampala and further to Kigali. As Uganda prepares to start exporting oil, it could see the country moving from the periphery of the pipeline network to its hub. Given the distance between Kampala and the Port of Mombasa the railways have great scope to obtain a larger market share than at present.
Rail 210. Uganda is connected to Mombasa by a railway line that runs parallel to the road route for most of the way. Construction of the line started from Mombasa towards Lake Victoria in 1896 but only reached Kampala in
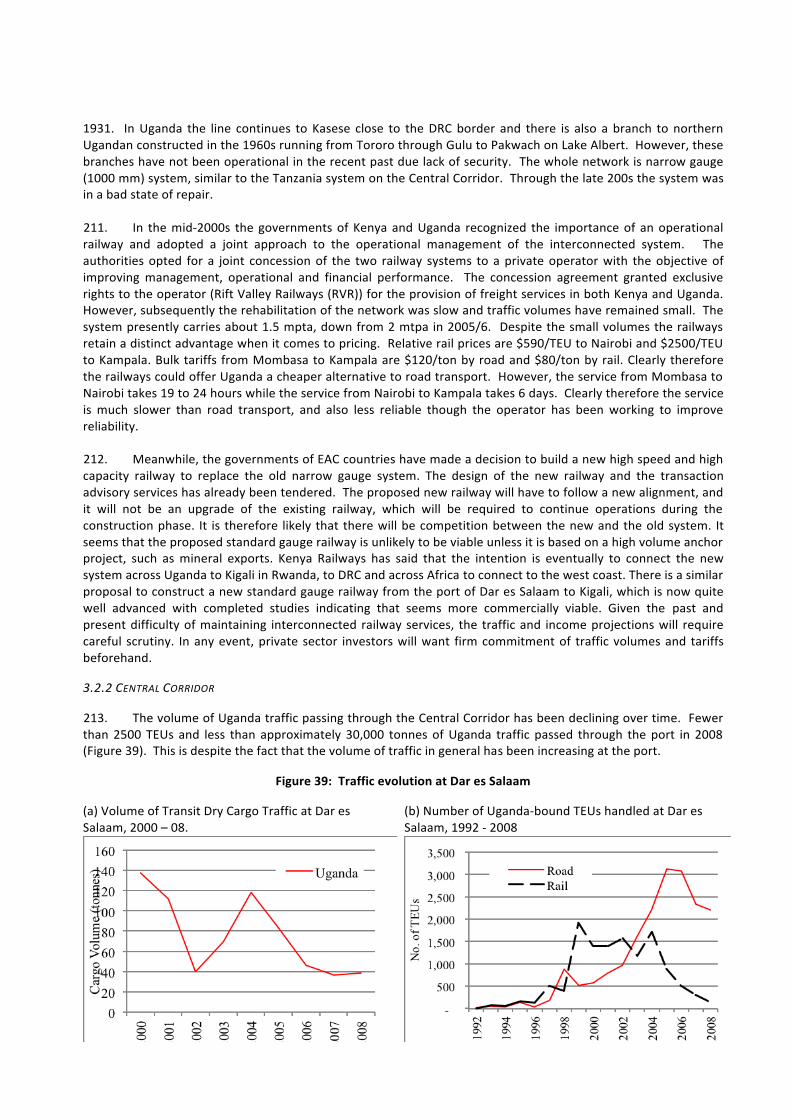
84
1931. In Uganda the line continues to Kasese close to the DRC border and there is also a branch to northern Ugandan constructed in the 1960s running from Tororo through Gulu to Pakwach on Lake Albert. However, these branches have not been operational in the recent past due lack of security. The whole network is narrow gauge (1000 mm) system, similar to the Tanzania system on the Central Corridor. Through the late 200s the system was in a bad state of repair.
211. In the mid-‐2000s the governments of Kenya and Uganda recognized the importance of an operational railway and adopted a joint approach to the operational management of the interconnected system. The authorities opted for a joint concession of the two railway systems to a private operator with the objective of improving management, operational and financial performance. The concession agreement granted exclusive rights to the operator (Rift Valley Railways (RVR)) for the provision of freight services in both Kenya and Uganda. However, subsequently the rehabilitation of the network was slow and traffic volumes have remained small. The system presently carries about 1.5 mpta, down from 2 mtpa in 2005/6. Despite the small volumes the railways retain a distinct advantage when it comes to pricing. Relative rail prices are $590/TEU to Nairobi and $2500/TEU to Kampala. Bulk tariffs from Mombasa to Kampala are $120/ton by road and $80/ton by rail. Clearly therefore the railways could offer Uganda a cheaper alternative to road transport. However, the service from Mombasa to Nairobi takes 19 to 24 hours while the service from Nairobi to Kampala takes 6 days. Clearly therefore the service is much slower than road transport, and also less reliable though the operator has been working to improve reliability.
212. Meanwhile, the governments of EAC countries have made a decision to build a new high speed and high capacity railway to replace the old narrow gauge system. The design of the new railway and the transaction advisory services has already been tendered. The proposed new railway will have to follow a new alignment, and it will not be an upgrade of the existing railway, which will be required to continue operations during the construction phase. It is therefore likely that there will be competition between the new and the old system. It seems that the proposed standard gauge railway is unlikely to be viable unless it is based on a high volume anchor project, such as mineral exports. Kenya Railways has said that the intention is eventually to connect the new system across Uganda to Kigali in Rwanda, to DRC and across Africa to connect to the west coast. There is a similar proposal to construct a new standard gauge railway from the port of Dar es Salaam to Kigali, which is now quite well advanced with completed studies indicating that seems more commercially viable. Given the past and present difficulty of maintaining interconnected railway services, the traffic and income projections will require careful scrutiny. In any event, private sector investors will want firm commitment of traffic volumes and tariffs beforehand.
3.2.2 CENTRAL CORRIDOR
213. The volume of Uganda traffic passing through the Central Corridor has been declining over time. Fewer than 2500 TEUs and less than approximately 30,000 tonnes of Uganda traffic passed through the port in 2008 (Figure 39). This is despite the fact that the volume of traffic in general has been increasing at the port.
Figure 39: Traffic evolution at Dar es Salaam
(a) Volume of Transit Dry Cargo Traffic at Dar es Salaam, 2000 – 08.
(b) Number of Uganda-‐bound TEUs handled at Dar es Salaam, 1992 -‐ 2008
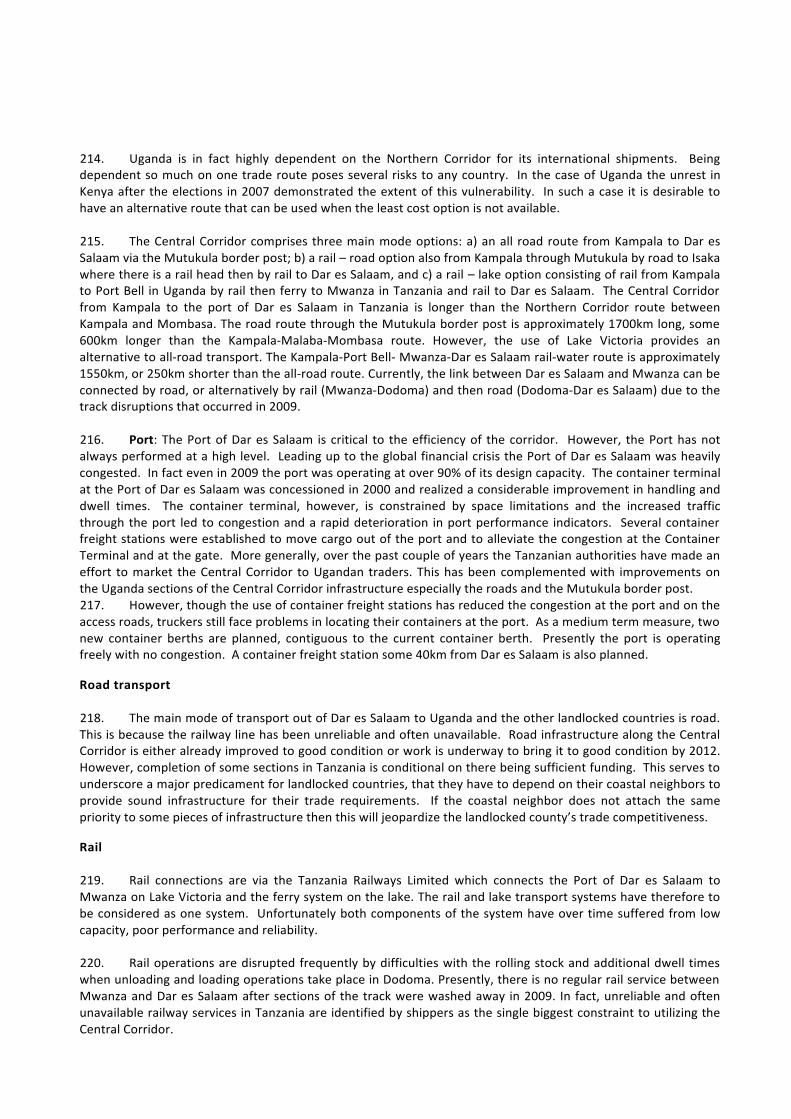
85
214. Uganda is in fact highly dependent on the Northern Corridor for its international shipments. Being dependent so much on one trade route poses several risks to any country. In the case of Uganda the unrest in Kenya after the elections in 2007 demonstrated the extent of this vulnerability. In such a case it is desirable to have an alternative route that can be used when the least cost option is not available.
215. The Central Corridor comprises three main mode options: a) an all road route from Kampala to Dar es Salaam via the Mutukula border post; b) a rail – road option also from Kampala through Mutukula by road to Isaka where there is a rail head then by rail to Dar es Salaam, and c) a rail – lake option consisting of rail from Kampala to Port Bell in Uganda by rail then ferry to Mwanza in Tanzania and rail to Dar es Salaam. The Central Corridor from Kampala to the port of Dar es Salaam in Tanzania is longer than the Northern Corridor route between Kampala and Mombasa. The road route through the Mutukula border post is approximately 1700km long, some 600km longer than the Kampala-‐Malaba-‐Mombasa route. However, the use of Lake Victoria provides an alternative to all-‐road transport. The Kampala-‐Port Bell-‐ Mwanza-‐Dar es Salaam rail-‐water route is approximately 1550km, or 250km shorter than the all-‐road route. Currently, the link between Dar es Salaam and Mwanza can be connected by road, or alternatively by rail (Mwanza-‐Dodoma) and then road (Dodoma-‐Dar es Salaam) due to the track disruptions that occurred in 2009.
216. Port: The Port of Dar es Salaam is critical to the efficiency of the corridor. However, the Port has not always performed at a high level. Leading up to the global financial crisis the Port of Dar es Salaam was heavily congested. In fact even in 2009 the port was operating at over 90% of its design capacity. The container terminal at the Port of Dar es Salaam was concessioned in 2000 and realized a considerable improvement in handling and dwell times. The container terminal, however, is constrained by space limitations and the increased traffic through the port led to congestion and a rapid deterioration in port performance indicators. Several container freight stations were established to move cargo out of the port and to alleviate the congestion at the Container Terminal and at the gate. More generally, over the past couple of years the Tanzanian authorities have made an effort to market the Central Corridor to Ugandan traders. This has been complemented with improvements on the Uganda sections of the Central Corridor infrastructure especially the roads and the Mutukula border post. 217. However, though the use of container freight stations has reduced the congestion at the port and on the access roads, truckers still face problems in locating their containers at the port. As a medium term measure, two new container berths are planned, contiguous to the current container berth. Presently the port is operating freely with no congestion. A container freight station some 40km from Dar es Salaam is also planned.
Road transport
218. The main mode of transport out of Dar es Salaam to Uganda and the other landlocked countries is road. This is because the railway line has been unreliable and often unavailable. Road infrastructure along the Central Corridor is either already improved to good condition or work is underway to bring it to good condition by 2012. However, completion of some sections in Tanzania is conditional on there being sufficient funding. This serves to underscore a major predicament for landlocked countries, that they have to depend on their coastal neighbors to provide sound infrastructure for their trade requirements. If the coastal neighbor does not attach the same priority to some pieces of infrastructure then this will jeopardize the landlocked county’s trade competitiveness.
Rail 219. Rail connections are via the Tanzania Railways Limited which connects the Port of Dar es Salaam to Mwanza on Lake Victoria and the ferry system on the lake. The rail and lake transport systems have therefore to be considered as one system. Unfortunately both components of the system have over time suffered from low capacity, poor performance and reliability.
220. Rail operations are disrupted frequently by difficulties with the rolling stock and additional dwell times when unloading and loading operations take place in Dodoma. Presently, there is no regular rail service between Mwanza and Dar es Salaam after sections of the track were washed away in 2009. In fact, unreliable and often unavailable railway services in Tanzania are identified by shippers as the single biggest constraint to utilizing the Central Corridor.
86
221. In addition services on the lake have not been reliable despite their great potential. Lake Victoria is the largest of all African lakes and the second widest in the world (length is 337 km and width 240km). Its surface area is approximately 69.500 km2 and is shared by Tanzania, Uganda and Kenya (49%, 45% and 6% respectively). Mean depth is 40m (max. depth 84m) and volume is 2,750 km2. There are several ports around the lake. The oldest ports, Kisumu and Port Bell were constructed at the same time the “Uganda” railway reached the lake in 1901 (as an alternative route to the mainline to Kampala which was only completed in 1931). The Mwanza ports (the South and North Ports designed respectively for cargo and passenger services) were constructed after a railway branch line from central Dar es Salaam-‐Kigoma railway was constructed between Tabora and Mwanza in 1928.
Table 13: Distances Between Main Ports on Lake Victoria
Distances Between Main Ports on Lake Victoria
Kenya Ports
Mwanza Musoma Kemondo Bay Port Bell Jinja Kisumu
Mwanza - 210 175 320 355 395Musoma 210 - 235 250Kemondo Bay 175 235 - 235 375Port Bell 320 250 235 - 285Jinja 355 - 235Kisumu 395 375 285 235 -
Lake VictoriaTanzania Ports Uganda Ports
Note: Distances are in km are rounded-‐up to the nearest 5km.
222. In the mid 1960’s rail-‐wagon terminals39 were constructed at Kisumu, Port Bell, Mwanza, Jinja, Musoma and Kemondo Bay40 with the intention of providing a seamless rail link around the lake (through neither Musoma nor Kemondo Bay are provided with a rail hinterland). Principal distances between these ports are shown in Table 13.
223. Services to these ports are provided by rail-‐wagon ferries. In the past there were five wagon ferries providing services: “Umoja” (constructed in 1964 and flagged in Tanzania), “Uhuru” (1966, Kenya) and “Kaawa”, “Pamba” and “Kabalega”41 (1981, 1982, 1984 respectively, Uganda). All these vessels are dedicated train ferries – designed to carry rail wagons which are shunted onto a single train deck over the stern -‐ of about 92m length, 16.5 m breadth and 4.2 m depth. Each has a deadweight carrying capacity is approximately 1,200 tons, though revenue deadweight (i.e. the measure of its freight earning potential) is approximately 880 tons -‐ empty flatbed container wagons can occupy approx. 30% its total deadweight capacity while empty enclosed type wagons for general cargo or liquid bulk can occupy between 46% and 55% total deadweight carrying capacity. If used exclusively on the Mwanza-‐Port Bell Route, combined they provided a freight task of approx. 110 wagons/day.
224. With the exception of the “Umoja” (which was refitted in Mwanza in 1990), the other vessels have not been operational following the sinking of the Kabalega in 2005. Together with the deterioration of train services on the Central Corridor the non-‐availability of four of the five wagon ferries resulted in a generally dilapidated rail and lake transport network such that it was characterized by inefficiency, unreliability, inconvenience and delay. Indeed and although originally forming the backbone of transport infrastructure, approximately 95% of all transit cargo through the Central Corridor gateway port at Dar es Salaam is now carried by road. However, Uganda in July 2012 completed rehabilitation of the MV Kaawa and the dry dock at Port Bell in Kampala. The vessel was waiting to enter service after tests for seaworthiness and insurance. It would be operated by the Kenya-‐Uganda 39 A rail wagon terminal is used to describe the total terminal area which forms a fixed shore based interface, specially constructed to enable rail wagons to be rolled on rolled off ships which are not provided with ramps, designed in this case exclusively for railway services. 40 Constructed in 1974 – some 22km south of Bukoba port. 41 The MV Kabalega was sunk on 8th May 2005 after a reported collision with the MV Kaawa some 90km from Port Bell.
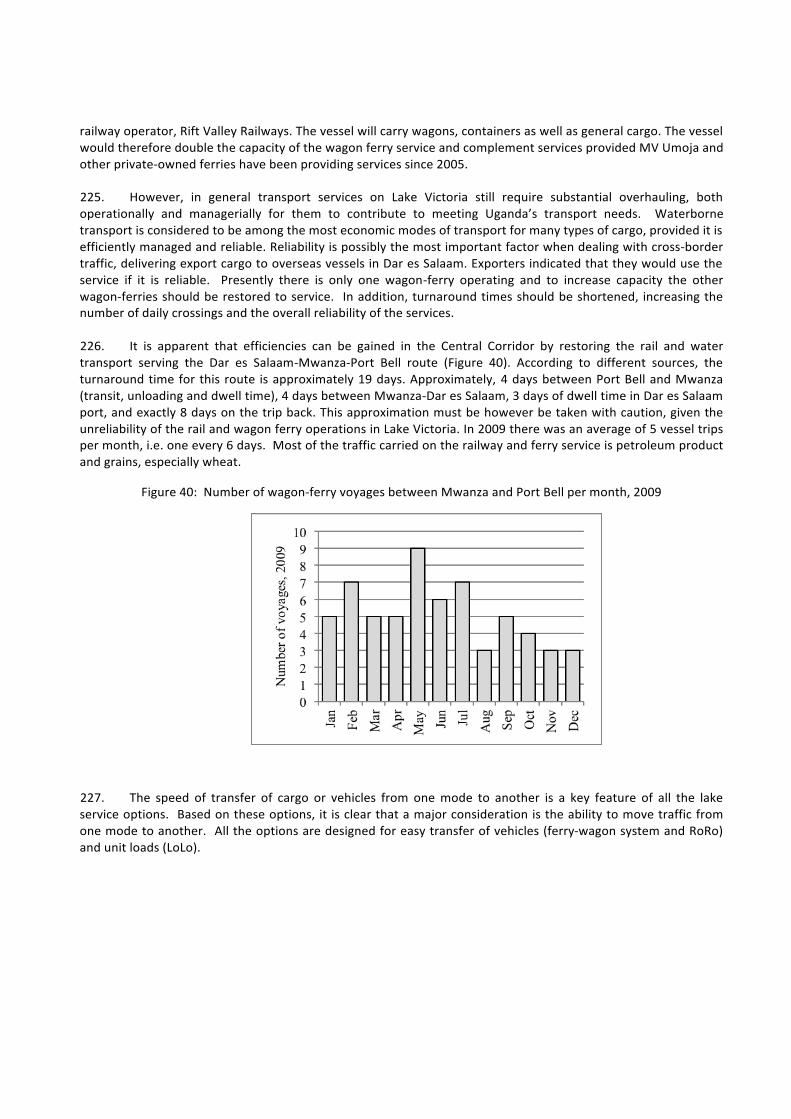
87
railway operator, Rift Valley Railways. The vessel will carry wagons, containers as well as general cargo. The vessel would therefore double the capacity of the wagon ferry service and complement services provided MV Umoja and other private-‐owned ferries have been providing services since 2005.
225. However, in general transport services on Lake Victoria still require substantial overhauling, both operationally and managerially for them to contribute to meeting Uganda’s transport needs. Waterborne transport is considered to be among the most economic modes of transport for many types of cargo, provided it is efficiently managed and reliable. Reliability is possibly the most important factor when dealing with cross-‐border traffic, delivering export cargo to overseas vessels in Dar es Salaam. Exporters indicated that they would use the service if it is reliable. Presently there is only one wagon-‐ferry operating and to increase capacity the other wagon-‐ferries should be restored to service. In addition, turnaround times should be shortened, increasing the number of daily crossings and the overall reliability of the services.
226. It is apparent that efficiencies can be gained in the Central Corridor by restoring the rail and water transport serving the Dar es Salaam-‐Mwanza-‐Port Bell route (Figure 40). According to different sources, the turnaround time for this route is approximately 19 days. Approximately, 4 days between Port Bell and Mwanza (transit, unloading and dwell time), 4 days between Mwanza-‐Dar es Salaam, 3 days of dwell time in Dar es Salaam port, and exactly 8 days on the trip back. This approximation must be however be taken with caution, given the unreliability of the rail and wagon ferry operations in Lake Victoria. In 2009 there was an average of 5 vessel trips per month, i.e. one every 6 days. Most of the traffic carried on the railway and ferry service is petroleum product and grains, especially wheat.
Figure 40: Number of wagon-‐ferry voyages between Mwanza and Port Bell per month, 2009
227. The speed of transfer of cargo or vehicles from one mode to another is a key feature of all the lake service options. Based on these options, it is clear that a major consideration is the ability to move traffic from one mode to another. All the options are designed for easy transfer of vehicles (ferry-‐wagon system and RoRo) and unit loads (LoLo).

88
3.3 COMPARATIVE CORRIDOR PERFORMANCE
228. It is apparent that the Northern Corridor dominates as Uganda’s main trade route because of a combination of shorter distance, superior performance of the port and better infrastructure and services. When comparing the costs of road transportation between Kampala and Mombasa, there is a sizeable price advantage in the Kampala-‐Mombasa route vis-‐à-‐vis the Central Corridor. Import costs from Mombasa are US$1,613 for a 20ft container, and US$2,992 for a single 40ft. Meanwhile, imports in the Central Corridor add up to US$4,145 per 40ft container and US$2,073 per 20ft container. Similarly, the costs of using rail transport for imports on the Central Corridor exceed those on the Northern Corridor, especially for imports. In addition, containerized exports from Kampala through the Northern Corridor cost US$1,100 per 40ft container, and US$800 per 20ft container, compared to US$1,350 and US$1,050 for the Kampala-‐Dar es Salaam Corridor. Relative to 2006 charges, rail costs have increased over 30% for the Central Corridor route, and more than 25% for imports coming from Mombasa to Kampala.
229. The longer length of the Central Corridor compared to the Northern Corridor need not render it uncompetitive. There are other trade corridors in Africa that are more competitive than shorter competing routes. This is the case of the Durban-‐Lusaka corridor in Southern Africa which is 2400 km long but is competitive against other ostensibly shorter routes to ports in Mozambique. The competitiveness of trade routes is a function of several factors including shipper preferences, shipping line connectivity, availability of return loads, border crossing delays, etc. Potentially therefore, the Central Corridor route can be competitive most likely for certain types of trade traffic.
230. In terms of reliability the Northern Corridor route is not only shorter, but also more reliable. According to different logistics services operators and shippers, a shipment coming by road from Mombasa to Kampala takes on average 7 -‐ 10 days (not including port dwell time). Fundamentally, the bulk of the time is spent in transit (5 to 6 days), while 3 to 5 days in the Port. For its part, rail transport from Mombasa takes in average 14 days (11 days in transit, and 3 days in the port).42 While road conditions are still difficult in minor segments of the journey, one of the most cumbersome impediments for shippers is the long delay time in the Mutukula border post. Although perceptions differ, delays might add up to 4 days, with 1 day in average according to the interviewees. In this respect, some efficiencies can be gained at this border post by implementing a joint border post like the one found in Malaba (Kenya-‐Ugandan border). Currently, automated systems in Malaba allow the truck and rail operators to clear goods at the border within 2 hours.
231. The Dar es Salaam port has traditionally been less competitive than Mombasa. Although the situation has improved more recently in the port of Dar es Salaam, dwell times in the first half of 2009 were in excess of 20 days (and a standard deviation of 4 days), compared to 9 days (3.16 days) in Mombasa.
232. The Central Corridor therefore provides a less competitive and reliable trade route when compared to the Northern Corridor. It is apparent that several of the improvements to the corridor are required in Tanzania. Both the governments and private sector bodies have to take actions to prioritize and coordinate implementation of the necessary improvements to the corridor. Increased traffic volumes will contribute to reducing costs through economies of scale and increased competition. As such, steps should be taken to raise awareness of the availability and potential of the corridor. These actions require coordination, which is best provided by appropriate institutions.
233. As a landlocked country it is important to acknowledge that several of the actions necessary to enhance logistics efficiency for Uganda have to be taken in Kenya and Tanzania. This requires that Uganda should engage with its neighbors to agree on the required actions. As indicated above, the legal framework for such cooperation is already in place. Actions in Tanzania are particularly important in order to increase the attractiveness of the central Corridor without increasing trade costs. One of the main areas is to increase the capacity and efficiency of the lake-‐rail system.
42 The perception of some shippers is that the transit time in rail transport from Mombasa to Kampala has almost doubled in time, from 8 to 14 days.
89
234. Strategies to improve the performance of the rail – lake transport system require measures to achieve minimal total freight costs on the entire transport chain. While inland water-‐way transport does provide the least distance route to Uganda when using the Central Corridor43, to make this competitive against all road routes, it will have to overcome certain challenges, including a short water to land transport leg. Typically, a water-‐land transport combination is less costly where the water leg is longer. Generally, there are five main options for rebuilding lake transport services (Table 14).
43 The Dsm – Port Bell rail/lake route is some 1,548 km (rail distance is 1,229 km, lake distance 319 km). This compares to a road/lake distance (through Mwanza) of approximately 1,492 km (road distance is 1,173 km, lake distance 319 km), or an all road distance between Dsm and Kampala (through Bukoba) of approximately 1,700 km (a similar distance if routing on existing all road routes to Tanga – via Bukoba, Singida, Babati and Arusha).
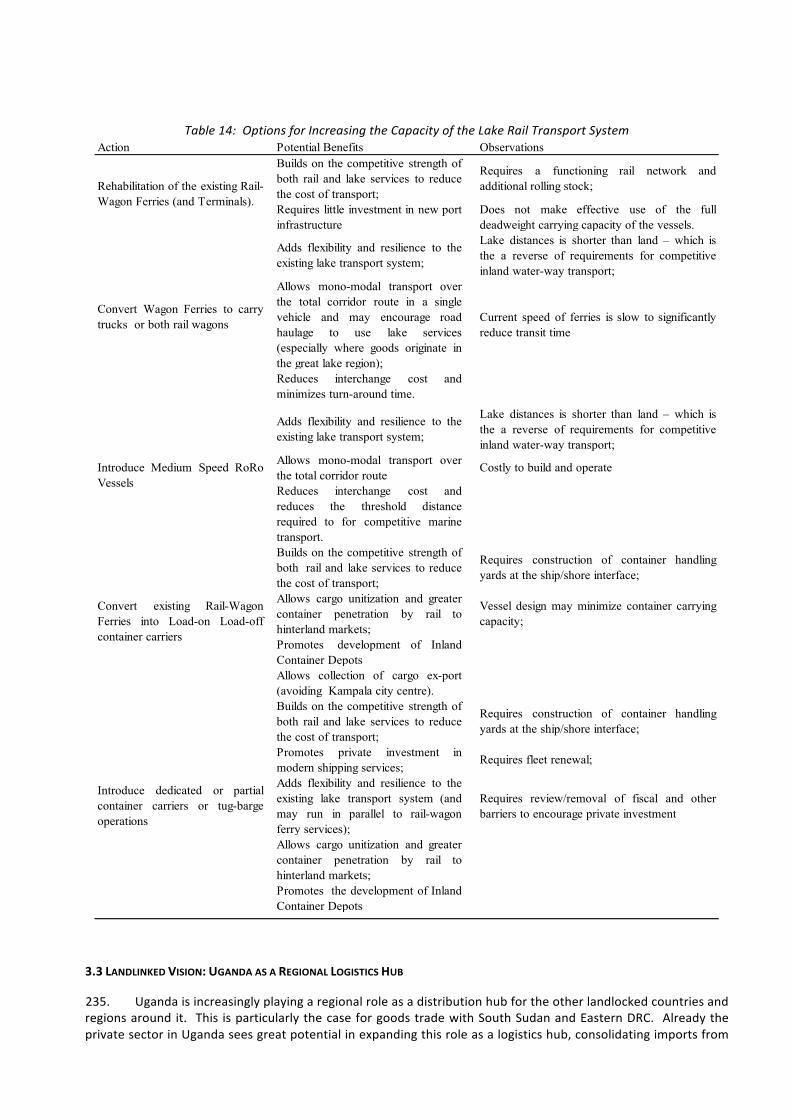
90
Table 14: Options for Increasing the Capacity of the Lake Rail Transport System Action Potential Benefits Observations
Builds on the competitive strength ofboth rail and lake services to reducethe cost of transport;
Requires a functioning rail network andadditional rolling stock;
Requires little investment in new portinfrastructure
Does not make effective use of the fulldeadweight carrying capacity of the vessels.
Adds flexibility and resilience to theexisting lake transport system;
Lake distances is shorter than land – which isthe a reverse of requirements for competitiveinland water-way transport;
Allows mono-modal transport overthe total corridor route in a singlevehicle and may encourage roadhaulage to use lake services(especially where goods originate inthe great lake region);
Current speed of ferries is slow to significantlyreduce transit time
Reduces interchange cost andminimizes turn-around time.
Adds flexibility and resilience to theexisting lake transport system;
Lake distances is shorter than land – which isthe a reverse of requirements for competitiveinland water-way transport;
Allows mono-modal transport overthe total corridor route
Costly to build and operate
Reduces interchange cost andreduces the threshold distancerequired to for competitive marinetransport.Builds on the competitive strength ofboth rail and lake services to reducethe cost of transport;
Requires construction of container handlingyards at the ship/shore interface;
Allows cargo unitization and greatercontainer penetration by rail tohinterland markets;
Vessel design may minimize container carryingcapacity;
Promotes development of InlandContainer Depots Allows collection of cargo ex-port(avoiding Kampala city centre).Builds on the competitive strength ofboth rail and lake services to reducethe cost of transport;
Requires construction of container handlingyards at the ship/shore interface;
Promotes private investment inmodern shipping services;
Requires fleet renewal;
Adds flexibility and resilience to theexisting lake transport system (andmay run in parallel to rail-wagonferry services);
Requires review/removal of fiscal and otherbarriers to encourage private investment
Allows cargo unitization and greatercontainer penetration by rail tohinterland markets; Promotes the development of InlandContainer Depots
Rehabilitation of the existing Rail-Wagon Ferries (and Terminals).
Convert Wagon Ferries to carrytrucks or both rail wagons
Introduce Medium Speed RoRoVessels
Convert existing Rail-WagonFerries into Load-on Load-offcontainer carriers
Introduce dedicated or partialcontainer carriers or tug-bargeoperations
3.3 LANDLINKED VISION: UGANDA AS A REGIONAL LOGISTICS HUB
235. Uganda is increasingly playing a regional role as a distribution hub for the other landlocked countries and regions around it. This is particularly the case for goods trade with South Sudan and Eastern DRC. Already the private sector in Uganda sees great potential in expanding this role as a logistics hub, consolidating imports from
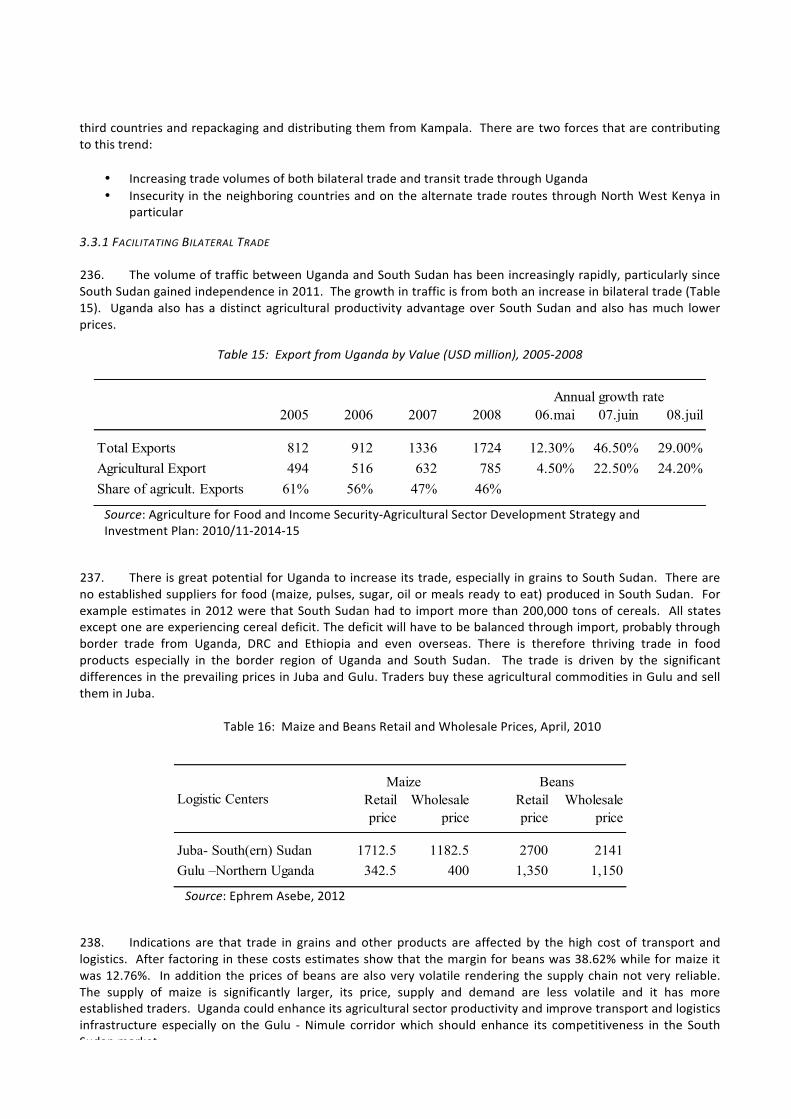
91
third countries and repackaging and distributing them from Kampala. There are two forces that are contributing to this trend:
• Increasing trade volumes of both bilateral trade and transit trade through Uganda • Insecurity in the neighboring countries and on the alternate trade routes through North West Kenya in
particular
3.3.1 FACILITATING BILATERAL TRADE
236. The volume of traffic between Uganda and South Sudan has been increasingly rapidly, particularly since South Sudan gained independence in 2011. The growth in traffic is from both an increase in bilateral trade (Table 15). Uganda also has a distinct agricultural productivity advantage over South Sudan and also has much lower prices.
Table 15: Export from Uganda by Value (USD million), 2005-‐2008
2005 2006 2007 2008 06.mai 07.juin 08.juil
Total Exports 812 912 1336 1724 12.30% 46.50% 29.00%Agricultural Export 494 516 632 785 4.50% 22.50% 24.20%Share of agricult. Exports 61% 56% 47% 46%
Annual growth rate
Source: Agriculture for Food and Income Security-‐Agricultural Sector Development Strategy and Investment Plan: 2010/11-‐2014-‐15
237. There is great potential for Uganda to increase its trade, especially in grains to South Sudan. There are no established suppliers for food (maize, pulses, sugar, oil or meals ready to eat) produced in South Sudan. For example estimates in 2012 were that South Sudan had to import more than 200,000 tons of cereals. All states except one are experiencing cereal deficit. The deficit will have to be balanced through import, probably through border trade from Uganda, DRC and Ethiopia and even overseas. There is therefore thriving trade in food products especially in the border region of Uganda and South Sudan. The trade is driven by the significant differences in the prevailing prices in Juba and Gulu. Traders buy these agricultural commodities in Gulu and sell them in Juba.
Table 16: Maize and Beans Retail and Wholesale Prices, April, 2010
Retail price
Wholesale price
Retail price
Wholesale price
Juba- South(ern) Sudan 1712.5 1182.5 2700 2141Gulu –Northern Uganda 342.5 400 1,350 1,150
Logistic CentersMaize Beans
Source: Ephrem Asebe, 2012
238. Indications are that trade in grains and other products are affected by the high cost of transport and logistics. After factoring in these costs estimates show that the margin for beans was 38.62% while for maize it was 12.76%. In addition the prices of beans are also very volatile rendering the supply chain not very reliable. The supply of maize is significantly larger, its price, supply and demand are less volatile and it has more established traders. Uganda could enhance its agricultural sector productivity and improve transport and logistics infrastructure especially on the Gulu -‐ Nimule corridor which should enhance its competitiveness in the South Sudan market.
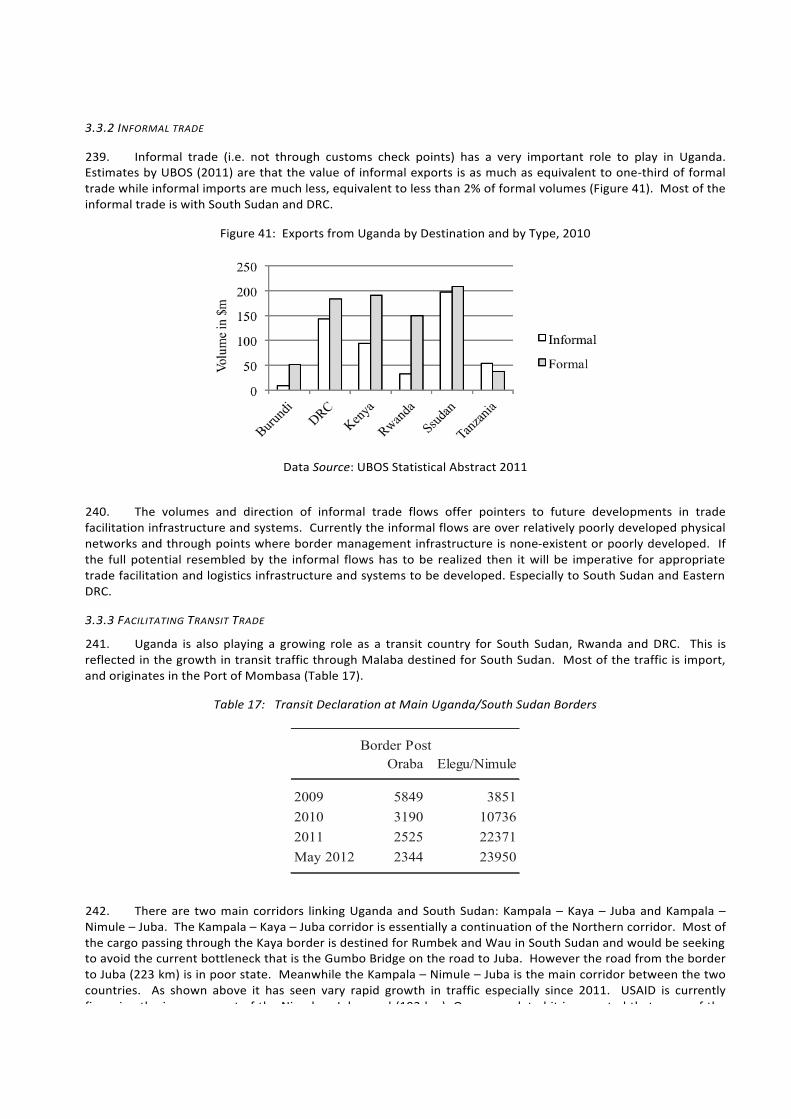
92
3.3.2 INFORMAL TRADE
239. Informal trade (i.e. not through customs check points) has a very important role to play in Uganda. Estimates by UBOS (2011) are that the value of informal exports is as much as equivalent to one-‐third of formal trade while informal imports are much less, equivalent to less than 2% of formal volumes (Figure 41). Most of the informal trade is with South Sudan and DRC.
Figure 41: Exports from Uganda by Destination and by Type, 2010
Data Source: UBOS Statistical Abstract 2011
240. The volumes and direction of informal trade flows offer pointers to future developments in trade facilitation infrastructure and systems. Currently the informal flows are over relatively poorly developed physical networks and through points where border management infrastructure is none-‐existent or poorly developed. If the full potential resembled by the informal flows has to be realized then it will be imperative for appropriate trade facilitation and logistics infrastructure and systems to be developed. Especially to South Sudan and Eastern DRC.
3.3.3 FACILITATING TRANSIT TRADE
241. Uganda is also playing a growing role as a transit country for South Sudan, Rwanda and DRC. This is reflected in the growth in transit traffic through Malaba destined for South Sudan. Most of the traffic is import, and originates in the Port of Mombasa (Table 17).
Table 17: Transit Declaration at Main Uganda/South Sudan Borders
Oraba Elegu/Nimule
2009 5849 38512010 3190 107362011 2525 22371May 2012 2344 23950
Border Post
242. There are two main corridors linking Uganda and South Sudan: Kampala – Kaya – Juba and Kampala – Nimule – Juba. The Kampala – Kaya – Juba corridor is essentially a continuation of the Northern corridor. Most of the cargo passing through the Kaya border is destined for Rumbek and Wau in South Sudan and would be seeking to avoid the current bottleneck that is the Gumbo Bridge on the road to Juba. However the road from the border to Juba (223 km) is in poor state. Meanwhile the Kampala – Nimule – Juba is the main corridor between the two countries. As shown above it has seen vary rapid growth in traffic especially since 2011. USAID is currently financing the improvement of the Nimule – Juba road (192 km). Once completed it is expected that some of the

93
traffic on the first corridor will be diverted to this route. The main bottle neck on this route is the Gumbo Bridge which causes a traffic bottleneck.
243. Given Uganda’s landlocked position, developments in neighboring countries are relevant to how the country can benefit more from deeper regional integration. Uganda can both benefit from improved connectivity with neighboring countries while at the same time serve as bridge between its immediate neighbors. Policy coordination and harmonization within EAC and the wider COMESA region is fundamental to these prospects. Uganda can play an active role in promoting such harmonization. For example, during the post-‐CPA pre-‐independence period for South Sudan (2005-‐2011), Ugandan authorities (e.g., Uganda Revenue Authority) played a pivotal role in facilitating dialogue with the South Sudanese customs authority, which paves a way for better linkage between South Sudan and the rest of EAC countries.
3.3.4 DEVELOPING A REGIONAL LOGISTICS HUB
244. Uganda has already made some strides in leveraging its central location in East Africa to serve as a regional distribution center and logistics hub. Granted the distribution industry is still small it has been growing, driven to a lager extent by private sector innovation and adaptation. URA already has in place the policies especially on bonded warehouses that have enabled temporary storage and re-‐export activities to grow. However, the public sector would also need to play a role. For instance, Uganda may have to consider participating in the COMESA FTA which could enhance the country’s potential as a transit hub between/among Sudan, Kenya, Rwanda, and Burundi (who have signed the COMESA FTA protocol). 245. Ultimately growing the logistics sector would eventually reduce Uganda’s own trade costs, through economies of scale and the development of modern facilities. Presently, the main marketing point for Uganda has been the insecurity in neighboring countries, especially South Sudan and DRC. The lack of security around Kenya-‐South Sudan border has encouraged shippers to South Sudan to travel between Juba and Mombasa through Gulu in Northern Uganda (either directly from the Kenya-‐Uganda border or through Kampala) before heading to South Sudan through Oraba-‐Kaya and Nimule border posts. Insecurity affects also the branch of the Northern Corridor through Lokichoggio in Kenya to Juba. In addition importers in South Sudan and DRC prefer to keep their supplies in bonded facilities in Kampala and bring them into either country as and when needed, but with assurances of shorter lead times. As a result, Uganda has seen transit volumes grow, which in turn has led to the emergence of a distribution industry especially in Jinja and Kampala.
246. However, future prospects for growing a logistics capacity need to depend on efficiency rather than the insecurity in neighboring countries. There is always the risk that with restoration of stability in the border area between Kenya and South Sudan (and possible road infrastructure development), Uganda would be not be as competitive as a transit country as it makes more sense, distance-‐wise, to ship goods directly between Kenya and South Sudan. Same goes for its role as a transit hub for the Northern Corridor, linking Rwanda, Burundi, and Eastern DRC with Kenya. At the moment, it is the lack of competitiveness of the Central Corridor (through Tanzania) that allows Uganda to keep its competitive edge. Uganda would have to modernize its infrastructure and procedures so as reduce costs and benefit from the bigger volumes that transit traffic would deliver.
3.3.5 LOGISTICS FOR NICHE EXPORTS
247. In 1971, Simon Kuznets showed that as a country moves from low to medium to high income levels, it goes through a structural transformation from agriculture to industry to service. This transformation is not a sequence of discontinued steps (Coulibaly, 2011). Traditional agriculture tends to be slowly replaced as agribusiness activities emerge in response to increased demand from urban areas within and outside a country (WDR 2008). These agribusiness activities such as storage, sorting, conditioning, packaging, transporting, processing, and distribution as well as risk management related services are already in the realm of increasing return to scale activities where internal and external economies of scales drive productivity and the ability to export. As industrialization takes root in a country, the share of manufacturing and business-‐related services becomes more and more important in production.
248. Enabling small scale producers to respond to globalization is important to shared growth and development. Both the public and private sectors have long acknowledged the challenges faced by small scale producers. Some innovative solutions have been designed but have met with varying levels of success. These have included among others, special postal services and express services tailored to small scale producers. Typically, some of the greatest constraints are at the local level and how flows cascade from local to the
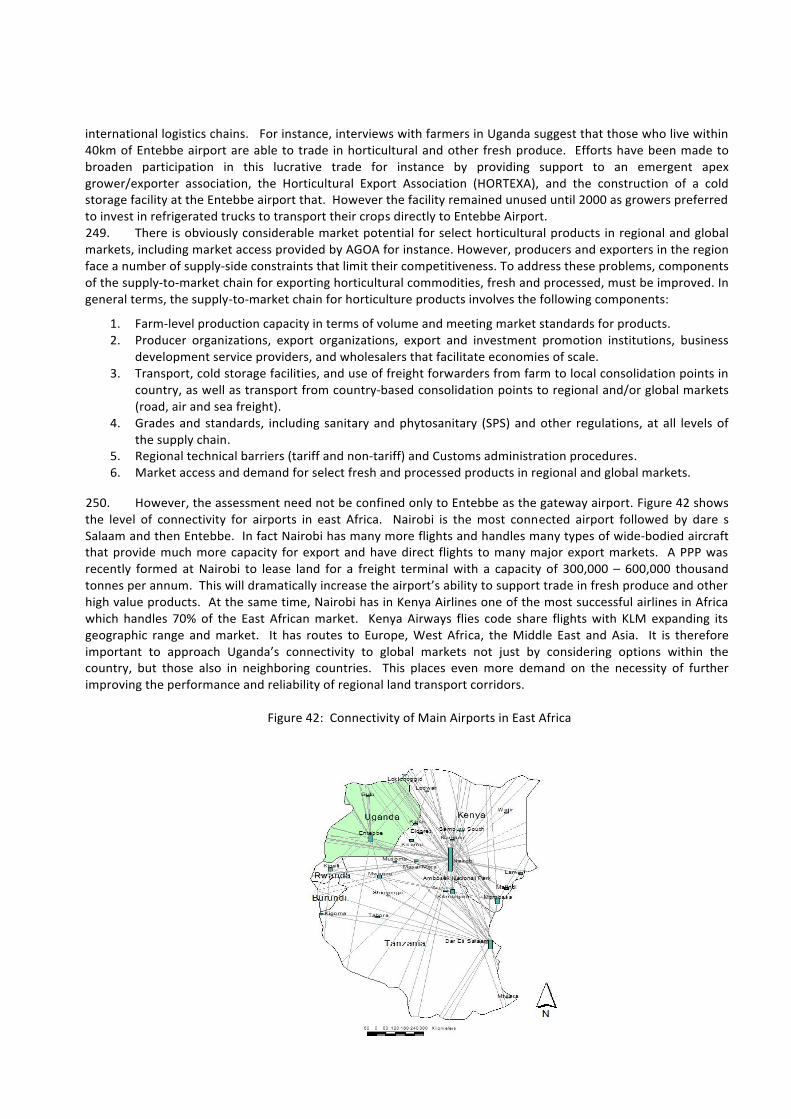
94
international logistics chains. For instance, interviews with farmers in Uganda suggest that those who live within 40km of Entebbe airport are able to trade in horticultural and other fresh produce. Efforts have been made to broaden participation in this lucrative trade for instance by providing support to an emergent apex grower/exporter association, the Horticultural Export Association (HORTEXA), and the construction of a cold storage facility at the Entebbe airport that. However the facility remained unused until 2000 as growers preferred to invest in refrigerated trucks to transport their crops directly to Entebbe Airport. 249. There is obviously considerable market potential for select horticultural products in regional and global markets, including market access provided by AGOA for instance. However, producers and exporters in the region face a number of supply-‐side constraints that limit their competitiveness. To address these problems, components of the supply-‐to-‐market chain for exporting horticultural commodities, fresh and processed, must be improved. In general terms, the supply-‐to-‐market chain for horticulture products involves the following components:
1. Farm-‐level production capacity in terms of volume and meeting market standards for products. 2. Producer organizations, export organizations, export and investment promotion institutions, business
development service providers, and wholesalers that facilitate economies of scale. 3. Transport, cold storage facilities, and use of freight forwarders from farm to local consolidation points in
country, as well as transport from country-‐based consolidation points to regional and/or global markets (road, air and sea freight).
4. Grades and standards, including sanitary and phytosanitary (SPS) and other regulations, at all levels of the supply chain.
5. Regional technical barriers (tariff and non-‐tariff) and Customs administration procedures. 6. Market access and demand for select fresh and processed products in regional and global markets.
250. However, the assessment need not be confined only to Entebbe as the gateway airport. Figure 42 shows the level of connectivity for airports in east Africa. Nairobi is the most connected airport followed by dare s Salaam and then Entebbe. In fact Nairobi has many more flights and handles many types of wide-‐bodied aircraft that provide much more capacity for export and have direct flights to many major export markets. A PPP was recently formed at Nairobi to lease land for a freight terminal with a capacity of 300,000 – 600,000 thousand tonnes per annum. This will dramatically increase the airport’s ability to support trade in fresh produce and other high value products. At the same time, Nairobi has in Kenya Airlines one of the most successful airlines in Africa which handles 70% of the East African market. Kenya Airways flies code share flights with KLM expanding its geographic range and market. It has routes to Europe, West Africa, the Middle East and Asia. It is therefore important to approach Uganda’s connectivity to global markets not just by considering options within the country, but those also in neighboring countries. This places even more demand on the necessity of further improving the performance and reliability of regional land transport corridors.
Figure 42: Connectivity of Main Airports in East Africa
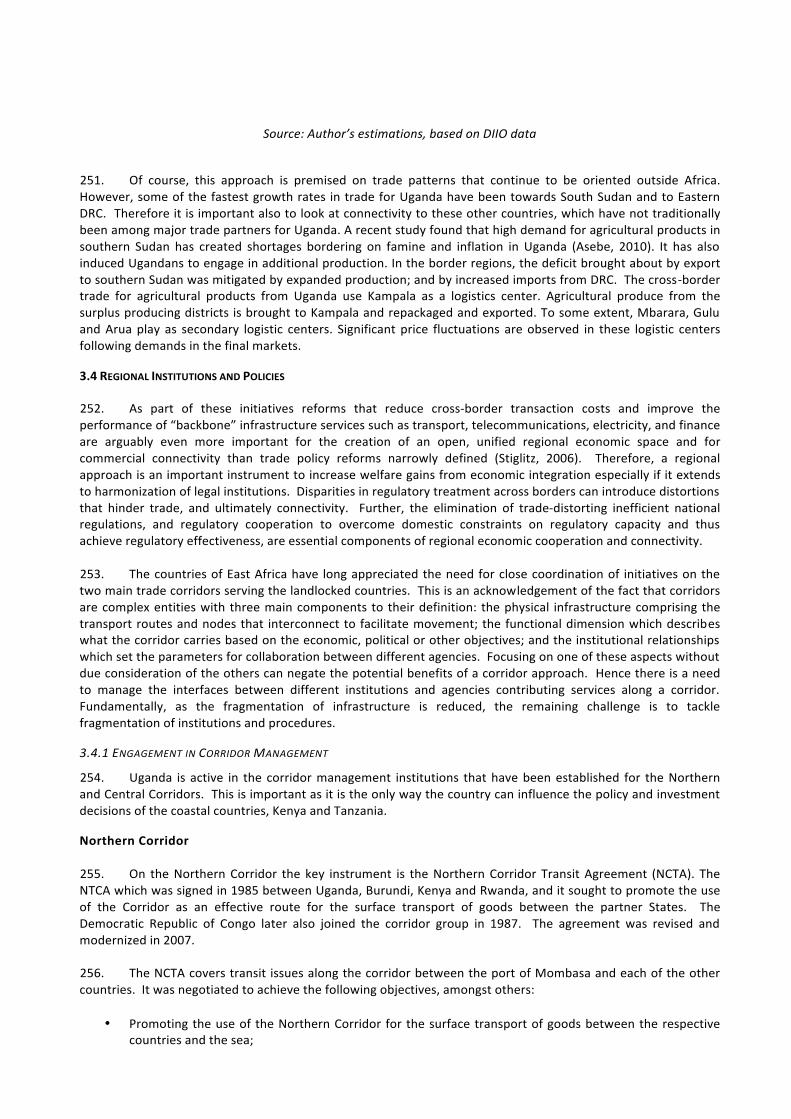
95
Source: Author’s estimations, based on DIIO data
251. Of course, this approach is premised on trade patterns that continue to be oriented outside Africa. However, some of the fastest growth rates in trade for Uganda have been towards South Sudan and to Eastern DRC. Therefore it is important also to look at connectivity to these other countries, which have not traditionally been among major trade partners for Uganda. A recent study found that high demand for agricultural products in southern Sudan has created shortages bordering on famine and inflation in Uganda (Asebe, 2010). It has also induced Ugandans to engage in additional production. In the border regions, the deficit brought about by export to southern Sudan was mitigated by expanded production; and by increased imports from DRC. The cross-‐border trade for agricultural products from Uganda use Kampala as a logistics center. Agricultural produce from the surplus producing districts is brought to Kampala and repackaged and exported. To some extent, Mbarara, Gulu and Arua play as secondary logistic centers. Significant price fluctuations are observed in these logistic centers following demands in the final markets.
3.4 REGIONAL INSTITUTIONS AND POLICIES
252. As part of these initiatives reforms that reduce cross-‐border transaction costs and improve the performance of “backbone” infrastructure services such as transport, telecommunications, electricity, and finance are arguably even more important for the creation of an open, unified regional economic space and for commercial connectivity than trade policy reforms narrowly defined (Stiglitz, 2006). Therefore, a regional approach is an important instrument to increase welfare gains from economic integration especially if it extends to harmonization of legal institutions. Disparities in regulatory treatment across borders can introduce distortions that hinder trade, and ultimately connectivity. Further, the elimination of trade-‐distorting inefficient national regulations, and regulatory cooperation to overcome domestic constraints on regulatory capacity and thus achieve regulatory effectiveness, are essential components of regional economic cooperation and connectivity.
253. The countries of East Africa have long appreciated the need for close coordination of initiatives on the two main trade corridors serving the landlocked countries. This is an acknowledgement of the fact that corridors are complex entities with three main components to their definition: the physical infrastructure comprising the transport routes and nodes that interconnect to facilitate movement; the functional dimension which describes what the corridor carries based on the economic, political or other objectives; and the institutional relationships which set the parameters for collaboration between different agencies. Focusing on one of these aspects without due consideration of the others can negate the potential benefits of a corridor approach. Hence there is a need to manage the interfaces between different institutions and agencies contributing services along a corridor. Fundamentally, as the fragmentation of infrastructure is reduced, the remaining challenge is to tackle fragmentation of institutions and procedures.
3.4.1 ENGAGEMENT IN CORRIDOR MANAGEMENT
254. Uganda is active in the corridor management institutions that have been established for the Northern and Central Corridors. This is important as it is the only way the country can influence the policy and investment decisions of the coastal countries, Kenya and Tanzania.
Northern Corridor 255. On the Northern Corridor the key instrument is the Northern Corridor Transit Agreement (NCTA). The NTCA which was signed in 1985 between Uganda, Burundi, Kenya and Rwanda, and it sought to promote the use of the Corridor as an effective route for the surface transport of goods between the partner States. The Democratic Republic of Congo later also joined the corridor group in 1987. The agreement was revised and modernized in 2007.
256. The NCTA covers transit issues along the corridor between the port of Mombasa and each of the other countries. It was negotiated to achieve the following objectives, amongst others:
• Promoting the use of the Northern Corridor for the surface transport of goods between the respective
countries and the sea;
96
• Granting the member countries a right of transit in order to facilitate movement of goods through their respective territories; and
• Taking measures to expedite the movement of traffic and for avoidance of unnecessary delays in the movement of goods; minimizing the avoidance of Customs duties and taxes; and simplifying and harmonizing documentation and procedures relating to the movement of goods in transit.
257. In order to meet the above objectives, a regional institution called the Northern Corridor Transit Transport Coordination Authority (NCTTCA) was established. The NCTTCA has three main organs which work closely towards realizing the objectives of the Northern Corridor Transit Agreement. These are the NCTTCA Authority, its Executive Body and the Secretariat. The Authority is formed of a Council of Ministers responsible for transportation in the member countries. It is the highest policy organ and is responsible for overall policy direction. The Executive Board is an inter-‐governmental committee comprising chief executives of ministries responsible for transport in the member states. The board assists the Authority in formulating strategies for transport and trade facilitation, infrastructure development; and, harmonization of national and regional policies. The Chairs of the Authority and the Executive Board rotate among the member countries. The Executive Board meets twice a year. The Permanent Secretariat is responsible for coordinating the implementation of the NCTA and any other decisions and resolutions made by the Authority and Executive Board. The Secretariat, which is located in Mombasa, Kenya was set up in 1988. Its work is based on technical programs defined by specialized committees. So far two committees are operational, one for infrastructure development and management and another for customs and trade facilitation. Uganda is represented and also an active player in all the bodies of the Northern Corridor.
Central Corridor
258. Up until 2006 trade facilitation on the Central Corridor was tackled through bilateral agreements between Tanzania and each of the landlocked countries. The bilateral arrangements were replaced in 2006 by the Central Corridor Transit Transport Facilitation Agency (CCTTFA). The CCTFA is based on an agreement between Tanzania, Uganda, Rwanda, Burundi, and DRC.
259. The institutional framework for the Central Corridor is largely inspired by the Northern Corridor experience. However, it has a greater involvement of the private sector, something that is only being introduced in the case of the Northern Corridor. The governing organs are an interstate council of ministers, an executive board, and a stakeholders’ consultative committee, supported by a permanent secretariat. It is still finalizing the staff for the secretariat in place but takes a position representing its members on many of the issues described above. The CCTFA is working with the World Bank managed Sub-‐Saharan Africa Transport Policy Program to carry-‐out a performance assessment of the Central Corridor. The assessment will be very helpful to providing metrics on the actual performance of the corridor.
260. On both the Northern and Central Corridors Uganda is an active participant, represented by both public and private sector stakeholders. On the Northern Corridor there is a Northern Corridor Stakeholders’ Consultative Forum that brings together chief executives of public and private sector agencies while the Stakeholders Consultative Committee has the same configuration on the Central Corridor. Both fora meet periodically to review operational matters and to agree on practical solutions, which are then implemented through the secretariats. In both, the key Uganda agencies that regularly take part are:
• Ministry of Works, Housing and Communications -‐ Directorate of Transport and Communications. • Uganda Railways Corporation (URC) • Uganda Revenue Authority (URA) • Uganda Freight Forwarders Association (UFFA) • Uganda Manufacturers Association (UMA) • Uganda Importers and Exporters Association (UGIETA) • Uganda National Chamber of Commerce and Industry (UNCCI) • Ministry of Tourism, Trade and Industry. • Uganda National Road Agency (UNRA)
97
261. Funding for regional institutions is one of the most immediate challenges to sustainability. When the NCTTCA was first established, all member countries used to make equal contributions to the Organization’s Budget, but this mechanism did not prove efficient as arrears accumulated. An alternative mechanism was needed that would make available to the Permanent Secretariat adequate resources to enable it to effectively analyze corridor efficiency, and facilitate and follow-‐up implementation of decisions of the TTCA and the Executive Board. In December 2003 the Executive Board adopted a formula, which would apportion the annual budgets, for the next following financial years, with Uganda as the second largest contributor.
262. The Uganda contribution is via levy on volumes passing through the Port of Mombasa. The levy is collected at the port by the Kenya Ports Authority. The other landlocked countries use the same approach, except Kenya which opted to pay from its Treasury. While not perfect, the use of a tonnage levy has improved funding sustainability for the NCTTCA, and has emerged as a model that other corridors across Sub-‐Saharan Africa are trying to replicate. The CCTTFA is working on adopting a funding mechanism similar to the Northern Corridor. Presently it is financed by donors.
263. Therefore on both its main international trade corridors there are institutional mechanisms for Uganda to contribute to priorities for service improvement. However, such contribution is at present hampered by the lack of financing mechanism especially for priority projects that may lie in the coastal countries. Such projects would require some form of incentive for the coastal countries to attach the same level of priority to the projects as the landlocked countries. This is not always easy. An option, though one not yet fully operationalized is for the regional bodies such as the EAC to have the financing capacity to fund improvement of core regional infrastructure and services.
3.4.2 POLICY HARMONIZATION
264. Transport and logistics services include the transport services (road, rail, air, maritime), clearing and forwarding, customs and border management, warehousing, etc. These are the services that help move goods between countries. Interoperability is an imperative for efficient and effective trade: international cooperation and coordination are about breaking down fragmentation of jurisdictional, infrastructural, procedural, management and other boundaries. Interoperability within and between transport modes is therefore necessary for efficient and effective trade logistics; this can be achieved through harmonization of laws, institutional frameworks, norms, standards and practices based on internationally agreed standards. The main goal of harmonization is to lessen to the extent possible the reasons for denied access to markets.
3.4.3 BORDER MANAGEMENT
265. Border management is one of the areas where Uganda has made tremendous progress since the DTIS. Delays at border crossings across Sub-‐Saharan Africa have long been identified as one of the largest non-‐tariff barriers to trade. Some of the identified, contributing factors include inefficient paperwork processes, lack of advance notification of goods, fraudulent declarations, lack of efficient, international information exchange between revenue authorities and out of date or lack of transit and trade statistics. One significant improvement lies in developing a platform for efficient customs and transit data exchange, management and reporting. Therefore, in addition to improving connectivity through infrastructure, documents and procedures, the countries of East Africa have also sought to interconnect their electronic systems for trade facilitation purposes. Traders typically lose large amounts of time as agencies in each country reenter trade related information in their computer systems for customs and other border control purposes. If such information can be shared across borders then there would be significant time savings. Uganda and Kenya have been at the forefront of this initiative. In 2009 they managed to interconnect their customs systems using a system known as Revenue Authorities Digital Data Exchange (RADDEx). The system was first installed at the Malaba border post between the two countries. The benefits of customs data sharing are outlined in the Chapter on Customs.
266. These several soft type interventions are complemented also by reorganization of the borders, in particular the introduction of one-‐stop border posts. In 2006, a one stop border operation was started on the railway at Malaba that has now reduced delays of 1-‐2 days to 1-‐2 hours. Manifests and customs declarations are sent from the port and joint customs teams simply check seals and that the loaded goods match the declarations. Drivers and train operators are not subject to passport processing by immigration. The same concept has since been extended in 2009 to road transport when Uganda Revenue Authority and Kenya Revenue Authority
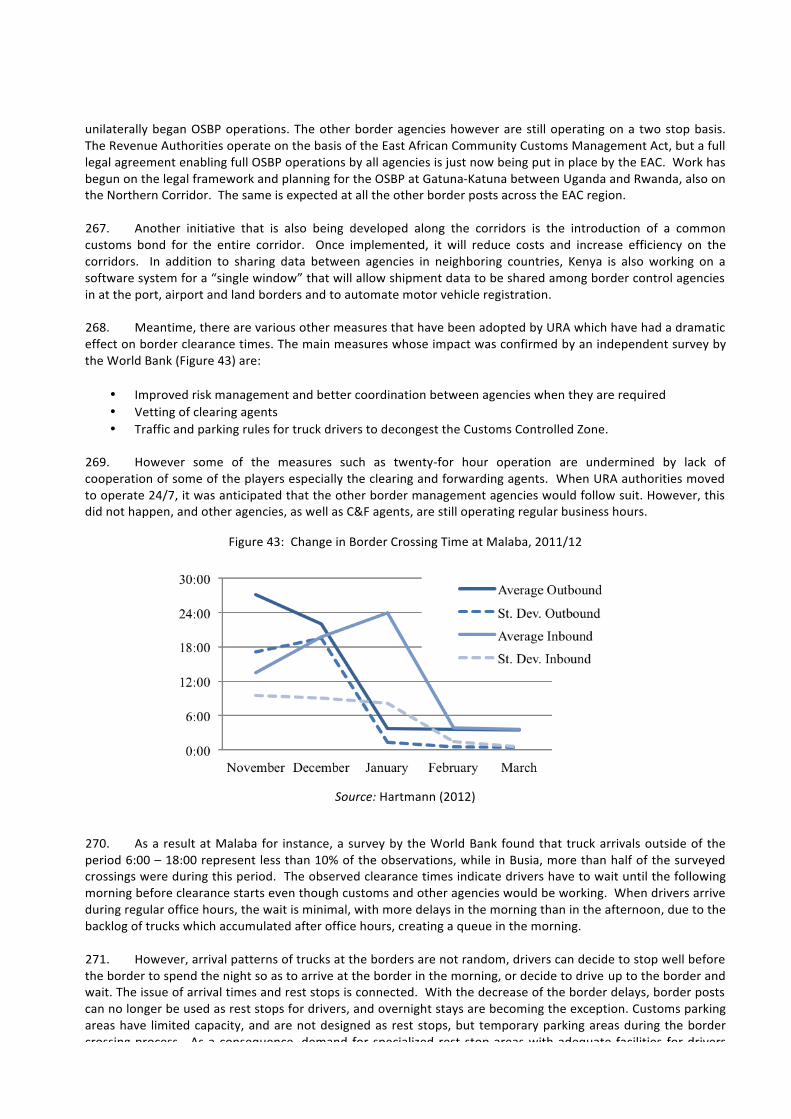
98
unilaterally began OSBP operations. The other border agencies however are still operating on a two stop basis. The Revenue Authorities operate on the basis of the East African Community Customs Management Act, but a full legal agreement enabling full OSBP operations by all agencies is just now being put in place by the EAC. Work has begun on the legal framework and planning for the OSBP at Gatuna-‐Katuna between Uganda and Rwanda, also on the Northern Corridor. The same is expected at all the other border posts across the EAC region.
267. Another initiative that is also being developed along the corridors is the introduction of a common customs bond for the entire corridor. Once implemented, it will reduce costs and increase efficiency on the corridors. In addition to sharing data between agencies in neighboring countries, Kenya is also working on a software system for a “single window” that will allow shipment data to be shared among border control agencies in at the port, airport and land borders and to automate motor vehicle registration.
268. Meantime, there are various other measures that have been adopted by URA which have had a dramatic effect on border clearance times. The main measures whose impact was confirmed by an independent survey by the World Bank (Figure 43) are:
• Improved risk management and better coordination between agencies when they are required • Vetting of clearing agents • Traffic and parking rules for truck drivers to decongest the Customs Controlled Zone.
269. However some of the measures such as twenty-‐for hour operation are undermined by lack of cooperation of some of the players especially the clearing and forwarding agents. When URA authorities moved to operate 24/7, it was anticipated that the other border management agencies would follow suit. However, this did not happen, and other agencies, as well as C&F agents, are still operating regular business hours.
Figure 43: Change in Border Crossing Time at Malaba, 2011/12
Source: Hartmann (2012)
270. As a result at Malaba for instance, a survey by the World Bank found that truck arrivals outside of the period 6:00 – 18:00 represent less than 10% of the observations, while in Busia, more than half of the surveyed crossings were during this period. The observed clearance times indicate drivers have to wait until the following morning before clearance starts even though customs and other agencies would be working. When drivers arrive during regular office hours, the wait is minimal, with more delays in the morning than in the afternoon, due to the backlog of trucks which accumulated after office hours, creating a queue in the morning.
271. However, arrival patterns of trucks at the borders are not random, drivers can decide to stop well before the border to spend the night so as to arrive at the border in the morning, or decide to drive up to the border and wait. The issue of arrival times and rest stops is connected. With the decrease of the border delays, border posts can no longer be used as rest stops for drivers, and overnight stays are becoming the exception. Customs parking areas have limited capacity, and are not designed as rest stops, but temporary parking areas during the border crossing process. As a consequence, demand for specialized rest stop areas with adequate facilities for drivers
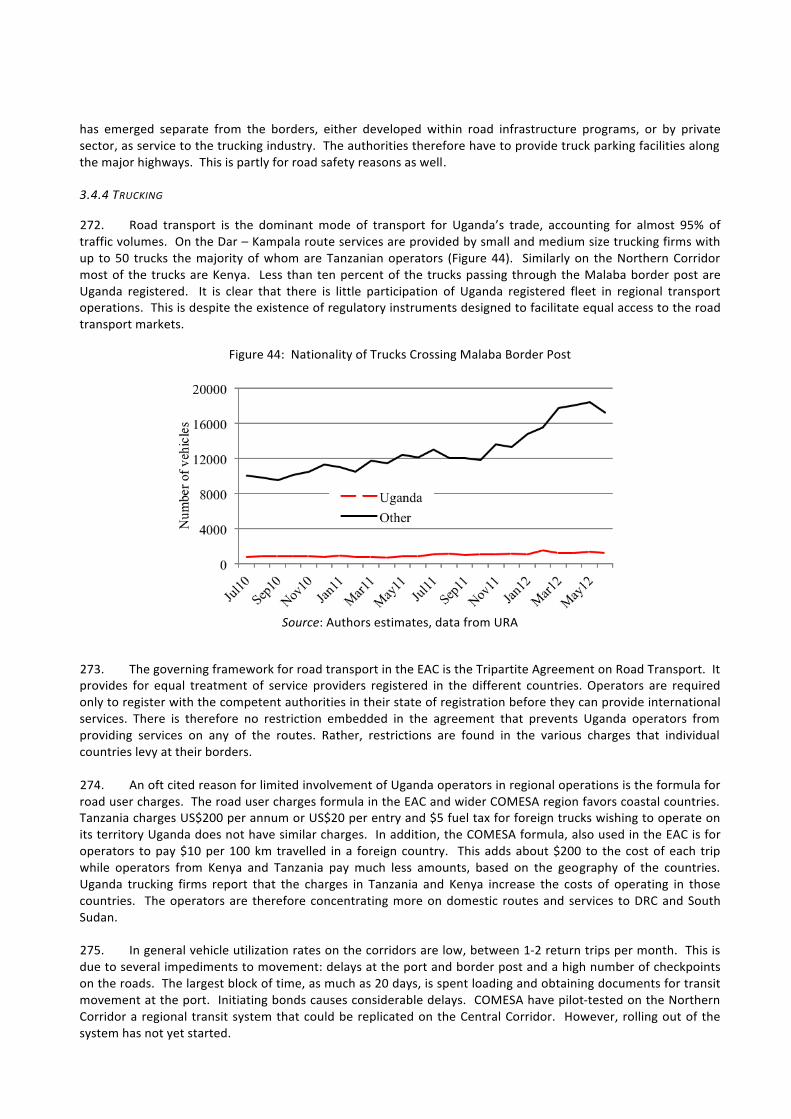
99
has emerged separate from the borders, either developed within road infrastructure programs, or by private sector, as service to the trucking industry. The authorities therefore have to provide truck parking facilities along the major highways. This is partly for road safety reasons as well.
3.4.4 TRUCKING
272. Road transport is the dominant mode of transport for Uganda’s trade, accounting for almost 95% of traffic volumes. On the Dar – Kampala route services are provided by small and medium size trucking firms with up to 50 trucks the majority of whom are Tanzanian operators (Figure 44). Similarly on the Northern Corridor most of the trucks are Kenya. Less than ten percent of the trucks passing through the Malaba border post are Uganda registered. It is clear that there is little participation of Uganda registered fleet in regional transport operations. This is despite the existence of regulatory instruments designed to facilitate equal access to the road transport markets.
Figure 44: Nationality of Trucks Crossing Malaba Border Post
Source: Authors estimates, data from URA
273. The governing framework for road transport in the EAC is the Tripartite Agreement on Road Transport. It provides for equal treatment of service providers registered in the different countries. Operators are required only to register with the competent authorities in their state of registration before they can provide international services. There is therefore no restriction embedded in the agreement that prevents Uganda operators from providing services on any of the routes. Rather, restrictions are found in the various charges that individual countries levy at their borders.
274. An oft cited reason for limited involvement of Uganda operators in regional operations is the formula for road user charges. The road user charges formula in the EAC and wider COMESA region favors coastal countries. Tanzania charges US$200 per annum or US$20 per entry and $5 fuel tax for foreign trucks wishing to operate on its territory Uganda does not have similar charges. In addition, the COMESA formula, also used in the EAC is for operators to pay $10 per 100 km travelled in a foreign country. This adds about $200 to the cost of each trip while operators from Kenya and Tanzania pay much less amounts, based on the geography of the countries. Uganda trucking firms report that the charges in Tanzania and Kenya increase the costs of operating in those countries. The operators are therefore concentrating more on domestic routes and services to DRC and South Sudan.
275. In general vehicle utilization rates on the corridors are low, between 1-‐2 return trips per month. This is due to several impediments to movement: delays at the port and border post and a high number of checkpoints on the roads. The largest block of time, as much as 20 days, is spent loading and obtaining documents for transit movement at the port. Initiating bonds causes considerable delays. COMESA have pilot-‐tested on the Northern Corridor a regional transit system that could be replicated on the Central Corridor. However, rolling out of the system has not yet started.
100
276. While the EAC has recently adopted uniform axle load limits for its member countries, differences in such limits have traditionally contributed to operational difficulties. Different vehicle load limits between Tanzania and Uganda have been a major constraint to corridor length vehicle operations. Based on corridor operations the greatest short term challenge faced with axle load control program is that the Uganda gross vehicle mass is 46 tonnes whereas it is 56 tonnes in Tanzania and the other neighboring countries. Both the Northern and Central corridors has several weighbridges positioned at strategic locations along their length. They are intended to preserve road infrastructure by controlling truck loads. In Tanzania TANROADS envisions about 7 weighbridges at points where additional traffic enters the corridor while in Uganda there are several fixed and mobile weighbridges, including at Masaka where the Central Corridor joins the Northern Corridor. There are presently 7 fixed and 3 mobile weighbridges on the route, as well as customs and police checkpoints. Standardization of the limits is important to smooth operations along the length of the corridor. While the weighing processes themselves are pretty fast (<10 minutes per truck)44 the problem has been lack of consistency in the limits and also in the practices. The weighbridges have as a result been locations for informal payments. In addition, greater benefits can also be derived from avoiding repeat weighing during the same trip. But this requires that the procedures, equipment and systems have sufficient integrity.
277. However, movement on the corridor is often interrupted by the numerous checkpoints. The same survey by the Centre for Economic Prosperity found that on average trucks are stopped 6 times per trip between Dar es Salaam and Singida. Importantly, more than 90% of the time a truck is topped a payment is made to the police thought he average payment is small, typically less $1. In terms of time the stops cost 20-‐30 minutes per trip. However, as traffic volumes increase both the weighbridges and checkpoints will most likely contribute to high operating costs on the corridor. Measures will have to be taken in advance to reduce both the number of weighbridges and also the number of checkpoints where trucks have to stop.
3.4.5 FREIGHT FORWARDING
278. The freight forwarding industry providing services on the corridor faces numerous constraints including difficulties in establishing customs bond guarantees for shipments; low access to ICT facilities to submit documents electronically (though some common facilities are available), and absence of an accreditation system for clearing and forwarding agents. The Kenya, Tanzania and Uganda Freight Forwarders Associations all support the proposed regional customs bond guarantee system mentioned above. Presently, bonds are organized on a national basis, requiring cooperation with forwarders in the transit and destination countries. This is a constraint especially on the smaller forwarders, who are 80% of the registered association members. In an effort to increase professionalism in the forwarding industry the associations is working on an accreditation system for its members. Easy entry into the sector often leads to individual operators who lack knowledge of how the systems work contributing to low levels of service. The Bank working with FIATA can support the design of an accreditation system that can serve as a model for the region.
279. There are several private sector associations that can contribute to the development and championing of the Central Corridor trade route. These include transporters associations (TATOA and Uganda Truck Owners Association), freight forwarders (TAFFA and UFFA), chambers of commerce and others. Recently, the government, clearing and forwarding agents and major importers in Uganda established the Uganda Shippers Council. The council seeks to, among others, support cargo owners in the negotiation of freight rates, and provides advice to its members on international shipping. An interim executive committee is in place and other institutional structures are being established. The shippers council indicated that it is ready to help promote the Central Corridor route. Furthermore, at a general level, there is need to provide training on logistics services to all players involved in trade facilitation, both government and private sector.
3.4.6 STORAGE FACILITIES
280. As part of the strategy to develop Kampala in particular as regional logistics hub it is necessary to increase the number and size of bonded storage facilities in the city. Presently Uganda enterprises have facilities in Mombasa, Nairobi and Dar es Salaam, which means inventory management relies to some extent on
44 Based on a survey in early 2010 by the Centre for Economic Prosperity which found that trucks spend on average less than 10 minutes per weighbridge.

101
coordination with operators in the neighboring countries. Enterprises that have facilities in Dar es Salaam are more likely to use the Central Corridor and those in Mombasa and Nairobi the Northern Corridor. One of the major influences on choice of route for firms in Uganda is the availability of storage and other facilities. Over the years Ugandan firms and clearing and forwarding agents have developed their own infrastructure or established relationships with firms in Kenya in particular to provide temporary storage facilities especially in Mombasa. Most do not have such relationships with Tanzanian firms. However, this would not be an insurmountable challenge as increased utilization of the corridor should lead to the development of such facilities or relationships between enterprises in the two countries.
281. As part of the strategy to maintain an alternate viable trade route government could offer incentives to Ugandan enterprises to develop infrastructure and facilities in Tanzania as well.
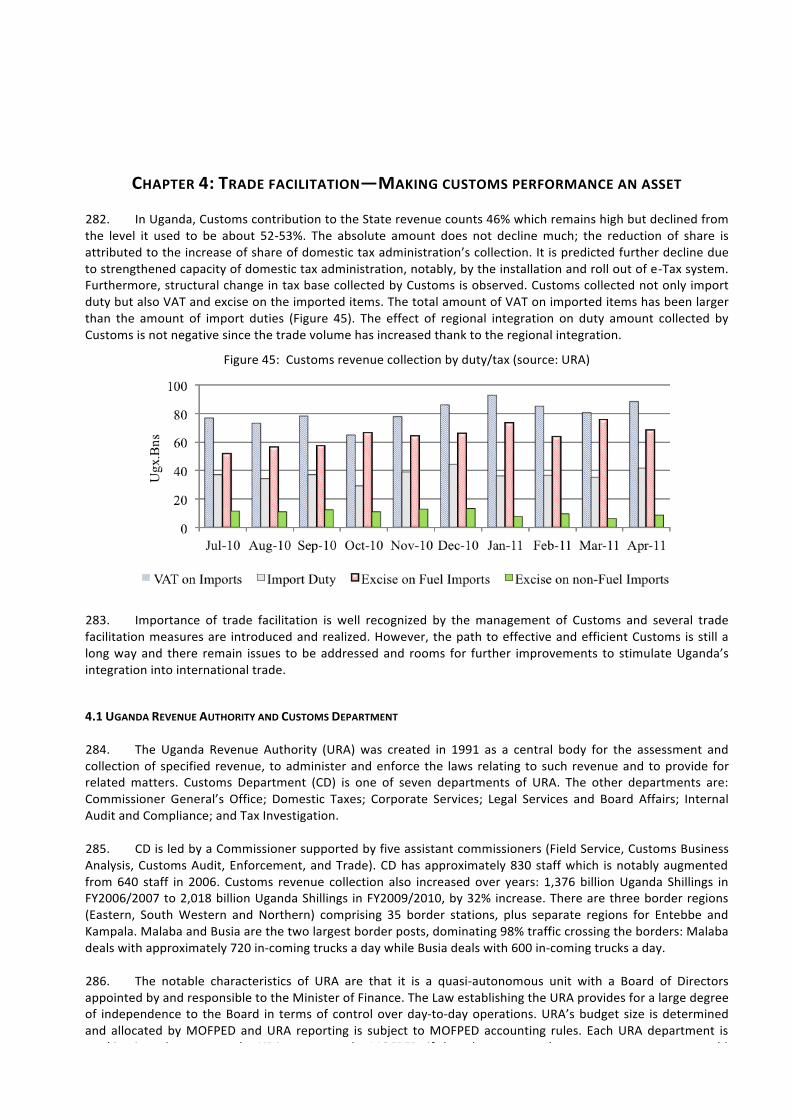
102
CHAPTER 4: TRADE FACILITATION—MAKING CUSTOMS PERFORMANCE AN ASSET 282. In Uganda, Customs contribution to the State revenue counts 46% which remains high but declined from the level it used to be about 52-‐53%. The absolute amount does not decline much; the reduction of share is attributed to the increase of share of domestic tax administration’s collection. It is predicted further decline due to strengthened capacity of domestic tax administration, notably, by the installation and roll out of e-‐Tax system. Furthermore, structural change in tax base collected by Customs is observed. Customs collected not only import duty but also VAT and excise on the imported items. The total amount of VAT on imported items has been larger than the amount of import duties (Figure 45). The effect of regional integration on duty amount collected by Customs is not negative since the trade volume has increased thank to the regional integration.
Figure 45: Customs revenue collection by duty/tax (source: URA)
283. Importance of trade facilitation is well recognized by the management of Customs and several trade facilitation measures are introduced and realized. However, the path to effective and efficient Customs is still a long way and there remain issues to be addressed and rooms for further improvements to stimulate Uganda’s integration into international trade.
4.1 UGANDA REVENUE AUTHORITY AND CUSTOMS DEPARTMENT
284. The Uganda Revenue Authority (URA) was created in 1991 as a central body for the assessment and collection of specified revenue, to administer and enforce the laws relating to such revenue and to provide for related matters. Customs Department (CD) is one of seven departments of URA. The other departments are: Commissioner General’s Office; Domestic Taxes; Corporate Services; Legal Services and Board Affairs; Internal Audit and Compliance; and Tax Investigation.
285. CD is led by a Commissioner supported by five assistant commissioners (Field Service, Customs Business Analysis, Customs Audit, Enforcement, and Trade). CD has approximately 830 staff which is notably augmented from 640 staff in 2006. Customs revenue collection also increased over years: 1,376 billion Uganda Shillings in FY2006/2007 to 2,018 billion Uganda Shillings in FY2009/2010, by 32% increase. There are three border regions (Eastern, South Western and Northern) comprising 35 border stations, plus separate regions for Entebbe and Kampala. Malaba and Busia are the two largest border posts, dominating 98% traffic crossing the borders: Malaba deals with approximately 720 in-‐coming trucks a day while Busia deals with 600 in-‐coming trucks a day.
286. The notable characteristics of URA are that it is a quasi-‐autonomous unit with a Board of Directors appointed by and responsible to the Minister of Finance. The Law establishing the URA provides for a large degree of independence to the Board in terms of control over day-‐to-‐day operations. URA’s budget size is determined and allocated by MOFPED and URA reporting is subject to MOFPED accounting rules. Each URA department is working in order to meet the URA targets set by MOFPED: if they do not meet the targets, consequence would
103
include change in the management and in the resource allocation in the next year. Therefore contents of targets and the decision making mechanism for setting the targets are quite important to characterize the organization and assess the corporate strategy and direction of URA.45
287. The URA targets on its official Website are only revenue targets; there is no trade facilitation related targets on the Website. Under such a circumstance, although the CD has responsibilities in “facilitating international and regional trade”46, the URA might not give corporate priority to the Customs missions other than revenue collection, notably trade facilitation, at a level as high as the stakeholders have anticipated. Similar revenue-‐centric tendency can be observed from the URA annual report and Business Plan. Annual report 2010/2011 very well articulates the tax/duties collection and tax-‐related activities, such as, refund. Although there is a section of “Facilitating Trade and Compliance Management”, it is merely descriptive part and does not provide any data, e.g., information on dwell time at the border post. In comparison to the best practices of modern Customs policy and practices, it is outdated to see the performance of Customs being assessed solely by the amount of revenue collected. Strategic objectives listed in Business Plan 2012-‐2013 do not have explicit trade facilitation aspects while there is explicit reference to revenue generation. URA has aspiration of 15% reduction in the border post dwell time, but the information is not published in the URA framework.47 Although 2004 Customs Circular announced the release time service standards, the current arrangement of these service standards are not clear: it is advisable to continue monitoring the progress on these trade facilitation indicators.48
288. It is therefore recommendable that management data on Customs missions other than revenue collection, notably, trade facilitation and securing security and safety, should be published and presented to the stakeholders, notably private sector and ministries in charge of country’s competitiveness and well-‐being, for feedback and managing the service standards endorsed by high level of hierarchy. Although one of the reasons of establishing the revenue agency was to remove external interference, external stakeholders in the board or advisory status might increase their active participation in the board in order to give priority to genuine Customs function.49 Since the targets of URA are determined by MOFPED, this recommendation is addressed to MOFPED.
4.2 MEASURES CONTRIBUTING TO REDUCE THE DWELL TIME AT THE BORDER POSTS
289. Recent successful development in the Uganda border management modernization is often cited as the border post dwell time has reduced from 3 days to 3 hours. Hartmann (2012) clearly shows the reduction in the border crossing time at Ugandan major border posts. URA listed up 5 elements for this success story as follows:
• Interconnectability with neighboring countries Customs ICT systems • Pre-‐arrival facility • Measures to prevent long stay • 24/7 operation • Self-‐assessment
4.2.1 INTERCONNECTABILITY WITH NEIGHBORING COUNTRIES CUSTOMS ICT SYSTEMS
290. Traders need taking time to produce Customs goods declarations. In production of Customs declaration from the scratch, there are always risks of mistype and making errors by which the verification, correction and Customs processing would cause further delay. In the EAC region, Revenue Authority Digital Data Exchange System (RADDex) transmits Customs declaration data, in near real time, from the point of initial lodging, through all affected transit points, to the final destination, of different countries.
291. In the region, the law remains requiring that Customs declaration needs to be placed by eligible party who is/ to be in the country. If the cargo destined to Kampala ICD enters the EAC at Mombasa port, declaration of Kenya through transit has to be made Kenyan party (parties since it needs two declarations: transit initiation and
45 Further reading on Revenue Authority is De Wulf (2005). 46 “Departmental Responsibilities” on URA Webpage (http://www.ura.go.ug/) 47 Project Appraisal Report on TMEA Website (http://www.trademarkea.com/downloads/pars/par11_uganda_ura.pdf) 48 The September 25, 2004 notice promises three hours for electronically lodged green lane entries, one day for yellow lane entries, two days for red lane entries, and 20 minutes for export entries lodged electronically. 49 Uganda Manufacturing Association had a seat on the board in 1998.
104
transit completion in Kenya). In the Ugandan side, declaration should be made by Ugandan counterparts. With RADDex, Kenyan party notices the Kenyan transit declaration reference number to the Ugandan counterpart. By using this reference number, the latter can retrieve the Kenyan transit declaration data onto the Ugandan Customs declaration data entry screen. If it is the transit declaration in Uganda, the number of data element is the same to the declaration to Kenya Customs (38 data elements). The Ugandan counterpart simply checks the contents and add/modify specific information, normally, 3 data elements out of 38, notably, declarant’s name.
292. RADDex has realized significant time reduction in preparation and processing the declarations by:
• (for the benefits of declarants) avoiding duplicate data entry by declarants at different border posts;
enabling pre-‐arrival declaration and data processing; and • (for the benefits of Customs) sending advance notice for the preparation; facilitating the verification.
293. EAC in support of USAID has been in charge of maintenance of RADDex which is being upgraded its ICT capacity, covering 5 countries’ Customs ICT systems (Kenya, Malawi, Rwanda, Tanzania and Uganda).
4.2.2 PRE-‐ARRIVAL FACILITY
294. Pre-‐arrival facility is the most commonly observed trade facilitation measure with an aim to reduce the clearance time while wishing to secure the level of controls. One of the prerequisites to pre-‐arrival facility is that there are needs of mechanism to secure the receipt of accurate goods declaration data prior to the physical arrival of the goods, which RADDex realizes. 295. URA calls the facility “pre-‐declaration”, allowing pre-‐arrival facility at the border posts: not only pre-‐arrival declaration and pre-‐arrival data processing (e.g., selectivity process, documentary checks), but also, in certain high compliant cases, the URA allows pre-‐arrival clearance. The usability is augmented when pre-‐arrival facility is used in combination of facilitation measure in the duty payment method, e.g., gross payment account.
296. Despite the benefits to both Customs and economic operators, URA has found that the use of pre-‐arrival facility is globally at low level while the figure for large established companies’ use is very high. Since the benefits of pre-‐arrival facility to both Customs and private sector is obvious, the challenge is to increase the use by smaller economic operators: URA is planning to provide training and raising awareness to those economic operators who are hesitant to use this trade facilitation measures.
297. Pre-‐arrival facility is allowed only in the goods declaration at the border posts: it allows any Customs regimes, including both transit and import for home consumption. Nevertheless, ICD (mostly, import for home consumption and Customs warehousing) is not allowed to use this trade facilitation instrument. URA stress that generation of manifest by Customs is necessary before starting the goods clearance processing (by which manifest is to be written off). Due to the asymmetric usability of pre-‐arrival facility, Freight Forwarders Association has pointed out that there is a pattern shift from Kampala to border posts as the site of import clearance for home consumption.
298. Although it is understandable of importance of generation of manifest information and reconciliation, this does not constitute the reason of not providing pre-‐arrival facility, particularly, pre-‐arrival declaration and pre-‐arrival data processing to the ICD users, with possible immediate release upon the confirmation of physical arrival of goods. It is recommendable to consider pre-‐declaration be available at the ICDs.
4.2.3 MEASURES TO PREVENT LONG STAY
299. URA has introduced and implemented several trade facilitation measures. Data generated by ASYCUDA++ 50 showed that the delay caused by inefficient Customs procedures reduced significantly. Nevertheless, URA has found out that dwell time did not change much (see Figure 46). The fact was that certain economic operators had their own interest in staying at the border post regardless the speed-‐up of the Customs procedures. Such interests were diverse, including: truck drivers to spend time in the village near-‐by the border 50 ASYCUDA is the software for Customs clearing process, which is developed and maintained by UNCTAD. It stands out “Automated SYstem for CUstoms DAta”. “ASYCUDA World” is the latest version after “ASYCUDA++”. ASYCUDA World has enhanced flexibility in terms of interfacing with different operating software and 3rd party database program. It is Internet base and its source code is open to the users.
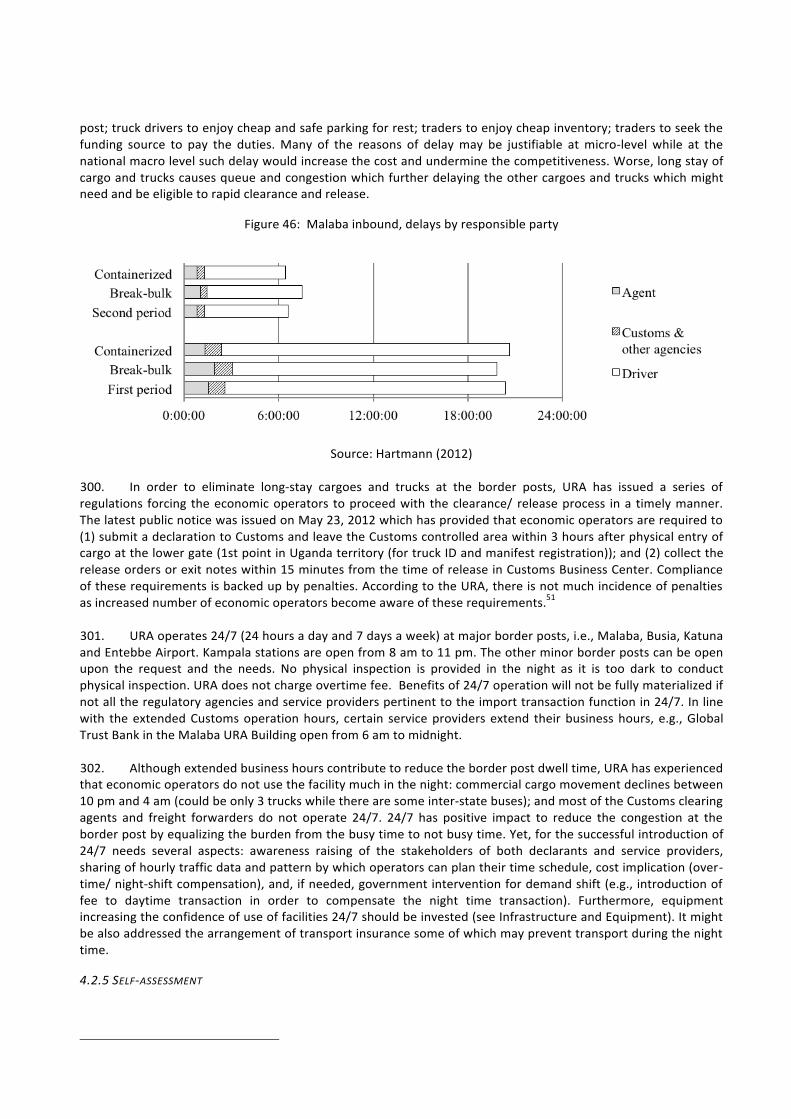
105
post; truck drivers to enjoy cheap and safe parking for rest; traders to enjoy cheap inventory; traders to seek the funding source to pay the duties. Many of the reasons of delay may be justifiable at micro-‐level while at the national macro level such delay would increase the cost and undermine the competitiveness. Worse, long stay of cargo and trucks causes queue and congestion which further delaying the other cargoes and trucks which might need and be eligible to rapid clearance and release.
Figure 46: Malaba inbound, delays by responsible party
Source: Hartmann (2012) 300. In order to eliminate long-‐stay cargoes and trucks at the border posts, URA has issued a series of regulations forcing the economic operators to proceed with the clearance/ release process in a timely manner. The latest public notice was issued on May 23, 2012 which has provided that economic operators are required to (1) submit a declaration to Customs and leave the Customs controlled area within 3 hours after physical entry of cargo at the lower gate (1st point in Uganda territory (for truck ID and manifest registration)); and (2) collect the release orders or exit notes within 15 minutes from the time of release in Customs Business Center. Compliance of these requirements is backed up by penalties. According to the URA, there is not much incidence of penalties as increased number of economic operators become aware of these requirements.51
301. URA operates 24/7 (24 hours a day and 7 days a week) at major border posts, i.e., Malaba, Busia, Katuna and Entebbe Airport. Kampala stations are open from 8 am to 11 pm. The other minor border posts can be open upon the request and the needs. No physical inspection is provided in the night as it is too dark to conduct physical inspection. URA does not charge overtime fee. Benefits of 24/7 operation will not be fully materialized if not all the regulatory agencies and service providers pertinent to the import transaction function in 24/7. In line with the extended Customs operation hours, certain service providers extend their business hours, e.g., Global Trust Bank in the Malaba URA Building open from 6 am to midnight.
302. Although extended business hours contribute to reduce the border post dwell time, URA has experienced that economic operators do not use the facility much in the night: commercial cargo movement declines between 10 pm and 4 am (could be only 3 trucks while there are some inter-‐state buses); and most of the Customs clearing agents and freight forwarders do not operate 24/7. 24/7 has positive impact to reduce the congestion at the border post by equalizing the burden from the busy time to not busy time. Yet, for the successful introduction of 24/7 needs several aspects: awareness raising of the stakeholders of both declarants and service providers, sharing of hourly traffic data and pattern by which operators can plan their time schedule, cost implication (over-‐time/ night-‐shift compensation), and, if needed, government intervention for demand shift (e.g., introduction of fee to daytime transaction in order to compensate the night time transaction). Furthermore, equipment increasing the confidence of use of facilities 24/7 should be invested (see Infrastructure and Equipment). It might be also addressed the arrangement of transport insurance some of which may prevent transport during the night time.
4.2.5 SELF-‐ASSESSMENT
51 Prolonged cases such as dispute in classification and valuation are not subject to the requirements.
106
303. Self-‐assessment is the assessment of duties by licensed companies, including licensed Customs clearing agents, who have rights to the Customs system. It enables the declarant to assess the declared value in the Customs declaration52 and to make straight to payment for the clearance. This is contrary to Customs imposed value where it is Customs to determine the goods’ value. The selectivity remains applied to self-‐assessed declarations: if the selection of control channel is Green and Blue, the goods are released immediately subject to the satisfactory of the payment of the duties. If the selection is Yellow and Red, the release is up to the findings of documentary check and physical inspection. Self-‐assessment requires high level of Customs legal and regulatory knowledge in the declarant, notably, goods nomenclature, valuation and the origin, which are vital elements to determine the goods’ value in the Customs declaration. With the ASYCUDA++, self-‐assessment materializes the benefits of Direct Trader Input (DIT) where the declarant can establish and submit their declarations, and possibly obtain the clearance and release note at their premises.
4.2.6 OTHER (EAST AFRICA COMMUNITY)
304. Uganda has been a member of the East African Community (EAC)53 since 2005. EAC is now completing the Customs Union. In the domain of Customs, Uganda has accepted EAC Common External Tariff (CET), EAC Common Tariff Nomenclature (CTN), and EAC Customs Management Act. Customs Management Act, entered into force in 2004 and revised annually, provides for the management and administration of Customs and for related matters which covers entire Customs processes and operations as well as rights and obligations of economic operators in relation to Customs. EAC Customs Management Act and its detailed interpretation, EAC Customs Management Regulations are directly applied to Uganda. Accordingly, all the formalities and data elements are regionally standardized which bring about trade facilitation effects in the region. In addition, EAC framework stipulates interconnection of revenue authority systems which realized accurate and timely declaration production which gives quite positive impact to the trade facilitation.
305. Since all the EAC Member States are working on the same legal and regulatory framework, projects, such as Authorized Economic Operators (AEO: details in 4.6.1) and reform of Customs clearing agency, are being designed at the EAC level in consultation with the other Member States and EAC Secretariat.
306. EAC Customs Union is working on the determination of the principle of Customs duty collection (collection at final destination or 1st entry point to the EAC) and whether or not and how to share the Customs duties collected. The pertinent work has already started. Consultants study papers on these fiscal aspects are being evaluated at the EAC level.
52 Customs could request supporting documents and information, including possible physical verification and inspection, if the declared value is appropriately assessed. 53 Customs Union Members are: Kenya, Rwanda, Tanzania, Uganda.
107
4.3 CUSTOMS MODERNIZATION
307. The URA has been furthering integration of Customs and domestic tax departments: e.g., excise is removed from Customs and Excise Department and administrative units are gradually merged. The “Customs Modernization Plan” is part of the URA modernization plan rather than a single stand-‐alone document. URA is willing to further consolidation of the gains and maintain the pace of change in its drive towards corporate excellence over the period from FY2011/2012 to 2014/2015. The reform program is called “Managing Compliance Programme” under which URA has developed a number of strategic reforms and defined projects necessary to bring their successful implementation. “Customs Business Systems Enhancement” is one of 4 projects identified in the MCP. The other three projects are: Service Support Enhancement (including URA Web-‐portal, laboratory, Monitoring and Evaluation on Customs modernization); Integrated Tax System; and Infrastructure Development (dominantly referring to One Stop Border Posts).
• Customs Business Systems Enhancement contains several anticipated interventions as follows. Key issues
are discussed in the following sections. • Review, enhance and implement all Customs business processes • Design, develop and implement ASYCUDA World system • Capacity building in Customs quality service delivery through system users training, ICD training, IT
specialized training and training materials, intelligence and surveillance, scanner operations • Develop and implement a change management plan • Transit monitoring improvement; procurement and installation of an electronic Cargo Tracking System to
improve Customs enforcement management • Digital stamp verification acquired and implemented • Acquire and install Customs valuation system • Interface airlines’ systems with ASYCUDA World to facilitate pre-‐arrival declaration and analysis • Implement the national AEO accreditation and extend the concept to Domestic taxes function • Implement monitoring and evaluation of Customs business systems enhancement
4.4 INFORMATION TECHNOLOGY
308. After the successful implementation of ASYCUDA++, URA has become much familiar with the use of ICT system in its operations: 34 Customs posts out of 35 were automated and connected to single ASYCUDA server stationed in the Customs Headquarters through which table maintenance is synchronized and account and statistics collection is automated. 99% of the total Customs revenue has been collected through ASYCUDA. Direct Trade Input (DTI) is increasingly used which has reduced the burden of declarant in submission of declarations to the Customs. Selectivity module functions. URA has stated that it seeks better systems and better use of ICT to further increase its efficiency and effectiveness: the main components of such enhancement are as follows.
4.4.1 MIGRATION TO ASYCUDA WORLD
309. ASYCUDA++ and the business process re-‐engineering during its installation has streamlined the URA Customs procedures and both Customs officials and traders got familiar themselves in use of system. Yet, URA assessed that ASYCUDA++ has limited functionalities, namely, limited interconnectivity with other systems; lack of support for enterprise wide risk management; complicated navigation; and upgrades that do not allow for engagement of key private sector stakeholders. URA has therefore decided to migrate to “ASYCUDA World” with an aim to its roll out in January 2013. The preparation and installation is being underway with support of UNCTAD and TMEA. When the AEO regime is established, it is necessary to design how AEO declaration would be treated in the selectivity process: e.g., override the selectivity module conclusion when the declarant is the AEO.
4.4.2 DIRECT TRADE INPUT (DTI) AND FULL PAPER-‐LESS
310. Direct Trade Input (DTI) is dominant data entry method, particularly but not limited to, large established traders, which accompanies self-‐assessment of value. Nevertheless, small-‐scaled traders (Customs clearing agents) tend to use data entry center which is situated within the Customs building. URA has an aspiration that all
108
declarations would be via DTI with an aim to avoid incidence of malpractice in the face-‐to-‐face interaction between the Customs officials and traders.
311. Electronic submission of supporting documents and picture image (in a form of PDF image) is scheduled to take place in October/ November 2012. Online inquiry communication channel will be also provided. Once these facilities are materialized and if the traders use Direct Trade Input (DTI), Customs clearance process would not require face-‐to-‐face interface between Customs officials and the traders, except those selected for physical inspection.
312. Full paper-‐less environment enables Uganda to join IATA e-‐freight which requires paper-‐free environment (electronic transmission is allowed while print out may be necessary) and accession to Montreal Protocol 4 and/or Montreal Convention of 1999 for the Unification of Certain Rules for International Carriage by Air. IATA e-‐freight reduces the cost and time in air-‐cargoes transactions by eliminating papers on the airplane and promoting data interchange by all the stakeholders. IATA cargo headquarter in Geneva is in charge of provision and arrangement of technical assistance and audit.54 Since Uganda horticultural exports use air transportation and the destination are introduced IATA e-‐freight, merits of introducing e-‐freight in Uganda are quite understandable.
4.4.3 DATABASE SYSTEM
313. ASYCUDA series are, in principle, processing system which is designed to process large volume fast and precisely in accordance with predetermined parameters. These parameters need to be maintained outside ASYCUDA: e.g., risk management indicators and tables, Customs valuation support information (commonly observed is combination of goods description + origin + reference value). Currently URA does not have the database system and data are manually managed and fed in ASYCUDA. Such data should include: feedback information (e.g., findings of physical inspection, documentary check and post-‐clearance verification, established value information), intelligence report (e.g., other government agencies, from neighboring countries’ Customs, WCO), administrative report (e.g., resource input, volume of transaction, dwell time), and traders’ compliance record.
314. Accordingly, the URA has a plan to prepare to create database system to support its operations, including risk management and valuation. Such database system will also be used in trial of modification of risk indicators and tables to assess the impact of such changes. The development of database system and its management capacity should be accelerated and supported for creating better data management structure.
4.4.4 CUSTOMS RECONCILIATION SYSTEM
315. Customs Reconciliation System (CURES) is the program developed in-‐house the URA which aims to complement ASYCUDA by capturing actual and physical information of trucks and containers. It is functioning at the entry point at Malaba near the border with Kenya, namely, lower gate, where Kenyan Customs and Ugandan Customs officers sit together side-‐by-‐side. They check and register the truck IDs and container numbers and produced “rotation numbers” for tracking in the system. This information will be reconciled with goods declaration and at the exit gate.
316. CURES is under piloting at Malaba. Data capturing apparently takes time and causes queue and congestion in the Kenyan side (queue to enter into the Ugandan side). Streamlined data capturing, such as, mobile image scanner and picture reader, would increase the productivity at this very up-‐stream procedures in the Ugandan side. (see Infrastructure and Equipment).
4.4.5 WORK ON SINGLE WINDOW
317. Ministry of Trade is coordinating on the work on Uganda Single Window. It is still at the very early stage. Most of the ministries and agencies do not have automation in their procedures and are not familiar with modern control techniques, such as, risk management and pre-‐arrival facility which Customs have demonstrated the usefulness. In general, clearance and release time in Uganda is not bad and coordination among control agencies
54 Further information is found in www.iata.org/whatwedo/cargo/efreight/.
109
is well established at the border posts. Single Window is always a good agenda, but ways to how to reach the Single Window have several different options. Customs experience shows that, even without Single Windows, automation of process itself has advantages and benefits: increase efficiency and effectiveness, enhance accountability, standardized formalities and interpretation of laws and regulations, real time communication between remote border posts and the headquarters. These benefits are surely applicable to the government agencies other than Customs.
318. Recent technologies offer flexible and user-‐friendly software architecture. Heavy and rigid ICT platform where simple modification of data entry screen or introduction of new reports takes several weeks with international consultant support is becoming obsolete. If current Single Window work does not move forward as smoothly as anticipated, it is recommendable to encourage the Ugandan stakeholders to redefine the priority of the activities to reach the Single Window: options would include start with automation of processing of individual border agency’s task and interconnectivity between the headquarters and border post staff of the same agencies; sharing Customs ICT property with the other agencies, notably selectivity module while the risk management principle to be maintained. In parallel to development of ICT aspects, it is always advisable to seek means and ways to enhance already good working relationship among the border agencies.
4.5 IMPORT AND TRANSIT PROCEDURES
319. Thanks to EAC regional integration and RADDex, import and transit procedures have become much streamlined in Uganda. Use of ASYCUDA is mandatory. Uganda is a land locked country; all the goods destined to Uganda except air cargoes need to cross the neighboring country’s territory. 98% of cargoes are via either Kenya or Tanzania (border posts of Malaba and Busia). Both Kenya and Tanzania are Member States of EAC and their export and transit formalities are being processed by their Customs ICT systems (Simba in Kenya, ASYCUDA in Tanzania). These entered data is transferred to RADDex from their systems and via RADDex to Uganda ASYCUDA. When the Ugandan declarant receives reference number from its counterpart in Kenya or Tanzania, he/she can retrieve the data entered by its counterpart in these countries. Accordingly, the declarant (often Customs clearing agent) in Uganda does not need to start the production of declaration from the scratch. He/she needs to check the contents and add missing information. For example, if it is transit declaration in Uganda, most of the data elements are the same to the export or transit declaration in Kenya or Tanzania: Ugandan declarant needs to fill just three data elements, such as, his company’s name and rotation number.
320. This means that Uganda declarants can capture the information and data necessary to establish the Customs goods declaration long before the physical arrival of goods – pre-‐arrival facility. Together with facilitative payment options, such as, general payment account, URA even provides options of pre-‐arrival clearance. Pre-‐arrival facility is not allowed to ICD as Customs states that it needs validation of manifest and majority of goods in ICD is for Customs warehousing (supposed to be for non-‐time sensitive items).
321. Once the goods declaration is established and electronically submitted to ASYCUDA, ASYCUDA starts the process. Meanwhile, declarant needs to submit the supporting document manually (e.g., invoice, freight invoice, insurance certificate, transport documents, bill of lading, required certificates and licenses: soon to be replaced with electronic pdf file which will be electronically attached to goods declaration). ASYCUDA selectivity module determines the controls channel: if the declaration is selected to Green or Blue, the process go to the next stage (request of payment of duties); if the declaration is selected to Yellow, declarant will submit the supplementary documents requested by the Customs officials; and if the declaration is selected to Red, declarant will arrange the truck of his cargo brought to inspection site for the Customs inspection. No physical inspection is selected for transit cargoes.
322. When the physical goods (means of transport) has arrived at the border post, the truck ID, container number, together with transport document numbers are registered to CURES, then rotation number is issued. This is the tracking number which needs to be registered onto the goods declaration. Through the rotation number, conceptual information (invoice information) and physical information (transport information) will be matched and tracking becomes possible.
323. Customs inspection site hosts other government agencies. If needed, trader submits the documents to these agencies for processing. When Customs decides to conduct physical inspection, Customs invites pertinent agencies if they wish to inspect jointly.
110
324. Once the control completes and appropriate modification or verification is done, trader will pay the duties and fee to the bank which issues the receipt electronically to ASYCUDA.55 ASYCUDA captures the payment and issues the release note.
325. Declarant/ truck drivers are requested to leave the Customs controlled within the set timeframe after the receipt of the release note. If the goods declaration is for import for home consumption, it is the end of the formalities. If the goods declaration is for initiation of transit, it is the start of transit journey. When they go out from the Customs controlled zone, gate keeper records the rotation number through which URA can monitor if the truck entered is eventually leaves the controlled zone within the set timeframe.
326. For domestic transit, Customs generates truck manifest which may contain several bills of lading according to the number of items on the transit declaration. The declarant at the final destination (ICD or bonded warehouse licensed by the URA) will prepare and submit the import declaration for home consumption or Customs warehousing by which manifest is to be written off. If the declarant foresees that the process would take long or no need to hurry, he/she will apply the Customs warehousing regime. For this transaction, generation of truck manifest is necessary and because of this process, URA does not allow pre-‐arrival facility at the ICDs.
327. For international transit (through transit), URA will produce transit document based on the transit initiation declaration. Transit documents produced by Customs significantly streamlined transit completion process. There is no explicit transit completion declaration: upon the arrival of the goods at the destined Customs border post, appropriate verification of seals and/or cargo unit and of declaration bundle carried by truck drivers may be effectuated by Customs officers. Upon the confirmation of verification, Customs completes the transit, namely validation of the Customs transit document.
4.6 OTHER CUSTOMS OPERATIONS
4.6.1 RISK MANAGEMENT PRINCIPLES AND COMPLIANCE STRATEGY
328. Risk management in the control is the concept and exercises that the scope, incidence and depth of intervention would be modified depending on the risk of non-‐compliance (frequency and significance). In the clearance process at the border posts, URA applies risk management by using the selectivity module in the ASYCUDA. For example, Malaba border post, the largest transaction in the country, process approximately 720 trucks a day56 among which 40 trucks are selected for physical inspection as a result of automatic ASYCUDA++ selection functioning based on the predetermined risk indicators and matrix. All 40 physical inspections, in principle, take place before the end of the closing hours: this partly due to the traffic pattern, i.e., according to the URA majority of trucks arrive in the border post in the early morning and declaration process tends to start at the beginning of the working hours. Although Customs functions 24/7, physical inspection is not conducted in the night time since there is not sufficient light. At the national level, rough approximate composition of control channels for import for home consumption is apparently as follows: Green and Blue (70%), Yellow (15%), and Red (15%).57 Yet, this ratio seems to be dependent of the total number of declarations a day. It appears that the absolute number of cases of Blue, Yellow and Red channels is stable probably due to the human resource mobilization. Accordingly, if the total number of declarations increases, the share of Green may augment and vice versa.
329. Risk Management needs continuous maintenance, update and review in an ever evolving international trading pattern. URA wishes to receive an international intervention to improve the risk management, including establishment of a risk management support system by which feedback from the risk management cycle (e.g., the results of post-‐clearance audit, results of physical inspection, management report) and intelligence (e.g., fraud pattern report) would be well captured, analyzed and help fine-‐tuning the risk indicators, matrices, and
55 In case of pre-declaration, the order could be opposite: inspection could be after the payment. 56 720 trucks do not include empty trucks. Yet, it contains both transit and import for home consumption (transit is in principle not subject to the inspection). 57 Green (the entry is automatically assessed and released), Blue (the entry is automatically assessed and released but selected for post-clearance verification), Yellow (the entry is selected for documentary check prior to release), and Red (entry is selected for physical inspection).
111
composition. URA has aspiration to reduce the physical inspection rate by 50% by improved risk management by 2015.58
330. Risk management is often considered simply that higher risk would be tougher control with mobilizing increased control resources, which is however just one side of the story. It also means that lower risk would be subject to no, little, less frequent control, or would be eligible to new streamlined procedures, by which control resource can be mobilized to more needed and labor intensive area, such as, control on higher risk cargoes and post-‐clearance audit. Through such a policy, Customs seeks higher compliance in the economic operators -‐ Compliance Strategy. Accordingly, Authorized Economic Operator scheme (AEO) where economic operators accredited by Customs as meeting certain control requirements including high level of compliance record, would enjoy facilitated procedures. Uganda is currently working on pilot AEO regime. AEO is requested not only to meet the control requirements for its property, management and employees, but also to stipulate and secure the compliance in its business partners.
331. Possible application would be ICD operator. The expiry of licenses to operate ICDs is one year which high compliant operators think short: the operators need to renew the license every year upon a new application. Several operators suggested that longer expiry would not only reduce administrative burden but would provide more certainty where operators are considering sometimes sizeable capital investments in their facilities. URA is now conducting a pilot AEO ICD operator in which it grants much longer expiry for the AEO ICD operators.59
332. The idea of ASYCUDA selectivity module to serve for the other ministries and agencies has been discussed between Customs and these ministries. Once this realizes, ASYCUDA selectivity module will specify the control channel with rationale of selection, including those registered by the other ministries and agencies, by which Customs can smoothly invite the pertinent ministries and agencies for joint control. The registration of risk indicators for the other ministries and agencies has been realized only with Ministry of Foreign Affairs (diplomatic items) and Coffee Export Board. Work with the other ministries was halted as these ministries and agencies have not yet accommodated themselves with the concept of risk management (to the contrary to 100% control on black listed items). As URA suggests, there are needs to raise the awareness and train the other border management agencies on risk management concept.
4.6.2 CUSTOMS CLEARING AGENTS
333. Customs clearing agents are intermediary logistic service providers who conduct the formalities on Customs-‐related matters on behalf of their traders; other names are Customs brokers, Customs agency. Most common their function is to perfection the Customs declarations and to do the Customs clearance procedures. Poor quality declarations (e.g., errors in the contents, delay in the submission of requested supporting documents) would attract Customs officials’ time and resources through which it causes the queue and congestion impacting to the other declarations that could have been cleared in a rather streamlined process. Many poor quality declarations would undermine the materialization of trade facilitation benefits. Therefore quality management mechanism of Customs clearing agents is important.
334. EAC region used to be well known as having, so-‐called brief case Customs clearing agents, which meant that they did not have physical offices, often did not have sufficient professional knowledge but had special relationship with Customs officers. They were seen as part of sources of poor declarations and corruption. According to Uganda Freight Forwarders Association (FAA), the error rate in the Customs declaration could be up to 50% before 2004 when it started providing basic training. It estimates that the error rate has reduced to 15%. Today, URA has licensing requirements: the most recent one is “Requirements and conditions for renewal of Customs Agency license for 2012”. The requirements list up the conditions. Yet, Customs technical part, i.e., the work experience and Customs technical knowledge (laws and regulations) are not explicitly requested.60
335. In the framework of EAC, URA and FAA are working on the improvement in the quality management mechanism in a collaborative manner. FAA is preparing refresh training module as a self-‐regulation instruments
58 TMEA (2011) Project Appraisal Report for “Support to Uganda Revenue Authority to improve customs systems”. 59 The length of license expiry and frequency of audit are not necessarily linked. 60 Technical requirements are: no outstanding transaction, no outstanding offences, Customs Clearing Agents Passes (ID), at least 2 employees trained in ASYCUDA++ for data capture.

112
and URA will respect the training results as an integral part of the conditions of renewal of the license. The work is aiming at the establishment of quality management mechanism in December 2013. TMEA has been supporting this exercise.
4.7 COOPERATION WITH OTHER BORDER AGENCIES AND THE PRIVATE SECTOR
336. Legitimate social objectives give control power to control over the goods, human and means of transport crossing the border to several ministries and agencies. Such ministries and agencies besides Customs include: Ministry of Agriculture, Animal Industry and Fisheries (Veterinary Department); National Drug Authority; National Bureau of Standards; Department of Geological Surveys and Mines; Coffee and Cotton Development Authorities; Ministry of Tourism, Trade and Industry; Chamber of Commerce and Industry; Immigration; Police (drugs); Criminal Investigation (military). Inter-‐agency coordination is well observed while the mode of cooperation is not supported by ICT. Single Window initiative exists under the coordination by Ministry of Commerce, but the progress is slow. Key ministries and agencies at the border posts are stationed in the Customs building: joint control is frequently observed. The idea of sharing ASYCUDA selectivity module has not yet realized since the mind-‐set of other ministries and agencies’ 100% check on black list does not fit the concept of risk management. At the capital level, inter-‐agency dialogue does not seem function well. Inter-‐agency framework did not take place over a year and the progress of Single Window project under the Ministry of Commerce is slow. 337. Consultative mechanism with stakeholder is considered critical in modern Customs management: the Revised Kyoto Convention provided that “(t)he Customs shall institute and maintain formal consultative relationships with the trade to increase co-‐operation and facilitate participation in establishing the most effective methods of working commensurate with national provisions and international agreements.”61 URA recognizes the value of consultation with the private sector. Formal consultation mechanism between the Customs management and economic operators62 is currently limited to Annual Budget Framework; and Presidential Investment Round Table (twice a year). It is complemented by ad-‐hoc meetings. There is no formal consultative mechanism at the border post level. Both trade facilitation and better control, stakeholders’ understanding and sharing the sense of ownership on regulations is the key to success of higher compliant. The consultative mechanism should not be limited to simple communication but also the place for cultivating environment for creating better regulatory environment. In order to make the discussion productive and action-‐oriented, the objective data, such as, management statistics and the follow up, particularly decision of action (or non-‐action) and time-‐frame, should be accountable to the stakeholders.
South Sudan and Informal Trade
338. South Sudan is the first rank destination of transit through Uganda. Economic activity with South Sudan has increased (Figure 47). South Sudan is preparing to join the EAC: once this done two economies relationship is expected to become further enhanced. Two countries’ Customs administrations are also strengthening cooperation in several fronts, including technical assistance provided by URA.
Figure 47: Transit through Uganda by destination
61 International Convention on the Simplification and Harmonization of Customs Procedures (amended, entered into force in 2006). The quoted article is Standard 1.3 of General Annex to the Convention. 62 Mission interviewed with Uganda Chamber of Commerce and Private Sector Foundation (Freight Forwarders Association).
113
Source: URA
339. According to Ugandan Bureau of Statistics (UBOS), the share of informal trade to the total trade between Uganda and South Soudan is 49.5% in exports from Uganda and 43.7% in imports in Uganda. The figures illustrate that informal trade activities cannot be ignored in assessing the impact to the local economy and in formulating the trade policy. Yet, the situation with South Soudan could be unique and it would need careful review if the situation is sustainable. In a Uganda’s global perspective, share of informal trade is much smaller: UBOS (2012) shows that informal export share is 14% to the total export in 2011. The situation of imports provides further different image: the share of informal imports is negligible, smaller than 1% to the total import in 2011. Together with the situation that informal trade is not expected to generate duties and tax revenue, URA does not spend much attention to informal trade in terms of control and trade facilitation. It is aware of the impact of informal trade to local economy and household and gender income generation. URA’s reaction to the informal trade appears limited to improvements in the infrastructure and procedures securing the safety of individuals conducting the informal trade.
4.8 INFRASTRUCTURE AND EQUIPMENT
340. URA focuses the launch of the One Stop Border Post which requires among other things investment in the infrastructure. TMEA and the World Bank support the investment, but progress is slow. Meanwhile, the volume of trade and transportation has augmented. Malaba border post, the country’s largest border post, is congested due to: inadequate space for cargo handling and parking; poor design of circulation; and slow process of reconciliation. Although Malaba clearing and release process is streamlined and most of cargoes and trucks are released within the same day, the infrastructure constraints would undermine the performance and quality of control if the trade and transport volume will continue growing. In addition, the border dwell time does not count the Kenyan side where long queue is expected to enter Uganda territory.
341. At Malaba, URA, in addition to the border post parking, mobilizes private sector parking. Because of this, the exit gate was moved further away from it used to be. Cargo handling space, particularly for the inspection and verification (by Customs and/or by traders) and transshipment is apparently not adequate. The access to/from inspection shed is not well designed: trucks are parked in different directions randomly. There is no bypass road for empty containers and transit trucks which are not subject to physical inspection and other urgent cargoes, such as perishable, which the URA allows expedited process: these trucks are equally suffered with the congestion and queue at several physical bottlenecks. From this perspectives, the stage of classification of trucks eligible to expedited process and guiding to dedicated lanes (once created) (e.g., empty truck, transit track, perishables, AEOs) should be located at a point as early as possible enough not to be affected by congestion. Reconciliation process contains: registration at the lower gate (closer to the border with Kenya) and confirmation of release at the upper gate (exit to Uganda). Due to lack of automated data capturing system, the registration and confirmation takes time and causes congestion and queue. These issues would be solved in conjunction with the investment in the OSBP. Nevertheless, if the progress of OSBP does not meet the anticipated pace, as a short-‐term measure, these small investment would improve the quality of border management and performance.
342. Besides the cost of mobilize employees in the inconvenient working hours, one of the reasons why 24/7 is not used much by the private sector is the security concern. Lighting of the access road and parking is necessary for the users to increase the confidence to use the facility 24/7. This should cover not only the truck parking and access road to the parking, but also Customs clearing agent’s parking space and access road (pedestrian route) to the Customs building. Investment in security facility to increase confidence of private sector would be regarded as part of promotion of 24/7.
343. Although under the framework of EAC full-‐fledged laboratory would be set up at the gate ports, URA and the other government agencies needs analyzing capacity at the border to fulfill their tasks to verify the goods meeting national technical requirements and standards and classify the goods accurately. URA Managing Compliance Program for FY2011/12 – 2014/15 list up the needs of investment in establishment of laboratories (chemical and petroleum, food and drugs, and materials and electricals). These laboratories would increase the performance of trade in such items. In order to augment the use, sharing the use of laboratories with other
114
agencies and public entities should be promoted and the location of laboratories should take into consideration of patterns of trade.
344. Certain border posts do not have inspection shed (with roof) without which physical inspection does not take place in the rainy day which delays the process and undermine the performance. Investment in the inspection shed would increase the performance and promote the confidence of quality of services and controls. The reason of no Customs physical inspection during the night is lack of lighting. If there become needs of conducting physical inspection during the night, investment in such lighting facility will be imperative.
345. Electricity and communication stability continues constraints to the border management performance. Reliance on automated procedure becomes URA vulnerable against disruption in the power supply and telecommunication network. Disaster Recovery Plan and, for certain key areas, Business Continuity Plan should be developed and pertinent equipment should be furnished at all the border posts. Since Customs is not the only agency at the border, sharing such equipment with the other agencies and stakeholders should be taken into consideration.
4.9 MANAGEMENT AND HUMAN RESOURCES ISSUES
346. Uganda stakeholders have recognized that integrity is a fundamental condition for poverty eradication and sustainable economic development. Integrity means individual officials’ integrity to both professionalism and moral standards. The URA has stated that declining of URA performance from 1998 to 2003 was attributed to declining integrity as one of the responsible factors.63 In order to respond to the crisis, the URA developed the Integrity Enhancement Project (IEP) in 2005 for 5 years program.
347. IEP contained comprehensive measures: together with regulatory reform and automation which has made regulation transparent, accountable and less discretionary, it covers success factors listed in the WCO Revised Arusha Declaration,64 such as, a corporate staff charter on ethics in the workplace; a program of continuous training in integrity; development and monitoring of leadership and accountability standards; a revised taxpayer/trader charter of rights and obligations; development of appropriate sanctions and rewards for behavior; training of ant-‐corruption role models; an asset declaration system; and integrity indicators for performance assessment.
348. IEP closure report in 2010 has provided the current status of activities enlisted in the IEP. Most of the activities were achieved while few remained not achieved or partially achieved. Such outstanding issues include: periodic publication of black list for errant stakeholders; development of fraud prevention policy; dissemination of risk management policy; monitoring of risk management practice. Together with continued improvements in the anti-‐corruption and professionalism enhancing measures, these issues have been addressed.
349. The URA is quite serious to pursue full paper less environment and DTI in the Customs clearing processes. It has endeavored to eliminate and reduce the incidence of face-‐to-‐face interaction between the economic operators and Customs officials on daily transaction. If there is no way to avoid such human interface, such as, physical inspection, post-‐clearance verification, the URA has tried to promote high level of accountability. For success of such modernization initiatives, change in the mind-‐set is imperative. Therefore, it is recommended to address change management to Customs officials as well as economic operators in parallel to modernization initiatives.
63 URA (2010) “Integrity Enhancement Project” Closure Report. 64 Declaration of the Customs Co-operation Council concerning Good Governance and Integrity in Customs.
115
CHAPTER 5: SERVICES, THE NEW FRONTIER OF EXPORTS
5.1 SERVICES: WHAT IS AT STAKE
350. Services matter for growth and export diversification. Services such as telecommunications, energy, transport, and business services are important inputs into the production of goods and other services and hence influence productivity and competitiveness. Opening up to services imports and foreign direct investment (FDI) can be an effective mechanism to increase the availability, affordability and quality of these services, which are crucial for export diversification, economic growth and poverty reduction in Uganda. In addition, services offer dynamic new opportunities for exports. Exports of services are of particular importance for land-‐locked countries like Uganda for which opportunities to diversify into the export of manufactures is more limited by the high costs of transporting goods.
351. The Government of Uganda has started to realize the importance of services for the economy. Several recent strategic documents highlight the need to improve the performance of services and the need to open them up to imports and foreign direct investment to increase competition and efficiency. The Government of Uganda has identified, through a consultative process with private and public sector stakeholders, the following sectors as critical for Uganda’s development: business services (professional services and information technology services), construction and engineering services, education, financial services, tourism, telecommunication, transport, energy, distribution and health services. With respect to sectors with high export potential, notably in the sub-‐region, professional, information technology, education, and construction services have been singled out. Uganda is already exporting education services and has the potential to become an education hub for East Africa; however, less progress has been observed in the other services sectors with export potential.
352. This chapter starts with an overall assessment of Uganda’s services sectors performance and trade policies. Then, in order to derive concrete guidance for policy makers regarding the coordination of regulatory reforms with liberalization measures, the remainder of the Chapters analyzes in detail one of authorities’ priority sector with high export potential-‐namely professional services-‐which provides a good illustration of challenges for furthering trade in services and how regional integration can help advance Uganda’s services reforms.65
5.2 UGANDA’S SERVICES PERFORMANCE AND SERVICES TRADE POLICIES
353. Services constitute the largest part of Uganda’s economy accounting for about 45 percent of the country’s GDP in 2011/12 (World Bank Development Economics LDB database, 2012). Services also exhibit dynamic growth rates in Uganda -‐ the average annual growth rate of services outputs between 2006/7 and 20011/12 17 percent (Uganda Bureau of Statistics, 2012). Interestingly, non-‐traditional services such as communication services, financial services and business services contributed to some extent to the increase in services outputs. Still, traditional sectors such as distribution services, real estate and hotels and restaurants continue to account for larger shares in terms of contribution to GDP (Table 18).
Table 18: Composition of Uganda’s GDP, 20011/12 and Annual Average Growth 2006/7-‐2011/12
65 An in-depth analysis of each of the sectors with high potential is beyond the scope of this DTIS update. Other services sectors with high potential, such as tourism, benefit from significant attention from authorities and donors and have specific development strategies.
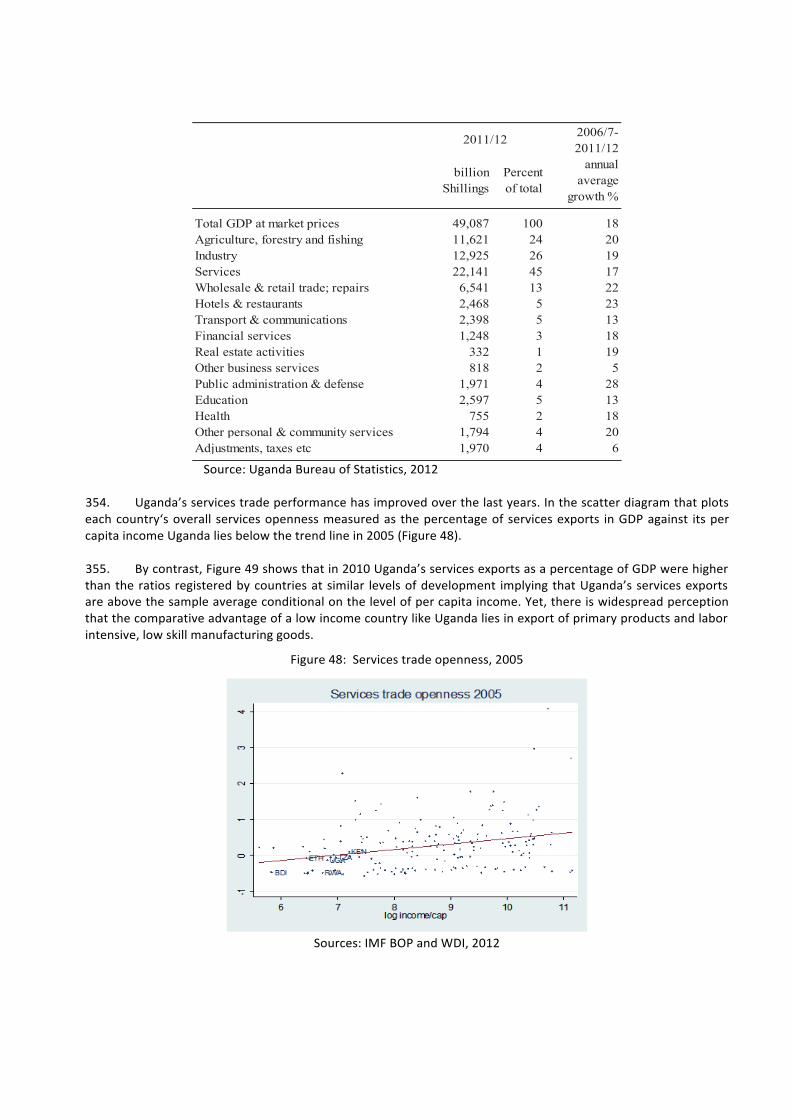
116
2006/7-2011/12
billion Shillings
Percent of total
annual average
growth %
Total GDP at market prices 49,087 100 18Agriculture, forestry and fishing 11,621 24 20Industry 12,925 26 19Services 22,141 45 17Wholesale & retail trade; repairs 6,541 13 22Hotels & restaurants 2,468 5 23Transport & communications 2,398 5 13Financial services 1,248 3 18Real estate activities 332 1 19Other business services 818 2 5Public administration & defense 1,971 4 28Education 2,597 5 13Health 755 2 18Other personal & community services 1,794 4 20Adjustments, taxes etc 1,970 4 6
2011/12
Source: Uganda Bureau of Statistics, 2012
354. Uganda’s services trade performance has improved over the last years. In the scatter diagram that plots each country‘s overall services openness measured as the percentage of services exports in GDP against its per capita income Uganda lies below the trend line in 2005 (Figure 48).
355. By contrast, Figure 49 shows that in 2010 Uganda’s services exports as a percentage of GDP were higher than the ratios registered by countries at similar levels of development implying that Uganda’s services exports are above the sample average conditional on the level of per capita income. Yet, there is widespread perception that the comparative advantage of a low income country like Uganda lies in export of primary products and labor intensive, low skill manufacturing goods.
Figure 48: Services trade openness, 2005
Sources: IMF BOP and WDI, 2012
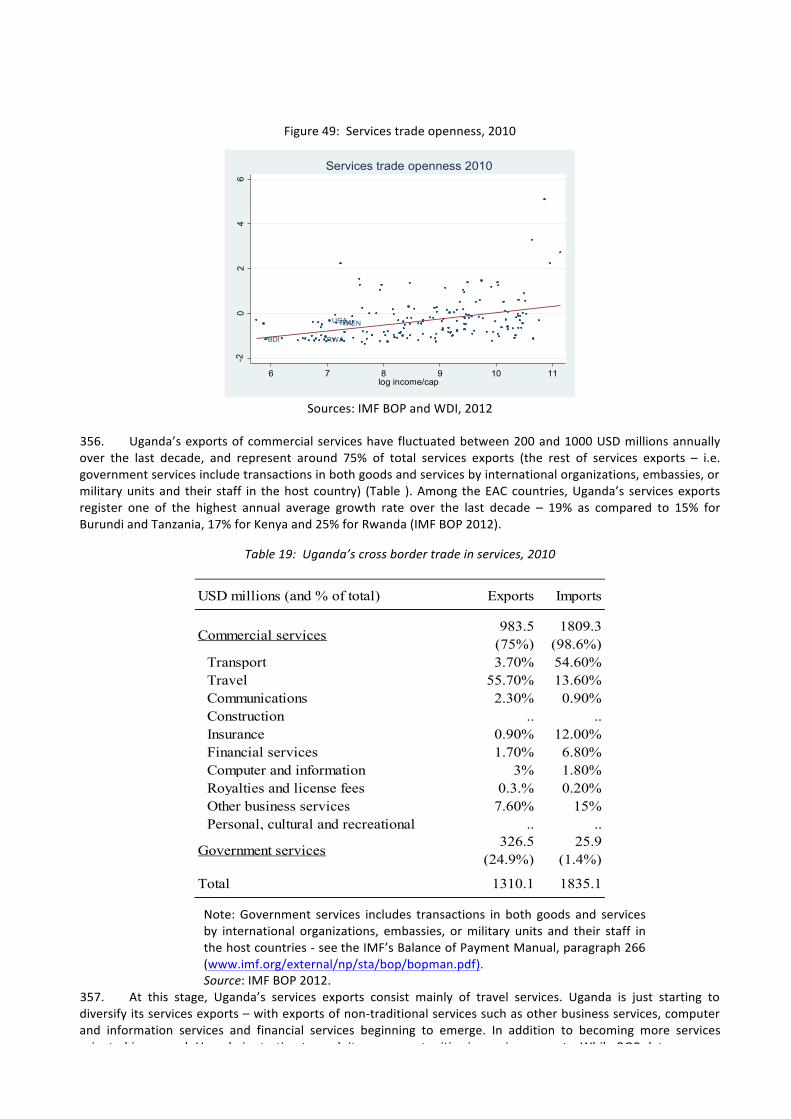
117
Figure 49: Services trade openness, 2010
BDI
KEN
RWA
TZAUGA
-20
24
6
6 7 8 9 10 11log income/cap
Services trade openness 2010
Sources: IMF BOP and WDI, 2012
356. Uganda’s exports of commercial services have fluctuated between 200 and 1000 USD millions annually over the last decade, and represent around 75% of total services exports (the rest of services exports – i.e. government services include transactions in both goods and services by international organizations, embassies, or military units and their staff in the host country) (Table ). Among the EAC countries, Uganda’s services exports register one of the highest annual average growth rate over the last decade – 19% as compared to 15% for Burundi and Tanzania, 17% for Kenya and 25% for Rwanda (IMF BOP 2012).
Table 19: Uganda’s cross border trade in services, 2010
USD millions (and % of total) Exports Imports
Commercial services 983.5 (75%)
1809.3 (98.6%)
Transport 3.70% 54.60%Travel 55.70% 13.60%Communications 2.30% 0.90%Construction .. ..Insurance 0.90% 12.00%Financial services 1.70% 6.80%Computer and information 3% 1.80%Royalties and license fees 0.3.% 0.20%Other business services 7.60% 15%Personal, cultural and recreational .. ..
Government services 326.5 (24.9%)
25.9 (1.4%)
Total 1310.1 1835.1
Note: Government services includes transactions in both goods and services by international organizations, embassies, or military units and their staff in the host countries -‐ see the IMF’s Balance of Payment Manual, paragraph 266 (www.imf.org/external/np/sta/bop/bopman.pdf). Source: IMF BOP 2012.
357. At this stage, Uganda’s services exports consist mainly of travel services. Uganda is just starting to diversify its services exports – with exports of non-‐traditional services such as other business services, computer and information services and financial services beginning to emerge. In addition to becoming more services oriented in general, Uganda is starting to exploit new opportunities in services exports. While BOP data on cross
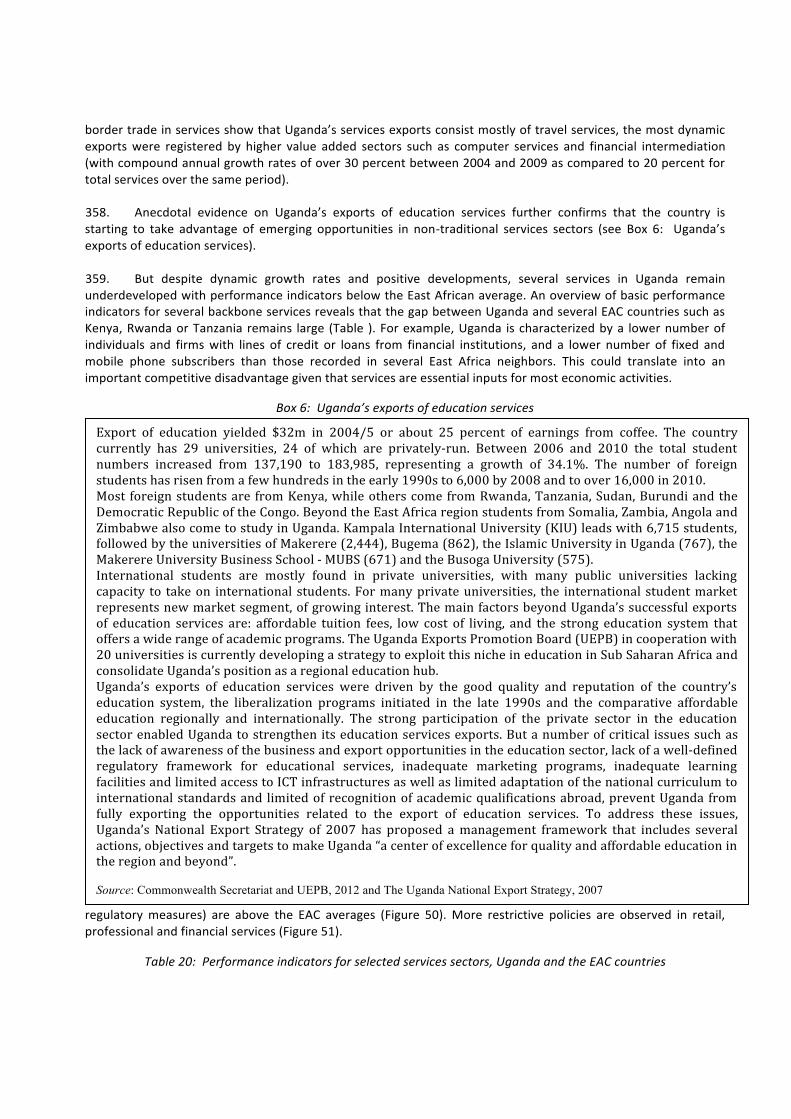
118
border trade in services show that Uganda’s services exports consist mostly of travel services, the most dynamic exports were registered by higher value added sectors such as computer services and financial intermediation (with compound annual growth rates of over 30 percent between 2004 and 2009 as compared to 20 percent for total services over the same period).
358. Anecdotal evidence on Uganda’s exports of education services further confirms that the country is starting to take advantage of emerging opportunities in non-‐traditional services sectors (see Box 6: Uganda’s exports of education services).
359. But despite dynamic growth rates and positive developments, several services in Uganda remain underdeveloped with performance indicators below the East African average. An overview of basic performance indicators for several backbone services reveals that the gap between Uganda and several EAC countries such as Kenya, Rwanda or Tanzania remains large (Table ). For example, Uganda is characterized by a lower number of individuals and firms with lines of credit or loans from financial institutions, and a lower number of fixed and mobile phone subscribers than those recorded in several East Africa neighbors. This could translate into an important competitive disadvantage given that services are essential inputs for most economic activities.
Box 6: Uganda’s exports of education services
360. Barriers to entry in services are likely to have slowed economic growth in Uganda in the same way as they have elsewhere by leading to inefficient provision of important inputs such as finance, telecommunications, electricity, transportation, and business services. Indeed, a recent World Bank survey of applied trade policies in five services sectors -‐ financial services (banking and insurance), telecommunications, retail distribution, maritime transport, and professional services in over 50 countries shows that Uganda’s overall restrictiveness index of applied services polices (explicit market access and national treatment barriers plus selected discriminatory regulatory measures) are above the EAC averages (Figure 50). More restrictive policies are observed in retail, professional and financial services (Figure 51).
Table 20: Performance indicators for selected services sectors, Uganda and the EAC countries
Export of education yielded $32m in 2004/5 or about 25 percent of earnings from coffee. The country currently has 29 universities, 24 of which are privately-‐run. Between 2006 and 2010 the total student numbers increased from 137,190 to 183,985, representing a growth of 34.1%. The number of foreign students has risen from a few hundreds in the early 1990s to 6,000 by 2008 and to over 16,000 in 2010. Most foreign students are from Kenya, while others come from Rwanda, Tanzania, Sudan, Burundi and the Democratic Republic of the Congo. Beyond the East Africa region students from Somalia, Zambia, Angola and Zimbabwe also come to study in Uganda. Kampala International University (KIU) leads with 6,715 students, followed by the universities of Makerere (2,444), Bugema (862), the Islamic University in Uganda (767), the Makerere University Business School -‐ MUBS (671) and the Busoga University (575). International students are mostly found in private universities, with many public universities lacking capacity to take on international students. For many private universities, the international student market represents new market segment, of growing interest. The main factors beyond Uganda’s successful exports of education services are: affordable tuition fees, low cost of living, and the strong education system that offers a wide range of academic programs. The Uganda Exports Promotion Board (UEPB) in cooperation with 20 universities is currently developing a strategy to exploit this niche in education in Sub Saharan Africa and consolidate Uganda’s position as a regional education hub. Uganda’s exports of education services were driven by the good quality and reputation of the country’s education system, the liberalization programs initiated in the late 1990s and the comparative affordable education regionally and internationally. The strong participation of the private sector in the education sector enabled Uganda to strengthen its education services exports. But a number of critical issues such as the lack of awareness of the business and export opportunities in the education sector, lack of a well-‐defined regulatory framework for educational services, inadequate marketing programs, inadequate learning facilities and limited access to ICT infrastructures as well as limited adaptation of the national curriculum to international standards and limited of recognition of academic qualifications abroad, prevent Uganda from fully exporting the opportunities related to the export of education services. To address these issues, Uganda’s National Export Strategy of 2007 has proposed a management framework that includes several actions, objectives and targets to make Uganda “a center of excellence for quality and affordable education in the region and beyond”.
Source: Commonwealth Secretariat and UEPB, 2012 and The Uganda National Export Strategy, 2007
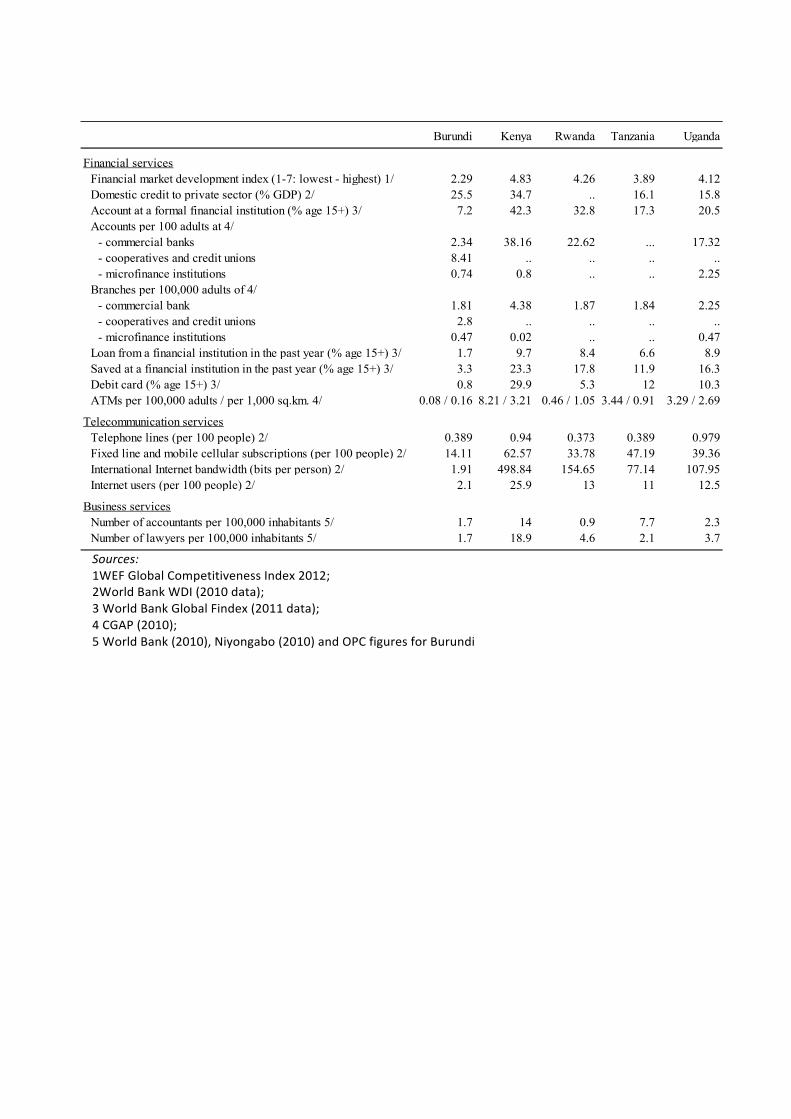
119
Burundi Kenya Rwanda Tanzania Uganda
Financial servicesFinancial market development index (1-7: lowest - highest) 1/ 2.29 4.83 4.26 3.89 4.12Domestic credit to private sector (% GDP) 2/ 25.5 34.7 .. 16.1 15.8Account at a formal financial institution (% age 15+) 3/ 7.2 42.3 32.8 17.3 20.5Accounts per 100 adults at 4/
- commercial banks 2.34 38.16 22.62 ... 17.32- cooperatives and credit unions 8.41 .. .. .. ..- microfinance institutions 0.74 0.8 .. .. 2.25
Branches per 100,000 adults of 4/- commercial bank 1.81 4.38 1.87 1.84 2.25- cooperatives and credit unions 2.8 .. .. .. ..- microfinance institutions 0.47 0.02 .. .. 0.47
Loan from a financial institution in the past year (% age 15+) 3/ 1.7 9.7 8.4 6.6 8.9Saved at a financial institution in the past year (% age 15+) 3/ 3.3 23.3 17.8 11.9 16.3Debit card (% age 15+) 3/ 0.8 29.9 5.3 12 10.3ATMs per 100,000 adults / per 1,000 sq.km. 4/ 0.08 / 0.16 8.21 / 3.21 0.46 / 1.05 3.44 / 0.91 3.29 / 2.69
Telecommunication servicesTelephone lines (per 100 people) 2/ 0.389 0.94 0.373 0.389 0.979Fixed line and mobile cellular subscriptions (per 100 people) 2/ 14.11 62.57 33.78 47.19 39.36International Internet bandwidth (bits per person) 2/ 1.91 498.84 154.65 77.14 107.95Internet users (per 100 people) 2/ 2.1 25.9 13 11 12.5
Business servicesNumber of accountants per 100,000 inhabitants 5/ 1.7 14 0.9 7.7 2.3Number of lawyers per 100,000 inhabitants 5/ 1.7 18.9 4.6 2.1 3.7
Sources: 1WEF Global Competitiveness Index 2012; 2World Bank WDI (2010 data); 3 World Bank Global Findex (2011 data); 4 CGAP (2010); 5 World Bank (2010), Niyongabo (2010) and OPC figures for Burundi
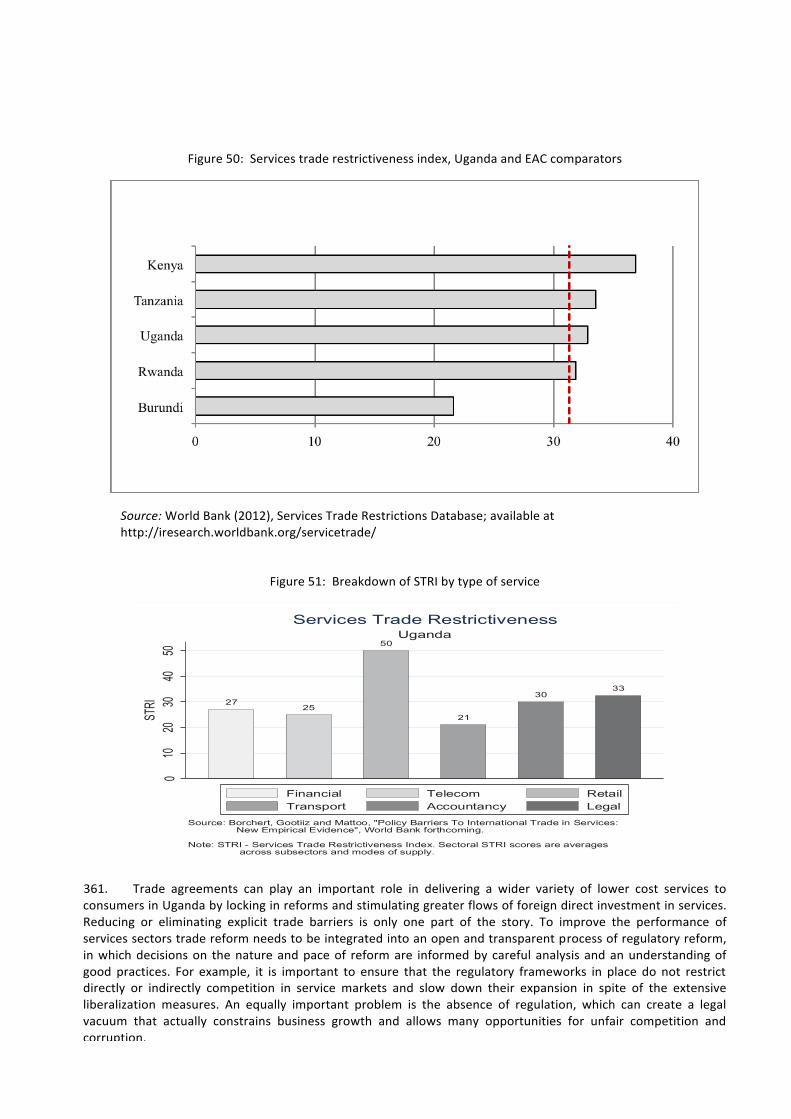
120
Figure 50: Services trade restrictiveness index, Uganda and EAC comparators
Source: World Bank (2012), Services Trade Restrictions Database; available at http://iresearch.worldbank.org/servicetrade/
Figure 51: Breakdown of STRI by type of service
2725
50
21
3033
010
2030
4050
STRI
Source: Borchert, Gootiiz and Mattoo, "Policy Barriers To International Trade in Services: New Empirical Evidence", World Bank forthcoming. Note: STRI - Services Trade Restrictiveness Index. Sectoral STRI scores are averages across subsectors and modes of supply.
UgandaServices Trade Restrictiveness
Financial Telecom RetailTransport Accountancy Legal
361. Trade agreements can play an important role in delivering a wider variety of lower cost services to consumers in Uganda by locking in reforms and stimulating greater flows of foreign direct investment in services. Reducing or eliminating explicit trade barriers is only one part of the story. To improve the performance of services sectors trade reform needs to be integrated into an open and transparent process of regulatory reform, in which decisions on the nature and pace of reform are informed by careful analysis and an understanding of good practices. For example, it is important to ensure that the regulatory frameworks in place do not restrict directly or indirectly competition in service markets and slow down their expansion in spite of the extensive liberalization measures. An equally important problem is the absence of regulation, which can create a legal vacuum that actually constrains business growth and allows many opportunities for unfair competition and corruption.
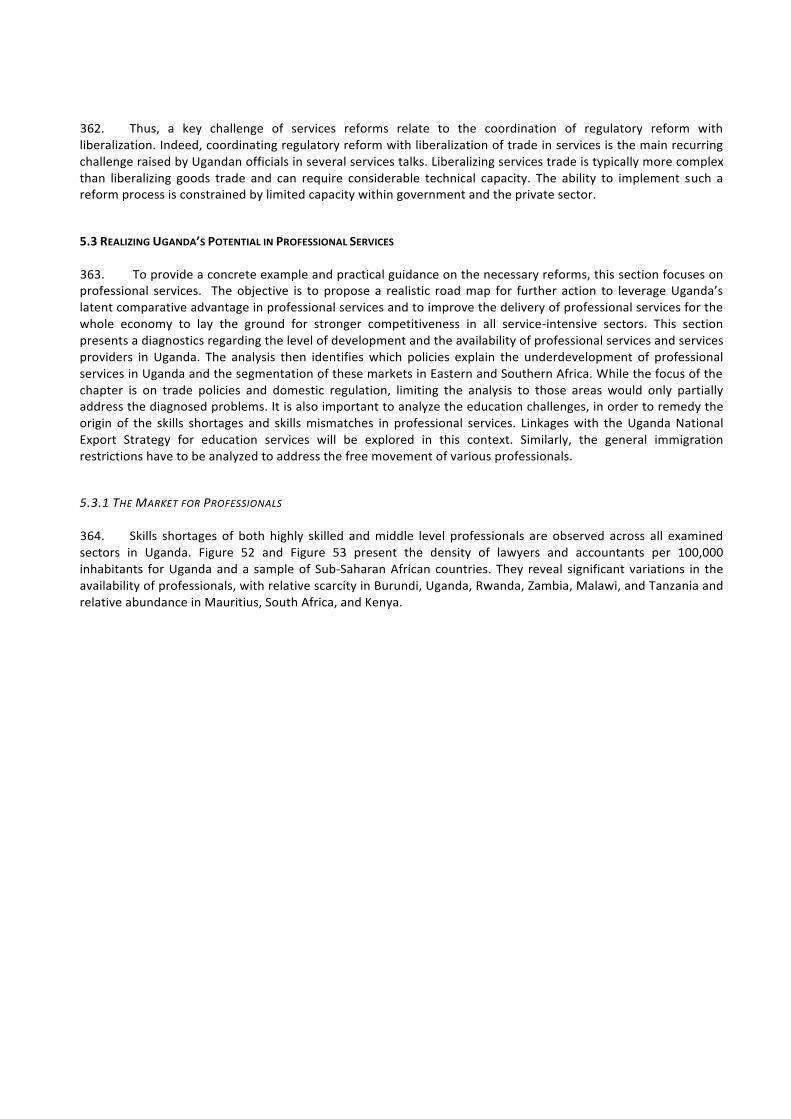
121
362. Thus, a key challenge of services reforms relate to the coordination of regulatory reform with liberalization. Indeed, coordinating regulatory reform with liberalization of trade in services is the main recurring challenge raised by Ugandan officials in several services talks. Liberalizing services trade is typically more complex than liberalizing goods trade and can require considerable technical capacity. The ability to implement such a reform process is constrained by limited capacity within government and the private sector.
5.3 REALIZING UGANDA’S POTENTIAL IN PROFESSIONAL SERVICES
363. To provide a concrete example and practical guidance on the necessary reforms, this section focuses on professional services. The objective is to propose a realistic road map for further action to leverage Uganda’s latent comparative advantage in professional services and to improve the delivery of professional services for the whole economy to lay the ground for stronger competitiveness in all service-‐intensive sectors. This section presents a diagnostics regarding the level of development and the availability of professional services and services providers in Uganda. The analysis then identifies which policies explain the underdevelopment of professional services in Uganda and the segmentation of these markets in Eastern and Southern Africa. While the focus of the chapter is on trade policies and domestic regulation, limiting the analysis to those areas would only partially address the diagnosed problems. It is also important to analyze the education challenges, in order to remedy the origin of the skills shortages and skills mismatches in professional services. Linkages with the Uganda National Export Strategy for education services will be explored in this context. Similarly, the general immigration restrictions have to be analyzed to address the free movement of various professionals.
5.3.1 THE MARKET FOR PROFESSIONALS
364. Skills shortages of both highly skilled and middle level professionals are observed across all examined sectors in Uganda. Figure 52 and Figure 53 present the density of lawyers and accountants per 100,000 inhabitants for Uganda and a sample of Sub-‐Saharan African countries. They reveal significant variations in the availability of professionals, with relative scarcity in Burundi, Uganda, Rwanda, Zambia, Malawi, and Tanzania and relative abundance in Mauritius, South Africa, and Kenya.
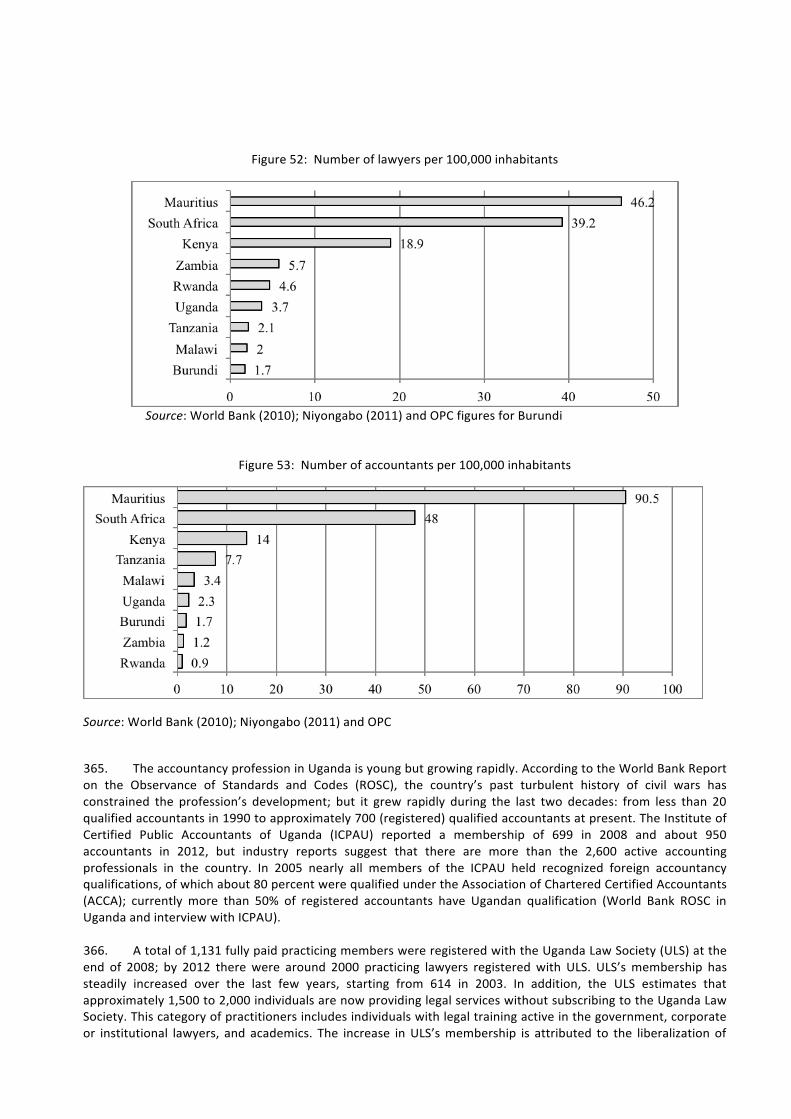
122
Figure 52: Number of lawyers per 100,000 inhabitants
Source: World Bank (2010); Niyongabo (2011) and OPC figures for Burundi
Figure 53: Number of accountants per 100,000 inhabitants
Source: World Bank (2010); Niyongabo (2011) and OPC
365. The accountancy profession in Uganda is young but growing rapidly. According to the World Bank Report on the Observance of Standards and Codes (ROSC), the country’s past turbulent history of civil wars has constrained the profession’s development; but it grew rapidly during the last two decades: from less than 20 qualified accountants in 1990 to approximately 700 (registered) qualified accountants at present. The Institute of Certified Public Accountants of Uganda (ICPAU) reported a membership of 699 in 2008 and about 950 accountants in 2012, but industry reports suggest that there are more than the 2,600 active accounting professionals in the country. In 2005 nearly all members of the ICPAU held recognized foreign accountancy qualifications, of which about 80 percent were qualified under the Association of Chartered Certified Accountants (ACCA); currently more than 50% of registered accountants have Ugandan qualification (World Bank ROSC in Uganda and interview with ICPAU).
366. A total of 1,131 fully paid practicing members were registered with the Uganda Law Society (ULS) at the end of 2008; by 2012 there were around 2000 practicing lawyers registered with ULS. ULS’s membership has steadily increased over the last few years, starting from 614 in 2003. In addition, the ULS estimates that approximately 1,500 to 2,000 individuals are now providing legal services without subscribing to the Uganda Law Society. This category of practitioners includes individuals with legal training active in the government, corporate or institutional lawyers, and academics. The increase in ULS’s membership is attributed to the liberalization of
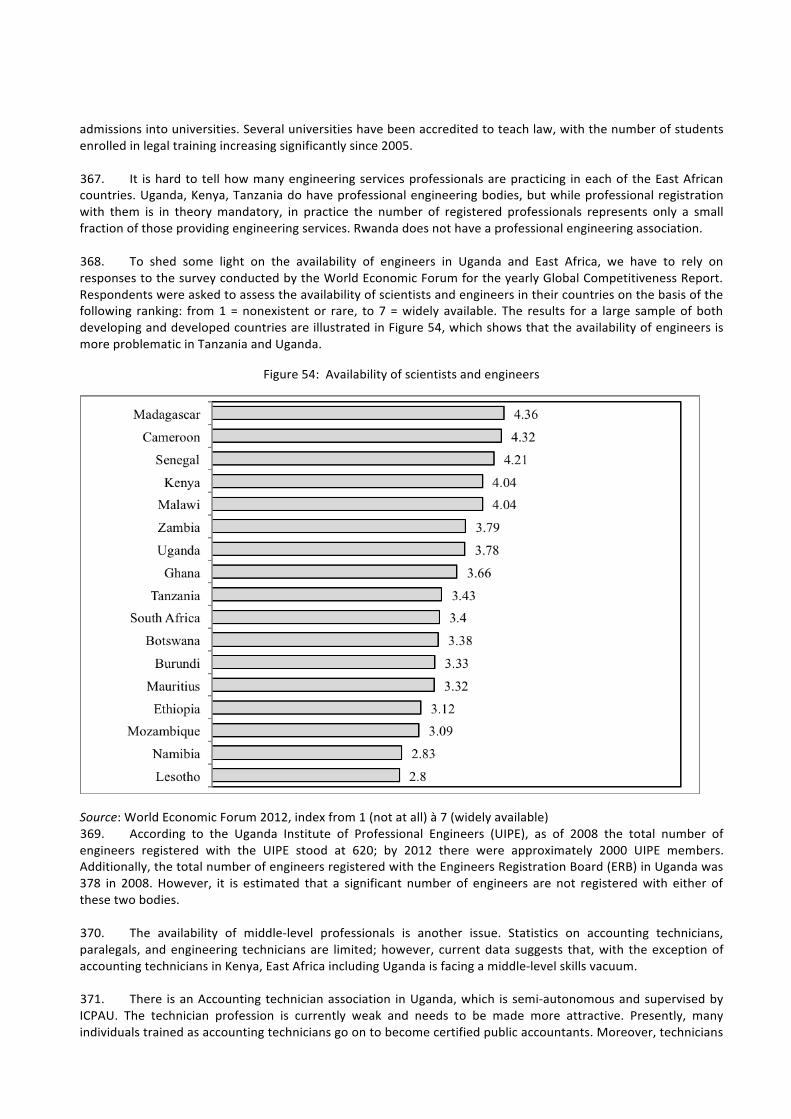
123
admissions into universities. Several universities have been accredited to teach law, with the number of students enrolled in legal training increasing significantly since 2005.
367. It is hard to tell how many engineering services professionals are practicing in each of the East African countries. Uganda, Kenya, Tanzania do have professional engineering bodies, but while professional registration with them is in theory mandatory, in practice the number of registered professionals represents only a small fraction of those providing engineering services. Rwanda does not have a professional engineering association.
368. To shed some light on the availability of engineers in Uganda and East Africa, we have to rely on responses to the survey conducted by the World Economic Forum for the yearly Global Competitiveness Report. Respondents were asked to assess the availability of scientists and engineers in their countries on the basis of the following ranking: from 1 = nonexistent or rare, to 7 = widely available. The results for a large sample of both developing and developed countries are illustrated in Figure 54, which shows that the availability of engineers is more problematic in Tanzania and Uganda.
Figure 54: Availability of scientists and engineers
Source: World Economic Forum 2012, index from 1 (not at all) à 7 (widely available) 369. According to the Uganda Institute of Professional Engineers (UIPE), as of 2008 the total number of engineers registered with the UIPE stood at 620; by 2012 there were approximately 2000 UIPE members. Additionally, the total number of engineers registered with the Engineers Registration Board (ERB) in Uganda was 378 in 2008. However, it is estimated that a significant number of engineers are not registered with either of these two bodies.
370. The availability of middle-‐level professionals is another issue. Statistics on accounting technicians, paralegals, and engineering technicians are limited; however, current data suggests that, with the exception of accounting technicians in Kenya, East Africa including Uganda is facing a middle-‐level skills vacuum.
371. There is an Accounting technician association in Uganda, which is semi-‐autonomous and supervised by ICPAU. The technician profession is currently weak and needs to be made more attractive. Presently, many individuals trained as accounting technicians go on to become certified public accountants. Moreover, technicians compete with undergraduates from universities who took some courses in accounting (e.g. BSc commerce and
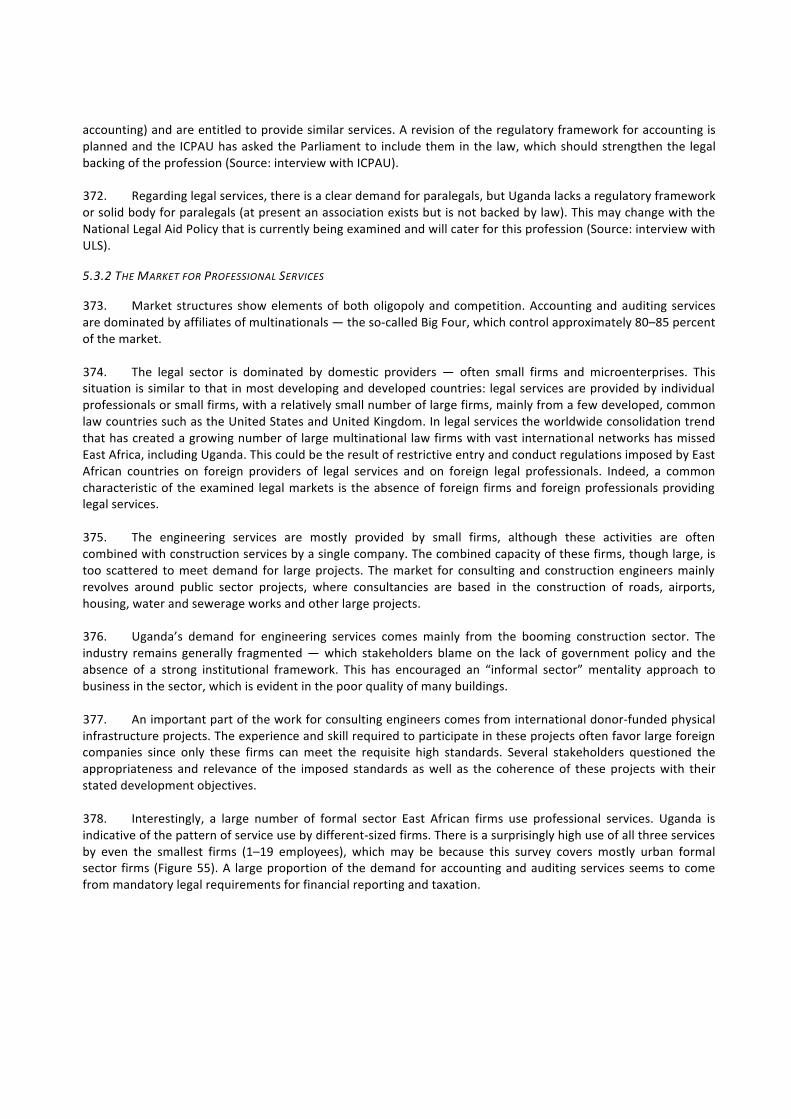
124
accounting) and are entitled to provide similar services. A revision of the regulatory framework for accounting is planned and the ICPAU has asked the Parliament to include them in the law, which should strengthen the legal backing of the profession (Source: interview with ICPAU).
372. Regarding legal services, there is a clear demand for paralegals, but Uganda lacks a regulatory framework or solid body for paralegals (at present an association exists but is not backed by law). This may change with the National Legal Aid Policy that is currently being examined and will cater for this profession (Source: interview with ULS).
5.3.2 THE MARKET FOR PROFESSIONAL SERVICES
373. Market structures show elements of both oligopoly and competition. Accounting and auditing services are dominated by affiliates of multinationals — the so-‐called Big Four, which control approximately 80–85 percent of the market.
374. The legal sector is dominated by domestic providers — often small firms and microenterprises. This situation is similar to that in most developing and developed countries: legal services are provided by individual professionals or small firms, with a relatively small number of large firms, mainly from a few developed, common law countries such as the United States and United Kingdom. In legal services the worldwide consolidation trend that has created a growing number of large multinational law firms with vast international networks has missed East Africa, including Uganda. This could be the result of restrictive entry and conduct regulations imposed by East African countries on foreign providers of legal services and on foreign legal professionals. Indeed, a common characteristic of the examined legal markets is the absence of foreign firms and foreign professionals providing legal services.
375. The engineering services are mostly provided by small firms, although these activities are often combined with construction services by a single company. The combined capacity of these firms, though large, is too scattered to meet demand for large projects. The market for consulting and construction engineers mainly revolves around public sector projects, where consultancies are based in the construction of roads, airports, housing, water and sewerage works and other large projects.
376. Uganda’s demand for engineering services comes mainly from the booming construction sector. The industry remains generally fragmented — which stakeholders blame on the lack of government policy and the absence of a strong institutional framework. This has encouraged an “informal sector” mentality approach to business in the sector, which is evident in the poor quality of many buildings.
377. An important part of the work for consulting engineers comes from international donor-‐funded physical infrastructure projects. The experience and skill required to participate in these projects often favor large foreign companies since only these firms can meet the requisite high standards. Several stakeholders questioned the appropriateness and relevance of the imposed standards as well as the coherence of these projects with their stated development objectives.
378. Interestingly, a large number of formal sector East African firms use professional services. Uganda is indicative of the pattern of service use by different-‐sized firms. There is a surprisingly high use of all three services by even the smallest firms (1–19 employees), which may be because this survey covers mostly urban formal sector firms (Figure 55). A large proportion of the demand for accounting and auditing services seems to come from mandatory legal requirements for financial reporting and taxation.
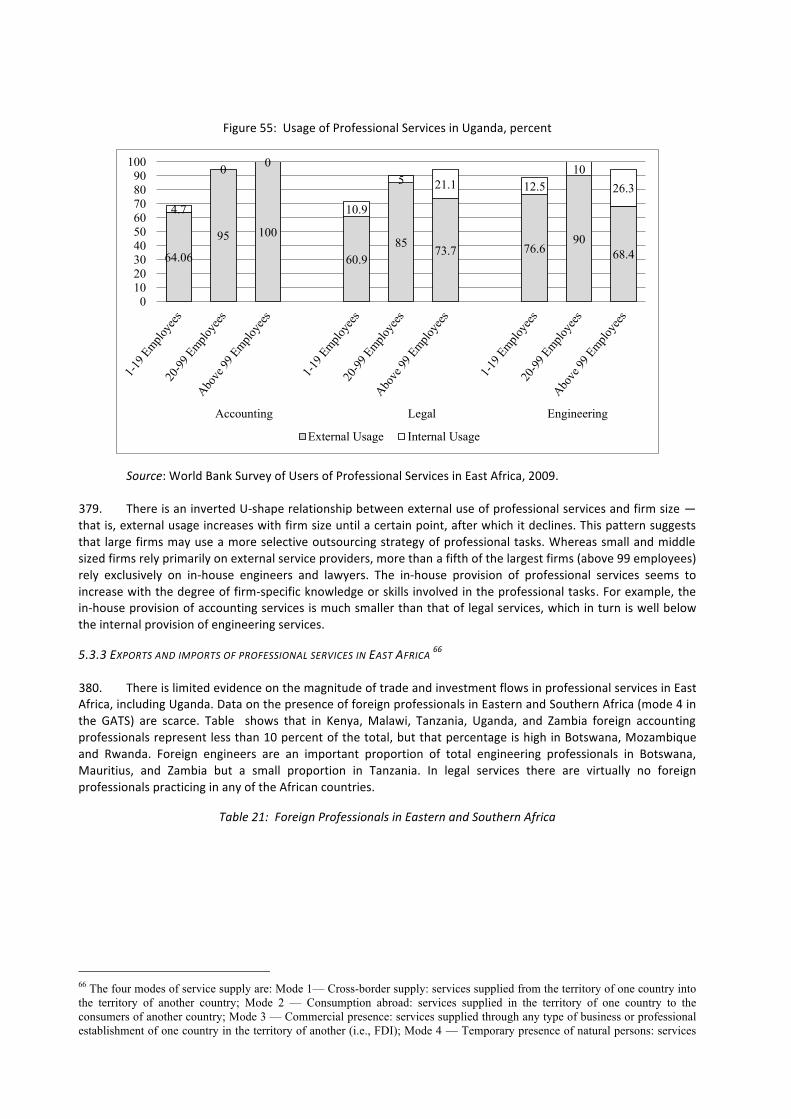
125
Figure 55: Usage of Professional Services in Uganda, percent
64.06
95 100
60.985 73.7 76.6
9068.4
4.7
0 0
10.9
5 21.1 12.510
26.3
0102030405060708090
100
Accounting Legal Engineering
External Usage Internal Usage
Source: World Bank Survey of Users of Professional Services in East Africa, 2009.
379. There is an inverted U-‐shape relationship between external use of professional services and firm size — that is, external usage increases with firm size until a certain point, after which it declines. This pattern suggests that large firms may use a more selective outsourcing strategy of professional tasks. Whereas small and middle sized firms rely primarily on external service providers, more than a fifth of the largest firms (above 99 employees) rely exclusively on in-‐house engineers and lawyers. The in-‐house provision of professional services seems to increase with the degree of firm-‐specific knowledge or skills involved in the professional tasks. For example, the in-‐house provision of accounting services is much smaller than that of legal services, which in turn is well below the internal provision of engineering services.
5.3.3 EXPORTS AND IMPORTS OF PROFESSIONAL SERVICES IN EAST AFRICA 66
380. There is limited evidence on the magnitude of trade and investment flows in professional services in East Africa, including Uganda. Data on the presence of foreign professionals in Eastern and Southern Africa (mode 4 in the GATS) are scarce. Table shows that in Kenya, Malawi, Tanzania, Uganda, and Zambia foreign accounting professionals represent less than 10 percent of the total, but that percentage is high in Botswana, Mozambique and Rwanda. Foreign engineers are an important proportion of total engineering professionals in Botswana, Mauritius, and Zambia but a small proportion in Tanzania. In legal services there are virtually no foreign professionals practicing in any of the African countries.
Table 21: Foreign Professionals in Eastern and Southern Africa
66 The four modes of service supply are: Mode 1— Cross-border supply: services supplied from the territory of one country into the territory of another country; Mode 2 — Consumption abroad: services supplied in the territory of one country to the consumers of another country; Mode 3 — Commercial presence: services supplied through any type of business or professional establishment of one country in the territory of another (i.e., FDI); Mode 4 — Temporary presence of natural persons: services supplied by nationals of one country in the territory of another. This mode includes both independent service suppliers and employees of the services supplier of another country.
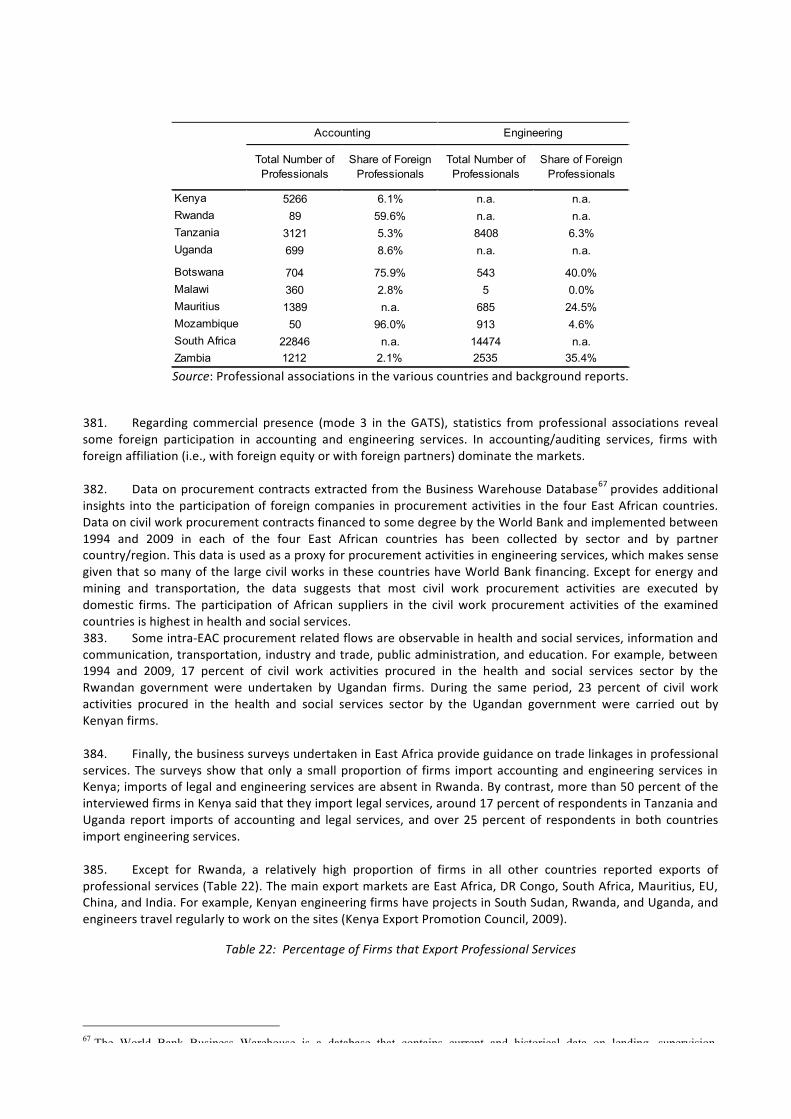
126
Total Number of Professionals
Share of Foreign Professionals
Total Number of Professionals
Share of Foreign Professionals
Kenya 5266 6.1% n.a. n.a.Rwanda 89 59.6% n.a. n.a.Tanzania 3121 5.3% 8408 6.3%Uganda 699 8.6% n.a. n.a.
Botswana 704 75.9% 543 40.0%Malawi 360 2.8% 5 0.0%Mauritius 1389 n.a. 685 24.5%Mozambique 50 96.0% 913 4.6%South Africa 22846 n.a. 14474 n.a.Zambia 1212 2.1% 2535 35.4%
Accounting Engineering
Source: Professional associations in the various countries and background reports.
381. Regarding commercial presence (mode 3 in the GATS), statistics from professional associations reveal some foreign participation in accounting and engineering services. In accounting/auditing services, firms with foreign affiliation (i.e., with foreign equity or with foreign partners) dominate the markets.
382. Data on procurement contracts extracted from the Business Warehouse Database67 provides additional insights into the participation of foreign companies in procurement activities in the four East African countries. Data on civil work procurement contracts financed to some degree by the World Bank and implemented between 1994 and 2009 in each of the four East African countries has been collected by sector and by partner country/region. This data is used as a proxy for procurement activities in engineering services, which makes sense given that so many of the large civil works in these countries have World Bank financing. Except for energy and mining and transportation, the data suggests that most civil work procurement activities are executed by domestic firms. The participation of African suppliers in the civil work procurement activities of the examined countries is highest in health and social services. 383. Some intra-‐EAC procurement related flows are observable in health and social services, information and communication, transportation, industry and trade, public administration, and education. For example, between 1994 and 2009, 17 percent of civil work activities procured in the health and social services sector by the Rwandan government were undertaken by Ugandan firms. During the same period, 23 percent of civil work activities procured in the health and social services sector by the Ugandan government were carried out by Kenyan firms.
384. Finally, the business surveys undertaken in East Africa provide guidance on trade linkages in professional services. The surveys show that only a small proportion of firms import accounting and engineering services in Kenya; imports of legal and engineering services are absent in Rwanda. By contrast, more than 50 percent of the interviewed firms in Kenya said that they import legal services, around 17 percent of respondents in Tanzania and Uganda report imports of accounting and legal services, and over 25 percent of respondents in both countries import engineering services.
385. Except for Rwanda, a relatively high proportion of firms in all other countries reported exports of professional services (Table 22). The main export markets are East Africa, DR Congo, South Africa, Mauritius, EU, China, and India. For example, Kenyan engineering firms have projects in South Sudan, Rwanda, and Uganda, and engineers travel regularly to work on the sites (Kenya Export Promotion Council, 2009).
Table 22: Percentage of Firms that Export Professional Services
67 The World Bank Business Warehouse is a database that contains current and historical data on lending, supervision, evaluation, non-lending/AAA, procurement, and resource management.
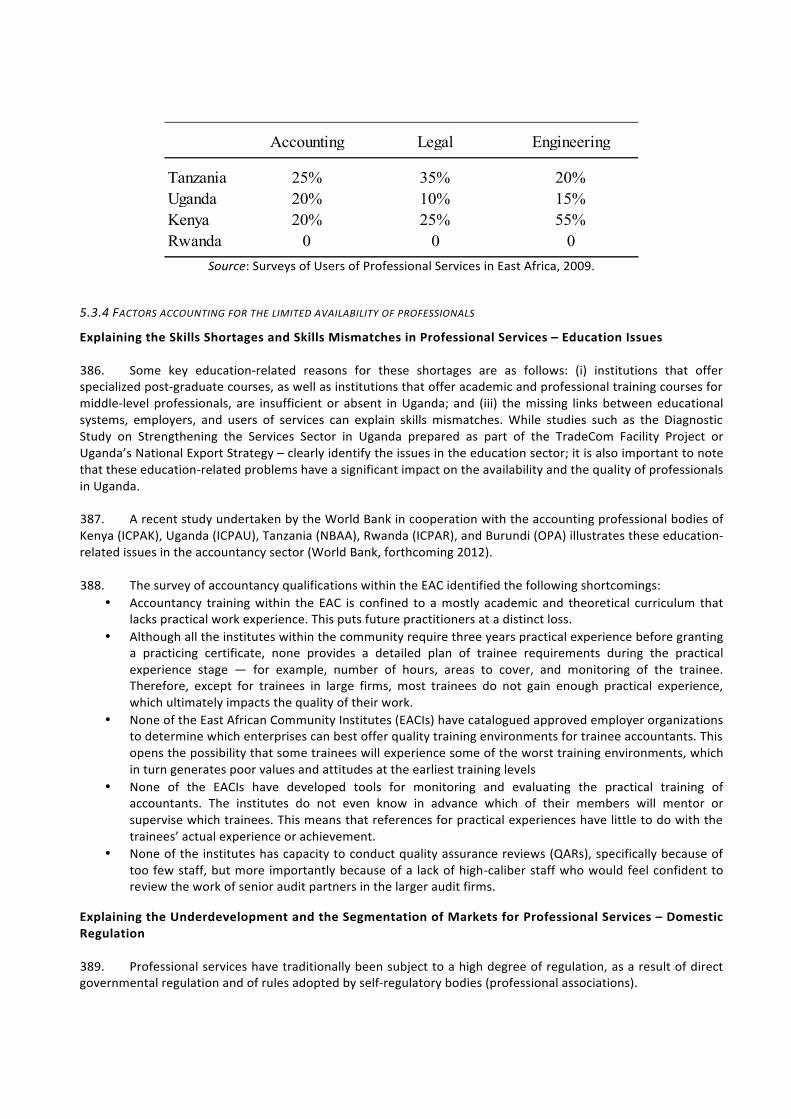
127
Accounting Legal Engineering
Tanzania 25% 35% 20%Uganda 20% 10% 15%Kenya 20% 25% 55%Rwanda 0 0 0
Source: Surveys of Users of Professional Services in East Africa, 2009.
5.3.4 FACTORS ACCOUNTING FOR THE LIMITED AVAILABILITY OF PROFESSIONALS
Explaining the Skills Shortages and Skills Mismatches in Professional Services – Education Issues 386. Some key education-‐related reasons for these shortages are as follows: (i) institutions that offer specialized post-‐graduate courses, as well as institutions that offer academic and professional training courses for middle-‐level professionals, are insufficient or absent in Uganda; and (iii) the missing links between educational systems, employers, and users of services can explain skills mismatches. While studies such as the Diagnostic Study on Strengthening the Services Sector in Uganda prepared as part of the TradeCom Facility Project or Uganda’s National Export Strategy – clearly identify the issues in the education sector; it is also important to note that these education-‐related problems have a significant impact on the availability and the quality of professionals in Uganda.
387. A recent study undertaken by the World Bank in cooperation with the accounting professional bodies of Kenya (ICPAK), Uganda (ICPAU), Tanzania (NBAA), Rwanda (ICPAR), and Burundi (OPA) illustrates these education-‐related issues in the accountancy sector (World Bank, forthcoming 2012).
388. The survey of accountancy qualifications within the EAC identified the following shortcomings:
• Accountancy training within the EAC is confined to a mostly academic and theoretical curriculum that lacks practical work experience. This puts future practitioners at a distinct loss.
• Although all the institutes within the community require three years practical experience before granting a practicing certificate, none provides a detailed plan of trainee requirements during the practical experience stage — for example, number of hours, areas to cover, and monitoring of the trainee. Therefore, except for trainees in large firms, most trainees do not gain enough practical experience, which ultimately impacts the quality of their work.
• None of the East African Community Institutes (EACIs) have catalogued approved employer organizations to determine which enterprises can best offer quality training environments for trainee accountants. This opens the possibility that some trainees will experience some of the worst training environments, which in turn generates poor values and attitudes at the earliest training levels
• None of the EACIs have developed tools for monitoring and evaluating the practical training of accountants. The institutes do not even know in advance which of their members will mentor or supervise which trainees. This means that references for practical experiences have little to do with the trainees’ actual experience or achievement.
• None of the institutes has capacity to conduct quality assurance reviews (QARs), specifically because of too few staff, but more importantly because of a lack of high-‐caliber staff who would feel confident to review the work of senior audit partners in the larger audit firms.
Explaining the Underdevelopment and the Segmentation of Markets for Professional Services – Domestic Regulation 389. Professional services have traditionally been subject to a high degree of regulation, as a result of direct governmental regulation and of rules adopted by self-‐regulatory bodies (professional associations).

128
Figure 56: Accounting Overall Regulation Index
Notes: A higher value of the index indicates a more stringent regulation. Source: OECD Regulatory Database on Professional Services and World Bank Regulatory Surveys in Africa, 2009 and 2010.
390. These regulatory measures affect the entry and operation of professionals and professional services firms, can undermine competition and constrain the growth of the sector. Information compiled in several African countries on domestic entry regulation (such as licensing and educational requirements, quantitative restrictions on the number of suppliers of professional services and exclusive rights granted to suppliers in certain activities), as well as on regulations on the operations of firms (such as restrictions on prices and fees, advertising, form of business, and inter-‐professional cooperation), are used to calculate the regulatory indices presented in Figure 56 and 57.68
Figure 57: Legal Overall Regulation Index
Notes: A higher value of the index indicates a more stringent regulation. Source: OECD Regulatory Database on Professional Services and World Bank Regulatory Surveys in Africa, 2009 and 2010.
391. Uganda has moderate regulatory indices for accounting and legal services. Entry requirements, such as pre-‐qualification requirements, licensing procedures or membership issues in a professional association tend to
68 The indices shown in Figures 56 and 57 convert qualitative information on regulatory conditions into quantitative indicators for each sector, using the OECD methodology described in Conway and Nicoletti (2006). Entry regulations include barriers to becoming a member of a profession taking the form of licensing and educational requirements, quantitative limits on the number of suppliers of professional services, and/or exclusive rights granted to suppliers in certain activities. Conduct/operation regulations include restrictions on prices and fees, advertising, form of business, and inter-professional cooperation. The qualitative information originates in regulatory surveys conducted by the World Bank.
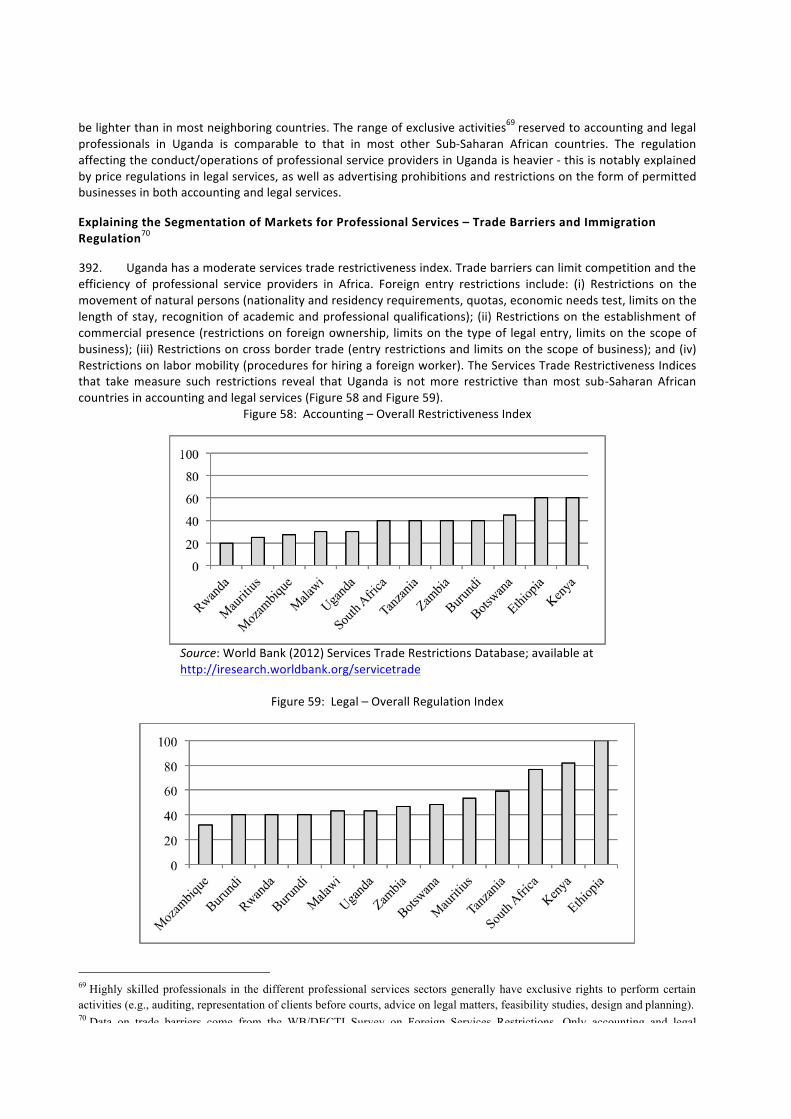
129
be lighter than in most neighboring countries. The range of exclusive activities69 reserved to accounting and legal professionals in Uganda is comparable to that in most other Sub-‐Saharan African countries. The regulation affecting the conduct/operations of professional service providers in Uganda is heavier -‐ this is notably explained by price regulations in legal services, as well as advertising prohibitions and restrictions on the form of permitted businesses in both accounting and legal services.
Explaining the Segmentation of Markets for Professional Services – Trade Barriers and Immigration Regulation70
392. Uganda has a moderate services trade restrictiveness index. Trade barriers can limit competition and the efficiency of professional service providers in Africa. Foreign entry restrictions include: (i) Restrictions on the movement of natural persons (nationality and residency requirements, quotas, economic needs test, limits on the length of stay, recognition of academic and professional qualifications); (ii) Restrictions on the establishment of commercial presence (restrictions on foreign ownership, limits on the type of legal entry, limits on the scope of business); (iii) Restrictions on cross border trade (entry restrictions and limits on the scope of business); and (iv) Restrictions on labor mobility (procedures for hiring a foreign worker). The Services Trade Restrictiveness Indices that take measure such restrictions reveal that Uganda is not more restrictive than most sub-‐Saharan African countries in accounting and legal services (Figure 58 and Figure 59).
Figure 58: Accounting – Overall Restrictiveness Index
Source: World Bank (2012) Services Trade Restrictions Database; available at http://iresearch.worldbank.org/servicetrade
Figure 59: Legal – Overall Regulation Index
69 Highly skilled professionals in the different professional services sectors generally have exclusive rights to perform certain activities (e.g., auditing, representation of clients before courts, advice on legal matters, feasibility studies, design and planning). 70 Data on trade barriers come from the WB/DECTI Survey on Foreign Services Restrictions. Only accounting and legal services are covered at this stage.
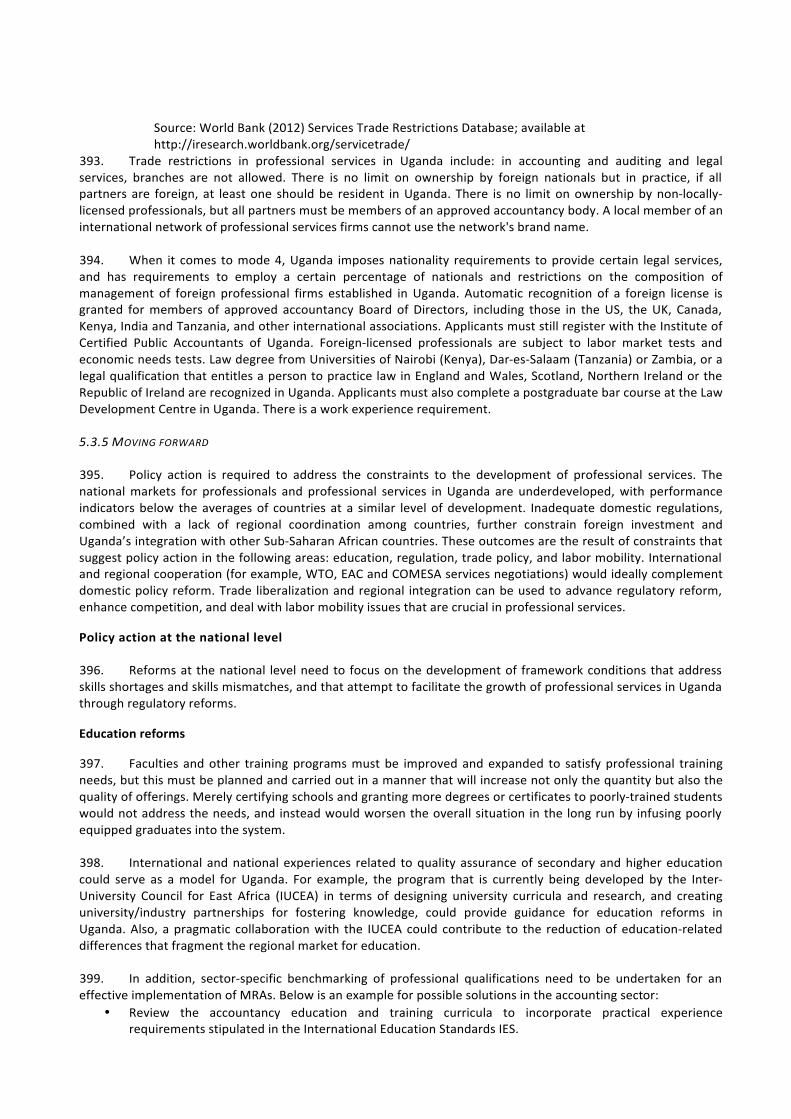
130
Source: World Bank (2012) Services Trade Restrictions Database; available at http://iresearch.worldbank.org/servicetrade/
393. Trade restrictions in professional services in Uganda include: in accounting and auditing and legal services, branches are not allowed. There is no limit on ownership by foreign nationals but in practice, if all partners are foreign, at least one should be resident in Uganda. There is no limit on ownership by non-‐locally-‐licensed professionals, but all partners must be members of an approved accountancy body. A local member of an international network of professional services firms cannot use the network's brand name.
394. When it comes to mode 4, Uganda imposes nationality requirements to provide certain legal services, and has requirements to employ a certain percentage of nationals and restrictions on the composition of management of foreign professional firms established in Uganda. Automatic recognition of a foreign license is granted for members of approved accountancy Board of Directors, including those in the US, the UK, Canada, Kenya, India and Tanzania, and other international associations. Applicants must still register with the Institute of Certified Public Accountants of Uganda. Foreign-‐licensed professionals are subject to labor market tests and economic needs tests. Law degree from Universities of Nairobi (Kenya), Dar-‐es-‐Salaam (Tanzania) or Zambia, or a legal qualification that entitles a person to practice law in England and Wales, Scotland, Northern Ireland or the Republic of Ireland are recognized in Uganda. Applicants must also complete a postgraduate bar course at the Law Development Centre in Uganda. There is a work experience requirement.
5.3.5 MOVING FORWARD
395. Policy action is required to address the constraints to the development of professional services. The national markets for professionals and professional services in Uganda are underdeveloped, with performance indicators below the averages of countries at a similar level of development. Inadequate domestic regulations, combined with a lack of regional coordination among countries, further constrain foreign investment and Uganda’s integration with other Sub-‐Saharan African countries. These outcomes are the result of constraints that suggest policy action in the following areas: education, regulation, trade policy, and labor mobility. International and regional cooperation (for example, WTO, EAC and COMESA services negotiations) would ideally complement domestic policy reform. Trade liberalization and regional integration can be used to advance regulatory reform, enhance competition, and deal with labor mobility issues that are crucial in professional services.
Policy action at the national level 396. Reforms at the national level need to focus on the development of framework conditions that address skills shortages and skills mismatches, and that attempt to facilitate the growth of professional services in Uganda through regulatory reforms.
Education reforms
397. Faculties and other training programs must be improved and expanded to satisfy professional training needs, but this must be planned and carried out in a manner that will increase not only the quantity but also the quality of offerings. Merely certifying schools and granting more degrees or certificates to poorly-‐trained students would not address the needs, and instead would worsen the overall situation in the long run by infusing poorly equipped graduates into the system.
398. International and national experiences related to quality assurance of secondary and higher education could serve as a model for Uganda. For example, the program that is currently being developed by the Inter-‐University Council for East Africa (IUCEA) in terms of designing university curricula and research, and creating university/industry partnerships for fostering knowledge, could provide guidance for education reforms in Uganda. Also, a pragmatic collaboration with the IUCEA could contribute to the reduction of education-‐related differences that fragment the regional market for education.
399. In addition, sector-‐specific benchmarking of professional qualifications need to be undertaken for an effective implementation of MRAs. Below is an example for possible solutions in the accounting sector:
• Review the accountancy education and training curricula to incorporate practical experience requirements stipulated in the International Education Standards IES.
131
• Develop more elaborate practical experience training plans to help guide the practical experience training processes.
• Identify approved training organizations to ensure that practical experience is gained from suitable institutional frameworks with sound systems and practices.
• Build internal capacity within the institutes to design and monitor practical training programs. • Encourage EACIs to collaborate on identifying respectable retired professional accountants to form a
pool for conducting QARs for the bigger international audit practices. • Develop staff capacity to conduct regular QARs.
400. Moreover, Uganda needs to put special emphasis on the development of programs for middle level professionals. Malawi’s experience with courses for middle-‐level legal professionals71 could be a useful model to be followed by other African countries, including Uganda.
401. Finally, the absence of links between educational systems, employers, and users of services prevents young graduates from finding employment, and further explains the attrition of skills in several professions. Several stakeholders from the private sector have emphasized the coordination problems between employers, professional associations, and education institutions in the content of educational programs for engineers and accountants. Policy actions to encourage collaboration between universities, professional associations, and the private sector, for example through internships, could help students acquire skills and practical training. The Structured Engineers Apprenticeship Program (SEAP) for Graduate Engineers developed by the Engineers Registration Board in Tanzania provides an example that could be followed by Uganda.
402. These measures could complement the actions listed in Action Matrix for the Education Sector presented in Uganda’s National Export Strategy (UNES). The UNES Action Matrix proposes several measures related to strengthening of the curricula, increasing the accessibility of education through on-‐line programs, educational infrastructure developments, image and branding strategies, and financial support; however, issues related to the benchmarking of curricula, recognition of degrees and involvement of the private sector in the process have been largely neglected. Additional measures along the lines described above could be added to UNES Action Matrix to strengthen Uganda’s exports of education services.
Regulatory reforms
403. Reforms need to focus on incremental, qualitative improvements in domestic regulation. Disproportionate cumulative entry requirements need to be relaxed. For example, narrowing the scope of exclusive tasks in certain professions would contribute to this goal. Exclusive rights can lead to increased specialization of professionals and guarantee a higher quality of service, but if they create monopolies they can have adverse price and allocation effects, especially when granted for services for which adequate quality can be provided at a lower cost by less-‐regulated middle-‐level professionals.
404. Adequate regulations that ensure that professionals are equipped with market-‐relevant skills need to be put in place.
405. Disproportionate restrictions that limit competition need to be eliminated: Price regulations affecting legal services and public procurement contracts in engineering are supported and introduced by professional associations or the government, who claim that they are useful tools to prevent adverse selection problems. Uganda needs to adopt less restrictive mechanisms, such as better access to information on services and services providers to accomplish the same goals at lower economic cost.
71 Some successful initiatives have encouraged the education, training, and development of middle-level professionals. The Paralegal Advisory Service in Malawi is an innovative program that offers paralegal aid in criminal cases and has so far trained 38 paralegals. Candidates receive training from NGOs working in partnership with key stakeholders, including Malawi Prisons, Police Services, and the court system. The paralegals are then able to work with these same institutions, making the arrangement beneficial for both sides. The program has been so successful that the organization is being transformed into the Paralegal Advisory Services Institute and is introducing similar programs throughout Africa and even further abroad in Bangladesh.
132
406. Advertising prohibitions are imposed by Uganda in accounting and legal services. The country needs to allow advertising of professional services, which facilitates competition by informing consumers about different products and which can be used as a competitive tool for new firms entering the market.
407. The key issue regarding regulatory reform is not less regulation but better regulation; that is regulation that more effectively achieves public policy objectives while ensuring efficiently produced low cost services. Tools and procedures can be put in place to assist policy makers to assess whether existing or new regulation will achieve the sector-‐specific public policy objectives while contributing to market openness. Box 7 presents such regulatory tools – Uganda could learn from these experiences:
Error! Not a valid bookmark self-‐reference.
The OECD principles on key market-‐oriented and trade-‐and-‐investment-‐friendly regulation could offer guidance to the regulation of services sectors in Africa. Furthermore, the APEC-‐OECD Integrated Checklist on Regulatory Reform (adapted to developing countries’ needs) could provide further guidance on how to undertake such a combined assessment of regulatory and competition policies, and market openness policies. The Checklist highlights key issues that should be considered during the process of development and implementation of regulatory policy and could be useful in building domestic capacities for quality regulation. The APEC-‐OECD Checklist is a voluntary tool that Uganda and other EAC economies may use to evaluate their respective regulatory reform efforts. The checklist has four sections including 40 specific open questions in total. The first is a horizontal questionnaire that deals with the degree of integration of regulatory, competition and market openness policies across levels of government, and on the accountability and transparency mechanisms needed to ensure their success. The second is on regulatory policies which are designed to maximize the efficiency, transparency and accountability of regulations based on an integrated rule-‐making approach and the application of regulatory tools and institutions. The third is on competition policies which promote economic growth and efficiency by eliminating or minimizing the distorting impact of laws, regulations and administrative policies, practices and procedures on competition, and by preventing and deterring private anti-‐competitive practices through effective enforcement of competition laws. The fourth is on market openness policies which aim to ensure that an economy can reap the benefits of globalization and international competition by eliminating or minimizing the distorting effects of border as well as behind-‐the-‐border regulations and practices. Other regulatory experiences such as the ASEAN Mutual Recognition Arrangement Framework on Accountancy Services, the ASEAN Mutual Recognition Arrangements on Engineering Services and on Architectural Services could provide further guidance to the Uganda and the EAC countries which are willing to engage in mutual recognition discussions. Furthermore, the experience of the EU with the internal recognition of professional qualifications as well as the regulatory dialogues and regulatory platforms established with third countries could give additional guidance to Ugandan policy makers.
Sources: OECD, APEC, ASEAN
Policy action at the regional and multilateral levels
408. The fragmentation of regional markets for professional services and professional education by restrictive policies and regulatory heterogeneity prevents Uganda from taking advantage of gains from trade based on comparative advantage, as well as gains from enhanced competition and economies of scale. Trade barriers would ideally be liberalized on a most favored nation (MFN) or non-‐preferential basis, since this would generate the largest welfare gains, and complemented with regional cooperation to reduce regulatory differences.
(i) Steps need to be taken to relax the explicit trade barriers applied by Uganda to the movement of natural
persons and commercial presence of professional services.
Examples of possible reforms are:
• Articulating the economic and social motivation for nationality and residency requirements; • Minimizing restrictions on the forms of establishment allowed; • Developing a transparent and consistent framework for accepting professionals with foreign
qualifications.
133
The reduction of explicit trade barriers also needs to be complemented with the reform of immigration laws and rules on the hiring of foreign workers.
(ii) Trade liberalization needs to be coordinated with regulatory reform and cooperation at the regional level.
409. Deeper regional integration, through regulatory cooperation with neighboring partners who have similar regulatory preferences, can usefully complement non-‐preferential trade liberalization. Regional integration would also enhance competition among services providers, enable those providers to exploit economies of scale in professional education, and produce a wider variety of services. Regional integration brings further benefits in that a larger regional market is able to attract greater domestic and foreign investment; and regionalization may help take advantage of scale economies in regulation, particularly where national agencies face technical skills or capacity constraints.72
410. Opening up regional boundaries and establishing Mutual Recognition Agreements (MRAs) would facilitate Uganda’s services integration with its African partners. The free movement of EAC nationals without work permit requirements would be of great help to increase business opportunities within the region and boost service exports. Uganda’s participation in MRAs of professional qualifications and licensing requirements within EAC and COMESA in the areas of accounting, architecture, engineering, and legal services would likely benefit Uganda service firms (as well as firms in neighboring countries) in their exports of services to the region. The EAC Common Market Protocol, adopted by the Multi Sector Council in 2009, includes an annex on a framework agreement on MRA of academic and professional qualifications. The five EAC countries, including Uganda, have already signed an MRA in accounting services and implementation focuses on the following areas: requirements for education, examinations, experience, conduct and ethics, professional development and re-‐certification, scope of practice, and local knowledge. To assist with the implementation of MRAs and support more broadly the integration of markets for professional services in Africa, the East African Business Council has launched the East Africa Professional Services Platform (EAPSP) in September 2012. To maximize its benefits from this platform, Uganda needs to identify clear objectives and concrete actions to achieve those objectives. Additional support for well-‐defined activities that support an accelerated economic integration in professional services could be obtained from the World Bank in the context of the COMESA Knowledge Platform for Professional Services (Box 8).
Error! Reference source not found.
The Professional Services Knowledge Platform for Eastern and Southern Africa will provide: Information and analysis of the current situation regarding the performance of several professional services sectors in the different countries covered, and their impact on other sectors and the wider economy. This will require surveys of both users and providers of services. An assessment of barriers to trade and foreign investment and of current regulatory policies, in the form of a trade and regulatory audit, together with an assessment of their impact on entry and conduct in the market. A review of the necessary steps to remove explicit barriers to trade and the regulatory options for integrated services markets, including measures that can be pursued at the national level and those that are likely to be more effective in collaboration with partner countries at the regional level. This will be informed by a careful analysis of the experience of other countries that have implemented reform programs in the specific sector, drawing on inputs and interactions with officials and experts from these countries. An assessment of capacity building that will be necessary for effective implementation and monitoring of outcomes in the different sectors and the impact of current regulation. In pursuing these outputs, the platform aims to support a process that ensures regular consultation between private and public stakeholders; effective communication between the regulator, sector specialists, and the relevant government ministries; extensive dissemination of information and analysis at the national and regional levels for increased awareness and deeper understanding of the policy issues affecting each sector.
72 See World Bank (2010b) for a discussion on the role that international trade agreements, particularly the Economic Partnership Agreements (EPAs) that are currently being negotiated with the European Union (EU), can play in supporting coordinated trade and regulatory reforms in Africa. The study discusses the key issues that EPAs will have to address if they are to support the development of service sectors in Africa, while recognizing that EPAs might not necessarily be the most effective way to pursue service sector reform for all African countries.
134
5.4 TOWARD A BETTER REGULATORY FRAMEWORK
411. To address these constraints policy action is required in the following areas: education, regulation, trade policy, and labor mobility. International and regional cooperation (for example, WTO, EAC and COMESA services negotiations) would ideally complement domestic policy reform. Trade liberalization and regional integration can be used to advance regulatory reform, enhance competition, and deal with labor mobility issues that are crucial in professional services.
412. The recommendations proposed in the new Action Matrix aim to address these challenges by tackling the concrete barriers identified as part of this work on professional services.
413. A key challenge of services reforms relates to putting in place an adequate regulatory framework that supports the effective implementation of existing engagements. Decisions on the nature and pace of reform need to be informed by careful analysis and an understanding of good practices. A national regulatory assessment mechanism covering all professional services sectors and education services should be put in place and a roadmap for action with concrete objectives and targets needs to be developed.
414. Regulatory cooperation at the regional level has the potential to accelerate services reforms. For example, regional agreements on the mutual recognition of professional qualification can help with the development of adequate curricula for various professions, and provide guidance for employers, mentors and trainees regarding the practical experience requirements for professionals. Uganda should work with regional bodies such as the IUCEA, the EABC, or the EAPSP to undertake in-‐depth, cross-‐country comparative assessments of professional qualifications (entry requirements, education and training, and practical experience requirements) and the regulations governing the professionals in each EAC member state. Such benchmarking exercises are necessary tools for the appropriate implementation of the MRAs.
415. The pace of integration is largely dependent upon Uganda’s political motivation and conviction that such liberalization is beneficial to the domestic constituencies. To improve such prospects, the promotion of more frequent and open dialogue between the key stakeholders involved in professional services -‐ professional bodies, private sector providers, users of services, higher education institutions, trade negotiators – is important. Uganda’s participation in the Professional Services Knowledge Platforms in East Africa and COMESA can help the country with the development of a meaningful reform program that includes the elimination of explicit barriers and regulatory, education and immigration reforms.
416. Uganda needs to engage in deep regulatory cooperation at the regional level and use multilateral trade liberalization and regional integration to reform and strengthen its professional services sectors. The government could engage with donors to secure technical and financial assistance to strengthen the capacity of regulatory organizations, and develop appropriate regulation.
135
CHAPTER 6: MAKING UGANDA EAST AFRICA’S MAIZE BARN
6.1 STRUCTURE OF THE SECTOR
6.1.1 BACKGROUND
417. Despite a new optimism about African economies (Zorya, 2012), many of the familiar disturbing trends are still apparent in Uganda. A 3.2 per cent population growth threatens the productivity gains that have been made and there is still a very high dependency on agriculture and little improvement in the poverty indices. Urbanization is occurring but per capita food output is barely maintained, with disturbing levels of food and nutritional insecurity. Despite the availability of modern technologies, agricultural yields remain low and, as Drew (2010) writes, there are biotic stresses on all crops and livestock (striga, Banana Xanthomansis Wilt, Cassava viruses, Coffee Wilt Disease, etc.) and a series of other, serious abiotic threats (soil nutrient mining, loss of tree cover, climate change effects of erratic rainfall).
418. Most significantly, in this context, projections indicate a doubling of food demand in the East African Community (EAC) within the next 15 years (COMPETE, 2010). This is of course a great opportunity, but a real challenge, given the past poor record around the inelasticity of the supply response. Where farmers have responded to the previous season’s price in making decisions on what crops to plant in the following season, the majority of the supply response has come from more acreage planted rather than investments in productivity enhancement, where, nonetheless, the marginal rate of return is much higher (Drew, 2010).
6.1.2 PRODUCTION
419. According to Sprague (1987), cited in Balirwa (1992), maize was introduced in Uganda in 1861. By 1900 (Ministry of Agriculture, 1988), it was already an established crop although in the childhood of many of the respondents to this report, it was still just a garden-‐based ‘poor man’s crop’. Its later emergence as the economic opportunity it is today came after the Amin era when ease of storage and preparation increased its appeal to the growing urban population. By 1997, annual production was estimated at 456,000 mt (IDEA project 1998) while by 2009, it was thought to have risen to at least 1.3 million mt.
420. Production has now expanded to almost all districts of the country and, although the figures are contested, it seems the area under maize has increased from some 260,000 hectares in 1980 (UBOS, 2006) to 840,000 hectares in 2007 (see Table 1 below), and even more now. Uganda has ideal conditions for maize production (fertile soils, ample rainfall) and the main production districts (USAID, 2010) are:
• Western (Kabale, Masindi, Kasese, and Kabarole districts); • Eastern (Iganga, Kamuli, Bugiri, Mayuge, Sironko, Tororo, Mbale, and Kapchorwa districts); • Northern (Arua, Nebbi, Apac, Lira, Kitgum, and Gulu districts); • Central (Mubende, Kiboga, Masaka, Mukono, and Rakai districts).
421. Unfortunately the figures are a confusion. This is commented on in most of the recent reports but no resolution has been reached about what to do or how to go about it. There are no reliable production and yield figures, nor of volumes consumed at the household level, nor of that saved for seed, nor of post-‐harvest losses, volumes entering different market channels etc. The Uganda Bureau of Statistics (UBOS) does produce production estimates based on district returns but, as the RATES report (2003) diplomatically put it, “the data does not take into account the weather patterns and crop conditions by season”. Industry players make their own estimates based on seed sales, field visits and information received from traders and these are much lower than the UBOS figures. The table below shows a mix of estimates, partly from the USAID COMPETE programme, mostly compiled on the above basis, and partly from FAO, which do appear to agree. These are taken to be as good as are anywhere available. Some industry insiders suggested to the author that production could be higher, between 1.5mt and 1.8mt.
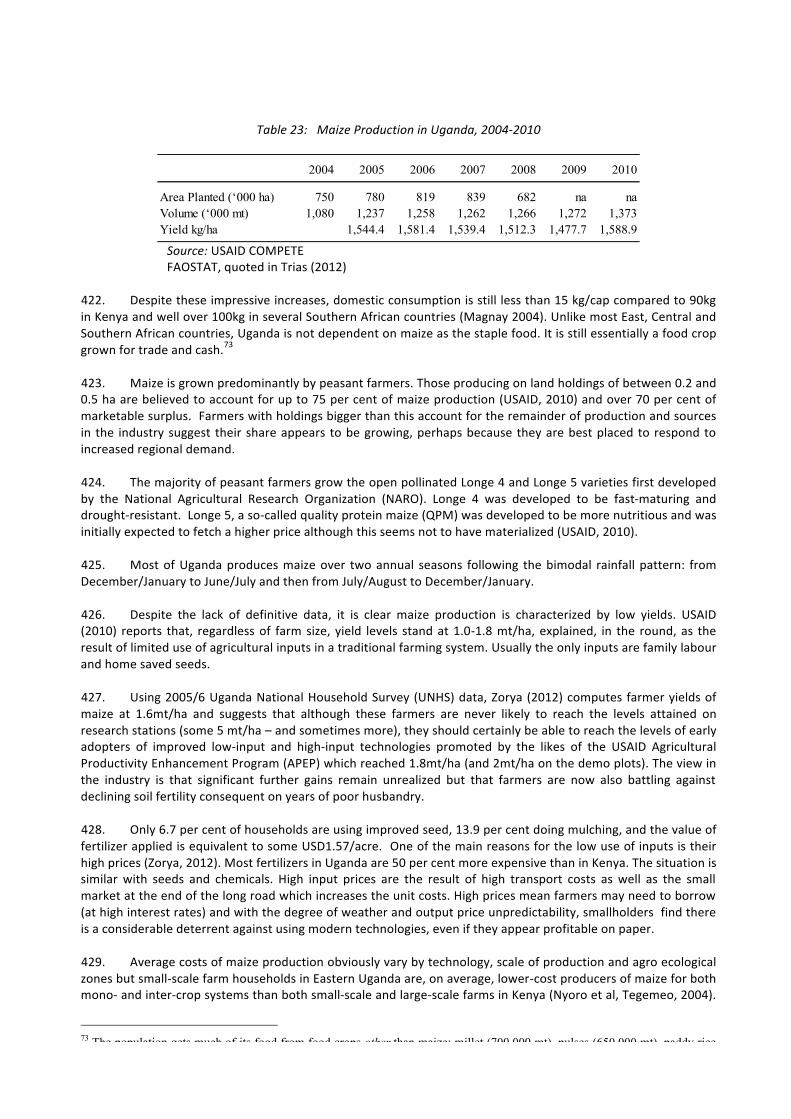
136
Table 23: Maize Production in Uganda, 2004-‐2010
2004 2005 2006 2007 2008 2009 2010
Area Planted (‘000 ha) 750 780 819 839 682 na naVolume (‘000 mt) 1,080 1,237 1,258 1,262 1,266 1,272 1,373Yield kg/ha 1,544.4 1,581.4 1,539.4 1,512.3 1,477.7 1,588.9
Source: USAID COMPETE FAOSTAT, quoted in Trias (2012)
422. Despite these impressive increases, domestic consumption is still less than 15 kg/cap compared to 90kg in Kenya and well over 100kg in several Southern African countries (Magnay 2004). Unlike most East, Central and Southern African countries, Uganda is not dependent on maize as the staple food. It is still essentially a food crop grown for trade and cash.73
423. Maize is grown predominantly by peasant farmers. Those producing on land holdings of between 0.2 and 0.5 ha are believed to account for up to 75 per cent of maize production (USAID, 2010) and over 70 per cent of marketable surplus. Farmers with holdings bigger than this account for the remainder of production and sources in the industry suggest their share appears to be growing, perhaps because they are best placed to respond to increased regional demand.
424. The majority of peasant farmers grow the open pollinated Longe 4 and Longe 5 varieties first developed by the National Agricultural Research Organization (NARO). Longe 4 was developed to be fast-‐maturing and drought-‐resistant. Longe 5, a so-‐called quality protein maize (QPM) was developed to be more nutritious and was initially expected to fetch a higher price although this seems not to have materialized (USAID, 2010).
425. Most of Uganda produces maize over two annual seasons following the bimodal rainfall pattern: from December/January to June/July and then from July/August to December/January.
426. Despite the lack of definitive data, it is clear maize production is characterized by low yields. USAID (2010) reports that, regardless of farm size, yield levels stand at 1.0-‐1.8 mt/ha, explained, in the round, as the result of limited use of agricultural inputs in a traditional farming system. Usually the only inputs are family labour and home saved seeds.
427. Using 2005/6 Uganda National Household Survey (UNHS) data, Zorya (2012) computes farmer yields of maize at 1.6mt/ha and suggests that although these farmers are never likely to reach the levels attained on research stations (some 5 mt/ha – and sometimes more), they should certainly be able to reach the levels of early adopters of improved low-‐input and high-‐input technologies promoted by the likes of the USAID Agricultural Productivity Enhancement Program (APEP) which reached 1.8mt/ha (and 2mt/ha on the demo plots). The view in the industry is that significant further gains remain unrealized but that farmers are now also battling against declining soil fertility consequent on years of poor husbandry.
428. Only 6.7 per cent of households are using improved seed, 13.9 per cent doing mulching, and the value of fertilizer applied is equivalent to some USD1.57/acre. One of the main reasons for the low use of inputs is their high prices (Zorya, 2012). Most fertilizers in Uganda are 50 per cent more expensive than in Kenya. The situation is similar with seeds and chemicals. High input prices are the result of high transport costs as well as the small market at the end of the long road which increases the unit costs. High prices mean farmers may need to borrow (at high interest rates) and with the degree of weather and output price unpredictability, smallholders find there is a considerable deterrent against using modern technologies, even if they appear profitable on paper.
429. Average costs of maize production obviously vary by technology, scale of production and agro ecological zones but small-‐scale farm households in Eastern Uganda are, on average, lower-‐cost producers of maize for both mono-‐ and inter-‐crop systems than both small-‐scale and large-‐scale farms in Kenya (Nyoro et al, Tegemeo, 2004).
73 The population gets much of its food from food crops other than maize: millet (700,000 mt), pulses (650,000 mt), paddy rice (160,000 mt), and bananas (matoke).
137
The wide variation in production costs within production categories in both countries most likely reflects differences in management practices in the cultivation of maize. This result underscores the importance of appropriate extension messages.
430. In Kenya’s high-‐potential maize production category, hired tractor ploughing was the predominant mode of land preparation and even though this contributed considerably more costs per acre, it was more than compensated for by the higher yields obtained. For monocrop, but not for intercropped, maize, application of higher levels of fertilizer is beneficial and accompanying higher yields more than compensate for associated costs. The main contributors to higher than optimum costs of maize production are poor crop husbandry, farm inputs and machinery, and poor seed quality.
6.1.3 THE MARKET FOR MAIZE
431. Maize producers have four basic outlets:
Domestic market 432. The main market in Uganda is the maize flour or posho market, which takes some 400,000 mt of grain. In 2004, it was estimated that this market was growing at a rate of approximately 5 per cent per year (Ferris and Ojok, 2006) and with current high population and income growth and rapid urbanization, sources in the industry suggest this is likely to be even higher now (especially with changing dietary preferences and increased use of maize by large institutions such as schools, hospitals and the army).
433. The posho market is almost entirely informal and will absorb grain of any quality. Millers provide services to mill grain for a fee of some UGX10-‐15/kg and also buy grain from farmers to retail to customers. Transactions are dominated by spot markets and lack of trust, with few contracts or long-‐term business relationships. This situation breeds speculation and opportunism, leading to distortions and planning problems for producers. There are no adequate storage facilities in the rural areas. The road network, especially the feeder roads, is in a poor state and makes transporting maize that much more costly.
434. Kiiza (2006b) shows a chart giving real maize farm gate prices for nearly 35 years (see Annex 2). This indicates there has been no increase in the real prices received by farmers over that time. It also shows the considerable volatility of prices and that this volatility appears to have increased in the post-‐liberalization period.
Food Relief 435. Since the early 1990s, purchases by the World Food Programme (WFP) for operations in the Great Lakes region have been a major factor in the maize market in Uganda. WFP purchases averaged 42,000 mt/annum over the period 1994 to 2003, passed 100,000 mt in 2004 and has risen to an estimated 153,000 mt in 2010 (Trias 2012).
436. With Uganda as a surplus maize producer, these purchases (and WFP only buys graded quality product74) have brought a critical element of stability to the volatile local market. Although there are more than 20 traders supplying it, WFP purchases most of its maize from a small number of firms based in Kampala (Fowler, 2008).
437. However, in the last two or three years, WFP has shifted its procedures to directly procure a large portion of its requirement directly from well-‐organized farmer and producer organizations through its Purchase for Progress (P4P) programme. The intention is to help small farmers lock into more profitable long term supply contracts but accessing this high value market has imposed a new set of problems on farmers related to their need to conform to the tough quality requirements. Projects like APEP and LEAD have offered structured support to farmers in the form of training in post-‐harvest and storage practices, business planning and improved market information as well as in the construction of required infrastructure such as drying cribs. In so doing, farmers have
74 The Draft East African Standards, 2011 on appropriate quality standards for maize is generally adopted across all East African states, and must be complied with for Ugandan traders to export any maize. These standards are adopted by the WFP.
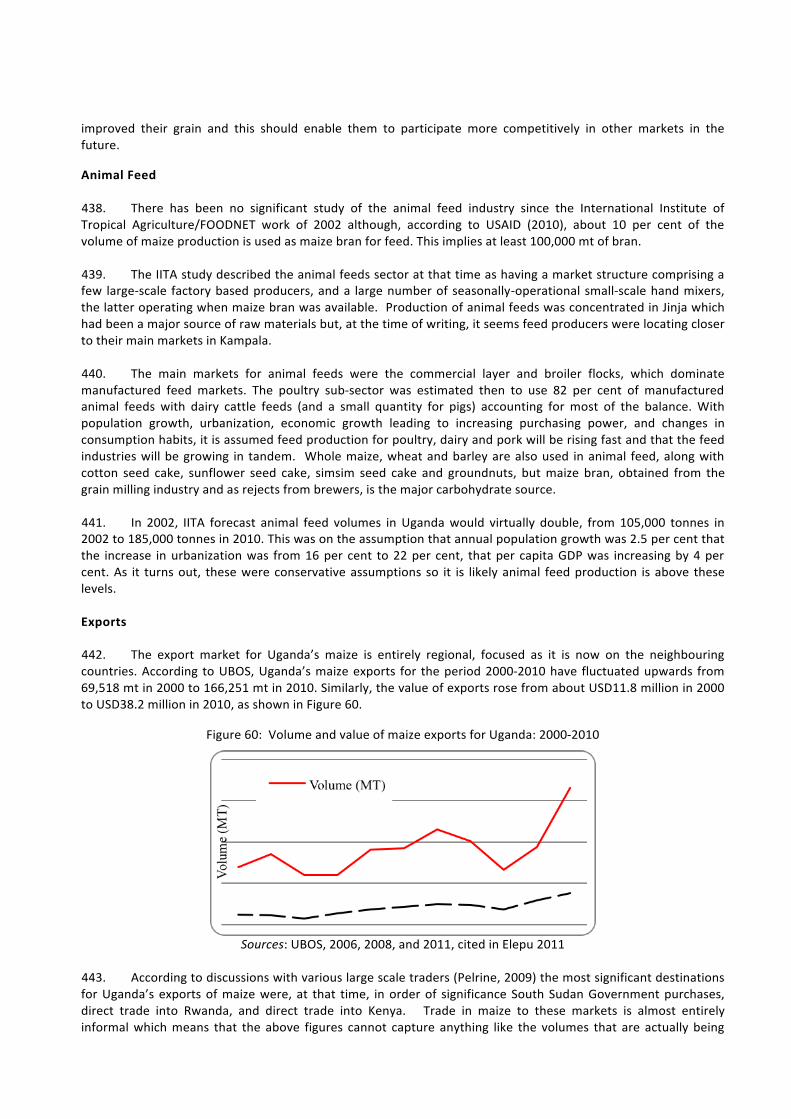
138
improved their grain and this should enable them to participate more competitively in other markets in the future.
Animal Feed 438. There has been no significant study of the animal feed industry since the International Institute of Tropical Agriculture/FOODNET work of 2002 although, according to USAID (2010), about 10 per cent of the volume of maize production is used as maize bran for feed. This implies at least 100,000 mt of bran.
439. The IITA study described the animal feeds sector at that time as having a market structure comprising a few large-‐scale factory based producers, and a large number of seasonally-‐operational small-‐scale hand mixers, the latter operating when maize bran was available. Production of animal feeds was concentrated in Jinja which had been a major source of raw materials but, at the time of writing, it seems feed producers were locating closer to their main markets in Kampala.
440. The main markets for animal feeds were the commercial layer and broiler flocks, which dominate manufactured feed markets. The poultry sub-‐sector was estimated then to use 82 per cent of manufactured animal feeds with dairy cattle feeds (and a small quantity for pigs) accounting for most of the balance. With population growth, urbanization, economic growth leading to increasing purchasing power, and changes in consumption habits, it is assumed feed production for poultry, dairy and pork will be rising fast and that the feed industries will be growing in tandem. Whole maize, wheat and barley are also used in animal feed, along with cotton seed cake, sunflower seed cake, simsim seed cake and groundnuts, but maize bran, obtained from the grain milling industry and as rejects from brewers, is the major carbohydrate source.
441. In 2002, IITA forecast animal feed volumes in Uganda would virtually double, from 105,000 tonnes in 2002 to 185,000 tonnes in 2010. This was on the assumption that annual population growth was 2.5 per cent that the increase in urbanization was from 16 per cent to 22 per cent, that per capita GDP was increasing by 4 per cent. As it turns out, these were conservative assumptions so it is likely animal feed production is above these levels. Exports 442. The export market for Uganda’s maize is entirely regional, focused as it is now on the neighbouring countries. According to UBOS, Uganda’s maize exports for the period 2000-‐2010 have fluctuated upwards from 69,518 mt in 2000 to 166,251 mt in 2010. Similarly, the value of exports rose from about USD11.8 million in 2000 to USD38.2 million in 2010, as shown in Figure 60.
Figure 60: Volume and value of maize exports for Uganda: 2000-‐2010
Sources: UBOS, 2006, 2008, and 2011, cited in Elepu 2011
443. According to discussions with various large scale traders (Pelrine, 2009) the most significant destinations for Uganda’s exports of maize were, at that time, in order of significance South Sudan Government purchases, direct trade into Rwanda, and direct trade into Kenya. Trade in maize to these markets is almost entirely informal which means that the above figures cannot capture anything like the volumes that are actually being
139
shipped. Pelrine goes as far as to say there are no accurate data on volumes and values exported to these countries.
444. Despite these impressive figures, Uganda is not yet, as is sometimes said, the breadbasket of East Africa. From the 1.0-‐1.2 million mt produced, Uganda can export, in a good year, maybe 200,000 mt. Kenya produces approximately 2.9 million mt/year with a structural deficit of approximately 300,000 mt75, Tanzania produces approximately 3.6 million mt/year. When Kenya or Tanzania has a deficit in maize, a relatively small volume is procured from Uganda. The big volumes traded are in white maize produced by the commercial farmers in South Africa. 445. The market in South Sudan is highly volatile and, with the Government of South Sudan (GoSS) living under a draconian austerity budget, traders are understandably wary about dealing with GoSS buyers. The post-‐conflict environment in South Sudan generally means Ugandan traders are vulnerable to rent seekers and predators. This is exacerbated by the unclear taxation regime and other non-‐tariff barriers (NTB) and also by the country’s unclear political future.
446. While at present, relations look stable, Kenya has, in the past, raised informal barriers to Uganda’s maize to protect the market there76. This market could be disrupted again by, for example, the imposition of the East African Community quality standards (although history so far suggests they will be difficult to apply, EAC processes being as slow as they are, and impossible to police, certainly unless the public health issues come much more to the fore). At any rate, Uganda should get ready to address these future challenges, which could threaten another grain market crash.
6.1.4 THE VALUE CHAIN
447. The earlier maize studies present the value chain in different ways but come to much the same conclusions, that is, it is quite complicated. Figure 61 comes from Pelrine (2009).
75 Although this has ranged as high as 650,000mt in 1993 and 1,200,000mt in 1997 (Magnay 2004). 76 In 2003, the Kenya Government engaged in (low) price setting to discourage exports of maize from Uganda (Magnay, 2004) and it is believed (aBi pers. comm.) that Mount Meru millers did this recently to unsettle Mukwano's dominance in oil seeds. Whether Kenyan traders have the cohesion to organize such a process over any length of time is doubtful however although the National Cereals and Produce Board has certainly been blamed over the years for the application of various NTBs to advantage its own farmers and trade. This would be very difficult to quantify.
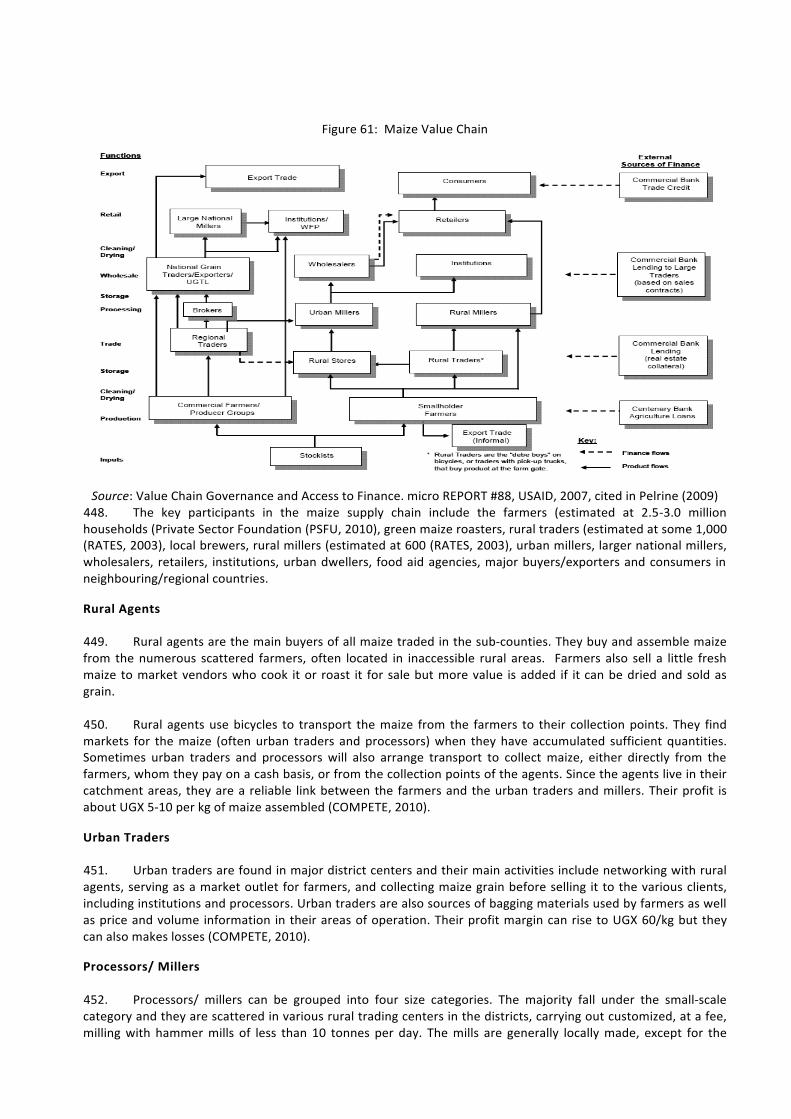
140
Figure 61: Maize Value Chain
Source: Value Chain Governance and Access to Finance. micro REPORT #88, USAID, 2007, cited in Pelrine (2009) 448. The key participants in the maize supply chain include the farmers (estimated at 2.5-‐3.0 million households (Private Sector Foundation (PSFU, 2010), green maize roasters, rural traders (estimated at some 1,000 (RATES, 2003), local brewers, rural millers (estimated at 600 (RATES, 2003), urban millers, larger national millers, wholesalers, retailers, institutions, urban dwellers, food aid agencies, major buyers/exporters and consumers in neighbouring/regional countries.
Rural Agents 449. Rural agents are the main buyers of all maize traded in the sub-‐counties. They buy and assemble maize from the numerous scattered farmers, often located in inaccessible rural areas. Farmers also sell a little fresh maize to market vendors who cook it or roast it for sale but more value is added if it can be dried and sold as grain.
450. Rural agents use bicycles to transport the maize from the farmers to their collection points. They find markets for the maize (often urban traders and processors) when they have accumulated sufficient quantities. Sometimes urban traders and processors will also arrange transport to collect maize, either directly from the farmers, whom they pay on a cash basis, or from the collection points of the agents. Since the agents live in their catchment areas, they are a reliable link between the farmers and the urban traders and millers. Their profit is about UGX 5-‐10 per kg of maize assembled (COMPETE, 2010).
Urban Traders 451. Urban traders are found in major district centers and their main activities include networking with rural agents, serving as a market outlet for farmers, and collecting maize grain before selling it to the various clients, including institutions and processors. Urban traders are also sources of bagging materials used by farmers as well as price and volume information in their areas of operation. Their profit margin can rise to UGX 60/kg but they can also makes losses (COMPETE, 2010).
Processors/ Millers 452. Processors/ millers can be grouped into four size categories. The majority fall under the small-‐scale category and they are scattered in various rural trading centers in the districts, carrying out customized, at a fee, milling with hammer mills of less than 10 tonnes per day. The mills are generally locally made, except for the motors and engine and are often of poor design, only able to produce “whole grain” maize flour, often referred to
141
as “No. 2”. Daily production levels vary depending on the consistency of power supply, type of machines and maize grains used. Processing costs range from UGX 50 to 100 per kg, depending on the location and the No. 2 maize flour sells for between UGX 600 to 800 per kg (COMPETE, 2010) with prices higher in the border areas and in urban centers and commercial centers.
453. In Kampala, milling is concentrated in the Kisenyi area, where the Kisenyi Millers Association is comprised of 80 or so small millers milling for the retail market. Local mills interviewed by Pelrine (2009) seemed to be reasonably profitable though earning differing levels of revenue depending on their throughput and the level of competition they faced. Local mills selling to institutions have an advantageous position as they pay farm-‐gate prices for their raw maize, mill using low cost labour and sell at import price parity rates. Much of the maize they were milling was too wet and sometimes it was mildewed, a public health issue. Another problem was the unreliable and increasingly expensive electricity supply which impeded attempts to improve mechanical drying at mill level. With these constraints, it may be impossible for local millers to compete with imported maize flour on the basis of price.77
454. Millers obtain gross margins of around UGX 350-‐450/kg (Elepu, 2011). Energy costs are high and account for 70-‐80 per cent of total milling costs which, if really true, shows how vulnerable millers are to the many vagaries of the energy market.
455. Medium-‐scale processors are taken to be those operating mills with capacities of up to 50 tons per day. These are based mainly in the district capitals and offer both contract and trade-‐based milling services to institutions and urban traders. The medium-‐scale millers first hull the maize to remove bran and then produce “No.1” flour, which is less nutritious than “No. 2”. From this process, the maize bran is sold to poultry and livestock farmers, while the “No. 1” flour is mainly bought by urban households. Medium scale millers do not produce “No. 2” maize flour because they are oriented towards the urban markets and the product specification of that market.
456. Although the medium-‐scale processors do store some grain, the volumes involved are limited by storage space and working capital. Medium-‐scale millers charge a price of UGX 70-‐100 per kg for milling (COMPETE, 2010) and the conversion rate to flour is about 70-‐73 per cent. This No. 1 flour currently sells for some UGX 800-‐1100, to wholesalers and retailers while maize bran sells for some UGX 100 per kg. COMPETE estimates this means medium-‐scale millers make a profit of some UGX 87-‐383 per kg processed.
457. Large-‐scale processors are only found in Kampala. They buy their maize from urban traders and from larger traders from the regions. They sell more than 75 per cent of their flour production to the WFP.
458. Regional-‐scale milling operations include Pembe, Rafiki and Unga. For the most part, they import their maize from first world exporters or more sophisticated developing countries. These companies have operations in several countries within the region though their strategies for procurement, milling and sales differ. Unga, for example, moves both raw and milled maize between Uganda and Kenya. Pemba has operations in Uganda and Rwanda but they do not trade with each other.
459. Large millers seem skeptical as to smallholder produced grain in terms of its quality, volume and price, the view seeming to be that local procurement ‘often results in rotten, non-‐uniform maize being delivered late if it is delivered at all’ (Pelrine 2009). Millers have had to face contract default because when prices have moved up, local suppliers refuse to honor contracts. Is it any wonder that they prefer to source maize from North America, South America or South Africa rather than procuring it in the region? Most of the time imported grain is cheaper and more reliable.
77 Ferris and Ojok estimated that, in 2004, urban millers were operating at only 50% of normal milling capacity and that, as a consequence, sales of grain in local markets were 25% lower than they had been the year before. The situation in this regard is still very bad and difficult for millers.

142
6.2 STRUCTURAL ISSUES AND THEIR POLICY IMPLICATIONS
6.2.1 OPPORTUNITIES AND POTENTIAL
460. The countries of the EAC are moving toward the establishment of a common market, creating a market of over 130 million consumers. If production could be stepped up, Uganda would be able to supply much more to this market. Maize is a staple in much of the EAC region and the deficits in several of the neighbouring countries are a real opportunity for Uganda. At the same time the growing urban population at home, and the changing preferences for maize among the city dwellers and the young, means there is a growing domestic base consuming posho and thus creating further opportunities for increased production and milling capacity. However, as should be apparent from Section 1, the maize chain in Uganda faces many structural problems that impede the development of an efficient commercial market.
The Scale of Production 461. Maize farmers in Uganda tend to be very small. It is estimated that 70-‐75 per cent of maize farmers cultivate between one and two acres.78 Just by virtue of size, the farming model impedes the farmer’s capacity to scale up because the low returns restrict savings and re-‐investment. This is difficult for small commercial farmers and impossible for subsistence farmers. To consider animal traction even for a higher value crop like sesame, a farmer must be cultivating seven to ten acres -‐ see Pelrine (2009) for calculations; to consider a tractor, a farmer must be cultivating 40 acres to generate sufficient return. Subsistence level farming therefore restricts farmers’ ability to scale up; and the inability of farmers to scale up restricts them to subsistence level farming.
462. As long as scale of production remains low like this, other value chain activities will continue to be inefficient. Consolidators of maize will continue to have to cover more journeys and larger distances to collect a truckload (with, due to excessive handling, all the negative effects on quality that entails). The resulting post-‐harvest losses and high procurement costs will be passed down the chain to millers, exporters and consumers. The same argument applies in reverse: input costs rise as distances and the number of fertilizer bag journeys increase.
Weak input markets
463. Modern inputs such as seeds, fertilizers and pesticides are essential for achieving the higher levels of productivity essential to a commercially sustainable industry.
464. The Ministry of Agriculture, Animal Industries and Fisheries (MAAIF) has the mandate to approve and certify seeds and chemicals but for many years has not had the vision, the capacity or the funding to deliver a service. As a consequence, very few improved seed varieties are approved, counterfeit certified seeds and counterfeit patented chemicals are common all over rural Uganda; and quality breeder seed is all but absent in the country. Numerous recommendations as to how to correct this have been made over the years, ranging from strengthening MAAIF (Danida, 2009) to privatizing these functions all together. However, implementation of the recommendations has never really got off first base. As this report was being completed, drafts of the Fertilizers Control Regulations, 2012 National Fertilizer Policy for Uganda, 2012 were released although they have not yet been approved. 465. Given the choice, vendors supplying imported inputs will favor selling to large agribusinesses rather than supplying the smallholder market through the large network of tiny stockists. The packaging of small quantities of inputs is expensive and the returns uncertain especially given the lack of regulation and the various market failures that exist. With most seed and agrochemicals sold, it is hard to know the age, origin and quality of inputs and there is widespread suspicion as to the reliability of inputs. Even the ones that are sound have to be applied in a careful and timely manner and this is frequently not well understood.
466. The majority of stockists are not adequately skilled to safely and properly handle inputs, profitably manage a business operation, procure and market the inventory with the greatest relevance to their clients, and/or to conduct extension operations to improve their market demand. Stockists regularly go out of business and Pelrine shows this is partly a consequence of their weak skills but partly due to inherent difficulties because of
78 Private Sector Foundation, 2005.
143
the pronounced seasonality of their businesses. They state in interviews that they could double their businesses if they had access to working capital or inventory on credit at ‘reasonable’ terms (Pelrine 2009).
467. Inputs are not readily available outside of trading centers and that the costs to farmers of accessing inputs were often prohibitive. The market in Uganda for fertilizers is small even by Sub Saharan African standards. Annual consumption in 2006 (latest figures so far found) was in the region of 25,000 tons per annum (internal Danida ASPS note) and large or highly intensive farming enterprises such as the tea estates and the flower farms account for a third of this. In fact, according to the 1999/2000 UNHS, only 4 per cent of farmers reported using inorganic fertilizer. Anecdotes suggest there has been growth in usage over the last decade but from a very low base.
468. According to IFPRI, Ugandan farmers use an average of one kg of nutrients per hectare of arable land compared to 35 in Kenya, 22 in Malawi and 13 in Tanzania (Wallace & Knausenberger, 1997, cited in Bayite-‐Kasule, 2009). This low rate of fertilizer use is particularly worrisome given that Uganda has one of the highest rates of soil nutrient depletion among countries in sub-‐Saharan Africa. Data on fertilizer use per hectare of arable land in Uganda is not available at regional level. However, the 2005-‐06 Uganda National Household Survey (UNHS) offers some insights on the proportion of farmers that use fertilizer. Only one per cent of the total farm households surveyed applied inorganic fertilizer to their crops. Regionally, a greater proportion of farmers in the Central and Eastern regions use fertilizer than do farmers in the Northern and Western regions.
469. Exactly why usage is so low is not clear but the deterrent effect of cost cannot be underestimated. Another study from IFPRI (Omamo, 2003) showed that the cost of DAP per tonne delivered (CIF) to Kampala was USD325 compared to USD265 for the same ton delivered in Nairobi or even USD165 delivered in Tampa, Florida. Tomoya and Yamanoa (2009) investigate the reasons for the low application of external fertilizers on farms in Kenya and Uganda and suggest that Kenyan maize farmers do apply at the optimal level but that, in Uganda, even the low application of inorganic fertilizer is not profitable because of its high relative price. They go further and suggest that the efficacy of policies based on improving farmers’ knowledge about fertilizer use will be limited as long as the relative price of fertilizer remains as high as it is. By other estimates, the increase in revenue from enhanced yield more than made up for the input price, as using fertilizers could produce a greater return to the farmer than subsistence farming even if fertilizer costs were to increase by 140 per cent. Despite this, farmers seem to prefer to open virgin land rather than use fertilizers. 470. The issue is that because of the numerous risks outside farmers’ control (weather, pests, disease, and commodity price fluctuations -‐ the latter often determined in far-‐off export markets); the returns to farmers from investing in these costly inputs are uncertain and highly sensitive to the crop prices obtained on sale. This is a clear deterrent. Farmers also know the importance of site and crop specific analysis for fertilizer application and that the lack of capacity in the extensionist and dealer networks is a major problem. They know that if weeding, spacing, timeliness, deployment of a variety that can benefit from fertilizer, pest loads, and soil moisture are also not optimal, fertilizer gains can quickly be lost.79
471. As regards specific fertilizer recommendations for changing soils, varieties, fertilizer products, economic conditions etc., no authoritative work has been done to revise the guidelines developed during the early 1970s by FAO and MAAIF. A revised assessment of the changing soils status and work to generate new recommendations based on solid information is needed as MAAIF last completed a reconnaissance soil survey (at a scale of 1:250,000) in the late 1950s. It is known that fertilizer response models have been prepared by donor projects and indeed by NARO but where these are now is far from clear. Some of the commercial farmers will have their own data and models.
79 Stockists and extensionists are generally not aware of correct application dosages, the role of the primary and secondary nutrients (N, P, K) in crop production, and the cost per unit of nutrient for different products (Drew, 2010). Some donor/NGO projects tried to address this problem, but the number of dealers and extensionists trained is only a small fraction of the total needed. The seasonal array of field trials and demonstrations that is necessary is established in an ad-hoc manner and the results of those are not systematically assembled and presented as a set of national crop prescriptions, supported by accurate gross margin information.
144
472. Recently USAID prepared gross margin calculations for maize using assumptions appropriate to traditional, low-‐input and high-‐input systems. A table summarizing these is shown in Annex 4, showing the effect of fertilizer and other input use on yield and income per acre. In the subsistence and low input models, farmers apply no DAP or UREA and no top dressing. In the high input model, farmers spend UGX102,000 (USD41.2) per acre per season on DAP, UREA and top dressing (and also UGX35,000 on other chemicals and a little extra labor). Priced at some UGX1,180/kg, this is equivalent to fertilizer application rates of some 213kg/ha. What this means in the light of the IFPRI figures above is not clear but this is a relatively high rate and the model shows yields rising from 1,300kg to 2,300 kg per acre, that is by 77%. Encouragingly, this means that, as input use rises, returns to family labor increase from UGX 9,451/day to UGX13,870/day, or 47 per cent.
473. Fertilizers are covered under the Crop Protection Act and subject to the same dysfunctional MAAIF regulatory environment described above. While work for Danida (2009) found no strong evidence of extensive product adulteration or mislabeling, short-‐weight measures were commonly reported. Clearly, there is a need to establish, and apply, a regulatory system for fertilizers in order to promote orderly development of the market.
474. As for seeds, the key issues are that :
• Farmer saved seed is cheap but yields only about one ton per hectare (Larson and Mbowa, 2004). • The NARO produced open pollinated varieties (OPVs) should increase average yields from the current 1
mt to 3-‐4 mt per ha with proper input application and crop management. • The hybrids available should produce 7-‐8 mt/ha with proper input application and crop management. • There are some 27 seed companies selling to a network of some 50 independent
distributors/wholesalers who in turn sell to a network of some 700 rural stockists/retailers. • Seed company sources suggest there are more and more sales of hybrids. One large company said sales
had risen from 1,200mt in 2009 to 6,000mt in 2011 and USTA are reported to bullish about seed sales in general.
475. However, despite years of support from donors, notably Danida and USAID, the basis for a sustainable seed industry is still not in place. The input dealers are where the dynamism is in the industry (because this is where the money is). In the future this is where donors would be best advised to look for leverage for change.
476. MAAIF is still unable to deliver a functioning National Seed Certification Service.80 Meanwhile the huge volume of seed distributed to farmers by GoU, NGOs and donor programmes continue to undermine efforts to develop a seed industry. If farmers do not buy seed, they never develop a relationship with their input dealer’s seed companies and so the market never takes off. At the same time the humanitarian agencies have privileged quantity over assured quality and this has also challenged the development of a market.
Genetically modified organisms
477. The announcement at the close of 2011 of the successful transformation of nine transgenic maize lines by scientists funded and coordinated by the Association for Strengthening Agricultural Research in Eastern and Central Africa (ASARECA) has generated excitement across the continent. The nine lines are due to undergo further scientific testing before they start the journey to the farmer’s field.
478. Developments like this are driving the debate about genetically modified organisms (GMOs) in Uganda, such as it. Most of the running however seems to have been made by environmental and consumer groups and there has been little coherent advocacy on behalf of GMOs. Currently Uganda does not have a GMO specific law
80 For seven years, between, 2000 and 2007, Danida’s ASPS1&2 programmes supported MAAIF to improve its seed quality assurance systems. The National Seed Certification Services (NSCS), a unit under MAAIF was assisted to establish a laboratory intended to achieve accreditation by the International Seed Trade Association (ISTA). However, despite much work, the initiative came to nothing. These vital functions were never prioritized in the budget or in any of the (largely un-implemented) action plans of the time. The Seeds and Plant Act came into force in 2007 but MAAIF documents routinely report it ‘has not been implemented to date’. After five years, how can there be so little sense of urgency?
145
or any seed variety legislation that would regulate release and dissemination of GMOs although various drafts have been pending for quite some time.
479. In reality, as might be deduced from the ASARECA statement, drought tolerant maize may not actually be the most pressing issue in Uganda. This is because drought is not of the economic significance it can be in the other East African countries. It might be that, if there was a GMO useful for Uganda, it would be herbicide-‐tolerant maize, something that could be used to combat an environment in which prodigious weed growth is so prevalent.81
480. Even so, if farmers struggle to afford fertilizers, it is unlikely they will be fall in line for expensive GM seeds, especially if these include the terminator technology which requires farmers to buy new seeds every year, and commits them to spray roundup on their fields. At this stage, GMOs seems more of a distraction in the Uganda context and it would seem efforts should rather be spent on solving fundamental issues of market failure, crop nutrition, access to finance and post harvest handling.
On-‐farm Quality Control
481. A value chain study in Busoga sub region (PMA, 2009) showed 58 per cent of processors expressing disappointment with the quality of maize received. This is because struggling subsistence farmers, who constitute the majority of Uganda’s maize producers, cannot resist the opportunity to sell to traders at the farm-‐gate (even at a low price and before their grain is properly dried). Essentially, the persistence of poor quality maize at the farm gate is a function of the poverty of the farmers and their need for immediate cash.
482. With little or no liquidity, investments in technology to improve the grain are difficult and not a high priority. Hand shellers for separating maize grains from cobs, for instance, or tarpaulins for sun drying maize, or cribs for air drying maize cannot be justified. And so the trade in small volumes of poor quality, wet, unclean maize continues, each delivery being consolidated into larger volumes of worsening quality maize. The high level of losses and the costs of handling, transporting and ultimately separating out the waste, often cited as above 30 per cent, drive up prices to consumers and keep farm gate prices low.
483. It would seem to follow that by delivering a clean and dry product the farmer could increase his/her income but this will only be so if the market differentiates on the basis of quality. In this case, where the only buyers are small scale opportunistic traders, there is little or no premium for providing a better quality product because, small batch as it is, it is destined to be comingled with other lower quality product.
484. There are ideas around (Pelrine, 2009) for on-‐farm value-‐adding processes such as on-‐farm milling. Theoretically, these could be justified but the economics are likely to be very marginal and any investments should be carefully reviewed on a cost-‐benefit basis. Very likely the output from on-‐farm agro-‐processing will not meet whatever standards the market requires and will come at a capital cost that cannot be recovered from sales revenues. As stated already, the international market can often provide the quality and quantity of maize required by buyers, at a lower cost or, at least, more reliably.
81 The two dominant agronomic traits currently available in GMOs are herbicide tolerance (HT) and insect resistance (mostly in the form of Bt crops). Herbicide tolerance is the prevailing trait that is deployed in all four dominant crops, while maize and cotton are the only two insect resistant GM crops currently commercially available (Kaphengst T et al, 2011).
146
Mechanization
485. Animal traction for ploughing (though not for weeding) was traditional in northern Uganda before the conflict and has made a minor comeback, largely subsidized by NGOs and donors. Ownership of tractors and/or the use of rented tractors is, however, unusual. Some farmers do hire tractor services for tasks such as first and second ploughing, but the marginal rate of return is dismal if low input agricultural practices follow. Drew (2010) observes that out growers in sugarcane and tobacco are keen to see the hired tractor service do the work, but are less enthusiastic at harvest time when such costs and accumulated interest charges are deducted from their gross proceeds. Block farming, like that practiced by cotton farmers in parts of Kasese, can reduce tractor hire service costs but much of Uganda is not amenable to this because of small farm sizes, multiple cropping, hilly and rocky terrain, swamps, trees and termite mounds. Drew reckons mechanized farmers must use Good Agricultural Practices (GAP) and that a 65-‐80 HP tractor and implements requires a minimum of 20 ha per season to justify the investment and that the optimum is closer to 40 ha/season.
486. Pelrine (2009) writes at length about the lack of access to finance including both term finance and working capital. Relatively large investments that depreciate slowly require term financing that is the investment is too large to be paid for in one or two years because the payments would exceed the income of the borrower. Therefore, such assets must be financed over longer terms with lower periodic payments. In this light, users of mechanization must have adequate working capital to cultivate enough land (the challenge of scale) to realize the marginal income from the mechanization. As noted however, term financing is not normally offered to farmers by Uganda’s financial institutions82 and term finance with complementary working capital lending is even rarer. There have been some exceptions with large scale leases to tractor service providers by Stanbic Bank and animal traction loans by Centenary and Equity Banks but these are not targeting maize production.
Organization of Farmers
487. The often-‐cited solution to what Pelrine refers to as “the scale problem, the application of technology problem, the bulk marketing problem and the market access problem” is organizing small farmers into some form of farmers’ organization (FO). This has a fairly tortuous history in Uganda and even in the modern era, the results have been decidedly mixed. INSPIRED, a consultancy company, was contracted by Danida/ASPS to evaluate the sustainability of FOs assisted by Danida over a fourteen year period, from 1995-‐2009, and found that only half of them had a possibility of achieving sustainability though none of them had yet done so. INSPIRED were probably being polite to their client. The issues included: management weakness, low adoption of business behavior, poor outreach to members, weak commitment from members to their own organization.
488. Lower level FOs, organized by APEP and others, apparently showed some success but are rarely if ever able to take responsibility for complex activities like bulk input purchases and collective marketing, the driving purpose of the enterprise. While these groups can be supported with technical assistance, they rapidly develop a dependency culture, and never wrestle with the fundamental inability to enforce social contracts. Members tend to use their organization when it benefits them and then refuse to honor agreements when it does not. Examples are legion and WFP has faced frequent and serious contract default on maize deliveries resulting from exactly this problem. 489. Despite the evidence, many donors are still strongly wedded to the idea of supporting farmers’ groups and are likely to persist with the view that it is more equitable to assist farmers who are arranged in groups. Perhaps, as Zorya (2012) suggests, they should consider thinking more broadly than the notion of formal 15-‐30 person groups with relatively static memberships and small group demonstration gardens. Such groups may be the ideal size for teaching about new technologies and demonstrating new seeds, but they are often too small to bulk substantial amounts of produce.
Bulking
490. Consolidation, or bulking, of raw maize is necessary to create economic volumes for processing, retailing and export. The critical issues largely relate back to the production issues covered earlier, most notably, the volumes and quality of maize available for purchase. Pelrine (2009) describes the various actors involved in this activity and their differing levels of sophistication.
82 This is due to Central Bank restrictions on term lending and general risk avoidance by lenders.
147
491. Small bulkers: No premiums are paid for cleanliness, quality or low moisture content at this level. There is no reason for small traders to require this as even if they receive clean, dry maize, it will simply be added to other maize that may not be clean and dry. The corollary to this is that there is little reason for farmers to offer quality maize if the trader doesn’t pay a premium for it.83
492. Rural bulking stations: Once maize is collected by small bulkers, it is often delivered to poorly maintained stores.84 Here maize is consolidated to volumes that are attractive to truck traders or rural millers. There is fair competition at this level often with several of these operations close to each other. The issues here, of course, are that these stations constitute yet another place for maize to be (poorly) handled and another time for it to be comingled with no regard for quality.
493. Larger truck traders: Traders with trucks of 25 to 30 mt compete for maize from the rural bulking stations (and sometimes manage bulking stations themselves) and then deliver this to large buyers/processors in Kampala such as Aponye, Premier and Sunrise who process and pack for large national and regional buyers. Pelrine suggests this business is competitive and seems efficient. In his interviews, large buyers complained that truck traders normally delivered low quality maize that required serious cleaning and drying.
494. Urban public warehouses: When it was operating, UGTL bulked the clean, dry product of sixteen large scale traders in Kampala but the structural challenges of building a functioning storage industry were cruelly exposed by the market failures then prevailing. Bulking operations are expensive and require long term capital investments that cannot be justified without regular, high volume throughput.
Lack of financial services
495. The lack of availability of finance is a major check on progress in the industry. Productivity enhancing technology exists, land for purchase or rent exists (up to a point) and labor is available. What is really lacking is investment, either from farmers’ retained earnings or from appropriately structured financial products. For example, maize farmers, especially smallholders, need credit to hire the labor they need for the maize production system. Without credit, they sell off most of their surplus maize to traders as soon as it is harvested and hence, receive low prices due to oversupply conditions. More commercial farmers may be able to avoid this predicament by using savings as a source of finance.
496. Other maize value chain actors, especially traders and millers, also lack access to adequate finance to buy and stock up grain after harvest. Some local informal cross border traders receive finance from Kenyan traders while those traders and millers who supply WFP, use the WFP contracts to borrow the working capital. Most small millers use mainly retained earnings or savings to finance their investments.
497. Medium-‐sized and large millers face shortage of investment capital due to limitations in the financial institutions and this clearly hinders their expansion into tertiary processing. Elepu found that some, like Unga, have expressed a wish to venture into food blending and packing but need to introduce expensive extruders and food packing lines which they cannot afford without financial support.
498. The problem is the familiar one that commercial banks shy away from funding agriculture and agribusiness because of perceived low returns and high risks: weather, pests, diseases, fluctuating prices, political interference etc. It was this essentially insoluble situation that led to the development of the Warehouse Receipt System idea.
499. Having said this, the emergence of remote banking offered by telecom services is likely to have a considerable impact. Banks and telecoms are pushing ahead with this, offering money transfer services although
83 As this report was being completed, the LEAD project was getting reports of an interesting development (pers. comm.): Kenyan buyers offering ‘slightly higher’ prices for better quality grain. In Mubende, three trucks are normally packed with different prices on each truck. The highest price is paid for best quality grain destined for Tanzania; the next highest price is for grain destined for Busia, on the border with Kenya; and the last grade and price is for maize destined for Kisenyi market. These are not the UCE grades but local grades developed by the industry itself. 84 Pelrine visited several of these where rats, mildew and weevils were all in plain sight.
148
as yet no credit facilities. Another prospect is for banks to offer commercial trade finance to larger stockists, say those with sales volumes and operations above UGX 100m per season. There are probably enough of them to justify the development of a trade credit product that can be offered by commercial and MSME lenders. Of course, even if these solutions sound attractive, if the cost of money remains as high as it is, and market risks are not well attended to, the full potential will be difficult to realize.
500. As this report was being completed, a final draft of MoFPED’s Agricultural Finance Strategy has been released but has yet to be approved.
Market information
501. Market information is frequently cited as a critical constraint that, once alleviated, would empower farmers to negotiate more strongly with traders and capture a greater percentage of the final price. This has been the driver of the many donor-‐funded initiatives over the years.
502. Unfortunately, market information is only useful to an extent. In the current situation, of multiple tiny producers unable to create sufficient market volumes to encourage competition among the buyers, knowing the price in the neighbouring district, or in Kampala, hardly helps. Farmers are still likely to have only one buyer and be unable to transport the grain anywhere else. On top of this, the market information available is insufficiently specific. It will typically be the price of maize in a regional market but will have no detail as to whether it relates to one bag, one kg, or one truck load, what type of maize it is (white, yellow, red tipped-‐yellow etc.), or even as to the quality of maize (17 per cent moisture content or 13.5 per cent). Providing such detailed information is costly of course and will probably only be justified when the industry becomes more commercial. At present all the market information systems are funded by donors. Phone/text MIS is available from UCE, Infotrade and others, but it is not clear how much farmers use it.
Sanitary, Phyto-‐sanitary and Other Standards
503. The bimodal rainfall pattern over most of Uganda is a mixed blessing for the maize industry. While it drives higher production, it also creates logistical and safe handling issues as drying the maize to a proper storage moisture content of 13.5 per cent to 14 per cent is challenging.
504. As has been explained, a lot of maize is sold wet with traders consolidating supplies and applying their own drying and storage methods. The basic shelling process contributes to broken and damaged grain, which enhances the growth of mould leading to aflatoxin and mycotoxin contamination and the lack of adequate drying (if it is below 14 per cent) leads to discoloration and supports further growth of mould. As a result, among regional commercial millers, Uganda’s maize is often avoided because it has a reputation for being transported wet and/or rotten and of sometimes being a health risk. The application of phytosanitary export standards is infrequent and not uniform but, as recently as 2004, Rwanda and Kenya both refused shipments of Ugandan grain due to quality problems.
505. The Action Plan from the last DTIS (2006) called for attention to be focused on establishing a coherent and agreed-‐upon vision for promoting and managing standards to improve export competitiveness and increase returns to primary producers, traders, and processors. Unfortunately very little progress if any has been achieved.85
506. To be fair, and while limited Sanitary and Phyto-‐sanitary (SPS) capacity has undoubtedly constrained Uganda’s maize exports, a quick summary of the standards that are being called for shows why the issue is so daunting for the industry (DTIS, 2006):
• Food Safety: Microbiological standards, Limits on Pesticide residues, Mycotoxins • Plant Health: Fumigation requirements or restrictions • Quality or Technical Attributes: Quality grades, GMO labeling, Nutritional labels
85 Two respondents who were there at the time recall the DTIS as stopping fairly suddenly with insufficient championing after the report came out. The process was exhausting and the report was huge and perhaps hard to digest. And, as time passed, there were always new priorities. There was clearly inadequate anchoring within GoU.

149
• Environment: Biosafety/GMO regulations, Codes for organic practices and certification
507. And then at least half a dozen under capacity public agencies are scrambling to involve themselves in these issues. It does not help with progress. In the DTIS (2006), it is written that ‘Some draft legislation was introduced to Parliament more than three years ago and actions are still pending.86 Six years on and they are still pending.87
Other Non-‐tariff Barriers 508. In a 2009 study to assess the impact of non-‐tariff barriers (NTB) on maize and beef cattle cross-‐border trade in the East African Community (Karugia et al, 2009) identified such NTBs as corruption through bribes, roadblocks, customs procedures, and harassment or discrimination during licensing. There are also numerous administrative requirements for traders in maize in East Africa such as simply acquiring licenses and municipal and council permits.
509. These NTBs may account for nearly 35 per cent of total maize transfer costs in Kenya and over 50 per cent in Uganda (Karugia et al. 2009). The study showed that reduction or elimination of NTBs would reduce the high transfer cost in the region and when completely abolished, maize producer and consumer prices in Kenya would fall by about 9 per cent and 3 per cent, respectively, but increase by 20 per cent and 24 per cent, respectively, in Uganda. This means, according to the model, that, inter alia, maize consumption declines in Uganda by 2 per cent, while production increases by 3 per cent. In fact, within the maize subsector, the greatest gainers from a complete abolishment of NTBs in East Africa would be maize producers in Uganda while the greatest losers from this policy change would be maize producers in Kenya. Ugandan maize producers benefitting from the increasing domestic maize prices would be able to expand their exports to Kenya.
The Uganda Commodities Exchange and the Warehouse Receipts System 510. In 2005, the Marketing and Agro-‐Processing Sub-‐Committee (MAPSC) of the PMA produced the Marketing and Agro-‐Processing Strategy which highlighted, among other things, the need for “the establishment of an agricultural commodity exchange and warehouse receipts/inventory credit system (WRS)” which would “provide greater liquidity at the rural end of the commodity supply chain” and improve “market efficiency… resulting in reduced transaction costs” (Ministry of Tourism Trade and Industry -‐ MTTI, 2005). Work on this then proceeded and drew on an earlier report by Onumah and Linton (2004) which included a business plan and a financing proposal for the Uganda Commodity Exchange (UCE) to become self-‐financing.
511. At the time of writing, hardly a trade has been made on the floor of the UCE and the WRS cannot be said to be in place. Five warehouses have received licenses from UCE and numerous trainings have been undertaken on grading, sampling and weighing skills etc. The Final Evaluation report for the EU project that supported the process (EU, 2011) ascribes the lack of progress firstly to problems already discussed (the risk that farmers will not always benefit from putting crops in store and the risk that a given warehouse is unviable due to lack of throughput) and secondly to the fundamental lack of sustainability of UCE itself in its present constitution. It is hard to see how a government department, without even its own budget line, one dependent on the good will of the Permanent Secretary and of any donors it can catch, can develop the required acumen and the necessary autonomy to survive, let alone flourish. Onumah and Linton considered that UCE could become self-‐financing approximately four years after trading operations commenced. At present there is no prospect of this.
86 Some examples have already been discussed: a draft Food Safety Bill, a draft Plant Protection and Health Bill, a draft Control of Agricultural Chemicals Bill, and a draft Biosafety Bill and associated Biosafety Regulations. 87 As this report was being finished, SIDA funded a study for MTTI/UBOS (2012) on Assessment of the Capacity Needs of Standards, Metrology, Conformity Assessment and Accreditation (SMCA) Service Providers in Uganda. This re-iterated (again) much of the above, i.e.: there are no standards for value chain inputs; the nation’s labs are under-equipped, under-funded and understaffed and without accreditation; there is no legal framework for establishing accreditation; no mechanisms for enforcement; low levels of awareness around the issue.
150
512. Then again, in its capacity as a regulator, UCE must become much stronger, and bring in more players from the Ugandan economy. It needs reliable central funding and political support to do its job properly. The political support needs to stay “hands-‐off” however.
513. The willingness of bankers to participate is much like the willingness of buyers. The bankers are likely to engage, if and only if, the numbers of transactions are high; the buyers and sellers are numerous and reliable; and if financing receipts are big and remunerative enough to encourage them to develop the skilled human resources to invest their liabilities. Again, it seems premature at this point to assume that this will happen.
6.3 LOOKING TO THE FUTURE
514. Arguably, looking to the future can boiled down to one thing: getting the maize industry onto a commercial footing. As MAAIF’s Development Strategy and Investment Plan (DSIP -‐ see Section 3) says, ‘The population that was 6 million in 1969 is now 30 million and every day there are more mouths to feed.’ Maize has the potential to make a considerable contribution here and the key has to be productivity enhancement (to reduce unit costs of production and make the enterprise more profitable, even in times when prices dip) and commercialization.
515. Positive commercialization experiences do exist in Uganda and lessons can be learned about how to move forward. Drew (2010) points to flowers & cuttings, sugar and the tea estates as examples. There are also commercial operations in dairy (Jesa in Wakiso and many zero grazing enterprises); beef (Zziwa ranches in Masindi); grains (the commercial farmer groups such as KACOFA in Kapchorwa); rice (Tilda in Bugiri); poultry (Ugachick near Namulonge, and others). Somewhat dispiritingly, however, some of these commercial operations, such as sugar and tea, involve smallholders as out growers (or contract growers) and with few exceptions, the operations are plagued by the same issues of low productivity and low quality as is found in the smallholder sector (Drew 2010).
516. With population growth and few off-‐land opportunities, farm sizes continue to become smaller, cropping cycles get shorter and intercropping increases. As Drew (2010) writes, one might surmise that this would have the effect of forcing smallholders to commercialize in order to maximize productivity on smaller land parcels. But this has not occurred in areas such as Southwest Uganda where population density is high, and climate is more moderate. Even the high value crops such as Irish potatoes and other temperate vegetables continue to be produced using low input technologies. The main coping mechanism has been continued extensification by encroachment into sensitive environments, and migration.
517. The difficult reality is that commercialization requires a huge change in mindset by peasants, politicians, bureaucrats, donors and NGOs. Commercialization does not, of course, simply mean ‘big’. Commercial farming can be performed even at the garden level although, for agriculture to modernize in Uganda, production will eventually need to be on a scale that can sustain efficient use of 4-‐wheeled tractors. Animal traction may contribute as a transitional technology in certain areas such as Eastern Uganda where soils are lighter and it is a tradition.
518. Drew (2010) asks what revenue farmers in Uganda might require in order to change their production system and what implications that would have. He wonders, for instance, what it would take for farmers to generate a revenue of UGX5 million from a given enterprise. For maize, for the sake of simplicity, he assumes single cropping and that farmers can sell the grain at UGX 300,000/mt. If they could achieve a yield of 3.5mt/ha (three times existing levels), this means they would need 4.8 ha under the crop. This is a land area beyond what can be handled by family labor and far above the current typical maize holding in Uganda.
519. As has already been said, farmers need to engage in employing Good Agricultural Practices (GAP) in combination with improved genetic material. This alone has been demonstrated repeatedly to result in approximately a doubling of yields (Drew 2010).
520. Drew describes some of the concerted efforts by DPs to commercialize/modernize Uganda’s maize sub-‐sector over the past 15 years. The positive spin is that the technologies are known and have been demonstrated and that support functions exist around external input supply and financing the value chain. The more difficult lesson is that, despite all the efforts, the level of commercialization is still very low. Farmers may partially adopt
151
some good practices such as proper plant spacing and use of improved seeds, but productivity enhancing practices such as use of fertilizer and Crop Protection Products (CPP) are only adopted by a few. Weather and price uncertainty seem to be the main constraints to farmers adopting the full suite of practices.
Box 7: Good agricultural practices
GAP entails a suite of practices: improved seed of the appropriate variety; field selection (soil type, drainage, etc.); proper land and seedbed preparation; timely planting; plant population & spacing (including row planting); timely weeding; pest scouting and control; proper harvest & post-‐harvest handling; etc. Apart from the use of improved seed, all of the above practices are within the reach of the resource poor household, and will improve yields (often by double). Even after extensive demonstrations and extension, smallholder farmers are only partial adopters of these practices.
521. Drew also notes that there are a few clusters of commercial maize farmers (notably in Kapchorwa, Mubende, Kiboga and Masindi) and that many of these are engaged in mechanized production (except for harvesting) and that some of them are growing several hundred acres of maize each year. Some larger scale farms have also emerged in Northern Uganda.
522. One final point, made by Pelrine (2009), is that vast amounts of improved inputs are purchased and distributed on charitable terms by either GoU or NGOs (70 per cent of the total, he estimates). This is done by these players for different but similar reasons and fundamentally disrupts the market, negatively impacting on long term sustainability and, arguably, prolonging the exposure of the farmers to the very vagaries it is supposed to be helping them against.
523. Many of the problems in the industry can be perceived as chicken and egg problems, such that it is hard to know quite where to start. However, the new maize platform is in preparation and the urgency is to get the stakeholders together, prioritize issues, make a plan and a budget. It is easy amidst the frustrations of the moment to think that no progress has been achieved. In fact, over the last 10 years, considerable headway has been made. It is now time to accelerate this and build on the gains. If all stakeholders can be corralled into pulling together there is no reason that this cannot become reality.
6.3.1 POLICY ISSUES
Extension Services and NAADS
524. The National Agricultural Advisory Services (NAADS) program was an innovative public-‐private initiative, originally designed to target the development and use of farmer institutions and, in the process, empower them to procure advisory services, manage linkages with marketing partners and monitor the services and their impacts. It showed very promising early results (see Annex 10) and showed great potential but eventually reduced its ambitions amidst a welter of political economy issues and a storm of donor and GoU recriminations. The country is now left largely without a functioning extension service but with an expensive hand-‐out program which delivers further distortion to the market and all the dependency issues usually associated with such endeavors.88 The prospects of providing effective, publically-‐funded productivity-‐enhancing advisory services to small or even medium sized farmers are, in the medium term, more or less zero so how maize farmers are to get the assistance they need to commercialize is deeply problematic.
Government sectoral plans
525. The policy framework is set by the National Development Plan (NDP) and central to it is the restoration of agricultural growth as an engine for employment creation, poverty reduction and industrialization. The NDP recognizes agriculture as among the key productive sectors driving the economy and “hence the Government will give it extra attention over the next five years”. This is a frequent promise in the documentation of the period but one which GoU has struggled to keep.
88 The Permanent Secretary of the Office of the Prime Minister was photographed in the Monitor “handing over eight tractors to farmers from northern Uganda” (31/10/08) while, on 10/9/08, the paper had reported a “gift bonanza” in Kanungu district when the President ’dished out’ pick-up trucks to four different farmers, tea seedlings and cash to others.

152
526. In the last ten years, agricultural sectoral policy initiatives have come and gone. The Plan for the Modernization of Agriculture (PMA) was a major initiative introduced during 2001 and publicly backed by the President. It was based on the two fundamental principles that agriculture was critical for poverty reduction and that the development of the sector was dependent upon mutually reinforcing, multi-‐sectoral interventions. To some extent, this was superseded by Prosperity for All which was part of the National Resistance Movement (NRM) manifesto of 2006 and promised that government would use substantial public expenditures to “identify and support economic enterprises that will enable households to earn daily, periodic and long-‐term incomes, with a target of UGX 20 million per household per year”. Lower level governments were tasked with selecting (through committees of which the local NRM chairman is by law a member) six model farmers per parish to receive benefits and serve as demonstration farms for the rest of the community.
527. Currently, the main reference point for the agriculture sector is MAAIF’s Development Strategy and Investment Plan described in its Introduction as government’s plan to put agriculture on the path to irreversible transformation. It constitutes a “road map” that will guide public action and investments in the agricultural sector over the next five years. However, even as the plan was being approved by Cabinet in 2010, it was apparent that MAAIF would have problems implementing it and little has happened since that day. 528. A key part of DSIP is Sub-‐program 1.8 ‘Promoting Strategic Enterprises’, in which MAAIF commits to “a strategy to support a number of enterprises to increase volumes and quality for the export markets”. The plan suggests MAAIF has learned from examples like the palm oil project in Kalangala district, or Kaweri Coffee in Mubende district, that “developments based on public private partnerships (PPP)”, will deliver benefits accruing “to both the main investors and hundreds of small scale out-‐growers”. The argument is that a focused approach to a commodity yields results, not least through the economies of scale that are necessary for both agro-‐industrial development and sustainable trade. On this basis, MAAIF has decided to support the development of specific value chains in addition to maintaining general support to agriculture. Accordingly, ten commodities have been selected under this sub-‐programme, one of which is maize.
529. Three years on, quite what this will involve is still not clear but the objective of the initiative will be “accelerated production on the basis of specialization and agro-‐zoning” and among the first steps planned is “the establishment of a commodity platform with membership drawn from actors along the value chain”. The Maize Platform is now being put together with support from USAID and it may be that this report, this Maize Industry Study, can be disseminated and used in such a manner that it can establish a baseline for the platform and its whole process.
530. There is a range of important support institutions specific to the maize sector. The Uganda chapter of the East Africa Grain Council still functions although there is currently internal dissension related to the perceived domination by Kenyan interests. At the producer level, there are associations such as Kapchorwa Commercial Farmers Association (KACOFA), Masindi Seed & Grain Growers Association (MASGGA) and there are District Farmer Associations under the Uganda National Farmers’ Federation (UNFFE) umbrella. There are also a number of primary societies involved in grains.
Rural roads
531. The problems of multiple, scattered, small producers have been discussed at length. Zorya (2012) suggests investing in rural roads would be a major factor in increasing farm profitability and inducing farm commercialization. This may be true but better roads do not guarantee success, they do not ensure farmers will engage in GAP although they perhaps make it more likely.
532. In fact a lot of funds have been invested in roads in Uganda in the last year or two, but mainly national level ones. The quality of the district roads remains very poor, and only the small size of the country (that is the short distances involved) allows Ugandan farmers to access markets and compete with their larger neighbours to the north and south. To increase the value for money in roads, investments should be (i) better aligned with agricultural potential; (ii) better aligned with cross-‐border trade facilitation; (iii) guided by the framework of justifiable loads and load consolidation activities; and (iv) focused on improving the efficiency of on-‐going investments. The recent Public Expenditure Review on Rural Roads, prepared by the World Bank, provides the framework for the necessary improvements.
153
Energy and Oil
533. Of the energy generated in Uganda, traditionally 93 per cent has come from fuel wood, 6 per cent from imported petroleum and 1 per cent from electricity (Norwegian Embassy website, 2012). Only 6-‐7 per cent of all households are electrified but the corresponding number for rural households is 1-‐2 per cent. With the growing demand for electricity and the lack of public and private investments in power infrastructure projects, there is now an acute shortage of power supply in Uganda. This is exacerbated by the drought conditions experienced in parts of the county coupled with increased discharges from Lake Victoria which have resulted in water levels in Lake Victoria falling by 2 meters and the Nalubale and Kiira hydropower plants at Jinja producing significantly less power than the installed capacity.
534. To address the power crisis, GoU Uganda has introduced a number of measures, including load shedding and the increased lease and import of expensive thermal energy. The latter in particular has meant tariffs have increased significantly and the industrial and business sectors have been hit hard. Millers of maize for whom electricity is a major variable cost feel this especially and these costs are yet another burden on their marginal profitability.
535. The discovery of crude oil reserves along the Albertine Rift Valley (see the discussion in Chapter 1) can have important implications for the maize sector. On the one hand, domestic demand for food, such as maize, but even more so, higher valued products, such as horticulture and livestock products, will increase as incomes rise. Moreover, higher urban income and urban consumer preferences will lead to increasing demand for processed foods and foods with greater domestic value-‐added, such as meat and fish. Provided Uganda’s tradable food sectors can remain competitive, this provides an opportunity for both farming and the food processing manufacturing sector. On the other hand, as has been shown, the record on competitiveness is not good and there is the immediate danger of losing some market share: this might be hard to regain after the oil boom.
536. The outcomes for the maize sub-‐sector and for other sub-‐sectors in agriculture depend very much on whether government revenues are used to alleviate chronic under-‐investment in the public goods that are constraining cereals growth in Uganda (or not). This may be the single most important issue for agricultural development in the next ten years and the early signs are, so far, not particularly good. Committed donors can surely be very useful in the policy dialogue process.
537. Once the oil industry gets fully underway, it can be expected that the value of the UGX will appreciate. This could be by 20 or 50 per cent. In the meantime, world prices of maize are projected to fall by about a third over the next couple of years before stabilizing and creeping back to historically high levels (USDA Economic Research Service, 2012). This is under the continuing influence of several long-‐term factors, including global growth in population and per capita income, a depreciating US dollar, increasing costs for crude petroleum, rising biofuel production, and slower growth in US agricultural productivity.
538. This is not a situation that cannot be planned for in Uganda, especially as the key driver of all initiatives in the maize sector should anyway be increasing productivity. As has been suggested, Uganda should be able to increase yields by at least double, over say 10 years. It is not the technical constraints that are binding but the willingness of stakeholders and GoU to constructively engage with the issue. Of course, a strengthening local currency will also help importers increase sales of vital agricultural inputs. The bigger threat may lie in currency fluctuations which will create uncertainty for business enterprises -‐ both importers and exporters.
154
Donor activities in the maize sector
539. Many donors have been involved in the agriculture sector, some for many years, and despite the equivocal record, new ones are jostling to get in or to come back. Donor initiatives include (see Drew, 2010): USAID’s Maize without Borders in Africa: the DFID-‐funded Research on the Food Crisis; WFP’s Purchase For Progress program; the establishment of the EAGC including a Uganda chapter to prepare, disseminate, and promote the exchange of information on matters affecting the regional grain industry, with funding from USAID, DFID and SIDA; various support to the former UGTL; various support to regional harmonization in East Africa (grades and standards); the EU supported WRS and UCE project including support to collateral management; support to NARO and ASARECA variety and agronomic research from the World Bank, Danida and the EU among others; the NAADS/ATAAS history (see above); producer organization support (to UCA, UNFFE and other producer groups) by Danida, USAID and others; support to private sector seed companies, agro-‐input dealers (under UNADA) and market information suppliers by Danida, USAID and others; export promotion (including support to the Uganda Export Promotion Board (UEPB) and the Uganda National Bureau of Standards (UNBS); revised regulations on agro chemicals, seed and fertilizers; farmer field technology demonstration sites and conservation tillage, supported by FAO; post-‐harvest handling supported by Danida, USAID and others; financing the value chain, including credit guarantee schemes along the value chain, supported by Danida, USAID and others; support to UBOS by DFID and others.
6.3.2 AN AGENDA FOR MOVING FORWARD
540. First, progress could be achieved in terms of implementation of existing policies.
Implementing the existing agenda
541. Although some voices call for a slowdown in regional integration and for export restrictions in the face of food crises such as the one in 2011, the Government of Uganda should forge ahead. After the re-‐establishment of the East African Community (EAC) in 1999, the pace of regional integration in East Africa has accelerated and the early results look promising: a 64 per cent increase in intra-‐regional trade since 2003 (Trademark East Africa website); launch of the customs union and single customs management legislation in 2004-‐5; signing of the Common Market Protocol in November 2009. Regional economic integration is understood to be a key factor in the growth trajectory of Uganda, very notably for the agriculture sector and for employment creation: harmonization within EAC makes Uganda an easier source of supply for structurally deficit areas such as Kenya.89
542. The Government of Uganda could specifically and proactively develop the regional grain market to ensure a sustainable market for Uganda’s surplus grain. This cannot be achieved without the support and cooperation of the Kenyan and Tanzanian Governments and the traders and producers of those countries. The prize will be improved trade & food security within the region and cheaper grain during the shortage periods compared to imports. A major step in this direction is harmonizing quality and trade standards and this will involve lobbying regionally for policy harmonization and tariff reduction. 543. As for NTBs specifically, they are very costly to Uganda. GoU needs to commit to ensuring it, and other member countries, harmonize trade regulations and streamline administrative procedures at border points. It should take a regional approach to removing NTBs, since they are similar across the member countries and across commodities. GoU also needs to design and implement efficient monitoring systems to provide feedback on the process and improve the road network to reduce high transportation costs.
544. Since the new DSIP was approved in 2010, there have been some discussions about implementing it and even (as per the document) of re-‐configuring MAAIF as a modern service-‐oriented ministry and of reorganizing the budget to fit the plan. These have become stuck once more in the bureaucracy, even though there are vocal proponents within the system. Consequently, the DSIP remains unimplemented and the ministry debilitated by indecision. It is essential to the wellbeing of the maize industry (and of the wider agriculture sector) that progress 89 Major themes in this regard are: improvement of efficiencies and effectiveness of cross-border processing at the border posts; the removal of NTBs by relevant organizations; the improvement of the regulatory and tax environment for businesses; capacity building in the ministry responsible for the integration agenda, the Ministry of EAC Affairs; institutional strengthening of private sector and civil society actors.
155
is made on this. Encouragingly, MAAIF has now put together a “Process Action Plan for Operationalization of the Non-‐ATAAS component of the DSIP”90 but, less encouragingly, it is already well behind schedule. Referring to capacity problems at MAAIF, one GoU source said “planning in MAAIF is getting weaker every day” although there are many people in MAAIF who want to see the organization perform its mandate better. The dilemma for the donors is how to assist them. Support to the non-‐ATAAS component is the current vehicle of choice.
545. Until 2007, a multi-‐sectoral SPS Committee met regularly to coordinate and discuss issues related to the implementation of the SPS Agreements at national level. Since then, MTTI has been charged with developing a national SPS policy to protect human, animal and plant life and health and to cut through the fragmentation, duplication of efforts, disputes arising from overlapping mandates, and lack of coordination among government agencies and the private sector. Of particular concern is the apparent inability to rapidly enact new SPS legislation. How GoU is going to do this and what milestones can be expected to be passed in the next 12 months should be urgently reviewed and acted upon. The 2006 DTIS made SPS recommendations which have largely not been enacted and some of which are still pertinent for the maize industry:
• Adopt needed measures (investments, advisory services, field testing) to minimize the risk of mycotoxin
contamination; • Develop a laboratory plan that rationalizes existing capacities, more clearly defines institutional roles,
and enables collaborative networking; • Complete analysis and consultations needed to finally enact several important pieces of pending
legislation; and • More explicitly incorporate SPS management considerations, priorities, and responsibilities in on-‐going
efforts to develop sub-‐sectoral development strategies.
546. GoU’s food security policy is a de facto reliance on WFP to feed its people. This is not a basis for the future. GoU should be persuaded to make a commitment to withdraw from using food aid as its primary food security measure. Thereafter a full Food Security Policy should be prepared.
547. Legislation on GMOs has been pending for some time but never seems to get beyond the pending status. The Plant Variety Protection Bill and The Plant Protection and Health Bill have been before Parliament for two years and policies on National Biotechnology and Biosafety and on Plant Genetic Resources have been under development for even longer. The status of this process and of the debate itself is very far from clear and needs to be elucidated and resolved as soon as possible. Both GoU and private industry have a responsibility to pursue this.
Institutional reforms
548. Several agricultural sector institutions are in need for energetic reform. The absence of a regulatory framework has negative implications on productivity, quality, and competitiveness of Uganda’s maize industry. The Government “should establish an independent non-‐governmental body, given statutory powers, that will protect all players and harmonize activities of the maize sector. It should be dynamic with horizontal, vertical, fast-‐track and in-‐depth linkages and operations. It should be transparent, flexible, non-‐discriminatory and provide equitable legal security for companies trying to introduce new products and services to the market” (Kiiza/Oxfam, 2008). Among other things, it will be “vetting and recommending input suppliers to ensure that quality inputs are used by farmers’ and meeting ‘with key buyers to set indicative price floors before the start of the season and ensure that the prices are enforced.” At the same time it will ‘ensure collective action among maize farmers to benefit from advisory services, credit support and collective marketing among other benefits.’ This suggests enormous faith in the public process, but a faith which is shared by many people in the public sector (although not many too elsewhere). Like several of the other maize industry reports (see Introduction) it seems somewhat lacking in curiosity as to what happened to the previous twenty maize industry reports. It also seems to require more ‘enforcing’ than is acceptable these days or than MAAIF has been able to do up to now. Perhaps it shows how far away many players in the industry are from each other. On the other hand perhaps it does suggest a way as to how the maize platform might develop a consensus on the way forward.
90 MAAIF has prepared TOR for the 12 task teams and recruiting has begun: “to facilitate the development of framework implementation plans for the non-ATAAS component” (March 2012).
156
549. MAAIF is at the top of the list of institutions where reform is urgent. At her speech to the CAADP roundtable in April 2010, the then Minister for Agriculture said “An important development for the next financial year will be significant institutional strengthening in MAAIF. Three sub-‐programmes will be implemented under DSIP involving (i) Strengthening and re-‐equipping MAAIF and related agencies; (ii) Relocating MAAIF HQ to Kampala, and; (iii) Improving the productivity of sector personnel. MAAIF has already accepted a new macro structure which is to be submitted to the Ministry of Public Service.” Two years later, as of July 2012, the only progress on this agenda was that some of the ministry staff had moved to Kampala (although the press has been reporting dissent in the ranks and moves were afoot to move back – New Vision, 21/6/12).
550. Plans to reform MAAIF have been piling up. The restructuring plan in the DSIP was done inclusively, was technically sound, seemed to be acceptable to management and was passed by Cabinet yet it has proved impossible to enact. As far as the maize industry is concerned one can go probably do no better than echo Booth (2011): “it is real policy that counts, not nominal policy. Policy is what policy does”. Among the specific reforms promised under DSIP were a “systematic process that can generate information on the profitability of enterprises on a continuous basis. Specific activities to be implemented included: (i) Review current work on the analysis of profitability of agricultural enterprises covering all major crop, livestock, and fish enterprises along their value chains; (ii) Build capacity across MAAIF, notably in the Agribusiness Unit in the Agricultural Planning Department; (iii) Design a system for assessing enterprise profitability, starting with the key enterprises.” This could go a long way to providing the authoritative farm management and gross margin analyses necessary for small farmers to commercialize. Perhaps some progress will be made under the support to the Non-‐ATAAS projects and certainly the initiative should be supported.
551. The important role of the National Seed Certification Service has been discussed in Section 2. For seven years, between, 2000 and 2007, Danida’s ASPS1&2 programmes supported MAAIF to improve its seed quality assurance systems. However, despite much work, the initiative came in the end to nothing and international accreditation was not achieved (Kiiza 2008). NSCS staff did understand that it needed to work with stakeholders, such as local leaders, extension staff, Uganda Seed Trade Association (USTA) and UNBS to ensure that all the steps in the chain (from the farms, to packaging, transportation and storage in the seed stockists’ premises) were well coordinated. It also understood that this required effective surveillance and enforcement capacity as well as good cooperation from UNBS. However these functions were never prioritized in the budget or in any of the (largely un-‐implemented) action plans of the time. The importance of the NSCS has not diminished but clearly it needs adequate human and financial capital to begin its task. If the political will was there, the return might be considerable. The Netherlands Embassy is considering trying this one again.
552. Some have argued that fixing NSCS is too difficult and too expensive. If this is judged to be so, let the industry start with self-‐regulation, a voluntary code to be subscribed to, or opted into, and policed by the key seed companies. It can be argued that much of the damage to physical seed quality happens after the seed has been sold to dealers (poor and too hot transport, poor storage, adulteration, etc.) and that self-‐regulation will not work without an operational government watchdog function. It is also argued that the Uganda Seed Trade Association (USTA) already has a code of good practice and that its sanctions are toothless because government refuses to strengthen the regulatory machinery, that is self-‐regulation will only work if and when the markets are functioning better. However, surely in the absence of action from NSCS, this would at least be a start and might get the process moving.
553. There is a huge gap where the functioning extension service and technical advisory services should be. Farmers do not receive adequate guidance and advice and therefore have not had a chance of changing their farming methods. This has been a large factor in the consistently low yields year on year. There is little prospect of this changing in the medium term. Even in the early years when it was beginning to get up and running, NAADS extension activities did not include advice on cross cutting issues like soil fertility improvement and natural resource conservation. These are urgent considerations and ideally there should be plans to begin to address them.
554. As stated in Section 1, there are no reliable statistics on Uganda’s maize industry. This is well known in the industry, in UBOS and among donors. It is of high priority but is not reflected in their various budgets. At the very least the status of the 2009 UCA should be clarified and it is utility clarified.
157
555. As far as the commodity exchange goes, UCE must be the driver of its own future. If it is to reach sustainability it must immediately make a work plan that is acceptable to the stakeholders and the wider industry and which can draw in a range of support. The vision needs to emphasize transparency, the capacity to price set, and the wider benefits from associating with a regional commodity exchange. It also needs to bring all the stakeholders in. UCE must then build a consensus around this and around what is to done.
556. UCE needs to clarify its long term role. Currently it exists to run a trading floor (which it has yet to really do), to promote warehousing generally and to regulate the warehouse industry. The former are commercial functions while the latter is a public service. The extent to which there may be conflicts between these roles (between regulating warehouses and between running the trading floor and regulating its clients) has to be spelled out so that UCE can optimize the use of its time and resources. UCE has to become more commercial and the first step has to be to develop a much more aggressive strategy and business plan to become self-‐financing. The political economy environment tends to steer plans and investments into the public sector framework but donors need to think their way through this. The inherent contradictions of the current institutional set up (a commercial operation embedded in a GoU ministry) will become apparent as the business plan is prepared and then implemented. It will need vision and courage for the stakeholders to address the matter.
557. If UCE intends to prioritize the trading floor, it will be necessary to get WFP to commit fully to buying through the CE. Unless one can get WFP, and then, following them, other large end users (schools, the police force, the army, prisons, Kakira Sugar Ltd etc.) and traders, to engage, it will not be attractive for the smaller players. WFP seems to be about to make a start trading on the floor. Once it and other buyers are using the floor, they can be levied and some valuable revenue generated.
558. There needs to be a much more thorough analysis of the market: how it works, who the companies and traders are, how many and what size are the viable farmers groups, what are the incentives of the stakeholders, how can the traders be brought in, what do they want from the exchange, how much crosses the border and in what quality, who is the final consumer of which grades, what drives institutional demand? UCE has to do this concurrently, or even before, the business plan. This report, which has reviewed all the existing literature, can be the beginning of such an analysis and plan.
559. A strategic decision is needed about UCE’s approach to licensing. Currently, UCE management is focused on the promotion of new licensed warehouses in the grains sector. While this sector has developmental importance, and speculative storage may prove attractive in a period of regional grain shortage, some observers believe it is unlikely to provide the licensing or trading revenues needed to assure the financial viability of UCE. Achieving this goal might therefore require UCE to adopt a broader remit, licensing existing warehousing operations for export and import/transit commodities.
560. UCE must develop and promote a sustainable business model for warehousing that can be used to assist warehouses to run as genuinely commercial entities. There needs to be some caution about throwing grants at promising recipients who, without commercial skill, without understanding of the need for proper maintenance, management and capital depreciation, risk being undermined rather than supported.
561. All parties need to investigate the prospects for forward contracting and WFP can take the lead on this. Forward trading by WFP will help traders secure finance, and at less cost than at present. Of course, WFP will not always be in this position in the market. The UCE plan needs to get ready for a time when the market will function without WFP.
Investments
562. In addition to institutional reforms, there are two areas where government investment could be considered:
563. First, it should conduct a study of the Sudan Market. A major outlet for Uganda’s maize is South Sudan and despite the problems there, this is likely to remain so for some time. However, the sources and sustainability of the cash flows underpinning this demand are unknown by producers, traders and processors and the possibility of interruptions in that demand is high. The industry in Uganda needs good consolidated intelligence vis-‐à-‐vis the opportunities and risks in South Sudan and GoU should pursue this, if necessary with donor support. There needs

158
to be much more information about who the buyers, regulators, processors and retailers are in South Sudan and then a concerted effort to formalize relations with these key players. GoU can also assist in improving the predictability of the trading environment and the industry can then approach donors for help with activities like the development of structured trade financing strategies whereby credit can be mobilized in Uganda, delivery made to Sudan and settlement made through banks thus reducing cash transit risks. Other useful services include the development of effective price and volume information and the dissemination of this information among value chain actors.
564. Some informed sources in the industry believe in the need for a strategic grain reserve operating as a buyer of last resort during glut seasons. This would take out price peaks and troughs in the cycle and prevent farmers losing confidence in the crop when prices fall. It would also help damp down food price inflation. Obviously this would have to be very carefully managed and Kiiza (2008) suggests the state should intervene with initial capitalization subsidies. This is the difficult bit. There may be a strong economic case for a buffer stock but the history of strategic grain reserves is chequered (see Box below) and there needs to be more considered debate. The Maize Platform would be the place to do this.
Box 8: Buffer Stocks: the Jinja complex
In the mid-‐1980s, Danida paid for three turn-‐key, industrial-‐scale grain silos in Jinja, Kyazanga and Kawempe. As the 1993 evaluation showed, there were many problems, starting with the selection of the contractor, the lack of construction supervision and the choice of bulk handling equipment. But, most pertinent, for this example, was the fact that that the energy costs of grain drying far exceeded the returns (not least because the Jinja complex had been built in a swamp). The situation would have rendered Danida’s investment non-‐viable, even without the bungled planning and construction. To this day, the huge silos, by far the largest Danida investment of the period, sit uneconomic and underutilized. Nonetheless they were regarded as such as a compelling symbol of the potency of bilateral aid at that time that the facilities at Kawempe were immortalized on Uganda’s one thousand shilling bank note while a proud President Museveni brought Nelson Mandela to the Jinja complex to see this example of good development aid while the latter was on a State visit in 1993.
Source: Danida (2006)
159
Recommendations from the first DTIS 2006
565. The first DTIS made two recommendations in relation to maize specifically. These were: • Evaluate and apply quick and inexpensive screening tests for aflatoxin that can be used at collection
centers and storage warehouses. Agencies to implement were NARO, WFP, Maize Traders. • Intensify efforts to improve post-‐harvest drying/management of maize through training and investments
in suitable facilities. Agencies to implement were NARO, NAADS, WFP, Maize Traders. 566. The new Maize Platform needs to be an ongoing, proactive forum for developing consensus on actions for the industry. It needs to include all the relevant private and public sector stakeholders but to be industry focused, with industry leadership, free from political interventions (otherwise the industry will not usefully contribute or even attend) but with GoU encouragement and backing. It needs to dialogue over maize issues covering constraints and opportunities including food security in the country and region. It needs to be able to make plans and suggest policy recommendations. Its plans should not be a list of desired investment as per many earlier plans but be based on prioritization with notions of costs and returns to different investment paths. The Maize Platform can be constituted with the authority to develop this consensus and to make the plan91. The process of doing this will, among other things, require reviewing progress on the DTIS (see entry above).
567. The agenda for the early days of the Maize platform should include: attending to the basics as a priority (looking for commercially sustainable solutions not quick fixes); emphasizing the gains to be made from government acting as an efficient regulator (and the costs of continuing not to be so); the potential for the regulatory services to be run on more business like lines (user-‐pays, retention of income by the regulatory unit, etc.) albeit this requires administrative integrity, process leadership, consistency and management; the need to reduce transport and energy costs; the importance of WFP’s role in the market and how this can best be utilized to improve market operations; the considerable potential of better financial services (incl. insurance); the need to attend to, and better institutionalize, training, information and knowledge sharing.
568. The uncertain state of market information has already been discussed and is a perennial topic in these kinds of recommendations. The maize platform should form a view about the current state of provision and about the degree of priority there is in intervening to improve it.
569. At least there needs to be a resolution of the long running anomalies between UBOS figures and those of the industry. The existing provision has made a useful contribution but there needs to be further exploration of the role that government can play and of the extent to which private interests can maintain a useful system with and without donor support. Plans have existed in the past to have one person at LC1 level, trained, equipped and facilitated with information at LC3, and district levels. The DSIP assumes much of this will be funded by the public sector and implemented by MAAIF, NAADS and local governments but the extent to which this is actually feasible and/or workable has to be rigorously revisited.
570. Good market information is of course a precondition of a functioning commodity exchange and, at some stage, an effort has to be made to bring together the various initiatives already underway into something that is truly sector wide, informative, reliable, valued by users and sustainable.
571. Publicize the import parity price of maize based on the FOB Nairobi price. To a large extent, this price is determined by the Chicago Board of Trade which is a highly liquid maize market with well-‐developed futures allowing trends to be easily understood. Taking this price, converting it to Ugandan Shillings and adding the basic costs (transport cost per mt from the local market to Nairobi) will give a very good estimate of where the market should be. This information could be offered by FIT Uganda, UCE, RATIN or any other organization and is easy to collect and calculate. 572. One way of reducing maize farmers’ exposure to price risk is the use of contracts where fixed-‐price forward sales are made. These contracts if formal and legally binding would enable maize farmers to lock-‐in a price for their production in advance. Fixed-‐price forward sales effectively eliminate the risk of price volatility
91 The coffee and cotton industries offer some lessons from which to learn.
160
because farmers can estimate roughly what their incomes are likely to be in advance. Farmers may miss the opportunity for higher prices than those in the contract but they can manage their farm enterprises effectively because there is no price uncertainty. In many cases, larger buyers will also offer contracts to guarantee supplies of a commodity of good quality, especially in niche markets.
573. For contracts to work well for both farmers and buyers, they must be legally binding with attendant penalties for both sides and a clearly defined formula for the price band. Of course, contracts will only work in an environment of strong judicial systems where enforcement in the courts can be done. In the meantime farmers’ organizations could co-‐ordinate and empower their members to act as watchdogs for contractual arrangements with maize buyers.
574. Even in the case of WFP, if it was to purchase on the basis of forward contracts it would be far easier than a WRS scheme and more in step with the market realities in Uganda. WFP could agree to purchase by contract from an FO; the FO would assign the contract to the bank; the bank would lend small amounts of purchasing credit to the FO; the FO would buy, clean, dry and bulk the maize; WFP will pick up the maize and pay the bank; the bank will deduct its loan payment, rebate any balance to the FO and release further buying credit. Such an arrangement reduces FO costs by 80 per cent versus warehouse receipts traded through an exchange (Pelrine, 2009). Financing can be offered in US Dollars at very low interest rates because purchasing credit is short term and foreign exchange risk is minimal. Pelrine suggests some minimum technical support be offered to formalize the effort for forward contracting with consultation between WFP, bankers and farmers organizations. Further support could be programmed for marketing the concept to FOs.
575. The government of Uganda should Promote Collective Action in the Industry. In theory, collective action has multiple benefits for farmers. These include (i) access to better services leading to better prices; (ii) creation of opportunities for entering into contracts with better and reliable buyers, such as agro-‐processing firms; (iii) improved storage and quality of maize supplied by use of collective large-‐capacity facilities; (v) improved access to rural financial services from microfinance organizations; (vi) development of social capital and increased power in the market. However, despite years of donor support to different collective action strategies, very little substantive, sustainable progress has been made. The extent to which the maize industry development strategy should hang on collective action groups or on a more robust commercial approach is something the Maize Platform should develop a view on, with all its implications. Both paths have benefits and they need to be better understood.
576. If it is decided to persist with the focus on FOs, as per WFP’s P4P strategy, questions need to be asked (again) about the entry points into the sustainable strengthening of FOs. What does their long history of underachievement mean for planners who wish to anchor productivity and market improvement reforms around collective farmer action? And in the absence of progress with land tenure reforms, what alternative farmer support strategies realistically exist?
577. The Government of Uganda should also develop one or two out-‐grower schemes on a commercial basis. This implies: selecting appropriate geographical areas (Masindi and Kapchorwa would be easy but other less advanced areas could be considered such as Mubende and Hoima); investigating and assuring the feasibility of growing, bulking and transporting economic volumes of maize92; developing and agreeing with buyers and farmers, terms and conditions that will create favorable incentives to perform and will put in place stiff and enforceable penalties for non-‐performance; developing a management mechanism to facilitate input supply, extension advice, regularly moving information between buyers and sellers, transport and logistics; and handholding the effort through a pilot phase.
578. It should work with regional private sector processors to purchase from FOs on a contract basis (that is without a fully developed out-‐grower scheme). To realize this goal, technical assistance must first properly scope out the effective regional milling demand (not with national statistics but based on actual relationships with actual millers) and develop pilot forward contracts, financed through regional banks. By facilitating one-‐to-‐one relationships between processors and growers, high efficiencies can be achieved in the maize value chains and these efficiencies will result in more reliable supplies and ultimately in lower priced food for consumers.
92 Clearly, actual or potential production measurable in thousands of metric tons within a limited geography is a prerequisite.
161
579. It should encourage fertilizer use. The question is whether there is scope for efficient intervention in the fertilizer market that would reduce prices to farmers and increase net margins to traders and the Maize Platform needs to look at this. Drew (pers. comm.) thinks appropriately structured finance could be provided for farmers in a manner similar to the warehouse receipts system. Pelrine (2009) thinks a temporary fertilizer subsidy can be justified. In summary, he suggests that because, even at high prices, fertilizer pays, there is a case for a one-‐off support to permanently ratchet up demand. His idea is that when the farmer delivers the maize, he will be paid the current market price in both cash and fertilizer (or a negotiable voucher). This, in essence, is a forced savings product ensuring that the farmer will have fertilizer for the subsequent season. If the farmer chooses, he can sell his fertilizer (though he will be ‘educated’ not to do so). Even if the fertilizer is sold, it will ensure that the fertilizer has been imported (increasing overall volumes and lowering average costs) and remains in the market place for other farmers to use (possibly even at a discount).
580. Historically, similar schemes have failed because the buyers deduct the cost of the fertilizer from the deliveries of maize and thus create a perfect incentive for the maize producer to sell his maize elsewhere and avoid the deduction. What is being recommended here is that in the first season the farmer receives fertilizer in advance of planting for a nominal cost or for free. When the farmer delivers, costs are not deducted but rather he receives payment in kind.
581. It should encourage the honoring of contracts. Uganda is plagued by a persistent failure to honor contracts. Buyers and sellers are equally guilty. In spite of these facts, contracts have been honored when they have been clearly understood and fast, alternative enforcement mechanisms have been established. Such mechanisms must be pursued further with the interested parties themselves (rather than developed elsewhere and explained to them). Arbitration mechanisms can include: buyers and sellers investing collateral to be held by a third party; buyers and sellers agreeing to third party arbitrators (including community and religious leaders, civil society organization representatives, etc.); inclusion of commercial insurers to issue performance bonds; and buyers and sellers agreeing terms and conditions carefully for defining reasons for non-‐performance. 582. Practically, steps forward could include identifying high potential suppliers; agreeing in principle with buyers and other service providers to contract with the growers; holding joint meetings to discuss agreeable contract terms; working with the communities where the growers are located to identify and prioritize ways and means to enforce contract performance.
583. The Government should expand Availability of Value Chain Finance. A recent LEAD enquiry (pers. comm.) of a sample of banks showed the usual risk aversion patterns: (i) banks lack confidence in warehouse operations; (ii) some banks do not have confidence in the capacity of some warehouse owner/operators to provide adequate assurances as to either the quality and/or security of the stocks used as collateral; (iii) some banks are averse to the risk of prices falling below appraised values of stocks and would prefer to lend under a credit guarantee scheme; (iv) some banks are reluctant to lend against receipts (and also, with the volumes of warehouse receipts being as limited as they are, unwilling to invest in their own internal capacity).
584. However, there have been a variety of successful lending schemes in the past. The Rockefeller Foundation had an efficacious credit guarantee intervention where dealers registered as silver, gold or platinum according to capitalization and demonstrated capacity and then received increasing levels of credit guarantee along with skills development and training. Schemes like this could be developed again. The finance should always be via a bank, of course and, it seems, the aBi Trust will be pursuing this in its next phase.
585. Some farmers interviewed in Kapchorwa, Masindi and Mubende have achieved large scale and should be qualified to borrow for large assets such as tractors either through leases or term loans. It is assumed that, if a farmer wants to finance a tractor and has the normal prerequisites the banks need, there is no real shortage of finance for him. Several banks offer lease arrangements. However, the cost of lending is problematic, as for all agri-‐lending. The costs of running tractors is of course itself problematic (operator skills are thin on the ground, maintenance support is poor, land holdings are small and atomized, and opening new land is very tough on the equipment). These larger borrowers would benefit from being ‘introduced’ to lenders such as Stanbic Bank to pursue this opportunity.
586. Some smaller semi-‐commercial farmers are performing strongly enough to justify production finance as currently offered by Centenary Bank and Equity Bank. These farmers should be helped to get ready and the
162
lender needs to be trained in product development services and outreach grants to extend their operations to service these borrowers.
587. As for other actors along the value chain, subsistence farmers are the most, risk averse under-‐capitalized group of all. They cannot be the main actors in the process but they can usefully be supported with appropriate savings mechanisms (VSLAs for the smallest, SACCOs and MDIs for the larger ones) so that they can save up to eventually achieve the level of investment necessary to commercialize. Having a savings product at harvest for the coming season’s inputs and labour needs is probably a very good way to begin.
588. Most millers run a high turnover, profitable business and a savings product is probably what they need. Such a product could be paid into monthly for the amortization period so that the client can simply buy a new machine as the existing one is exhausted. 589. Finally, the Government should work to expand the Role of Advocacy. Much of the dysfunctionality of the maize market is exacerbated by a weak public sector and policy environment: in Uganda, in its neighbours and among the regional economies. Clearly, for value chain actors to function well, they must communicate with the political-‐economic context they exist within. It is therefore recommended that, rather than donors leading in this dialogue, facilitation be provided to producers, processors and transporters to lobby policymakers on troubling policy issues. These include many of the issues discussed in this report. Support could be provided, on a reducing subsidy basis, for trade organizations to form and deliver direct engagement with the government, commission policy white papers; and use mass media to state their positions.
163
References
Akerlof, G. (1970). “The Market for ‘Lemons’: Quality Uncertainty and the Market Mechanism.” Quarterly Journal of Economics, Vol. 84.
APEC-‐OECD (2005). “APEC-‐OECD Integrated Checklist on Regulatory Reform: A Policy Instrument for Regulatory Quality, Competition Policy and Market Openness,” Accessed at http://www.oecd.org/dataoecd/41/9/34989455.pdf
ASEAN (2004). “ASEAN Mutual Recognition Arrangement Framework on Accountancy Services,” Accessed at http://vacpa.org.vn/upload/infodoc/mraaccountancy(feb09).pdf.
ASEAN (2005). “ASEAN Mutual Recognition Arrangement on Engineering Services,” Accessed at http://www.thaifta.com/trade/ascorner/asser_11.pdf.
ASEAN (2007). “ASEAN Mutual Recognition Arrangement on Architectural Services,” Accessed at http://www.aseanarchitectcouncil.org/pdf/amra.pdf.
Borchert, I., B. Gootiiz and A. Mattoo (2009). “Policy Barriers To International Trade in Services: New Empirical Evidence”, Policy Research Working Paper 4917, Washington D.C.: The World Bank.
Commonwealth Secretariat and the Uganda Export Promotion Board (2012). Guide to Studying in Uganda.
Conway, P. and G. Nicoletti (2006). “Product Market Regulation in the Non-‐Manufacturing Sectors of OECD Countries: Measurement and Highlights”, OECD Economics Department Working Papers No. 530.
Boysen, Ole, and A. Matthews (2009). “The Economic Partnership Agreement between Uganda and the EU: Trade and Poverty Impacts”; Dublin: IIES Discussion paper 307.
Brenton, Paul; O. Cadot and D. Pierola (2012). Surviving: Pathways to African export sustainability; Washington, D.C.: The World Bank, Trade Division Report.
Carrère, Céline (2006). “Revisiting the effects of regional trade agreements on trade flows with proper specification of the gravity model”; European Economic Review 50, 223-‐247.
Cape Consult (2010). Integrated Program on Corridor Development in East Africa (Border Audits) Final Report, for JICA.
World Bank (2010). UGANDA: Assessment of Trade and Transport Corridors Serving Uganda, September 29, 2010.
Deloitte (2012). Guide to fiscal information—Key economies of Africa; Deloitte Touche Tohmatsu Ltd.
EAC (2006). EAC Mechanism for the elimination of non-‐tariff barriers ; Arusha, Tanzania : EAC Secretariat.
Hartmann (2012). “Border crossing delays monitoring along the Northern Corridor”; SSATP.
International Monetary Fund (2013). Uganda: Fifth Review Under the Policy Support Instrument and Request For Program extension; Country Report No. 13/25; Washington D.C.
— (2012). Uganda: Fourth Review Under the Policy Support Instrument and Request For Modification of Assessment Criteria; Country Report No. 12/135; Washington D.C.
Inter-‐University Council for East Africa (2011). “Rolling Strategic Plan 2011/12-‐ 2015/16”.
Jensen, Michael, and J. Keyser (forthcoming). “Standards Harmonization and Trade: The Case of the East African Dairy Industry”; in O. Cadot and M. Malouche, eds., Non-‐tariff measures: A fresh look at trade policy’s new frontier; London/Washington, D.C.: CEPR/The World Bank.
Kirk, Robert (2010). “Addressing Trade Restrictive Non-‐Tariff Measures on Goods Trade in the East African Community”; Washington, D.C.: The World Bank, Africa Trade Policy Note #7.
Nathan Associates (2010). Definition and Investment Strategy for a Core Strategic Transport Network for Eastern and Southern Africa: Corridor Review Report, World Bank.
Okomu, Luke, and J.C. O. Nyankori (2010). “Non-‐Tariff Barriers In EAC Customs Union: Implications For Trade Between Uganda And Other EAC Countries”; Economic Policy Research Center Research Series #75.
164
PASI The Paralegal Advisory Service Institute (2007). “Changing the Landscape,” Evaluation Report March 2007, Lilongwe, Malawi.
Posner, R. (1974).” Theories of Economic Regulation.” Bell Journal of Economics and Management Science, Vol. 5.
OECD (1997). “The OECD Report on Regulatory Reform: Synthesis,” Paris: OECD.
Shihotori, Miho; B. Tumurchudur and O. Cadot (2008). “Revealed Factor Intensity Indices At The Product Level”; Geneva: UNCTAD, Policy Issues In International Trade And Commodities Study Series No. 44.
Stigler, G. (1971). ”The Theory of Economic Regulation.” Bell Journal of Economics and Management Science, Vol. 2.
Trade Mark East Africa (2012). Mechanism to enable professional services participate in regional integration; Kampala: draft report.
Trolliet, C. and J. Hegarty (2003). “Regulatory Reform and Trade Liberalization in Accountancy Services”, in Domestic Regulation & Services Trade Liberalization edited by Mattoo, A. and P. Sauve, World Bank and Oxford University Press, 2003.
Uganda (2007). The Uganda national export strategy, 2008-‐2012; Kampala: Ministry of Tourism, Trade and Industry, 2007.
Uganda Bureau of Statistics (2012). 2012 Statistical Abstract, UBOS, Kampala.
Uganda Ministry of Trade and Industry (2007). “The Uganda National Export Strategy 2008-‐2012”.
Uganda Revenue Authority (2010). “Integrity Enhancement Project (IEP): Closure Report”; URA.
— (2011a). “Managing Compliance to Finance the National Development Plan: Managing Compliance Programme (MCP) 2011/12 to 2014/15”; URA.
— (2011b). “Annual report 2010/2011”; URA.
World Bank (2006). Uganda DTIS; Washington, D.C: The World Bank.
— (2008a). Non-‐tariff measures on goods trade in the East African Community; Report # 45708-‐AFR, Washington, D.C.: The World Bank.
— (2008b). “Report on the Observance of Standards and Codes: Uganda.” Washington DC: The World Bank.
— (2010a). Reform and Regional Integration of Professional Services in East Africa: Time for Action. Washington, DC: World Bank.
— (2011). Harnessing Regional Integration for Trade and Growth in Southern Africa. Washington, DC: World Bank.
— (2010b). Africa’s Trade in Services and Economic Partnership Agreements, Washington, DC: World Bank.
— (2010c). Uganda CAS. Kampala, Uganda: The World Bank.
— (2012a). Burundi DTIS update; Washington, D.C: The World Bank.
— (2012) Report on the Implementation of the Accountancy Professional Mutual Recognition Agreement in the East African Community, forthcoming 2012
World Bank/IFC (2011), Regulatory Capacity Review: East African Community; EAC Investment Climate Program. Washington DC: The World Bank.
World Economic Forum (2012). Global Competitiveness Report 2012. Geneva.
De Wulf, Luc (2005). “Human Resources and Organizational Issues in Customs”; in Customs Modernization Handbook, 31-‐50; World Bank.
Yoshino, Yutaka; G. Ngungi and E. Asebe (2011). “Enhancing the Recent Growth of Cross-‐Border Trade Between South Sudan and Uganda”; World Bank Africa Trade Policy Note 21; Washington, DC: The World Bank.


MINISTRY OF TRADE, INDUSTRY & COOPERATIVES
3rd - 6th Floor, Farmers House Plot 6/8, Parliamentary AvenueP.O. Box 7103, Kampala-UGANDA.
Tel: +256 414 314 000 • +256 414 314 268 Fax: +256 414 341 247Email: [email protected] • www.mtic.go.ug
Uganda Diagnostic Trade Integration Study (DTIS) Update
Trade for LDC Development
Ministry of Trade,Industry and Co-operatives
The World Bank
UG
AN
DA D
IAG
NO
STIC TR
AD
E INTEG
RATIO
N STU
DY (D
TIS) UPD
ATE