Embed Size (px)
Citation preview
MINNESOTA CLIMATE AND HEALTH PROFILE REPORT 2015
Minnesota Department of HealthMINNESOTA CLIMATE & HEALTH PROGRAM, ENVIRONMENTAL IMPACTS ANALYSIS UNIT
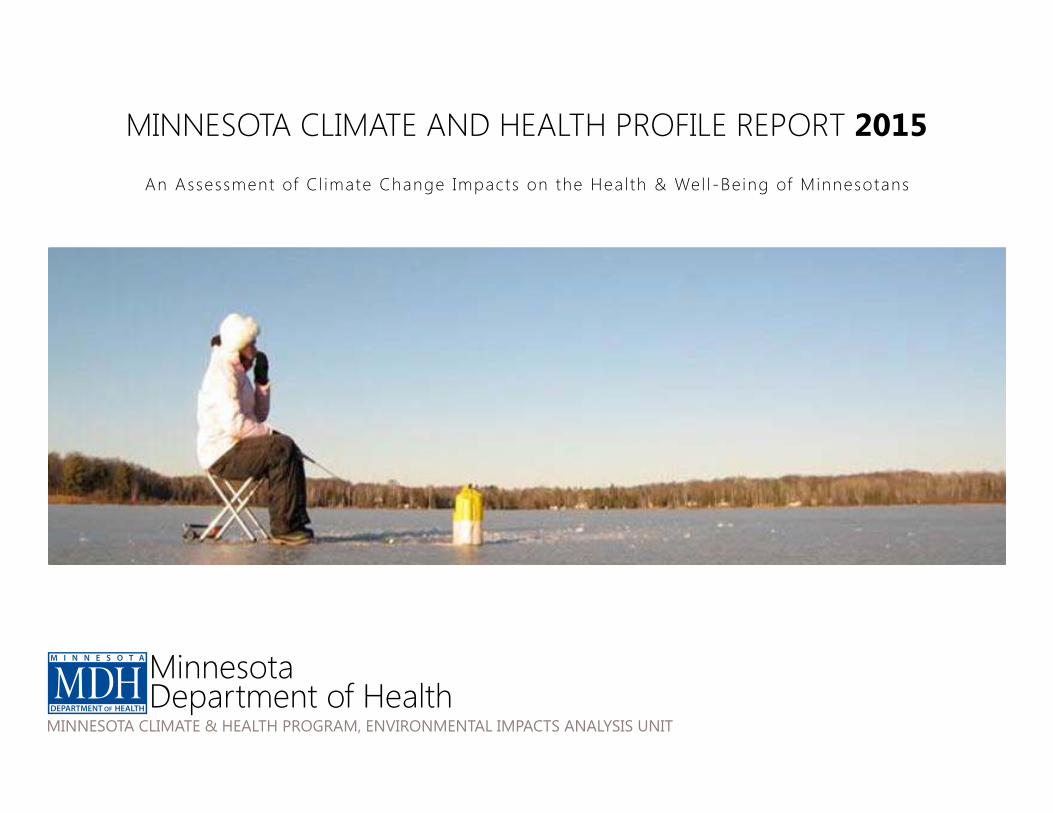
An Assessment of Cl imate Change Impacts on the Heal th & Wel l-Being of Minnesotans
M I N N E S O T A C L I M A T E A N D H E A L T H P R O F I L E R E P O R T
For more information or to obtain additional copies of this report: Minnesota Department of Health Minnesota Climate & Health Program Environmental Impacts Analysis Unit625 Robert Street North PO Box 64975 St. Paul, MN 55164-0975651-201-4899health.mn.gov/climatechange/ February 2015Suggested citation:Minnesota Climate & Health Profile Report. Minnesota Department of Health. St. Paul, MN. February 2015. Cover photo courtesy of Wikimedia Commons.
M I N N E S O T A C L I M A T E A N D H E A L T H P R O F I L E R E P O R T
3
ContentsI Excutive Summary ...................................................................................II Introduction ..................................................................................................................4
Organization of the Report...........................................................................7III Overview of Minnesota Geography & Climate ..........................................8IV Climate Trends & Projections ..........................................................................12
Historical Trends.............................................................................................12Future Projections .........................................................................................24
V Climate Hazards & Exposure Pathways .......................................................37Air Pollution .....................................................................................................39Extreme Heat ...................................................................................................51Floods & Drought .........................................................................................59Ecosystem Threats .........................................................................................77
VI Conclusion .................................................................................................................91VII References ................................................................................................................93
M I N N E S O T A C L I M A T E A N D H E A L T H P R O F I L E R E P O R T
4
The following hazard-impact pathways are described in detail:
▪ Air pollution (ozone, particulate matter, pollen) ▪ Direct health impacts: chronic obstructive pulmonary disease, lung cancer, cardiovascular disease, allergies and asthma
▪ Extreme heat ▪ Direct health impacts: mortality, heat stress, and other conditions exacerbated by heat
▪ Indirect health impacts: infrastructure failures, strain on essential services and disruption of key social networks
▪ Floods and drought ▪ Direct health impacts: drowning and injuries, waterborne disease, and mental stress
▪ Indirect health impacts: respiratory ailments, disruption of essential services, fiscal strain, loss of livelihood, and threat to community cohesion
▪ Ecosystem threats ▪ Direct health impacts: West Nile virus, Lyme disease, harmful algal blooms
The Profile Report concludes with a brief discussion of next steps required for an effective response to the identified climate hazards. The overarching goal of providing this information is to highlight what is currently known about each climate hazard and potential health impacts, as well as data or information gaps and various system challenges that are making it difficult to advance our knowledge base and promote climate adaptation actions. It is hoped that the Profile Report will be used by public health officials, practitioners, and other stakeholders in their efforts to understand and
I Executive Summary
Changes are occurring in Minnesota’s climate with serious consequences for human health and well-being. Minnesota has become measurably warmer, particularly in the last few decades, and precipitation patterns have become more erratic, including heavier rainfall events. Climate projections for the state indicate that these trends are likely to continue well into the current century and may worsen, according to some scenarios.
The Minnesota Climate & Health Profile Report (Profile Report) provides a comprehensive assessment of climate change impacts and potential health burden for the state. In addition to describing climate trends and projections relevant to Minnesota, the Profile Report identifies how these climate changes are linked to health impacts along with opportunities and challenges for developing quantitative measures of health outcomes.
Minnesota’s continental climate is characterized by seasonal variations in temperature and precipitation. In addition, given the size and geographic diversity of the state, temperatures can vary substantially depending on location. Air pollution, extreme heat, flooding, drought, and ecosystem threats were identified as hazards most likely to occur from a changing climate that are especially relevant to Minnesotans. A central theme of the Profile Report is that climate impacts are experienced both directly and indirectly and can affect a wide spectrum of social and environmental factors that are well-recognized determinants of health. Because Minnesota’s climate varies significantly across the state, the types and scope of hazards likely to be experienced by a specific community will depend on local factors, thereby presenting a difficult challenge for planners and elected officials.
M I N N E S O T A C L I M A T E A N D H E A L T H P R O F I L E R E P O R T
5
prepare for climate change impacts on the health of individuals within their own communities.
ACKNOWLEDGEMENTSThe Profile Report was funded through a cooperative agreement with MDH from the Centers for Disease Control and Prevention (CDC) Building Resilience Against Climate Effects (BRACE) program (5H13EH001125-02). The BRACE framework was developed by the CDC as an approach for state and local public health departments to address climate change impacts. BRACE is a multi-step process that facilitates public health professionals, climate experts, and other agency colleagues with developing and implementing effective climate adaptation strategies specific to state and local jurisdictions.
M I N N E S O T A C L I M A T E A N D H E A L T H P R O F I L E R E P O R T
6
II Introduction
Changes occurring in Minnesota’s climate are affecting the health and well-being of the people who live, work and play within its borders. While residents are well aware of the erratic nature of Minnesota weather, extreme events have become even more frequent and precipitation patterns have become even less predictable. Already these climate changes are impacting Minnesota’s agricultural and industrial economies, natural resources, public infrastructure and population health. The risks are especially high for people who lack “climate resilience” due to age, income, residence or numerous other vulnerability factors that influence whether an individual can thrive in a changing climate.
The Minnesota (MN) Climate & Health Program has established a set of six goals outlined in a strategic plan for the Minnesota Department of Health (MDH). These goals will guide priorities and funding decisions for activities to minimize climate change impacts on the health of all Minnesotans:
Goal 1: MDH will understand, research, monitor, track, and report on the public health impacts of climate change.
Goal 2: MDH will identify and develop potential mitigation and adaptation strategies and tools to address climate change and public health.
Goal 3: MDH will identify populations that are at risk of poor health outcomes and sources.
Goal 4: MDH will enhance planning and preparedness for emergency and disaster response and recovery to effectively protect the public’s health against negative impacts associated with climate change-related disasters.
Goal 5: MDH will increase the public health system’s capacity to respond to and adapt to the public health impacts of climate change.
Goal 6: MDH will communicate and educate public health professionals, healthcare providers, state agency personnel, policy-makers, vulnerable populations and the general public on climate change’s effects on human health.
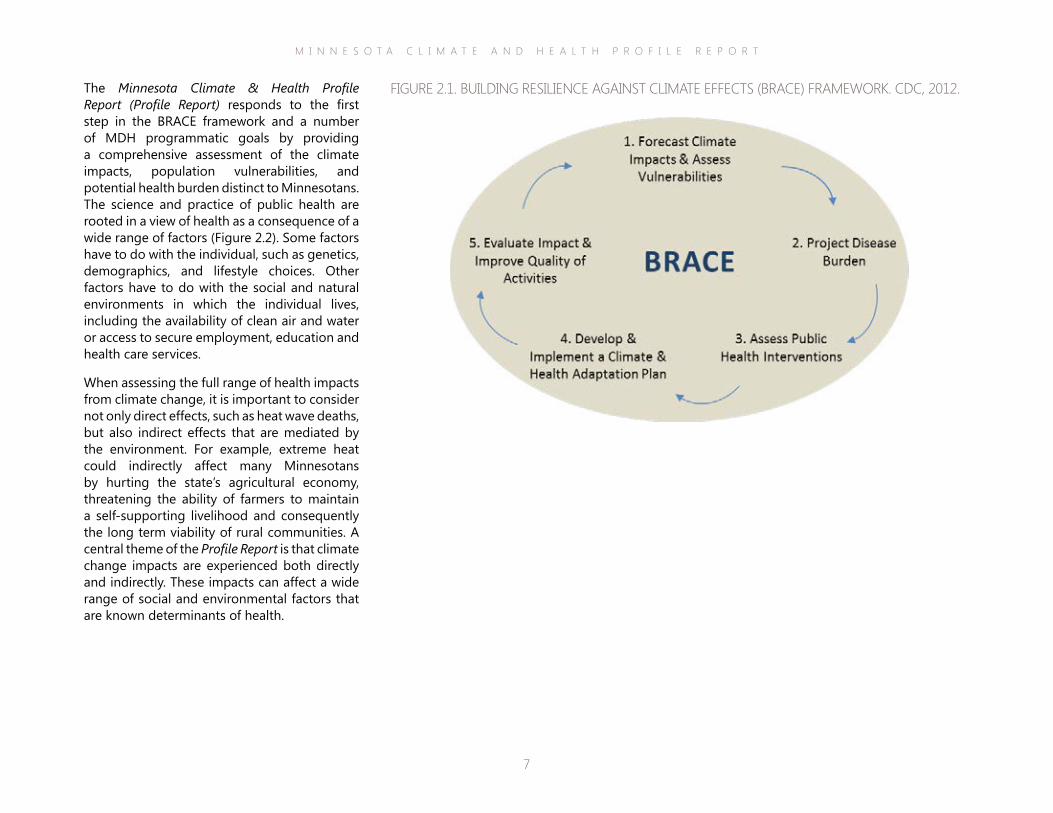
In 2010 MDH’s MN Climate & Health Program received funding from the Centers for Disease Control and Prevention (CDC) to conduct programmatic activities aimed at reducing health impacts of climate change through the Building Resilience Against Climate Effects (BRACE) framework (Figure 2.1). BRACE is a multi-step process that enables health departments to work with climate experts and other agency colleagues to incorporate the best available climate science into the development and implementation of a comprehensive climate and health adaptation strategy for their jurisdictions. The process results in lessons learned to improve future program efforts and ensure the best public health outcomes.
M I N N E S O T A C L I M A T E A N D H E A L T H P R O F I L E R E P O R T
7
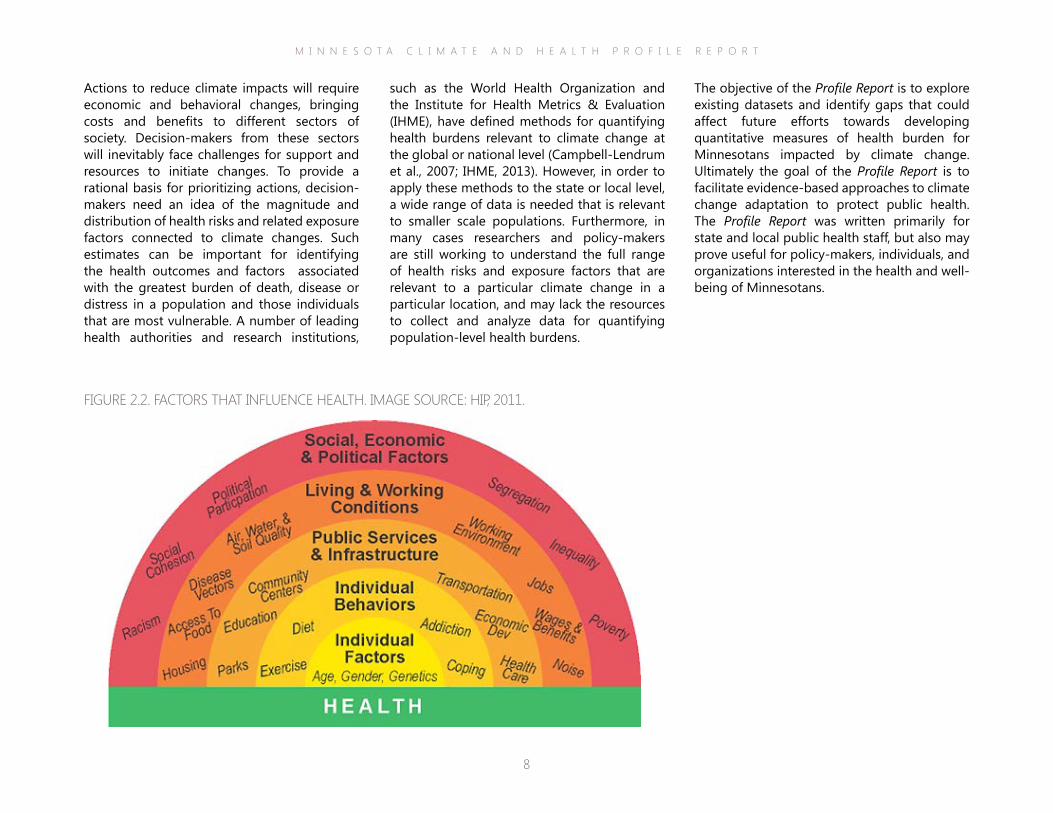
The Minnesota Climate & Health Profile Report (Profile Report) responds to the first step in the BRACE framework and a number of MDH programmatic goals by providing a comprehensive assessment of the climate impacts, population vulnerabilities, and potential health burden distinct to Minnesotans. The science and practice of public health are rooted in a view of health as a consequence of a wide range of factors (Figure 2.2). Some factors have to do with the individual, such as genetics, demographics, and lifestyle choices. Other factors have to do with the social and natural environments in which the individual lives, including the availability of clean air and water or access to secure employment, education and health care services.
When assessing the full range of health impacts from climate change, it is important to consider not only direct effects, such as heat wave deaths, but also indirect effects that are mediated by the environment. For example, extreme heat could indirectly affect many Minnesotans by hurting the state’s agricultural economy, threatening the ability of farmers to maintain a self-supporting livelihood and consequently the long term viability of rural communities. A central theme of the Profile Report is that climate change impacts are experienced both directly and indirectly. These impacts can affect a wide range of social and environmental factors that are known determinants of health.
FIGURE 2.1. BUILDING RESILIENCE AGAINST CLIMATE EFFECTS (BRACE) FRAMEWORK. CDC, 2012.
M I N N E S O T A C L I M A T E A N D H E A L T H P R O F I L E R E P O R T
8
The objective of the Profile Report is to explore existing datasets and identify gaps that could affect future efforts towards developing quantitative measures of health burden for Minnesotans impacted by climate change. Ultimately the goal of the Profile Report is to facilitate evidence-based approaches to climate change adaptation to protect public health. The Profile Report was written primarily for state and local public health staff, but also may prove useful for policy-makers, individuals, and organizations interested in the health and well-being of Minnesotans.
such as the World Health Organization and the Institute for Health Metrics & Evaluation (IHME), have defined methods for quantifying health burdens relevant to climate change at the global or national level (Campbell-Lendrum et al., 2007; IHME, 2013). However, in order to apply these methods to the state or local level, a wide range of data is needed that is relevant to smaller scale populations. Furthermore, in many cases researchers and policy-makers are still working to understand the full range of health risks and exposure factors that are relevant to a particular climate change in a particular location, and may lack the resources to collect and analyze data for quantifying population-level health burdens.
Actions to reduce climate impacts will require economic and behavioral changes, bringing costs and benefits to different sectors of society. Decision-makers from these sectors will inevitably face challenges for support and resources to initiate changes. To provide a rational basis for prioritizing actions, decision-makers need an idea of the magnitude and distribution of health risks and related exposure factors connected to climate changes. Such estimates can be important for identifying the health outcomes and factors associated with the greatest burden of death, disease or distress in a population and those individuals that are most vulnerable. A number of leading health authorities and research institutions,
FIGURE 2.2. FACTORS THAT INFLUENCE HEALTH. IMAGE SOURCE: HIP, 2011.
M I N N E S O T A C L I M A T E A N D H E A L T H P R O F I L E R E P O R T
9
The four distinct environmental changes described in Section 5 include alterations in air, weather, water and ecosystems. As a results of these changes, MDH considers the following hazards particularly compelling for the Minnesota population at this time: Air Pollution, Extreme Heat, Flood & Drought, and Ecosystem Threats.
Section 5 also includes summary tables briefly describing existing knowledge and data gaps pertaining to climate-mediated hazards, exposure pathways, and vulnerability factors that contribute to overall health risk. Vulnerability is an important factor in assessing risk given that certain demographic groups and environments are differentially impacted by climate changes. Vulnerability is a major focus for public health attention, and widely recognized as a determining factor in a person’s ability to survive and thrive in a changing climate (IPCC, 2007). MDH’s MN Climate & Health Program has conducted an extensive climate vulnerability assessment for areas of Minnesota, culminating in the Minnesota Climate Change Vulnerability Assessment (http://www.health.state.mn.us/divs/climatechange/data.html#ccva).
Section 6 provides a summary of key points from the Profile Report with an emphasis on areas where further information and research are required to support the preservation of health of Minnesotans against a changing climate.
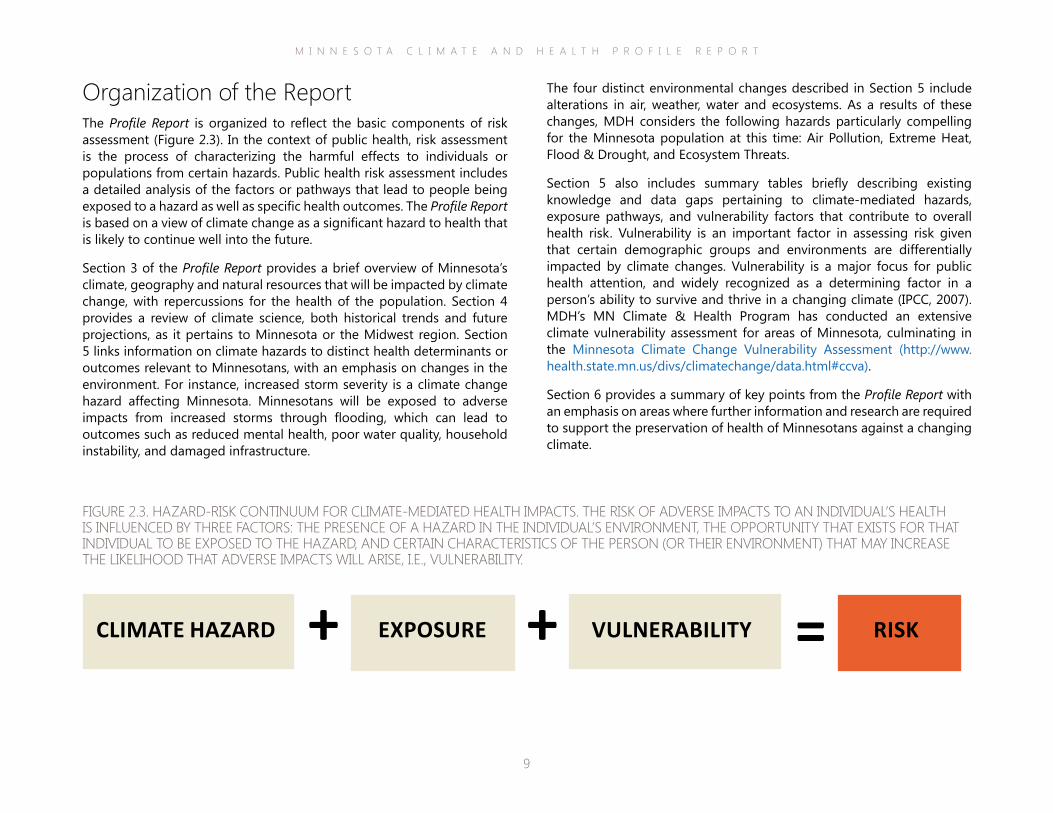
Organization of the ReportThe Profile Report is organized to reflect the basic components of risk assessment (Figure 2.3). In the context of public health, risk assessment is the process of characterizing the harmful effects to individuals or populations from certain hazards. Public health risk assessment includes a detailed analysis of the factors or pathways that lead to people being exposed to a hazard as well as specific health outcomes. The Profile Report is based on a view of climate change as a significant hazard to health that is likely to continue well into the future.
Section 3 of the Profile Report provides a brief overview of Minnesota’s climate, geography and natural resources that will be impacted by climate change, with repercussions for the health of the population. Section 4 provides a review of climate science, both historical trends and future projections, as it pertains to Minnesota or the Midwest region. Section 5 links information on climate hazards to distinct health determinants or outcomes relevant to Minnesotans, with an emphasis on changes in the environment. For instance, increased storm severity is a climate change hazard affecting Minnesota. Minnesotans will be exposed to adverse impacts from increased storms through flooding, which can lead to outcomes such as reduced mental health, poor water quality, household instability, and damaged infrastructure.
FIGURE 2.3. HAZARD-RISK CONTINUUM FOR CLIMATE-MEDIATED HEALTH IMPACTS. THE RISK OF ADVERSE IMPACTS TO AN INDIVIDUAL’S HEALTH IS INFLUENCED BY THREE FACTORS: THE PRESENCE OF A HAZARD IN THE INDIVIDUAL’S ENVIRONMENT, THE OPPORTUNITY THAT EXISTS FOR THAT INDIVIDUAL TO BE EXPOSED TO THE HAZARD, AND CERTAIN CHARACTERISTICS OF THE PERSON (OR THEIR ENVIRONMENT) THAT MAY INCREASE THE LIKELIHOOD THAT ADVERSE IMPACTS WILL ARISE, I.E., VULNERABILITY.
VULNERABILITY+ + =CLIMATE HAZARD EXPOSURE RISK
M I N N E S O T A C L I M A T E A N D H E A L T H P R O F I L E R E P O R T
10
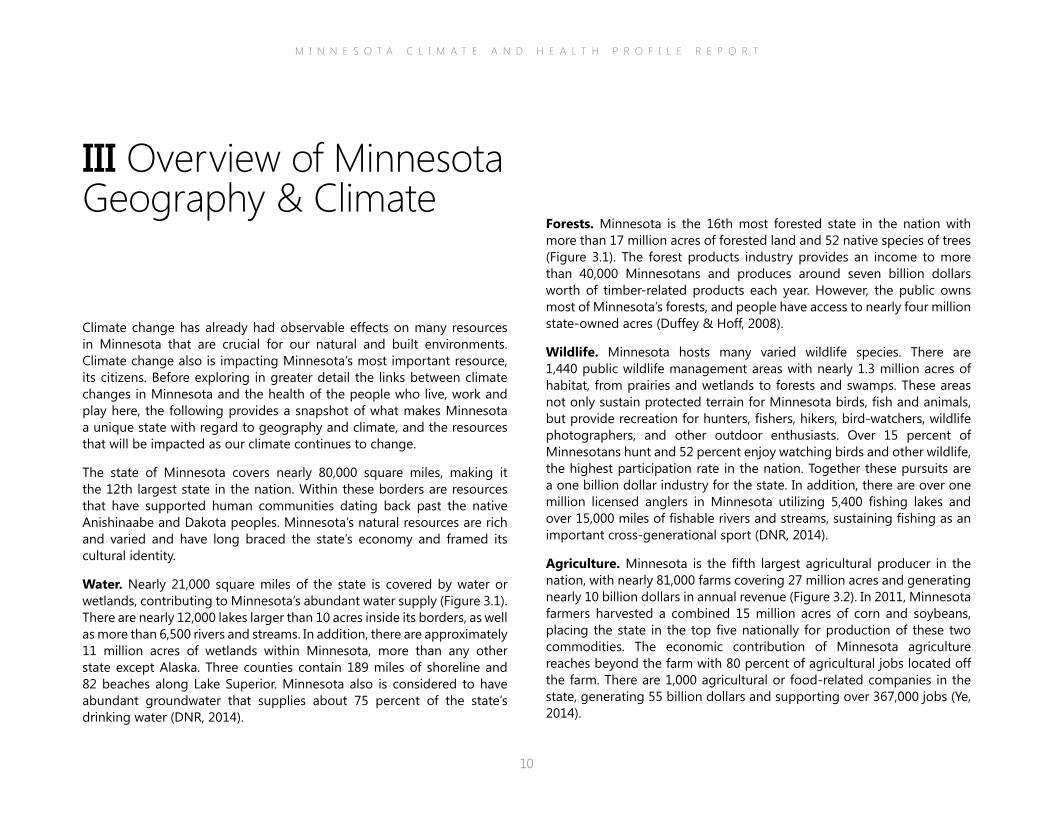
Forests. Minnesota is the 16th most forested state in the nation with more than 17 million acres of forested land and 52 native species of trees (Figure 3.1). The forest products industry provides an income to more than 40,000 Minnesotans and produces around seven billion dollars worth of timber-related products each year. However, the public owns most of Minnesota’s forests, and people have access to nearly four million state-owned acres (Duffey & Hoff, 2008).
Wildlife. Minnesota hosts many varied wildlife species. There are 1,440 public wildlife management areas with nearly 1.3 million acres of habitat, from prairies and wetlands to forests and swamps. These areas not only sustain protected terrain for Minnesota birds, fish and animals, but provide recreation for hunters, fishers, hikers, bird-watchers, wildlife photographers, and other outdoor enthusiasts. Over 15 percent of Minnesotans hunt and 52 percent enjoy watching birds and other wildlife, the highest participation rate in the nation. Together these pursuits are a one billion dollar industry for the state. In addition, there are over one million licensed anglers in Minnesota utilizing 5,400 fishing lakes and over 15,000 miles of fishable rivers and streams, sustaining fishing as an important cross-generational sport (DNR, 2014).
Agriculture. Minnesota is the fifth largest agricultural producer in the nation, with nearly 81,000 farms covering 27 million acres and generating nearly 10 billion dollars in annual revenue (Figure 3.2). In 2011, Minnesota farmers harvested a combined 15 million acres of corn and soybeans, placing the state in the top five nationally for production of these two commodities. The economic contribution of Minnesota agriculture reaches beyond the farm with 80 percent of agricultural jobs located off the farm. There are 1,000 agricultural or food-related companies in the state, generating 55 billion dollars and supporting over 367,000 jobs (Ye, 2014).
III Overview of Minnesota Geography & Climate
Climate change has already had observable effects on many resources in Minnesota that are crucial for our natural and built environments. Climate change also is impacting Minnesota’s most important resource, its citizens. Before exploring in greater detail the links between climate changes in Minnesota and the health of the people who live, work and play here, the following provides a snapshot of what makes Minnesota a unique state with regard to geography and climate, and the resources that will be impacted as our climate continues to change.
The state of Minnesota covers nearly 80,000 square miles, making it the 12th largest state in the nation. Within these borders are resources that have supported human communities dating back past the native Anishinaabe and Dakota peoples. Minnesota’s natural resources are rich and varied and have long braced the state’s economy and framed its cultural identity.
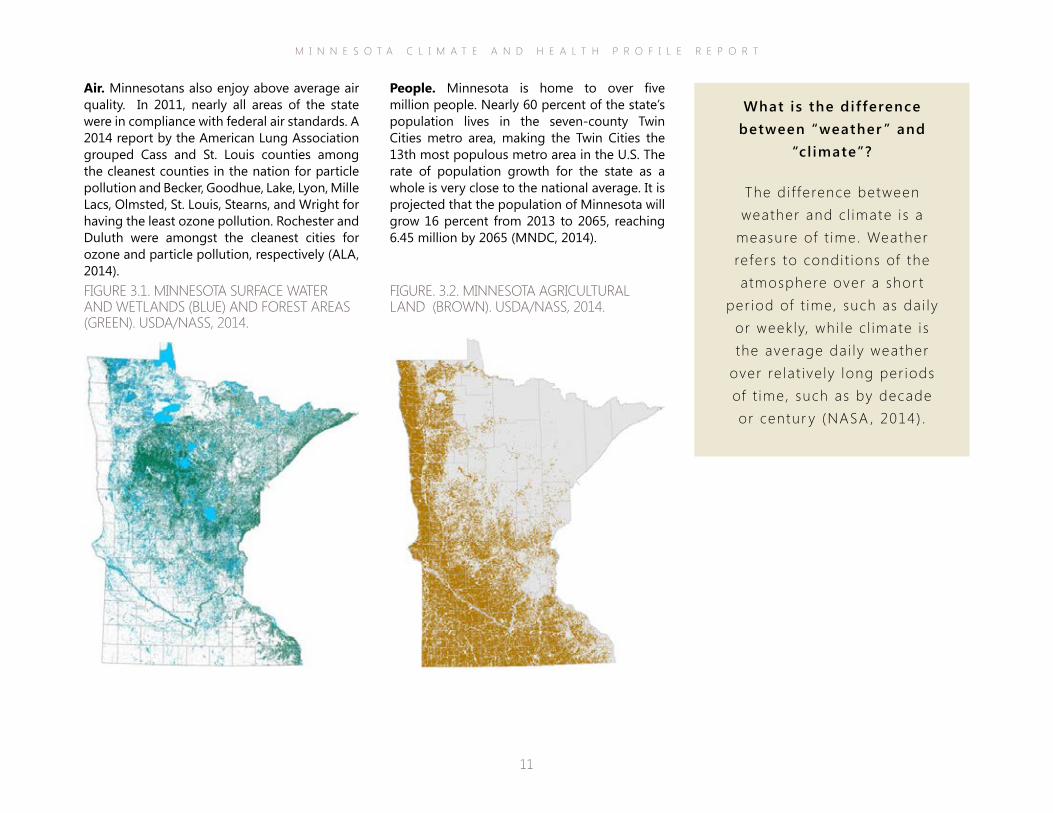
Water. Nearly 21,000 square miles of the state is covered by water or wetlands, contributing to Minnesota’s abundant water supply (Figure 3.1). There are nearly 12,000 lakes larger than 10 acres inside its borders, as well as more than 6,500 rivers and streams. In addition, there are approximately 11 million acres of wetlands within Minnesota, more than any other state except Alaska. Three counties contain 189 miles of shoreline and 82 beaches along Lake Superior. Minnesota also is considered to have abundant groundwater that supplies about 75 percent of the state’s drinking water (DNR, 2014).
M I N N E S O T A C L I M A T E A N D H E A L T H P R O F I L E R E P O R T
11
People. Minnesota is home to over five million people. Nearly 60 percent of the state’s population lives in the seven-county Twin Cities metro area, making the Twin Cities the 13th most populous metro area in the U.S. The rate of population growth for the state as a whole is very close to the national average. It is projected that the population of Minnesota will grow 16 percent from 2013 to 2065, reaching 6.45 million by 2065 (MNDC, 2014).
Air. Minnesotans also enjoy above average air quality. In 2011, nearly all areas of the state were in compliance with federal air standards. A 2014 report by the American Lung Association grouped Cass and St. Louis counties among the cleanest counties in the nation for particle pollution and Becker, Goodhue, Lake, Lyon, Mille Lacs, Olmsted, St. Louis, Stearns, and Wright for having the least ozone pollution. Rochester and Duluth were amongst the cleanest cities for ozone and particle pollution, respectively (ALA, 2014). FIGURE 3.1. MINNESOTA SURFACE WATER AND WETLANDS (BLUE) AND FOREST AREAS (GREEN). USDA/NASS, 2014.
FIGURE. 3.2. MINNESOTA AGRICULTURAL LAND (BROWN). USDA/NASS, 2014.
What is the difference between “weather ” and
“cl imate”?
The di f ference between weather and c l imate is a
measure of t ime. Weather refers to condi t ions of the atmosphere over a shor t
per iod of t ime, such as dai ly or weekly, whi le c l imate is the average dai ly weather
over re lat ive ly long per iods of t ime, such as by decade or centur y (NASA , 2014) .
M I N N E S O T A C L I M A T E A N D H E A L T H P R O F I L E R E P O R T
12
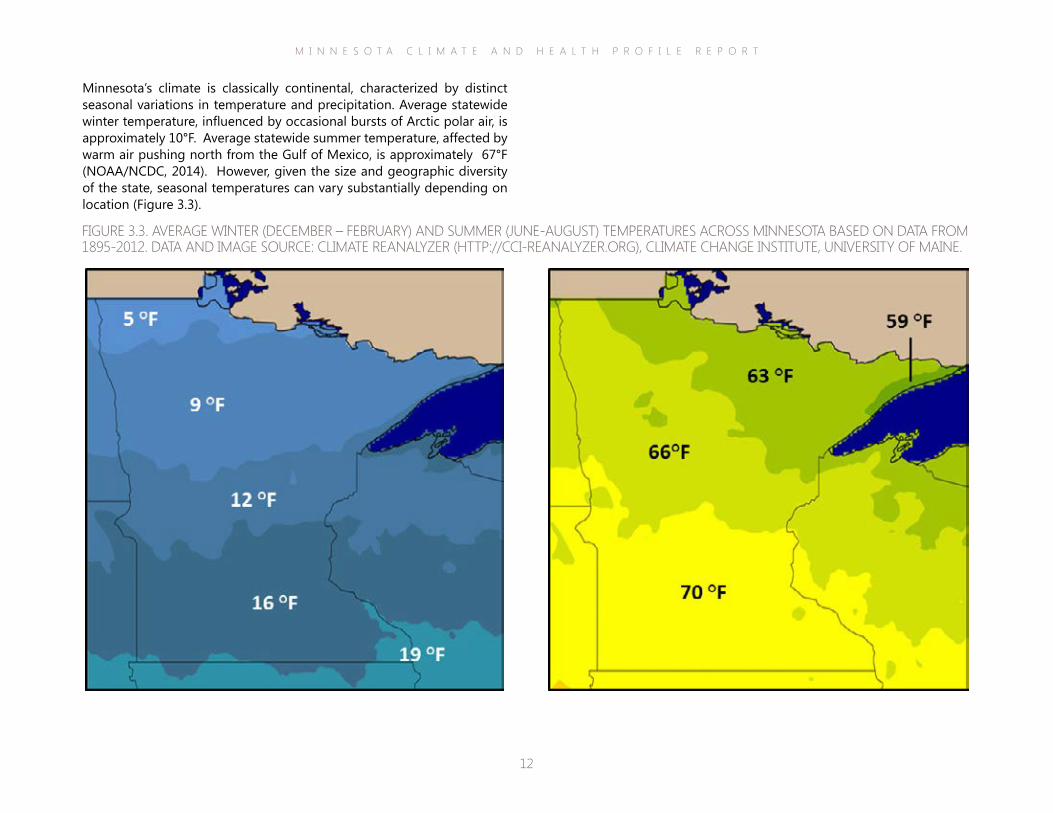
Minnesota’s climate is classically continental, characterized by distinct seasonal variations in temperature and precipitation. Average statewide winter temperature, influenced by occasional bursts of Arctic polar air, is approximately 10°F. Average statewide summer temperature, affected by warm air pushing north from the Gulf of Mexico, is approximately 67°F (NOAA/NCDC, 2014). However, given the size and geographic diversity of the state, seasonal temperatures can vary substantially depending on location (Figure 3.3).
FIGURE 3.3. AVERAGE WINTER (DECEMBER – FEBRUARY) AND SUMMER (JUNE-AUGUST) TEMPERATURES ACROSS MINNESOTA BASED ON DATA FROM 1895-2012. DATA AND IMAGE SOURCE: CLIMATE REANALYZER (HTTP://CCI-REANALYZER.ORG), CLIMATE CHANGE INSTITUTE, UNIVERSITY OF MAINE.
M I N N E S O T A C L I M A T E A N D H E A L T H P R O F I L E R E P O R T
13
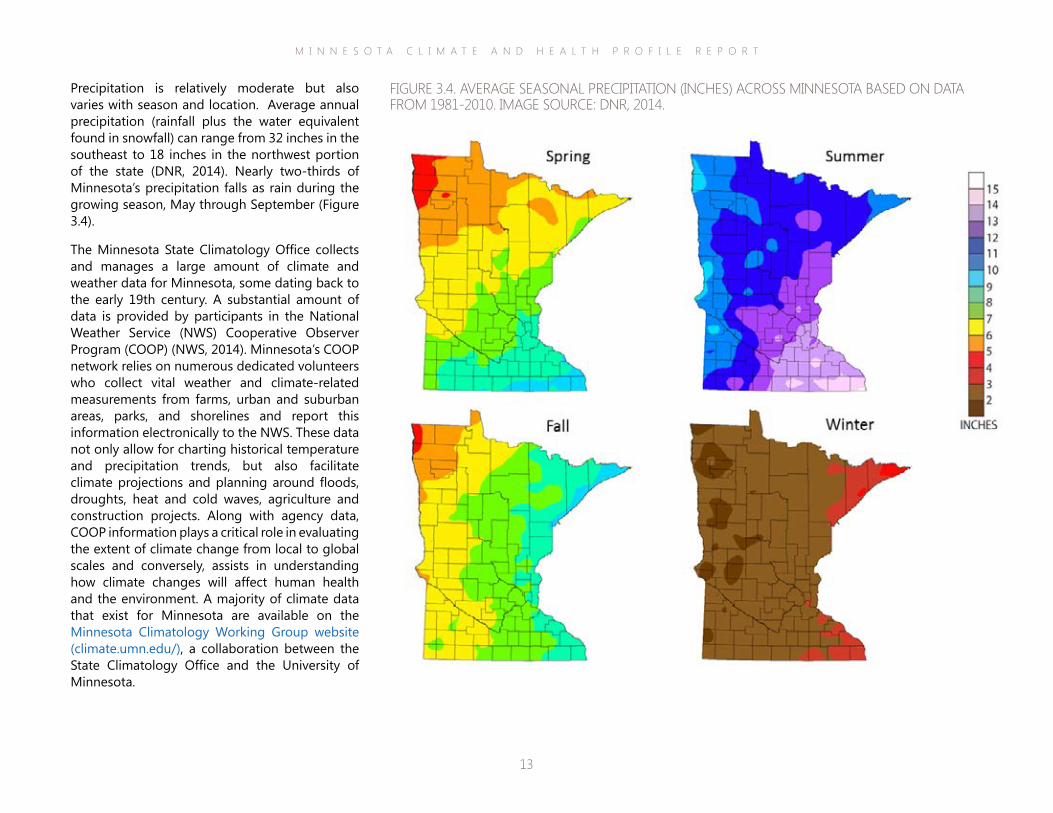
Precipitation is relatively moderate but also varies with season and location. Average annual precipitation (rainfall plus the water equivalent found in snowfall) can range from 32 inches in the southeast to 18 inches in the northwest portion of the state (DNR, 2014). Nearly two-thirds of Minnesota’s precipitation falls as rain during the growing season, May through September (Figure 3.4).
The Minnesota State Climatology Office collects and manages a large amount of climate and weather data for Minnesota, some dating back to the early 19th century. A substantial amount of data is provided by participants in the National Weather Service (NWS) Cooperative Observer Program (COOP) (NWS, 2014). Minnesota’s COOP network relies on numerous dedicated volunteers who collect vital weather and climate-related measurements from farms, urban and suburban areas, parks, and shorelines and report this information electronically to the NWS. These data not only allow for charting historical temperature and precipitation trends, but also facilitate climate projections and planning around floods, droughts, heat and cold waves, agriculture and construction projects. Along with agency data, COOP information plays a critical role in evaluating the extent of climate change from local to global scales and conversely, assists in understanding how climate changes will affect human health and the environment. A majority of climate data that exist for Minnesota are available on the Minnesota Climatology Working Group website (climate.umn.edu/), a collaboration between the State Climatology Office and the University of Minnesota.
FIGURE 3.4. AVERAGE SEASONAL PRECIPITATION (INCHES) ACROSS MINNESOTA BASED ON DATA FROM 1981-2010. IMAGE SOURCE: DNR, 2014.
M I N N E S O T A C L I M A T E A N D H E A L T H P R O F I L E R E P O R T
14
greenhouse gases because of their ability to absorb and emit radiation both upwards to space and back down to the Earth’s surface. The increase in greenhouse gases in the atmosphere, and resulting increase in solar energy retained by the planet, is the driving force behind climate change globally (IPCC, 2007).
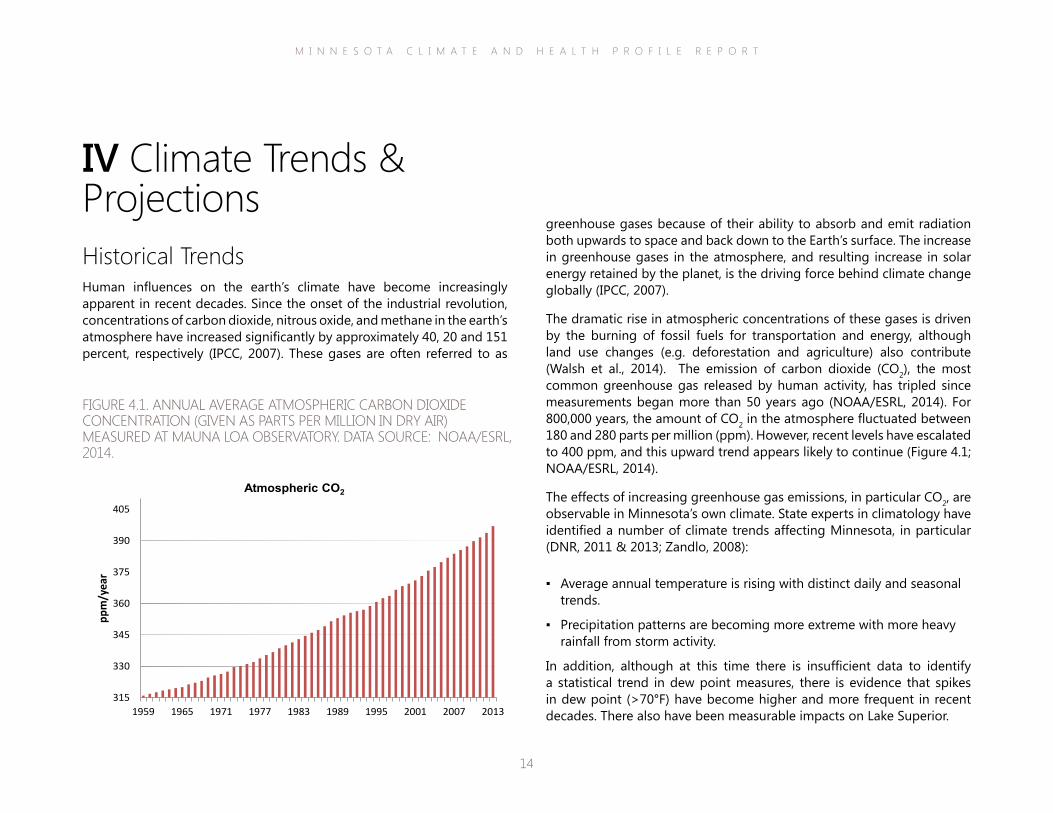
The dramatic rise in atmospheric concentrations of these gases is driven by the burning of fossil fuels for transportation and energy, although land use changes (e.g. deforestation and agriculture) also contribute (Walsh et al., 2014). The emission of carbon dioxide (CO2), the most common greenhouse gas released by human activity, has tripled since measurements began more than 50 years ago (NOAA/ESRL, 2014). For 800,000 years, the amount of CO2 in the atmosphere fluctuated between 180 and 280 parts per million (ppm). However, recent levels have escalated to 400 ppm, and this upward trend appears likely to continue (Figure 4.1; NOAA/ESRL, 2014).
The effects of increasing greenhouse gas emissions, in particular CO2, are observable in Minnesota’s own climate. State experts in climatology have identified a number of climate trends affecting Minnesota, in particular (DNR, 2011 & 2013; Zandlo, 2008):
▪ Average annual temperature is rising with distinct daily and seasonal trends.
▪ Precipitation patterns are becoming more extreme with more heavy rainfall from storm activity.
In addition, although at this time there is insufficient data to identify a statistical trend in dew point measures, there is evidence that spikes in dew point (>70°F) have become higher and more frequent in recent decades. There also have been measurable impacts on Lake Superior.
IV Climate Trends & ProjectionsHistorical TrendsHuman influences on the earth’s climate have become increasingly apparent in recent decades. Since the onset of the industrial revolution, concentrations of carbon dioxide, nitrous oxide, and methane in the earth’s atmosphere have increased significantly by approximately 40, 20 and 151 percent, respectively (IPCC, 2007). These gases are often referred to as
FIGURE 4.1. ANNUAL AVERAGE ATMOSPHERIC CARBON DIOXIDE CONCENTRATION (GIVEN AS PARTS PER MILLION IN DRY AIR) MEASURED AT MAUNA LOA OBSERVATORY. DATA SOURCE: NOAA/ESRL, 2014.
315
330
345
360
375
390
405
1959 1965 1971 1977 1983 1989 1995 2001 2007 2013
ppm
/yea
r
Atmospheric CO2
M I N N E S O T A C L I M A T E A N D H E A L T H P R O F I L E R E P O R T
15
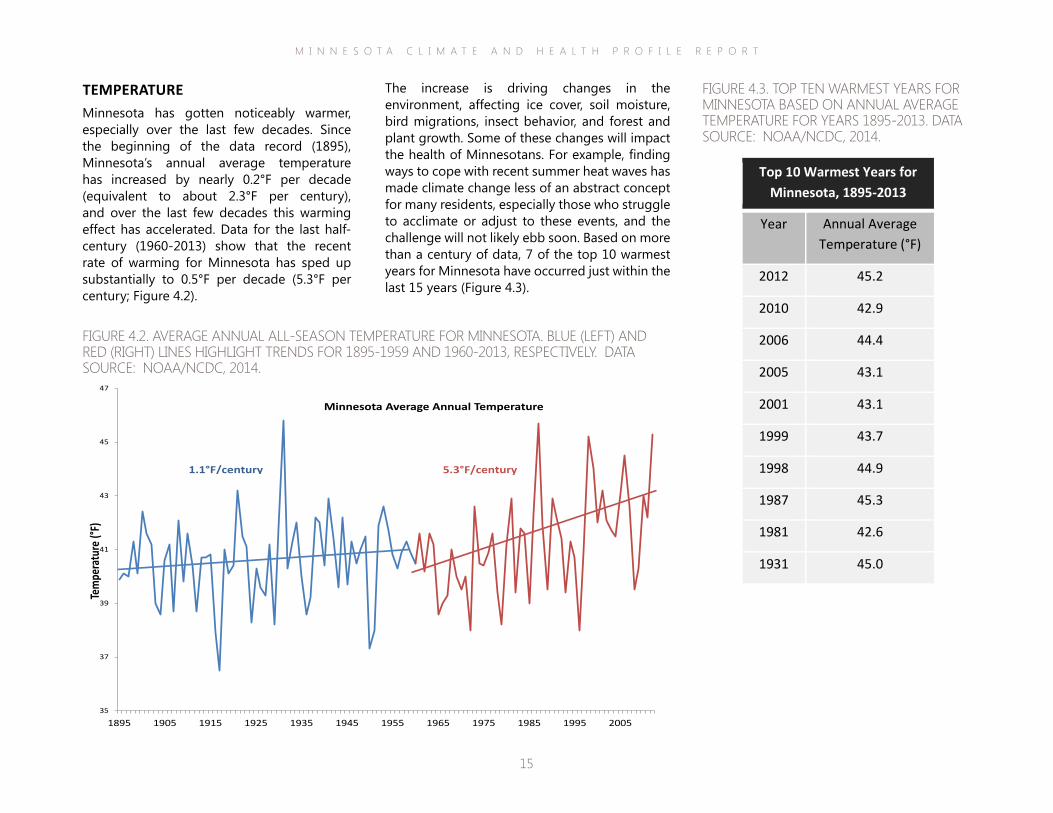
The increase is driving changes in the environment, affecting ice cover, soil moisture, bird migrations, insect behavior, and forest and plant growth. Some of these changes will impact the health of Minnesotans. For example, finding ways to cope with recent summer heat waves has made climate change less of an abstract concept for many residents, especially those who struggle to acclimate or adjust to these events, and the challenge will not likely ebb soon. Based on more than a century of data, 7 of the top 10 warmest years for Minnesota have occurred just within the last 15 years (Figure 4.3).
TEMPERATUREMinnesota has gotten noticeably warmer, especially over the last few decades. Since the beginning of the data record (1895), Minnesota’s annual average temperature has increased by nearly 0.2°F per decade (equivalent to about 2.3°F per century), and over the last few decades this warming effect has accelerated. Data for the last half-century (1960-2013) show that the recent rate of warming for Minnesota has sped up substantially to 0.5°F per decade (5.3°F per century; Figure 4.2).
FIGURE 4.2. AVERAGE ANNUAL ALL-SEASON TEMPERATURE FOR MINNESOTA. BLUE (LEFT) AND RED (RIGHT) LINES HIGHLIGHT TRENDS FOR 1895-1959 AND 1960-2013, RESPECTIVELY. DATA SOURCE: NOAA/NCDC, 2014.
35
37
39
41
43
45
47
1895 1905 1915 1925 1935 1945 1955 1965 1975 1985 1995 2005
Tem
pera
ture
(°F)
Minnesota Average Annual Temperature
1.1°F/century 5.3°F/century
FIGURE 4.3. TOP TEN WARMEST YEARS FOR MINNESOTA BASED ON ANNUAL AVERAGE TEMPERATURE FOR YEARS 1895-2013. DATA SOURCE: NOAA/NCDC, 2014.
Top 10 Warmest Years for Minnesota, 1895-2013
Year Annual Average Temperature (°F)
2012 45.2 2010 42.9 2006 44.4 2005 43.1 2001 43.1 1999 43.7 1998 44.9 1987 45.3 1981 42.6 1931 45.0

M I N N E S O T A C L I M A T E A N D H E A L T H P R O F I L E R E P O R T
16
into the northern part of Minnesota (Figure 4.4). There is no straightforward answer as to why nighttime lows are warming faster than daytime highs, but one likely factor is an increase in cloudiness that insulates land surface at night combined with reduced snowcover (Dai et al., 1999).
In Minnesota, there are distinct daily, seasonal, and regional trends in temperature. Minimum temperatures, often referred to as “overnight lows”, have increased at a faster rate than average daily temperatures taken as a whole. Since 1985, average annual overnight lows have been rising at a rate of 6.0°F per century (NOAA/NCDC, 2014). Over the last half century there has been a distinct spread of warmer lows
Investigating cl imate change: What is a good
baseline?
When analyz ing c l imate anomal ies , the Nat ional
Oceanic and Atmospher ic Adminis t rat ion (NOAA) uses the range 1901-
1960 to represent basel ine c l imate condit ions when
compared to current t rends or condi t ions (Kunkel et a l . , 2013) . NOAA expla ins that 1960 was se lected as the
end of the reference per iod because c l imate data d isp lay a pronounced accelerat ion of heat ing due to human
inf luences af ter 1960. The current per iod 1960-
2012, i s used in th is repor t to represent the ef fect of
human act iv i t ies assoc iated wi th s igni f icant ly increased greenhouse gas emiss ions . The increase of emiss ions
is somet imes referred to as “radiat ive forc ing” on the
ear th ’s c l imate.
FIGURE 4.4. ANNUAL AVERAGE MINIMUM TEMPERATURE (°F) ACROSS MINNESOTA FOR 1900-1959 (LEFT) AND 1960-2013 (RIGHT). DATA AND IMAGE SOURCE: MRCC, 2014.
M I N N E S O T A C L I M A T E A N D H E A L T H P R O F I L E R E P O R T
17
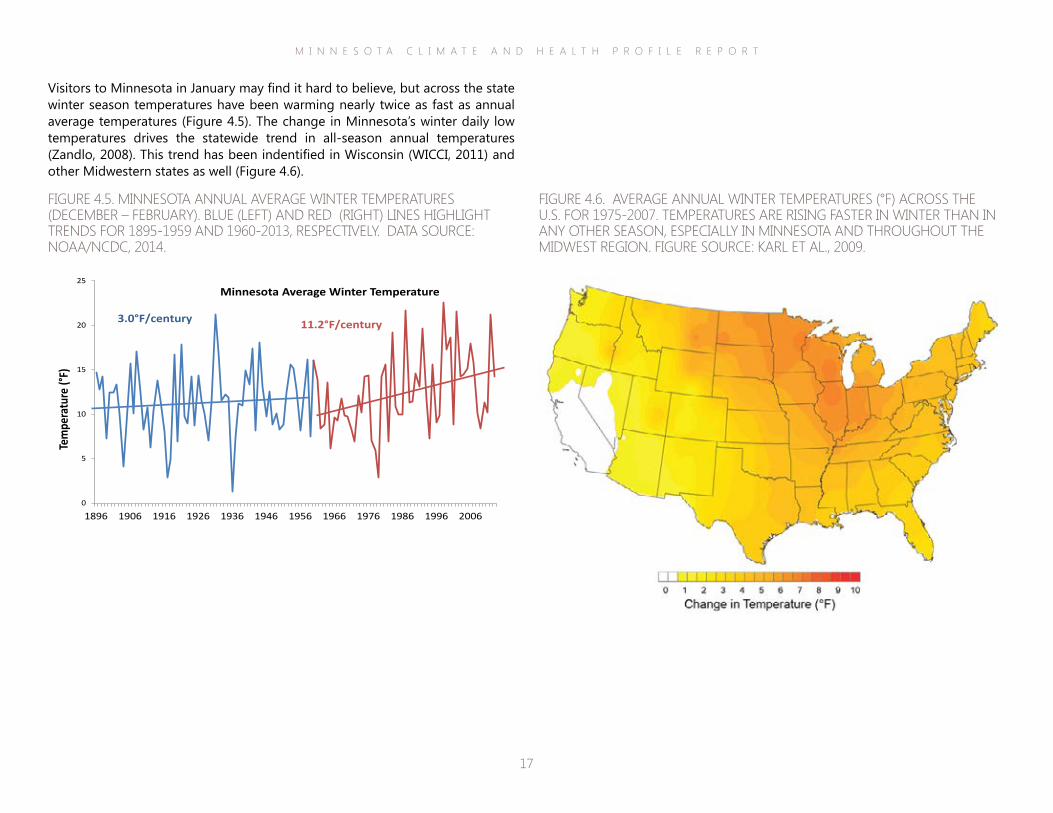
FIGURE 4.5. MINNESOTA ANNUAL AVERAGE WINTER TEMPERATURES (DECEMBER – FEBRUARY). BLUE (LEFT) AND RED (RIGHT) LINES HIGHLIGHT TRENDS FOR 1895-1959 AND 1960-2013, RESPECTIVELY. DATA SOURCE: NOAA/NCDC, 2014.
0
5
10
15
20
25
1896 1906 1916 1926 1936 1946 1956 1966 1976 1986 1996 2006
Tem
pera
ture
(°F)
Minnesota Average Winter Temperature
3.0°F/century 11.2°F/century
FIGURE 4.6. AVERAGE ANNUAL WINTER TEMPERATURES (°F) ACROSS THE U.S. FOR 1975-2007. TEMPERATURES ARE RISING FASTER IN WINTER THAN IN ANY OTHER SEASON, ESPECIALLY IN MINNESOTA AND THROUGHOUT THE MIDWEST REGION. FIGURE SOURCE: KARL ET AL., 2009.
Visitors to Minnesota in January may find it hard to believe, but across the state winter season temperatures have been warming nearly twice as fast as annual average temperatures (Figure 4.5). The change in Minnesota’s winter daily low temperatures drives the statewide trend in all-season annual temperatures (Zandlo, 2008). This trend has been indentified in Wisconsin (WICCI, 2011) and other Midwestern states as well (Figure 4.6).

M I N N E S O T A C L I M A T E A N D H E A L T H P R O F I L E R E P O R T
18
Given the size and location of the state, it’s not surprising that temperature varies within Minnesota’s borders. The average annual temperature in the extreme northern area of the state is around 38°F compared to 47°F along the Mississippi River in the southeast (G. Spoden, personal communication, June 23, 2014). Areas adjacent to Lake Superior are affected by the moderating influence of this large body of water, in particular by summer season cooling.
Warming rates generally have been higher in northern areas of the state compared to southern areas, which is consistent with patterns seen across the Northern Hemisphere, where climate changes are occurring more rapidly at higher latitudes (IPCC, 2007). However, the Twin Cities area located in the southeastern part of the state is a notable exception. The highest calculated warming trend of recent years is associated with the Twin Cities Metropolitan Area (TCMA; Figure 4.7). The high rate of warming associated with the TCMA may be a result of the urban heat island effect (see inset on the next page). Trends for the TCMA, however, have greater uncertainty because less data are used compared to calculations of state or nationwide trends, which are based on much larger datasets. Regional measures are still very useful for informing the direction of ongoing investigations. For example, regional differences in climate trends may be strongly influenced by local land use changes (Zandlo, 2008).
FIGURE 4.7. COMPARISON OF AVERAGE TEMPERATURES (°F/CENTURY) FOR MINNESOTA CLIMATE DIVISIONS. THE “CLIMATE DIVISION” BOUNDARIES FOR EVERY STATE ARE ESTABLISHED BY NOAA TO ALLOW FOR LONG-TERM COMPARISONS ACROSS REGIONS. VALUES ARE BASED ON DATA FROM 1895-1959 (TOP) AND 1960-2013 (BOTTOM). THE TWIN CITIES METROPOLITAN AREA IS REPRESENTED BY THE SHADED AREA AND INCLUDES THE FOLLOWING SEVEN COUNTIES: ANOKA, CARVER, DAKOTA, HENNEPIN, RAMSEY, SCOTT, AND WASHINGTON. DATA SOURCE: MRCC, 2014.
+2.3°F
+5.5
°F
+2.2°F
+6.0
°F
+1.2 °F
+6.3
°F
+2.3°F
+4.5
°F +2.2
°F
+5.2°F
+2.4°F
+5.9
°F
+2.0°F
+4.1
°F
+2.3°F
+4.2
°F
+1.5°F
+4.9
°F
+3.6°F
+8.3
°F
M I N N E S O T A C L I M A T E A N D H E A L T H P R O F I L E R E P O R T
19
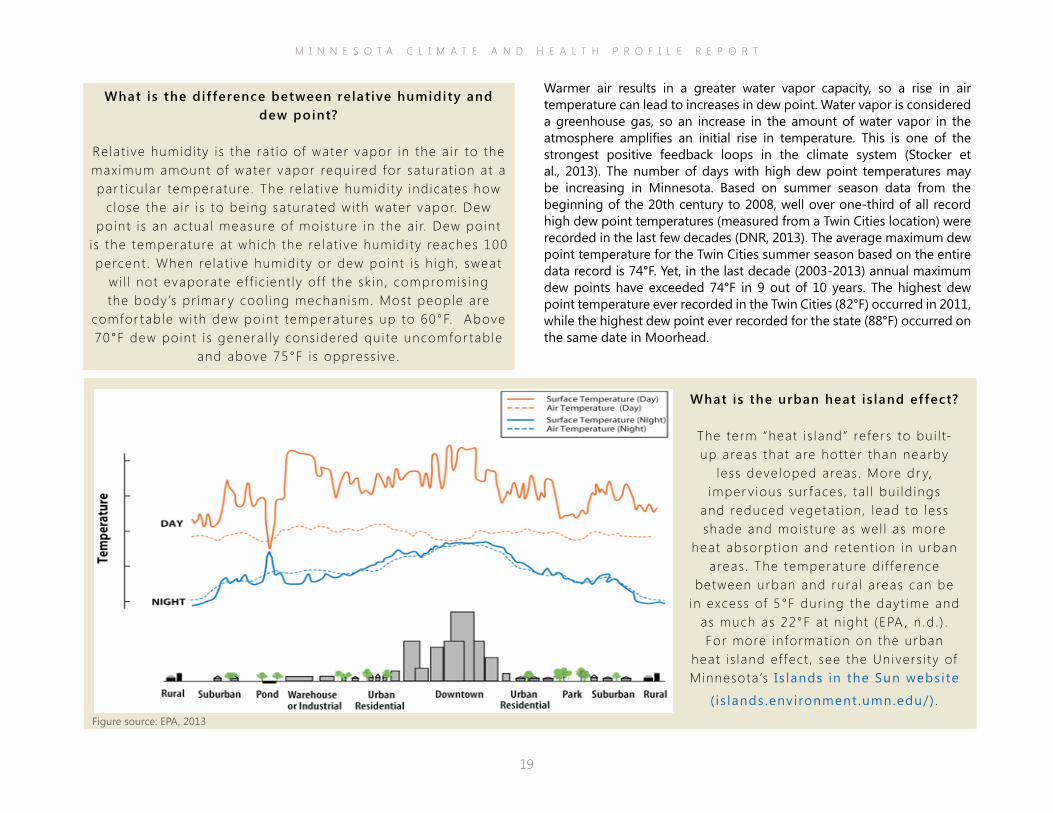
What is the urban heat is land effect?
The term “heat i s land” refers to bui l t-up areas that are hotter than nearby
less developed areas . More dr y, imper v ious sur faces , ta l l bui ld ings
and reduced vegetat ion, lead to less shade and moisture as wel l as more
heat absorpt ion and retent ion in urban areas . The temperature d i f ference
between urban and rura l areas can be in excess of 5°F dur ing the dayt ime and
as much as 22°F at n ight (EPA , n .d . ) . For more informat ion on the urban
heat i s land ef fect , see the Univers i ty of Minnesota ’s Is lands in the Sun website
( is lands.environment.umn.edu/) .
Warmer air results in a greater water vapor capacity, so a rise in air temperature can lead to increases in dew point. Water vapor is considered a greenhouse gas, so an increase in the amount of water vapor in the atmosphere amplifies an initial rise in temperature. This is one of the strongest positive feedback loops in the climate system (Stocker et al., 2013). The number of days with high dew point temperatures may be increasing in Minnesota. Based on summer season data from the beginning of the 20th century to 2008, well over one-third of all record high dew point temperatures (measured from a Twin Cities location) were recorded in the last few decades (DNR, 2013). The average maximum dew point temperature for the Twin Cities summer season based on the entire data record is 74°F. Yet, in the last decade (2003-2013) annual maximum dew points have exceeded 74°F in 9 out of 10 years. The highest dew point temperature ever recorded in the Twin Cities (82°F) occurred in 2011, while the highest dew point ever recorded for the state (88°F) occurred on the same date in Moorhead.
Figure source: EPA, 2013
What is the difference between relat ive humidity and dew point?
Relat ive humidi ty i s the rat io of water vapor in the a i r to the maximum amount of water vapor required for saturat ion at a par t icu lar temperature. The re lat ive humidi ty indicates how
c lose the a i r i s to being saturated wi th water vapor. Dew point i s an actual measure of moisture in the a i r. Dew point
i s the temperature at which the re lat ive humidi ty reaches 100 percent . When re lat ive humidi ty or dew point i s h igh, sweat
wi l l not evaporate ef f ic ient ly of f the sk in , compromis ing the body’s pr imar y cool ing mechanism. Most people are
comfor table wi th dew point temperatures up to 60°F. Above 70°F dew point i s genera l ly cons idered qui te uncomfor table
and above 75°F is oppress ive .
M I N N E S O T A C L I M A T E A N D H E A L T H P R O F I L E R E P O R T
20
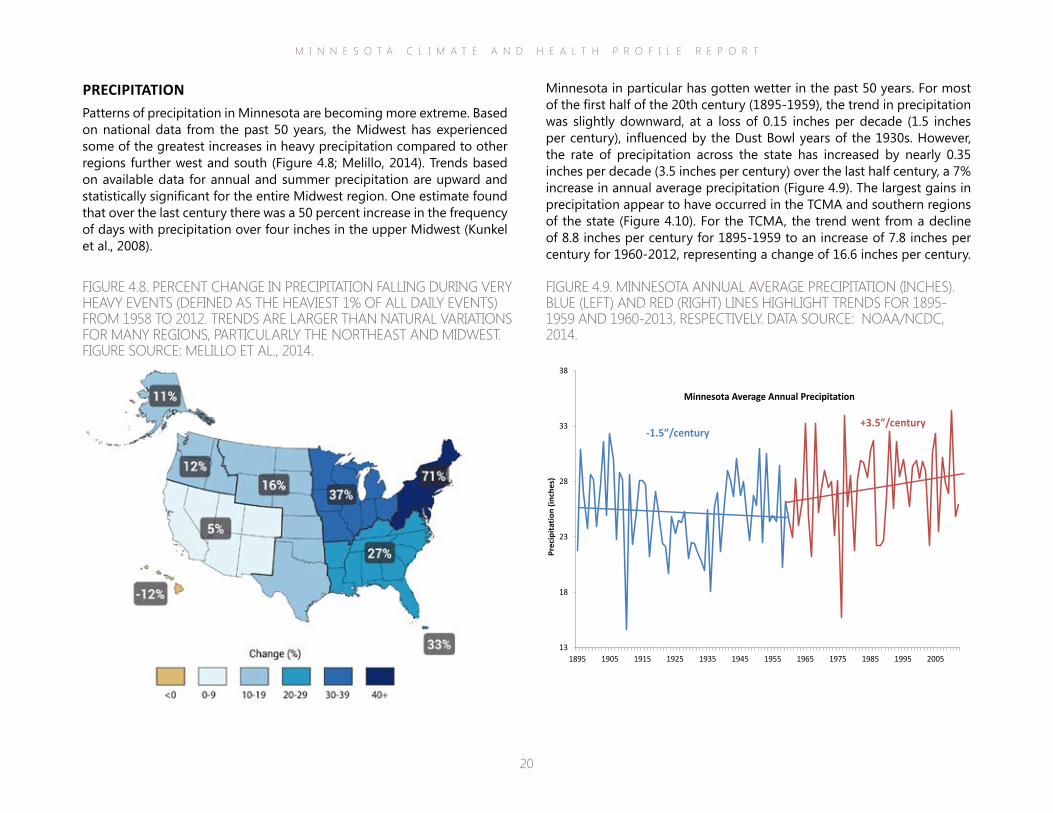
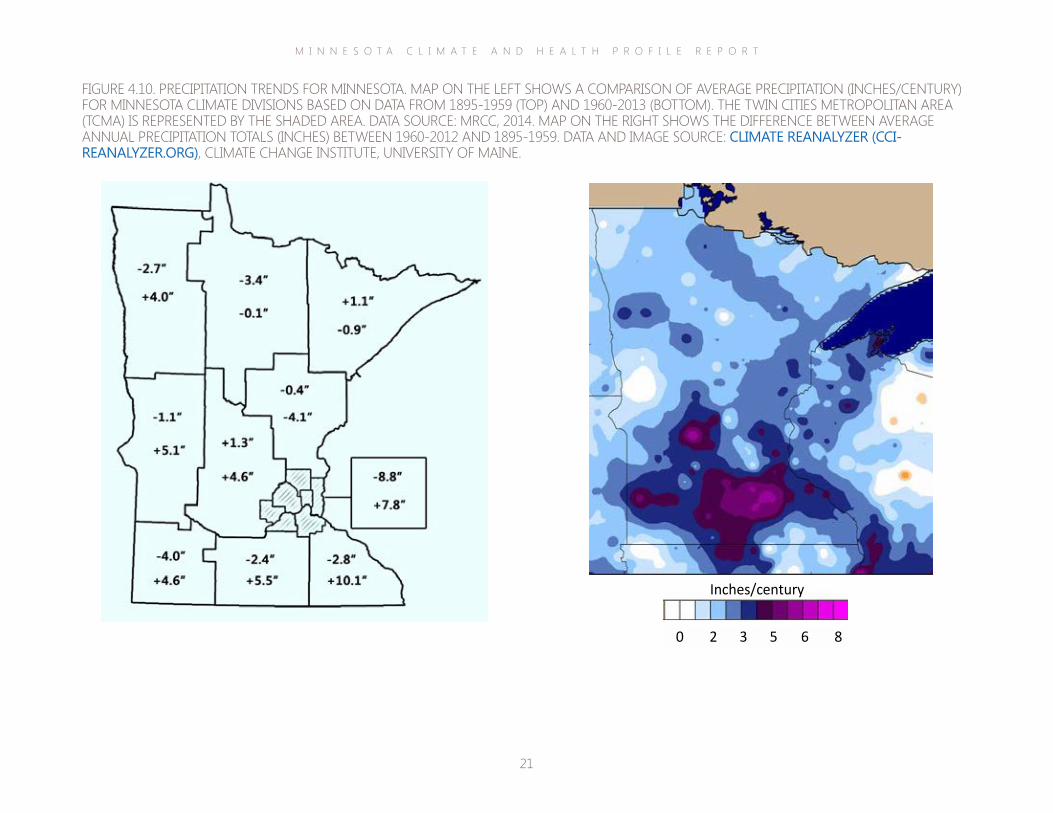
Minnesota in particular has gotten wetter in the past 50 years. For most of the first half of the 20th century (1895-1959), the trend in precipitation was slightly downward, at a loss of 0.15 inches per decade (1.5 inches per century), influenced by the Dust Bowl years of the 1930s. However, the rate of precipitation across the state has increased by nearly 0.35 inches per decade (3.5 inches per century) over the last half century, a 7% increase in annual average precipitation (Figure 4.9). The largest gains in precipitation appear to have occurred in the TCMA and southern regions of the state (Figure 4.10). For the TCMA, the trend went from a decline of 8.8 inches per century for 1895-1959 to an increase of 7.8 inches per century for 1960-2012, representing a change of 16.6 inches per century.
PRECIPITATIONPatterns of precipitation in Minnesota are becoming more extreme. Based on national data from the past 50 years, the Midwest has experienced some of the greatest increases in heavy precipitation compared to other regions further west and south (Figure 4.8; Melillo, 2014). Trends based on available data for annual and summer precipitation are upward and statistically significant for the entire Midwest region. One estimate found that over the last century there was a 50 percent increase in the frequency of days with precipitation over four inches in the upper Midwest (Kunkel et al., 2008).
FIGURE 4.8. PERCENT CHANGE IN PRECIPITATION FALLING DURING VERY HEAVY EVENTS (DEFINED AS THE HEAVIEST 1% OF ALL DAILY EVENTS) FROM 1958 TO 2012. TRENDS ARE LARGER THAN NATURAL VARIATIONS FOR MANY REGIONS, PARTICULARLY THE NORTHEAST AND MIDWEST. FIGURE SOURCE: MELILLO ET AL., 2014.
FIGURE 4.9. MINNESOTA ANNUAL AVERAGE PRECIPITATION (INCHES). BLUE (LEFT) AND RED (RIGHT) LINES HIGHLIGHT TRENDS FOR 1895-1959 AND 1960-2013, RESPECTIVELY. DATA SOURCE: NOAA/NCDC, 2014.
13
18
23
28
33
38
1895 1905 1915 1925 1935 1945 1955 1965 1975 1985 1995 2005
Prec
ipita
tion
(inch
es)
Minnesota Average Annual Precipitation
+3.5”/century-1.5”/century
M I N N E S O T A C L I M A T E A N D H E A L T H P R O F I L E R E P O R T
21
FIGURE 4.10. PRECIPITATION TRENDS FOR MINNESOTA. MAP ON THE LEFT SHOWS A COMPARISON OF AVERAGE PRECIPITATION (INCHES/CENTURY) FOR MINNESOTA CLIMATE DIVISIONS BASED ON DATA FROM 1895-1959 (TOP) AND 1960-2013 (BOTTOM). THE TWIN CITIES METROPOLITAN AREA (TCMA) IS REPRESENTED BY THE SHADED AREA. DATA SOURCE: MRCC, 2014. MAP ON THE RIGHT SHOWS THE DIFFERENCE BETWEEN AVERAGE ANNUAL PRECIPITATION TOTALS (INCHES) BETWEEN 1960-2012 AND 1895-1959. DATA AND IMAGE SOURCE: CLIMATE REANALYZER (CCI-REANALYZER.ORG), CLIMATE CHANGE INSTITUTE, UNIVERSITY OF MAINE.
8 6 5 3 2 0
Inches/century
M I N N E S O T A C L I M A T E A N D H E A L T H P R O F I L E R E P O R T
22
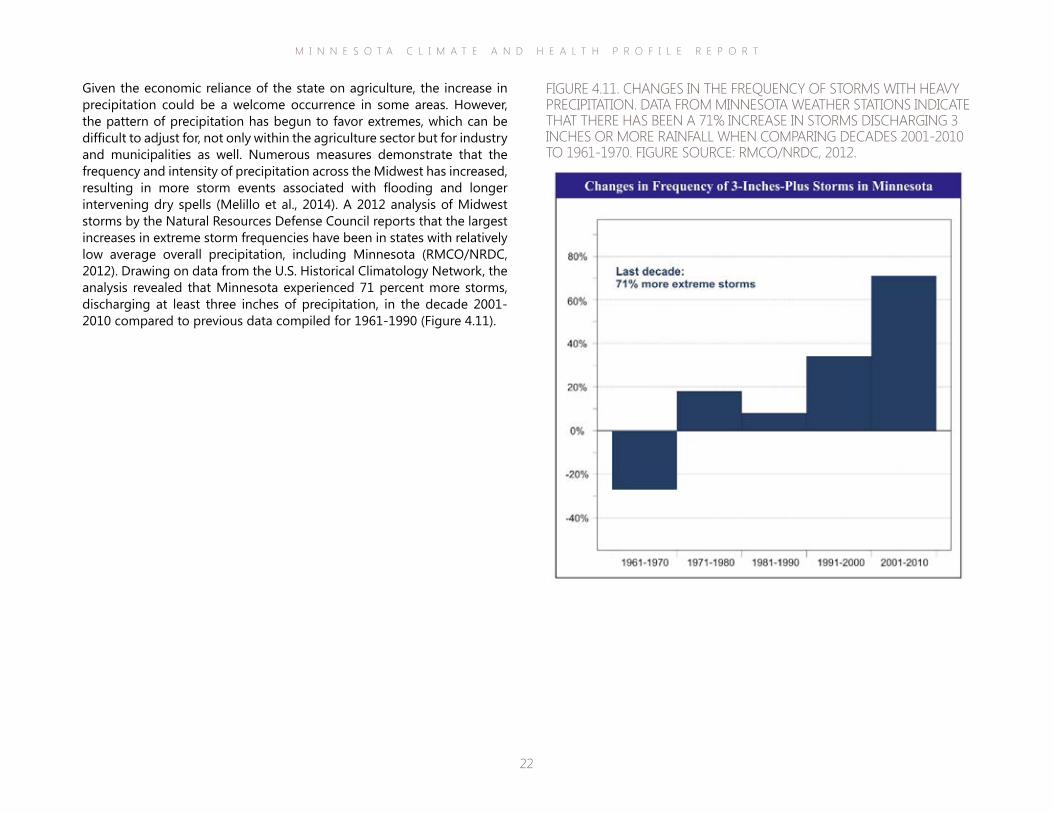
Given the economic reliance of the state on agriculture, the increase in precipitation could be a welcome occurrence in some areas. However, the pattern of precipitation has begun to favor extremes, which can be difficult to adjust for, not only within the agriculture sector but for industry and municipalities as well. Numerous measures demonstrate that the frequency and intensity of precipitation across the Midwest has increased, resulting in more storm events associated with flooding and longer intervening dry spells (Melillo et al., 2014). A 2012 analysis of Midwest storms by the Natural Resources Defense Council reports that the largest increases in extreme storm frequencies have been in states with relatively low average overall precipitation, including Minnesota (RMCO/NRDC, 2012). Drawing on data from the U.S. Historical Climatology Network, the analysis revealed that Minnesota experienced 71 percent more storms, discharging at least three inches of precipitation, in the decade 2001-2010 compared to previous data compiled for 1961-1990 (Figure 4.11).
FIGURE 4.11. CHANGES IN THE FREQUENCY OF STORMS WITH HEAVY PRECIPITATION. DATA FROM MINNESOTA WEATHER STATIONS INDICATE THAT THERE HAS BEEN A 71% INCREASE IN STORMS DISCHARGING 3 INCHES OR MORE RAINFALL WHEN COMPARING DECADES 2001-2010 TO 1961-1970. FIGURE SOURCE: RMCO/NRDC, 2012.
M I N N E S O T A C L I M A T E A N D H E A L T H P R O F I L E R E P O R T
23
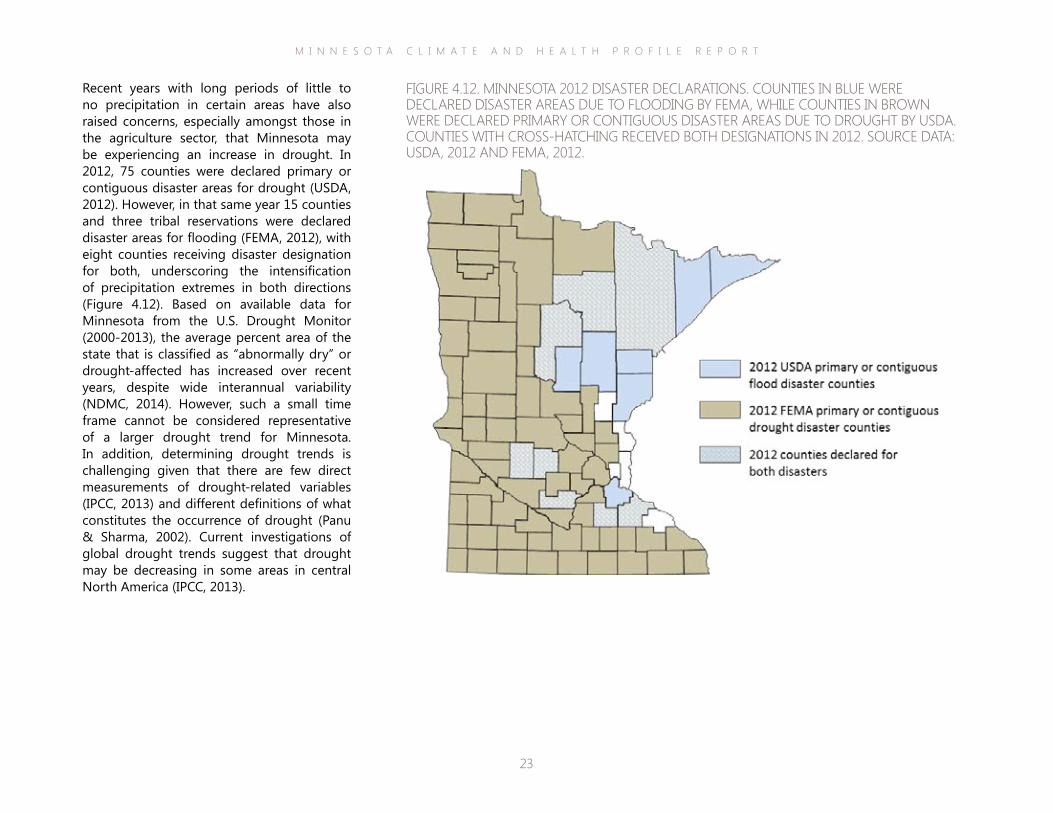
Recent years with long periods of little to no precipitation in certain areas have also raised concerns, especially amongst those in the agriculture sector, that Minnesota may be experiencing an increase in drought. In 2012, 75 counties were declared primary or contiguous disaster areas for drought (USDA, 2012). However, in that same year 15 counties and three tribal reservations were declared disaster areas for flooding (FEMA, 2012), with eight counties receiving disaster designation for both, underscoring the intensification of precipitation extremes in both directions (Figure 4.12). Based on available data for Minnesota from the U.S. Drought Monitor (2000-2013), the average percent area of the state that is classified as “abnormally dry” or drought-affected has increased over recent years, despite wide interannual variability (NDMC, 2014). However, such a small time frame cannot be considered representative of a larger drought trend for Minnesota. In addition, determining drought trends is challenging given that there are few direct measurements of drought-related variables (IPCC, 2013) and different definitions of what constitutes the occurrence of drought (Panu & Sharma, 2002). Current investigations of global drought trends suggest that drought may be decreasing in some areas in central North America (IPCC, 2013).
FIGURE 4.12. MINNESOTA 2012 DISASTER DECLARATIONS. COUNTIES IN BLUE WERE DECLARED DISASTER AREAS DUE TO FLOODING BY FEMA, WHILE COUNTIES IN BROWN WERE DECLARED PRIMARY OR CONTIGUOUS DISASTER AREAS DUE TO DROUGHT BY USDA. COUNTIES WITH CROSS-HATCHING RECEIVED BOTH DESIGNATIONS IN 2012. SOURCE DATA: USDA, 2012 AND FEMA, 2012.
M I N N E S O T A C L I M A T E A N D H E A L T H P R O F I L E R E P O R T
24
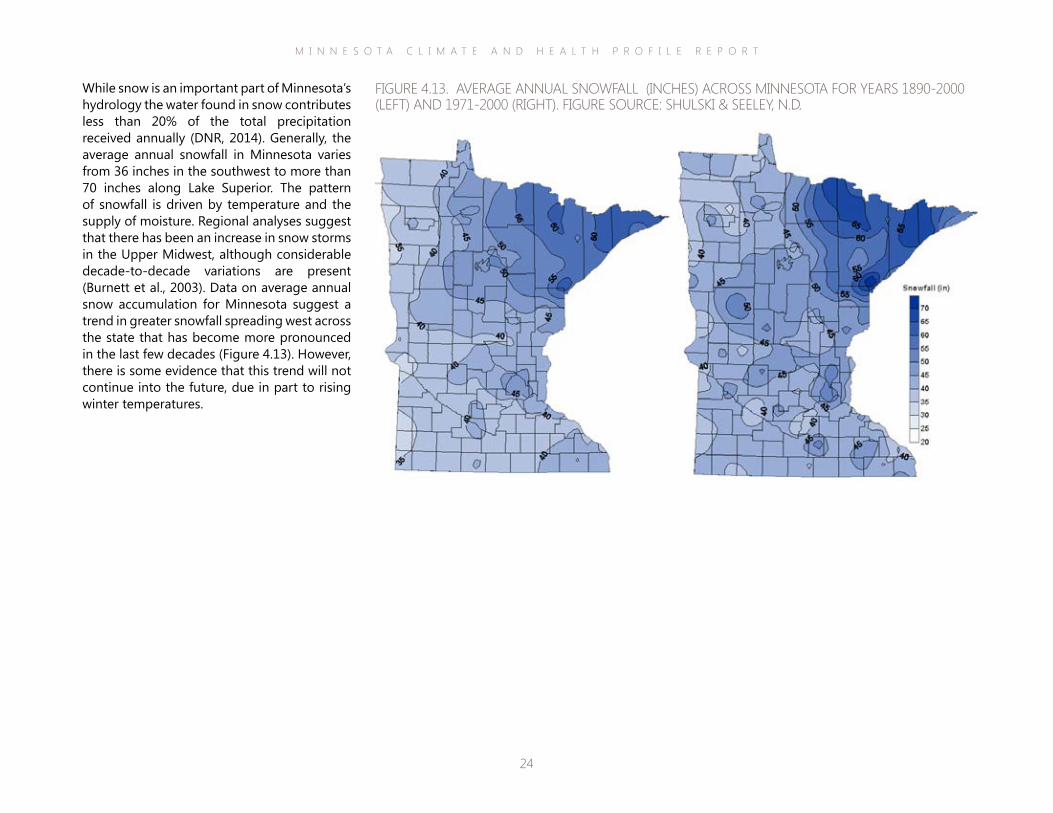
While snow is an important part of Minnesota’s hydrology the water found in snow contributes less than 20% of the total precipitation received annually (DNR, 2014). Generally, the average annual snowfall in Minnesota varies from 36 inches in the southwest to more than 70 inches along Lake Superior. The pattern of snowfall is driven by temperature and the supply of moisture. Regional analyses suggest that there has been an increase in snow storms in the Upper Midwest, although considerable decade-to-decade variations are present (Burnett et al., 2003). Data on average annual snow accumulation for Minnesota suggest a trend in greater snowfall spreading west across the state that has become more pronounced in the last few decades (Figure 4.13). However, there is some evidence that this trend will not continue into the future, due in part to rising winter temperatures.
FIGURE 4.13. AVERAGE ANNUAL SNOWFALL (INCHES) ACROSS MINNESOTA FOR YEARS 1890-2000 (LEFT) AND 1971-2000 (RIGHT). FIGURE SOURCE: SHULSKI & SEELEY, N.D.
M I N N E S O T A C L I M A T E A N D H E A L T H P R O F I L E R E P O R T
25
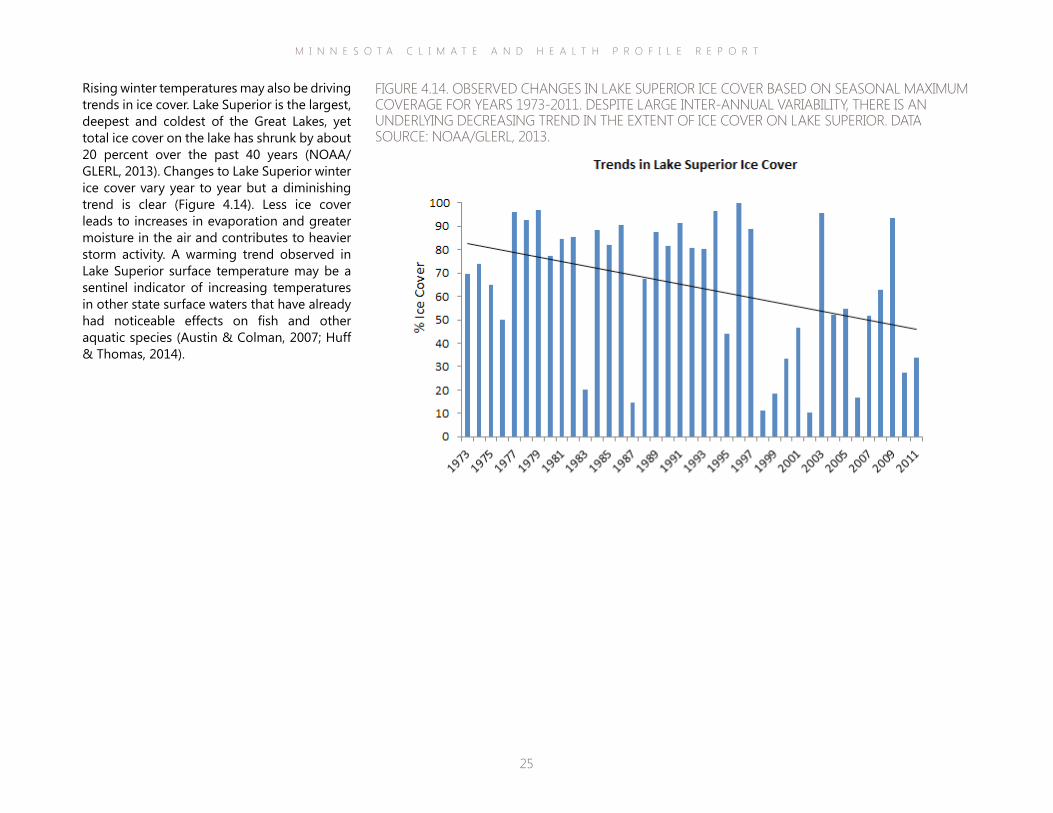
Rising winter temperatures may also be driving trends in ice cover. Lake Superior is the largest, deepest and coldest of the Great Lakes, yet total ice cover on the lake has shrunk by about 20 percent over the past 40 years (NOAA/GLERL, 2013). Changes to Lake Superior winter ice cover vary year to year but a diminishing trend is clear (Figure 4.14). Less ice cover leads to increases in evaporation and greater moisture in the air and contributes to heavier storm activity. A warming trend observed in Lake Superior surface temperature may be a sentinel indicator of increasing temperatures in other state surface waters that have already had noticeable effects on fish and other aquatic species (Austin & Colman, 2007; Huff & Thomas, 2014).
FIGURE 4.14. OBSERVED CHANGES IN LAKE SUPERIOR ICE COVER BASED ON SEASONAL MAXIMUM COVERAGE FOR YEARS 1973-2011. DESPITE LARGE INTER-ANNUAL VARIABILITY, THERE IS AN UNDERLYING DECREASING TREND IN THE EXTENT OF ICE COVER ON LAKE SUPERIOR. DATA SOURCE: NOAA/GLERL, 2013.
M I N N E S O T A C L I M A T E A N D H E A L T H P R O F I L E R E P O R T
26
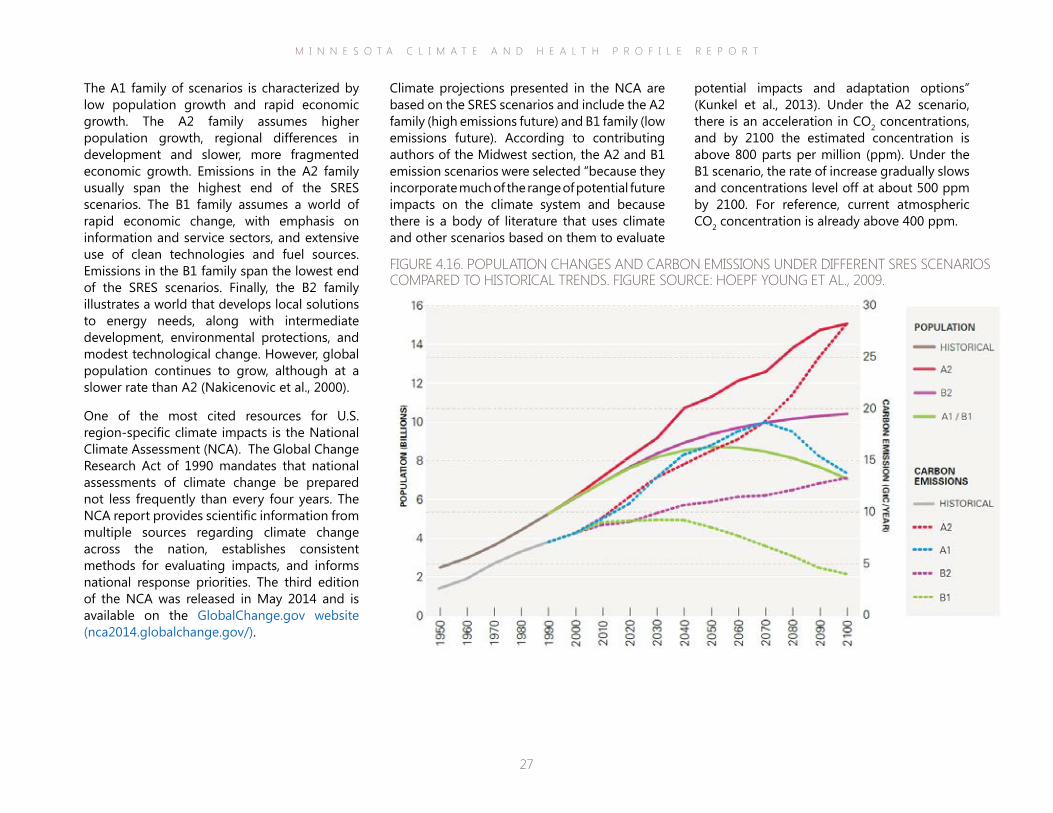
describing possible futures and combinations of driving forces (Figure 4.16). These scenarios are widely used as the basis for scientific studies and as a reference for political and societal discussions on climate change.
have been described in the 2000 Special Report on Emissions Scenarios (SRES; Nakicenovic et al., 2000). The 2000 SRES scenarios cover from 1990 to 2100. There are 40 scenarios, grouped into four “families” (A1, A2, B1, B2), each with a storyline
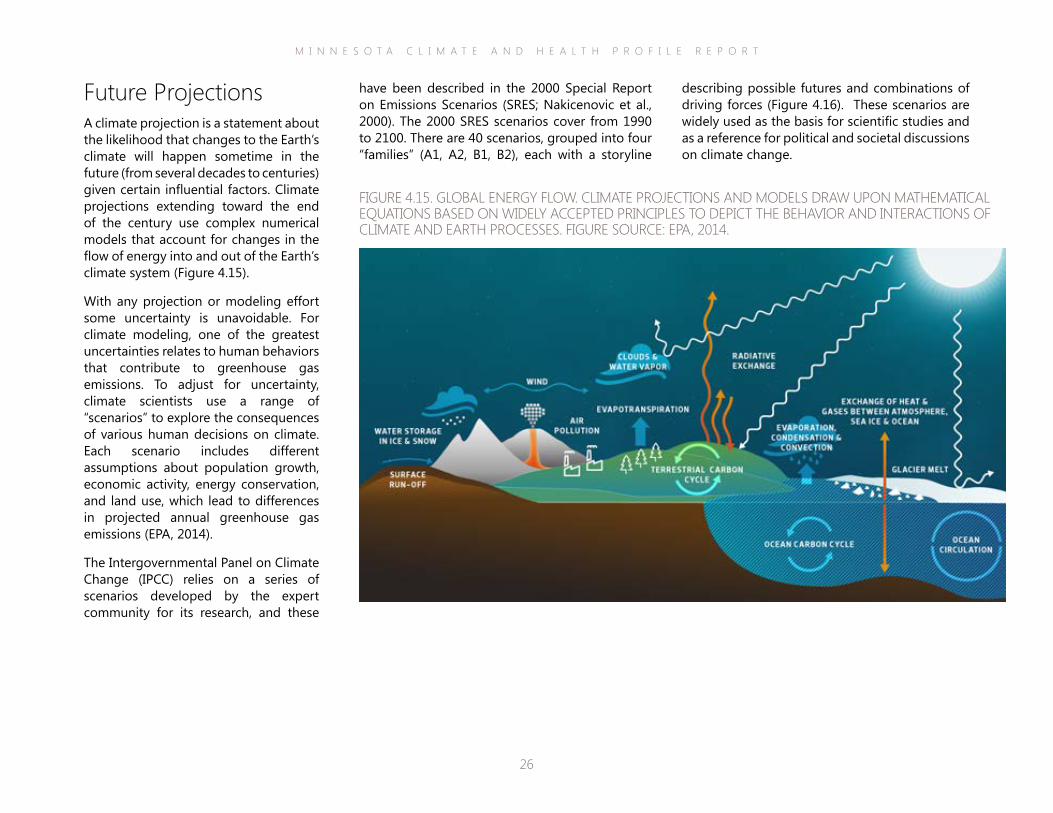
Future ProjectionsA climate projection is a statement about the likelihood that changes to the Earth’s climate will happen sometime in the future (from several decades to centuries) given certain influential factors. Climate projections extending toward the end of the century use complex numerical models that account for changes in the flow of energy into and out of the Earth’s climate system (Figure 4.15).
With any projection or modeling effort some uncertainty is unavoidable. For climate modeling, one of the greatest uncertainties relates to human behaviors that contribute to greenhouse gas emissions. To adjust for uncertainty, climate scientists use a range of “scenarios” to explore the consequences of various human decisions on climate. Each scenario includes different assumptions about population growth, economic activity, energy conservation, and land use, which lead to differences in projected annual greenhouse gas emissions (EPA, 2014).
The Intergovernmental Panel on Climate Change (IPCC) relies on a series of scenarios developed by the expert community for its research, and these
FIGURE 4.15. GLOBAL ENERGY FLOW. CLIMATE PROJECTIONS AND MODELS DRAW UPON MATHEMATICAL EQUATIONS BASED ON WIDELY ACCEPTED PRINCIPLES TO DEPICT THE BEHAVIOR AND INTERACTIONS OF CLIMATE AND EARTH PROCESSES. FIGURE SOURCE: EPA, 2014.
M I N N E S O T A C L I M A T E A N D H E A L T H P R O F I L E R E P O R T
27
Climate projections presented in the NCA are based on the SRES scenarios and include the A2 family (high emissions future) and B1 family (low emissions future). According to contributing authors of the Midwest section, the A2 and B1 emission scenarios were selected “because they incorporate much of the range of potential future impacts on the climate system and because there is a body of literature that uses climate and other scenarios based on them to evaluate
potential impacts and adaptation options” (Kunkel et al., 2013). Under the A2 scenario, there is an acceleration in CO2 concentrations, and by 2100 the estimated concentration is above 800 parts per million (ppm). Under the B1 scenario, the rate of increase gradually slows and concentrations level off at about 500 ppm by 2100. For reference, current atmospheric CO2 concentration is already above 400 ppm.
The A1 family of scenarios is characterized by low population growth and rapid economic growth. The A2 family assumes higher population growth, regional differences in development and slower, more fragmented economic growth. Emissions in the A2 family usually span the highest end of the SRES scenarios. The B1 family assumes a world of rapid economic change, with emphasis on information and service sectors, and extensive use of clean technologies and fuel sources. Emissions in the B1 family span the lowest end of the SRES scenarios. Finally, the B2 family illustrates a world that develops local solutions to energy needs, along with intermediate development, environmental protections, and modest technological change. However, global population continues to grow, although at a slower rate than A2 (Nakicenovic et al., 2000).
One of the most cited resources for U.S. region-specific climate impacts is the National Climate Assessment (NCA). The Global Change Research Act of 1990 mandates that national assessments of climate change be prepared not less frequently than every four years. The NCA report provides scientific information from multiple sources regarding climate change across the nation, establishes consistent methods for evaluating impacts, and informs national response priorities. The third edition of the NCA was released in May 2014 and is available on the GlobalChange.gov website (nca2014.globalchange.gov/).
FIGURE 4.16. POPULATION CHANGES AND CARBON EMISSIONS UNDER DIFFERENT SRES SCENARIOS COMPARED TO HISTORICAL TRENDS. FIGURE SOURCE: HOEPF YOUNG ET AL., 2009.
M I N N E S O T A C L I M A T E A N D H E A L T H P R O F I L E R E P O R T
28
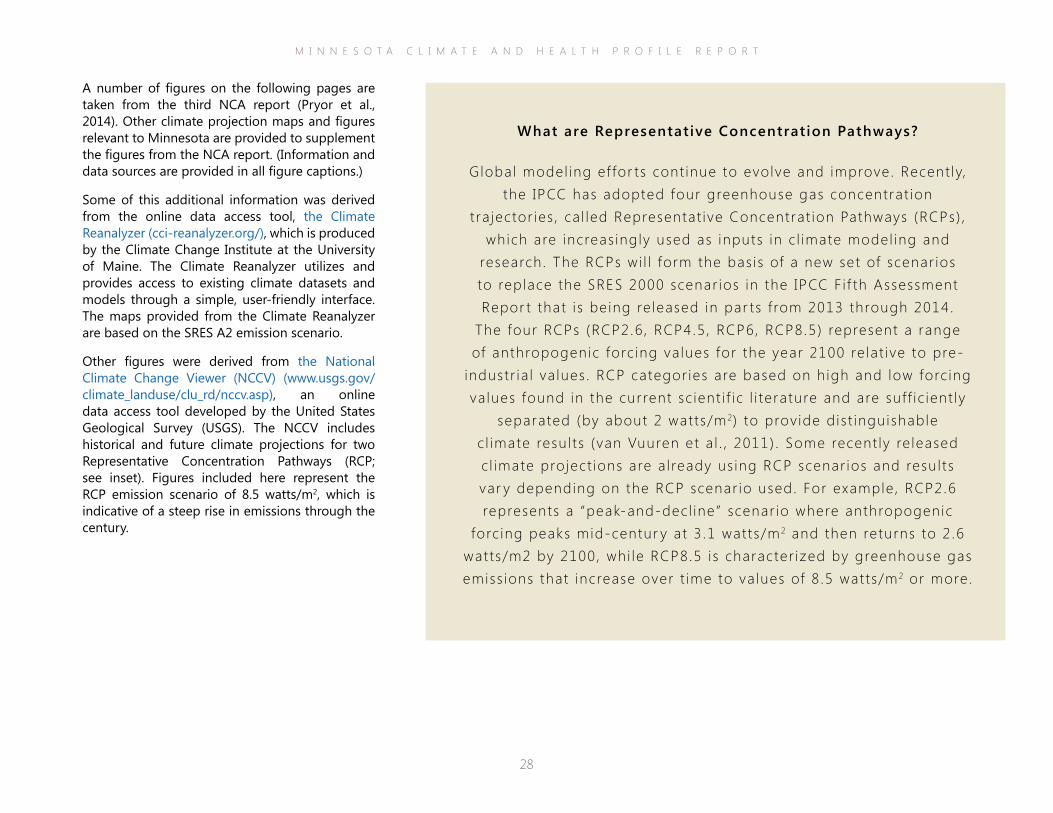
What are Representative Concentration Pathways?
Global model ing ef for ts cont inue to evolve and improve. Recent ly, the IPCC has adopted four greenhouse gas concentrat ion
tra jector ies , ca l led Representat ive Concentrat ion Pathways (RCPs) , which are increas ingly used as inputs in c l imate model ing and
research. The RCPs wi l l form the bas is of a new set of scenar ios to replace the SRES 2000 scenar ios in the IPCC F i f th Assessment Repor t that i s being re leased in par ts f rom 2013 through 2014.
The four RCPs (RCP2.6 , RCP4.5 , RCP6, RCP8.5) represent a range of anthropogenic forc ing va lues for the year 2100 re lat ive to pre-
industr ia l va lues . RCP categor ies are based on high and low forc ing va lues found in the current sc ient i f ic l i terature and are suf f ic ient ly
separated (by about 2 watts/m2) to provide dis t inguishable c l imate resul ts (van Vuuren et a l . , 2011) . Some recent ly re leased c l imate project ions are a l ready us ing RCP scenar ios and resul ts var y depending on the RCP scenar io used. For example, RCP2.6 represents a “peak-and-decl ine” scenar io where anthropogenic
forc ing peaks mid-centur y at 3 .1 watts/m2 and then returns to 2 .6 watts/m2 by 2100, whi le RCP8.5 is character ized by greenhouse gas emiss ions that increase over t ime to va lues of 8 .5 watts/m2 or more.
A number of figures on the following pages are taken from the third NCA report (Pryor et al., 2014). Other climate projection maps and figures relevant to Minnesota are provided to supplement the figures from the NCA report. (Information and data sources are provided in all figure captions.)
Some of this additional information was derived from the online data access tool, the Climate Reanalyzer (cci-reanalyzer.org/), which is produced by the Climate Change Institute at the University of Maine. The Climate Reanalyzer utilizes and provides access to existing climate datasets and models through a simple, user-friendly interface. The maps provided from the Climate Reanalyzer are based on the SRES A2 emission scenario.
Other figures were derived from the National Climate Change Viewer (NCCV) (www.usgs.gov/climate_landuse/clu_rd/nccv.asp), an online data access tool developed by the United States Geological Survey (USGS). The NCCV includes historical and future climate projections for two Representative Concentration Pathways (RCP; see inset). Figures included here represent the RCP emission scenario of 8.5 watts/m2, which is indicative of a steep rise in emissions through the century.
M I N N E S O T A C L I M A T E A N D H E A L T H P R O F I L E R E P O R T
29
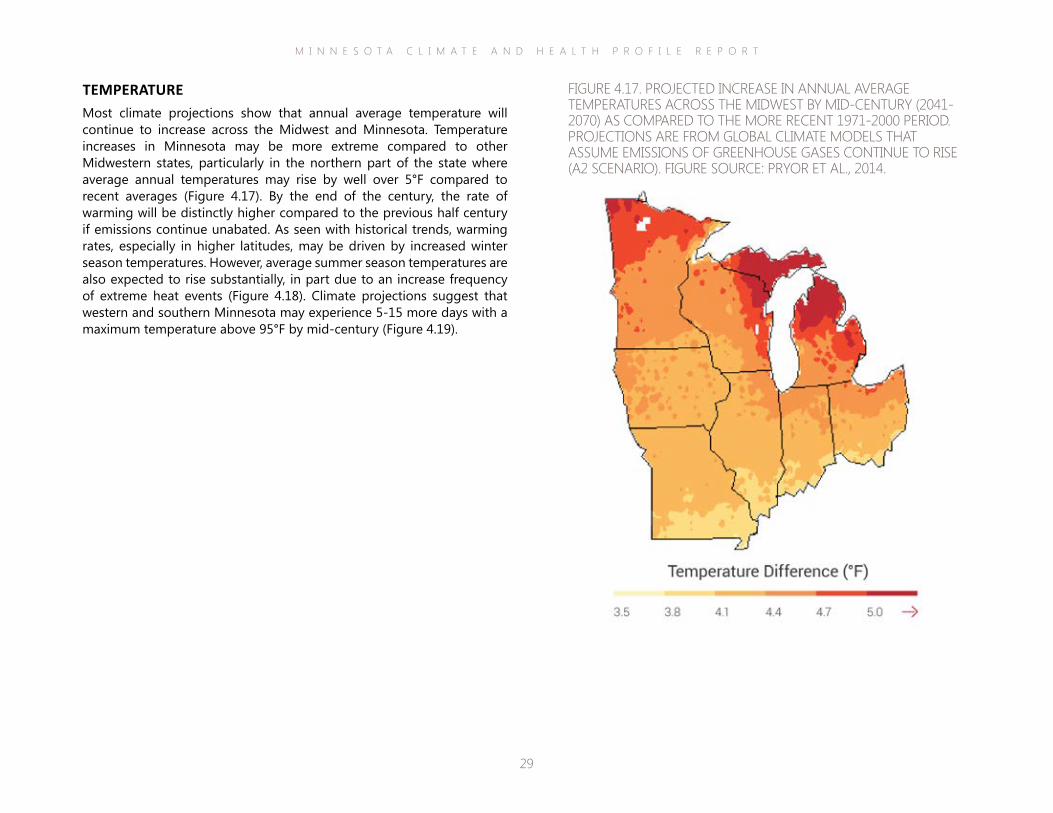
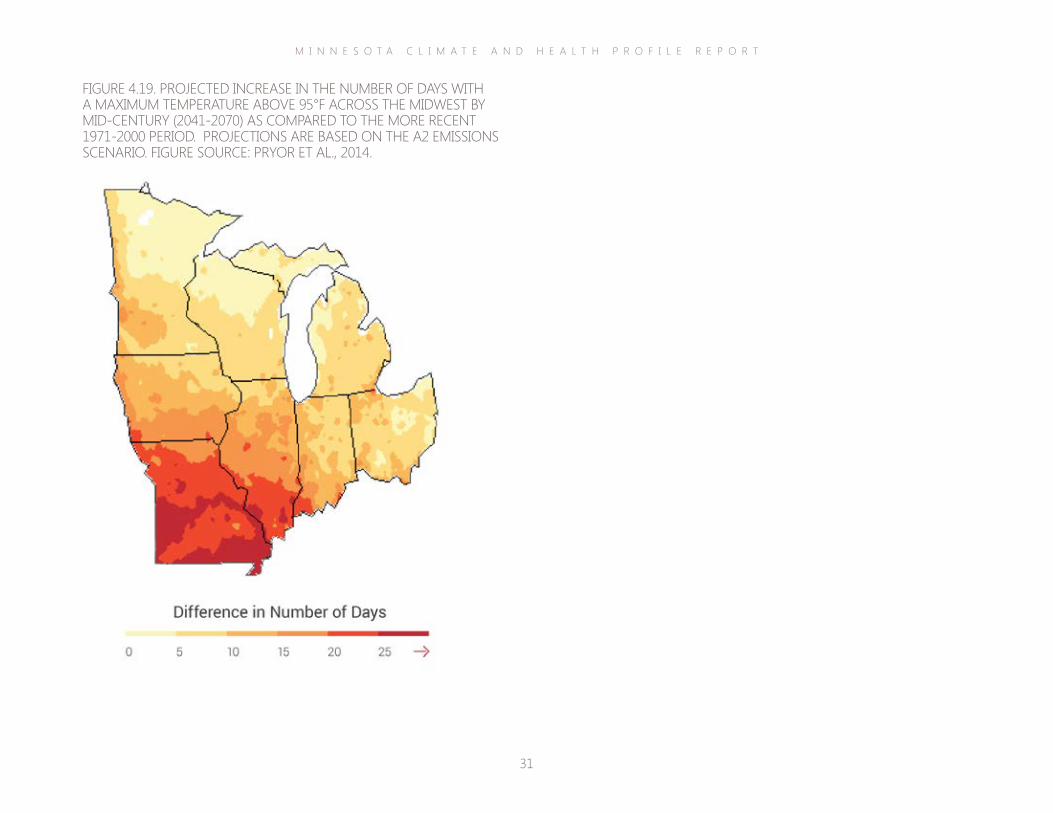
TEMPERATUREMost climate projections show that annual average temperature will continue to increase across the Midwest and Minnesota. Temperature increases in Minnesota may be more extreme compared to other Midwestern states, particularly in the northern part of the state where average annual temperatures may rise by well over 5°F compared to recent averages (Figure 4.17). By the end of the century, the rate of warming will be distinctly higher compared to the previous half century if emissions continue unabated. As seen with historical trends, warming rates, especially in higher latitudes, may be driven by increased winter season temperatures. However, average summer season temperatures are also expected to rise substantially, in part due to an increase frequency of extreme heat events (Figure 4.18). Climate projections suggest that western and southern Minnesota may experience 5-15 more days with a maximum temperature above 95°F by mid-century (Figure 4.19).
FIGURE 4.17. PROJECTED INCREASE IN ANNUAL AVERAGE TEMPERATURES ACROSS THE MIDWEST BY MID-CENTURY (2041-2070) AS COMPARED TO THE MORE RECENT 1971-2000 PERIOD. PROJECTIONS ARE FROM GLOBAL CLIMATE MODELS THAT ASSUME EMISSIONS OF GREENHOUSE GASES CONTINUE TO RISE (A2 SCENARIO). FIGURE SOURCE: PRYOR ET AL., 2014.

M I N N E S O T A C L I M A T E A N D H E A L T H P R O F I L E R E P O R T
30
FIGURE 4.18. APPROXIMATE SEASONAL TEMPERATURES ACROSS MINNESOTA. MAPS ON THE TOP DISPLAY AVERAGE WINTER (DECEMBER-JANUARY) TEMPERATURES AND MAPS ON THE BOTTOM DISPLAY AVERAGE SUMMER (JUNE-AUGUST) TEMPERATURES. MAPS ON THE LEFT DISPLAY AVERAGE OBSERVED TEMPERATURES FOR 1870-1960 AND MAPS ON THE RIGHT DISPLAY AVERAGE PROJECTED TEMPERATURES FOR 2070-2099. MAPS ARE BASED ON THE A2 EMISSIONS SCENARIO. DATA AND IMAGE SOURCE: CLIMATE REANALYZER (HTTP://CCI-REANALYZER.ORG), CLIMATE CHANGE INSTITUTE, UNIVERSITY OF MAINE.
AVERAGE WINTER TEMPERATURES
AVERAGE SUMMER TEMPERATURES
M I N N E S O T A C L I M A T E A N D H E A L T H P R O F I L E R E P O R T
31
FIGURE 4.19. PROJECTED INCREASE IN THE NUMBER OF DAYS WITH A MAXIMUM TEMPERATURE ABOVE 95°F ACROSS THE MIDWEST BY MID-CENTURY (2041-2070) AS COMPARED TO THE MORE RECENT 1971-2000 PERIOD. PROJECTIONS ARE BASED ON THE A2 EMISSIONS SCENARIO. FIGURE SOURCE: PRYOR ET AL., 2014.

M I N N E S O T A C L I M A T E A N D H E A L T H P R O F I L E R E P O R T
32
PRECIPITATIONClimate projections suggest that the total amount of precipitation will increase across the Midwest and Minnesota throughout the century. Certain parts of Minnesota, particularly in the central and southern areas may gain an additional three inches or more of annual precipitation (Figure 4.20). Yet, there will likely be some distinct seasonal variations. Some models predict that under a high emissions scenario, Minnesota may experience a decrease in summer season precipitation; however, there is a notable amount of uncertainty surrounding these projections (Figure 4.21; Pryor et al., 2014; Winkler et al., 2012). Historical trends of increased precipitation during the past century were mainly due to the intensification of the heaviest rainfall events, and this tendency towards precipitation extremes is projected to continue in the future (Pryor et al., 2014). In addition, projections indicate that intervening dry periods will become longer, a variable that has been used to indicate an increase in the chance of drought (Figure 4.22).
FIGURE 4.20. PROJECTED CHANGES IN TOTAL ANNUAL AVERAGE PRECIPITATION (INCHES) FOR THE MIDDLE OF THE CURRENT CENTURY (2041-2070) RELATIVE TO THE END OF THE LAST CENTURY (1971-2000) ACROSS THE MIDWEST UNDER A HIGH EMISSIONS (A2) SCENARIO. FIGURE SOURCE: PRYOR ET AL., 2014.
M I N N E S O T A C L I M A T E A N D H E A L T H P R O F I L E R E P O R T
33
FIGURE 4.21. MONTHLY AVERAGES OF PRECIPITATION (INCHES) FOR MINNESOTA BASED ON RCP8.5 EMISSION SCENARIO OVER FOUR TIME PERIODS. EACH SOLID LINE REPRESENTS AN AVERAGE OF 30 DIFFERENT CLIMATE PROJECTION MODELS WHILE SHADED AREAS AROUND EACH LINE REPRESENT STANDARD DEVIATIONS. FIGURE SOURCE: NCCV (HTTP://WWW.USGS.GOV/CLIMATE_LANDUSE/CLU_RD/NCCV.ASP), USGS, USA.
FIGURE 4.22. CHANGE IN AVERAGE MAXIMUM NUMBER OF CONSECUTIVE DAYS EACH YEAR WITH LESS THAN 0.01 INCHES OF PRECIPITATION FOR THE MIDDLE OF THE CURRENT CENTURY (2041-2070) RELATIVE TO THE END OF THE LAST CENTURY (1971-2000) ACROSS THE MIDWEST UNDER A HIGH EMISSIONS (A2) SCENARIO. AN INCREASE IN THIS VARIABLE HAS BEEN USED TO INDICATE AN INCREASE IN THE CHANCE OF DROUGHT IN THE FUTURE. FIGURE SOURCE: PRYOR ET AL., 2014.
M I N N E S O T A C L I M A T E A N D H E A L T H P R O F I L E R E P O R T
34
FIGURE 4.23. MONTHLY AVERAGES OF SNOW WATER (INCHES) FOR MINNESOTA BASED ON RCP8.5 EMISSION SCENARIO OVER FOUR TIME PERIODS. EACH SOLID LINE REPRESENTS AN AVERAGE OF 30 DIFFERENT CLIMATE PROJECTION MODELS WHILE SHADED AREAS AROUND EACH LINE REPRESENT STANDARD DEVIATIONS. FIGURE SOURCE: NCCV (HTTP://WWW.USGS.GOV/CLIMATE_LANDUSE/CLU_RD/NCCV.ASP), USGS, USA.
FIGURE 4.24. MONTHLY AVERAGES OF RUNOFF (INCHES PER MONTH) FOR MINNESOTA BASED ON RCP8.5 EMISSION SCENARIO OVER FOUR TIME PERIODS. RUNOFF IS DEFINED AS THE SUM OF DIRECT RUNOFF THAT OCCURS FROM PRECIPITATION AND SNOW MELT AND SURPLUS RUNOFF WHICH OCCURS WHEN SOIL MOISTURE IS AT 100% CAPACITY. EACH SOLID LINE REPRESENTS AN AVERAGE OF 30 DIFFERENT CLIMATE PROJECTION MODELS WHILE SHADED AREAS AROUND EACH LINE REPRESENT STANDARD DEVIATIONS. FIGURE SOURCE: NCCV (HTTP://WWW.USGS.GOV/CLIMATE_LANDUSE/CLU_RD/NCCV.ASP), USGS, USA.
The amount of precipitation occurring as snowfall in the winter is projected to decrease, with a larger proportion falling as rain, in part due to warming temperatures (Figure 4.23). Snowpack strongly influences seasonal runoff. Less snowpack coupled with earlier snow melt, is expected to change the timing and magnitude of surface runoff with implications for future flooding, which may occur earlier in the spring season (Figure 4.24).
M I N N E S O T A C L I M A T E A N D H E A L T H P R O F I L E R E P O R T
35
Projections of temperature and precipitation shifts suggest future climate changes are likely to have substantial impacts on Minnesota’s ecosystems and agriculture. Plant hardiness zones provide a standard by which growers can determine which plants are most likely to thrive at a certain location. Plant hardiness zones in the Midwest have already changed significantly (Kart et al., 2009). In the future, hardiness zones for the winter season are projected to shift one-half to one full zone every 30 years across the Midwest (Figure 4.25). This may have repercussions for crop yields and viability of both native and invasive species. By the end of the 21st century, plants now associated with the Southeastern U.S. may become established throughout the Midwest, while some native plant and tree species may disappear altogether. For example, the range size of many exemplar tree species for Minnesota, such as paper birch, quaking aspen, balsam fir and black spruce, are projected to decline substantially across the northern Midwest, while species that are common farther south, like some oaks and pines, will move northward into the region (Figure 4.26).
FIGURE 4.25. OBSERVED AND PROJECTED CHANGES IN PLANT HARDINESS ZONES. NORTHWARD SHIFTS IN PLANT HARDINESS ZONES HAVE ALREADY OCCURRED ACROSS THE MIDWEST AND ARE PROJECTED TO CONTINUE. EACH ZONE REPRESENTS A 10°F RANGE IN THE LOWEST TEMPERATURE OF THE YEAR, WITH ZONE 3 REPRESENTING -40 TO -30°F AND ZONE 8 REPRESENTING 10 TO 20°F. FIGURE SOURCE: KARL ET AL., 2009.
FIGURE 4.26. CURRENT AND PROJECTED DISTRIBUTION OF FOREST TYPES IN THE MIDWEST. PROJECTED FUTURE DISTRIBUTION MAPS ARE BASED ON SRES LOWER AND HIGHER GREENHOUSE GAS EMISSIONS SCENARIOS. FIGURE SOURCE: PRASAD ET AL., 2007.
M I N N E S O T A C L I M A T E A N D H E A L T H P R O F I L E R E P O R T
36
Studies by University of Minnesota researchers offer another perspective on the potential for substantial changes to Minnesota’s ecosystems and natural resources. Galatowitsch and colleagues (2009) used climate projections to assess impacts for eight “landscape” regions in Minnesota with results indicating that each of these regions may be replaced by climate areas currently located 400-500 kilometers to the south or southwest (Figure 4.27). For example, projections suggest that by mid-century the current climate of Minnesota northern peatlands will be replaced by climate conditions representative of the far southwestern border of the state. Boreal peatlands are a unique and valuable ecosystem for the state and region given that peatlands effectively store carbon: one-third of the world’s soil carbon pool is sequestered in peatlands. Mounting evidence suggests that warming trends are already disrupting the ability of Minnesota peatlands to capture and store carbon, which may potentially lead to larger releases of sequestered carbon to the atmosphere (Keller et al., 2004).
FIGURE 4.27. FUTURE CLIMATE ANALOGS FOR SELECT MINNESOTA LANDSCAPES. EIGHT UNIQUE ECOSYSTEMS IN MINNESOTA ARE IDENTIFIED IN BLUE. ASSOCIATED BROWN COLORED AREAS TO THE SOUTH REPRESENT CURRENT CLIMATES MOST RESEMBLING WHAT THE BLUE AREAS WILL BECOME BY MID-CENTURY (2060-2069) BASED ON HIGH EMISSIONS CLIMATE CHANGE PROJECTIONS. FIGURE BASED ON RESEARCH BY GALATOWITSCH ET AL., 2009. FIGURE SOURCE: DNR, 2011.

M I N N E S O T A C L I M A T E A N D H E A L T H P R O F I L E R E P O R T
37
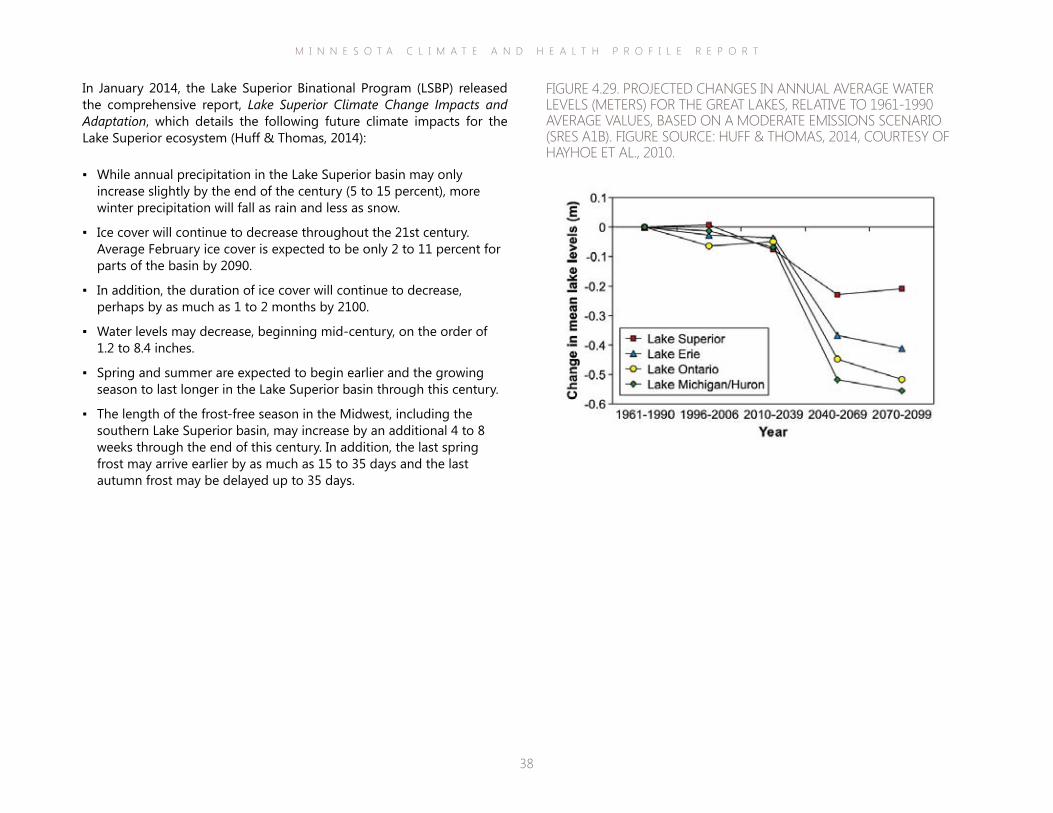
ecosystems, Lake Superior. Minnesota’s Great Lake contains nine percent of the world’s surface fresh water and is considered the most pristine of the Great Lakes. Yet it faces a range of ongoing challenges—spread of invasive species, declining resident species, legacy and emerging pollutants, land development and hydropower dams—including climate change stressors. Climate stressors include higher water temperatures, falling lake levels (Figure 4.29) and reduced snow fall.
All major groups of animals, including birds, mammals, amphibians, reptiles, and insects, are likely to be affected by future impacts to Minnesota’s ecosystems. Die-offs of moose and common loons, iconic animals for Minnesota, have already been documented, and projections suggest serious population declines in the future (Figure 4.28; Gardner, 2013; Robbins, 2013).
Climate projections also indicate substantial impacts to one of Minnesota’s most prized
FIGURE 4.28. POTENTIAL FUTURE CHANGES IN THE INCIDENCE OF THE COMMON LOON. CURRENT INCIDENCE IS SHOWN ON THE LEFT AND PROJECTED INCIDENCE FOR 2099 UNDER A HIGH EMISSIONS SCENARIO IS SHOWN ON THE RIGHT. FIGURE SOURCE: HUFF & THOMAS, 2014.
M I N N E S O T A C L I M A T E A N D H E A L T H P R O F I L E R E P O R T
38
In January 2014, the Lake Superior Binational Program (LSBP) released the comprehensive report, Lake Superior Climate Change Impacts and Adaptation, which details the following future climate impacts for the Lake Superior ecosystem (Huff & Thomas, 2014):
▪ While annual precipitation in the Lake Superior basin may only increase slightly by the end of the century (5 to 15 percent), more winter precipitation will fall as rain and less as snow.
▪ Ice cover will continue to decrease throughout the 21st century. Average February ice cover is expected to be only 2 to 11 percent for parts of the basin by 2090.
▪ In addition, the duration of ice cover will continue to decrease, perhaps by as much as 1 to 2 months by 2100.
▪ Water levels may decrease, beginning mid-century, on the order of 1.2 to 8.4 inches.
▪ Spring and summer are expected to begin earlier and the growing season to last longer in the Lake Superior basin through this century.
▪ The length of the frost-free season in the Midwest, including the southern Lake Superior basin, may increase by an additional 4 to 8 weeks through the end of this century. In addition, the last spring frost may arrive earlier by as much as 15 to 35 days and the last autumn frost may be delayed up to 35 days.
FIGURE 4.29. PROJECTED CHANGES IN ANNUAL AVERAGE WATER LEVELS (METERS) FOR THE GREAT LAKES, RELATIVE TO 1961-1990 AVERAGE VALUES, BASED ON A MODERATE EMISSIONS SCENARIO (SRES A1B). FIGURE SOURCE: HUFF & THOMAS, 2014, COURTESY OF HAYHOE ET AL., 2010.
M I N N E S O T A C L I M A T E A N D H E A L T H P R O F I L E R E P O R T
39
communities. For example, GHG emissions directly contribute to air pollution and inhalation exposures that are associated with poor health outcomes. GHG emissions also cause higher ambient temperatures which facilitate chemical reactions that lead to toxic by-products, like ground-level ozone, which can aggravate certain conditions like asthma. High ozone alert days reduce worker productivity, especially for outdoor occupations, and stifle outdoor recreation activities, which foster physical activity and community cohesion.
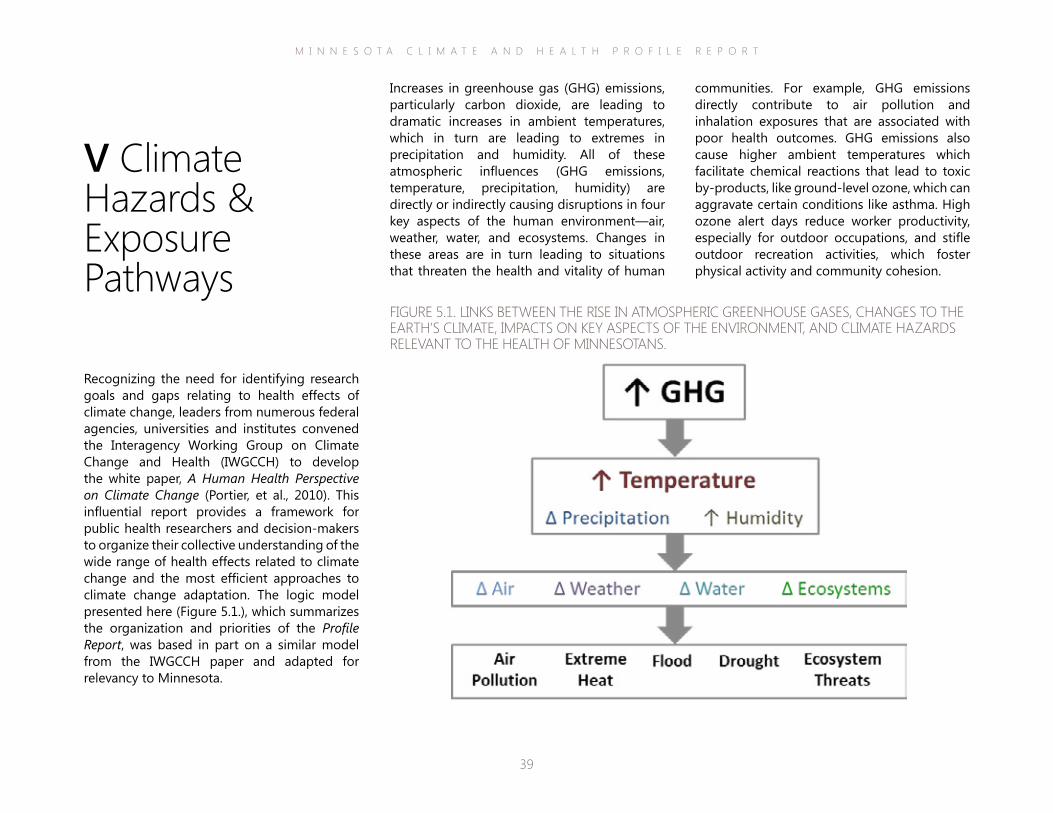
Increases in greenhouse gas (GHG) emissions, particularly carbon dioxide, are leading to dramatic increases in ambient temperatures, which in turn are leading to extremes in precipitation and humidity. All of these atmospheric influences (GHG emissions, temperature, precipitation, humidity) are directly or indirectly causing disruptions in four key aspects of the human environment—air, weather, water, and ecosystems. Changes in these areas are in turn leading to situations that threaten the health and vitality of human
V Climate Hazards & Exposure Pathways
Recognizing the need for identifying research goals and gaps relating to health effects of climate change, leaders from numerous federal agencies, universities and institutes convened the Interagency Working Group on Climate Change and Health (IWGCCH) to develop the white paper, A Human Health Perspective on Climate Change (Portier, et al., 2010). This influential report provides a framework for public health researchers and decision-makers to organize their collective understanding of the wide range of health effects related to climate change and the most efficient approaches to climate change adaptation. The logic model presented here (Figure 5.1.), which summarizes the organization and priorities of the Profile Report, was based in part on a similar model from the IWGCCH paper and adapted for relevancy to Minnesota.
FIGURE 5.1. LINKS BETWEEN THE RISE IN ATMOSPHERIC GREENHOUSE GASES, CHANGES TO THE EARTH’S CLIMATE, IMPACTS ON KEY ASPECTS OF THE ENVIRONMENT, AND CLIMATE HAZARDS RELEVANT TO THE HEALTH OF MINNESOTANS.
M I N N E S O T A C L I M A T E A N D H E A L T H P R O F I L E R E P O R T
40
The following sections of the Profile Report will expand on five specific climate hazards and describe how they are likely to affect the health of Minnesotans, i.e., air pollution, extreme heat, flooding, drought, and ecosystem threats. Each section includes a brief review of the climate hazard, associated exposure pathways and vulnerability factors along with the corresponding health outcomes in order to facilitate ongoing discussions and analyses of the health risks associated with climate change in Minnesota. The overarching goal of providing this information is to highlight what is currently known about each climate hazard and potential health impacts, as well as data or information gaps and various system challenges that are making it difficult to improve our knowledge base and subsequent promotion of climate adaption actions.

M I N N E S O T A C L I M A T E A N D H E A L T H P R O F I L E R E P O R T
41
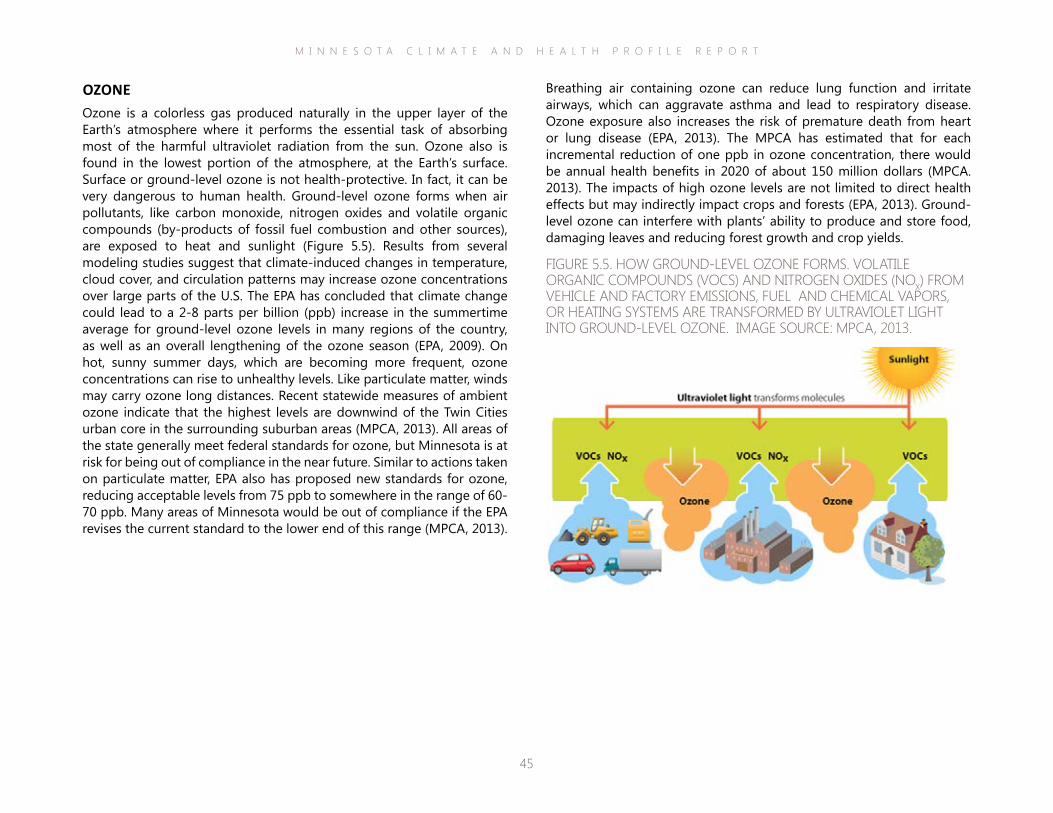
Air PollutionA number of factors can contribute to “bad air days”, including unfavorable weather, air pollutants such as greenhouse gas emissions and particulate matter, and high pollen counts (EPA, 2008; Jacob & Winner, 2009). Hotter, more stagnant weather systems combined with rising levels of air contaminants may lead to longer periods of exposure to a greater amount of pollutants for many Americans (Fang et al., 2013; Norris et al., 2000). Already, nearly 5 in 10 people live where pollution levels are often dangerous to breathe (ALA, 2014). In addition, some emission pollutants can trigger climate conditions that add to and amplify existing contamination and health risks. For example, breathing in particulate matter (such as black carbon, a component of soot) for even short periods of time is associated with an increased risk of heart attack and other forms of heart disease (Fang et al., 2002; Zanobetti et al., 2014). In addition, black carbon particles absorb sunlight increasing atmospheric temperatures, which contribute to the formation of another major pollutant, ground-level ozone, which is also harmful to health (EPA, 2012).
Minnesota’s overall air quality has improved over the past two decades (MPCA, 2013). This is a notable accomplishment given that population density, greenhouse gas emissions, and economic activity have increased (Figure 5.2).
FIGURE 5.2. COMPARISON OF GROWTH AREAS AND EMISSIONS IN MINNESOTA. MINNESOTA’S AIR QUALITY IS IMPROVING DESPITE INCREASES IN POPULATION AND ECONOMIC ACTIVITY. IMAGE SOURCE: MPCA, 2013.

M I N N E S O T A C L I M A T E A N D H E A L T H P R O F I L E R E P O R T
42
For over a decade, Minnesota air has met federal air quality limits for most major air pollutants. The Air Quality Index (AQI) is used to represent real-time air quality conditions and communicate current health risk to the public. Minnesota has experienced only a small number of days where the AQI exceeded the range for healthy air conditions (Figure 5.3), and generally the average annual AQI for the state has been consistently below the national average.
Yet, air quality issues are a concern for public health, and many sources of air pollution in the state are challenging to address. Small, widespread sources of air emissions—like cars, trucks and wood burning—are significant contributors to pollution in Minnesota and lack the same oversight as factories or power plants (MPCA, 2014). Air quality in Minnesota’s urban centers, especially the Twin Cities metro area, is worse compared to other areas of the state, largely due to elevated levels of ozone and particulate matter (MPCA, 2013; 2014). Many air pollutants can travel long distances, especially on windy days. Thus, a pollutant like ozone generated in the densely populated Twin Cities area, where ozone pre-cursors (from traffic and power plant emissions) are plentiful, can be transported across the state impacting air quality in suburban and rural areas (MPCA, 2014). Conversely, rural and suburban areas with allergenic trees, plants and shrubs can negatively impact urban “airsheds.” Pollen from a ragweed plant can travel up to 400 miles by wind (NIAID, 2012).
FIGURE 5.3. AIR QUALITY INDEX (AQI) TRENDS FOR MINNESOTA, 2003-2013. ASSIGNED TO EACH DAY OF THE YEAR, AN AQI VALUE CORRELATES TO ONE OF FIVE HEALTH-BASED CATEGORIES: GOOD, MODERATE, UNHEALTHY FOR SENSITIVE GROUPS, UNHEALTHY, AND VERY UNHEALTHY. THE DAILY AQI IS BASED ON THE HIGHEST POLLUTANT MEASURED ACROSS ALL MINNESOTA MONITORING SITES (OVER 30 STATIONS ACROSS THE STATE). THE STATEWIDE AQI TREND SHOWS IMPROVEMENTS IN AIR QUALITY OVER TIME. IMAGE ADAPTED FROM MPCA, 2014.
M I N N E S O T A C L I M A T E A N D H E A L T H P R O F I L E R E P O R T
43
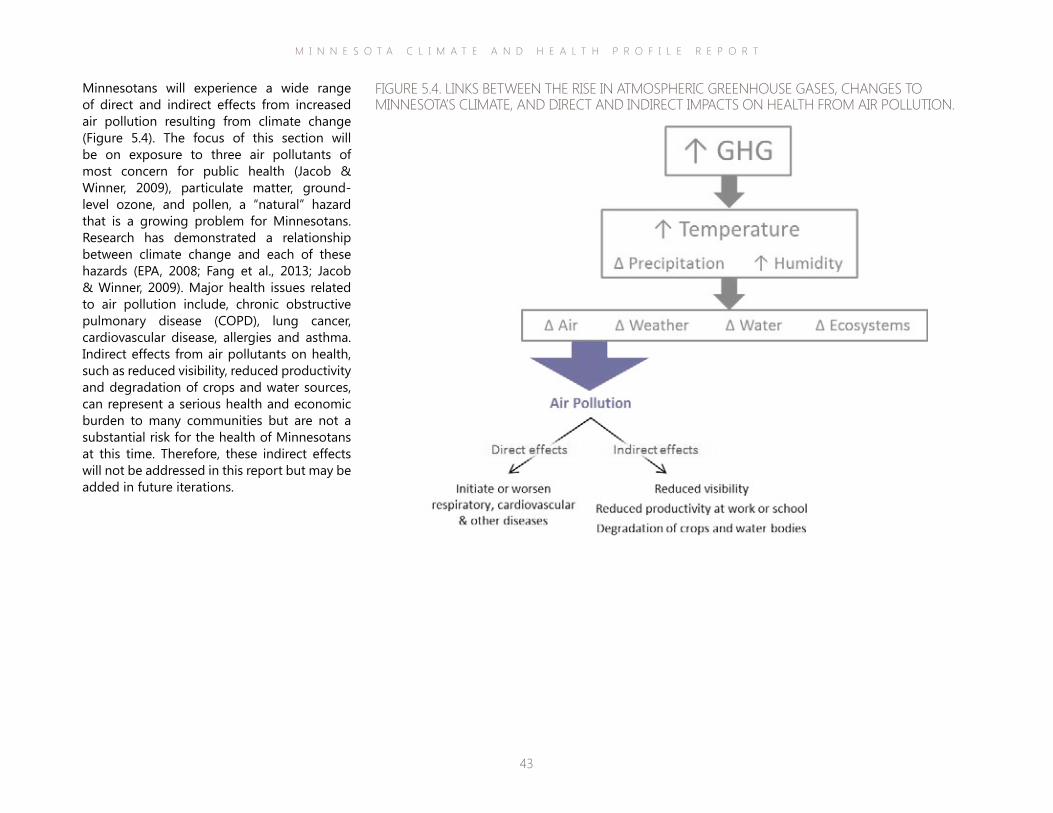
Minnesotans will experience a wide range of direct and indirect effects from increased air pollution resulting from climate change (Figure 5.4). The focus of this section will be on exposure to three air pollutants of most concern for public health (Jacob & Winner, 2009), particulate matter, ground-level ozone, and pollen, a “natural” hazard that is a growing problem for Minnesotans. Research has demonstrated a relationship between climate change and each of these hazards (EPA, 2008; Fang et al., 2013; Jacob & Winner, 2009). Major health issues related to air pollution include, chronic obstructive pulmonary disease (COPD), lung cancer, cardiovascular disease, allergies and asthma. Indirect effects from air pollutants on health, such as reduced visibility, reduced productivity and degradation of crops and water sources, can represent a serious health and economic burden to many communities but are not a substantial risk for the health of Minnesotans at this time. Therefore, these indirect effects will not be addressed in this report but may be added in future iterations.
FIGURE 5.4. LINKS BETWEEN THE RISE IN ATMOSPHERIC GREENHOUSE GASES, CHANGES TO MINNESOTA’S CLIMATE, AND DIRECT AND INDIRECT IMPACTS ON HEALTH FROM AIR POLLUTION.
M I N N E S O T A C L I M A T E A N D H E A L T H P R O F I L E R E P O R T
44
and river basins, nutrient depletion in soils, and reductions in visibility (EPA, 2014).
The Minnesota Pollution Control Agency (MPCA) collects hourly measurements of fine particles, ozone, sulfur dioxide, and carbon monoxide at over 30 locations across the state and posts hourly AQI results on the MPCA website (www.pca.state.mn.us). Statewide levels of particulate matter (both PM2.5 & PM10) in Minnesota generally meet annual and daily standards and are below the national mean (MPCA, 2013). However, in 2012, the EPA strengthened the annual air standard for PM2.5 from 15 micrograms per cubic meter of air (μg/m3) to 12 μg/m3, putting some urban areas of the state under pressure to remain in compliance (MPCA, 2013). MPCA has calculated estimates of the health benefits associated with improving air quality in Minnesota. For each reduction of one μg/m3 in annual ambient PM2.5 levels, there would be annual health benefits in 2020 of about two billion dollars (MPCA, 2013).
PARTICULATE MATTER Particulate matter is a broad class of chemically and physically diverse material that exists over a wide range of sizes. Two sizes in particular are associated with adverse health effects: coarse particles with diameters less than or equal to 10 microns (PM10) and fine particles with diameters less than or equal to 2.5 microns (PM2.5). Particulate matter can be released directly from sources, such as forest fires or factories, or they can form when emissions from power plants and vehicles react in the air. Vehicle exhaust contributes one-third to one-half of fine particle concentrations in urban areas (MPCA, 2013). Particulate matter is both a product and cause of climate change (Ebi & McGregor, 2008; Griffin, 2013). According to experts, certain types of particulate matter are “extremely important climate forcers” (Dawson et al., 2014) because they can absorb and radiate energy from the sun, contributing toward global warming trends. Particulate matter also affects cloud formation and duration (Griffin, 2013). Current studies suggest that air stagnation and precipitation frequency may be important aspects of the relationship between climate change and particle pollution (Jacob & Winner, 2009). Levels of particulate matter in the air can fluctuate across seasons, but in general, it is viewed as a year-round air quality problem. Patterns of particulate matter are difficult to predict given the influence of local factors and sources coupled with the fact that particles can travel long distances.
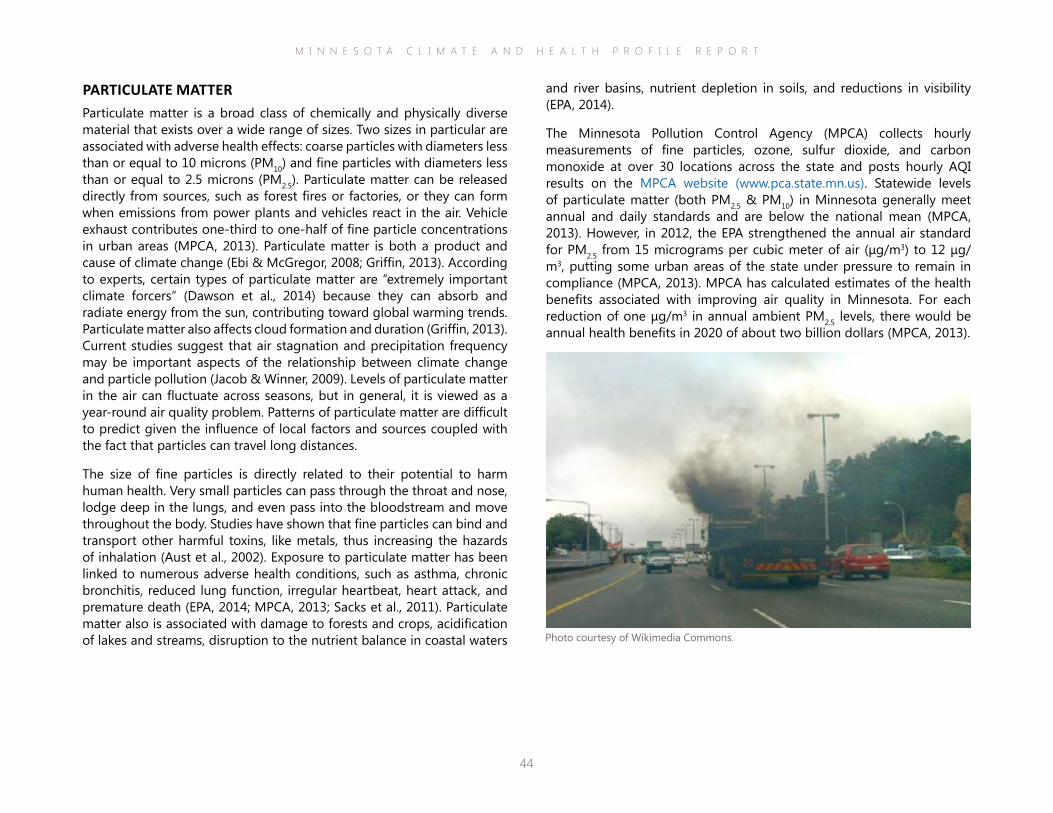
The size of fine particles is directly related to their potential to harm human health. Very small particles can pass through the throat and nose, lodge deep in the lungs, and even pass into the bloodstream and move throughout the body. Studies have shown that fine particles can bind and transport other harmful toxins, like metals, thus increasing the hazards of inhalation (Aust et al., 2002). Exposure to particulate matter has been linked to numerous adverse health conditions, such as asthma, chronic bronchitis, reduced lung function, irregular heartbeat, heart attack, and premature death (EPA, 2014; MPCA, 2013; Sacks et al., 2011). Particulate matter also is associated with damage to forests and crops, acidification of lakes and streams, disruption to the nutrient balance in coastal waters Photo courtesy of Wikimedia Commons.
M I N N E S O T A C L I M A T E A N D H E A L T H P R O F I L E R E P O R T
45
Breathing air containing ozone can reduce lung function and irritate airways, which can aggravate asthma and lead to respiratory disease. Ozone exposure also increases the risk of premature death from heart or lung disease (EPA, 2013). The MPCA has estimated that for each incremental reduction of one ppb in ozone concentration, there would be annual health benefits in 2020 of about 150 million dollars (MPCA. 2013). The impacts of high ozone levels are not limited to direct health effects but may indirectly impact crops and forests (EPA, 2013). Ground-level ozone can interfere with plants’ ability to produce and store food, damaging leaves and reducing forest growth and crop yields.
OZONEOzone is a colorless gas produced naturally in the upper layer of the Earth’s atmosphere where it performs the essential task of absorbing most of the harmful ultraviolet radiation from the sun. Ozone also is found in the lowest portion of the atmosphere, at the Earth’s surface. Surface or ground-level ozone is not health-protective. In fact, it can be very dangerous to human health. Ground-level ozone forms when air pollutants, like carbon monoxide, nitrogen oxides and volatile organic compounds (by-products of fossil fuel combustion and other sources), are exposed to heat and sunlight (Figure 5.5). Results from several modeling studies suggest that climate-induced changes in temperature, cloud cover, and circulation patterns may increase ozone concentrations over large parts of the U.S. The EPA has concluded that climate change could lead to a 2-8 parts per billion (ppb) increase in the summertime average for ground-level ozone levels in many regions of the country, as well as an overall lengthening of the ozone season (EPA, 2009). On hot, sunny summer days, which are becoming more frequent, ozone concentrations can rise to unhealthy levels. Like particulate matter, winds may carry ozone long distances. Recent statewide measures of ambient ozone indicate that the highest levels are downwind of the Twin Cities urban core in the surrounding suburban areas (MPCA, 2013). All areas of the state generally meet federal standards for ozone, but Minnesota is at risk for being out of compliance in the near future. Similar to actions taken on particulate matter, EPA also has proposed new standards for ozone, reducing acceptable levels from 75 ppb to somewhere in the range of 60-70 ppb. Many areas of Minnesota would be out of compliance if the EPA revises the current standard to the lower end of this range (MPCA, 2013).
FIGURE 5.5. HOW GROUND-LEVEL OZONE FORMS. VOLATILE ORGANIC COMPOUNDS (VOCS) AND NITROGEN OXIDES (NOX) FROM VEHICLE AND FACTORY EMISSIONS, FUEL AND CHEMICAL VAPORS, OR HEATING SYSTEMS ARE TRANSFORMED BY ULTRAVIOLET LIGHT INTO GROUND-LEVEL OZONE. IMAGE SOURCE: MPCA, 2013.
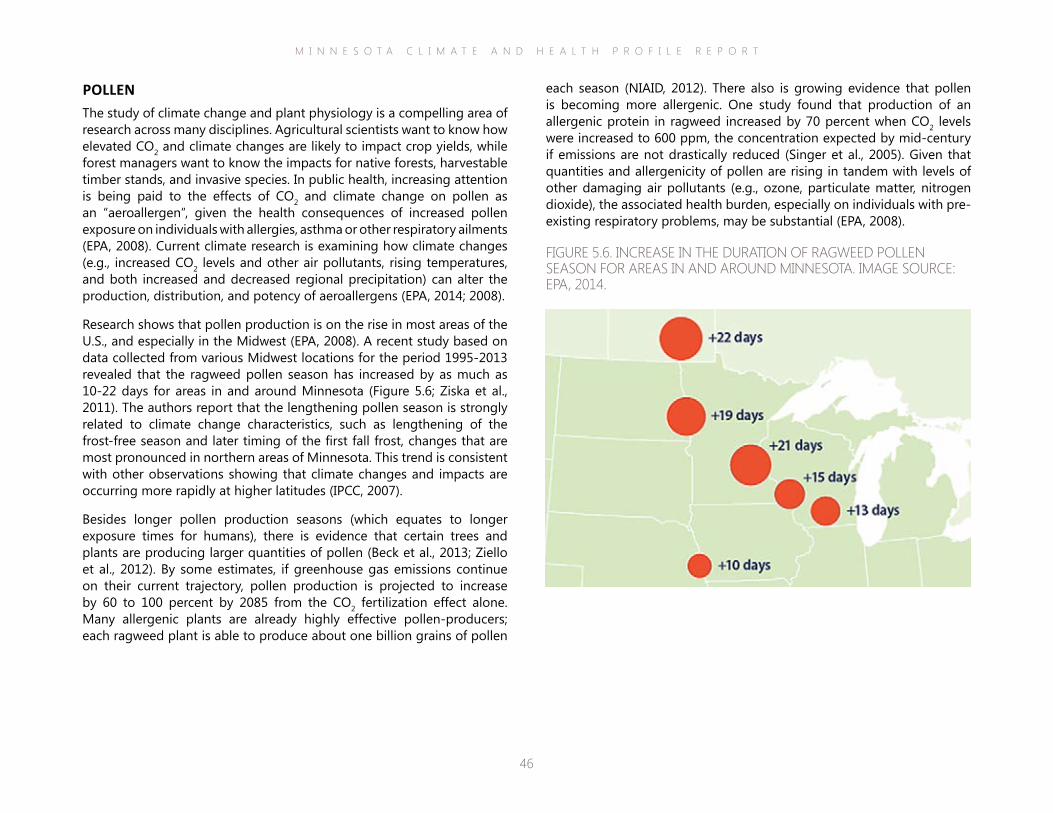
M I N N E S O T A C L I M A T E A N D H E A L T H P R O F I L E R E P O R T
46
each season (NIAID, 2012). There also is growing evidence that pollen is becoming more allergenic. One study found that production of an allergenic protein in ragweed increased by 70 percent when CO2 levels were increased to 600 ppm, the concentration expected by mid-century if emissions are not drastically reduced (Singer et al., 2005). Given that quantities and allergenicity of pollen are rising in tandem with levels of other damaging air pollutants (e.g., ozone, particulate matter, nitrogen dioxide), the associated health burden, especially on individuals with pre-existing respiratory problems, may be substantial (EPA, 2008).
POLLEN The study of climate change and plant physiology is a compelling area of research across many disciplines. Agricultural scientists want to know how elevated CO2 and climate changes are likely to impact crop yields, while forest managers want to know the impacts for native forests, harvestable timber stands, and invasive species. In public health, increasing attention is being paid to the effects of CO2 and climate change on pollen as an “aeroallergen”, given the health consequences of increased pollen exposure on individuals with allergies, asthma or other respiratory ailments (EPA, 2008). Current climate research is examining how climate changes (e.g., increased CO2 levels and other air pollutants, rising temperatures, and both increased and decreased regional precipitation) can alter the production, distribution, and potency of aeroallergens (EPA, 2014; 2008).
Research shows that pollen production is on the rise in most areas of the U.S., and especially in the Midwest (EPA, 2008). A recent study based on data collected from various Midwest locations for the period 1995-2013 revealed that the ragweed pollen season has increased by as much as 10-22 days for areas in and around Minnesota (Figure 5.6; Ziska et al., 2011). The authors report that the lengthening pollen season is strongly related to climate change characteristics, such as lengthening of the frost-free season and later timing of the first fall frost, changes that are most pronounced in northern areas of Minnesota. This trend is consistent with other observations showing that climate changes and impacts are occurring more rapidly at higher latitudes (IPCC, 2007).
Besides longer pollen production seasons (which equates to longer exposure times for humans), there is evidence that certain trees and plants are producing larger quantities of pollen (Beck et al., 2013; Ziello et al., 2012). By some estimates, if greenhouse gas emissions continue on their current trajectory, pollen production is projected to increase by 60 to 100 percent by 2085 from the CO2 fertilization effect alone. Many allergenic plants are already highly effective pollen-producers; each ragweed plant is able to produce about one billion grains of pollen
FIGURE 5.6. INCREASE IN THE DURATION OF RAGWEED POLLEN SEASON FOR AREAS IN AND AROUND MINNESOTA. IMAGE SOURCE: EPA, 2014.
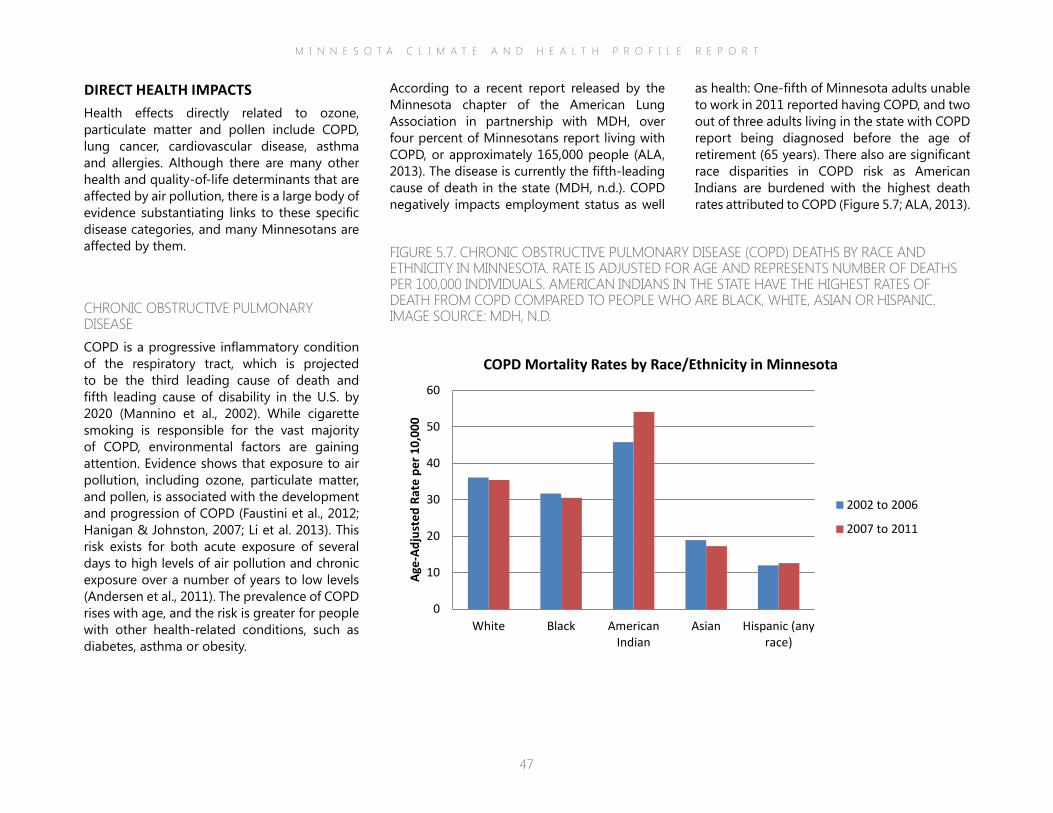
M I N N E S O T A C L I M A T E A N D H E A L T H P R O F I L E R E P O R T
47
as health: One-fifth of Minnesota adults unable to work in 2011 reported having COPD, and two out of three adults living in the state with COPD report being diagnosed before the age of retirement (65 years). There also are significant race disparities in COPD risk as American Indians are burdened with the highest death rates attributed to COPD (Figure 5.7; ALA, 2013).
According to a recent report released by the Minnesota chapter of the American Lung Association in partnership with MDH, over four percent of Minnesotans report living with COPD, or approximately 165,000 people (ALA, 2013). The disease is currently the fifth-leading cause of death in the state (MDH, n.d.). COPD negatively impacts employment status as well
DIRECT HEALTH IMPACTSHealth effects directly related to ozone, particulate matter and pollen include COPD, lung cancer, cardiovascular disease, asthma and allergies. Although there are many other health and quality-of-life determinants that are affected by air pollution, there is a large body of evidence substantiating links to these specific disease categories, and many Minnesotans are affected by them.
CHRONIC OBSTRUCTIVE PULMONARY DISEASECOPD is a progressive inflammatory condition of the respiratory tract, which is projected to be the third leading cause of death and fifth leading cause of disability in the U.S. by 2020 (Mannino et al., 2002). While cigarette smoking is responsible for the vast majority of COPD, environmental factors are gaining attention. Evidence shows that exposure to air pollution, including ozone, particulate matter, and pollen, is associated with the development and progression of COPD (Faustini et al., 2012; Hanigan & Johnston, 2007; Li et al. 2013). This risk exists for both acute exposure of several days to high levels of air pollution and chronic exposure over a number of years to low levels (Andersen et al., 2011). The prevalence of COPD rises with age, and the risk is greater for people with other health-related conditions, such as diabetes, asthma or obesity.
FIGURE 5.7. CHRONIC OBSTRUCTIVE PULMONARY DISEASE (COPD) DEATHS BY RACE AND ETHNICITY IN MINNESOTA. RATE IS ADJUSTED FOR AGE AND REPRESENTS NUMBER OF DEATHS PER 100,000 INDIVIDUALS. AMERICAN INDIANS IN THE STATE HAVE THE HIGHEST RATES OF DEATH FROM COPD COMPARED TO PEOPLE WHO ARE BLACK, WHITE, ASIAN OR HISPANIC. IMAGE SOURCE: MDH, N.D.
0
10
20
30
40
50
60
White Black AmericanIndian
Asian Hispanic (anyrace)
Age-
Adju
sted
Rat
e pe
r 10,
000
COPD Mortality Rates by Race/Ethnicity in Minnesota
2002 to 2006
2007 to 2011
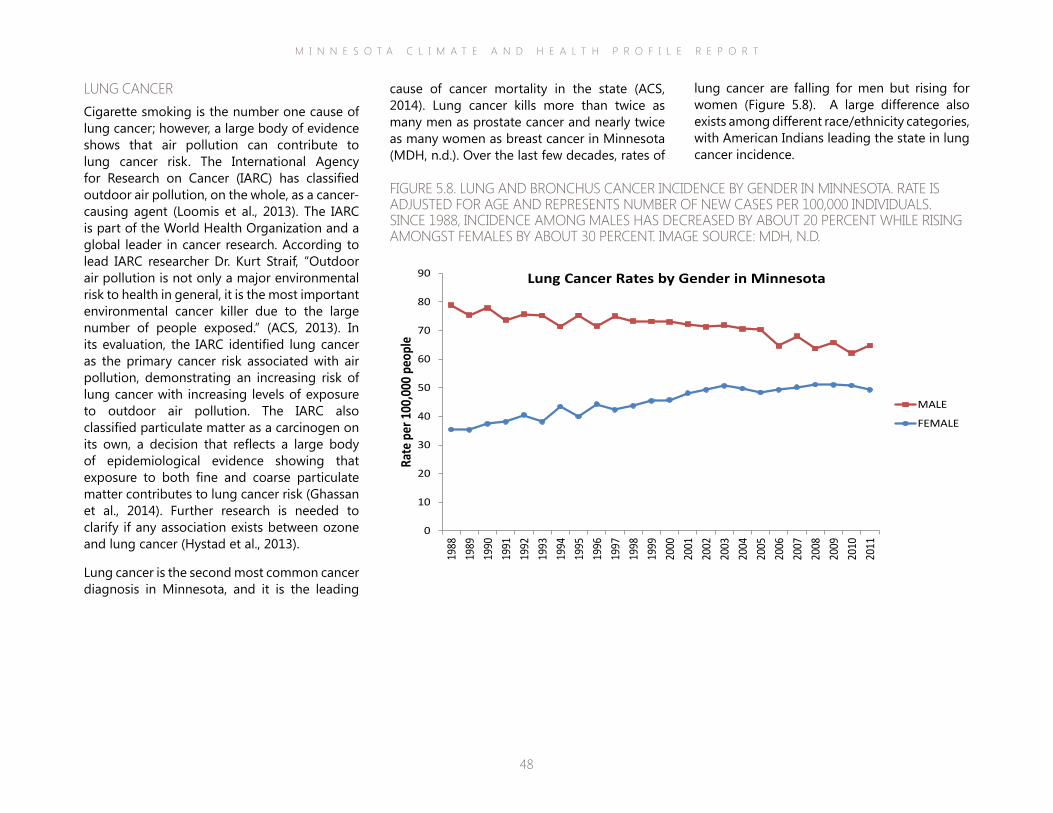
M I N N E S O T A C L I M A T E A N D H E A L T H P R O F I L E R E P O R T
48
lung cancer are falling for men but rising for women (Figure 5.8). A large difference also exists among different race/ethnicity categories, with American Indians leading the state in lung cancer incidence.
cause of cancer mortality in the state (ACS, 2014). Lung cancer kills more than twice as many men as prostate cancer and nearly twice as many women as breast cancer in Minnesota (MDH, n.d.). Over the last few decades, rates of
LUNG CANCERCigarette smoking is the number one cause of lung cancer; however, a large body of evidence shows that air pollution can contribute to lung cancer risk. The International Agency for Research on Cancer (IARC) has classified outdoor air pollution, on the whole, as a cancer-causing agent (Loomis et al., 2013). The IARC is part of the World Health Organization and a global leader in cancer research. According to lead IARC researcher Dr. Kurt Straif, “Outdoor air pollution is not only a major environmental risk to health in general, it is the most important environmental cancer killer due to the large number of people exposed.” (ACS, 2013). In its evaluation, the IARC identified lung cancer as the primary cancer risk associated with air pollution, demonstrating an increasing risk of lung cancer with increasing levels of exposure to outdoor air pollution. The IARC also classified particulate matter as a carcinogen on its own, a decision that reflects a large body of epidemiological evidence showing that exposure to both fine and coarse particulate matter contributes to lung cancer risk (Ghassan et al., 2014). Further research is needed to clarify if any association exists between ozone and lung cancer (Hystad et al., 2013).
Lung cancer is the second most common cancer diagnosis in Minnesota, and it is the leading
FIGURE 5.8. LUNG AND BRONCHUS CANCER INCIDENCE BY GENDER IN MINNESOTA. RATE IS ADJUSTED FOR AGE AND REPRESENTS NUMBER OF NEW CASES PER 100,000 INDIVIDUALS. SINCE 1988, INCIDENCE AMONG MALES HAS DECREASED BY ABOUT 20 PERCENT WHILE RISING AMONGST FEMALES BY ABOUT 30 PERCENT. IMAGE SOURCE: MDH, N.D.
0
10
20
30
40
50
60
70
80
90
1988
1989
1990
1991
1992
1993
1994
1995
1996
1997
1998
1999
2000
2001
2002
2003
2004
2005
2006
2007
2008
2009
2010
2011
Rate
per
100
,000
peo
ple
Lung Cancer Rates by Gender in Minnesota
MALE
FEMALE
M I N N E S O T A C L I M A T E A N D H E A L T H P R O F I L E R E P O R T
49
disease: American Indians have consistently higher heart disease mortality compared to all other races (Peacock & Shanedling, 2011).
median rate. However, Minnesota continues to have lower mortality rates due to heart disease and stroke (Figure 5.9). Unfortunately, the racial disparities seen in other health outcomes also are seen in the trends for cardiovascular
CARDIOVASCULAR DISEASEDecades of research have shown that air pollution negatively impacts cardiovascular health and can trigger heart attacks, strokes, and irregular heart rhythms (EPA, 2014; Lee et al., 2014; Nawrot et al., 2011). Past evidence has focused on particulate matter as the primary contaminant of concern for cardiovascular health, but more attention is being paid to ozone and its role in vessel and heart-related disease. Large population studies have demonstrated that both long-term and short-term exposures to air pollution can lead to poor cardiovascular outcomes (Brook et al., 2004; Lee et al., 2014). Cardiovascular impacts are worse for individuals with pre-existing heart or blood vessel disease. A recent study of cardiac patients found that those living in high pollution areas were over 40 percent more likely to have a second heart attack or suffer congestive heart failure and 46 percent more likely to suffer a stroke (Koton et al., 2013).
According to a recent report by MDH, approximately 139,000 Minnesotans (3.5% of adults) have coronary heart disease, and over 90,000 (2.3% of adults) have had a stroke (Peacock & Shanedling, 2011). In 2009, heart disease and stroke were the second and fourth leading causes of death in the state, respectively. While Minnesotans have fewer risk factors related to cardiovascular disease (e.g., smoking, low physical activity, hypertension, diabetes), rates of overweight and obesity for the state have been consistently at or above the national
FIGURE 5.9. HEART DISEASE MORTALITY RATE FOR THE UNITED STATES (TOP BLUE LINE) AND MINNESOTA (BOTTOM BLACK LINE), INCLUDES ALL AGES, 2000-2009. RATE IS ADJUSTED FOR AGE AND REPRESENTS NUMBER OF DEATHS PER 100,000 INDIVIDUALS. IMAGE SOURCE: PEACOCK & SHANEDLING, 2011).
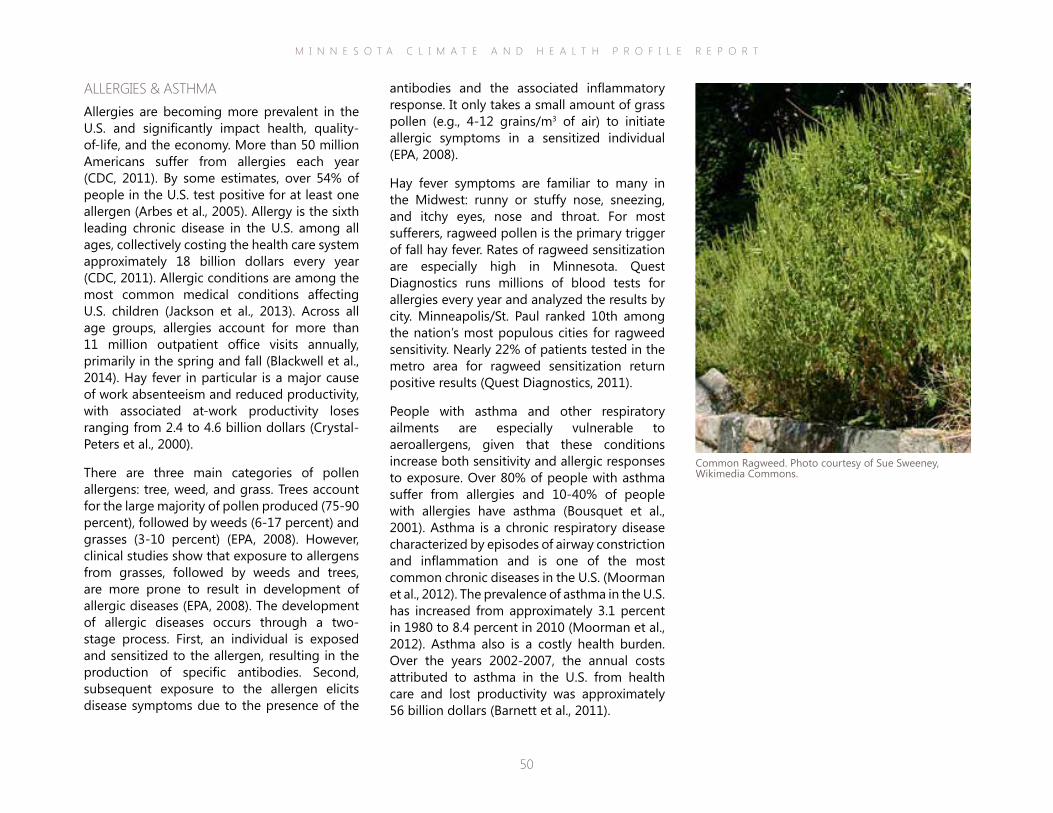
M I N N E S O T A C L I M A T E A N D H E A L T H P R O F I L E R E P O R T
50
antibodies and the associated inflammatory response. It only takes a small amount of grass pollen (e.g., 4-12 grains/m3 of air) to initiate allergic symptoms in a sensitized individual (EPA, 2008).
Hay fever symptoms are familiar to many in the Midwest: runny or stuffy nose, sneezing, and itchy eyes, nose and throat. For most sufferers, ragweed pollen is the primary trigger of fall hay fever. Rates of ragweed sensitization are especially high in Minnesota. Quest Diagnostics runs millions of blood tests for allergies every year and analyzed the results by city. Minneapolis/St. Paul ranked 10th among the nation’s most populous cities for ragweed sensitivity. Nearly 22% of patients tested in the metro area for ragweed sensitization return positive results (Quest Diagnostics, 2011).
People with asthma and other respiratory ailments are especially vulnerable to aeroallergens, given that these conditions increase both sensitivity and allergic responses to exposure. Over 80% of people with asthma suffer from allergies and 10-40% of people with allergies have asthma (Bousquet et al., 2001). Asthma is a chronic respiratory disease characterized by episodes of airway constriction and inflammation and is one of the most common chronic diseases in the U.S. (Moorman et al., 2012). The prevalence of asthma in the U.S. has increased from approximately 3.1 percent in 1980 to 8.4 percent in 2010 (Moorman et al., 2012). Asthma also is a costly health burden. Over the years 2002-2007, the annual costs attributed to asthma in the U.S. from health care and lost productivity was approximately 56 billion dollars (Barnett et al., 2011).
ALLERGIES & ASTHMAAllergies are becoming more prevalent in the U.S. and significantly impact health, quality-of-life, and the economy. More than 50 million Americans suffer from allergies each year (CDC, 2011). By some estimates, over 54% of people in the U.S. test positive for at least one allergen (Arbes et al., 2005). Allergy is the sixth leading chronic disease in the U.S. among all ages, collectively costing the health care system approximately 18 billion dollars every year (CDC, 2011). Allergic conditions are among the most common medical conditions affecting U.S. children (Jackson et al., 2013). Across all age groups, allergies account for more than 11 million outpatient office visits annually, primarily in the spring and fall (Blackwell et al., 2014). Hay fever in particular is a major cause of work absenteeism and reduced productivity, with associated at-work productivity loses ranging from 2.4 to 4.6 billion dollars (Crystal-Peters et al., 2000).
There are three main categories of pollen allergens: tree, weed, and grass. Trees account for the large majority of pollen produced (75-90 percent), followed by weeds (6-17 percent) and grasses (3-10 percent) (EPA, 2008). However, clinical studies show that exposure to allergens from grasses, followed by weeds and trees, are more prone to result in development of allergic diseases (EPA, 2008). The development of allergic diseases occurs through a two-stage process. First, an individual is exposed and sensitized to the allergen, resulting in the production of specific antibodies. Second, subsequent exposure to the allergen elicits disease symptoms due to the presence of the
Common Ragweed. Photo courtesy of Sue Sweeney, Wikimedia Commons.
M I N N E S O T A C L I M A T E A N D H E A L T H P R O F I L E R E P O R T
51
MDH maintains an asthma surveillance system to track and describe asthma prevalence in Minnesota. In 2012, eight percent, or 1 in 12, of Minnesota adults reported that they live with asthma compared to 8.9 percent, the median estimate for all U.S. states (W. Brunner, personal communication, July 22, 2014). While asthma prevalence has steadily increased across the U.S., rates for Minnesota have been relatively steady since 2006. However, rates of reported asthma for the Twin Cities metro area have been consistently higher compared to the rest of the state (Figure 5.10). In 2011, 7.1 percent of Minnesota children were reported to have asthma compared to the national estimate of 8.8 percent (MDH, 2012). However, there are distinct racial and ethnic disparities in asthma prevalence among Minnesota youth. Based on data from the 2013 Minnesota Student Survey, rates of asthma are higher in American Indian and African American youth compared to youth of other racial or ethnic groups. Impacts to Minnesota’s economy from asthma are substantial. In 2010, asthma required approximately 544 million dollars in direct medical expenditures and 62 million in missed work days (CDC, 2014).
FIGURE 5.10. PERCENTAGE OF ADULTS WITH ASTHMA IN THE TWIN CITIES METRO AREA COMPARED TO THE REST OF MINNESOTA. THE GAP BETWEEN 2010 AND 2011 INDICATES A CHANGE IN METHODOLOGY. IMAGE SOURCE: W. BRUNNER, UNPUBLISHED DATA.
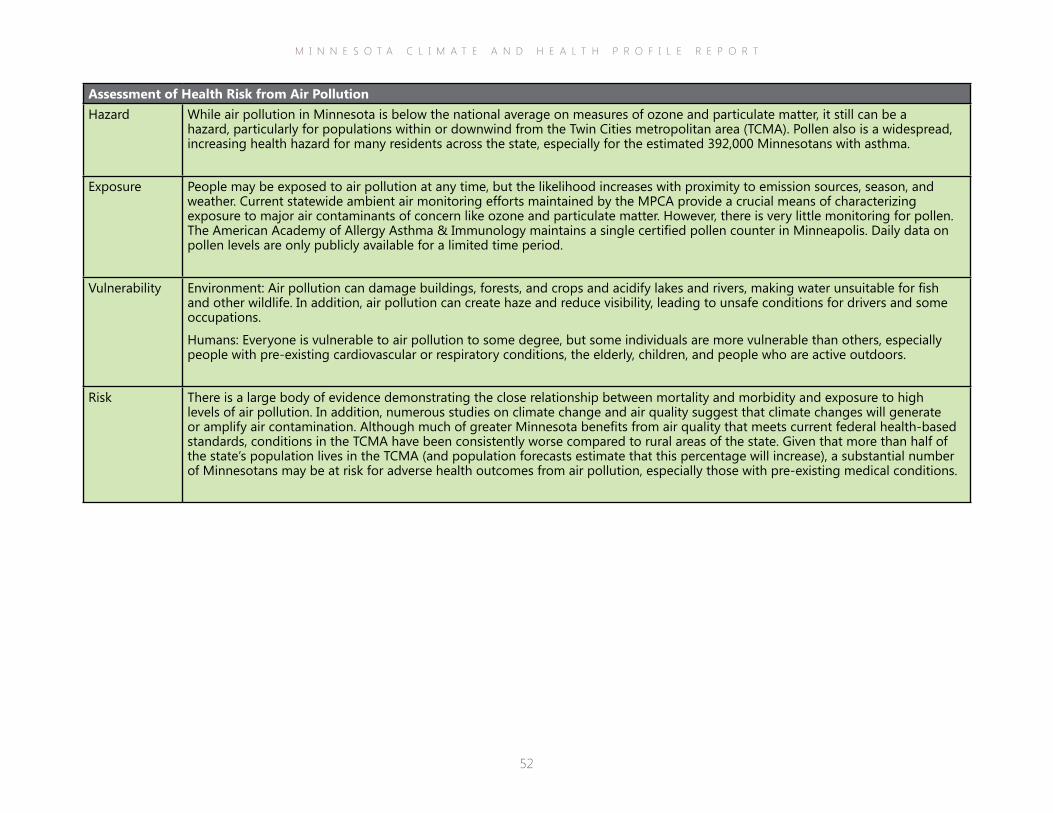
M I N N E S O T A C L I M A T E A N D H E A L T H P R O F I L E R E P O R T
52
Assessment of Health Risk from Air PollutionHazard While air pollution in Minnesota is below the national average on measures of ozone and particulate matter, it still can be a
hazard, particularly for populations within or downwind from the Twin Cities metropolitan area (TCMA). Pollen also is a widespread, increasing health hazard for many residents across the state, especially for the estimated 392,000 Minnesotans with asthma.
Exposure People may be exposed to air pollution at any time, but the likelihood increases with proximity to emission sources, season, and weather. Current statewide ambient air monitoring efforts maintained by the MPCA provide a crucial means of characterizing exposure to major air contaminants of concern like ozone and particulate matter. However, there is very little monitoring for pollen. The American Academy of Allergy Asthma & Immunology maintains a single certified pollen counter in Minneapolis. Daily data on pollen levels are only publicly available for a limited time period.
Vulnerability Environment: Air pollution can damage buildings, forests, and crops and acidify lakes and rivers, making water unsuitable for fish and other wildlife. In addition, air pollution can create haze and reduce visibility, leading to unsafe conditions for drivers and some occupations.
Humans: Everyone is vulnerable to air pollution to some degree, but some individuals are more vulnerable than others, especially people with pre-existing cardiovascular or respiratory conditions, the elderly, children, and people who are active outdoors.
Risk There is a large body of evidence demonstrating the close relationship between mortality and morbidity and exposure to high levels of air pollution. In addition, numerous studies on climate change and air quality suggest that climate changes will generate or amplify air contamination. Although much of greater Minnesota benefits from air quality that meets current federal health-based standards, conditions in the TCMA have been consistently worse compared to rural areas of the state. Given that more than half of the state’s population lives in the TCMA (and population forecasts estimate that this percentage will increase), a substantial number of Minnesotans may be at risk for adverse health outcomes from air pollution, especially those with pre-existing medical conditions.
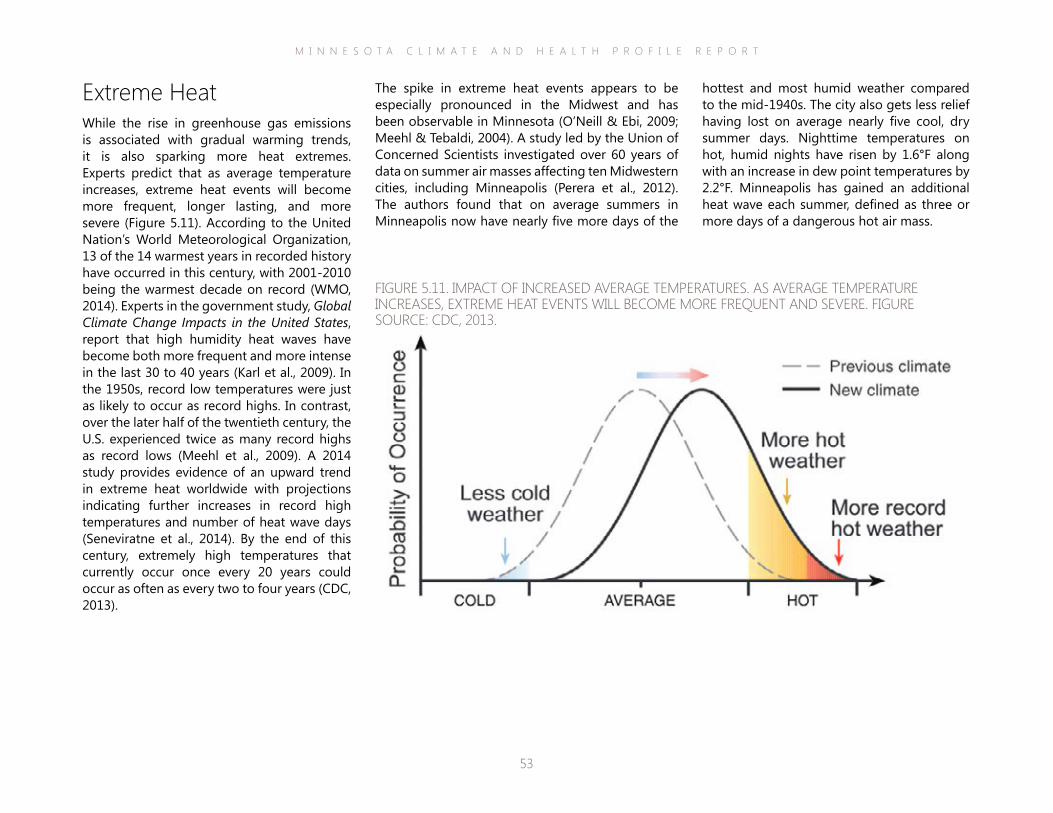
M I N N E S O T A C L I M A T E A N D H E A L T H P R O F I L E R E P O R T
53
The spike in extreme heat events appears to be especially pronounced in the Midwest and has been observable in Minnesota (O’Neill & Ebi, 2009; Meehl & Tebaldi, 2004). A study led by the Union of Concerned Scientists investigated over 60 years of data on summer air masses affecting ten Midwestern cities, including Minneapolis (Perera et al., 2012). The authors found that on average summers in Minneapolis now have nearly five more days of the
Extreme HeatWhile the rise in greenhouse gas emissions is associated with gradual warming trends, it is also sparking more heat extremes. Experts predict that as average temperature increases, extreme heat events will become more frequent, longer lasting, and more severe (Figure 5.11). According to the United Nation’s World Meteorological Organization, 13 of the 14 warmest years in recorded history have occurred in this century, with 2001-2010 being the warmest decade on record (WMO, 2014). Experts in the government study, Global Climate Change Impacts in the United States, report that high humidity heat waves have become both more frequent and more intense in the last 30 to 40 years (Karl et al., 2009). In the 1950s, record low temperatures were just as likely to occur as record highs. In contrast, over the later half of the twentieth century, the U.S. experienced twice as many record highs as record lows (Meehl et al., 2009). A 2014 study provides evidence of an upward trend in extreme heat worldwide with projections indicating further increases in record high temperatures and number of heat wave days (Seneviratne et al., 2014). By the end of this century, extremely high temperatures that currently occur once every 20 years could occur as often as every two to four years (CDC, 2013).
FIGURE 5.11. IMPACT OF INCREASED AVERAGE TEMPERATURES. AS AVERAGE TEMPERATURE INCREASES, EXTREME HEAT EVENTS WILL BECOME MORE FREQUENT AND SEVERE. FIGURE SOURCE: CDC, 2013.
hottest and most humid weather compared to the mid-1940s. The city also gets less relief having lost on average nearly five cool, dry summer days. Nighttime temperatures on hot, humid nights have risen by 1.6°F along with an increase in dew point temperatures by 2.2°F. Minneapolis has gained an additional heat wave each summer, defined as three or more days of a dangerous hot air mass.

M I N N E S O T A C L I M A T E A N D H E A L T H P R O F I L E R E P O R T
54
Minnesotans will experience a wide range of direct and indirect health impacts from the increased frequency and severity of extreme heat events (Figure 5.12). Direct health effects include symptoms associated with heat stress, such as fatigue, cramps, headaches and nausea, or responses that are much more extreme, including heat stroke, organ failure, and even death. In addition, heat waves can exacerbate pre-existing medical conditions or diseases, such as diabetes, cardiovascular disease, chronic obstructive pulmonary disease, kidney ailments and mental or behavioral disorders. Indirect health effects include infrastructure failures like power outages; disruption of some occupations (especially those involving outdoor, strenuous labor), schooling, or major events, like athletic competitions or festivals; and a strain on emergency and health care services, in particular 911 response and emergency department operations. In addition, extreme heat contributes to other major climate impact areas, such as air contamination and drought, which in turn have direct and indirect effects on the health of Minnesotans.
FIGURE 5.12. LINKS BETWEEN THE RISE IN ATMOSPHERIC GREENHOUSE GASES, CHANGES TO THE EARTH’S CLIMATE, AND DIRECT AND INDIRECT IMPACTS ON HEALTH FROM EXTREME HEAT EVENTS.
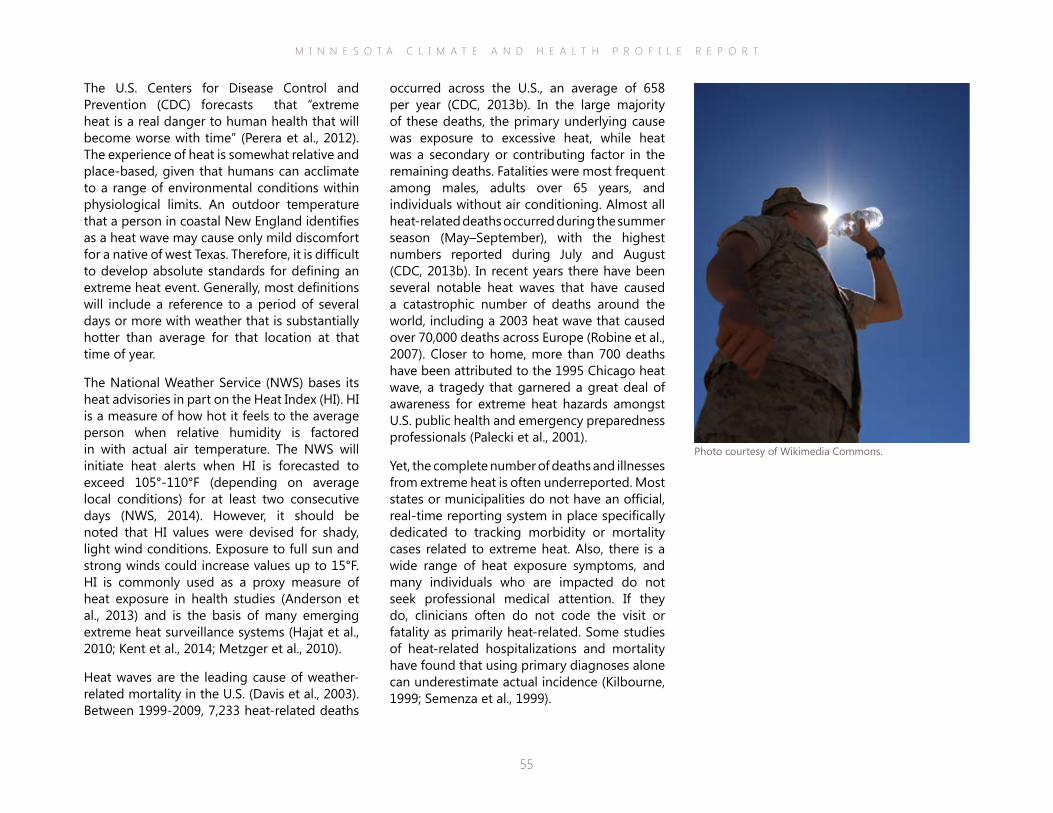
M I N N E S O T A C L I M A T E A N D H E A L T H P R O F I L E R E P O R T
55
occurred across the U.S., an average of 658 per year (CDC, 2013b). In the large majority of these deaths, the primary underlying cause was exposure to excessive heat, while heat was a secondary or contributing factor in the remaining deaths. Fatalities were most frequent among males, adults over 65 years, and individuals without air conditioning. Almost all heat-related deaths occurred during the summer season (May–September), with the highest numbers reported during July and August (CDC, 2013b). In recent years there have been several notable heat waves that have caused a catastrophic number of deaths around the world, including a 2003 heat wave that caused over 70,000 deaths across Europe (Robine et al., 2007). Closer to home, more than 700 deaths have been attributed to the 1995 Chicago heat wave, a tragedy that garnered a great deal of awareness for extreme heat hazards amongst U.S. public health and emergency preparedness professionals (Palecki et al., 2001).
Yet, the complete number of deaths and illnesses from extreme heat is often underreported. Most states or municipalities do not have an official, real-time reporting system in place specifically dedicated to tracking morbidity or mortality cases related to extreme heat. Also, there is a wide range of heat exposure symptoms, and many individuals who are impacted do not seek professional medical attention. If they do, clinicians often do not code the visit or fatality as primarily heat-related. Some studies of heat-related hospitalizations and mortality have found that using primary diagnoses alone can underestimate actual incidence (Kilbourne, 1999; Semenza et al., 1999).
The U.S. Centers for Disease Control and Prevention (CDC) forecasts that “extreme heat is a real danger to human health that will become worse with time” (Perera et al., 2012). The experience of heat is somewhat relative and place-based, given that humans can acclimate to a range of environmental conditions within physiological limits. An outdoor temperature that a person in coastal New England identifies as a heat wave may cause only mild discomfort for a native of west Texas. Therefore, it is difficult to develop absolute standards for defining an extreme heat event. Generally, most definitions will include a reference to a period of several days or more with weather that is substantially hotter than average for that location at that time of year.
The National Weather Service (NWS) bases its heat advisories in part on the Heat Index (HI). HI is a measure of how hot it feels to the average person when relative humidity is factored in with actual air temperature. The NWS will initiate heat alerts when HI is forecasted to exceed 105°-110°F (depending on average local conditions) for at least two consecutive days (NWS, 2014). However, it should be noted that HI values were devised for shady, light wind conditions. Exposure to full sun and strong winds could increase values up to 15°F. HI is commonly used as a proxy measure of heat exposure in health studies (Anderson et al., 2013) and is the basis of many emerging extreme heat surveillance systems (Hajat et al., 2010; Kent et al., 2014; Metzger et al., 2010).
Heat waves are the leading cause of weather-related mortality in the U.S. (Davis et al., 2003). Between 1999-2009, 7,233 heat-related deaths
Photo courtesy of Wikimedia Commons.
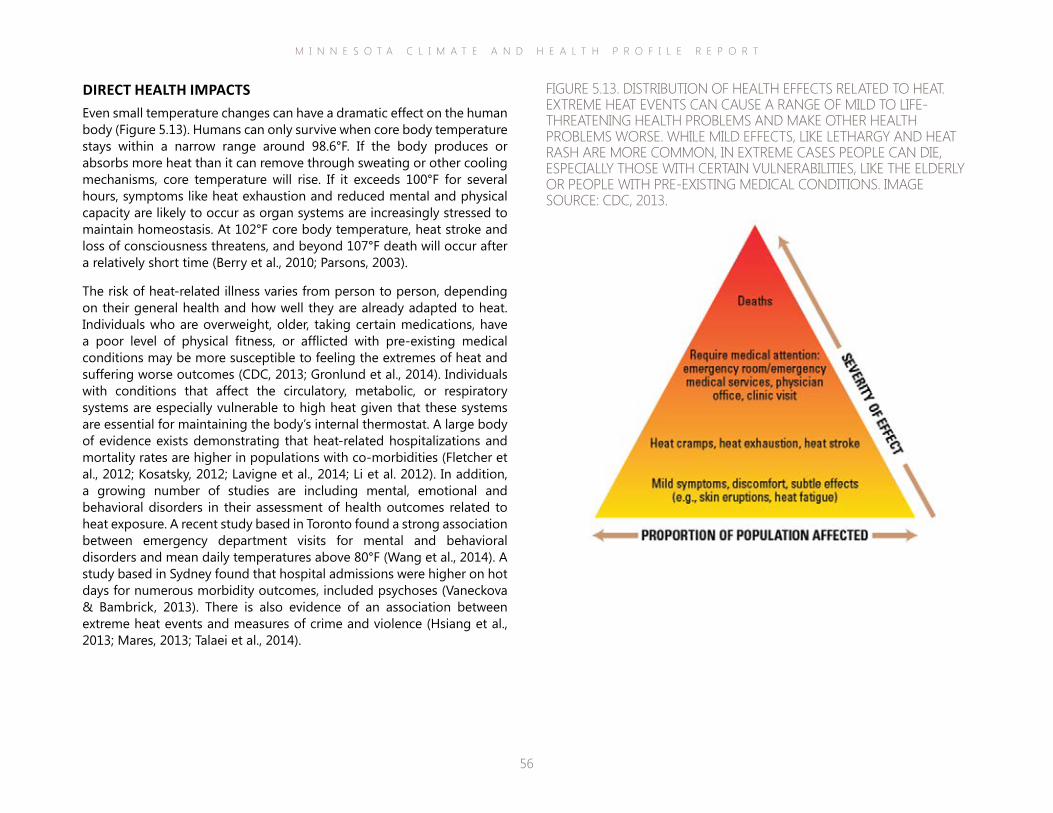
M I N N E S O T A C L I M A T E A N D H E A L T H P R O F I L E R E P O R T
56
DIRECT HEALTH IMPACTSEven small temperature changes can have a dramatic effect on the human body (Figure 5.13). Humans can only survive when core body temperature stays within a narrow range around 98.6°F. If the body produces or absorbs more heat than it can remove through sweating or other cooling mechanisms, core temperature will rise. If it exceeds 100°F for several hours, symptoms like heat exhaustion and reduced mental and physical capacity are likely to occur as organ systems are increasingly stressed to maintain homeostasis. At 102°F core body temperature, heat stroke and loss of consciousness threatens, and beyond 107°F death will occur after a relatively short time (Berry et al., 2010; Parsons, 2003).
The risk of heat-related illness varies from person to person, depending on their general health and how well they are already adapted to heat. Individuals who are overweight, older, taking certain medications, have a poor level of physical fitness, or afflicted with pre-existing medical conditions may be more susceptible to feeling the extremes of heat and suffering worse outcomes (CDC, 2013; Gronlund et al., 2014). Individuals with conditions that affect the circulatory, metabolic, or respiratory systems are especially vulnerable to high heat given that these systems are essential for maintaining the body’s internal thermostat. A large body of evidence exists demonstrating that heat-related hospitalizations and mortality rates are higher in populations with co-morbidities (Fletcher et al., 2012; Kosatsky, 2012; Lavigne et al., 2014; Li et al. 2012). In addition, a growing number of studies are including mental, emotional and behavioral disorders in their assessment of health outcomes related to heat exposure. A recent study based in Toronto found a strong association between emergency department visits for mental and behavioral disorders and mean daily temperatures above 80°F (Wang et al., 2014). A study based in Sydney found that hospital admissions were higher on hot days for numerous morbidity outcomes, included psychoses (Vaneckova & Bambrick, 2013). There is also evidence of an association between extreme heat events and measures of crime and violence (Hsiang et al., 2013; Mares, 2013; Talaei et al., 2014).
FIGURE 5.13. DISTRIBUTION OF HEALTH EFFECTS RELATED TO HEAT.EXTREME HEAT EVENTS CAN CAUSE A RANGE OF MILD TO LIFE-THREATENING HEALTH PROBLEMS AND MAKE OTHER HEALTH PROBLEMS WORSE. WHILE MILD EFFECTS, LIKE LETHARGY AND HEAT RASH ARE MORE COMMON, IN EXTREME CASES PEOPLE CAN DIE, ESPECIALLY THOSE WITH CERTAIN VULNERABILITIES, LIKE THE ELDERLY OR PEOPLE WITH PRE-EXISTING MEDICAL CONDITIONS. IMAGE SOURCE: CDC, 2013.
M I N N E S O T A C L I M A T E A N D H E A L T H P R O F I L E R E P O R T
57
cause of death on death certificates, given that it is difficult to establish if environmental conditions are not witnessed directly by a physician or emergency care provider. Cases where heat was a significant casual factor but were not coded as directly attributable to heat will not be represented in the EPHT dataset. Second, in all cases, personal identifiers are stripped from the data, which comes from the Minnesota Mortality Database and the Minnesota Hospital Discharge Data. Without any identifiers it is not possible to determine if an individual is receiving care at more than one facility and therefore could potentially be represented more than once in the dataset. Finally, only Minnesota resident data are included in the dataset. This excludes out-of-state visitors who may nonetheless have been treated or admitted for heat-related illness associated with an extreme heat event in the state. Regardless of the limitations, EPHT data provide an essential snapshot of heat-related health effects in the state, which assists state and local public health departments with planning and evaluating response and prevention efforts.
Some studies are suggesting that race and income may play a role in heat susceptibility. A New York State study found that hospitalizations for acute renal failure went up 9% for every 5°F in mean temperature, with black and Hispanic populations carrying twice the odds of whites for hospitalization. There also was some indication of higher risk among the economically disadvantaged (Fletcher et al., 2012). A study based in New York City concluded that extreme high temperatures drove up hospital admissions for cardiovascular and respiratory disorders, but rates were higher for Hispanic persons and the elderly (Lin et al., 2009). There is also some evidence that maternal exposure to high environmental temperatures during certain developmental windows may be linked to birth defects, such as congenital cataracts (Van Zutphen et al., 2012), although studies in this area are limited.
Data on the numbers of hospitalizations, emergency department (ED) visits and deaths directly attributed to heat (i.e., heat exposure is listed as the primary diagnosis or cause) are collected and provided to the public by MDH’s Environmental Public Health Tracking program (EPHT). Between 2000-2011, over 1,000 hospitalizations, 8,000 ED visits, and nearly 40 deaths directly attributable to heat exposure were recorded in Minnesota (Figure 5.14). Similar to global patterns of lethality, nearly all heat-related deaths occurred in the summer months, mainly July and August. In most cases, the elderly were the most affected age group and males were more affected than females. However, younger males aged 15-34 had the highest rate of ED visits due to heat-related illness, while males age 65 years old and older had the highest rate of hospitalizations. This may reflect hospital intake practices (e.g., a bias toward hospitalizing older patients) and a higher prevalence of risky behaviors amongst younger males (e.g., engaging in strenuous, outdoor activities without taking necessary precautions) that may lead to an ED visit.
When interpreting EPHT data it is essential to keep in mind certain limitations. First, symptoms of heat-related illness can vary substantially depending on the individual and level of exposure. Since only people with the most severe signs of illness are hospitalized, visit the ED, or perish from exposure, EPHT data cannot be used to represent the total burden of extreme heat events on Minnesotans. Only cases where an individual seeks medical care and heat-related illness is explicitly listed as the primary cause will be represented in the EPHT dataset. Rarely is heat listed as a primary
FIGURE 5.14. MINNESOTA CASE COUNTS OF HEAT-RELATED HOSPITALIZATIONS AND EMERGENCY DEPARTMENT (ED) VISITS FROM 2000-2011. DATA SOURCE: MINNESOTA PUBLIC HEALTH DATA ACCESS PORTAL (WWW.HEALTH.STATE.MN.US/DIVS/HPCD/TRACKING/DATA/INDEX.HTML), MINNESOTA TRACKING, MINNESOTA DEPARTMENT OF HEALTH.
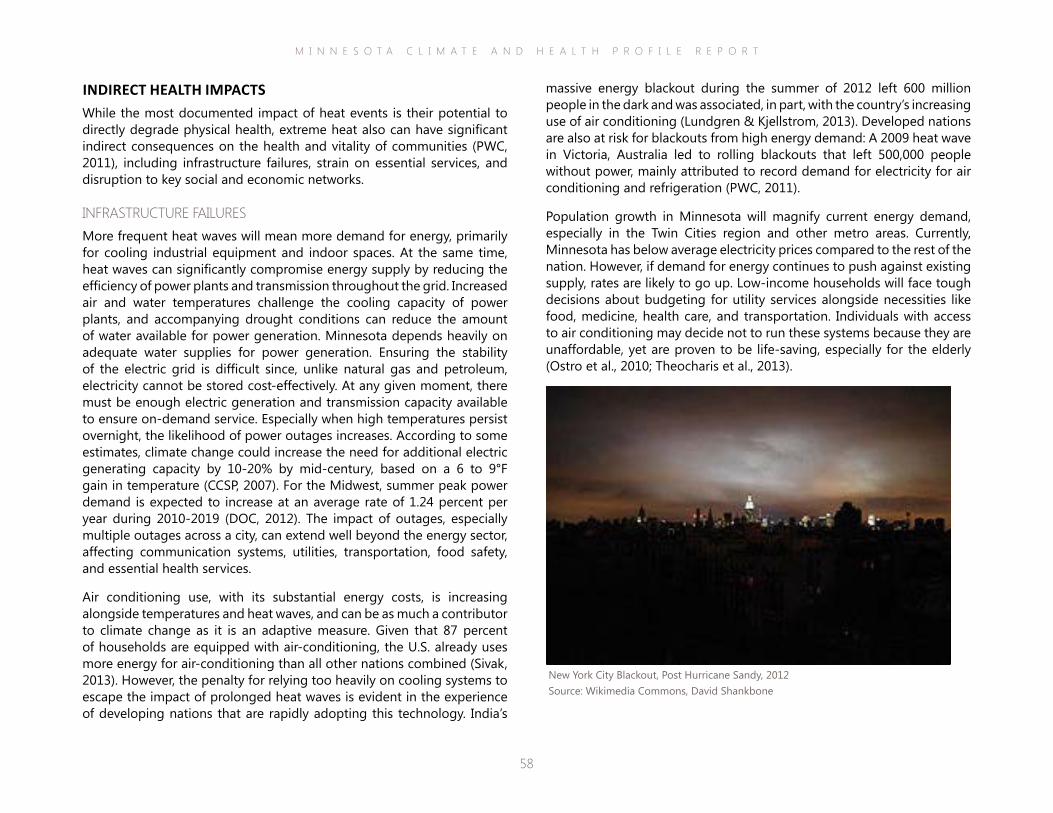
M I N N E S O T A C L I M A T E A N D H E A L T H P R O F I L E R E P O R T
58
massive energy blackout during the summer of 2012 left 600 million people in the dark and was associated, in part, with the country’s increasing use of air conditioning (Lundgren & Kjellstrom, 2013). Developed nations are also at risk for blackouts from high energy demand: A 2009 heat wave in Victoria, Australia led to rolling blackouts that left 500,000 people without power, mainly attributed to record demand for electricity for air conditioning and refrigeration (PWC, 2011).
Population growth in Minnesota will magnify current energy demand, especially in the Twin Cities region and other metro areas. Currently, Minnesota has below average electricity prices compared to the rest of the nation. However, if demand for energy continues to push against existing supply, rates are likely to go up. Low-income households will face tough decisions about budgeting for utility services alongside necessities like food, medicine, health care, and transportation. Individuals with access to air conditioning may decide not to run these systems because they are unaffordable, yet are proven to be life-saving, especially for the elderly (Ostro et al., 2010; Theocharis et al., 2013).
INDIRECT HEALTH IMPACTSWhile the most documented impact of heat events is their potential to directly degrade physical health, extreme heat also can have significant indirect consequences on the health and vitality of communities (PWC, 2011), including infrastructure failures, strain on essential services, and disruption to key social and economic networks.
INFRASTRUCTURE FAILURESMore frequent heat waves will mean more demand for energy, primarily for cooling industrial equipment and indoor spaces. At the same time, heat waves can significantly compromise energy supply by reducing the efficiency of power plants and transmission throughout the grid. Increased air and water temperatures challenge the cooling capacity of power plants, and accompanying drought conditions can reduce the amount of water available for power generation. Minnesota depends heavily on adequate water supplies for power generation. Ensuring the stability of the electric grid is difficult since, unlike natural gas and petroleum, electricity cannot be stored cost-effectively. At any given moment, there must be enough electric generation and transmission capacity available to ensure on-demand service. Especially when high temperatures persist overnight, the likelihood of power outages increases. According to some estimates, climate change could increase the need for additional electric generating capacity by 10-20% by mid-century, based on a 6 to 9°F gain in temperature (CCSP, 2007). For the Midwest, summer peak power demand is expected to increase at an average rate of 1.24 percent per year during 2010-2019 (DOC, 2012). The impact of outages, especially multiple outages across a city, can extend well beyond the energy sector, affecting communication systems, utilities, transportation, food safety, and essential health services.
Air conditioning use, with its substantial energy costs, is increasing alongside temperatures and heat waves, and can be as much a contributor to climate change as it is an adaptive measure. Given that 87 percent of households are equipped with air-conditioning, the U.S. already uses more energy for air-conditioning than all other nations combined (Sivak, 2013). However, the penalty for relying too heavily on cooling systems to escape the impact of prolonged heat waves is evident in the experience of developing nations that are rapidly adopting this technology. India’s
New York City Blackout, Post Hurricane Sandy, 2012Source: Wikimedia Commons, David Shankbone
M I N N E S O T A C L I M A T E A N D H E A L T H P R O F I L E R E P O R T
59
STRAIN ON ESSENTIAL SERVICESDuring periods of high temperatures, there is increased demand for ambulance and hospital emergency services (Thornes et al. 2014; Kue & Dyer, 2013). Extensive documentation of the Chicago heat wave of 1995 showed that the capacity of emergency services to meet sudden increases in demand is often significantly compromised during an extreme heat event, resulting in extended response times, inadequate care, and a potential for increased morbidity and mortality (Klinenberg, 2002; Palecki, 2001). In addition, there is substantial evidence to suggest a link between heat and crime, such as homicide, suicide, sexual assault, and domestic abuse (Bushman et al., 2005; Hsiang et al., 2013; Lin et al., 2008; McLean, 2007; Mares et al., 2013). Increased crime and violence places additional strain on law enforcement and may lead to delayed response times by available officers.
DISRUPTION TO KEY SOCIAL AND ECONOMIC NETWORKSExtreme heat events may disrupt certain sectors of employment and even compromise long-term viability of some occupations. Construction, agriculture, forestry, mining and other outdoor occupations are likely to be disrupted in the short term as employee productivity decreases and the risk of adverse health consequences increases (Houser et al., 2014). In addition, lost labor hours may have negative economic impacts for affected employees, while worker absenteeism may lead to interruptions in service or production sectors. In the long term, farming and other jobs dependent on agriculture, may become far less secure as high heat events and accompanying drought conditions lead to crop losses and threats to animal welfare (Walthall et al., 2012). Extreme heat events also lead to school and event cancellations, which may reduce opportunities for community cohesion and physical activity. For example, the August 2013 heat wave in Minneapolis led to classes and many athletic events being cancelled at more than 25 schools over multiple days (Littlefield, 2013).
Photo courtesy of Microsoft Clip Art, 2014.
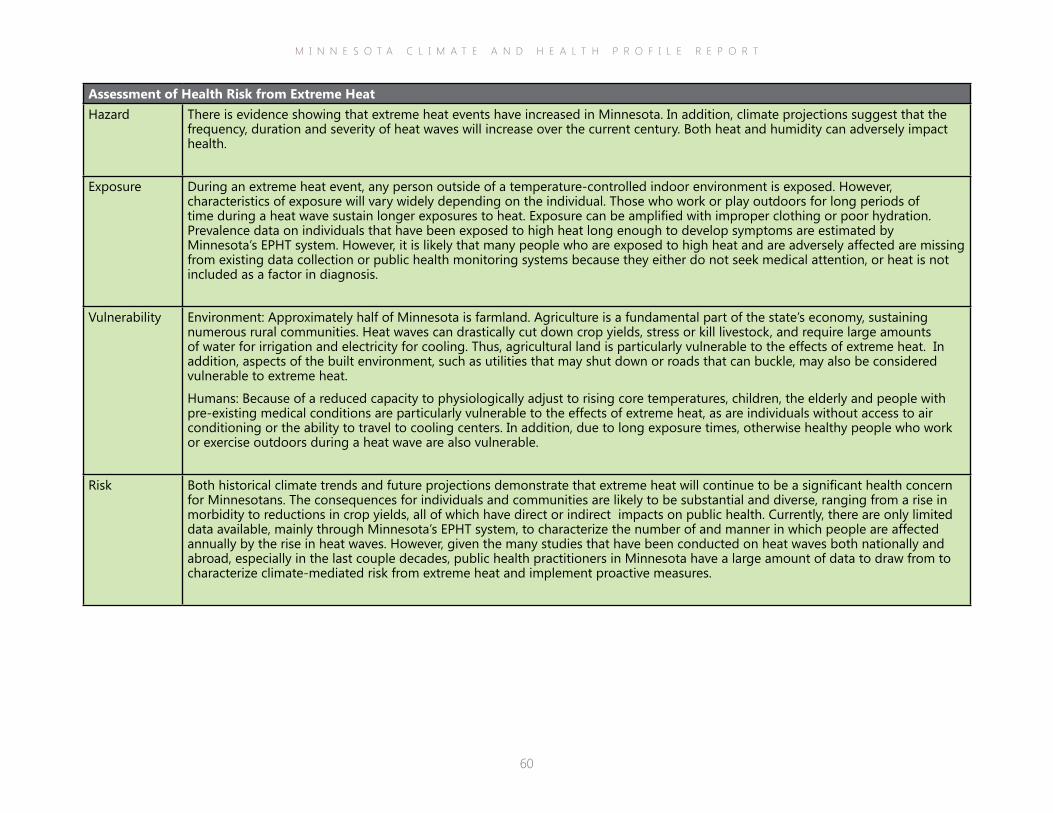
M I N N E S O T A C L I M A T E A N D H E A L T H P R O F I L E R E P O R T
60
Assessment of Health Risk from Extreme HeatHazard There is evidence showing that extreme heat events have increased in Minnesota. In addition, climate projections suggest that the
frequency, duration and severity of heat waves will increase over the current century. Both heat and humidity can adversely impact health.
Exposure During an extreme heat event, any person outside of a temperature-controlled indoor environment is exposed. However, characteristics of exposure will vary widely depending on the individual. Those who work or play outdoors for long periods of time during a heat wave sustain longer exposures to heat. Exposure can be amplified with improper clothing or poor hydration. Prevalence data on individuals that have been exposed to high heat long enough to develop symptoms are estimated by Minnesota’s EPHT system. However, it is likely that many people who are exposed to high heat and are adversely affected are missing from existing data collection or public health monitoring systems because they either do not seek medical attention, or heat is not included as a factor in diagnosis.
Vulnerability Environment: Approximately half of Minnesota is farmland. Agriculture is a fundamental part of the state’s economy, sustaining numerous rural communities. Heat waves can drastically cut down crop yields, stress or kill livestock, and require large amounts of water for irrigation and electricity for cooling. Thus, agricultural land is particularly vulnerable to the effects of extreme heat. In addition, aspects of the built environment, such as utilities that may shut down or roads that can buckle, may also be considered vulnerable to extreme heat.
Humans: Because of a reduced capacity to physiologically adjust to rising core temperatures, children, the elderly and people with pre-existing medical conditions are particularly vulnerable to the effects of extreme heat, as are individuals without access to air conditioning or the ability to travel to cooling centers. In addition, due to long exposure times, otherwise healthy people who work or exercise outdoors during a heat wave are also vulnerable.
Risk Both historical climate trends and future projections demonstrate that extreme heat will continue to be a significant health concern for Minnesotans. The consequences for individuals and communities are likely to be substantial and diverse, ranging from a rise in morbidity to reductions in crop yields, all of which have direct or indirect impacts on public health. Currently, there are only limited data available, mainly through Minnesota’s EPHT system, to characterize the number of and manner in which people are affected annually by the rise in heat waves. However, given the many studies that have been conducted on heat waves both nationally and abroad, especially in the last couple decades, public health practitioners in Minnesota have a large amount of data to draw from to characterize climate-mediated risk from extreme heat and implement proactive measures.
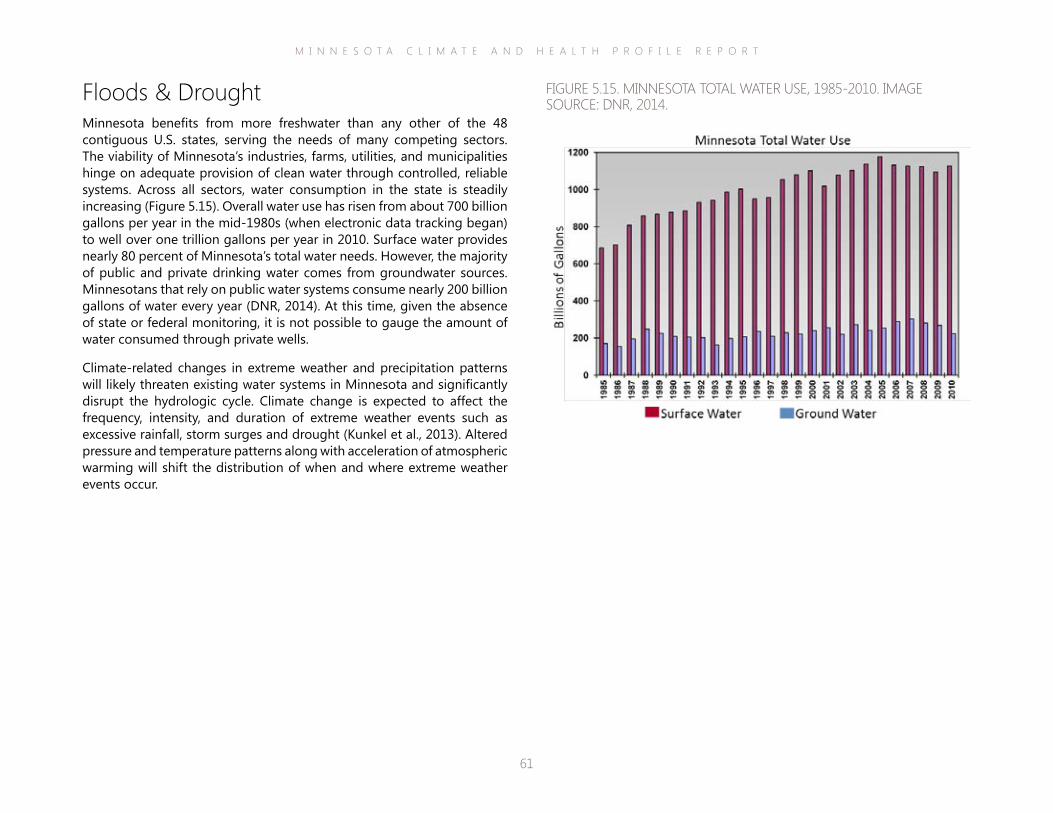
M I N N E S O T A C L I M A T E A N D H E A L T H P R O F I L E R E P O R T
61
Floods & DroughtMinnesota benefits from more freshwater than any other of the 48 contiguous U.S. states, serving the needs of many competing sectors. The viability of Minnesota’s industries, farms, utilities, and municipalities hinge on adequate provision of clean water through controlled, reliable systems. Across all sectors, water consumption in the state is steadily increasing (Figure 5.15). Overall water use has risen from about 700 billion gallons per year in the mid-1980s (when electronic data tracking began) to well over one trillion gallons per year in 2010. Surface water provides nearly 80 percent of Minnesota’s total water needs. However, the majority of public and private drinking water comes from groundwater sources. Minnesotans that rely on public water systems consume nearly 200 billion gallons of water every year (DNR, 2014). At this time, given the absence of state or federal monitoring, it is not possible to gauge the amount of water consumed through private wells.
Climate-related changes in extreme weather and precipitation patterns will likely threaten existing water systems in Minnesota and significantly disrupt the hydrologic cycle. Climate change is expected to affect the frequency, intensity, and duration of extreme weather events such as excessive rainfall, storm surges and drought (Kunkel et al., 2013). Altered pressure and temperature patterns along with acceleration of atmospheric warming will shift the distribution of when and where extreme weather events occur.
FIGURE 5.15. MINNESOTA TOTAL WATER USE, 1985-2010. IMAGE SOURCE: DNR, 2014.
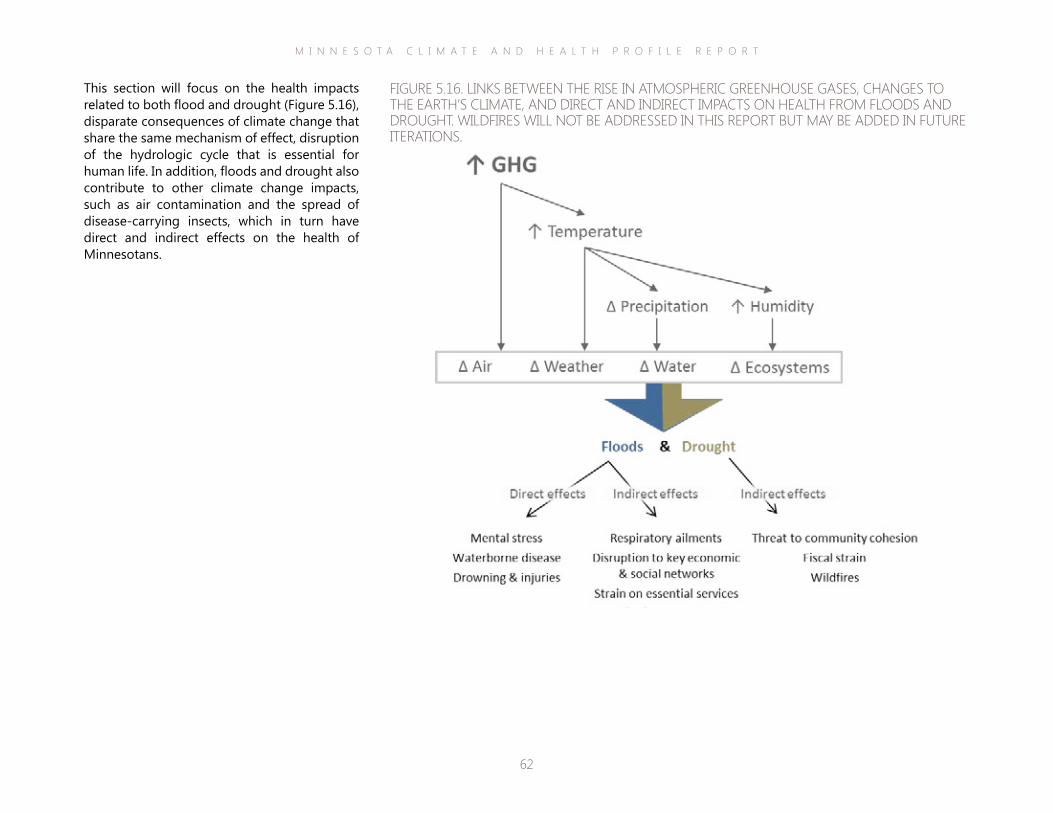
M I N N E S O T A C L I M A T E A N D H E A L T H P R O F I L E R E P O R T
62
This section will focus on the health impacts related to both flood and drought (Figure 5.16), disparate consequences of climate change that share the same mechanism of effect, disruption of the hydrologic cycle that is essential for human life. In addition, floods and drought also contribute to other climate change impacts, such as air contamination and the spread of disease-carrying insects, which in turn have direct and indirect effects on the health of Minnesotans.
FIGURE 5.16. LINKS BETWEEN THE RISE IN ATMOSPHERIC GREENHOUSE GASES, CHANGES TO THE EARTH’S CLIMATE, AND DIRECT AND INDIRECT IMPACTS ON HEALTH FROM FLOODS AND DROUGHT. WILDFIRES WILL NOT BE ADDRESSED IN THIS REPORT BUT MAY BE ADDED IN FUTURE ITERATIONS.
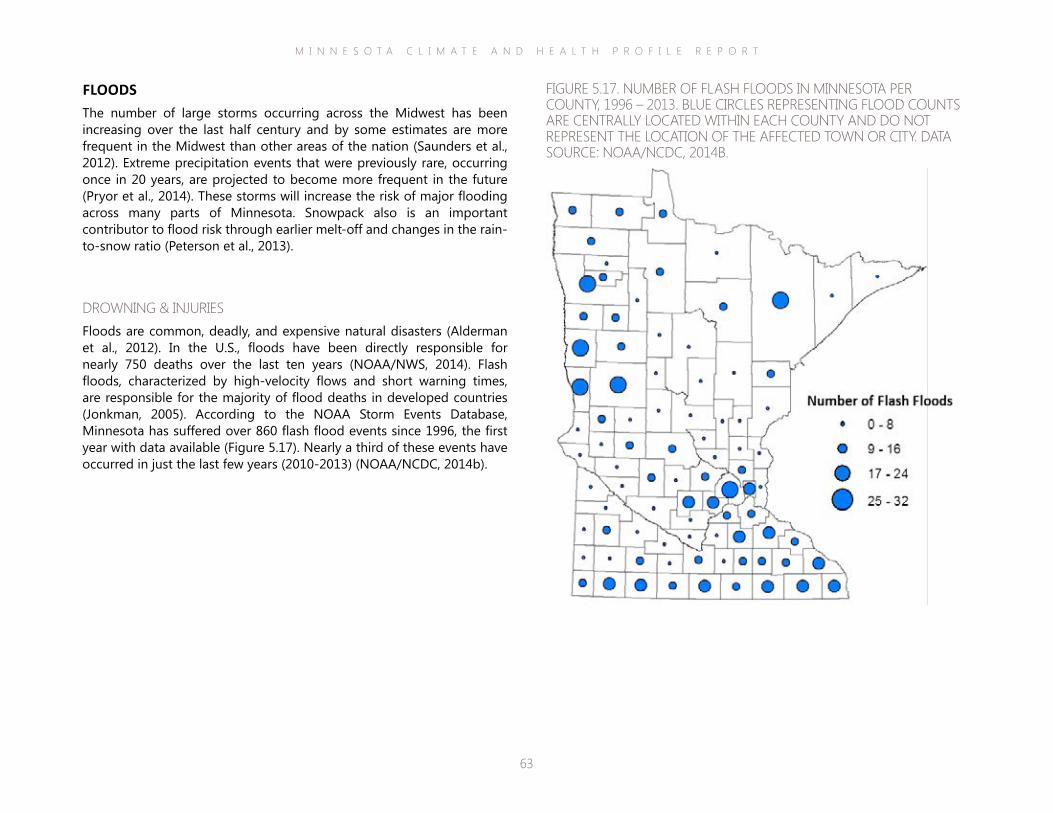
M I N N E S O T A C L I M A T E A N D H E A L T H P R O F I L E R E P O R T
63
FLOODSThe number of large storms occurring across the Midwest has been increasing over the last half century and by some estimates are more frequent in the Midwest than other areas of the nation (Saunders et al., 2012). Extreme precipitation events that were previously rare, occurring once in 20 years, are projected to become more frequent in the future (Pryor et al., 2014). These storms will increase the risk of major flooding across many parts of Minnesota. Snowpack also is an important contributor to flood risk through earlier melt-off and changes in the rain-to-snow ratio (Peterson et al., 2013).
DROWNING & INJURIESFloods are common, deadly, and expensive natural disasters (Alderman et al., 2012). In the U.S., floods have been directly responsible for nearly 750 deaths over the last ten years (NOAA/NWS, 2014). Flash floods, characterized by high-velocity flows and short warning times, are responsible for the majority of flood deaths in developed countries (Jonkman, 2005). According to the NOAA Storm Events Database, Minnesota has suffered over 860 flash flood events since 1996, the first year with data available (Figure 5.17). Nearly a third of these events have occurred in just the last few years (2010-2013) (NOAA/NCDC, 2014b).
FIGURE 5.17. NUMBER OF FLASH FLOODS IN MINNESOTA PER COUNTY, 1996 – 2013. BLUE CIRCLES REPRESENTING FLOOD COUNTS ARE CENTRALLY LOCATED WITHIN EACH COUNTY AND DO NOT REPRESENT THE LOCATION OF THE AFFECTED TOWN OR CITY. DATA SOURCE: NOAA/NCDC, 2014B.
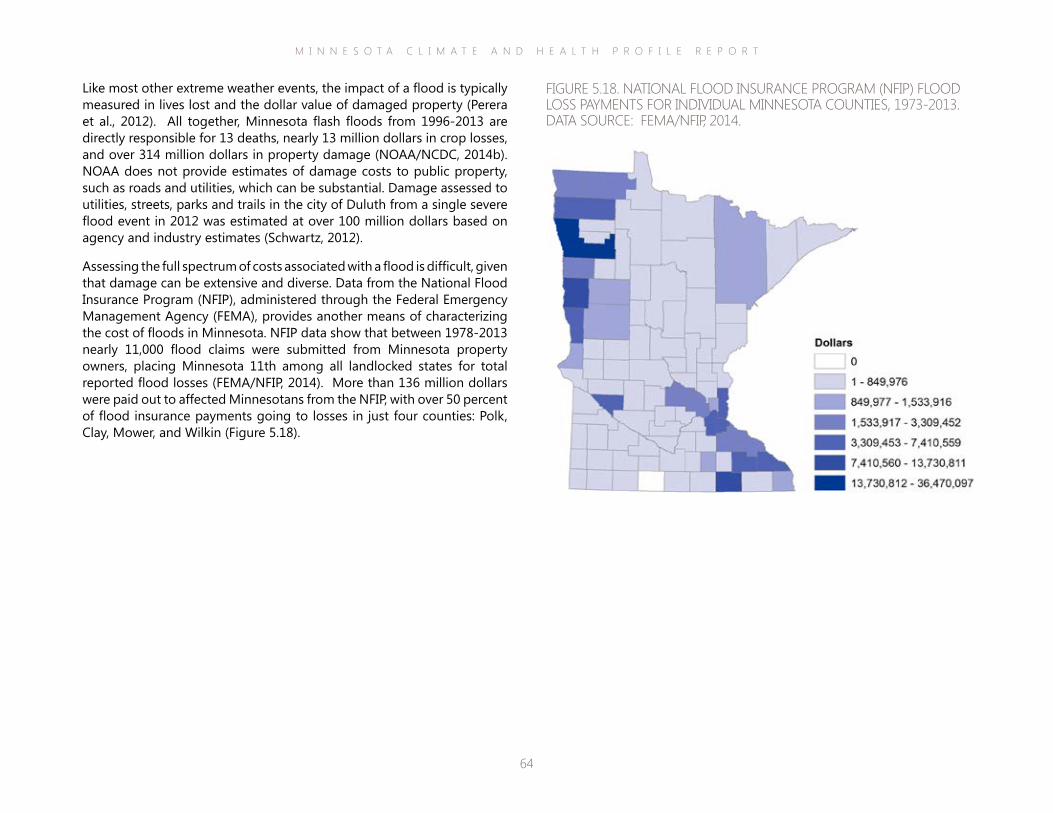
M I N N E S O T A C L I M A T E A N D H E A L T H P R O F I L E R E P O R T
64
Like most other extreme weather events, the impact of a flood is typically measured in lives lost and the dollar value of damaged property (Perera et al., 2012). All together, Minnesota flash floods from 1996-2013 are directly responsible for 13 deaths, nearly 13 million dollars in crop losses, and over 314 million dollars in property damage (NOAA/NCDC, 2014b). NOAA does not provide estimates of damage costs to public property, such as roads and utilities, which can be substantial. Damage assessed to utilities, streets, parks and trails in the city of Duluth from a single severe flood event in 2012 was estimated at over 100 million dollars based on agency and industry estimates (Schwartz, 2012).
Assessing the full spectrum of costs associated with a flood is difficult, given that damage can be extensive and diverse. Data from the National Flood Insurance Program (NFIP), administered through the Federal Emergency Management Agency (FEMA), provides another means of characterizing the cost of floods in Minnesota. NFIP data show that between 1978-2013 nearly 11,000 flood claims were submitted from Minnesota property owners, placing Minnesota 11th among all landlocked states for total reported flood losses (FEMA/NFIP, 2014). More than 136 million dollars were paid out to affected Minnesotans from the NFIP, with over 50 percent of flood insurance payments going to losses in just four counties: Polk, Clay, Mower, and Wilkin (Figure 5.18).
FIGURE 5.18. NATIONAL FLOOD INSURANCE PROGRAM (NFIP) FLOOD LOSS PAYMENTS FOR INDIVIDUAL MINNESOTA COUNTIES, 1973-2013. DATA SOURCE: FEMA/NFIP, 2014.
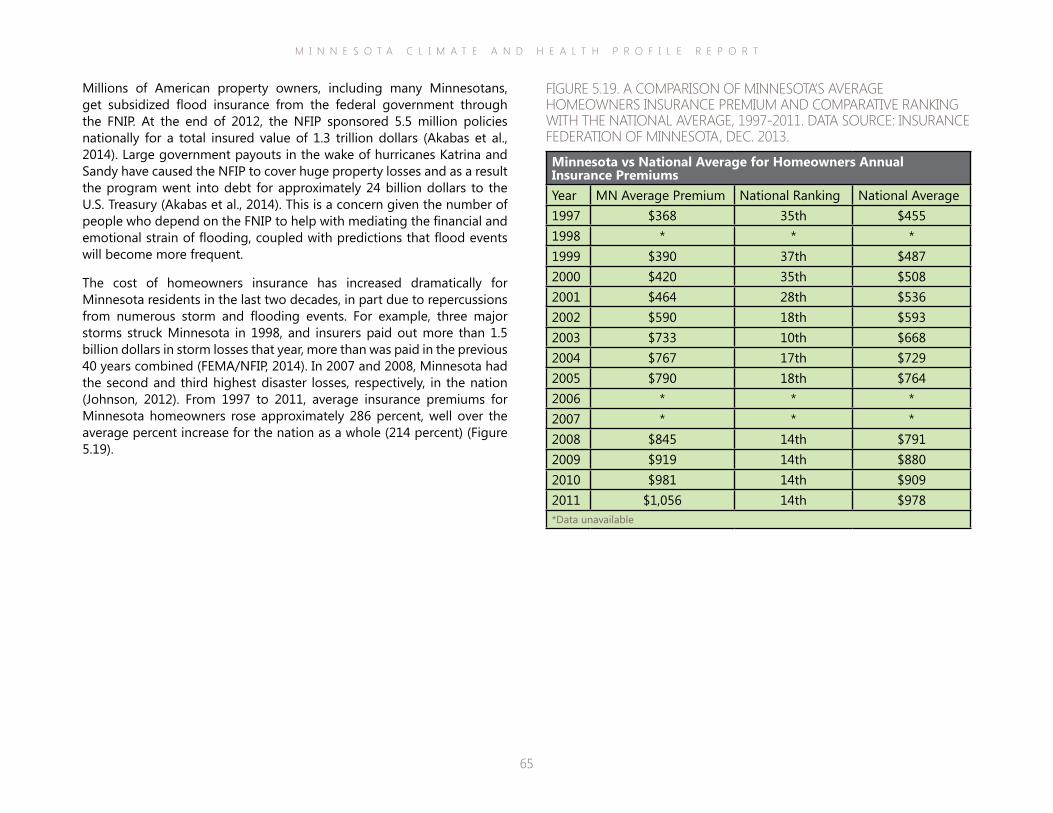
M I N N E S O T A C L I M A T E A N D H E A L T H P R O F I L E R E P O R T
65
Millions of American property owners, including many Minnesotans, get subsidized flood insurance from the federal government through the FNIP. At the end of 2012, the NFIP sponsored 5.5 million policies nationally for a total insured value of 1.3 trillion dollars (Akabas et al., 2014). Large government payouts in the wake of hurricanes Katrina and Sandy have caused the NFIP to cover huge property losses and as a result the program went into debt for approximately 24 billion dollars to the U.S. Treasury (Akabas et al., 2014). This is a concern given the number of people who depend on the FNIP to help with mediating the financial and emotional strain of flooding, coupled with predictions that flood events will become more frequent.
The cost of homeowners insurance has increased dramatically for Minnesota residents in the last two decades, in part due to repercussions from numerous storm and flooding events. For example, three major storms struck Minnesota in 1998, and insurers paid out more than 1.5 billion dollars in storm losses that year, more than was paid in the previous 40 years combined (FEMA/NFIP, 2014). In 2007 and 2008, Minnesota had the second and third highest disaster losses, respectively, in the nation (Johnson, 2012). From 1997 to 2011, average insurance premiums for Minnesota homeowners rose approximately 286 percent, well over the average percent increase for the nation as a whole (214 percent) (Figure 5.19).
FIGURE 5.19. A COMPARISON OF MINNESOTA’S AVERAGE HOMEOWNERS INSURANCE PREMIUM AND COMPARATIVE RANKING WITH THE NATIONAL AVERAGE, 1997-2011. DATA SOURCE: INSURANCE FEDERATION OF MINNESOTA, DEC. 2013.
Minnesota vs National Average for Homeowners Annual Insurance PremiumsYear MN Average Premium National Ranking National Average1997 $368 35th $4551998 * * *1999 $390 37th $4872000 $420 35th $5082001 $464 28th $5362002 $590 18th $5932003 $733 10th $6682004 $767 17th $7292005 $790 18th $7642006 * * *2007 * * *2008 $845 14th $7912009 $919 14th $8802010 $981 14th $9092011 $1,056 14th $978*Data unavailable

M I N N E S O T A C L I M A T E A N D H E A L T H P R O F I L E R E P O R T
66
(such as clean water and air), or quality of life (WHO, 2013).
Therefore, it’s important to acknowledge that the full extent to which a flood impacts health is determined not just by the magnitude of the flood, but also by individual and societal factors, such as socio-economic and demographic characteristics, expanding development into flood-prone areas, neglecting maintenance to key infrastructure (e.g., roads, railways, drinking water and sewage systems), and modifications to waterways (Du et al., 2010; Lowe et al, 2013).
Specific health impacts of flooding can be divided into those associated with the immediate event (direct effects) and those arising in the aftermath (indirect effects). Immediate, direct effects are caused by primary exposure to floodwaters and the debris it contains (e.g. injury, mental stress, waterborne disease), but a flood continues to adversely impact health during the recovery and rebuilding process, which may continue for months to years. These effects are less easily identified and quantified with currently available data compared to fatalities and direct injuries. Examples of indirect health impacts associated with floods include respiratory distress or disease from exposure to indoor air contaminants, exacerbation of existing medical conditions, and disrupted health services. These impacts are likely to be relevant for Minnesotans and will be covered in more detail in the rest of the section.
There are a number of problems with relying solely on mortality statistics and damage estimates to fully characterize flood impacts to society (NOAA/NWS, 2014b). First, flood events associated with high levels of mortality, especially in developed countries, are rare (Doocy et al., 2013). Despite the increased frequency of flood events worldwide, flood trends show a decrease in the average number of deaths per event, but an increase in the size of affected populations (Doocy et al., 2013). Flood fatalities alone provide little detail of the full range of impacts from a flood event in a community. Second, flood damage estimates are reported in many different ways and are subject to a wide variety of errors. Currently, there is no one governmental agency that has specific responsibility for collecting and evaluating detailed flood loss information. Estimates can come from federal, state, county and city level officials (NOAA/NWS, 2014b), even the media. However, the amount and type of media coverage are not necessarily proportional to the size of a flood event (WHO, 2013). In addition, damages are often underreported, in part due to a lack of post-event follow up with affected individuals and the absence of a centralized system for collecting these data.
Finally, damage estimates are as much a reflection of extreme weather events as they are of land use decisions and wealth. Increased urbanization in areas where flooding may occur means that there are more homes, highways, utilities, and other infrastructure and property that can be damaged (Du et al., 2010). If flooding occurs in an undeveloped area, it is not likely to be associated with extensive damage costs. Some researchers make the distinction between hydrological floods (which occur in unpopulated areas and may not be linked to damages) and disasters (which occur in populated areas and can adversely impact a number of socioeconomic systems) (Barredo, 2009). With regard to private flood insurance, an individual with an expensive home and belongings will likely receive a larger damage estimate than an individual with less capital, even though the relative impact of the flood on their health, finances and well-being may be comparable, or even greater for the less advantaged person. A number of researchers argue that flood loss estimates are, in effect, a reflection of urbanization and assets and are more closely related to a population’s standard of living than with flood severity, thus limiting their usefulness (Barredo, 2009; Pielke, 1999). Rarely do flood damage estimates take into account the costs incurred from impacts to human health (beyond mortality and limited injury statistics), ecosystem services
Minnesota National Guard Soldiers drive through rushing water down Minnesota Highway 1 into Oslo on April 16, 2011. Source: Wikimedia Commons, Tech. Sgt. Erik Gudmundson.
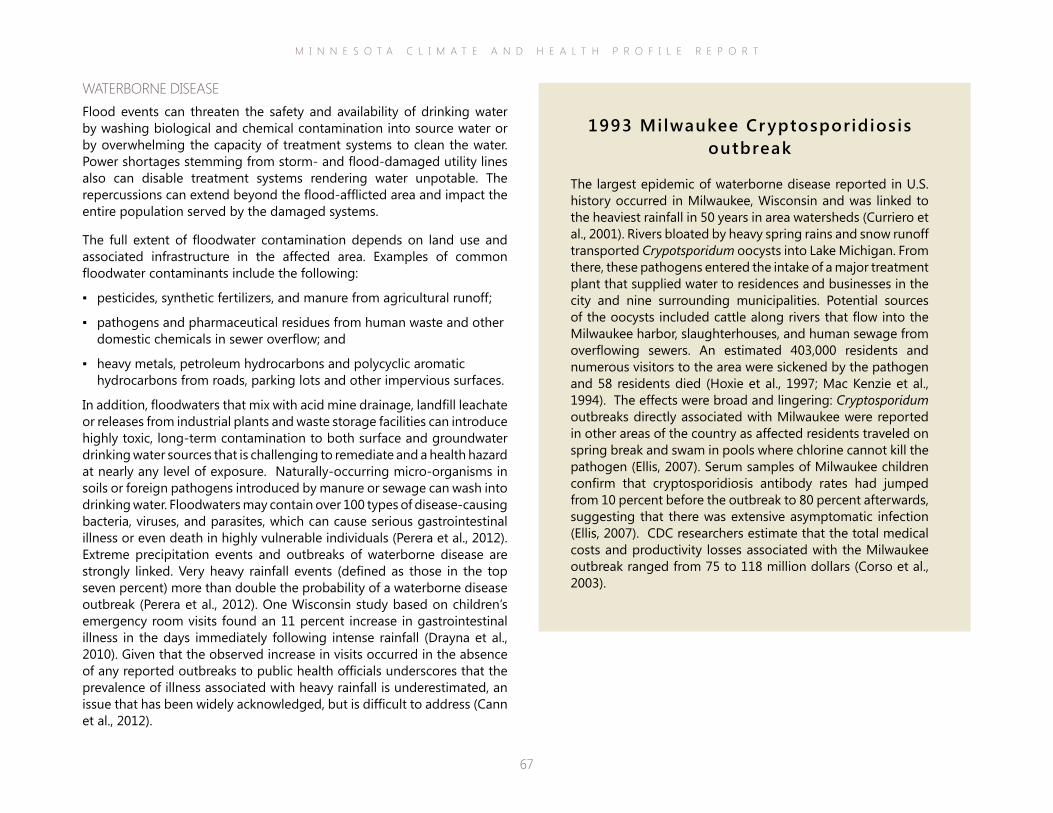
M I N N E S O T A C L I M A T E A N D H E A L T H P R O F I L E R E P O R T
67
1993 Milwaukee Cr yptosporidiosis outbreak
The largest epidemic of waterborne disease reported in U.S. history occurred in Milwaukee, Wisconsin and was linked to the heaviest rainfall in 50 years in area watersheds (Curriero et al., 2001). Rivers bloated by heavy spring rains and snow runoff transported Crypotsporidum oocysts into Lake Michigan. From there, these pathogens entered the intake of a major treatment plant that supplied water to residences and businesses in the city and nine surrounding municipalities. Potential sources of the oocysts included cattle along rivers that flow into the Milwaukee harbor, slaughterhouses, and human sewage from overflowing sewers. An estimated 403,000 residents and numerous visitors to the area were sickened by the pathogen and 58 residents died (Hoxie et al., 1997; Mac Kenzie et al., 1994). The effects were broad and lingering: Cryptosporidum outbreaks directly associated with Milwaukee were reported in other areas of the country as affected residents traveled on spring break and swam in pools where chlorine cannot kill the pathogen (Ellis, 2007). Serum samples of Milwaukee children confirm that cryptosporidiosis antibody rates had jumped from 10 percent before the outbreak to 80 percent afterwards, suggesting that there was extensive asymptomatic infection (Ellis, 2007). CDC researchers estimate that the total medical costs and productivity losses associated with the Milwaukee outbreak ranged from 75 to 118 million dollars (Corso et al., 2003).
WATERBORNE DISEASEFlood events can threaten the safety and availability of drinking water by washing biological and chemical contamination into source water or by overwhelming the capacity of treatment systems to clean the water. Power shortages stemming from storm- and flood-damaged utility lines also can disable treatment systems rendering water unpotable. The repercussions can extend beyond the flood-afflicted area and impact the entire population served by the damaged systems.
The full extent of floodwater contamination depends on land use and associated infrastructure in the affected area. Examples of common floodwater contaminants include the following:
▪ pesticides, synthetic fertilizers, and manure from agricultural runoff;
▪ pathogens and pharmaceutical residues from human waste and other domestic chemicals in sewer overflow; and
▪ heavy metals, petroleum hydrocarbons and polycyclic aromatic hydrocarbons from roads, parking lots and other impervious surfaces.
In addition, floodwaters that mix with acid mine drainage, landfill leachate or releases from industrial plants and waste storage facilities can introduce highly toxic, long-term contamination to both surface and groundwater drinking water sources that is challenging to remediate and a health hazard at nearly any level of exposure. Naturally-occurring micro-organisms in soils or foreign pathogens introduced by manure or sewage can wash into drinking water. Floodwaters may contain over 100 types of disease-causing bacteria, viruses, and parasites, which can cause serious gastrointestinal illness or even death in highly vulnerable individuals (Perera et al., 2012). Extreme precipitation events and outbreaks of waterborne disease are strongly linked. Very heavy rainfall events (defined as those in the top seven percent) more than double the probability of a waterborne disease outbreak (Perera et al., 2012). One Wisconsin study based on children’s emergency room visits found an 11 percent increase in gastrointestinal illness in the days immediately following intense rainfall (Drayna et al., 2010). Given that the observed increase in visits occurred in the absence of any reported outbreaks to public health officials underscores that the prevalence of illness associated with heavy rainfall is underestimated, an issue that has been widely acknowledged, but is difficult to address (Cann et al., 2012).
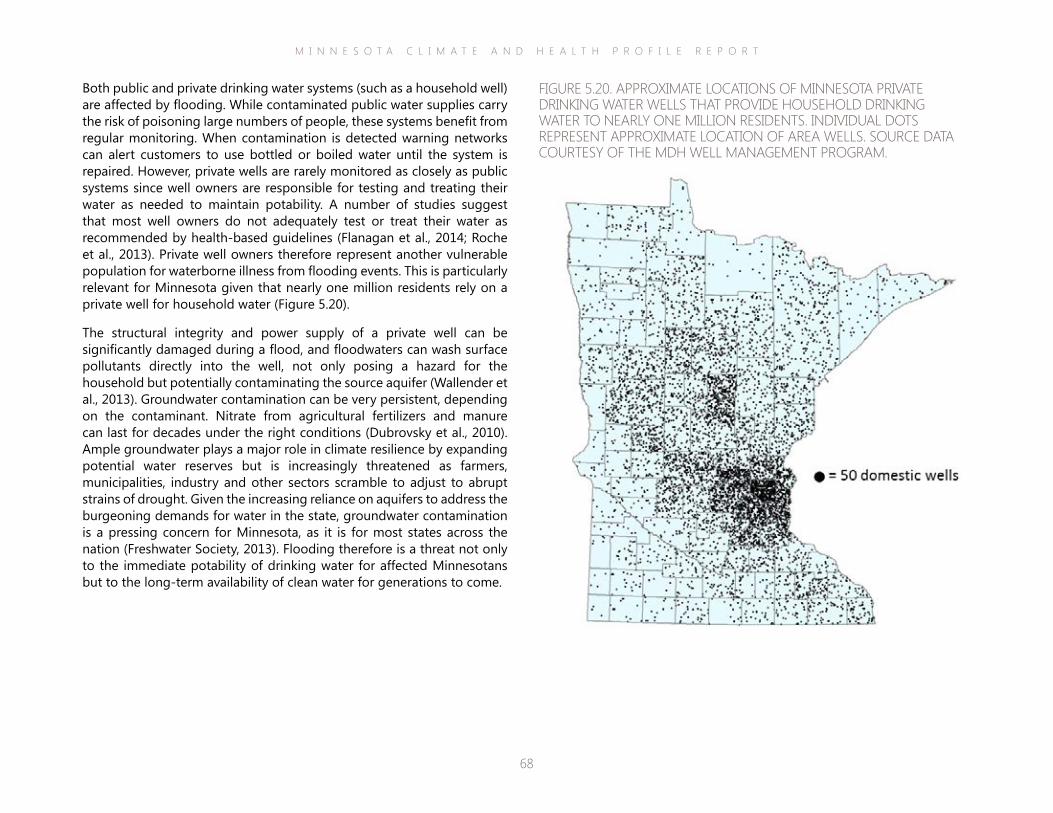
M I N N E S O T A C L I M A T E A N D H E A L T H P R O F I L E R E P O R T
68
Both public and private drinking water systems (such as a household well) are affected by flooding. While contaminated public water supplies carry the risk of poisoning large numbers of people, these systems benefit from regular monitoring. When contamination is detected warning networks can alert customers to use bottled or boiled water until the system is repaired. However, private wells are rarely monitored as closely as public systems since well owners are responsible for testing and treating their water as needed to maintain potability. A number of studies suggest that most well owners do not adequately test or treat their water as recommended by health-based guidelines (Flanagan et al., 2014; Roche et al., 2013). Private well owners therefore represent another vulnerable population for waterborne illness from flooding events. This is particularly relevant for Minnesota given that nearly one million residents rely on a private well for household water (Figure 5.20).
The structural integrity and power supply of a private well can be significantly damaged during a flood, and floodwaters can wash surface pollutants directly into the well, not only posing a hazard for the household but potentially contaminating the source aquifer (Wallender et al., 2013). Groundwater contamination can be very persistent, depending on the contaminant. Nitrate from agricultural fertilizers and manure can last for decades under the right conditions (Dubrovsky et al., 2010). Ample groundwater plays a major role in climate resilience by expanding potential water reserves but is increasingly threatened as farmers, municipalities, industry and other sectors scramble to adjust to abrupt strains of drought. Given the increasing reliance on aquifers to address the burgeoning demands for water in the state, groundwater contamination is a pressing concern for Minnesota, as it is for most states across the nation (Freshwater Society, 2013). Flooding therefore is a threat not only to the immediate potability of drinking water for affected Minnesotans but to the long-term availability of clean water for generations to come.
FIGURE 5.20. APPROXIMATE LOCATIONS OF MINNESOTA PRIVATE DRINKING WATER WELLS THAT PROVIDE HOUSEHOLD DRINKING WATER TO NEARLY ONE MILLION RESIDENTS. INDIVIDUAL DOTS REPRESENT APPROXIMATE LOCATION OF AREA WELLS. SOURCE DATA COURTESY OF THE MDH WELL MANAGEMENT PROGRAM.

M I N N E S O T A C L I M A T E A N D H E A L T H P R O F I L E R E P O R T
69
The increased use of mental health services following a flood contributes to its overall economic cost, but is often not included in broad estimates of damage. Studies of severe flooding in the U.K. demonstrated that 90 percent of associated public health costs were devoted to mental health problems (UKEA, 2010). Flooding in France in 2002 resulted in a net increase in psychotropic drugs, with a cost to insurance of approximately 375,000 dollars (WHO, 2013).
Substantial evidence from the scientific literature indicates that a major factor in the experience and persistence of mental stress amongst flood victims is how people are treated by the organizations they interact with during the recovery phase (WHO, 2013). Examples of these organizations include builders, contractors, utility companies and insurance adjusters. In particular, a number of studies underscore that financial losses and frustrations with negotiating insurance payments for rebuilding are highly correlated with the mental stress experienced by flood victims (Bei et al., 2013; Paranjothy et al., 2011). A report from the UK on the experience of households flooded over the period 1998-2000 found that “problems with insurers” was a major predictor of psychological distress and PTSD at two to four years after flooding (DEFRA/UKEA).
such as sleeplessness, anxiety and depression (Adeola, 2009).
In the aftermath of the Midwest floods of 1993, rates of domestic violence and alcohol abuse, manifestations of extreme stress and mental health problems, were all elevated in affected communities (Axelrod et al., 1994). A study on the 1997 floods in North Dakota suggested that impacted women experienced worse pregnancy outcomes post-disaster than pre-disaster, with the authors attributing this result to stress and anxiety associated with the event (Tong et al., 2011).
MENTAL STRESSAccording to a report by the Climate Institute, one in five people suffers from the effects of psychological stress after a severe weather event (Climate Institute, 2011). Some level of mental stress is common during and after a flood. Emotional responses like tearfulness, numbness, anger, or insomnia are common (WHO, 2013). However, these symptoms can persist and disrupt an individual’s ability to fulfill their responsibilities and be present in their daily life. Post-traumatic stress disorder (PTSD) is the most common mental health disorder found in people affected by natural disasters like floods, followed by depression and anxiety (Heo et al., 2008; Liu et al., 2006; Mason et al., 2010). These conditions and the toll they exact on victims’ lives can last for months or even years after a flood, as those affected continue to struggle with the loss of their belongings, damage to their homes, disruption to work, school and social involvement, or complete displacement from their community. Studies of flood impacts report prevalence of mental health disorders ranging from approximately nine percent (Liu et al., 2006) to 53 percent (Heo et al., 2008) in the first two years following floods. One study of psychosocial outcomes in those badly affected by floods showed that the prevalence of adverse mental health symptoms was two to five times higher among people who reported floodwater in their home than in people who did not (Paranjothy et al., 2011). A study on a large population of Hurricane Katrina flood victims in the U.S. showed significant racial and gender difference in psychological impacts,
A resident carries some of the contents of her home. Rushford, MN, 2007. Photo courtesy of Wikimedia Commons.
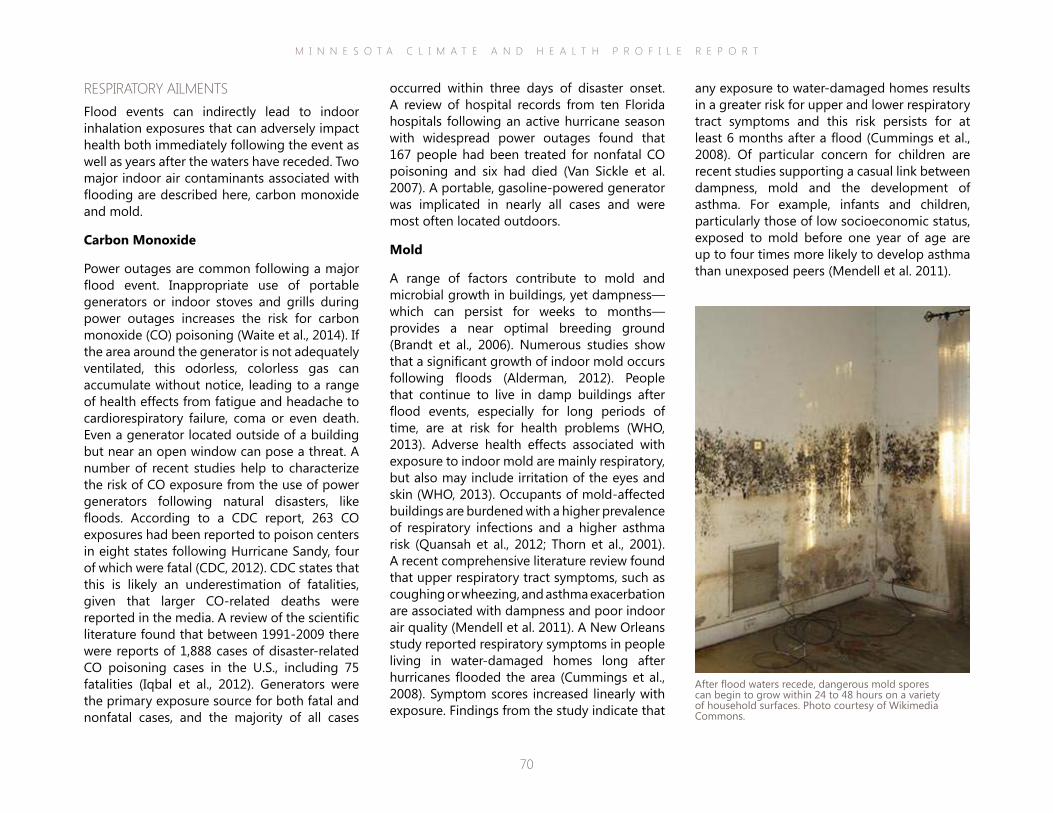
M I N N E S O T A C L I M A T E A N D H E A L T H P R O F I L E R E P O R T
70
any exposure to water-damaged homes results in a greater risk for upper and lower respiratory tract symptoms and this risk persists for at least 6 months after a flood (Cummings et al., 2008). Of particular concern for children are recent studies supporting a casual link between dampness, mold and the development of asthma. For example, infants and children, particularly those of low socioeconomic status, exposed to mold before one year of age are up to four times more likely to develop asthma than unexposed peers (Mendell et al. 2011).
occurred within three days of disaster onset. A review of hospital records from ten Florida hospitals following an active hurricane season with widespread power outages found that 167 people had been treated for nonfatal CO poisoning and six had died (Van Sickle et al. 2007). A portable, gasoline-powered generator was implicated in nearly all cases and were most often located outdoors.
Mold
A range of factors contribute to mold and microbial growth in buildings, yet dampness—which can persist for weeks to months—provides a near optimal breeding ground (Brandt et al., 2006). Numerous studies show that a significant growth of indoor mold occurs following floods (Alderman, 2012). People that continue to live in damp buildings after flood events, especially for long periods of time, are at risk for health problems (WHO, 2013). Adverse health effects associated with exposure to indoor mold are mainly respiratory, but also may include irritation of the eyes and skin (WHO, 2013). Occupants of mold-affected buildings are burdened with a higher prevalence of respiratory infections and a higher asthma risk (Quansah et al., 2012; Thorn et al., 2001). A recent comprehensive literature review found that upper respiratory tract symptoms, such as coughing or wheezing, and asthma exacerbation are associated with dampness and poor indoor air quality (Mendell et al. 2011). A New Orleans study reported respiratory symptoms in people living in water-damaged homes long after hurricanes flooded the area (Cummings et al., 2008). Symptom scores increased linearly with exposure. Findings from the study indicate that
RESPIRATORY AILMENTSFlood events can indirectly lead to indoor inhalation exposures that can adversely impact health both immediately following the event as well as years after the waters have receded. Two major indoor air contaminants associated with flooding are described here, carbon monoxide and mold.
Carbon Monoxide
Power outages are common following a major flood event. Inappropriate use of portable generators or indoor stoves and grills during power outages increases the risk for carbon monoxide (CO) poisoning (Waite et al., 2014). If the area around the generator is not adequately ventilated, this odorless, colorless gas can accumulate without notice, leading to a range of health effects from fatigue and headache to cardiorespiratory failure, coma or even death. Even a generator located outside of a building but near an open window can pose a threat. A number of recent studies help to characterize the risk of CO exposure from the use of power generators following natural disasters, like floods. According to a CDC report, 263 CO exposures had been reported to poison centers in eight states following Hurricane Sandy, four of which were fatal (CDC, 2012). CDC states that this is likely an underestimation of fatalities, given that larger CO-related deaths were reported in the media. A review of the scientific literature found that between 1991-2009 there were reports of 1,888 cases of disaster-related CO poisoning cases in the U.S., including 75 fatalities (Iqbal et al., 2012). Generators were the primary exposure source for both fatal and nonfatal cases, and the majority of all cases
After flood waters recede, dangerous mold spores can begin to grow within 24 to 48 hours on a variety of household surfaces. Photo courtesy of Wikimedia Commons.
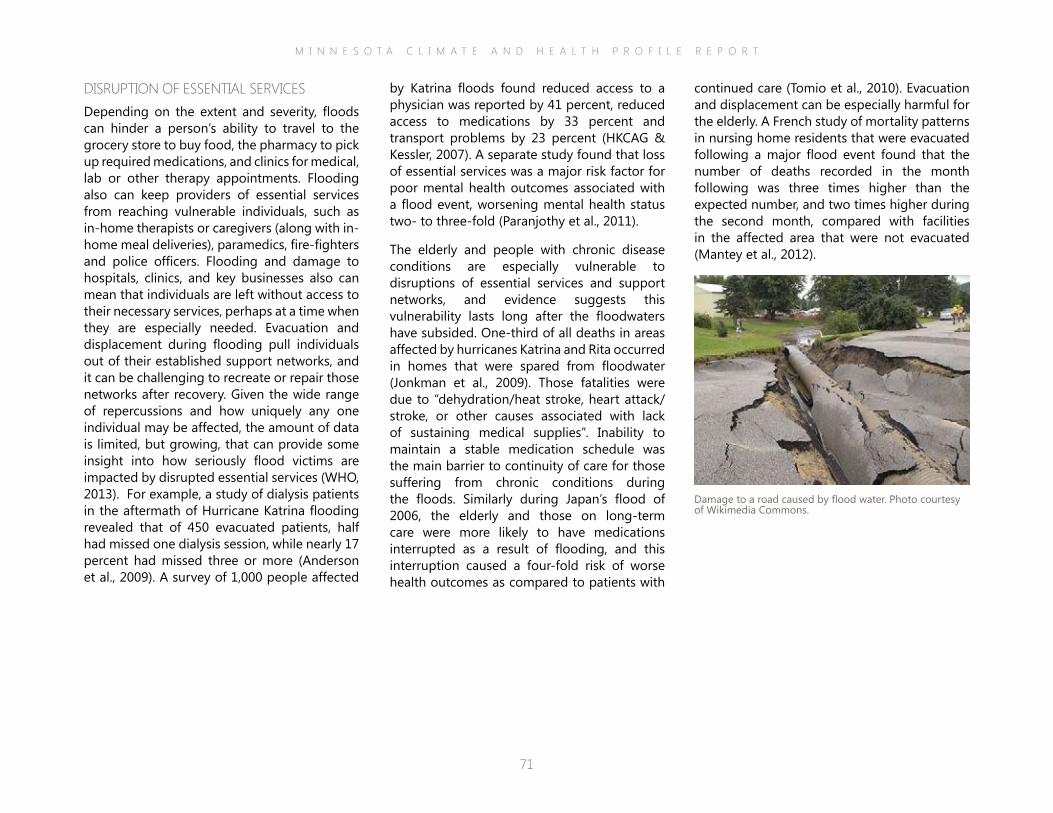
M I N N E S O T A C L I M A T E A N D H E A L T H P R O F I L E R E P O R T
71
by Katrina floods found reduced access to a physician was reported by 41 percent, reduced access to medications by 33 percent and transport problems by 23 percent (HKCAG & Kessler, 2007). A separate study found that loss of essential services was a major risk factor for poor mental health outcomes associated with a flood event, worsening mental health status two- to three-fold (Paranjothy et al., 2011).
The elderly and people with chronic disease conditions are especially vulnerable to disruptions of essential services and support networks, and evidence suggests this vulnerability lasts long after the floodwaters have subsided. One-third of all deaths in areas affected by hurricanes Katrina and Rita occurred in homes that were spared from floodwater (Jonkman et al., 2009). Those fatalities were due to “dehydration/heat stroke, heart attack/stroke, or other causes associated with lack of sustaining medical supplies”. Inability to maintain a stable medication schedule was the main barrier to continuity of care for those suffering from chronic conditions during the floods. Similarly during Japan’s flood of 2006, the elderly and those on long-term care were more likely to have medications interrupted as a result of flooding, and this interruption caused a four-fold risk of worse health outcomes as compared to patients with
DISRUPTION OF ESSENTIAL SERVICESDepending on the extent and severity, floods can hinder a person’s ability to travel to the grocery store to buy food, the pharmacy to pick up required medications, and clinics for medical, lab or other therapy appointments. Flooding also can keep providers of essential services from reaching vulnerable individuals, such as in-home therapists or caregivers (along with in-home meal deliveries), paramedics, fire-fighters and police officers. Flooding and damage to hospitals, clinics, and key businesses also can mean that individuals are left without access to their necessary services, perhaps at a time when they are especially needed. Evacuation and displacement during flooding pull individuals out of their established support networks, and it can be challenging to recreate or repair those networks after recovery. Given the wide range of repercussions and how uniquely any one individual may be affected, the amount of data is limited, but growing, that can provide some insight into how seriously flood victims are impacted by disrupted essential services (WHO, 2013). For example, a study of dialysis patients in the aftermath of Hurricane Katrina flooding revealed that of 450 evacuated patients, half had missed one dialysis session, while nearly 17 percent had missed three or more (Anderson et al., 2009). A survey of 1,000 people affected
Damage to a road caused by flood water. Photo courtesy of Wikimedia Commons.
continued care (Tomio et al., 2010). Evacuation and displacement can be especially harmful for the elderly. A French study of mortality patterns in nursing home residents that were evacuated following a major flood event found that the number of deaths recorded in the month following was three times higher than the expected number, and two times higher during the second month, compared with facilities in the affected area that were not evacuated (Mantey et al., 2012).
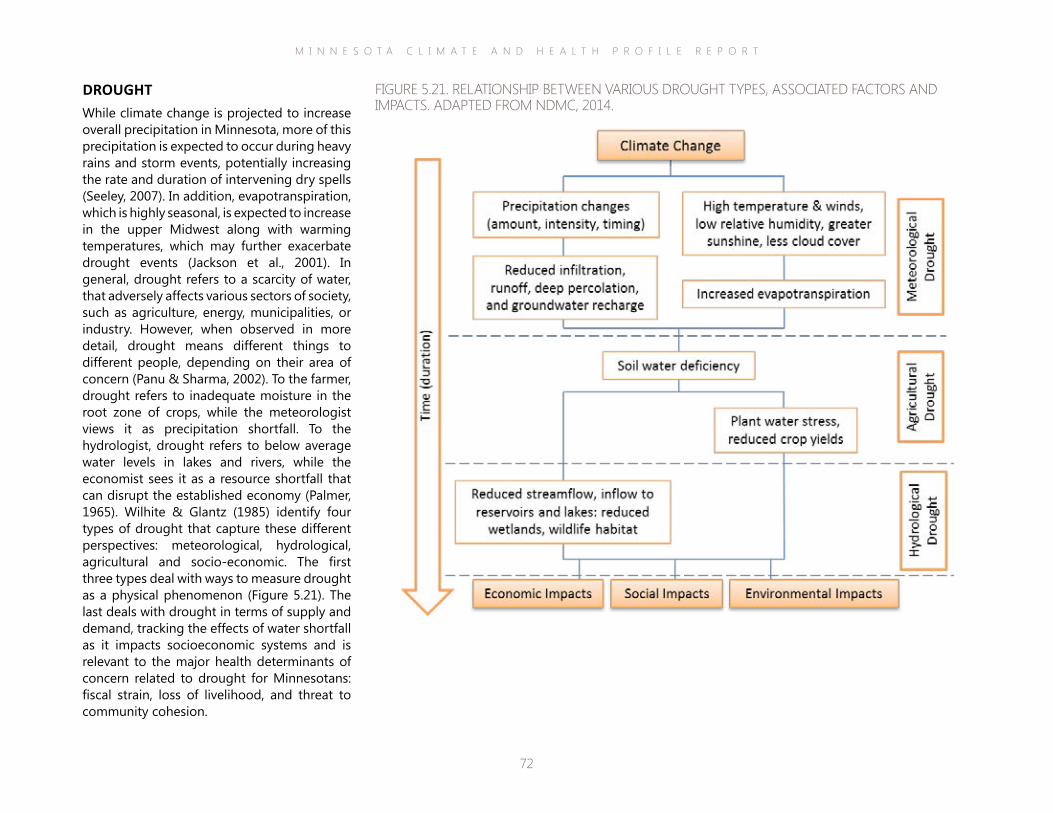
M I N N E S O T A C L I M A T E A N D H E A L T H P R O F I L E R E P O R T
72
DROUGHTWhile climate change is projected to increase overall precipitation in Minnesota, more of this precipitation is expected to occur during heavy rains and storm events, potentially increasing the rate and duration of intervening dry spells (Seeley, 2007). In addition, evapotranspiration, which is highly seasonal, is expected to increase in the upper Midwest along with warming temperatures, which may further exacerbate drought events (Jackson et al., 2001). In general, drought refers to a scarcity of water, that adversely affects various sectors of society, such as agriculture, energy, municipalities, or industry. However, when observed in more detail, drought means different things to different people, depending on their area of concern (Panu & Sharma, 2002). To the farmer, drought refers to inadequate moisture in the root zone of crops, while the meteorologist views it as precipitation shortfall. To the hydrologist, drought refers to below average water levels in lakes and rivers, while the economist sees it as a resource shortfall that can disrupt the established economy (Palmer, 1965). Wilhite & Glantz (1985) identify four types of drought that capture these different perspectives: meteorological, hydrological, agricultural and socio-economic. The first three types deal with ways to measure drought as a physical phenomenon (Figure 5.21). The last deals with drought in terms of supply and demand, tracking the effects of water shortfall as it impacts socioeconomic systems and is relevant to the major health determinants of concern related to drought for Minnesotans: fiscal strain, loss of livelihood, and threat to community cohesion.
FIGURE 5.21. RELATIONSHIP BETWEEN VARIOUS DROUGHT TYPES, ASSOCIATED FACTORS AND IMPACTS. ADAPTED FROM NDMC, 2014.
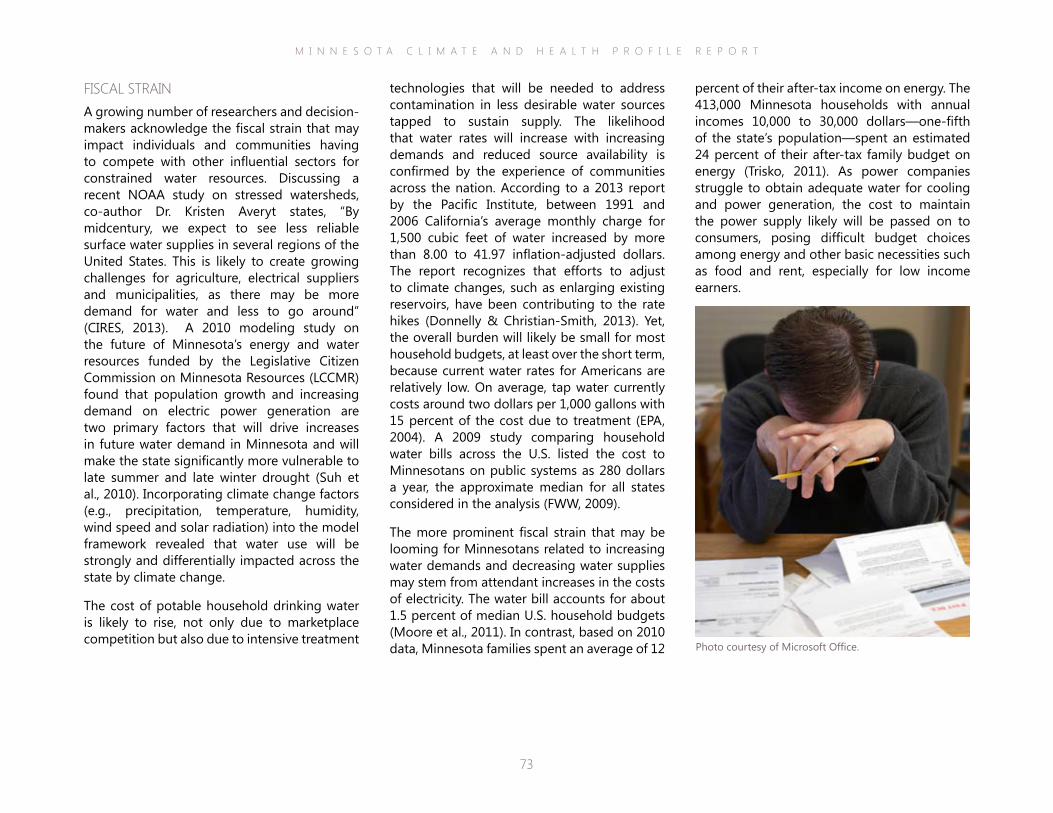
M I N N E S O T A C L I M A T E A N D H E A L T H P R O F I L E R E P O R T
73
percent of their after-tax income on energy. The 413,000 Minnesota households with annual incomes 10,000 to 30,000 dollars—one-fifth of the state’s population—spent an estimated 24 percent of their after-tax family budget on energy (Trisko, 2011). As power companies struggle to obtain adequate water for cooling and power generation, the cost to maintain the power supply likely will be passed on to consumers, posing difficult budget choices among energy and other basic necessities such as food and rent, especially for low income earners.
technologies that will be needed to address contamination in less desirable water sources tapped to sustain supply. The likelihood that water rates will increase with increasing demands and reduced source availability is confirmed by the experience of communities across the nation. According to a 2013 report by the Pacific Institute, between 1991 and 2006 California’s average monthly charge for 1,500 cubic feet of water increased by more than 8.00 to 41.97 inflation-adjusted dollars. The report recognizes that efforts to adjust to climate changes, such as enlarging existing reservoirs, have been contributing to the rate hikes (Donnelly & Christian-Smith, 2013). Yet, the overall burden will likely be small for most household budgets, at least over the short term, because current water rates for Americans are relatively low. On average, tap water currently costs around two dollars per 1,000 gallons with 15 percent of the cost due to treatment (EPA, 2004). A 2009 study comparing household water bills across the U.S. listed the cost to Minnesotans on public systems as 280 dollars a year, the approximate median for all states considered in the analysis (FWW, 2009).
The more prominent fiscal strain that may be looming for Minnesotans related to increasing water demands and decreasing water supplies may stem from attendant increases in the costs of electricity. The water bill accounts for about 1.5 percent of median U.S. household budgets (Moore et al., 2011). In contrast, based on 2010 data, Minnesota families spent an average of 12
FISCAL STRAINA growing number of researchers and decision-makers acknowledge the fiscal strain that may impact individuals and communities having to compete with other influential sectors for constrained water resources. Discussing a recent NOAA study on stressed watersheds, co-author Dr. Kristen Averyt states, “By midcentury, we expect to see less reliable surface water supplies in several regions of the United States. This is likely to create growing challenges for agriculture, electrical suppliers and municipalities, as there may be more demand for water and less to go around” (CIRES, 2013). A 2010 modeling study on the future of Minnesota’s energy and water resources funded by the Legislative Citizen Commission on Minnesota Resources (LCCMR) found that population growth and increasing demand on electric power generation are two primary factors that will drive increases in future water demand in Minnesota and will make the state significantly more vulnerable to late summer and late winter drought (Suh et al., 2010). Incorporating climate change factors (e.g., precipitation, temperature, humidity, wind speed and solar radiation) into the model framework revealed that water use will be strongly and differentially impacted across the state by climate change.
The cost of potable household drinking water is likely to rise, not only due to marketplace competition but also due to intensive treatment
Photo courtesy of Microsoft Office.
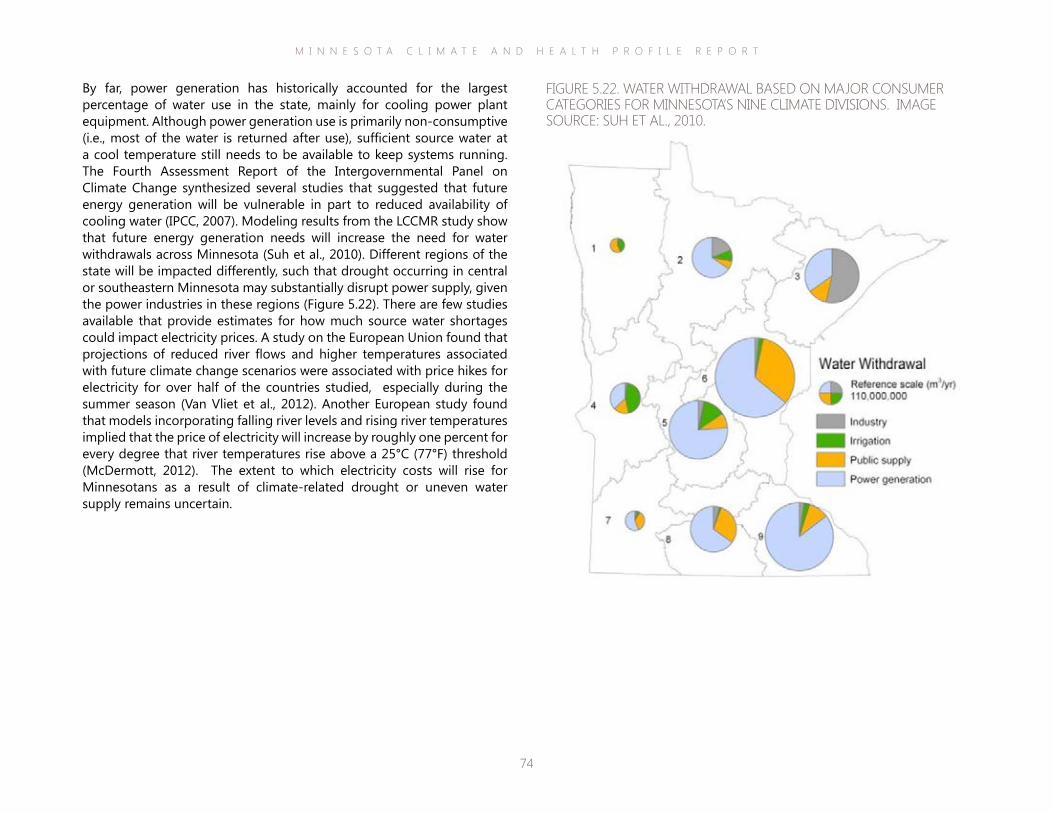
M I N N E S O T A C L I M A T E A N D H E A L T H P R O F I L E R E P O R T
74
By far, power generation has historically accounted for the largest percentage of water use in the state, mainly for cooling power plant equipment. Although power generation use is primarily non-consumptive (i.e., most of the water is returned after use), sufficient source water at a cool temperature still needs to be available to keep systems running. The Fourth Assessment Report of the Intergovernmental Panel on Climate Change synthesized several studies that suggested that future energy generation will be vulnerable in part to reduced availability of cooling water (IPCC, 2007). Modeling results from the LCCMR study show that future energy generation needs will increase the need for water withdrawals across Minnesota (Suh et al., 2010). Different regions of the state will be impacted differently, such that drought occurring in central or southeastern Minnesota may substantially disrupt power supply, given the power industries in these regions (Figure 5.22). There are few studies available that provide estimates for how much source water shortages could impact electricity prices. A study on the European Union found that projections of reduced river flows and higher temperatures associated with future climate change scenarios were associated with price hikes for electricity for over half of the countries studied, especially during the summer season (Van Vliet et al., 2012). Another European study found that models incorporating falling river levels and rising river temperatures implied that the price of electricity will increase by roughly one percent for every degree that river temperatures rise above a 25°C (77°F) threshold (McDermott, 2012). The extent to which electricity costs will rise for Minnesotans as a result of climate-related drought or uneven water supply remains uncertain.
FIGURE 5.22. WATER WITHDRAWAL BASED ON MAJOR CONSUMER CATEGORIES FOR MINNESOTA’S NINE CLIMATE DIVISIONS. IMAGE SOURCE: SUH ET AL., 2010.
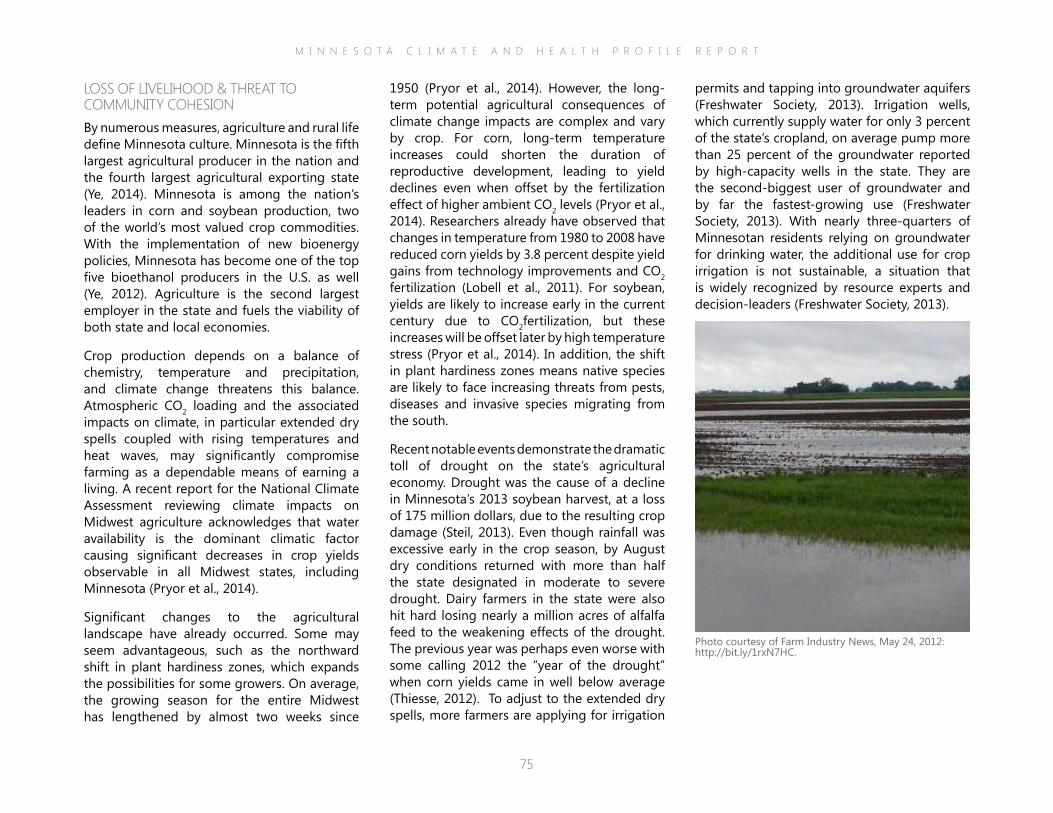
M I N N E S O T A C L I M A T E A N D H E A L T H P R O F I L E R E P O R T
75
permits and tapping into groundwater aquifers (Freshwater Society, 2013). Irrigation wells, which currently supply water for only 3 percent of the state’s cropland, on average pump more than 25 percent of the groundwater reported by high-capacity wells in the state. They are the second-biggest user of groundwater and by far the fastest-growing use (Freshwater Society, 2013). With nearly three-quarters of Minnesotan residents relying on groundwater for drinking water, the additional use for crop irrigation is not sustainable, a situation that is widely recognized by resource experts and decision-leaders (Freshwater Society, 2013).
1950 (Pryor et al., 2014). However, the long-term potential agricultural consequences of climate change impacts are complex and vary by crop. For corn, long-term temperature increases could shorten the duration of reproductive development, leading to yield declines even when offset by the fertilization effect of higher ambient CO2 levels (Pryor et al., 2014). Researchers already have observed that changes in temperature from 1980 to 2008 have reduced corn yields by 3.8 percent despite yield gains from technology improvements and CO2 fertilization (Lobell et al., 2011). For soybean, yields are likely to increase early in the current century due to CO2fertilization, but these increases will be offset later by high temperature stress (Pryor et al., 2014). In addition, the shift in plant hardiness zones means native species are likely to face increasing threats from pests, diseases and invasive species migrating from the south.
Recent notable events demonstrate the dramatic toll of drought on the state’s agricultural economy. Drought was the cause of a decline in Minnesota’s 2013 soybean harvest, at a loss of 175 million dollars, due to the resulting crop damage (Steil, 2013). Even though rainfall was excessive early in the crop season, by August dry conditions returned with more than half the state designated in moderate to severe drought. Dairy farmers in the state were also hit hard losing nearly a million acres of alfalfa feed to the weakening effects of the drought. The previous year was perhaps even worse with some calling 2012 the “year of the drought” when corn yields came in well below average (Thiesse, 2012). To adjust to the extended dry spells, more farmers are applying for irrigation
LOSS OF LIVELIHOOD & THREAT TO COMMUNITY COHESIONBy numerous measures, agriculture and rural life define Minnesota culture. Minnesota is the fifth largest agricultural producer in the nation and the fourth largest agricultural exporting state (Ye, 2014). Minnesota is among the nation’s leaders in corn and soybean production, two of the world’s most valued crop commodities. With the implementation of new bioenergy policies, Minnesota has become one of the top five bioethanol producers in the U.S. as well (Ye, 2012). Agriculture is the second largest employer in the state and fuels the viability of both state and local economies.
Crop production depends on a balance of chemistry, temperature and precipitation, and climate change threatens this balance. Atmospheric CO2 loading and the associated impacts on climate, in particular extended dry spells coupled with rising temperatures and heat waves, may significantly compromise farming as a dependable means of earning a living. A recent report for the National Climate Assessment reviewing climate impacts on Midwest agriculture acknowledges that water availability is the dominant climatic factor causing significant decreases in crop yields observable in all Midwest states, including Minnesota (Pryor et al., 2014).
Significant changes to the agricultural landscape have already occurred. Some may seem advantageous, such as the northward shift in plant hardiness zones, which expands the possibilities for some growers. On average, the growing season for the entire Midwest has lengthened by almost two weeks since
Photo courtesy of Farm Industry News, May 24, 2012: http://bit.ly/1rxN7HC.
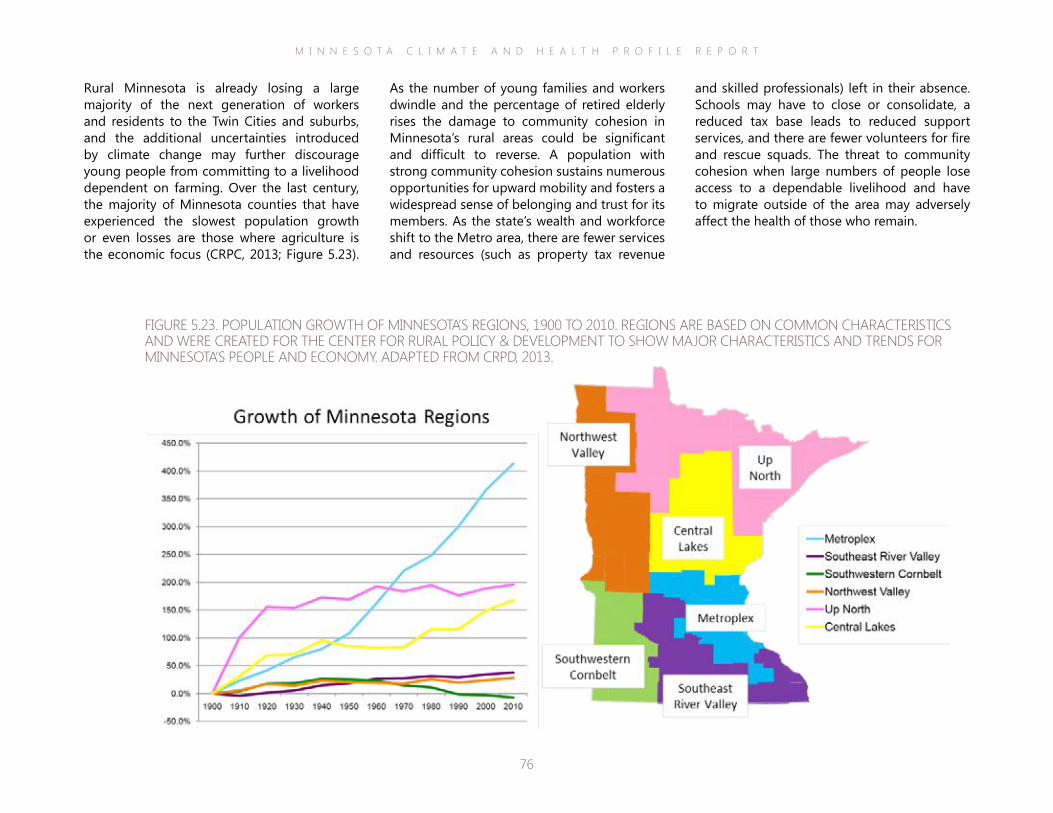
M I N N E S O T A C L I M A T E A N D H E A L T H P R O F I L E R E P O R T
76
and skilled professionals) left in their absence. Schools may have to close or consolidate, a reduced tax base leads to reduced support services, and there are fewer volunteers for fire and rescue squads. The threat to community cohesion when large numbers of people lose access to a dependable livelihood and have to migrate outside of the area may adversely affect the health of those who remain.
As the number of young families and workers dwindle and the percentage of retired elderly rises the damage to community cohesion in Minnesota’s rural areas could be significant and difficult to reverse. A population with strong community cohesion sustains numerous opportunities for upward mobility and fosters a widespread sense of belonging and trust for its members. As the state’s wealth and workforce shift to the Metro area, there are fewer services and resources (such as property tax revenue
Rural Minnesota is already losing a large majority of the next generation of workers and residents to the Twin Cities and suburbs, and the additional uncertainties introduced by climate change may further discourage young people from committing to a livelihood dependent on farming. Over the last century, the majority of Minnesota counties that have experienced the slowest population growth or even losses are those where agriculture is the economic focus (CRPC, 2013; Figure 5.23).
FIGURE 5.23. POPULATION GROWTH OF MINNESOTA’S REGIONS, 1900 TO 2010. REGIONS ARE BASED ON COMMON CHARACTERISTICS AND WERE CREATED FOR THE CENTER FOR RURAL POLICY & DEVELOPMENT TO SHOW MAJOR CHARACTERISTICS AND TRENDS FOR MINNESOTA’S PEOPLE AND ECONOMY. ADAPTED FROM CRPD, 2013.
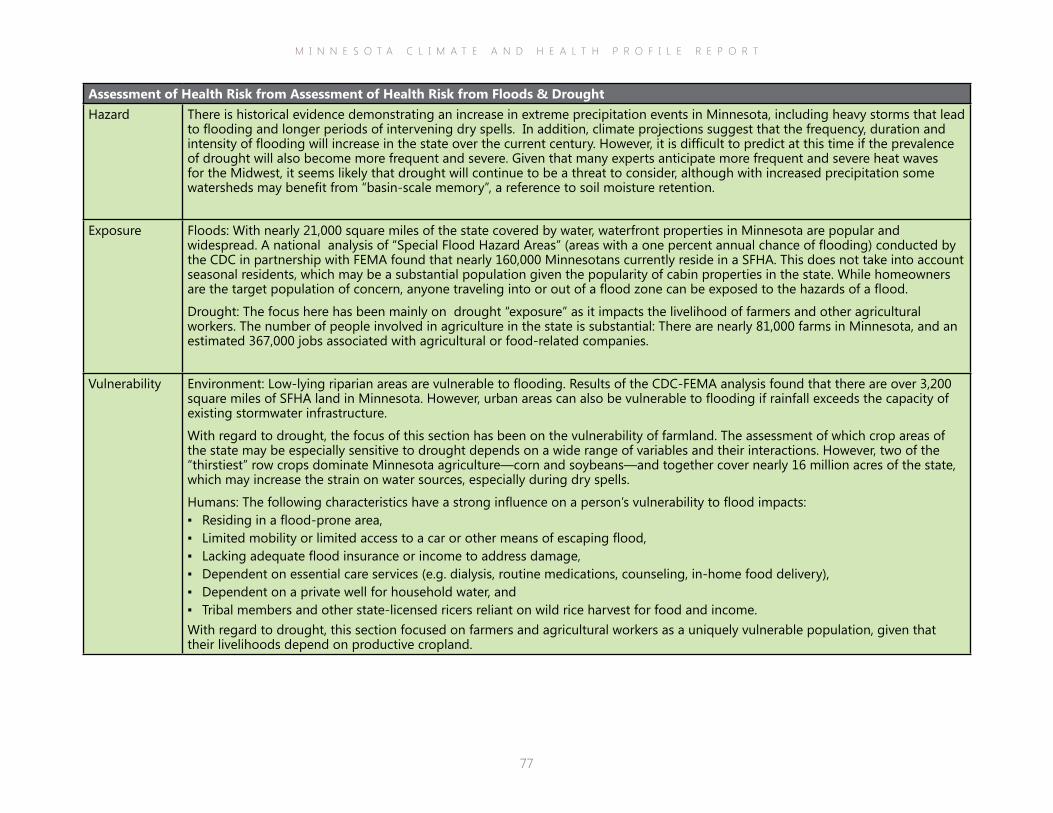
M I N N E S O T A C L I M A T E A N D H E A L T H P R O F I L E R E P O R T
77
Assessment of Health Risk from Assessment of Health Risk from Floods & DroughtHazard There is historical evidence demonstrating an increase in extreme precipitation events in Minnesota, including heavy storms that lead
to flooding and longer periods of intervening dry spells. In addition, climate projections suggest that the frequency, duration and intensity of flooding will increase in the state over the current century. However, it is difficult to predict at this time if the prevalence of drought will also become more frequent and severe. Given that many experts anticipate more frequent and severe heat waves for the Midwest, it seems likely that drought will continue to be a threat to consider, although with increased precipitation some watersheds may benefit from “basin-scale memory”, a reference to soil moisture retention.
Exposure Floods: With nearly 21,000 square miles of the state covered by water, waterfront properties in Minnesota are popular and widespread. A national analysis of “Special Flood Hazard Areas” (areas with a one percent annual chance of flooding) conducted by the CDC in partnership with FEMA found that nearly 160,000 Minnesotans currently reside in a SFHA. This does not take into account seasonal residents, which may be a substantial population given the popularity of cabin properties in the state. While homeowners are the target population of concern, anyone traveling into or out of a flood zone can be exposed to the hazards of a flood.
Drought: The focus here has been mainly on drought “exposure” as it impacts the livelihood of farmers and other agricultural workers. The number of people involved in agriculture in the state is substantial: There are nearly 81,000 farms in Minnesota, and an estimated 367,000 jobs associated with agricultural or food-related companies.
Vulnerability Environment: Low-lying riparian areas are vulnerable to flooding. Results of the CDC-FEMA analysis found that there are over 3,200 square miles of SFHA land in Minnesota. However, urban areas can also be vulnerable to flooding if rainfall exceeds the capacity of existing stormwater infrastructure.
With regard to drought, the focus of this section has been on the vulnerability of farmland. The assessment of which crop areas of the state may be especially sensitive to drought depends on a wide range of variables and their interactions. However, two of the “thirstiest” row crops dominate Minnesota agriculture—corn and soybeans—and together cover nearly 16 million acres of the state, which may increase the strain on water sources, especially during dry spells.
Humans: The following characteristics have a strong influence on a person’s vulnerability to flood impacts: ▪ Residing in a flood-prone area, ▪ Limited mobility or limited access to a car or other means of escaping flood, ▪ Lacking adequate flood insurance or income to address damage, ▪ Dependent on essential care services (e.g. dialysis, routine medications, counseling, in-home food delivery), ▪ Dependent on a private well for household water, and ▪ Tribal members and other state-licensed ricers reliant on wild rice harvest for food and income.
With regard to drought, this section focused on farmers and agricultural workers as a uniquely vulnerable population, given that their livelihoods depend on productive cropland.
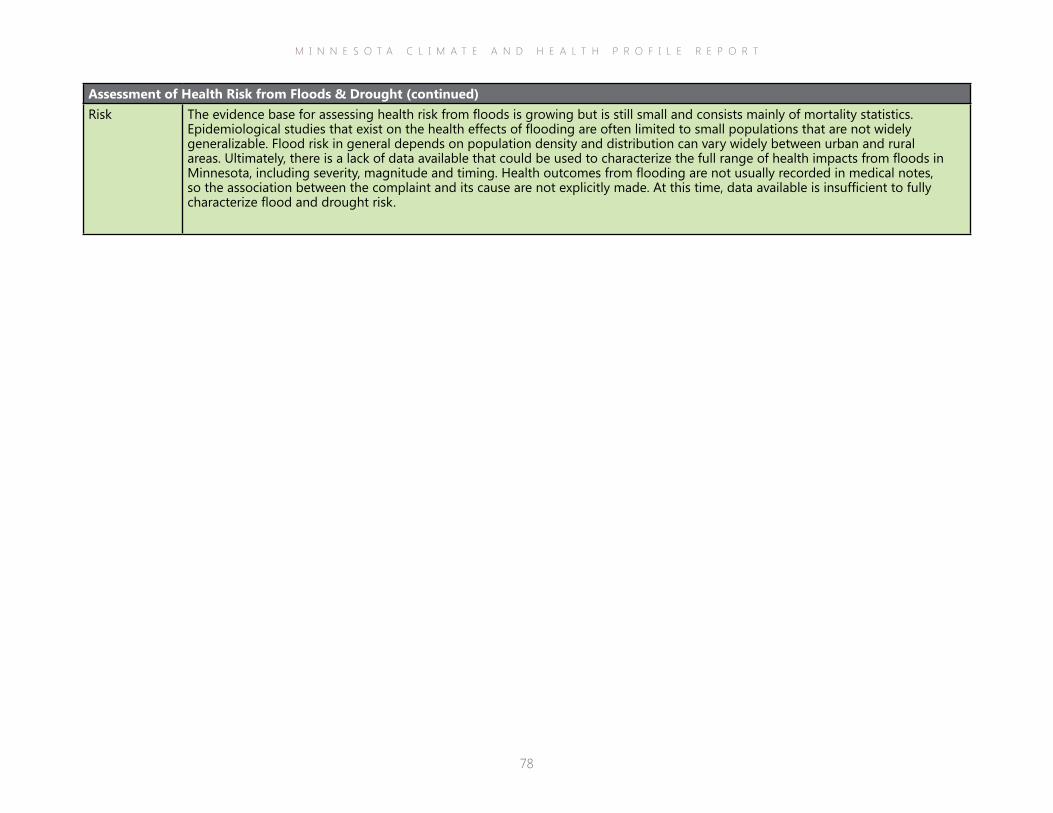
M I N N E S O T A C L I M A T E A N D H E A L T H P R O F I L E R E P O R T
78
Assessment of Health Risk from Floods & Drought (continued)Risk The evidence base for assessing health risk from floods is growing but is still small and consists mainly of mortality statistics.
Epidemiological studies that exist on the health effects of flooding are often limited to small populations that are not widely generalizable. Flood risk in general depends on population density and distribution can vary widely between urban and rural areas. Ultimately, there is a lack of data available that could be used to characterize the full range of health impacts from floods in Minnesota, including severity, magnitude and timing. Health outcomes from flooding are not usually recorded in medical notes, so the association between the complaint and its cause are not explicitly made. At this time, data available is insufficient to fully characterize flood and drought risk.
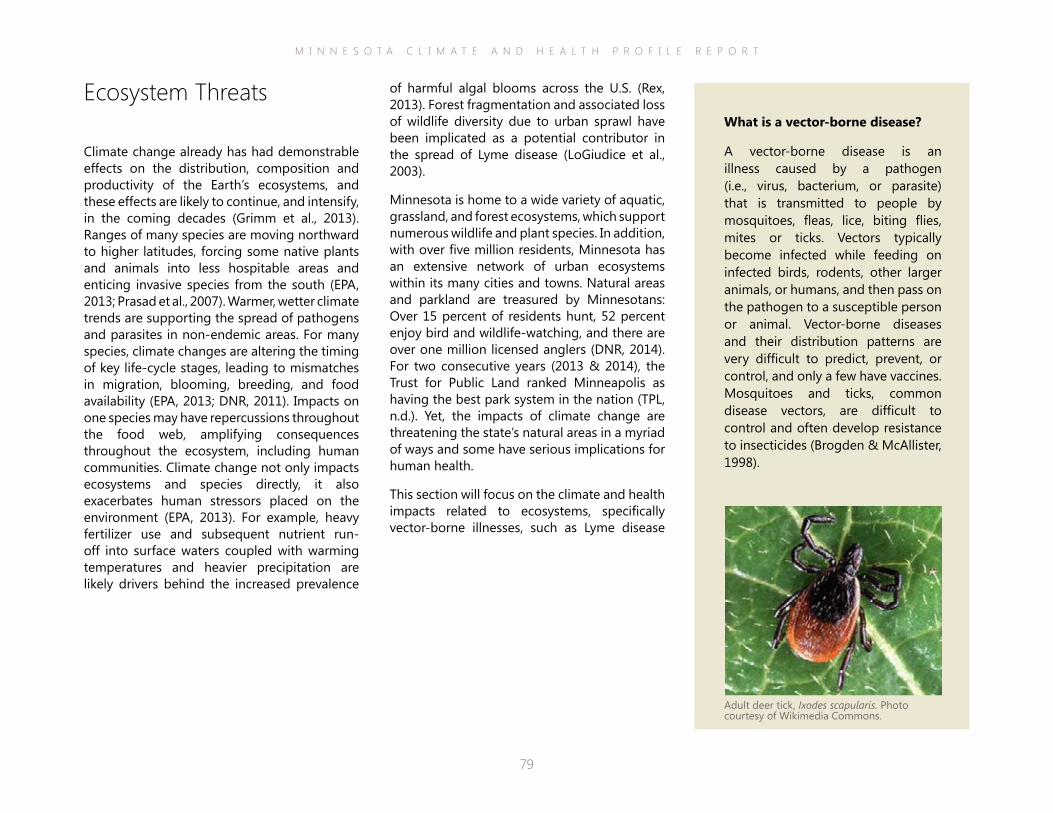
M I N N E S O T A C L I M A T E A N D H E A L T H P R O F I L E R E P O R T
79
What is a vector-borne disease?
A vector-borne disease is an illness caused by a pathogen (i.e., virus, bacterium, or parasite) that is transmitted to people by mosquitoes, fleas, lice, biting flies, mites or ticks. Vectors typically become infected while feeding on infected birds, rodents, other larger animals, or humans, and then pass on the pathogen to a susceptible person or animal. Vector-borne diseases and their distribution patterns are very difficult to predict, prevent, or control, and only a few have vaccines. Mosquitoes and ticks, common disease vectors, are difficult to control and often develop resistance to insecticides (Brogden & McAllister, 1998).
of harmful algal blooms across the U.S. (Rex, 2013). Forest fragmentation and associated loss of wildlife diversity due to urban sprawl have been implicated as a potential contributor in the spread of Lyme disease (LoGiudice et al., 2003).
Minnesota is home to a wide variety of aquatic, grassland, and forest ecosystems, which support numerous wildlife and plant species. In addition, with over five million residents, Minnesota has an extensive network of urban ecosystems within its many cities and towns. Natural areas and parkland are treasured by Minnesotans: Over 15 percent of residents hunt, 52 percent enjoy bird and wildlife-watching, and there are over one million licensed anglers (DNR, 2014). For two consecutive years (2013 & 2014), the Trust for Public Land ranked Minneapolis as having the best park system in the nation (TPL, n.d.). Yet, the impacts of climate change are threatening the state’s natural areas in a myriad of ways and some have serious implications for human health.
This section will focus on the climate and health impacts related to ecosystems, specifically vector-borne illnesses, such as Lyme disease
Ecosystem Threats
Climate change already has had demonstrable effects on the distribution, composition and productivity of the Earth’s ecosystems, and these effects are likely to continue, and intensify, in the coming decades (Grimm et al., 2013). Ranges of many species are moving northward to higher latitudes, forcing some native plants and animals into less hospitable areas and enticing invasive species from the south (EPA, 2013; Prasad et al., 2007). Warmer, wetter climate trends are supporting the spread of pathogens and parasites in non-endemic areas. For many species, climate changes are altering the timing of key life-cycle stages, leading to mismatches in migration, blooming, breeding, and food availability (EPA, 2013; DNR, 2011). Impacts on one species may have repercussions throughout the food web, amplifying consequences throughout the ecosystem, including human communities. Climate change not only impacts ecosystems and species directly, it also exacerbates human stressors placed on the environment (EPA, 2013). For example, heavy fertilizer use and subsequent nutrient run-off into surface waters coupled with warming temperatures and heavier precipitation are likely drivers behind the increased prevalence
Adult deer tick, Ixodes scapularis. Photo courtesy of Wikimedia Commons.
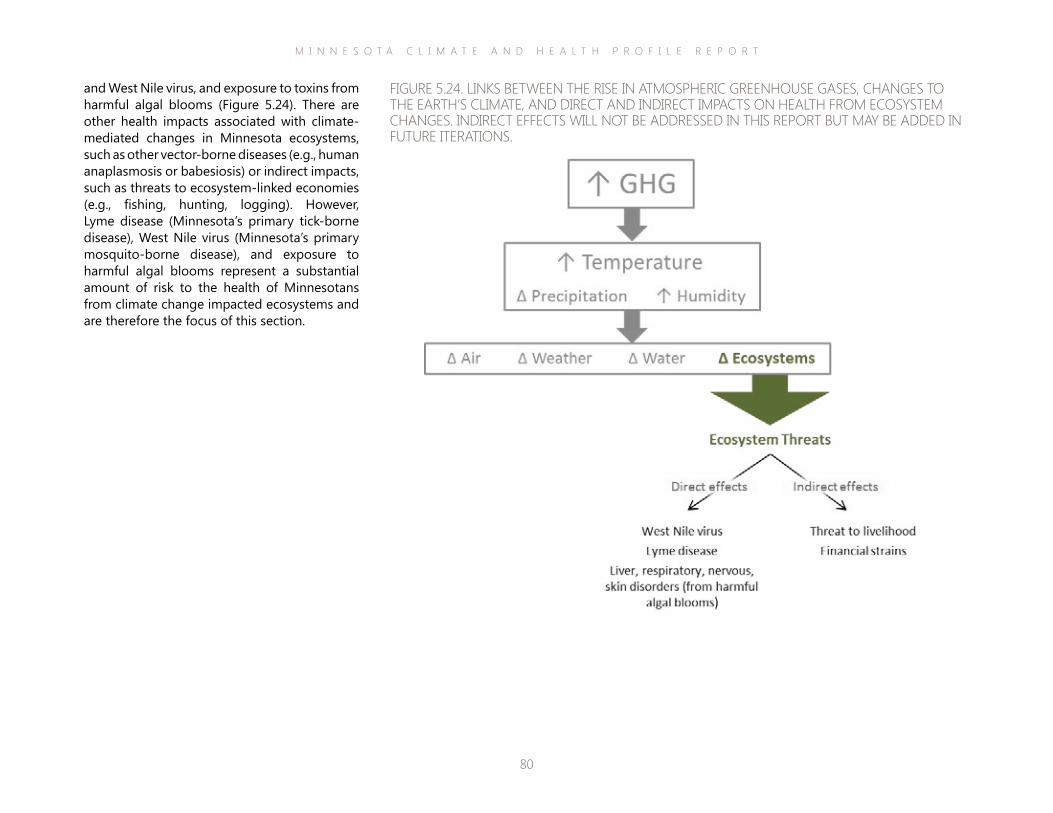
M I N N E S O T A C L I M A T E A N D H E A L T H P R O F I L E R E P O R T
80
and West Nile virus, and exposure to toxins from harmful algal blooms (Figure 5.24). There are other health impacts associated with climate-mediated changes in Minnesota ecosystems, such as other vector-borne diseases (e.g., human anaplasmosis or babesiosis) or indirect impacts, such as threats to ecosystem-linked economies (e.g., fishing, hunting, logging). However, Lyme disease (Minnesota’s primary tick-borne disease), West Nile virus (Minnesota’s primary mosquito-borne disease), and exposure to harmful algal blooms represent a substantial amount of risk to the health of Minnesotans from climate change impacted ecosystems and are therefore the focus of this section.
FIGURE 5.24. LINKS BETWEEN THE RISE IN ATMOSPHERIC GREENHOUSE GASES, CHANGES TO THE EARTH’S CLIMATE, AND DIRECT AND INDIRECT IMPACTS ON HEALTH FROM ECOSYSTEM CHANGES. INDIRECT EFFECTS WILL NOT BE ADDRESSED IN THIS REPORT BUT MAY BE ADDED IN FUTURE ITERATIONS.
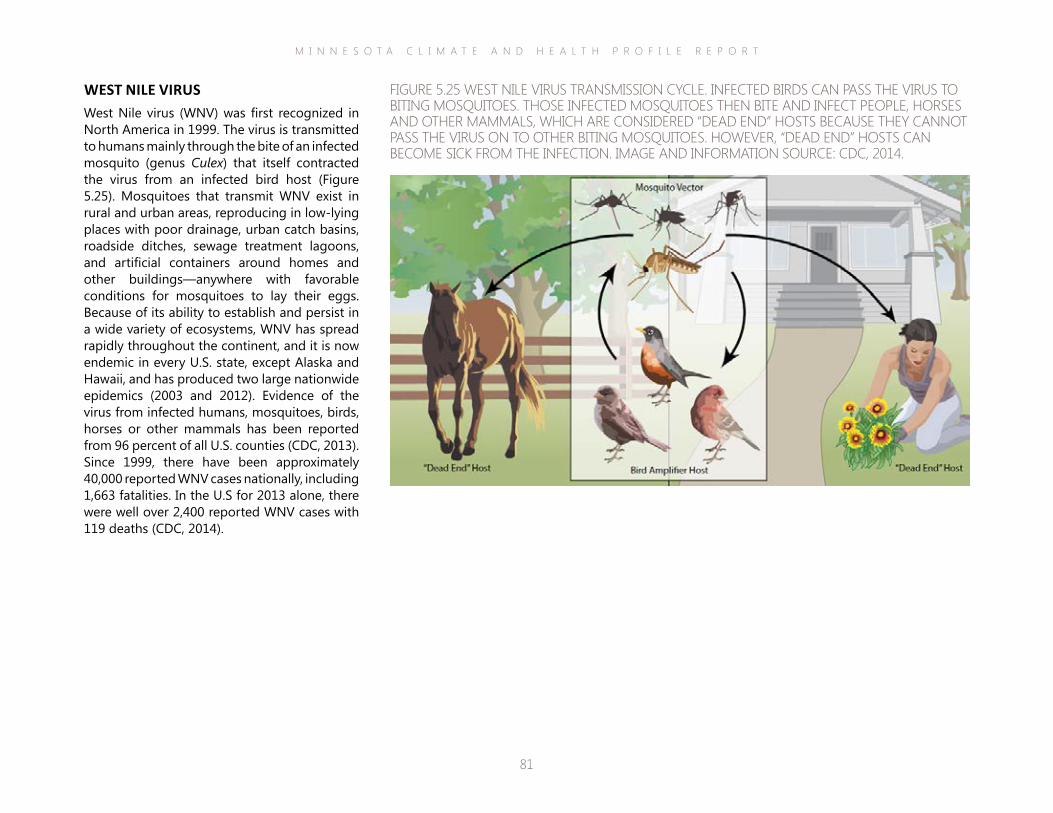
M I N N E S O T A C L I M A T E A N D H E A L T H P R O F I L E R E P O R T
81
WEST NILE VIRUSWest Nile virus (WNV) was first recognized in North America in 1999. The virus is transmitted to humans mainly through the bite of an infected mosquito (genus Culex) that itself contracted the virus from an infected bird host (Figure 5.25). Mosquitoes that transmit WNV exist in rural and urban areas, reproducing in low-lying places with poor drainage, urban catch basins, roadside ditches, sewage treatment lagoons, and artificial containers around homes and other buildings—anywhere with favorable conditions for mosquitoes to lay their eggs. Because of its ability to establish and persist in a wide variety of ecosystems, WNV has spread rapidly throughout the continent, and it is now endemic in every U.S. state, except Alaska and Hawaii, and has produced two large nationwide epidemics (2003 and 2012). Evidence of the virus from infected humans, mosquitoes, birds, horses or other mammals has been reported from 96 percent of all U.S. counties (CDC, 2013). Since 1999, there have been approximately 40,000 reported WNV cases nationally, including 1,663 fatalities. In the U.S for 2013 alone, there were well over 2,400 reported WNV cases with 119 deaths (CDC, 2014).
FIGURE 5.25 WEST NILE VIRUS TRANSMISSION CYCLE. INFECTED BIRDS CAN PASS THE VIRUS TO BITING MOSQUITOES. THOSE INFECTED MOSQUITOES THEN BITE AND INFECT PEOPLE, HORSES AND OTHER MAMMALS, WHICH ARE CONSIDERED “DEAD END” HOSTS BECAUSE THEY CANNOT PASS THE VIRUS ON TO OTHER BITING MOSQUITOES. HOWEVER, “DEAD END” HOSTS CAN BECOME SICK FROM THE INFECTION. IMAGE AND INFORMATION SOURCE: CDC, 2014.
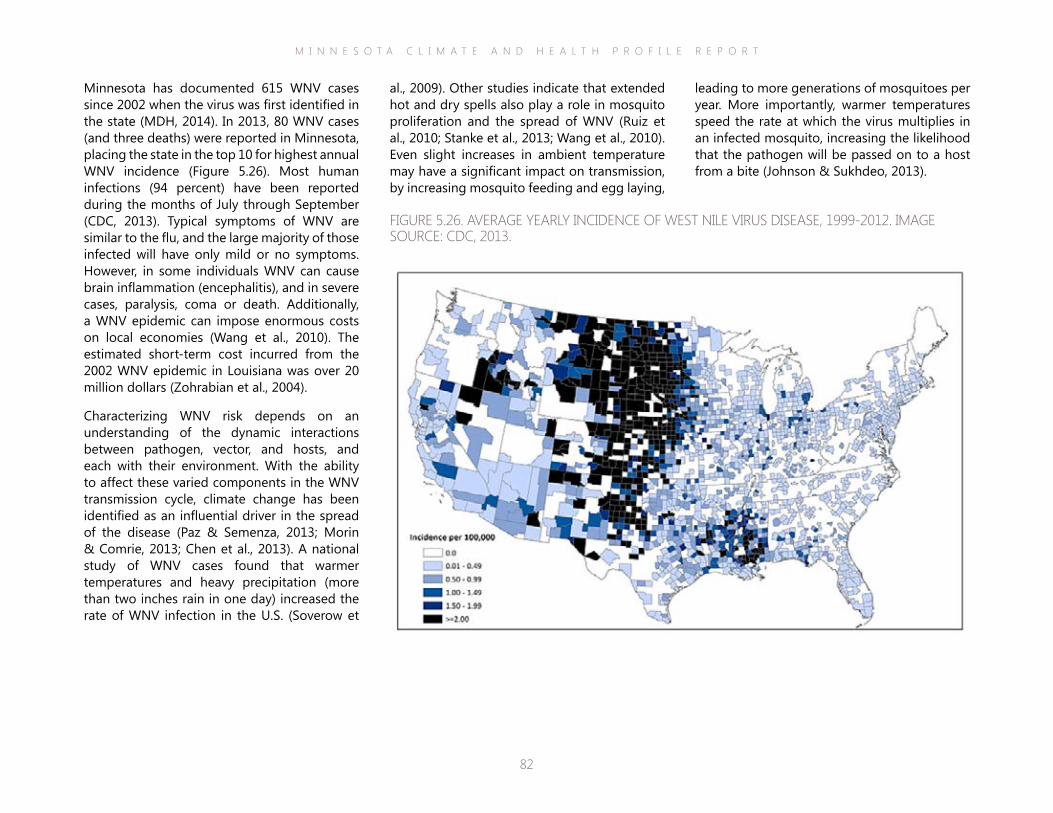
M I N N E S O T A C L I M A T E A N D H E A L T H P R O F I L E R E P O R T
82
leading to more generations of mosquitoes per year. More importantly, warmer temperatures speed the rate at which the virus multiplies in an infected mosquito, increasing the likelihood that the pathogen will be passed on to a host from a bite (Johnson & Sukhdeo, 2013).
al., 2009). Other studies indicate that extended hot and dry spells also play a role in mosquito proliferation and the spread of WNV (Ruiz et al., 2010; Stanke et al., 2013; Wang et al., 2010). Even slight increases in ambient temperature may have a significant impact on transmission, by increasing mosquito feeding and egg laying,
Minnesota has documented 615 WNV cases since 2002 when the virus was first identified in the state (MDH, 2014). In 2013, 80 WNV cases (and three deaths) were reported in Minnesota, placing the state in the top 10 for highest annual WNV incidence (Figure 5.26). Most human infections (94 percent) have been reported during the months of July through September (CDC, 2013). Typical symptoms of WNV are similar to the flu, and the large majority of those infected will have only mild or no symptoms. However, in some individuals WNV can cause brain inflammation (encephalitis), and in severe cases, paralysis, coma or death. Additionally, a WNV epidemic can impose enormous costs on local economies (Wang et al., 2010). The estimated short-term cost incurred from the 2002 WNV epidemic in Louisiana was over 20 million dollars (Zohrabian et al., 2004).
Characterizing WNV risk depends on an understanding of the dynamic interactions between pathogen, vector, and hosts, and each with their environment. With the ability to affect these varied components in the WNV transmission cycle, climate change has been identified as an influential driver in the spread of the disease (Paz & Semenza, 2013; Morin & Comrie, 2013; Chen et al., 2013). A national study of WNV cases found that warmer temperatures and heavy precipitation (more than two inches rain in one day) increased the rate of WNV infection in the U.S. (Soverow et
FIGURE 5.26. AVERAGE YEARLY INCIDENCE OF WEST NILE VIRUS DISEASE, 1999-2012. IMAGE SOURCE: CDC, 2013.
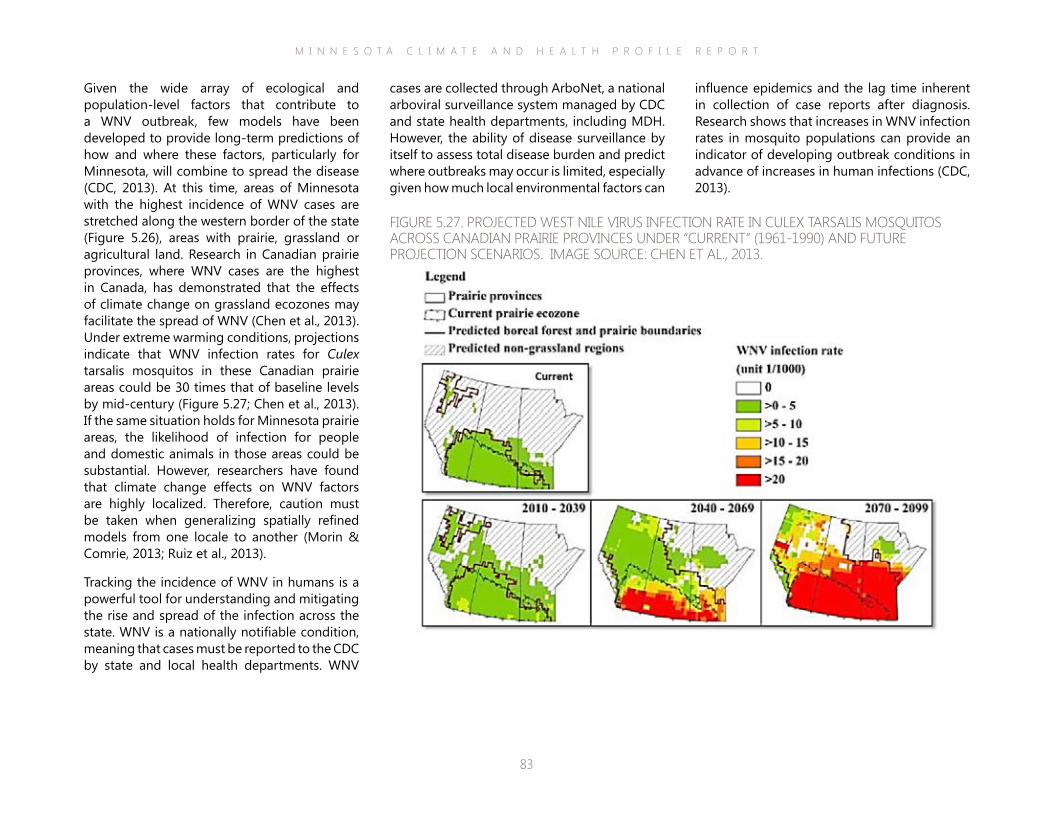
M I N N E S O T A C L I M A T E A N D H E A L T H P R O F I L E R E P O R T
83
influence epidemics and the lag time inherent in collection of case reports after diagnosis. Research shows that increases in WNV infection rates in mosquito populations can provide an indicator of developing outbreak conditions in advance of increases in human infections (CDC, 2013).
cases are collected through ArboNet, a national arboviral surveillance system managed by CDC and state health departments, including MDH. However, the ability of disease surveillance by itself to assess total disease burden and predict where outbreaks may occur is limited, especially given how much local environmental factors can
Given the wide array of ecological and population-level factors that contribute to a WNV outbreak, few models have been developed to provide long-term predictions of how and where these factors, particularly for Minnesota, will combine to spread the disease (CDC, 2013). At this time, areas of Minnesota with the highest incidence of WNV cases are stretched along the western border of the state (Figure 5.26), areas with prairie, grassland or agricultural land. Research in Canadian prairie provinces, where WNV cases are the highest in Canada, has demonstrated that the effects of climate change on grassland ecozones may facilitate the spread of WNV (Chen et al., 2013). Under extreme warming conditions, projections indicate that WNV infection rates for Culex tarsalis mosquitos in these Canadian prairie areas could be 30 times that of baseline levels by mid-century (Figure 5.27; Chen et al., 2013). If the same situation holds for Minnesota prairie areas, the likelihood of infection for people and domestic animals in those areas could be substantial. However, researchers have found that climate change effects on WNV factors are highly localized. Therefore, caution must be taken when generalizing spatially refined models from one locale to another (Morin & Comrie, 2013; Ruiz et al., 2013).
Tracking the incidence of WNV in humans is a powerful tool for understanding and mitigating the rise and spread of the infection across the state. WNV is a nationally notifiable condition, meaning that cases must be reported to the CDC by state and local health departments. WNV
FIGURE 5.27. PROJECTED WEST NILE VIRUS INFECTION RATE IN CULEX TARSALIS MOSQUITOS ACROSS CANADIAN PRAIRIE PROVINCES UNDER “CURRENT” (1961-1990) AND FUTURE PROJECTION SCENARIOS. IMAGE SOURCE: CHEN ET AL., 2013.
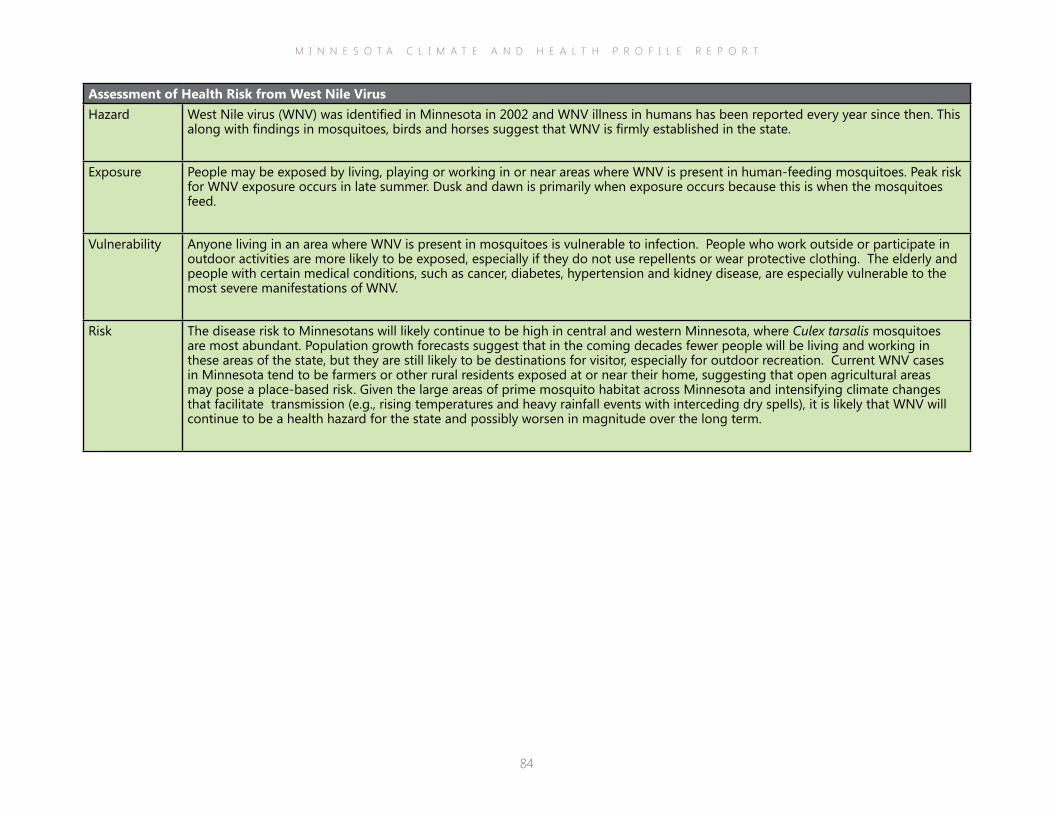
M I N N E S O T A C L I M A T E A N D H E A L T H P R O F I L E R E P O R T
84
Assessment of Health Risk from West Nile VirusHazard West Nile virus (WNV) was identified in Minnesota in 2002 and WNV illness in humans has been reported every year since then. This
along with findings in mosquitoes, birds and horses suggest that WNV is firmly established in the state.
Exposure People may be exposed by living, playing or working in or near areas where WNV is present in human-feeding mosquitoes. Peak risk for WNV exposure occurs in late summer. Dusk and dawn is primarily when exposure occurs because this is when the mosquitoes feed.
Vulnerability Anyone living in an area where WNV is present in mosquitoes is vulnerable to infection. People who work outside or participate in outdoor activities are more likely to be exposed, especially if they do not use repellents or wear protective clothing. The elderly and people with certain medical conditions, such as cancer, diabetes, hypertension and kidney disease, are especially vulnerable to the most severe manifestations of WNV.
Risk The disease risk to Minnesotans will likely continue to be high in central and western Minnesota, where Culex tarsalis mosquitoes are most abundant. Population growth forecasts suggest that in the coming decades fewer people will be living and working in these areas of the state, but they are still likely to be destinations for visitor, especially for outdoor recreation. Current WNV cases in Minnesota tend to be farmers or other rural residents exposed at or near their home, suggesting that open agricultural areas may pose a place-based risk. Given the large areas of prime mosquito habitat across Minnesota and intensifying climate changes that facilitate transmission (e.g., rising temperatures and heavy rainfall events with interceding dry spells), it is likely that WNV will continue to be a health hazard for the state and possibly worsen in magnitude over the long term.
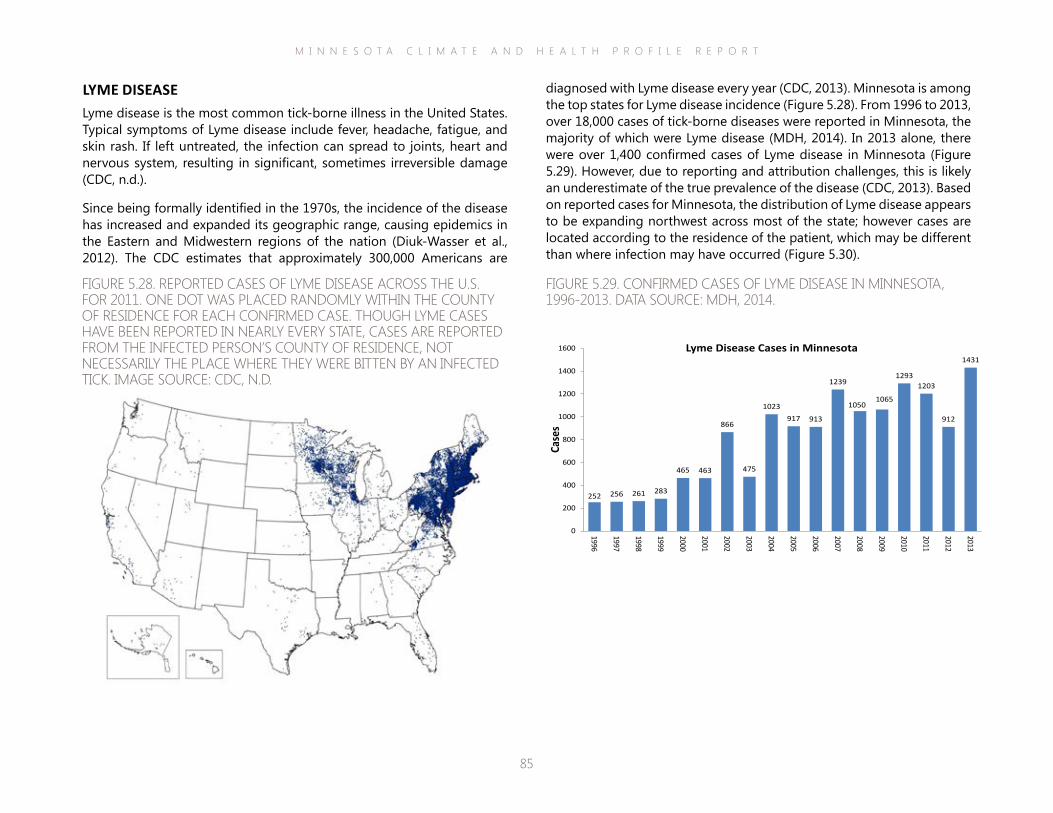
M I N N E S O T A C L I M A T E A N D H E A L T H P R O F I L E R E P O R T
85
diagnosed with Lyme disease every year (CDC, 2013). Minnesota is among the top states for Lyme disease incidence (Figure 5.28). From 1996 to 2013, over 18,000 cases of tick-borne diseases were reported in Minnesota, the majority of which were Lyme disease (MDH, 2014). In 2013 alone, there were over 1,400 confirmed cases of Lyme disease in Minnesota (Figure 5.29). However, due to reporting and attribution challenges, this is likely an underestimate of the true prevalence of the disease (CDC, 2013). Based on reported cases for Minnesota, the distribution of Lyme disease appears to be expanding northwest across most of the state; however cases are located according to the residence of the patient, which may be different than where infection may have occurred (Figure 5.30).
LYME DISEASELyme disease is the most common tick-borne illness in the United States. Typical symptoms of Lyme disease include fever, headache, fatigue, and skin rash. If left untreated, the infection can spread to joints, heart and nervous system, resulting in significant, sometimes irreversible damage (CDC, n.d.).
Since being formally identified in the 1970s, the incidence of the disease has increased and expanded its geographic range, causing epidemics in the Eastern and Midwestern regions of the nation (Diuk-Wasser et al., 2012). The CDC estimates that approximately 300,000 Americans are
FIGURE 5.28. REPORTED CASES OF LYME DISEASE ACROSS THE U.S. FOR 2011. ONE DOT WAS PLACED RANDOMLY WITHIN THE COUNTY OF RESIDENCE FOR EACH CONFIRMED CASE. THOUGH LYME CASES HAVE BEEN REPORTED IN NEARLY EVERY STATE, CASES ARE REPORTED FROM THE INFECTED PERSON’S COUNTY OF RESIDENCE, NOT NECESSARILY THE PLACE WHERE THEY WERE BITTEN BY AN INFECTED TICK. IMAGE SOURCE: CDC, N.D.
ReportedCasesofLymeDisease—UnitedStates,2013 One dot is placed randomly within the county of residence for each confirmed case. Though Lyme disease cases have beenreported in nearly every state, cases are reported based on the county of residence, not necessarily the county of infection.
National Center for Emerging and Zoonotic Infectious DiseasesDivision of Vector borne Diseases | Bacterial Diseases Branch
FIGURE 5.29. CONFIRMED CASES OF LYME DISEASE IN MINNESOTA, 1996-2013. DATA SOURCE: MDH, 2014.
252 256 261 283
465 463
866
475
1023917 913
1239
10501065
12931203
912
1431
0
200
400
600
800
1000
1200
1400
1600
1996
1997
1998
1999
2000
2001
2002
2003
2004
2005
2006
2007
2008
2009
2010
2011
2012
2013
Case
s
Lyme Disease Cases in Minnesota
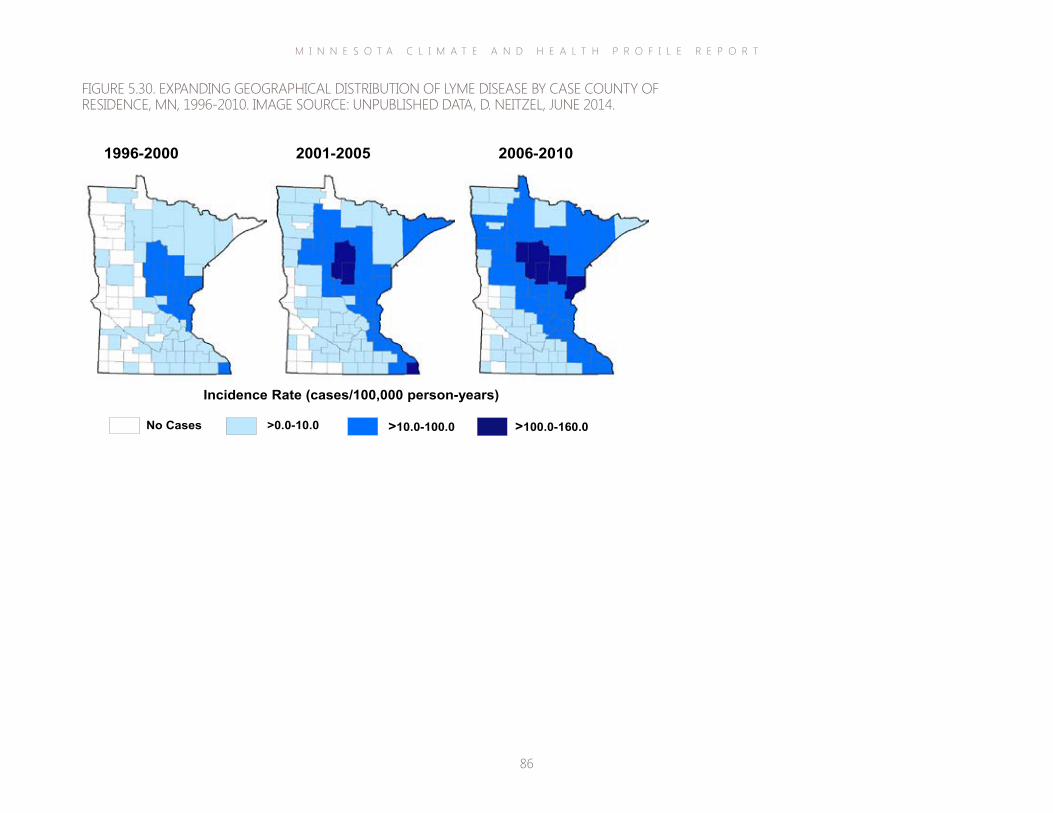
M I N N E S O T A C L I M A T E A N D H E A L T H P R O F I L E R E P O R T
86
FIGURE 5.30. EXPANDING GEOGRAPHICAL DISTRIBUTION OF LYME DISEASE BY CASE COUNTY OF RESIDENCE, MN, 1996-2010. IMAGE SOURCE: UNPUBLISHED DATA, D. NEITZEL, JUNE 2014.
Incidence Rate (cases/100,000 person-years)
No Cases >0.0-10.0 >10.0-100.0 >100.0-160.0
2006-2010 2001-2005 1996-2000
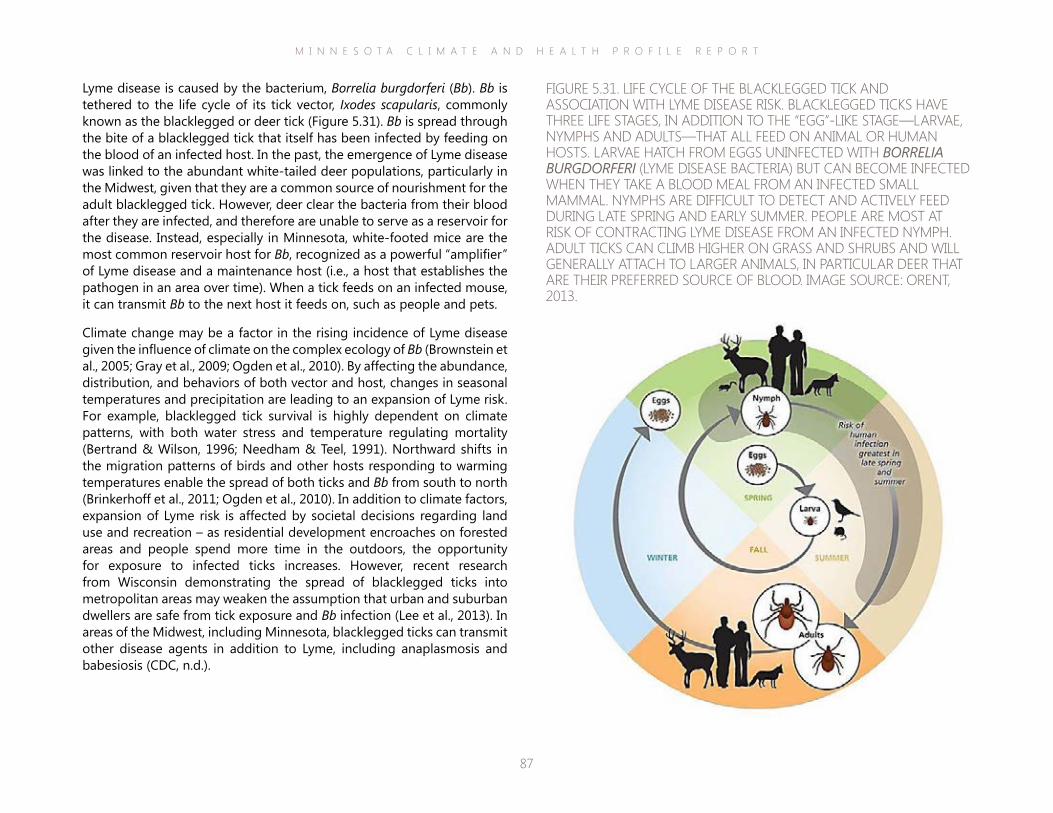
M I N N E S O T A C L I M A T E A N D H E A L T H P R O F I L E R E P O R T
87
Lyme disease is caused by the bacterium, Borrelia burgdorferi (Bb). Bb is tethered to the life cycle of its tick vector, Ixodes scapularis, commonly known as the blacklegged or deer tick (Figure 5.31). Bb is spread through the bite of a blacklegged tick that itself has been infected by feeding on the blood of an infected host. In the past, the emergence of Lyme disease was linked to the abundant white-tailed deer populations, particularly in the Midwest, given that they are a common source of nourishment for the adult blacklegged tick. However, deer clear the bacteria from their blood after they are infected, and therefore are unable to serve as a reservoir for the disease. Instead, especially in Minnesota, white-footed mice are the most common reservoir host for Bb, recognized as a powerful “amplifier” of Lyme disease and a maintenance host (i.e., a host that establishes the pathogen in an area over time). When a tick feeds on an infected mouse, it can transmit Bb to the next host it feeds on, such as people and pets.
Climate change may be a factor in the rising incidence of Lyme disease given the influence of climate on the complex ecology of Bb (Brownstein et al., 2005; Gray et al., 2009; Ogden et al., 2010). By affecting the abundance, distribution, and behaviors of both vector and host, changes in seasonal temperatures and precipitation are leading to an expansion of Lyme risk. For example, blacklegged tick survival is highly dependent on climate patterns, with both water stress and temperature regulating mortality (Bertrand & Wilson, 1996; Needham & Teel, 1991). Northward shifts in the migration patterns of birds and other hosts responding to warming temperatures enable the spread of both ticks and Bb from south to north (Brinkerhoff et al., 2011; Ogden et al., 2010). In addition to climate factors, expansion of Lyme risk is affected by societal decisions regarding land use and recreation – as residential development encroaches on forested areas and people spend more time in the outdoors, the opportunity for exposure to infected ticks increases. However, recent research from Wisconsin demonstrating the spread of blacklegged ticks into metropolitan areas may weaken the assumption that urban and suburban dwellers are safe from tick exposure and Bb infection (Lee et al., 2013). In areas of the Midwest, including Minnesota, blacklegged ticks can transmit other disease agents in addition to Lyme, including anaplasmosis and babesiosis (CDC, n.d.).
FIGURE 5.31. LIFE CYCLE OF THE BLACKLEGGED TICK AND ASSOCIATION WITH LYME DISEASE RISK. BLACKLEGGED TICKS HAVE THREE LIFE STAGES, IN ADDITION TO THE “EGG”-LIKE STAGE—LARVAE, NYMPHS AND ADULTS—THAT ALL FEED ON ANIMAL OR HUMAN HOSTS. LARVAE HATCH FROM EGGS UNINFECTED WITH BORRELIA BURGDORFERI (LYME DISEASE BACTERIA) BUT CAN BECOME INFECTED WHEN THEY TAKE A BLOOD MEAL FROM AN INFECTED SMALL MAMMAL. NYMPHS ARE DIFFICULT TO DETECT AND ACTIVELY FEED DURING LATE SPRING AND EARLY SUMMER. PEOPLE ARE MOST AT RISK OF CONTRACTING LYME DISEASE FROM AN INFECTED NYMPH. ADULT TICKS CAN CLIMB HIGHER ON GRASS AND SHRUBS AND WILL GENERALLY ATTACH TO LARGER ANIMALS, IN PARTICULAR DEER THAT ARE THEIR PREFERRED SOURCE OF BLOOD. IMAGE SOURCE: ORENT, 2013.
M I N N E S O T A C L I M A T E A N D H E A L T H P R O F I L E R E P O R T
88
Reducing the burden of Lyme disease and other tick-borne diseases in Minnesota requires two main strategies, early identification and treatment of currently infected individuals and prevention of Bb transmission, with the latter being the ultimate goal. Critical to any prevention strategy is an understanding of the tick, hosts, pathogen and the dynamic interplay among them. Accurate information on patterns of human Lyme risk is essential for making personal protection decisions, allocating public health resources, and assisting clinicians with diagnoses and use of prophylaxis or vaccines (Diuk-Wasser et al., 2012). However, it is difficult to get reliable data due to underreporting, misdiagnoses, and case definitions, and the variable interval between exposure and appearance of symptoms, which can confound determination of exposure location (Diuk-Wasser et al., 2012; Lee et al., 2013). Some regions also face issues with changes in surveillance methods. However, Minnesota has had relatively consistent surveillance since the mid-1990s.
Lyme disease is a nationally notifiable condition in the U.S. Cases are collected and verified by state and local health departments and then shared with the CDC through an infectious disease reporting system. Generally, surveillance data are captured at a coarse level, and not by county of exposure, but county of residence. Often, Lyme disease data are not available at local scales, nor linked to the point of disease transmission, two factors that are crucial for epidemiological studies and development of effective prevention strategies. In Minnesota, MDH is able to determine data at local scales and link cases to the point of disease transmission. MDH adds to surveillance efforts in Minnesota by following up with patients directly in order to collect information on potential locations of exposure and other relevant data. In addition, monitoring and data collection efforts are centralized within the MDH, which lends efficiency and consistency to surveillance methods.
M I N N E S O T A C L I M A T E A N D H E A L T H P R O F I L E R E P O R T
89
Assessment of Health Risk from Lyme DiseaseHazard Lyme disease has been identified throughout Minnesota. Recent case counts suggest that the disease is expanding beyond its
endemic range.
Exposure Because Lyme disease is a nationally reportable condition, exposure to Borrelia burgdorferi that results in a diagnosis of Lyme disease is captured. However, Lyme disease cases diagnosed on the basis of the “bulls-eye” rash alone without laboratory tests are often not reported to MDH. Because the body’s reaction to Borrelia burgdorferi can be mistaken for other ailments, it is possible that many cases are escaping detection altogether. Therefore, at this time we do not have an exact measure of the extent to which Minnesotans are being exposed to the pathogen through tick bites.
Vulnerability Any person living, playing or working in or near areas that are endemic for Lyme disease is vulnerable. However, people who regularly work outside (e.g., in landscaping, farming, or forestry) or actively participate in outdoor activities (e.g., gardening, hiking, camping, hunting, or bird-watching) are vulnerable, especially if they do not use bug spray or wear protective clothing. Pets also are vulnerable to contracting Lyme disease.
Risk Infectious disease reporting provides a means of estimating the annual number of Lyme disease cases in Minnesota, although there are probably many cases that are not counted due to misdiagnosis by a clinician or the individual never seeks medical care. The disease risk to Minnesotans will likely continue to be higher in areas where habitat exists to support a thriving tick population and people are regularly coming into contact with ticks, such as those working outside or participating in outdoor activities, especially through the spring, summer and fall seasons. Given that Lyme disease is endemic in most areas of the state and climate changes will facilitate transmission (e.g., rising temperatures and heavy rainfall events with interceding dry spells), it is likely that Lyme disease will continue to be a significant health hazard for the state, both in the near and long term.
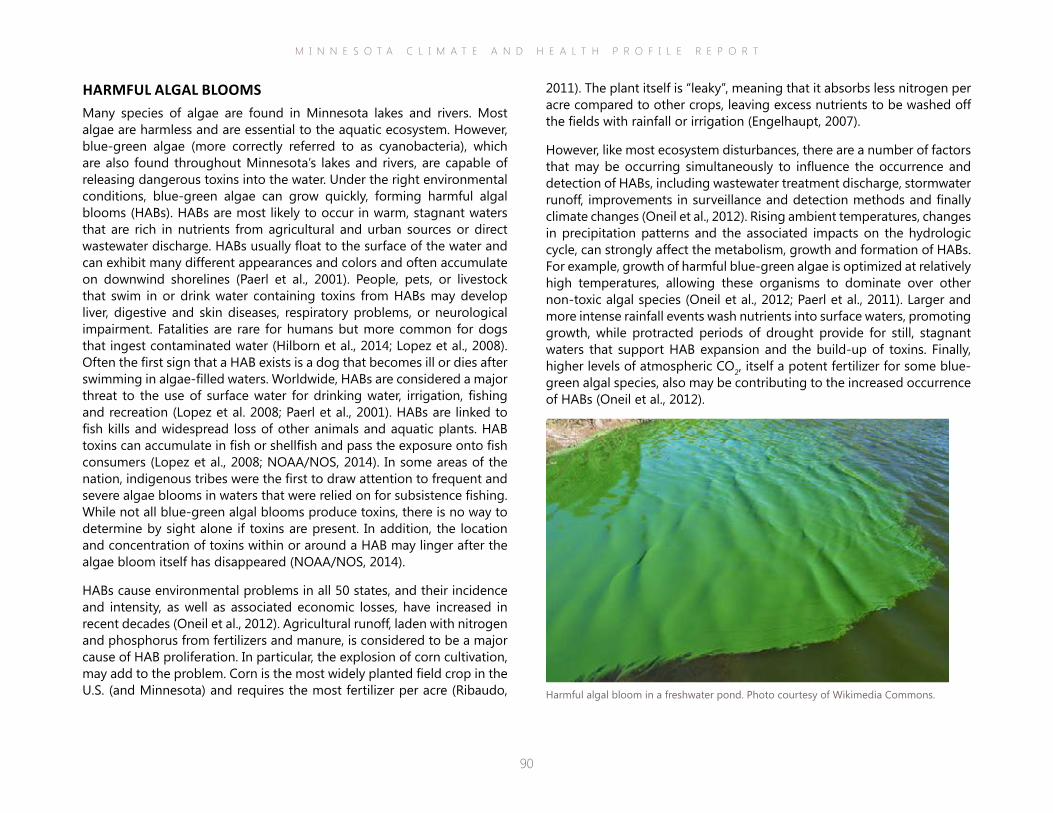
M I N N E S O T A C L I M A T E A N D H E A L T H P R O F I L E R E P O R T
90
2011). The plant itself is “leaky”, meaning that it absorbs less nitrogen per acre compared to other crops, leaving excess nutrients to be washed off the fields with rainfall or irrigation (Engelhaupt, 2007).
However, like most ecosystem disturbances, there are a number of factors that may be occurring simultaneously to influence the occurrence and detection of HABs, including wastewater treatment discharge, stormwater runoff, improvements in surveillance and detection methods and finally climate changes (Oneil et al., 2012). Rising ambient temperatures, changes in precipitation patterns and the associated impacts on the hydrologic cycle, can strongly affect the metabolism, growth and formation of HABs. For example, growth of harmful blue-green algae is optimized at relatively high temperatures, allowing these organisms to dominate over other non-toxic algal species (Oneil et al., 2012; Paerl et al., 2011). Larger and more intense rainfall events wash nutrients into surface waters, promoting growth, while protracted periods of drought provide for still, stagnant waters that support HAB expansion and the build-up of toxins. Finally, higher levels of atmospheric CO2, itself a potent fertilizer for some blue-green algal species, also may be contributing to the increased occurrence of HABs (Oneil et al., 2012).
HARMFUL ALGAL BLOOMSMany species of algae are found in Minnesota lakes and rivers. Most algae are harmless and are essential to the aquatic ecosystem. However, blue-green algae (more correctly referred to as cyanobacteria), which are also found throughout Minnesota’s lakes and rivers, are capable of releasing dangerous toxins into the water. Under the right environmental conditions, blue-green algae can grow quickly, forming harmful algal blooms (HABs). HABs are most likely to occur in warm, stagnant waters that are rich in nutrients from agricultural and urban sources or direct wastewater discharge. HABs usually float to the surface of the water and can exhibit many different appearances and colors and often accumulate on downwind shorelines (Paerl et al., 2001). People, pets, or livestock that swim in or drink water containing toxins from HABs may develop liver, digestive and skin diseases, respiratory problems, or neurological impairment. Fatalities are rare for humans but more common for dogs that ingest contaminated water (Hilborn et al., 2014; Lopez et al., 2008). Often the first sign that a HAB exists is a dog that becomes ill or dies after swimming in algae-filled waters. Worldwide, HABs are considered a major threat to the use of surface water for drinking water, irrigation, fishing and recreation (Lopez et al. 2008; Paerl et al., 2001). HABs are linked to fish kills and widespread loss of other animals and aquatic plants. HAB toxins can accumulate in fish or shellfish and pass the exposure onto fish consumers (Lopez et al., 2008; NOAA/NOS, 2014). In some areas of the nation, indigenous tribes were the first to draw attention to frequent and severe algae blooms in waters that were relied on for subsistence fishing. While not all blue-green algal blooms produce toxins, there is no way to determine by sight alone if toxins are present. In addition, the location and concentration of toxins within or around a HAB may linger after the algae bloom itself has disappeared (NOAA/NOS, 2014).
HABs cause environmental problems in all 50 states, and their incidence and intensity, as well as associated economic losses, have increased in recent decades (Oneil et al., 2012). Agricultural runoff, laden with nitrogen and phosphorus from fertilizers and manure, is considered to be a major cause of HAB proliferation. In particular, the explosion of corn cultivation, may add to the problem. Corn is the most widely planted field crop in the U.S. (and Minnesota) and requires the most fertilizer per acre (Ribaudo, Harmful algal bloom in a freshwater pond. Photo courtesy of Wikimedia Commons.
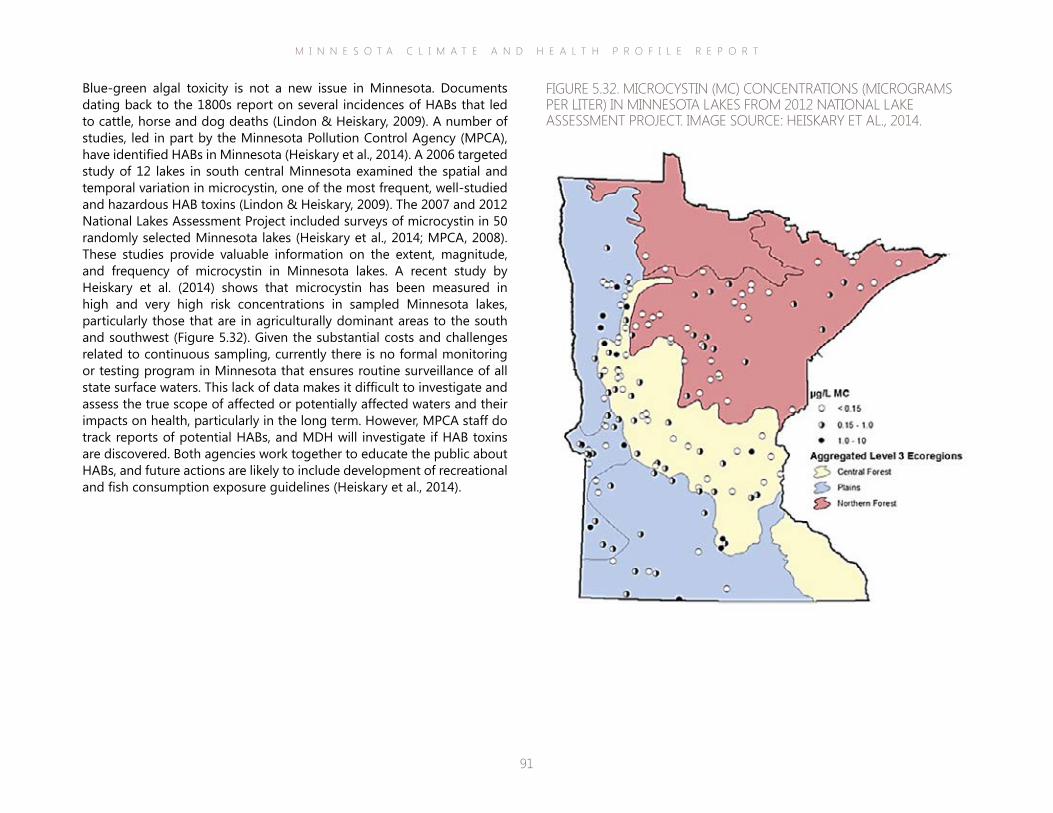
M I N N E S O T A C L I M A T E A N D H E A L T H P R O F I L E R E P O R T
91
Blue-green algal toxicity is not a new issue in Minnesota. Documents dating back to the 1800s report on several incidences of HABs that led to cattle, horse and dog deaths (Lindon & Heiskary, 2009). A number of studies, led in part by the Minnesota Pollution Control Agency (MPCA), have identified HABs in Minnesota (Heiskary et al., 2014). A 2006 targeted study of 12 lakes in south central Minnesota examined the spatial and temporal variation in microcystin, one of the most frequent, well-studied and hazardous HAB toxins (Lindon & Heiskary, 2009). The 2007 and 2012 National Lakes Assessment Project included surveys of microcystin in 50 randomly selected Minnesota lakes (Heiskary et al., 2014; MPCA, 2008). These studies provide valuable information on the extent, magnitude, and frequency of microcystin in Minnesota lakes. A recent study by Heiskary et al. (2014) shows that microcystin has been measured in high and very high risk concentrations in sampled Minnesota lakes, particularly those that are in agriculturally dominant areas to the south and southwest (Figure 5.32). Given the substantial costs and challenges related to continuous sampling, currently there is no formal monitoring or testing program in Minnesota that ensures routine surveillance of all state surface waters. This lack of data makes it difficult to investigate and assess the true scope of affected or potentially affected waters and their impacts on health, particularly in the long term. However, MPCA staff do track reports of potential HABs, and MDH will investigate if HAB toxins are discovered. Both agencies work together to educate the public about HABs, and future actions are likely to include development of recreational and fish consumption exposure guidelines (Heiskary et al., 2014).
FIGURE 5.32. MICROCYSTIN (MC) CONCENTRATIONS (MICROGRAMS PER LITER) IN MINNESOTA LAKES FROM 2012 NATIONAL LAKE ASSESSMENT PROJECT. IMAGE SOURCE: HEISKARY ET AL., 2014.

M I N N E S O T A C L I M A T E A N D H E A L T H P R O F I L E R E P O R T
92
Assessment of Health Risk from Harmful Algal BloomsHazard Harmful algal blooms (HABs) have been identified in Minnesota. However, with no established ongoing HABs monitoring program
in the state it is difficult to estimate trends in microcystin production, nor the extent to which HABs are a current or future health hazard.
Exposure People may be exposed by swimming in, drinking, or breathing in HAB toxins. However, characteristics of exposure are difficult to determine given the current lack of sampling data. At this time, it is not possible to identify the frequency, duration, magnitude or severity of HAB-toxin exposure to Minnesota residents or visitors. Yet, given the large number of potentially impacted ponds, lakes, and rivers, coupled with resident and visitor fondness for water recreation in the state, suggests that exposure could be frequent and impact a large number of people and pets. In addition, the body’s reaction to HAB toxins can be mistaken for numerous other infections or ailments. Thus, cases of HAB poisonings may not always be accurately identified because the person doesn’t seek treatment, or they are misdiagnosed.
Vulnerability Environment: Fertilizer and manure runoff from cropland enriches surface waters with excess nutrients and is a leading cause of HABs in the rural portions of Minnesota. In urban areas, stormwater and wastewater discharge are prominent sources of excess nutrients to lake and rivers.
Humans: Any person swimming in, drinking, or breathing in HAB toxins is vulnerable. However children, the elderly, individuals with pre-existing health problems, and frequent fish consumers (e.g., members of indigenous or other ethnic groups) may be especially vulnerable to adverse health impacts. People who rely on private wells also may be vulnerable if the well draws directly from surface water or groundwater that is recharged by contaminated surface water. Communities that rely on lake and river tourism traffic or commercial fishing employment may be vulnerable to impacts from HABs. Some communities may face increased water treatment costs to remediate HAB toxins in drinking water sources.
Risk Given the lack of data on the occurrence and location of HABs coupled with the lack of a case reporting system on HAB poisonings, it is difficult at this time to estimate the current and future risk to population health from HABs in Minnesota. Yet, given the number of nutrient-affected waters in the state coupled with intensifying climate changes (i.e., rising temperatures and heavy rainfall events with interceding dry spells) it is possible that HAB poisonings could be a significant health hazard for the state, both in the near and long term.
M I N N E S O T A C L I M A T E A N D H E A L T H P R O F I L E R E P O R T
93
▪ Communicating direct and indirect effects of climate change. Climate change impacts health both directly and indirectly. Disseminating information about and planning for indirect and “upstream” effects are as important as describing and preparing for the direct impacts. Public health practice is rooted in a view of health as a “downstream” outcome of numerous “upstream” influences. From this perspective, factors that diminish a person’s access to secure employment, quality education, or a reliable support network are viewed as key health determinants. Underscoring these connections with agency colleagues, decision-makers, and the public will be instrumental toward garnering attention and action toward bolstering these indirect health determinants, and mitigating poor health outcomes well before they arise in a population.
▪ Outreach to vulnerable populations. Some Minnesotans will be more vulnerable to a particular climate hazard compared to the general population due to age, gender, education level, income, occupation, recreational interests, or current health status. Vulnerability is situational; a person who is vulnerable to one hazard may not necessarily be vulnerable to another. Also, climate vulnerability may be temporary along with the characteristic, e.g., pregnancy or homelessness. A wide view should be taken as to what groups are vulnerable to a climate hazard and when they are vulnerable. For instance, the elderly are often identified as vulnerable to extreme heat, but less often acknowledged are farmers who are also vulnerable, albeit indirectly due to crop or livestock loss, threat to livelihood and financial strains on access to basic necessities and essential services. In addition, while direct outreach to vulnerable populations is essential, tapping into networks that support these populations can be equally effective. For example, some jurisdictions work with local “Meals on Wheels” programs to provide some additional oversight of potentially isolated elderly during extreme heat events.
VI Conclusion
Minnesota has gotten warmer, and precipitation patterns have become more unpredictable. According to climate projections for the state, these trends are likely to continue with wide-ranging repercussions for the health and well-being of the population. Minnesota’s Climate & Health Profile Report provides a comprehensive assessment of the major health impacts that Minnesotans will face from climate change hazards, including extreme heat and flood events, rise in air pollution, spread of vector-borne diseases, and drought impacts on the agriculture sector.
The next steps for an effective response to these hazards are reflected in the CDC BRACE process and MDH’s Minnesota Climate & Health Program goals and activities, and include the following:
▪ Addressing data and research gaps. Characterizing the broad spectrum of health threats from climate change requires an equally broad spectrum of quantitative and qualitative information. Public health professionals will have to expand their view of the types of data and information that are required for characterizing the true burden of disease or distress associated with climate hazards, as well as obtaining access to these data. For example, limited data exist to help characterize all impacts from flooding on Minnesotans, including financial, physical, and emotional influences on health and well-being. A complete assessment of this kind will require identifying and accessing datasets that may not be commonly used for public health investigations, or creating opportunities for gathering necessary information, e.g., interviews with affected individuals or town hall style forums.
M I N N E S O T A C L I M A T E A N D H E A L T H P R O F I L E R E P O R T
94
▪ Expand cross-sector collaboration. Characterizing climate change impacts on the health of Minnesotans will require teaming up with sectors and disciplines that may be relatively new to public health. In addition, adaptation efforts will need to happen on larger and faster scales compared to the past, which will necessitate that public health professionals ally with other state agency personnel, business leaders, policy-makers, vulnerable populations and the general public to obtain and analyze information and apply this knowledge toward fostering climate resiliency in the state. These cross-sector collaborations will have extensive co-benefits, strengthening public health alongside Minnesota’s infrastructure and economy.
▪ Identifying effective interventions. Expanding access to data, widening our view of key health determinants and developing cross-sector partnerships will help to identify interventions or strategies for optimizing health and well-being in Minnesota’s changing climate. Given that states and municipalities across the nation are undergoing similar efforts, numerous strategies will likely be identified and implemented to mitigate the effects of climate hazards. Minnesota public health professionals can learn from these experiences while drawing on resources and partnerships here in the state to select the most effective interventions for sustaining health. These interventions should be implemented with an evaluation plan in place so their efficacy can be measured and outcomes shared with the public and colleagues.
M I N N E S O T A C L I M A T E A N D H E A L T H P R O F I L E R E P O R T
95
Aging Ment Health, 17(8):992-1002. Berry, H.L., Bowen, K., and Kjellstrom, T. (2010). Climate change and mental health: a causal pathways framework. International Journal of Public Health, 55: 123-132.Bertrand, M.R., Wilson, M.L. (1996). Microclimate-dependent survival of unfed adult Ixodes scapularis (Acari:Ixodidae) in nature: life cycle and study design implications. Journal of Medical Entomology, 33(4):619–27.Blackwell, D.L., Lucas, J.W., Clarke, T.C. (2014). Summary health statistics for U.S. adults: National Health Interview Survey, 2012. National Center for Health Statistics. Vital Health Stat 10(260).Bousquet, J., Van Cauwenberge, P., Khaltaev, N.; Aria Workshop Group; World Health Organization. (2001). Allergic rhinitis and its impact on asthma. J Allergy Clin Immunol, 108(5 Suppl):S147-334.Brandt, M., Brown, C., Burkhart, J., Burton, N., Cox-Ganser, J., Damon, S., Falk, H., Fridkin, S., Garbe, P., McGeehin, M., Morgan, J., Page, E., Rao, C., Redd, S., Sinks, T., Trout, D., Wallingford, K., Warnock, D., Weissman, D. (2006). Mold prevention strategies and possible health effects in the aftermath of hurricanes and major floods. MMWR Recomm Rep, 55(RR-8):1-27.Brinkerhoff, R.J., Folsom-O’Keefe, C.M., Streby, H.M., Bent, S.J., Tsao, K., Diuk-Wasser, M.A. (2001). Regional variation in immature Ixodes scapularis parasitism on North American songbirds: implications for transmission of the Lyme pathogen, Borrelia burgdorferi. J Med Entomol, 48(2):422-8.Brogdon, W.G., McAllister, J.C. (1998). Insecticide resistance and vector control (wwwnc.cdc.gov/eid/article/4/4/pdfs/98-0410.pdf).Brook, R.D., Franklin, B., Cascio, W., Hong, Y., Howard, G., Lipsett, M., Luepker, R., Mittleman, M., Samet, J., Smith, S.C. Jr., Tager, I.; Expert Panel on Population and Prevention Science of the American Heart Association. (2004). Air pollution and cardiovascular disease: a statement for healthcare professionals from the Expert Panel on Population and Prevention Science of the American Heart Association. Circulation, 109(21):2655-71.Brownstein, J.S., Holford, T.R., Fish, D. (2005). Effect of Climate Change on Lyme Disease Risk in North America. Ecohealth, 2(1):38-46.Bushman, B.J., Wang, M.C., Anderson, C.A. (2005). Is the curve relating temperature to aggression linear or curvilinear? Assaults and temperature in Minneapolis reexamined. J Pers Soc Psychol, 89(1):62-6.Cann, K.F., Thomas, D.R., Salmon, R.L., Wyn-Jones, A.P., Kay, D. (2013). Extreme water-related weather events and waterborne disease. Epidemiol Infect, 141(4):671-86.CDC. (2011). Allergies (www.cdc.gov/healthcommunication/ToolsTemplates/EntertainmentEd/Tips/Allergies.html).CDC. (2012). Notes from the field: carbon monoxide exposures reported to poison centers and related to hurricane Sandy - Northeastern United States, 2012. MMWR Morb Mortal Wkly Rep, 61(44):905.CDC. (2013a). Climate Change and Extreme Heat Events (www.cdc.gov/climateandhealth/pubs/ClimateChangeandExtremeHeatEvents.pdf).CDC. (2013b). Heat-related deaths after an extreme heat event--four states, 2012, and United States, 1999-2009. MMWR Morb Mortal Wkly Rep. Jun 7;62(22):433-6.
VII ReferencesACS. (2013, October 17). World Health Organization: outdoor air pollution causes cancer. (www.cancer.org/cancer/news/world-health-organization-outdoor-air-pollution-causes-cancer).Adeola, F. (2009). Mental health and psychological distress sequelae of Katrina. Human Ecology Review, 16:195–210.Akabas, S., Collins, B., Gold, A. (2014, January 23). The National Flood Insurance Program still requires reform. Bipartisan Policy Center. (bipartisanpolicy.org/blog/economicpolicy/2014/01/23/national-flood-insurance-program-still-requires-reform).ALA. (2013). The scope of COPD in Minnesota (www.health.state.mn.us/divs/hpcd/tracking/pubs/copdreport2013.pdf).Alderman, K., Turner, L. R., & Tong, S. (2012). Floods and human health: a systematic review. Environment international, 47, 37-47.American Cancer Society (ACS). (2014). Cancer Facts & Figures 2014. Atlanta: American Cancer Society.American Lung Association (ALA). (2014). State of the Air 2014 (www.stateoftheair.org/2014/assets/ALA-SOTA-2014-Full.pdf).Andersen, Z.J., Hvidberg, M., Jensen, S.S., Ketzel, M., Loft, S., Sørensen, M., Tjønneland, A., Overvad, K., Raaschou-Nielsen, O. (2011). Chronic obstructive pulmonary disease and long-term exposure to traffic-related air pollution: a cohort study. Am J Respir Crit Care Med, 183(4):455-61.Anderson, A.H., Cohen, A.J., Kutner, N.G., Kopp, J.B., Kimmel, P.L., Muntner, P. (2009). Missed dialysis sessions and hospitalization in hemodialysis patients after Hurricane Katrina. Kidney International, 75(11):1202-8. Anderson, G.B., Bell, M.L., Peng, R.D. (2013). Methods to calculate the heat index as an exposure metric in environmental health research. Environmental Health Perspectives, 121:1111-1119.Arbes, S.J. Jr., Gergen, P.J., Elliott, L., Zeldin, D.C. (2005). Prevalences of positive skin test responses to 10 common allergens in the US population: results from the third National Health and Nutrition Examination Survey. J Allergy Clin Immunol. 116(2):377-83.Aust, A.E., Ball, J.C., Hu, A.A., Lighty, J.S., Smith, K.R., Straccia, A.M., Veranth, J.M., Young, W.C. (2002). Particle characteristics responsible for effects on human lung epithelial cells. Res Rep Health Eff Inst. 110:1-76.Axelrod, C., Killam, P.P., Gaston, M.H., Stinson, N. (1994). Primary health care and the midwest flood disaster. Public Health Rep 109(5):601–605.Barnett, S.B., Nurmagambetov, T.A. (2011). Costs of Asthma in the Unites States: 2002-2007. Journal of Allergy and Clinical Immunology, 127:145-52.Barredo, J.I. (2009). Normalised flood losses in Europe: 1970-2006. Nat Hazards Earth Syst Sci. 9:97-104.Beck, I., Jochner, S., Gilles, S., McIntyre, M., Buters, J.T., Schmidt-Weber, C., Behrendt, H., Ring, J., Menzel, A., Traidl-Hoffmann, C. (2013). High environmental ozone levels lead to enhanced allergenicity of birch pollen. PLoS One, 8(11):e80147.Bei, B., Bryant, C., Gilson, K.M., Koh, J., Gibson, P., Komiti, A., Jackson, H., Judd, F. (2013). A prospective study of the impact of floods on the mental and physical health of older adults.
M I N N E S O T A C L I M A T E A N D H E A L T H P R O F I L E R E P O R T
96
Donnelly, K., Christian-Smith, J., (2013). An Overview of the “New Normal” and Water Rate Basics. Oakland: Pacific Institute. Doocy, S., Daniels, A., Murray, S., Kirsch, T.D. (2013). The Human Impact of Floods: a Historical Review of Events 1980-2009 and Systematic Literature Review. PLOS Currents Disasters, Apr 16. Edition 1.Drayna, P., McLellan, S.L., Simpson, P., Li, S-H., Gorelick, M.H. (2010). Association between rainfall and pediatric emergency department visits for acute gastrointestinal illness. Environ Health Perspect, 118:1439-1443.Du, W., Fitzgerald, G., Clark, M., Hou, X. (2010). Health impacts of floods. Prehosp Disaster Med, 25:265–72.Dubrovsky, N.M., Burow, K.R., Clark, G.M., Gronberg, J.A., Hamilton, P.A., Hitt, K.J., et al. (2010). Nutrients in the nation’s streams and groundwater. USGS, VA.Ebi, K.L., McGregor, G. (2008). Climate change, tropospheric ozone and particulate matter, and health impacts. Environ Health Perspect, 116:1449-1455.Ellis, K.H. (2007, September). Cryptosporidium in Milwaukee’s water supply caused widespread illness. Infectious Disease News (www.healio.com/infectious-disease/gastrointestinal-infections/news/print/infectious-disease-news/%7Bc89c35b9-b521-43e5-960c-1d3809f77482%7D/cryptosporidium-in-milwaukees-water-supply-caused-widespread-illness).Engelhaupt, E. (2007). Biofueling water problems. Environmental Science & Technology, 41(22):7593-5.Environmental Protection Agency (EPA). (2014a). Particulate matter: health (www.epa.gov/pm/health.html).EPA. (2008). Review of the impacts of climate variability and change on aeroallergens and their associated effects. Report no: EPA/600/R-06/164F. Washington, D.C.: EPA.EPA. (2012). Report to Congress on Black Carbon. EPA-450/R-12-00. Washington, D.C.: EPA.EPA. (2013a). Ground level ozone (www.epa.gov/airquality/ozonepollution/).EPA. (2013b). Ecosystems: Climate Impacts on Ecosystems (www.epa.gov/climatechange/impacts-adaptation/ecosystems.html).EPA. (2014b). Climate change indicators in the United States - ragweed pollen season. (www.epa.gov/climatechange/science/indicators/health-society/ragweed.html).Fang, S.C., Mehta, A.J., Alexeeff, S.E., Gryparis, A., Coull, B., Vokonas, P., Christiani, D.C., Schwartz, J. (2012). Residential black carbon exposure and circulating markers of systemic inflammation in elderly males: the normative aging study. Environ Health Perspect, 120(5):674-80.Fang, Y., Mauzerall, D.L., Liu, J., Fiore, A.M., Horowitz, L.W. (2013). Impacts of 21st century climate change on global air pollution-related premature mortality. Climatic Change, 121:239-253.Faustini, A., Stafoggia, M., Cappai, G., Forastiere, F. (2012). Short-term effects of air pollution in a cohort of patients with chronic obstructive pulmonary disease. Epidemiology, 23(6):861-79.Federal Emergency Management Agency, National Flood Insurance Program (FEMA/NFIP). (2014). National Flood Insurance Program. (bsa.nfipstat.fema.gov/index.html).Flanagan, S.V., Marvinney, R.G., Zheng, Y. (2014). Influences on domestic well water testing behavior in a Central Maine area with frequent groundwater arsenic occurrence. Sci Total Environ. doi: 10.1016/j.scitotenv.2014.05.017. [Epub ahead of print]Fletcher, B.A., Lin, S., Fitzgerald, E.F., Hwang, S.A. (2012). Association of summer temperatures with hospital admissions for renal diseases in New York State: a case-crossover study. Am J Epidemiol, 175(9):907-16. Food & Water Watch (FWW). (2009, June). Questions & Answers: A cost comparison of public and private water utility operations (documents.foodandwaterwatch.org/doc/A-Cost-Comparison-of-Public-and-Private-Water.pdf).
CDC. (2013c). CDC provides estimate of Americans diagnosed with Lyme disease each year (www.cdc.gov/media/releases/2013/p0819-lyme-disease.html).CDC. (2013d). West Nile virus in the United State: guidelines for surveillance, prevention, and control (www.cdc.gov/westnile/resources/pdfs/wnvguidelines.pdf).CDC. (2014b). West Nile Virus (www.cdc.gov/westnile/index.html).Center for Rural Policy & Development (CRPD). (2013). State of Rural Minnesota Report, 2013 (archive.leg.state.mn.us/docs/2013/mandated/130292.pdf).Centers for Disease Control and Prevention (CDC). (2014a). Chronic Disease Cost Calculator Version 2 (www.cdc.gov/chronicdisease/resources/calculator/).Chen, C. C., Jenkins, E., Epp, T., Waldner, C., Curry, P.S., Soos, C. (2013). Climate change and West Nile virus in a highly endemic region of North America. Int J Environ Res Public Health, 10:3052-3071.Climate Change Science Program (CCSP). (2007). Effects of Climate Change on Energy Production and Use in the United States . Department of Energy, Office of Biological & Environmental Research: Washington, DC.Climate Institute. (2011). A Climate of Suffering: the real cost of living with inaction on climate change. Melbourne & Sydney: The Climate Institute.Cooperative Institute for Research in Environmental Science (CIRES). (2013, September 18). Today’s worst watershed stresses may become the new normal, study finds (http://www.colorado.edu/news/releases/2013/09/18/today%E2%80%99s-worst-watershed-stresses-may-become-new-normal-study-finds).Corso, P.S., Kramer, M.H., Blair, K.A., Addiss, D.G., Davis, J.P., Haddix, A.C. (2003, April). Cost of illness in the 1993 Waterborne Cryptosporidium outbreak, Milwaukee, Wisconsin. Emerg Infect Dis. (wwwnc.cdc.gov/eid/article/9/4/02-0417).Crystal-Peters, J., Crown, W.H., Goetzel, R.Z., Schutt, DC. (2000). The cost of productivity losses associated with allergic rhinitis. Am J Manag Care, 6(3):373-8.Cummings, K.J., Cox-Ganser, J., Riggs, M.A., Edwards, N., Hobbs, G.R., Kreiss, K. (2008). Health effects of exposure to water-damaged New Orleans homes six months after Hurricanes Katrina and Rita. Am J Public Health, 98(5):869-75.Curriero, F.C., Patz, J.A., Rose, J.B., Lele, S. (2001). The association between extreme precipitation and waterborne disease outbreaks in the United States, 1948–1994. Am J Public Health, 91:1194 –9.Davis, R.E., Knappenberger, P.C., Michaels, P.J., Novicoff, W.M. (2003). Changing heat-related mortality in the United States. Environ Health Perspect. 111(14):1712-8.Dawson, J.P., Bloomer,B.J., Winner, D.A., Weaver, C.P. (2014). Understanding the meteorological drivers of U.S. particulate matter concentrations in a changing climate. Bull Amer Meteor Soc, 95: 521–532.Delaware River Basin Commission (DRBC). (2012). Hydrological Information (www.state.nj.us/drbc/hydrological/).Department for Environment, Food, and Rural Affairs, Environment Agency (DEFRA/UKEA). (2004). The appraisal of human related intangible impacts of flooding. London: DEFRA.Department of Commerce - Minnesota (DOC). (2012). Energy Policy and Conservation Quadrennial Report (mn.gov/commerce/energy/images/Energy-Quad-Report2012.pdf).Department of Natural Resources - Minnesota (DNR). (2014). Water use - Water Appropriations Permit Program (www.dnr.state.mn.us/waters/watermgmt_section/appropriations/wateruse.html).Diuk-Wasser, M.A., Hoen, A.G., Cislo, P., Brinkerhoff, R., Hamer, S.A., Rowland, M., Cortinas, R., Vourch, G., Melton, F., Hickling, G.J., Tsao, J.I., Bunikis, J., Barbour, A.G., Kitron, U., Piesman, J., Fish, D. (2012). Human risk of infection with Borrelia burgdorferi, the Lyme disease agent, in eastern United States. Am J Trop Med Hyg, 86(2):320-7.
M I N N E S O T A C L I M A T E A N D H E A L T H P R O F I L E R E P O R T
97
(eds.). Cambridge University Press. Cambridge, United Kingdom 996 pIqbal, S., Clower, J.H., Hernandez, S.A., Damon, S.A., Yip, F.Y. (2012). A review of disaster-related carbon monoxide poisoning: surveillance, epidemiology, and opportunities for prevention. Am J Public Health, 102(10):1957-63.Jackson, K.D., Howie, L.D., Akinbami, L.J. (2013). Trends in allergic conditions among children: United States, 1997-2011. NCHS Data Brief. No. 121. May 2013.Jackson, R. B., Carpenter, S. R., Dahm, C. N., McKnight, D. M., Naiman, R. J., Postel, S. L., Running, S. W. (2001). Water in a changing world. Ecological Applications, 11(4):1027-1045.Jacob, D.J., Winner, D.A. (2009). Effect of climate change on air quality. Atmospheric Environment, 43:51-63.Johnson, B. (2012, November 21). Minnesota’s rising homeowners insurance easily fixed. Post-Bulletin. (www.postbulletin.com/opinion/minnesota-s-rising-homeowners-insurance-easily-fixed/article_0909b17b-d280-5cdb-98bb-58d02086f823.html).Johnson, B.J., Sukhdeo, M.V. (2013). Drought-induced amplification of local and regional West Nile virus infection rates in New Jersey. J Med Entomol, 50(1):195-204.Jonkman, S., Maaskant, B., Boyd, E., Levitan, M. (2009). Loss of life caused by the flooding of New Orleans after Hurricane Katrina: analysis of the relationship between flood characteristics and mortality. Risk Anal, 29:676–98.Jonkman, S.N. (2005) Global Perspectives on Loss of Human Life Caused by Floods. Natural Hazards, 34(2):151-175.Kent, S.T., McClure, L.A., Zaitchik, B.K., Smith, T.T., Gohlke, J.M. (2014). Heat waves and health outcomes in Alabama (USA): the importance of heat wave definition. Environmental Health Perspectives, 122(2):151-158.Kilbourne, E.M. 1999. The spectrum of illness during heat waves. Am J Prev Med, 16:359–360.Klinenberg, E. (2002). Heat wave: a social autopsy of diaster in Chicago. Chicago: University of Chicago. Knowlton, K., Rotkin-Ellman, M., King, G., Margolis, H.G., Smith, D., Solomon, G., Trent, R., English, P. (2009). The 2006 California heat wave: impacts on hospitalizations and emergency department visits. Environ Health Perspect, 117(1):61-7.Kosatsky, T., Henderson, S.B., Pollock, S.L. (2012). Shifts in mortality during a hot weather event in Vancouver, British Columbia: rapid assessment with case-only analysis. Am J Public Health, 102(12):2367-71.Koton, S., Molshatzki, N., Yuval, Myers, V., Broday, D.M., Drory, Y., Steinberg, D.M., Gerber, Y. (2013). Cumulative exposure to particulate matter air pollution and long-term post-myocardial infarction outcomes. Prev Med, 57(4):339-44.Kue, R.C., Dyer, K.S. (2013). The impact of heat waves on transport volumes in an urban emergency medical services system: a retrospective review. Prehosp Disaster Med, 28(6):610-5. Kunkel, K. E., L. E. Stevens, S. E. Stevens, L. Sun, E. Janssen, D. Wuebbles, S. D. Hilberg, M. S. Timlin, L. Stoecker, N. E. Westcott, and J. G. Dobson, 2013: Regional Climate Trends and Scenarios for the U.S. National Climate Assessment: Part 3. Climate of the Midwest U.S. NOAA Technical Report NESDIS 142-3, National Oceanic and Atmospheric Administration, National Environmental Satellite, Data, and Information Service, Washington, D.C. Lavigne, E., Gasparrini, A., Wang, X., Chen, H., Yagouti, A., Fleury, M.D., Cakmak, S. (2014). Extreme ambient temperatures and cardiorespiratory emergency room visits: assessing risk by comorbid health conditions in a time series study. Environ Health, 13(1):5.Lee, B.J., Kim, B., Lee, K. (2014). Air pollution exposure and cardiovascular disease. Toxicol Res, 30(2):71-5.Lee, X., Hardy, K., Johnson, D.H., Paskewitz, S.M. (2013). Hunter-killed deer surveillance to assess changes in the prevalence and distribution of Ixodes scapularis (Acari: Ixodidae) in Wisconsin. J Med Entomol, 50(3):632-9.
Freshwater Society. (2013). Minnesota’s Groundwater: Is our use sustainable? (www.house.leg.state.mn.us/comm/docs/freshwater-report4-8-13.pdf).Ghassan, B., Neela, G.H., Cohen, A., Laden, F., Raaschou-Nielsen, O., Samet, J.M., Vineis, P., Forastiere, F., Saldiva, P., Yorifuji, T., Loomis, D. (2014). Outdoor Particulate Matter Exposure and Lung Cancer: A Systematic Review and Meta-Analysis, Environ Health Perspect; DOI:10.1289/ehp.1408092Gray, J.S., Dautel, H., Estrada-Peña, A., Kahl, O., Lindgren, E. (2009). Effects of climate change on ticks and tick-borne diseases in Europe. Interdiscip Perspect Infect Dis, 593232.Griffin, R. J. (2013). The Sources and Impacts of Tropospheric Particulate Matter. Nature Education Knowledge 4(5):1Grimm, N.B., Chapin III, F.S., Bierwagen, B., Gonzalez, P., Groffman, P.M., Luo, Y., Melton, F., Nadelhoffer, K., Pairis, A., Raymond, P.A., Schimel, S., Williamson, C.E. (2013). The impacts of climate change on ecosystem structure and function. Frontiers in Ecology and the Environment, 11: 474–482. Gronlund, C.J., Zanobetti, A., Schwartz, J.D., Wellenius, G.A., O’Neill, M.S. (2014). Heat, Heat Waves, and Hospital Admissions among the Elderly in the United States, 1992-2006. Environ Health Perspect. Jun 6. [Epub ahead of print]Hajat, S., Sheridan, S.C., Allen, M.J., Pascal, M., Laaidi, K., Yagouti, A., Bickis, U., Tobias, A., Bourque, D., Armstrong, B.G., Kosatsky, T. (2010). Heat-health warning systems: a comparison of the predictive capacity of different approaches to identifying dangerously hot days. American Journal of Public Health, 100(6):1137-1144.Hanigan, I.C., Johnston, F.H. (2007). Respiratory hospital admissions were associated with ambient airborne pollen in Darwin, Australia, 2004-2005. Clin Exp Allergy, 37(10):1556-65.Heiskary, S., Lindon, M., Anderson, J. (2014). Summary of microcystin concentrations in Minnesota lakes. Lake and Reservoir Management, 30(3):268-272Heo, J., Kim, M., Koh, S., Noh, S., Park, J., Ahn, J., et al. (2008). A prospective study on changes in health status following flood disaster. Psychiatry Investig, 5:186–92.Hilborn, E.D., Roberts, V.A., Backer, L., Deconno, E., Egan, J.S., Hyde, J.B., Nicholas, D.C., Wiegert, E.J., Billing, L.M., Diorio, M., Mohr, M.C., Hardy, J.F., Wade, T.J., Yoder, J.S., Hlavsa, M.C.; Centers for Disease Control and Prevention (CDC). (2014). Algal bloom-associated disease outbreaks among users of freshwater lakes--United States, 2009-2010. MMWR Morb Mortal Wkly Rep, 63(1):11-5.Houser, T., Koop, R., Hsiang, S., Delgado, M., Jina, A., Larsen, K., Mastrandrea, M., Mohan, S., Muir-Wood, R., Rasmussen, D.J., Rising, J., Wilson, P. (2014). American Climate Prospectus: Economic Risks in the United States. Rhodium Group: New York. Hoxie, N.J., Davis, J.P., Vergeront, J.M., Nashold, R.D., Blair, K.A. (1997). Cryptosporidiosis-associated mortality following a massive waterborne outbreak in Milwaukee, Wisconsin. Am J Public Health, 87(12):2032-5.Hsiang, S.M., Burke, M., Miguel, E. (2013). Quantifying the influence of climate on human conflict. Science, 341(6151):1235367.Hurricane Katrina Community Advisory Group (HKCAG), Kessler, R.C. (2007). Hurricane Katrina’s impact on the care of survivors with chronic medical conditions. J Gen Intern Med, 22(9):1225-30.Hystad, P., Demers, P.A., Johnson, K.C., Carpiano, R.M., Brauer, M. (2013). Long-term residential exposure to air pollution and lung cancer risk. Epidemiology, 24(5):762-72.Intergovernmental Panel on Climate Change (IPCC). (2007a). Climate Change 2007: Synthesis Report. Contribution of Working Groups I, II and III to the Fourth Assessment Report of the Intergovernmental Panel on Climate Change [Core Writing Team, Pachauri, R.K and Reisinger, A. (eds.)]. IPCC, Geneva, Switzerland.IPCC. (2007b). Climate Change 2007: The Physical Science Basis. Contribution of Working Group I to the Fourth Assessment Report of the Intergovernmental Panel on Climate Change. S. Solomon , D. Qin, M. Manning, Z. Chen, M. Marquis, K.B. Averyt, M. Tignor and H.L. Miller
M I N N E S O T A C L I M A T E A N D H E A L T H P R O F I L E R E P O R T
98
MDH. (n.d.). MN Public Health Data Access Portal (apps.health.state.mn.us/mndata/home).Meehl, G. A., Tebaldi, C. (2004). More intense, more frequent, and longer lasting heat waves in the 21st century. Science, 305(5686): 994-997.Meehl, G.A., Tebaldi, C., Walton, G., Easterling, D., McDaniel, L. (2009). Relative increase of record high maximum temperatures compared to record low minimum temperatures in the U.S. Geophysical Research Letters, 36:L23701. Mendell, M.J., Mirer, A.G., Cheung, K., Tong, M., Douwes, J. (2011). Respiratory and Allergic Health Effects of Dampness, Mold, and Dampness-Related Agents: A Review of the Epidemiologic Evidence. Environ Health Perspect, 119(6): 748–756.Metzger, K.B., Ito, K., Matte, T.D. (2010). Summer heat and mortality in New York City: how hot is too hot? Environmental Health Perspectives, 118(1):80-86.Moore, E., Matalon, E., Balazs, C., Clary, J., Firestone, L., De Anda, S., Guzman, M. (2011). The human costs of nitrate-contaminated drinking water in the San Joaquin Valley. Oakland: Pacific Institute. Moorman, J.E., Akinbami, L.J., Bailey, C.M. (2012). National surveillance of asthma: United States, 2001–2010. National Center for Health Statistics. Vital Health Stat, 3: 1–58.Morin, C.W., Comrie, A.C. (2013). Regional and seasonal response of a West Nile virus vector to climate change. PNAS, 110(39):15620-15625.MPCA. (2008). Minnesota National Lakes Assessment Project: Microcystin Concentrations in Minnesota Lakes (www.pca.state.mn.us/index.php/view-document.html?gid=6231).MPCA. (2013). Air Quality in Minnesota: 2013 Report to the Legislature (www.pca.state.mn.us/index.php/view-document.html?gid=18909). MPCA. (2014a). 2014 Pollution Report to the Legislature: a summary of Minnesota’s air emissions and water discharges (www.pca.state.mn.us/index.php/view-document.html?gid=20890).MPCA. (2014b). Minnesota air quality index trends: 2003-2013 (www.pca.state.mn.us/index.php/view-document.html?gid=19493).National Aeronautics and Space Administration (NASA). (2014). NASA - What’s the difference between weather and climate? (www.nasa.gov/mission_pages/noaa-n/climate/climate_weather.html).National Drought Mitigation Center (NDMC). (2014). Types of Drought (drought.unl.edu/DroughtBasics/TypesofDrought.aspx).National Institute of Allergy & Infections Diseases (NIAID). (2012). Pollen Allergy (www.niaid.nih.gov/topics/allergicDiseases/Documents/PollenAllergyFactSheet.pdf).National Oceanic and Atmospheric Administration, National Weather Service (NOAA/NWS). (2014a). Natural Hazard Statistics (www.nws.noaa.gov/om/hazstats.shtml).National Weather Service (NWS). (2014b). Heat: A Major Killer (http://www.nws.noaa.gov/os/heat/index.shtml).Nawrot, T.S., Perez, L., Künzli, N., Munters, E., Nemery, B. (2011). Public health importance of triggers of myocardial infarction: a comparative risk assessment. Lancet, 377(9767):732-40.Needham, G.R., Teel, P.D. (1991). Off-host physiological ecology of ixodid ticks. Annual Review of Entomology, 36:659–681.NOAA, National Climatic Data Center (NOAA/NCDC). (2014). Storm Events Database (www.ncdc.noaa.gov/stormevents/).NOAA, National Ocean Service (NOAA/NOS). (2014, August 11). Harmful Algal Blooms (oceanservice.noaa.gov/hazards/hab/).
NOAA, National Weather Service (NOAA/NWS). (2014). Hydrologic Information Center - Flood Loss Data (www.nws.noaa.gov/hic/index.shtml).
Li, F., Wiegman, C., Seiffert, J.M., Zhu, J., Clarke, C., Chang, Y., Bhavsar, P., Adcock, I., Zhang, J., Zhou, X., Chung, K.F. (2013). Effects of N-acetylcysteine in ozone-induced chronic obstructive pulmonary disease model. PLoS One, 8(11):e80782.Lin, H.C., Chen, C.S., Xirasagar, S., Lee, H.C. (2008). Seasonality and climatic associations with violent and nonviolent suicide: a population-based study. Neuropsychobiology, 57(1-2):32-7.Lindon, M., Heiskary, S. (2009). Blue-green algal toxin (microcystin) levels in Minnesota lakes. Lake and Reservoir Management, 25:3,240-252.Littlefield, E. (2013, August 28). Heat wave closes dozens Of Minneapolis schools for rest of the week. CBS Minnesota (minnesota.cbslocal.com/2013/08/28/heat-wave-closes-dozens-of-mpls-schools-for-rest-of-the-week/).Liu, A., Tan, H., Zhou, J., Li, S., Yang, T., Wang, J., et al. (2006). An epidemiologic study of post-traumatic stress disorder in flood victims in Hunan China. Can J Psychiatry, 51:350–4.Lobell, D. B., Schlenker, W., Costa-Roberts, J. (2011). Science, 333:6116-20.LoGiudice, K., Ostfeld, R.S., Schmidt, K.A., Keesing, F. (2003). The ecology of infectious disease: Effects of host diversity and community composition on Lyme disease risk. Proc Nat Acad Sci, 100:567-71.Loomis, D., Grosse, Y., Lauby-Secretan, B., El Ghissassi, F., Bouvard, V., Benbrahim-Tallaa, L., Guha, N., Baan, R., Mattock, H., Straif, K., International Agency for Research on Cancer Monograph Working Group (IARC). (2013). The carcinogenicity of outdoor air pollution. Lancet Oncol, 14(13):1262-3.Lopez, C.B., Jewett, E.B., Dortch, Q., Walton, B.T., Hudnell, H.K. (2008). Scientific Assessment of Freshwater Harmful Algal Blooms. Interagency Working Group on Harmful Algal Blooms, Hypoxia, and Human Health of the Joint Subcommittee on Ocean Science and Technology. Washington, DC.Lowe, D., Ebi, K.L., Forsberg, B. (2013). Factors increasing vulnerability to health effects before, during and after floods. International Journal of Environmental Research & Public Health, 10(12):7015-7067.Lundgren, K., Kjellstrom, T. (2013). Sustainability challenges from climate change and air conditioning use in urban areas. Sustainability, 5(7):3116-3128.Mac Kenzie, W.R., Hoxie, N.J., Proctor, M.E., Gradus, M.S., Blair, K.A., Peterson, D.E., Kazmierczak, J.J., Addiss, D.G., Fox, K.R., Rose, J.B., Davis, J.D. (1994). A massive outbreak in Milwaukee of cryptosporidium infection transmitted through the public water supply. N Engl J Med, 331(3):161-7.Mannino, D.M., Homa, D.M., Akinbami, L.J., Ford, E.S., Redd, S.C. (2002). Chronic obstructive pulmonary disease surveillance—United States, 1971–2000. Respir Care, 47:1184–99.Mantey, K., Coccoz, F., Boulogne, O., Torrents, R., Guibert, N., Six, C., Malfait, P. (2010). Increase of mortality associated with emergency relocation of elderly nursing homes residents following flooding in the Var district, France. Geriatr Psychol Neuropsychiatr Vieil, 10(4):373-382.Mares, D. (2013). Climate change and levels of violence in socially disadvantaged neighborhood groups. J Urban Health, 90(4):768-83. Mason, V., Andrews, H., Upton, D. (2010). The psychological impact of exposure to floods. Psychol Health Med, 15:61–73.McDermott, G. R. (2012). Electricity prices, river temperatures and cooling water scarcity. Bonn: Institute for the Study of Labor.McLean, I. (2007). Climatic effects on incidence of sexual assault. J Forensic Leg Med, 14(1):16-9.MDH. (2012). Asthma in Minnesota: 2012 Epidemiology Report. Minnesota Department of Health. St. Paul, MN.MDH. (2014a). West Nile Virus (WNV) (www.health.state.mn.us/divs/idepc/diseases/westnile/).MDH. (2014b). Lyme Disease Statistics (www.health.state.mn.us/divs/idepc/diseases/lyme/statistics.html).
M I N N E S O T A C L I M A T E A N D H E A L T H P R O F I L E R E P O R T
99
Human Health Effects of Climate Change. Research Triangle Park, NC: Environmental Health Perspectives/National Institute of Environmental Health Sciences. Price Waterhouse Coopers (PWC). (2011, November). Protecting human health and safety during severe and extreme heat events: A national framework. Report for the Commonwealth Government (www.pwc.com.au/industry/government/assets/extreme-heat-events-nov11.pdf).Pryor, S. C., D. Scavia, C. Downer, M. Gaden, L. Iverson, R. Nordstrom, J. Patz, and G. P. Robertson, 2014: Ch. 18: Midwest. Climate Change Impacts in the United States: The Third National Climate Assessment, J. M. Melillo, Terese (T.C.) Richmond, and G. W. Yohe, Eds., U.S. Global Change Research Program, 418-440. Quansah, R., Jaakkola, M.S., Hugg, T.T., Heikkinen, S.A., Jaakkola, J.J. (2012). Residential dampness and molds and the risk of developing asthma: a systematic review and meta-analysis. PLoS One, 7(11):e47526. Quest Diagnostics. (2011). Allergies across America - the largest study of allergy testing in the United States (www.questdiagnostics.com/dms/Documents/Other/2011_QD_AllergyReport.pdf).Rex, E. (2013, January 8). Harmful algal blooms increase as lake water warms. Scientific American (www.scientificamerican.com/article/harmful-algal-blooms-increase-as-lake-water-warms/).Ribaudo, M. (2011, September 1). Reducing Agriculture’s Nitrogen Footprint: Are New Policy Approaches Needed? (www.ers.usda.gov/amber-waves/2011-september/nitrogen-footprint.aspx).Robine, J.M., Cheung, S.L., Le Roy, S., Van Oyen, H., Herrmann, F.R. (2007). Report on excess mortality in Europe during summer 2003. In: G. A. EU Community Action Programme for Public Health, p. 13.Roche, S.M., Jones-Bitton, A., Majowicz, S.E., Pintar, K.D., Allison, D. (2013). Investigating public perceptions and knowledge translation priorities to improve water safety for residents with private water supplies: a cross-sectional study in Newfoundland and Labrador. BMC Public Health, 13:1225. Ruiz, M.O., Chaves, L.F., Hamer, G.L., Sun, T., Brown, W.M., Walker, E.D., Haramis, L., Goldberg, T.L., Kitron, U.D. (2010). Local impact of temperature and precipitation on West Nile virus infection in Culex species mosquitoes in northeast Illinois, USA. Parasit Vectors, 3(1):19.Sacks, J.D., Stanek, L.W., Luben, T.J., Johns, D.O., Buckley, B.J., Brown, J.S., Ross, M. (2011). Particulate matter-induced health effects: who is susceptible? Environ Health Perspect, 119(4):446-54.Saunders, S., Findlay, D., Easley, T., Spencer, T. (2012). Doubled Trouble: More Midwestern Extreme Storms. The Rocky Mountain Climate Organization and the Natural Resources Defense Council.Schwartz, J. (2012, June 22). Cost of Minnesota flood estimated at $100 million. The New York Times (www.nytimes.com/2012/06/23/us/millions-in-damage-from-duluth-flooding.html?_r=0).Seeley, M. (2007). Climate change in Minnesota: Measurement evidence, consequence, and implications. In Water Resources Science Seminar Series, Water Resources Science, University of Minnesota. St. Paul, MN.Semenza, J.C., McCullough, J.E., Flanders, W.D., McGeehin, M.A., Lumpkin, J.R. (1999). Excess hospital admissions during the July 1995 heat wave in Chicago. Am J Prev Med, 16:269–277.Seneviratne, S.I., Donat, M.G., Mueller, B., Alexander, L.V. (2014). No pause in the increase of hot temperature extremes. Nature Climate Change, 4(3):161-163.Singer, B.D., Ziska, L.H., Frenz, D.A., Gebhard, D.E., Straka, J.G. (2005). Increasing Amb a 1 content in common ragweed (Ambrosia artemisiifolia) pollen as a function of rising atmospheric CO2 concentration. Funct Plant Biol, 32:667–670
Norris, G., Larson, T., Koenig, J., Claiborn, C., Sheppard, L., Finn, D. (2000). Asthma aggravation, combustion, and stagnant air. Thorax, 55(6):466-70.Ogden, N.H., Radojevic, M., Wu, X., Duvvuri, V.R., Leighton, P.A., Wu, J. (2014). Estimated effects of projected climate change on the basic reproductive number of the Lyme disease vector Ixodes scapularis. Environ Health Perspect, 122(6):631-8.O’Neil, J.M., Davis, T.W., Burford, M.A., Gobler, C.J. (2012). The rise of harmful cyanobacteria blooms: the potential roles of eutrophication and climate change. Harmful Algae 14:313-334.O’Neill, M.S., Ebi, K.L. (2009). Temperature extremes and health: impacts of climate variability and change in the United States. J Occup Environ Med, 51(1):13-25. Orent, W. (2013, December 11). The confounding debate over Lyme disease in the South. Discover Magazine (discovermagazine.com/2013/dec/14-southern-gothic).Ostro, B., Rauch, S., Green, R., Malig, B., Basu, R. (2010). The effects of temperature and use of air conditioning on hospitalizations. Am J Epidemiol, 172(9):1053-61. Paerl, H.W., Fulton, R.S. III, Moisander, P.H., Dyble, J. (2001). Harmful freshwater algal blooms, with an emphasis on cyanobacteria. ScientificWorldJournal, 1:76-113.Paerl, H.W., Hall, N.S., Calandrino, E.S. (2011). Controlling harmful cyanobacterial blooms in a world experiencing anthropogenic and climatic-induced change. Sci Total Environ, 409(10):1739-45.Palecki, M.A., Changnon, S.A., Kunkel, K.E. (2001). The nature and impacts of the July 1999 heat wave in the Midwestern United States: Learning from the lessons of 1995. Bull Amer Meteor Soc, 82:1353-1367.Palmer, W.C. (1965). Meteorological drought. Paper no. 45, 1-58. Weather Bureau, U.S. Department of Commerce, Washington, D.C.Panu, U., Sharma, T. (2002). Challenges in drought research: some perspectives and future directions. Hydrological Sciences Journal, 47(sup1): S19-S30.Paranjothy, S., Gallacher, J., Amlôt, R., Rubin, G.J., Page, L., Baxter, T., Wight, J., Kirrage, D., McNaught, R., Palmer, S.R. (2011). Psychosocial impact of the summer 2007 floods in England. BMC Public Health, 11:145. Parsons, K. (2003). Human thermal environments. The effects of hot, moderate and cold temperatures on human health, comfort and performance (2nd ed.). London, UK: Taylor & Francis.Paz, S., Semenza, J.C. (2013). Environmental drivers of west nile fever epidemiology in Europe and Western Asia - a review. Int J Environ Res Public Health, 10:3543-3562.Peacock, J.M., Shanedling, S. (2011). Heart disease and stroke in Minnesota: 2011 burden report. St. Paul, MN: Minnesota Department of Health . Perera, E.M., Sanford, T., Cleetus, R. (2012). After the Storm: The Hidden Health Risks of Flooding in a Warming World. Cambridge: Union of Concerned Scientists.Perera, E.M., Sanford, T., White-Newsome, J.L., Kalkstein, L.S., Vanos, J.K., Weir, K. (2012). Heat in the Heartland: 60 Years of Warming in the Midwest. Cambridge, Mass.: Union of Concerned Scientists. Peterson, T.C., Heim Jr., R.R., Hirsch, R., Kaiser, D.P., Brooks, H., Diffenbaugh, N.S., Dole, R.M., Giovannettone, J.P., Guirguis, K., Karl, T.R., Katz, R.W., Kunkel, K., Lettenmaier, D., McCabe, G.J., Paciorek, C.J., Ryberg, K.R., Schubert, S., Silva, V.B.S., Stewart, B.C., Vecchia, A.V., Villarini, G., Vose, R.S., Walsh, J., Wehner, M., Wolock, D., Wolter, K., Woodhouse, C.A., Wuebbles, D. (2013). Monitoring and understanding changes in heat waves, cold waves, floods, and droughts in the united states: state of knowledge. Bull Amer Meteor Soc, 94: 821–834.Pielke, R.A., Jr. (1999). Nine fallacies of floods. Climatic Change, 42(2), 413-438.Portier, C.J., Thigpen, T.K., Carter, S.R., Dilworth, C.H., Grambsch, A.E., Gohlke, J., Hess, J., Howard, S.N., Luber, G., Lutz, J.T., Maslak, T., Prudent, N., Radtke, M., Rosenthal, J.P., Rowles, T., Sandifer, P.A., Scheraga, J., Schramm, P.J., Strickman, D., Trtanj, J.M., Whung, P-Y. (2010). A Human Health Perspective On Climate Change: A Report Outlining the Research Needs on the
M I N N E S O T A C L I M A T E A N D H E A L T H P R O F I L E R E P O R T
100
Wallender, E.K., Ailes, E.C., Yoder, J.S., Roberts, V.A., Brunkard, J.M. (2013). Contributing Factors to Disease Outbreaks Associated with Untreated Groundwater. Ground Water. doi: 10.1111/gwat.12121. [Epub ahead of print]Walthall, C.L., J. Hatfield, P. Backlund, L. Lengnick, E. Marshall, M. Walsh, S. Adkins, M. Aillery, E.A. Ainsworth,C. Ammann, C.J. Anderson, I. Bartomeus, L.H. Baumgard, F. Booker, B. Bradley, D.M. Blumenthal, J. Bunce, K. Burkey, S.M. Dabney, J.A. Delgado, J. Dukes, A. Funk, K. Garrett, M. Glenn, D.A. Grantz, D. Goodrich, S. Hu, R.C. Izaurralde, R.A.C. Jones, S-H. Kim, A.D.B. Leaky, K. Lewers, T.L. Mader, A. McClung, J. Morgan, D.J. Muth, M. Nearing, D.M. Oosterhuis, D. Ort, C. Parmesan, W.T. Pettigrew, W. Polley, R. Rader, C. Rice, M. Rivington, E. Rosskopf, W.A. Salas, L.E. Sollenberger, R. Srygley, C. Stöckle, E.S. Takle, D. Timlin, J.W. White, R. Winfree, L. Wright-Morton, L.H. Ziska. 2012. Climate Change and Agriculture in the United States: Effects and Adaptation. USDA Technical Bulletin 1935. Washington, DC.Wang, G., Minnis, R.B., Belant, J.L., Wax, C.L. (2010). Dry weather induces outbreaks of human West Nile virus infections. BMC Infectious Diseases, 10:38.Wang, X., Lavigne, E., Ouellette-Kuntz, H., Chen, B.E. (2014). Acute impacts of extreme temperature exposure on emergency room admissions related to mental and behavior disorders in Toronto, Canada. J Affect Disord, 155:154-61.Wilhite, D.A., Glantz, M.H. (1985). Understanding the Drought Phenomenon: The Role of Definitions. Water International, 10(3):111–120.World Health Organization (WHO). (2013). Floods in WHO European Region: health effects and their prevention. Denmark: World Health Organization.World Meteorological Organization (WMO). (2014). WMO Statement on the Status of the Global Climate in 2013 (docs.google.com/file/d/0BwdvoC9AeWjUeEV1cnZ6QURVaEE/edit).Ye, S. (2012). Minnesota ethanol industry (www.mda.state.mn.us/~/media/Files/food/business/economics/plantsreport.ashx).Ye, S. (2014). Minnesota Agricultural Profile (www.mda.state.mn.us/~/media/Files/agprofile.ashx).Zanobetti, A., Coull, B.A., Gryparis, A., Kloog, I., Sparrow, D., Vokonas, P.S., Wright, R.O., Gold, D.R., Schwartz, J. (2014). Associations between arrhythmia episodes and temporally and spatially resolved black carbon and particulate matter in elderly patients. Occup Environ Med, 71(3):201-7.Ziello, C., Sparks, T.H., Estrella, N., Belmonte, J., Bergmann, K.C., Bucher, E., Brighetti, M.A., Damialis, A., Detandt, M., Galán, C., Gehrig, R., Grewling, L., Gutiérrez Bustillo, A.M., Hallsdóttir, M., Kockhans-Bieda, M.C., De Linares, C., Myszkowska, D., Pàldy, A., Sánchez, A., Smith, M., Thibaudon, M., Travaglini, A., Uruska, A., Valencia-Barrera, R.M., Vokou, D., Wachter, R., de Weger, L.A., Menzel, A. (2012). Changes to airborne pollen counts across Europe. PLoS One, 7(4):e34076.Ziska, L., K. Knowlton, C. Rogers, D. Dalan, N. Tierney, M. Elder, W. Filley, J. Shropshire, L.B. Ford, C. Hedberg, P. Fleetwood, K.T. Hovanky, T. Kavanaugh, G. Fulford, R.F. Vrtis, J.A. Patz, J. Portnoy, F. Coates, L. Bielory, and D. Frenz. (2011). Recent warming by latitude associated with increased length of ragweed pollen season in central North America. Proc Natl Acad Sci, 108:4248–4251.Ziska, L., K. Knowlton, C. Rogers, National Allergy Bureau, Aerobiology Research Laboratories, Canada. (2014). 2014 update to data originally published in: Ziska, L., K. Knowlton, C. Rogers, D. Dalan, N. Tierney, M. Elder, W. Filley, J. Shropshire, L.B. Ford, C. Hedberg, P. Fleetwood, K.T. Hovanky, T. Kavanaugh, G. Fulford, R.F. Vrtis, J.A. Patz, J. Portnoy, F. Coates, L. Bielory, and D. Frenz. 2011. Recent warming by latitude associated with increased length of ragweed pollen season in central North America. Proc Natl Acad Sci, 108:4248–4251.Zohrabian, A., Meltzer, M.I., Ratard, R., Billah, K., Molinari, N.A., Roy, K., Scott, R.D. II, Petersen, L.R. (2004). West Nile virus economic impact, Louisiana, 2002. Emerg Infect Dis, 10(10):1736-44.
Sivak, M. (2013). Will AC put a chill on the global energy supply? American Scientist, 101(5):330.Soverow, J.E., Wellenius, G.A., Fisman, D.N., Mittleman, M.A. (2009). Infectious disease in a warming world: how weather influenced West Nile virus in the United States (2001-2005). Environ Health Perspect, 117(7):1049-52.Stanke, C., Kerac, M., Prudhomme, C., Medlock, J., Murray, V. (2013). Health effects of drought: a systematic review of the evidence. PLoS Curr, Jun 5;5. Steil, M. (2013, September 12). Drought hurts Minnesota’s soybean crop. MPR News (www.mprnews.org/story/2013/09/12/drought-damages-minnesota-soybean-crop).Suh, S., Chiu, Y.-W., Olabisi, L.S. (2010). The Future of Energy and Minnesota’s Water Resources. Report to Legislative Citizen’s Commission on Minnesota Resources. Saint Paul, Minnesota.Talaei, A., Hedjazi, A., Rezaei Ardani, A., Fayyazi Bordbar, M.R., Talaei, A. (2014). The relationship between meteorological conditions and homicide, suicide, rage, and psychiatric hospitalization. J Forensic Sci, doi: 10.1111/1556-4029.12471. [Epub ahead of print]Theocharis, G., Tansarli, G.S., Mavros, M.N., Spiropoulos, T., Barbas, S.G., Falagas, M.E. (2013). Association between use of air-conditioning or fan and survival of elderly febrile patients: a prospective study. Eur J Clin Microbiol Infect Dis, 32(9):1143-7.Thiesse, K. (2012, December 18). 2012 agriculture review: crop production, drought conditions. Corn and Soybean Digest (cornandsoybeandigest.com/blog/2012-agriculture-review-crop-production-drought-conditions).Thorn, J., Brisman, J., Torén, K. (2001). Adult-onset asthma is associated with self-reported mold or environmental tobacco smoke exposures in the home. Allergy, 56(4):287-92.Thornes, J.E., Fisher, P.A., Rayment-Bishop, T., Smith, C. (2014). Ambulance call-outs and response times in Birmingham and the impact of extreme weather and climate change. Emerg Med J, 31(3):220-8. Tomio, J., Sato, H., Mizumura, H. (2010). Interruption of medication among outpatients with chronic conditions after a flood. Prehosp Disaster Med, 25:42–50.Tong, V.T., Zotti, M.E., Hsia, J. (2011). Impact of the Red River catastrophic flood on women giving birth in North Dakota, 1994-2000. Matern Child Health J, 15(3):281-8. Trisko, E.M. (2011, February). Energy cost impacts on Minnesota families, 2010 (americaspower.org/sites/all/themes/americaspower/images/pdf/Minnesota-Energy-Analysis-2010.pdf).Trust for Public Land (n.d.) ParkScore index: City Rankings (parkscore.tpl.org/rankings.php).U.S. Environmental Protection Agency (USEPA). (2004, June). Drinking water costs & federal funding (water.epa.gov/lawsregs/guidance/sdwa/upload/2009_08_28_sdwa_fs_30ann_dwsrf_web.pdf).UK Environment Agency (UKEA). (2010). The costs of the summer 2007 floods in England. Bristol, UK: environment agency (publications.environment-agency.gov.uk/PDF/SCHO1109BRJA-E-E.pdf).Van Sickle, D., Chertow, D.S., Schulte, J.M., Ferdinands, J.M., Patel, P.S., Johnson, D.R., Harduar-Morano, L., Blackmore, C., Ourso, A.C., Cruse, K.M., Dunn, K.H., Moolenaar, R.L. (2007). Carbon monoxide poisoning in Florida during the 2004 hurricane season. Am J Prev Med, 32(4):340-6.Van Vliet, M.T.H., Vogele, S., Rubbleke, D. (2013). Water constraints on European power supply under climate change: impacts on electricity prices. Environ Res Lett, 8(3): 035010.Van Zutphen, A.R., Lin, S., Fletcher, B.A., Hwang, S.A. (2012). A population-based case-control study of extreme summer temperature and birth defects. Environ Health Perspect, 120(10):1443-9Vaneckova, P., Bambrick, H. (2013). Cause-specific hospital admissions on hot days in Sydney, Australia. PLoS One, 8(2):e55459.Waite, T., Murray, V., Baker, D. (2014). Carbon monoxide poisoning and flooding: changes in risk before, during and after flooding require appropriate public health interventions. PLoS Curr, Jul 3;6. pii: ecurrents.dis.2b2eb9e15f9b982784938803584487f1.