Embed Size (px)
Citation preview
August 2004
Minnesota Report Card on Environmental Literacy
A survey of adult environmental
knowledge, attitudes and behavior
Minnesota Office of Environmental Assistance
the secondthe second
Center for Global Environmental Education
Principal AuthorDr. Tony P. Murphy, Assistant Professor, Education Department, College of St. Catherine, St. Paul, Minnesota. Dr. Murphy is also an adjunct faculty member at Hamline University in St. Paul, Minnesota. He has been involved in various science education programs at the state and national levels for many years. He has published articles in various journals and presented at state and national conferences.
Project Manager: Tracy Fredin, CGEE, Hamline Univeristy
AcknowledgementsThe Second Minnesota Report Card on Environmental Literacy would not have been possible without funding from the Minnesota Office of Environmental Assistance and Hamline University in St. Paul, Minnesota. Wilder Research Center staff, especially Dr. Craig Helmstetter was instrumental in the survey and data analysis. Additional support and feedback was received from Dr. Paulette Johnson, Director, Pennsylvania Center for Environmental Education, and Dr. Rosanne Fortner, Professor of Natural Resources, Ohio State University. The National Environmental Education Training Foundation, Washington, DC, was generous in allowing us to use various questions from some of its previous surveys.
Special thanks to the working group who came together, offering their time and effort to support this project, develop the survey, and provide feedback on the final report. Working group members include:
• Tony Murphy, Ph.D., College of St. Catherine (principal investigator/working group chair)• Don Berger, Pollution Control Agency• Bill Brady, Cargill, Incorporated• Chris Crutchfield, Attorney at Law• Lisa Doerr, League of Conservation Voters Education Fund• Bill Droessler, Minnesota Environmental Initiative• Joseph J. Duggan, Pheasants Forever• Dawn A. Flinn, Minnesota Department of Natural Resources• Tracy Fredin, Director, Center for Global Environmental Education, Hamline University• Ken Gilbertson, Ph.D., University of Minnesota-Duluth• Betsy Hearn, Communications Specialist, Target Corporation• Craig Helmstetter, Ph.D., Wilder Research Center• Linda Henning, Environmental Services, Metropolitan Council• Cathi Lyman-Onkka, Ramsey County Department of Public Health• Tom Miller, Minnesota Office of Environmental Assistance• Denise Stromme, Minnesota Office of Environmental Assistance• Ron Struss, University of Minnesota Extension, Board of Water and Soil Resources• Karen Wold, Barr Engineering
In addition, a thank-you is due to the Minnesota adults who took the time to participate in the survey.
Editing and GraphicsScott Andre | Theresa Gaffey
August 2004
For additional information on this survey, check out the SEEK web site: mnseek.net
This report was printed by a Minnesota Great Printer on 30% post-consumer recycled paper manufactured without chlorine or chlorine derivatives (PCF).
Second Minnesota Report Card on Environmental Literacy 1
Table of Contents Executive Summary............................................................................... 2
Introduction ........................................................................................ 7
Part 1 Environmental Knowledge.............................................................. 9
General environmental knowledge .................................................................... 9 Knowledge of water issues.............................................................................16 Overall knowledge scores of Minnesota residents .................................................20 Self-reported knowledge of environmental issues.................................................22 Specific environmental topics .........................................................................23 Connections with other research .....................................................................26
Part 2 Environmental Attitudes ...............................................................27
Attitudes toward environmental protection........................................................27 Attitudes toward environmental responsibility ....................................................32 Attitudes toward water quality.......................................................................35 Attitudes toward environmental education.........................................................40 Connections with other research .....................................................................41
Part 3 Environmental Behaviors ..............................................................42
Daily behaviors...........................................................................................42 Connections with other research .....................................................................50
Part 4 Environmental literacy: Integrating knowledge, attitudes, and behavior...51
Self-reported knowledge of the environment ......................................................51 Other scales of measurement .........................................................................53
Appendix A. Survey Instrument ................................................................55
Appendix B. Methodology .......................................................................65
Appendix C. Final Frequencies .................................................................66
Appendix D. Demographic Profile of Survey Respondents .................................90
Appendix E. List of Referenced Reports ......................................................92
2 Executive Summary
Executive Summary Minnesota residents continue to encounter a variety of environmental issues. What knowledge and skills do they need to be able to solve these issues? It is clear that Minnesota needs an environmentally literate citizenry—one that has knowledge about, and attitudes toward the environment and the issues that in turn may affect behaviors related to the environment.
The Second Minnesota Report Card on Environmental Literacy documents the results of the second statewide survey, which was conducted in 2003, concerning environmental literacy of adults in Minnesota. The first survey (2001) created a baseline of environmental literacy for residents of the state. Minnesota adults were surveyed for their knowledge about, attitudes toward, and behaviors related to the environment. (See the SEEK or the CGEE website for an electronic version of Minnesota Report Card on Environmental Literacy 2002.)
The 2003 survey continues this process with some new questions. The Second Minnesota Report Card on Environmental Literacy follows a similar format to the previous report; however, it goes on to examine changes that occurred in the intervening period for questions used in both surveys. Comparisons are also made to Pennsylvania residents and United States citizens. These comparisons are based on similar studies performed by Pennsylvania and nationally. While some of the data from these surveys may seem old, they are important to include, as Pennsylvania is still the only other state to conduct a similar survey.
It is important to conduct similar surveys in the future. By continuing to collect information about Minnesotans’ knowledge, attitudes, and behaviors, we can track trends in environmental literacy and highlight any appropriate changes to our education efforts.
What does environmental literacy
mean?
The Earth is a set of interacting natural and social systems. An environmentally literate person must understand the relationship of the parts of a system and the interdependence of human and environmental systems. —Minnesota’s Environmental Literacy Scope
and Sequence This report is available on the following web
sites: SEEK (mnseek.net)
Hamline University’s Center for Global
Environmental Education
(cgee.hamline.edu).
Second Minnesota Report Card on Environmental Literacy 3
Environmental knowledge
To collect data about environmental knowledge, adult Minnesota residents were asked 13 fact-based questions to determine what they actually know about the environment.
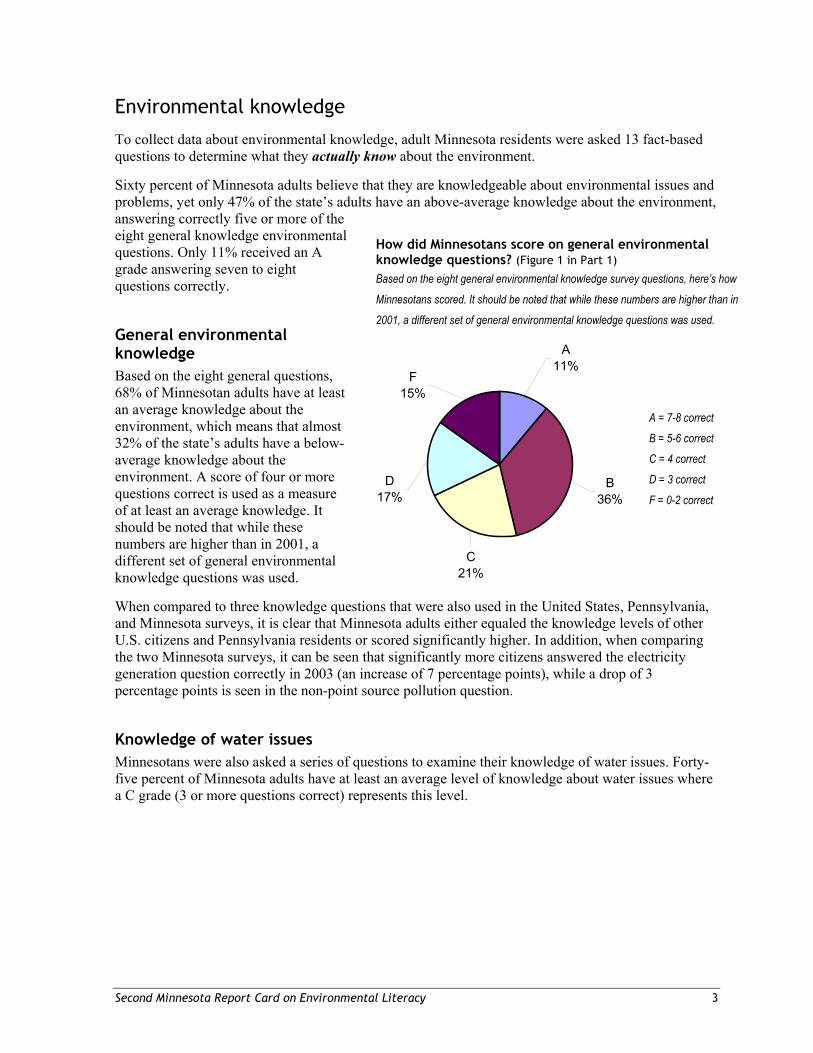
Sixty percent of Minnesota adults believe that they are knowledgeable about environmental issues and problems, yet only 47% of the state’s adults have an above-average knowledge about the environment, answering correctly five or more of the eight general knowledge environmental questions. Only 11% received an A grade answering seven to eight questions correctly.
General environmental knowledge Based on the eight general questions, 68% of Minnesotan adults have at least an average knowledge about the environment, which means that almost 32% of the state’s adults have a below-average knowledge about the environment. A score of four or more questions correct is used as a measure of at least an average knowledge. It should be noted that while these numbers are higher than in 2001, a different set of general environmental knowledge questions was used.
When compared to three knowledge questions that were also used in the United States, Pennsylvania, and Minnesota surveys, it is clear that Minnesota adults either equaled the knowledge levels of other U.S. citizens and Pennsylvania residents or scored significantly higher. In addition, when comparing the two Minnesota surveys, it can be seen that significantly more citizens answered the electricity generation question correctly in 2003 (an increase of 7 percentage points), while a drop of 3 percentage points is seen in the non-point source pollution question.
Knowledge of water issues Minnesotans were also asked a series of questions to examine their knowledge of water issues. Forty-five percent of Minnesota adults have at least an average level of knowledge about water issues where a C grade (3 or more questions correct) represents this level.
How did Minnesotans score on general environmental knowledge questions? (Figure 1 in Part 1) Based on the eight general environmental knowledge survey questions, here’s how
Minnesotans scored. It should be noted that while these numbers are higher than in
2001, a different set of general environmental knowledge questions was used.
B36%
A11%
F15%
D17%
C21%
A = 7-8 correct
B = 5-6 correct
C = 4 correct
D = 3 correct
F = 0-2 correct
4 Executive Summary
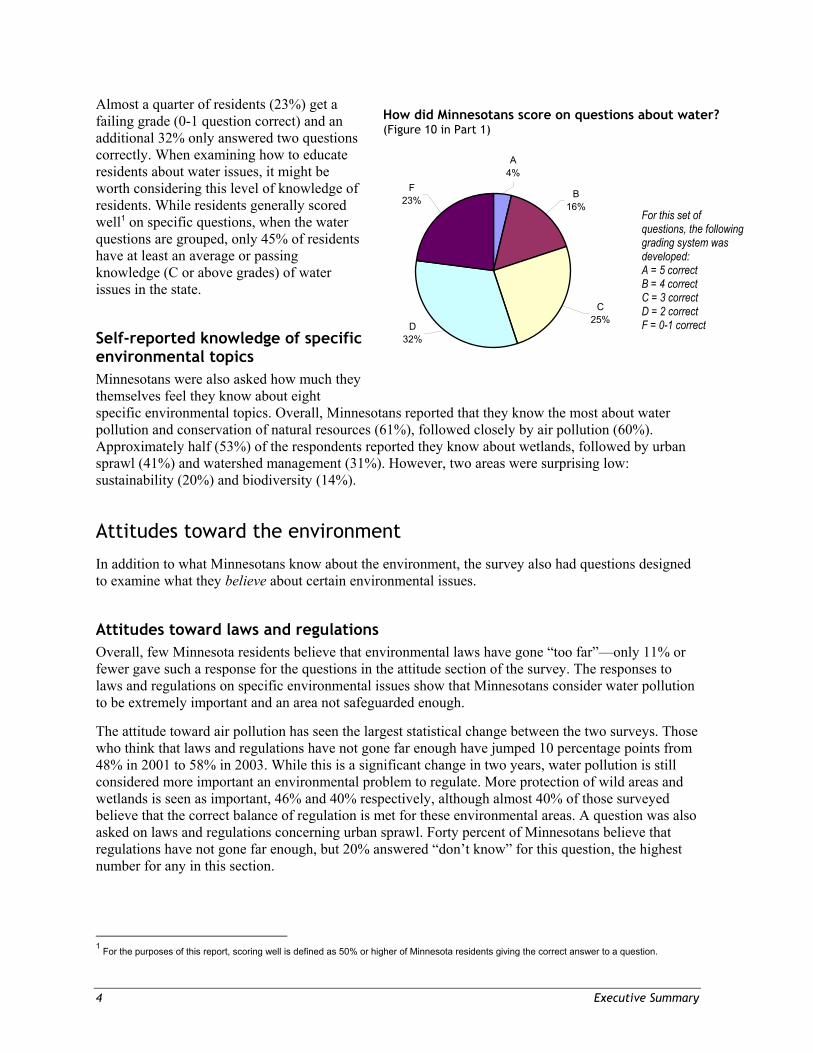
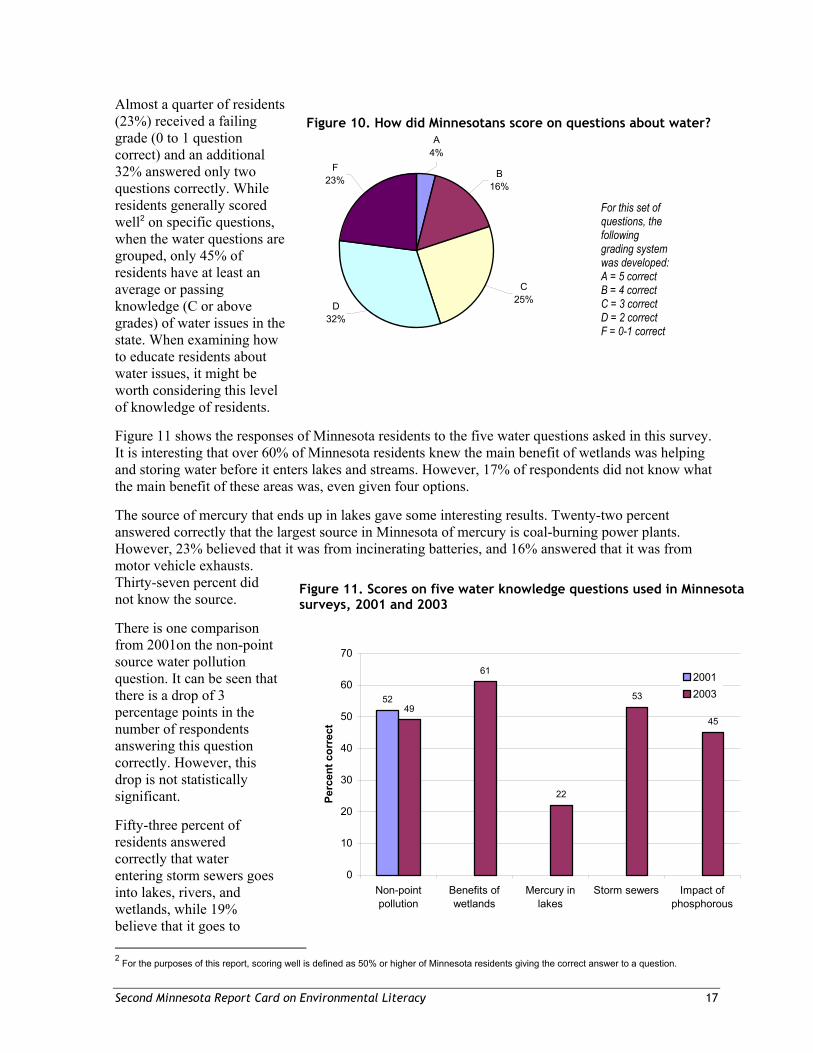
Almost a quarter of residents (23%) get a failing grade (0-1 question correct) and an additional 32% only answered two questions correctly. When examining how to educate residents about water issues, it might be worth considering this level of knowledge of residents. While residents generally scored well1 on specific questions, when the water questions are grouped, only 45% of residents have at least an average or passing knowledge (C or above grades) of water issues in the state.
Self-reported knowledge of specific environmental topics Minnesotans were also asked how much they themselves feel they know about eight specific environmental topics. Overall, Minnesotans reported that they know the most about water pollution and conservation of natural resources (61%), followed closely by air pollution (60%). Approximately half (53%) of the respondents reported they know about wetlands, followed by urban sprawl (41%) and watershed management (31%). However, two areas were surprising low: sustainability (20%) and biodiversity (14%).
Attitudes toward the environment
In addition to what Minnesotans know about the environment, the survey also had questions designed to examine what they believe about certain environmental issues.
Attitudes toward laws and regulations Overall, few Minnesota residents believe that environmental laws have gone “too far”—only 11% or fewer gave such a response for the questions in the attitude section of the survey. The responses to laws and regulations on specific environmental issues show that Minnesotans consider water pollution to be extremely important and an area not safeguarded enough.
The attitude toward air pollution has seen the largest statistical change between the two surveys. Those who think that laws and regulations have not gone far enough have jumped 10 percentage points from 48% in 2001 to 58% in 2003. While this is a significant change in two years, water pollution is still considered more important an environmental problem to regulate. More protection of wild areas and wetlands is seen as important, 46% and 40% respectively, although almost 40% of those surveyed believe that the correct balance of regulation is met for these environmental areas. A question was also asked on laws and regulations concerning urban sprawl. Forty percent of Minnesotans believe that regulations have not gone far enough, but 20% answered “don’t know” for this question, the highest number for any in this section.
1 For the purposes of this report, scoring well is defined as 50% or higher of Minnesota residents giving the correct answer to a question.
How did Minnesotans score on questions about water? (Figure 10 in Part 1)
For this set of questions, the following grading system was developed: A = 5 correct B = 4 correct C = 3 correct D = 2 correct F = 0-1 correct
F23%
D32%
C25%
B16%
A4%
Second Minnesota Report Card on Environmental Literacy 5
Attitudes toward environmental responsibility Minnesotans were also asked who they thought had responsibility for solving environmental problems in the state. Respondents had the following choices: business and industry; government; individual citizens; and agriculture and forestry. Thirty-three percent of Minnesotan residents strongly agree that individual citizens should be responsible for solving environmental problems in Minnesota, followed by government (29%), agriculture and forestry (24%), and business and industry (23%).
Attitudes toward environmental education The majority of Minnesotans (90%) want schools to provide environmental education. This support is the same as in the 2001 survey. This is not surprising given the interest of residents in providing quality education to the state’s children, and not significantly different from the Pennsylvania and national surveys.
Environmental behaviors
Minnesotans were asked a series of questions on environmental behaviors, from daily activities to lawn care. For daily behaviors, it is clear that a majority of Minnesotans report that they frequently conserve energy (87%) by turning off lights when leaving a room. However, only 51% report that they frequently conserve water by taking short showers (less than five minutes). In relation to transportation, 19% of Minnesotans report using alternate transportation frequently. This is identical to the 2001survey.
In relation to lawn care, 82% of respondents reported having a yard or garden that they or someone in their household maintains. Of those who care for the lawn, 35% don’t use a fertilizer, while only 5% use fertilizers containing phosphorous. However, 16% did not know if the fertilizer they use contains phosphorus.
Twenty percent of Minnesota adults reported that they donate money to environmental organizations more than once a year, while 34% responded that they donate once a year. However, 44% stated that they never donate money to environmental organizations.
Demographics considerations
Survey data were analyzed based on a number of demographics. Males again scored higher than females in most of the responses to the general environmental knowledge questions, a finding consistent with the Pennsylvania and national surveys. However, females tend to have a more positive attitude toward the environment compared to males. Age, location, income, and education are important factors in various areas of knowledge, attitudes, and behaviors.
Environmental literacy: Integrating knowledge, attitudes, and behavior
It is clear from the results of this and the 2001 survey that a connection exists between Minnesotans’ environmental knowledge and their self-reported attitudes and behaviors. However, if a higher level of environmental behaviors is to be promoted, what factors are required to move citizens from a medium
6 Executive Summary
level to the high level of behavior? Is it the acquisition of knowledge or more affective (attitudinal) education (or experiences) that is required to promote more positive environmental behaviors?
Whatever the case, Minnesota residents are willing to conduct environmentally friendly behaviors, but continued research is required on the effects of knowledge and attitudes on these behaviors in the creation of an environmentally literate population. These are important considerations when planning environmental educational programs. So, while the focus of environmental education may require some change, it does play an integral component in assuring an environmentally literate Minnesota and is an area that has strong public support.
Comparing Minnesota’s report cards In this report card, the data from the 2003 survey and the 2001 survey are compared. The first survey created a baseline of environmental literacy for residents of the state. This survey continues this process with some new questions. However, the report also examines changes that occurred in the intervening period for questions used in both surveys. It is important to conduct similar surveys in the future so that trends in environmental literacy can be tracked and any appropriate changes made in education efforts.
Second Minnesota Report Card on Environmental Literacy 7
Introduction Minnesota residents continue to encounter a variety of environmental issues. What knowledge and skills do they need to be able to solve these issues? It is clear that Minnesota needs an environmentally literate citizenry—one that has knowledge about, and attitudes toward the environment and the issues that in turn may affect behaviors related to the environment.
The Second Minnesota Report Card on Environmental Literacy documents the results of the second statewide survey, which was conducted in 2003, concerning environmental literacy of adults in Minnesota. The first survey (2001) created a baseline of environmental literacy for residents of the state. Minnesota adults were surveyed for their knowledge about, attitudes toward, and behaviors related to the environment. (See the SEEK or the CGEE website for an electronic version of Minnesota Report Card on Environmental Literacy 2002.)
The 2003 survey continues this process with some new questions. The Second Minnesota Report Card on Environmental Literacy follows a similar format to the previous report; however, it goes on to examine changes that occurred in the intervening period for questions used in both surveys. Comparisons are also made to Pennsylvania residents and United States citizens. These comparisons are based on similar studies performed by Pennsylvania and nationally. While some of the data from these surveys may seem old, they are important to include, as Pennsylvania is still the only other state to conduct a similar survey.
It is important to conduct similar surveys in the future. By continuing to collect information about Minnesotans’ knowledge, attitudes, and behaviors, we can track trends in environmental literacy and highlight any appropriate changes to our education efforts.
Survey instrument
From August through November 2003, a random sample of 1,000 Minnesota adults answered a series of questions in a telephone survey conducted by the Wilder Research Center in St. Paul, Minnesota. A copy of the entire survey is available in Appendix A. See Appendix C for the final frequencies of responses to each individual question.
The Minnesota environmental literacy survey was developed with members of the working group (see acknowledgements page). The survey instrument includes questions from various National Report Cards on Environmental Knowledge, Attitudes and Behaviors (referred to as National Environmental Report Cards in this report) conducted by the National Environmental Education Training Foundation and Roper Starch Worldwide. Questions were also developed specifically for this survey.
What does environmental literacy
mean?
The Earth is a set of interacting natural and social systems. An environmentally literate person must understand the relationship of the parts of a system and the interdependence of human and environmental systems.—Minnesota’s
Environmental Literacy Scope and
Sequence This report is available on the following web
sites: SEEK (mnseek.net)
Hamline University’s Center for Global
Environmental Education
(cgee.hamline.edu).
8 Introduction
Data analysis
Data from the survey interviews were analyzed using frequencies of occurrence and the Pearson Chi-Square, which tests the relationship between two variables and reports statistical significance. One set of variables in this report is the demographics (gender, age, education, location, income), while the other set are the questions from the survey.
Demographics
The respondents to the survey were divided according to specific demographics to allow for analysis of the data (Questions 31-36). The demographics selected were gender, age (18-34, 35-44, 45-64, and 65 and over), education (high school, some college, college degree), location (seven-county metro, other metro areas in the state, non-metro or rural areas), and income ($30,000 or less, $30,001-$50,000, $50,001-$75,000, and over $75,000). These demographics were also used in the other national and Pennsylvania report cards. The Pearson Chi-Square determines a statistical relationship between two variables, in this case, demographics and the questions.
Organization and purpose of report
The report is divided into four parts. The first three discuss specific sections of the survey: knowledge, attitudes, and behaviors. The final section offers an integrated perspective to the overall report and to Minnesota adults’ environmental literacy.
It is important to remember that this survey and report are not an evaluation of the public, but rather a further collection of information concerning the knowledge about, attitudes toward, and behaviors related to the environment in Minnesota. This will be used with the previous report—and future reports—to track trends and changes in environmental literacy as Minnesota adults are surveyed again at various points in the future.
Second Minnesota Report Card on Environmental Literacy 9
Part 1 Environmental Knowledge To collect data about environmental knowledge, adult Minnesota residents were asked 13 fact-based questions to determine what they actually know about the environment. Eight of the questions surveyed general environmental knowledge (Questions 10 to 12, and 14 to 18). The remaining five questions deal with the specific issue of water (Questions 9, 13, 21, 24, and 25). Note, of the five questions dealing with water quality, two questions (Questions 9 and 13) are analyzed with the other water quality questions in this report. In the Minnesota Report Card on Environmental Literacy 2002, these same two water questions were analyzed within the general environmental knowledge set of questions.
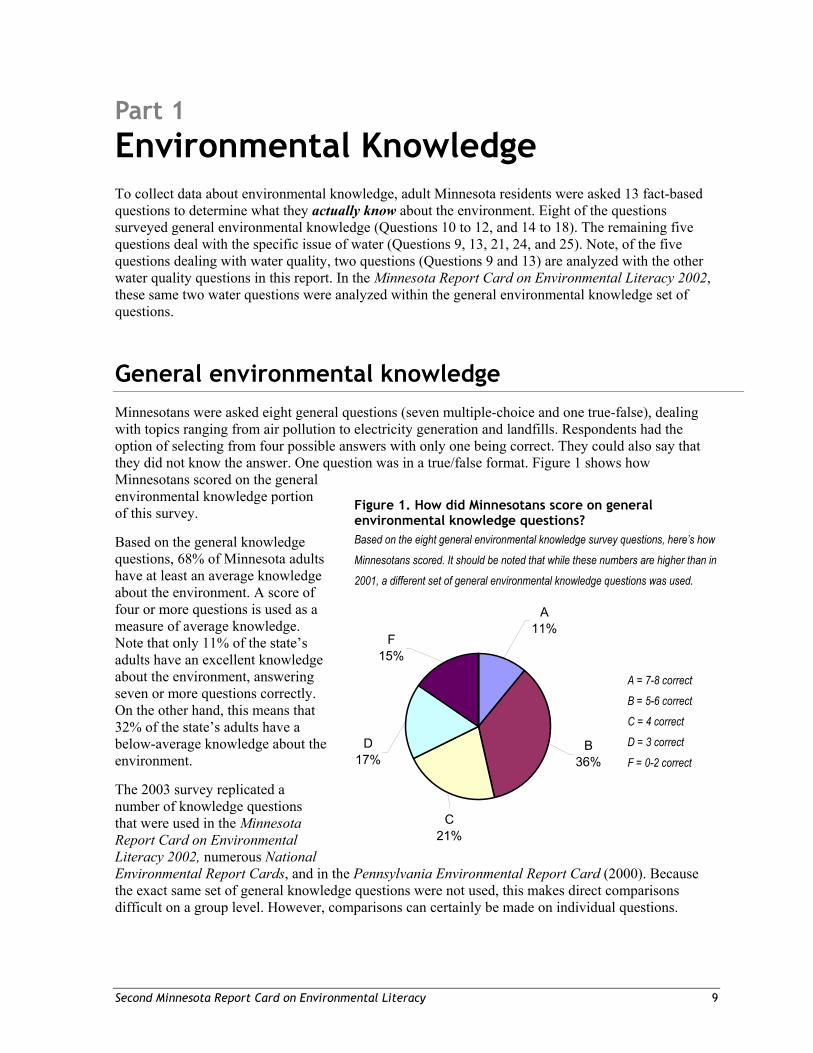
General environmental knowledge Minnesotans were asked eight general questions (seven multiple-choice and one true-false), dealing with topics ranging from air pollution to electricity generation and landfills. Respondents had the option of selecting from four possible answers with only one being correct. They could also say that they did not know the answer. One question was in a true/false format. Figure 1 shows how Minnesotans scored on the general environmental knowledge portion of this survey.
Based on the general knowledge questions, 68% of Minnesota adults have at least an average knowledge about the environment. A score of four or more questions is used as a measure of average knowledge. Note that only 11% of the state’s adults have an excellent knowledge about the environment, answering seven or more questions correctly. On the other hand, this means that 32% of the state’s adults have a below-average knowledge about the environment.
The 2003 survey replicated a number of knowledge questions that were used in the Minnesota Report Card on Environmental Literacy 2002, numerous National Environmental Report Cards, and in the Pennsylvania Environmental Report Card (2000). Because the exact same set of general knowledge questions were not used, this makes direct comparisons difficult on a group level. However, comparisons can certainly be made on individual questions.
Figure 1. How did Minnesotans score on general environmental knowledge questions? Based on the eight general environmental knowledge survey questions, here’s how
Minnesotans scored. It should be noted that while these numbers are higher than in
2001, a different set of general environmental knowledge questions was used.
B36%
A11%
F15%
D17%
C21%
A = 7-8 correct
B = 5-6 correct
C = 4 correct
D = 3 correct
F = 0-2 correct
10 Part 1 Environmental Knowledge
For direct comparisons of
raw frequencies,
a difference of five
percentage points is
considered significant.
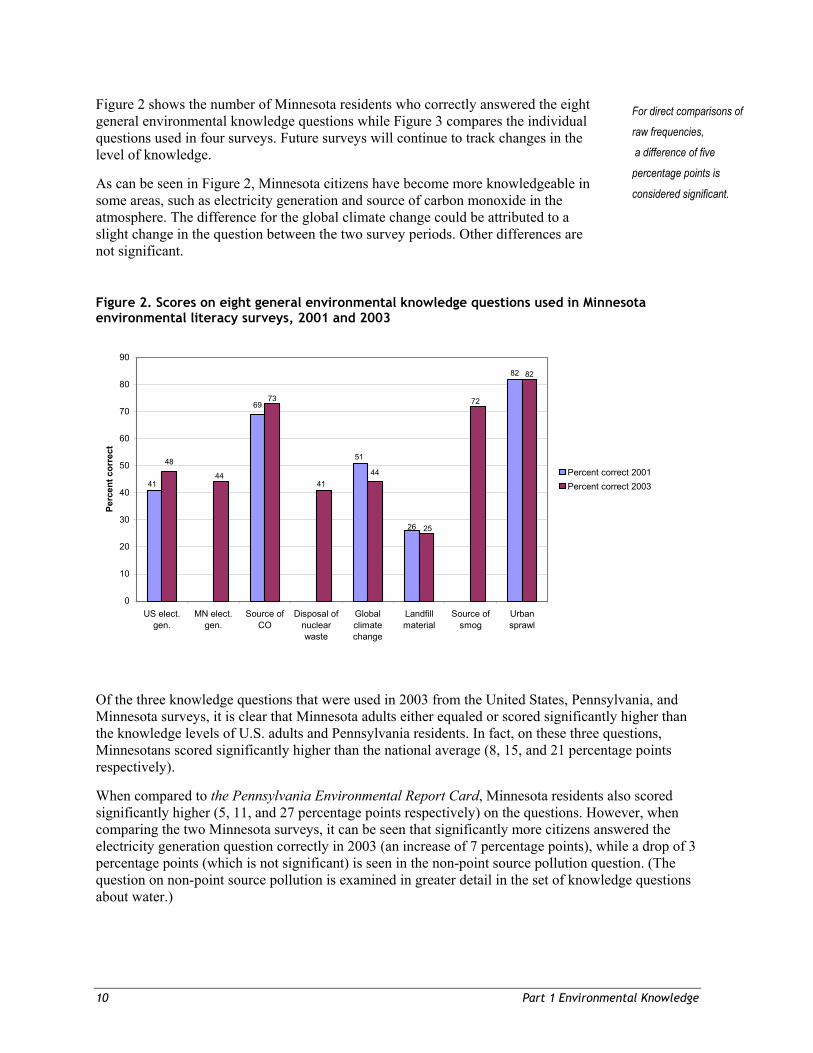
Figure 2 shows the number of Minnesota residents who correctly answered the eight general environmental knowledge questions while Figure 3 compares the individual questions used in four surveys. Future surveys will continue to track changes in the level of knowledge.
As can be seen in Figure 2, Minnesota citizens have become more knowledgeable in some areas, such as electricity generation and source of carbon monoxide in the atmosphere. The difference for the global climate change could be attributed to a slight change in the question between the two survey periods. Other differences are not significant.
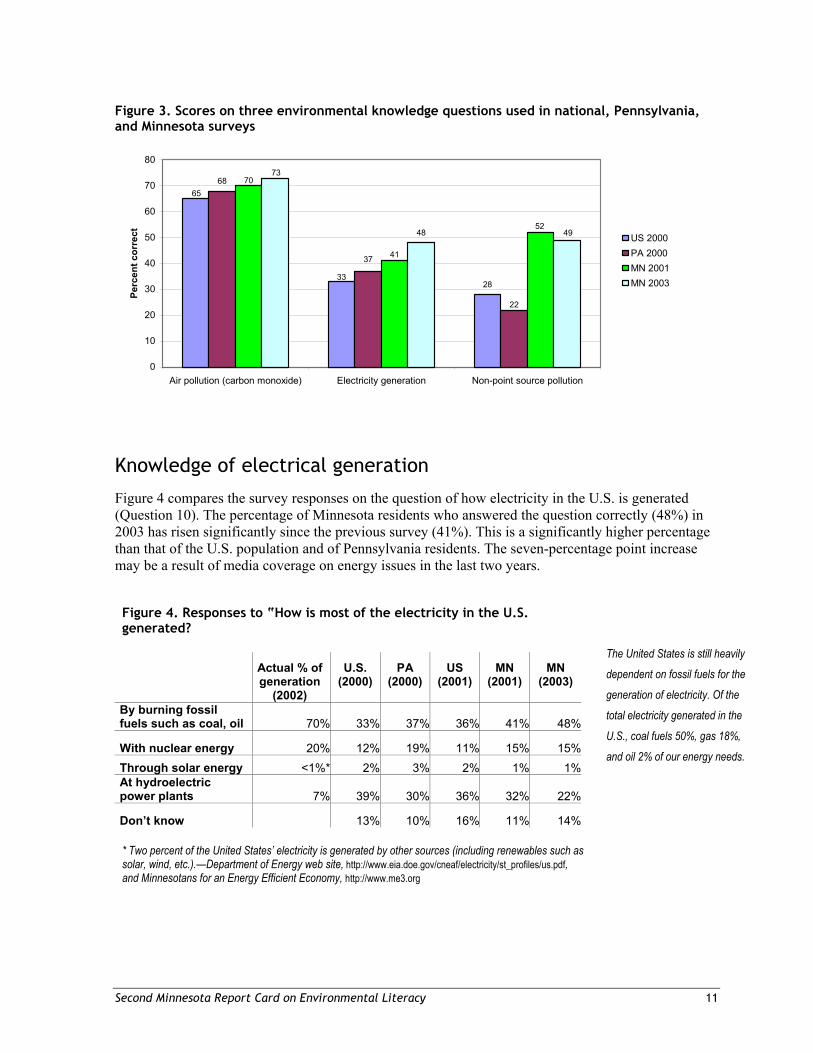
Of the three knowledge questions that were used in 2003 from the United States, Pennsylvania, and Minnesota surveys, it is clear that Minnesota adults either equaled or scored significantly higher than the knowledge levels of U.S. adults and Pennsylvania residents. In fact, on these three questions, Minnesotans scored significantly higher than the national average (8, 15, and 21 percentage points respectively).
When compared to the Pennsylvania Environmental Report Card, Minnesota residents also scored significantly higher (5, 11, and 27 percentage points respectively) on the questions. However, when comparing the two Minnesota surveys, it can be seen that significantly more citizens answered the electricity generation question correctly in 2003 (an increase of 7 percentage points), while a drop of 3 percentage points (which is not significant) is seen in the non-point source pollution question. (The question on non-point source pollution is examined in greater detail in the set of knowledge questions about water.)
Figure 2. Scores on eight general environmental knowledge questions used in Minnesota environmental literacy surveys, 2001 and 2003
69
4844
41
82
26
51
73
44
82
72
25
41
0
10
20
30
40
50
60
70
80
90
US elect.gen.
MN elect.gen.
Source ofCO
Disposal ofnuclearwaste
Globalclimatechange
Landfillmaterial
Source ofsmog
Urbansprawl
Perc
ent c
orre
ct
Percent correct 2001Percent correct 2003
Second Minnesota Report Card on Environmental Literacy 11
Knowledge of electrical generation
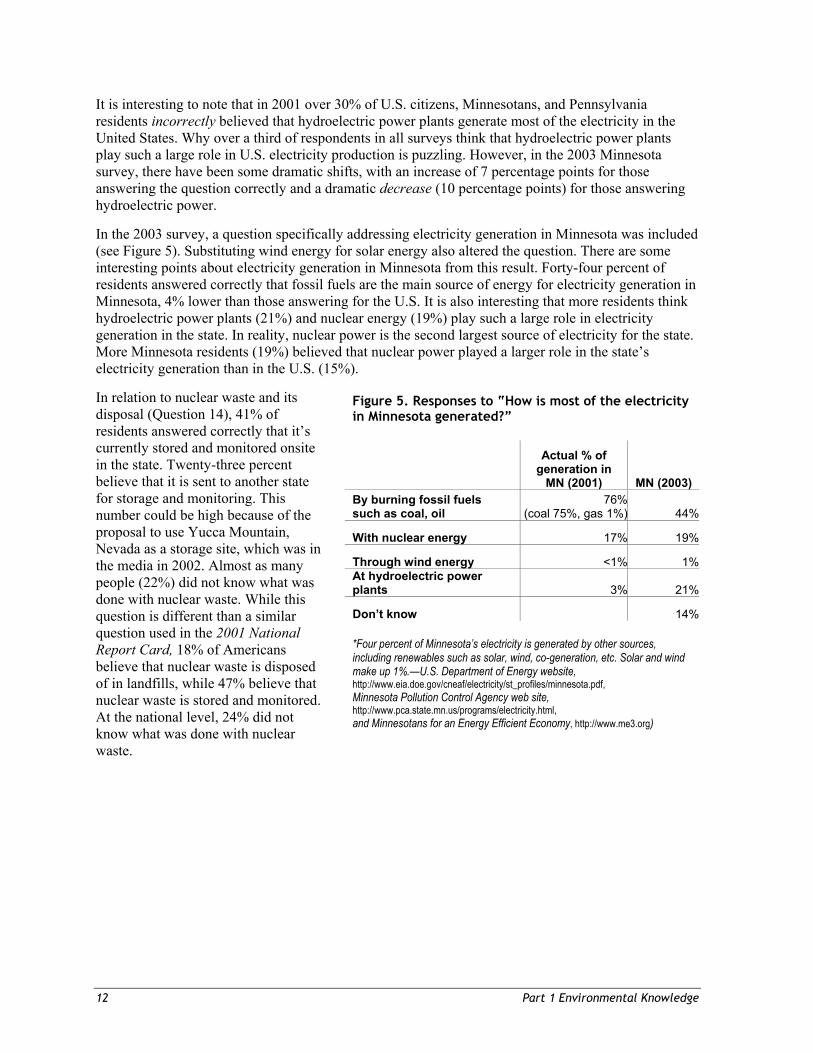
Figure 4 compares the survey responses on the question of how electricity in the U.S. is generated (Question 10). The percentage of Minnesota residents who answered the question correctly (48%) in 2003 has risen significantly since the previous survey (41%). This is a significantly higher percentage than that of the U.S. population and of Pennsylvania residents. The seven-percentage point increase may be a result of media coverage on energy issues in the last two years.
Figure 4. Responses to “How is most of the electricity in the U.S. generated?
Actual % of generation
(2002)
U.S. (2000)
PA (2000)
US (2001)
MN (2001)
MN (2003)
By burning fossil fuels such as coal, oil 70% 33% 37% 36% 41% 48%
With nuclear energy 20% 12% 19% 11% 15% 15%Through solar energy <1%* 2% 3% 2% 1% 1%At hydroelectric power plants 7% 39% 30% 36% 32% 22%
Don’t know 13% 10% 16% 11% 14%
The United States is still heavily
dependent on fossil fuels for the
generation of electricity. Of the
total electricity generated in the
U.S., coal fuels 50%, gas 18%,
and oil 2% of our energy needs.
* Two percent of the United States’ electricity is generated by other sources (including renewables such as solar, wind, etc.).—Department of Energy web site, http://www.eia.doe.gov/cneaf/electricity/st_profiles/us.pdf, and Minnesotans for an Energy Efficient Economy, http://www.me3.org
Figure 3. Scores on three environmental knowledge questions used in national, Pennsylvania, and Minnesota surveys
28
68
48
65
33
37
22
70
41
52
73
49
0
10
20
30
40
50
60
70
80
Air pollution (carbon monoxide) Electricity generation Non-point source pollution
Perc
ent c
orre
ct US 2000PA 2000MN 2001MN 2003
12 Part 1 Environmental Knowledge
It is interesting to note that in 2001 over 30% of U.S. citizens, Minnesotans, and Pennsylvania residents incorrectly believed that hydroelectric power plants generate most of the electricity in the United States. Why over a third of respondents in all surveys think that hydroelectric power plants play such a large role in U.S. electricity production is puzzling. However, in the 2003 Minnesota survey, there have been some dramatic shifts, with an increase of 7 percentage points for those answering the question correctly and a dramatic decrease (10 percentage points) for those answering hydroelectric power.
In the 2003 survey, a question specifically addressing electricity generation in Minnesota was included (see Figure 5). Substituting wind energy for solar energy also altered the question. There are some interesting points about electricity generation in Minnesota from this result. Forty-four percent of residents answered correctly that fossil fuels are the main source of energy for electricity generation in Minnesota, 4% lower than those answering for the U.S. It is also interesting that more residents think hydroelectric power plants (21%) and nuclear energy (19%) play such a large role in electricity generation in the state. In reality, nuclear power is the second largest source of electricity for the state. More Minnesota residents (19%) believed that nuclear power played a larger role in the state’s electricity generation than in the U.S. (15%).
In relation to nuclear waste and its disposal (Question 14), 41% of residents answered correctly that it’s currently stored and monitored onsite in the state. Twenty-three percent believe that it is sent to another state for storage and monitoring. This number could be high because of the proposal to use Yucca Mountain, Nevada as a storage site, which was in the media in 2002. Almost as many people (22%) did not know what was done with nuclear waste. While this question is different than a similar question used in the 2001 National Report Card, 18% of Americans believe that nuclear waste is disposed of in landfills, while 47% believe that nuclear waste is stored and monitored. At the national level, 24% did not know what was done with nuclear waste.
Figure 5. Responses to “How is most of the electricity in Minnesota generated?”
Actual % of generation in
MN (2001) MN (2003) By burning fossil fuels such as coal, oil
76%(coal 75%, gas 1%) 44%
With nuclear energy 17% 19%
Through wind energy <1% 1%At hydroelectric power plants 3% 21%
Don’t know 14%
*Four percent of Minnesota’s electricity is generated by other sources, including renewables such as solar, wind, co-generation, etc. Solar and wind make up 1%.—U.S. Department of Energy website, http://www.eia.doe.gov/cneaf/electricity/st_profiles/minnesota.pdf, Minnesota Pollution Control Agency web site, http://www.pca.state.mn.us/programs/electricity.html, and Minnesotans for an Energy Efficient Economy, http://www.me3.org)
Second Minnesota Report Card on Environmental Literacy 13
Knowledge of landfill material
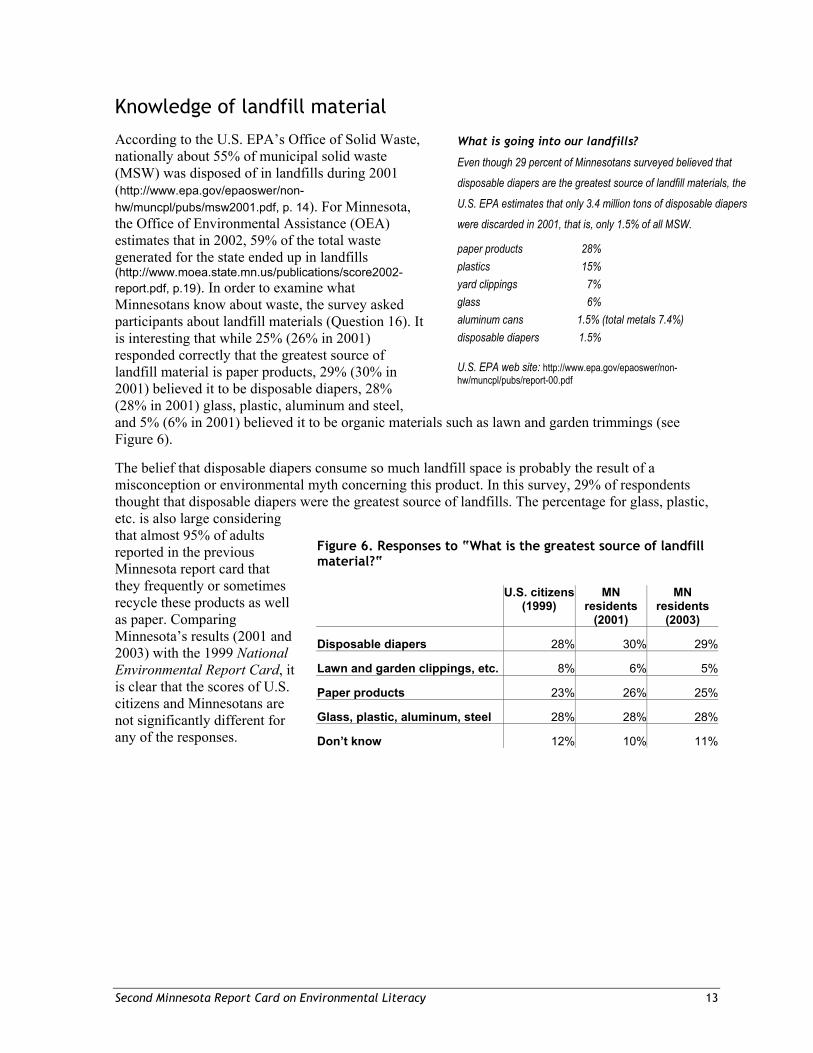
According to the U.S. EPA’s Office of Solid Waste, nationally about 55% of municipal solid waste (MSW) was disposed of in landfills during 2001 (http://www.epa.gov/epaoswer/non-hw/muncpl/pubs/msw2001.pdf, p. 14). For Minnesota, the Office of Environmental Assistance (OEA) estimates that in 2002, 59% of the total waste generated for the state ended up in landfills (http://www.moea.state.mn.us/publications/score2002-report.pdf, p.19). In order to examine what Minnesotans know about waste, the survey asked participants about landfill materials (Question 16). It is interesting that while 25% (26% in 2001) responded correctly that the greatest source of landfill material is paper products, 29% (30% in 2001) believed it to be disposable diapers, 28% (28% in 2001) glass, plastic, aluminum and steel, and 5% (6% in 2001) believed it to be organic materials such as lawn and garden trimmings (see Figure 6).
The belief that disposable diapers consume so much landfill space is probably the result of a misconception or environmental myth concerning this product. In this survey, 29% of respondents thought that disposable diapers were the greatest source of landfills. The percentage for glass, plastic, etc. is also large considering that almost 95% of adults reported in the previous Minnesota report card that they frequently or sometimes recycle these products as well as paper. Comparing Minnesota’s results (2001 and 2003) with the 1999 National Environmental Report Card, it is clear that the scores of U.S. citizens and Minnesotans are not significantly different for any of the responses.
Figure 6. Responses to “What is the greatest source of landfill material?“
U.S. citizens (1999)
MN residents
(2001)
MN residents
(2003)
Disposable diapers 28% 30% 29%
Lawn and garden clippings, etc. 8% 6% 5%
Paper products 23% 26% 25%
Glass, plastic, aluminum, steel 28% 28% 28%
Don’t know 12% 10% 11%
What is going into our landfills?
Even though 29 percent of Minnesotans surveyed believed that
disposable diapers are the greatest source of landfill materials, the
U.S. EPA estimates that only 3.4 million tons of disposable diapers
were discarded in 2001, that is, only 1.5% of all MSW.
paper products 28% plastics 15% yard clippings 7% glass 6% aluminum cans 1.5% (total metals 7.4%) disposable diapers 1.5%
U.S. EPA web site: http://www.epa.gov/epaoswer/non-hw/muncpl/pubs/report-00.pdf
14 Part 1 Environmental Knowledge
Demographics
The Pearson Chi-Square determines a statistical relationship between two variables, in this case, demographics and the questions. Significant differences were found in gender, age, education, and income for this set of general environmental questions. As in the 2001 survey, location did not make a significant difference.
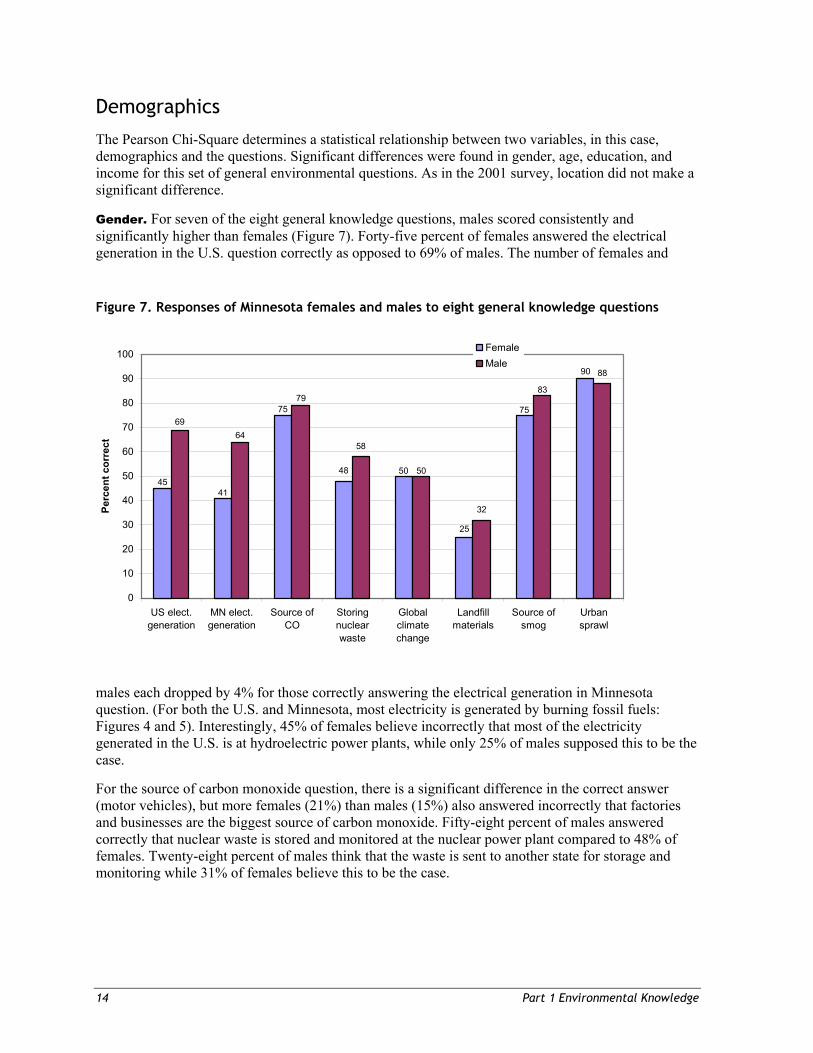
Gender. For seven of the eight general knowledge questions, males scored consistently and significantly higher than females (Figure 7). Forty-five percent of females answered the electrical generation in the U.S. question correctly as opposed to 69% of males. The number of females and
males each dropped by 4% for those correctly answering the electrical generation in Minnesota question. (For both the U.S. and Minnesota, most electricity is generated by burning fossil fuels: Figures 4 and 5). Interestingly, 45% of females believe incorrectly that most of the electricity generated in the U.S. is at hydroelectric power plants, while only 25% of males supposed this to be the case.
For the source of carbon monoxide question, there is a significant difference in the correct answer (motor vehicles), but more females (21%) than males (15%) also answered incorrectly that factories and businesses are the biggest source of carbon monoxide. Fifty-eight percent of males answered correctly that nuclear waste is stored and monitored at the nuclear power plant compared to 48% of females. Twenty-eight percent of males think that the waste is sent to another state for storage and monitoring while 31% of females believe this to be the case.
Figure 7. Responses of Minnesota females and males to eight general knowledge questions
48
58
32
88
4145
75
50
90
75
25
6469
79
50
83
0
10
20
30
40
50
60
70
80
90
100
US elect.generation
MN elect.generation
Source ofCO
Storingnuclearwaste
Globalclimatechange
Landfillmaterials
Source ofsmog
Urbansprawl
Perc
ent c
orre
ct
FemaleMale
Second Minnesota Report Card on Environmental Literacy 15
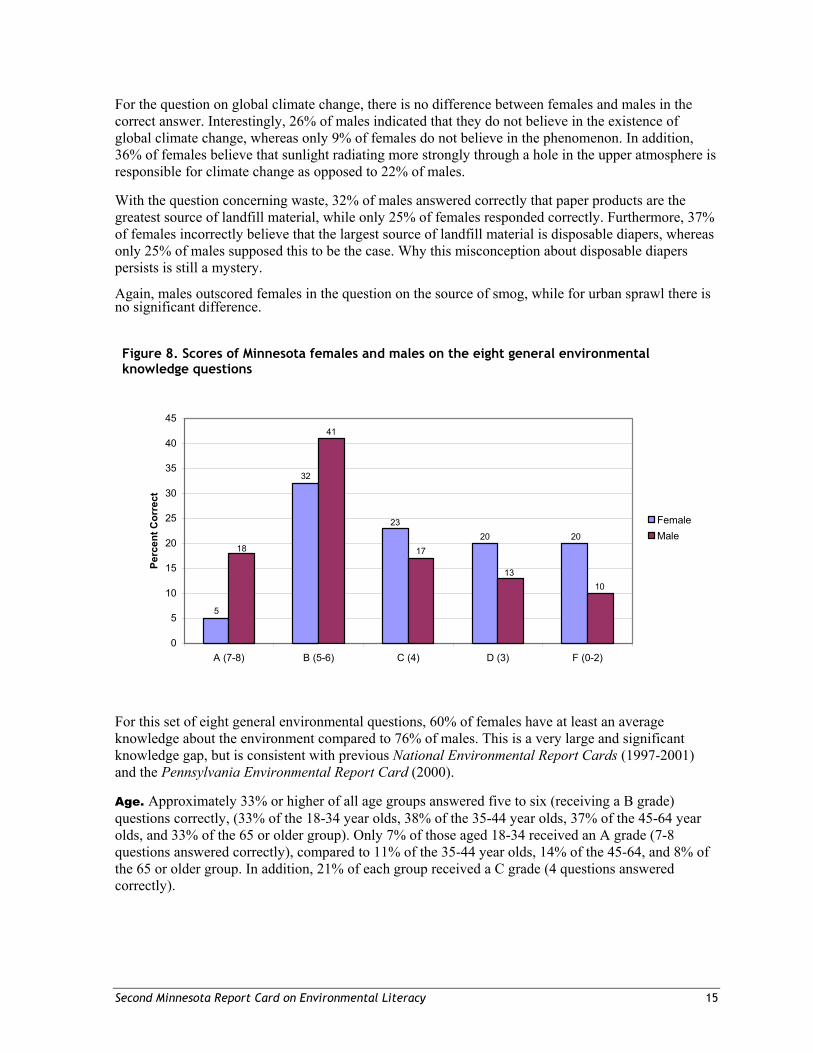
For the question on global climate change, there is no difference between females and males in the correct answer. Interestingly, 26% of males indicated that they do not believe in the existence of global climate change, whereas only 9% of females do not believe in the phenomenon. In addition, 36% of females believe that sunlight radiating more strongly through a hole in the upper atmosphere is responsible for climate change as opposed to 22% of males.
With the question concerning waste, 32% of males answered correctly that paper products are the greatest source of landfill material, while only 25% of females responded correctly. Furthermore, 37% of females incorrectly believe that the largest source of landfill material is disposable diapers, whereas only 25% of males supposed this to be the case. Why this misconception about disposable diapers persists is still a mystery.
Again, males outscored females in the question on the source of smog, while for urban sprawl there is no significant difference.
Figure 8. Scores of Minnesota females and males on the eight general environmental knowledge questions
For this set of eight general environmental questions, 60% of females have at least an average knowledge about the environment compared to 76% of males. This is a very large and significant knowledge gap, but is consistent with previous National Environmental Report Cards (1997-2001) and the Pennsylvania Environmental Report Card (2000).
Age. Approximately 33% or higher of all age groups answered five to six (receiving a B grade) questions correctly, (33% of the 18-34 year olds, 38% of the 35-44 year olds, 37% of the 45-64 year olds, and 33% of the 65 or older group). Only 7% of those aged 18-34 received an A grade (7-8 questions answered correctly), compared to 11% of the 35-44 year olds, 14% of the 45-64, and 8% of the 65 or older group. In addition, 21% of each group received a C grade (4 questions answered correctly).
5
32
2320 20
41
18 17
1310
0
5
10
15
20
25
30
35
40
45
A (7-8) B (5-6) C (4) D (3) F (0-2)
Perc
ent C
orre
ct
FemaleMale
16 Part 1 Environmental Knowledge
It is not surprising that residents now aged 45 to 64 are more environmentally knowledgeable (72% compared to 70% of the 35-44 year olds, 62% for 65 or older, and 60% for 18-34 year olds). They were 30 years younger when the environmental movement flourished with the foundation of Earth Day and created a new awareness about the need to preserve and maintain the environment. It was also during the late ’60s and early ’70s that much of the environmental legislation, policy, and education was formulated and enacted both nationally and at the state level. Although environmental legislation, policy, and education have continued to be important issues in society, it is interesting to note that the younger adult group (ages 18-34) scored the lowest on the general environmental knowledge questions.
Education. Level of education is significant in responding correctly to the knowledge questions in the survey. Minnesotans with a college degree (bachelor’s degree or above) scored significantly higher than those with either some college or a high school education. Thirteen percent of those with a college degree or above received an A grade, compared to 6% and 3% for those with some college education and high school, respectively. A similar pattern exists for the B grade. Of those with a college education, only 15% got a failing grade, compared to 22% and 36% for those with some college education and high school, respectively. There is no significant difference between the two surveys regarding level of knowledge and level of education.
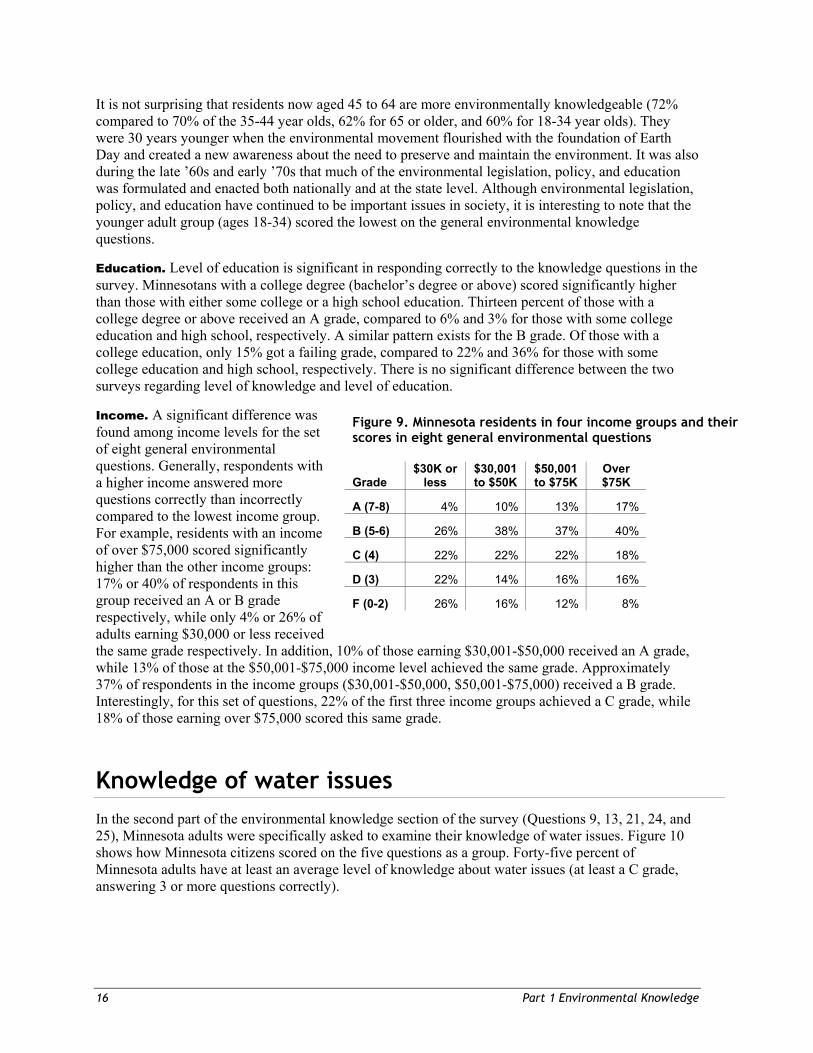
Income. A significant difference was found among income levels for the set of eight general environmental questions. Generally, respondents with a higher income answered more questions correctly than incorrectly compared to the lowest income group. For example, residents with an income of over $75,000 scored significantly higher than the other income groups: 17% or 40% of respondents in this group received an A or B grade respectively, while only 4% or 26% of adults earning $30,000 or less received the same grade respectively. In addition, 10% of those earning $30,001-$50,000 received an A grade, while 13% of those at the $50,001-$75,000 income level achieved the same grade. Approximately 37% of respondents in the income groups ($30,001-$50,000, $50,001-$75,000) received a B grade. Interestingly, for this set of questions, 22% of the first three income groups achieved a C grade, while 18% of those earning over $75,000 scored this same grade.
Knowledge of water issues In the second part of the environmental knowledge section of the survey (Questions 9, 13, 21, 24, and 25), Minnesota adults were specifically asked to examine their knowledge of water issues. Figure 10 shows how Minnesota citizens scored on the five questions as a group. Forty-five percent of Minnesota adults have at least an average level of knowledge about water issues (at least a C grade, answering 3 or more questions correctly).
Figure 9. Minnesota residents in four income groups and their scores in eight general environmental questions
Grade $30K or
less $30,001 to $50K
$50,001 to $75K
Over $75K
A (7-8) 4% 10% 13% 17%
B (5-6) 26% 38% 37% 40%
C (4) 22% 22% 22% 18%
D (3) 22% 14% 16% 16%
F (0-2) 26% 16% 12% 8%
Second Minnesota Report Card on Environmental Literacy 17
Almost a quarter of residents (23%) received a failing grade (0 to 1 question correct) and an additional 32% answered only two questions correctly. While residents generally scored well2 on specific questions, when the water questions are grouped, only 45% of residents have at least an average or passing knowledge (C or above grades) of water issues in the state. When examining how to educate residents about water issues, it might be worth considering this level of knowledge of residents.
Figure 11 shows the responses of Minnesota residents to the five water questions asked in this survey. It is interesting that over 60% of Minnesota residents knew the main benefit of wetlands was helping and storing water before it enters lakes and streams. However, 17% of respondents did not know what the main benefit of these areas was, even given four options.
The source of mercury that ends up in lakes gave some interesting results. Twenty-two percent answered correctly that the largest source in Minnesota of mercury is coal-burning power plants. However, 23% believed that it was from incinerating batteries, and 16% answered that it was from motor vehicle exhausts. Thirty-seven percent did not know the source.
There is one comparison from 2001on the non-point source water pollution question. It can be seen that there is a drop of 3 percentage points in the number of respondents answering this question correctly. However, this drop is not statistically significant.
Fifty-three percent of residents answered correctly that water entering storm sewers goes into lakes, rivers, and wetlands, while 19% believe that it goes to 2 For the purposes of this report, scoring well is defined as 50% or higher of Minnesota residents giving the correct answer to a question.
Figure 10. How did Minnesotans score on questions about water?
For this set of questions, the following grading system was developed: A = 5 correct B = 4 correct C = 3 correct D = 2 correct F = 0-1 correct
Figure 11. Scores on five water knowledge questions used in Minnesota surveys, 2001 and 2003
F23%
D32%
C25%
B16%
A4%
5249
61
22
53
45
0
10
20
30
40
50
60
70
Non-pointpollution
Benefits ofwetlands
Mercury inlakes
Storm sewers Impact ofphosphorous
Perc
ent c
orre
ct
20012003
18 Part 1 Environmental Knowledge
wastewater treatment plants and 18% into groundwater. Nine percent of respondents did not know the destination of this water.
Forty-five percent of Minnesota residents answered correctly that the major environmental impact of phosphorous is that it promotes excessive plant and algae growth in lakes and rivers. Thirty percent believe that the major environmental impact of phosphorous is polluting groundwater; while 10% answered that the major environmental impact of phosphorous is that it is poisonous to fish. Fourteen percent of the respondents did not know the major environmental impact of phosphorous.
Demographics
The Pearson Chi-Square determines a statistical relationship between two variables, in this case, demographics and the questions.
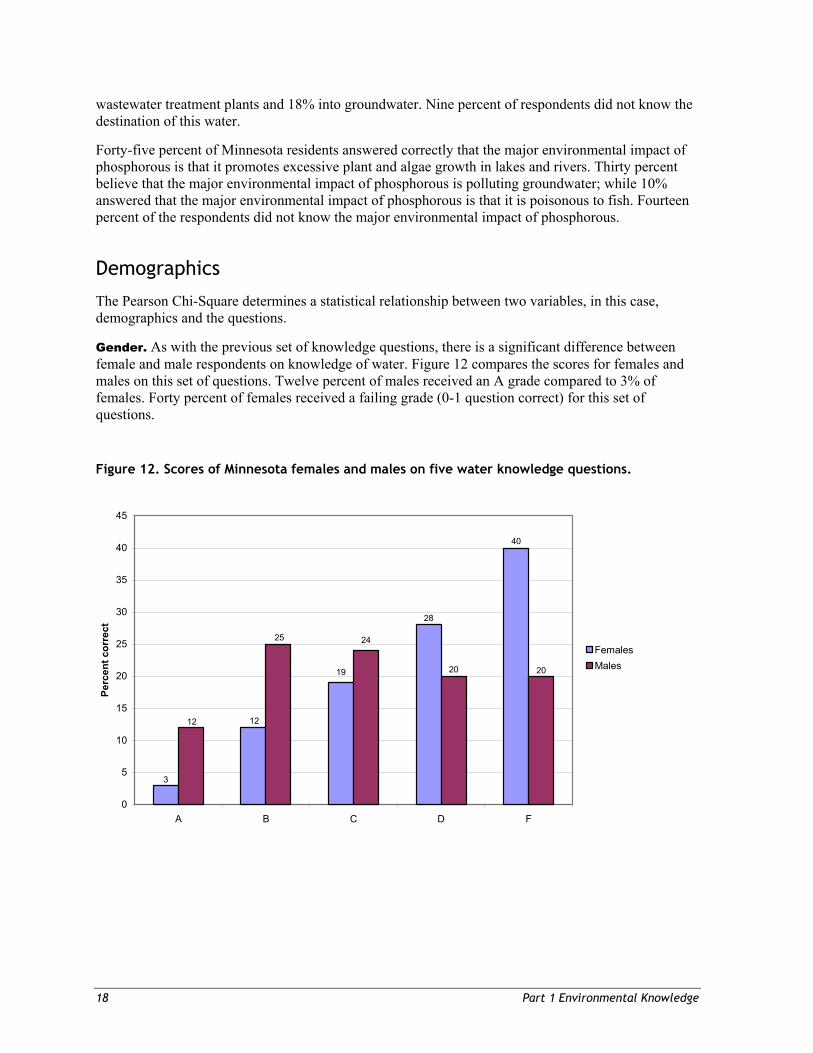
Gender. As with the previous set of knowledge questions, there is a significant difference between female and male respondents on knowledge of water. Figure 12 compares the scores for females and males on this set of questions. Twelve percent of males received an A grade compared to 3% of females. Forty percent of females received a failing grade (0-1 question correct) for this set of questions.
Figure 12. Scores of Minnesota females and males on five water knowledge questions.
19
24
40
28
12
3
2020
25
12
0
5
10
15
20
25
30
35
40
45
A B C D F
Perc
ent c
orre
ct
FemalesMales
Second Minnesota Report Card on Environmental Literacy 19
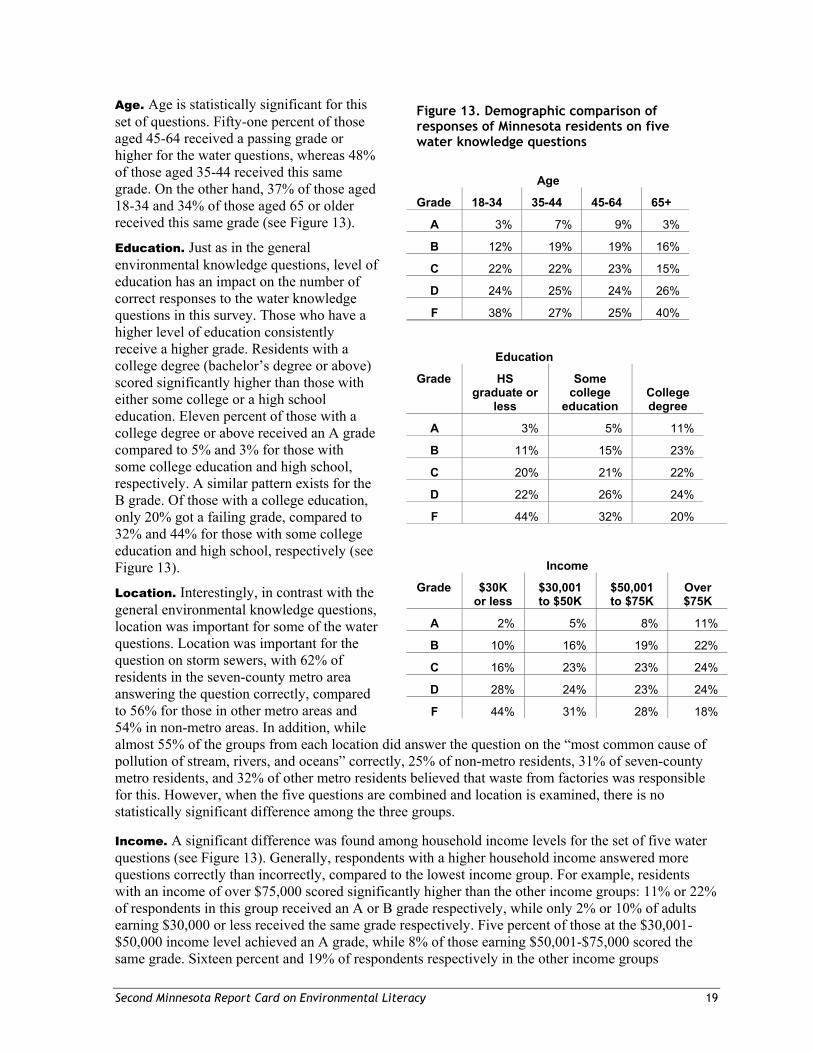
Age. Age is statistically significant for this set of questions. Fifty-one percent of those aged 45-64 received a passing grade or higher for the water questions, whereas 48% of those aged 35-44 received this same grade. On the other hand, 37% of those aged 18-34 and 34% of those aged 65 or older received this same grade (see Figure 13).
Education. Just as in the general environmental knowledge questions, level of education has an impact on the number of correct responses to the water knowledge questions in this survey. Those who have a higher level of education consistently receive a higher grade. Residents with a college degree (bachelor’s degree or above) scored significantly higher than those with either some college or a high school education. Eleven percent of those with a college degree or above received an A grade compared to 5% and 3% for those with some college education and high school, respectively. A similar pattern exists for the B grade. Of those with a college education, only 20% got a failing grade, compared to 32% and 44% for those with some college education and high school, respectively (see Figure 13).
Location. Interestingly, in contrast with the general environmental knowledge questions, location was important for some of the water questions. Location was important for the question on storm sewers, with 62% of residents in the seven-county metro area answering the question correctly, compared to 56% for those in other metro areas and 54% in non-metro areas. In addition, while almost 55% of the groups from each location did answer the question on the “most common cause of pollution of stream, rivers, and oceans” correctly, 25% of non-metro residents, 31% of seven-county metro residents, and 32% of other metro residents believed that waste from factories was responsible for this. However, when the five questions are combined and location is examined, there is no statistically significant difference among the three groups.
Income. A significant difference was found among household income levels for the set of five water questions (see Figure 13). Generally, respondents with a higher household income answered more questions correctly than incorrectly, compared to the lowest income group. For example, residents with an income of over $75,000 scored significantly higher than the other income groups: 11% or 22% of respondents in this group received an A or B grade respectively, while only 2% or 10% of adults earning $30,000 or less received the same grade respectively. Five percent of those at the $30,001-$50,000 income level achieved an A grade, while 8% of those earning $50,001-$75,000 scored the same grade. Sixteen percent and 19% of respondents respectively in the other income groups
Figure 13. Demographic comparison of responses of Minnesota residents on five water knowledge questions
Age
Grade 18-34 35-44 45-64 65+
A 3% 7% 9% 3%
B 12% 19% 19% 16%
C 22% 22% 23% 15%
D 24% 25% 24% 26%
F 38% 27% 25% 40%
Education
Grade HS graduate or
less
Some college
education College degree
A 3% 5% 11%
B 11% 15% 23%
C 20% 21% 22%
D 22% 26% 24%
F 44% 32% 20%
Income
Grade $30K or less
$30,001 to $50K
$50,001 to $75K
Over $75K
A 2% 5% 8% 11%
B 10% 16% 19% 22%
C 16% 23% 23% 24%
D 28% 24% 23% 24%
F 44% 31% 28% 18%
20 Part 1 Environmental Knowledge
($30,001-$50,000, $50,001-$75,000) received a B grade. The number of those who received a C grade was not as disparate, 16% of those earning $30,000 or less received this grade, while 23 to 24% of those in the other income groups got three questions correct. Those who received a failing grade were inversely proportional to their level of income ($30,000 or less 44%; $30,001-$50,000 31%; $50,001-$75,000 28%; over $75,000 18%).
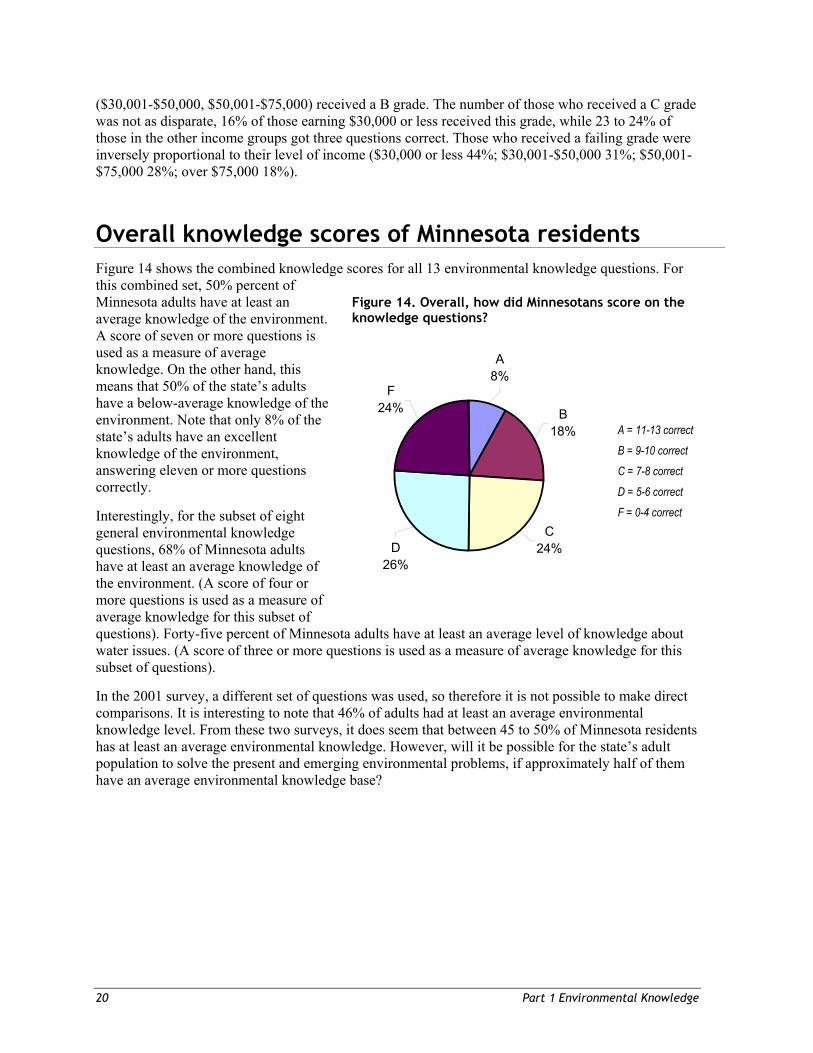
Overall knowledge scores of Minnesota residents Figure 14 shows the combined knowledge scores for all 13 environmental knowledge questions. For this combined set, 50% percent of Minnesota adults have at least an average knowledge of the environment. A score of seven or more questions is used as a measure of average knowledge. On the other hand, this means that 50% of the state’s adults have a below-average knowledge of the environment. Note that only 8% of the state’s adults have an excellent knowledge of the environment, answering eleven or more questions correctly.
Interestingly, for the subset of eight general environmental knowledge questions, 68% of Minnesota adults have at least an average knowledge of the environment. (A score of four or more questions is used as a measure of average knowledge for this subset of questions). Forty-five percent of Minnesota adults have at least an average level of knowledge about water issues. (A score of three or more questions is used as a measure of average knowledge for this subset of questions).
In the 2001 survey, a different set of questions was used, so therefore it is not possible to make direct comparisons. It is interesting to note that 46% of adults had at least an average environmental knowledge level. From these two surveys, it does seem that between 45 to 50% of Minnesota residents has at least an average environmental knowledge. However, will it be possible for the state’s adult population to solve the present and emerging environmental problems, if approximately half of them have an average environmental knowledge base?
Figure 14. Overall, how did Minnesotans score on the knowledge questions?
A = 11-13 correct
B = 9-10 correct
C = 7-8 correct
D = 5-6 correct
F = 0-4 correct
F24%
D 26%
C24%
B 18%
A8%
Second Minnesota Report Card on Environmental Literacy 21
Demographics
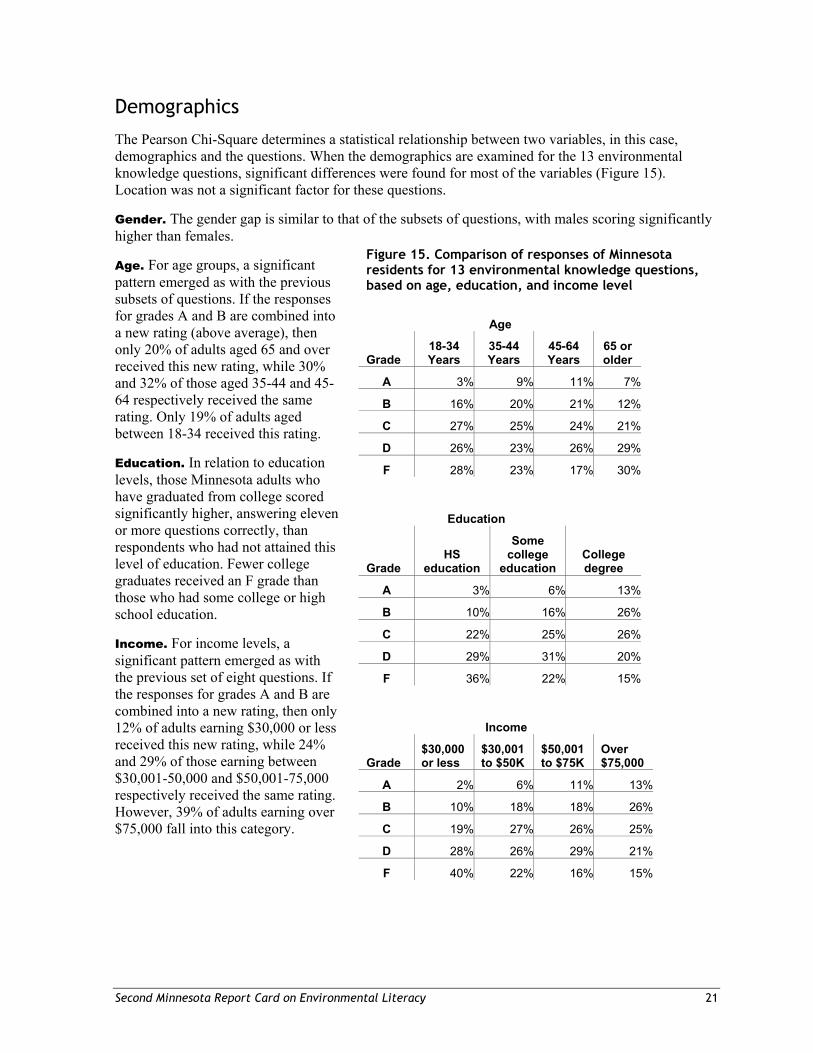
The Pearson Chi-Square determines a statistical relationship between two variables, in this case, demographics and the questions. When the demographics are examined for the 13 environmental knowledge questions, significant differences were found for most of the variables (Figure 15). Location was not a significant factor for these questions.
Gender. The gender gap is similar to that of the subsets of questions, with males scoring significantly higher than females.
Age. For age groups, a significant pattern emerged as with the previous subsets of questions. If the responses for grades A and B are combined into a new rating (above average), then only 20% of adults aged 65 and over received this new rating, while 30% and 32% of those aged 35-44 and 45-64 respectively received the same rating. Only 19% of adults aged between 18-34 received this rating.
Education. In relation to education levels, those Minnesota adults who have graduated from college scored significantly higher, answering eleven or more questions correctly, than respondents who had not attained this level of education. Fewer college graduates received an F grade than those who had some college or high school education.
Income. For income levels, a significant pattern emerged as with the previous set of eight questions. If the responses for grades A and B are combined into a new rating, then only 12% of adults earning $30,000 or less received this new rating, while 24% and 29% of those earning between $30,001-50,000 and $50,001-75,000 respectively received the same rating. However, 39% of adults earning over $75,000 fall into this category.
Figure 15. Comparison of responses of Minnesota residents for 13 environmental knowledge questions, based on age, education, and income level
Age
Grade 18-34 Years
35-44 Years
45-64 Years
65 or older
A 3% 9% 11% 7%
B 16% 20% 21% 12%
C 27% 25% 24% 21%
D 26% 23% 26% 29%
F 28% 23% 17% 30%
Education
Grade HS
education
Some college
education College degree
A 3% 6% 13%
B 10% 16% 26%
C 22% 25% 26%
D 29% 31% 20%
F 36% 22% 15%
Income
Grade $30,000 or less
$30,001to $50K
$50,001to $75K
Over $75,000
A 2% 6% 11% 13%
B 10% 18% 18% 26%
C 19% 27% 26% 25%
D 28% 26% 29% 21%
F 40% 22% 16% 15%
22 Part 1 Environmental Knowledge
Self-reported knowledge of environmental issues Minnesota adults were asked how much they themselves feel they know about environmental issues and problems (Question 1). Responses ranged from “a lot,” “a fair amount,” “only a little,” or “practically nothing.”
Combining the categories “a lot” and “a fair amount” to represent a high level of self-reported knowledge about environmental issues, and “only a little” and “practically nothing” to represent a low level of self-reported knowledge about issues, it can be seen that almost 60% of Minnesotans believe that they are knowledgeable about these issues, down 5 percentage points from the 2001 survey. Contrast this with the fact that only 8% received an A grade on the environmental knowledge questions, a decrease of 2 percentage points from the previous survey. In the 2000 National Environmental Report Card, 70% of U.S. citizens believed that they were knowledgeable about environmental issues but only 10% actually received an A grade, answering 11 to 12 of the knowledge questions used in that survey correctly.
It is interesting to note that 60% of Minnesota adults believe that they are knowledgeable about environmental issues, yet only 26% have an above-average knowledge score on the 13 general environmental knowledge questions (9-13 correct).
Demographics
The Pearson Chi-Square determines a statistical relationship between two variables, in this case, demographics and the questions. As in 2001, a significant difference was not found based on location for this question.
Gender. Significantly, 70% percent of males (77% in 2001) believe that they are knowledgeable about environmental issues, but only 53% of females (56% in 2001) believe that they are knowledgeable about these issues. For males, this represents a significant drop between the two survey periods. This self-reported lack of knowledge about environmental issues reflects the gender gap where 60% of males and only 37% of females correctly answered five or more of the eight general environmental questions.
Age. Unlike the previous survey, differences are significant across the age groups for this question. Sixty-five percent of respondents in the 45-64 age group believe that they are knowledgeable about environmental issues, compared to 50% for those in the 18-34 age group. While 59% and 62% of those in the 35-44 and 65 or older age groups believe they are knowledgeable about the environment.
Education. Education is a significant factor in respondents’ beliefs about their knowledge of environmental issues. Seventy-one percent of respondents who have graduated from college reported that they are knowledgeable about the environment (compared to 75% in 2001), as opposed to 56% for those with some college education (compared to 66% in 2001) and 48% (compared to 51% in 2001) for those who had a high school education or less. The most significant difference for this group is with those who had some college education. There is a significant decrease (10%) between the two surveys in respondents who believe they are knowledgeable about the environment.
In 2001, 16% of college graduates reported that they knew “a lot” about environmental problems and issues compared to 9% for those with some college and 8% for those with high school education or less. In 2003, 12% of college graduates reported that they know “a lot” about environmental problems and issues compared to 7% for those with some college and 4% for those with high school education or less.
Second Minnesota Report Card on Environmental Literacy 23
Income. As in 2001, significantly, more respondents in the higher income bracket than any other group believe they are knowledgeable about environmental issues and problems. In 2003, the percentage of adults who reported that they had environmental knowledge increased from a low of 49% (54% in 2001) for those earning $30,000 or less to 67% (75% in 2001) for those earning more than $75,000. For the other income groups ($30,001- $50,000 and $50,001- $75,000), 64% and 63% respectively reported that they are knowledgeable about environmental issues and problems. This pattern is also followed for the number of adults in these income groups who received a B grade or higher grade in environmental knowledge.
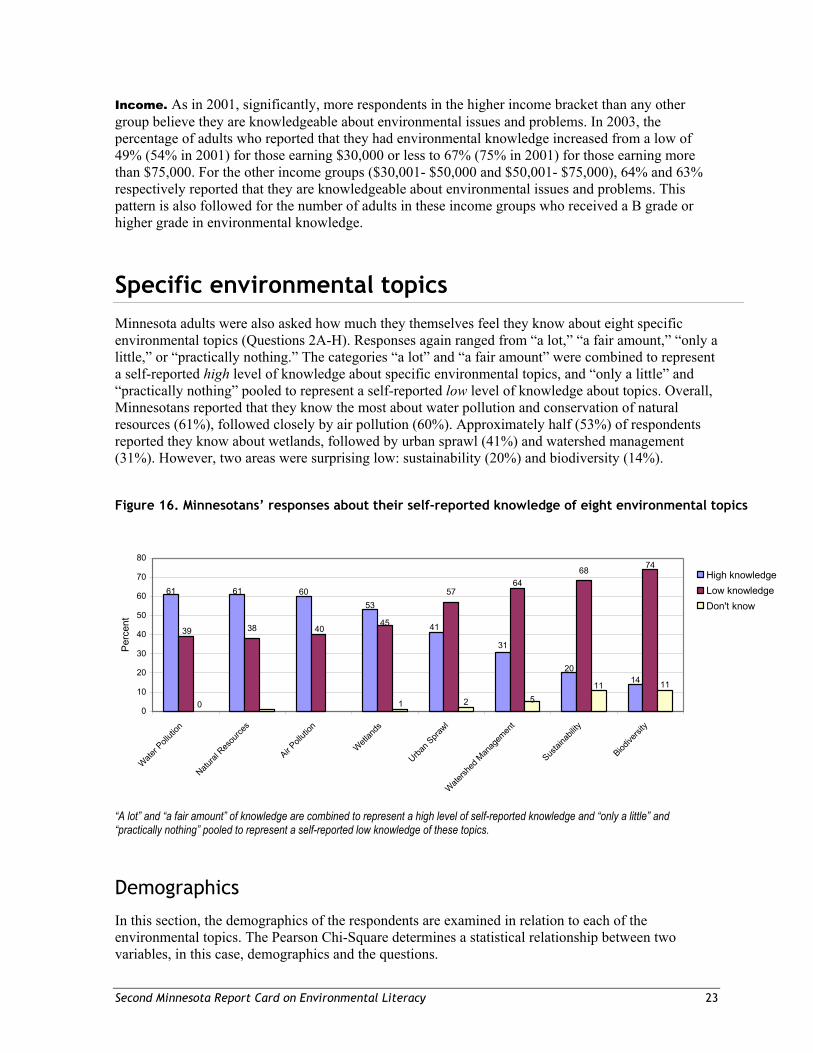
Specific environmental topics Minnesota adults were also asked how much they themselves feel they know about eight specific environmental topics (Questions 2A-H). Responses again ranged from “a lot,” “a fair amount,” “only a little,” or “practically nothing.” The categories “a lot” and “a fair amount” were combined to represent a self-reported high level of knowledge about specific environmental topics, and “only a little” and “practically nothing” pooled to represent a self-reported low level of knowledge about topics. Overall, Minnesotans reported that they know the most about water pollution and conservation of natural resources (61%), followed closely by air pollution (60%). Approximately half (53%) of respondents reported they know about wetlands, followed by urban sprawl (41%) and watershed management (31%). However, two areas were surprising low: sustainability (20%) and biodiversity (14%).
Figure 16. Minnesotans’ responses about their self-reported knowledge of eight environmental topics
“A lot” and “a fair amount” of knowledge are combined to represent a high level of self-reported knowledge and “only a little” and “practically nothing” pooled to represent a self-reported low knowledge of these topics.
Demographics
In this section, the demographics of the respondents are examined in relation to each of the environmental topics. The Pearson Chi-Square determines a statistical relationship between two variables, in this case, demographics and the questions.
38
57
68
1420
31
53
41
60616164
74
4539 40
1111
0 1 2 50
10
20
30
40
50
60
70
80
Water P
olluti
on
Natural
Res
ource
s
Air Poll
ution
Wetlan
ds
Urban S
prawl
Watersh
ed M
anag
emen
t
Sustai
nabil
ity
Biodive
rsity
Perc
ent
High knowledgeLow knowledgeDon't know
24 Part 1 Environmental Knowledge
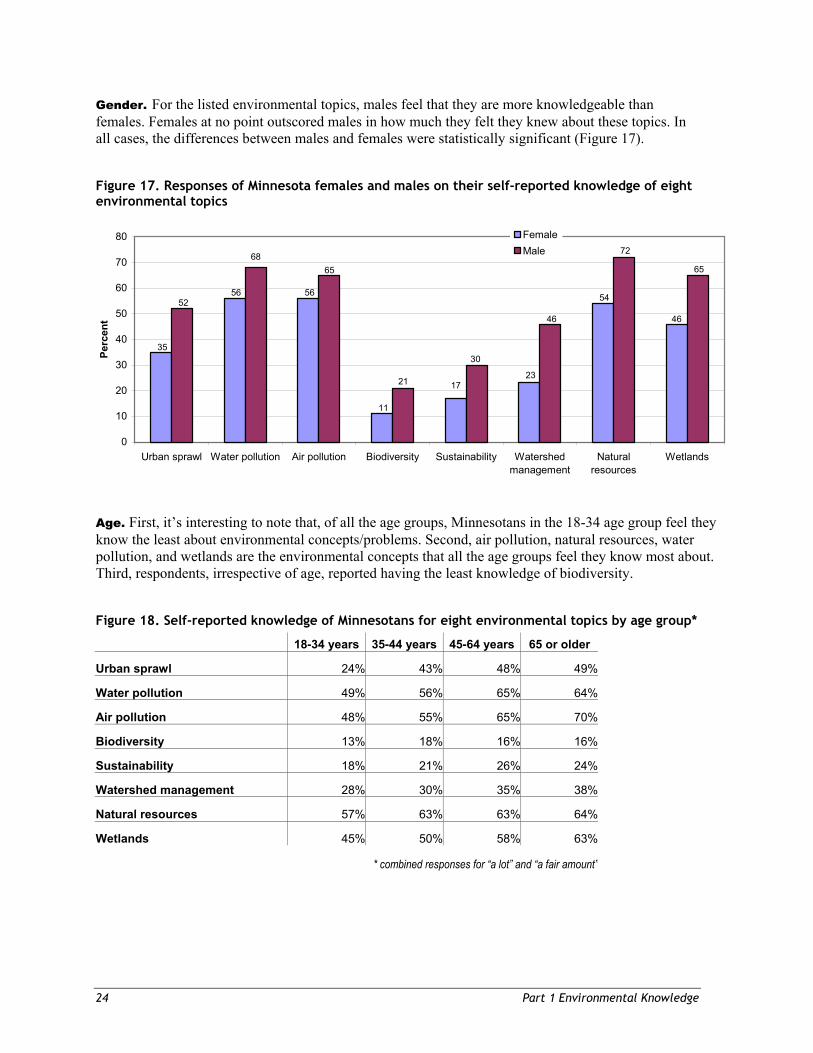
Gender. For the listed environmental topics, males feel that they are more knowledgeable than females. Females at no point outscored males in how much they felt they knew about these topics. In all cases, the differences between males and females were statistically significant (Figure 17).
Figure 17. Responses of Minnesota females and males on their self-reported knowledge of eight environmental topics
Age. First, it’s interesting to note that, of all the age groups, Minnesotans in the 18-34 age group feel they know the least about environmental concepts/problems. Second, air pollution, natural resources, water pollution, and wetlands are the environmental concepts that all the age groups feel they know most about. Third, respondents, irrespective of age, reported having the least knowledge of biodiversity.
Figure 18. Self-reported knowledge of Minnesotans for eight environmental topics by age group*
18-34 years 35-44 years 45-64 years 65 or older
Urban sprawl 24% 43% 48% 49%
Water pollution 49% 56% 65% 64%
Air pollution 48% 55% 65% 70%
Biodiversity 13% 18% 16% 16%
Sustainability 18% 21% 26% 24%
Watershed management 28% 30% 35% 38%
Natural resources 57% 63% 63% 64%
Wetlands 45% 50% 58% 63%
* combined responses for “a lot” and “a fair amount”
68
46
54
2317
11
5656
35
65
72
46
30
21
65
52
0
10
20
30
40
50
60
70
80
Urban sprawl Water pollution Air pollution Biodiversity Sustainability Watershedmanagement
Naturalresources
Wetlands
Perc
ent
FemaleMale
Second Minnesota Report Card on Environmental Literacy 25
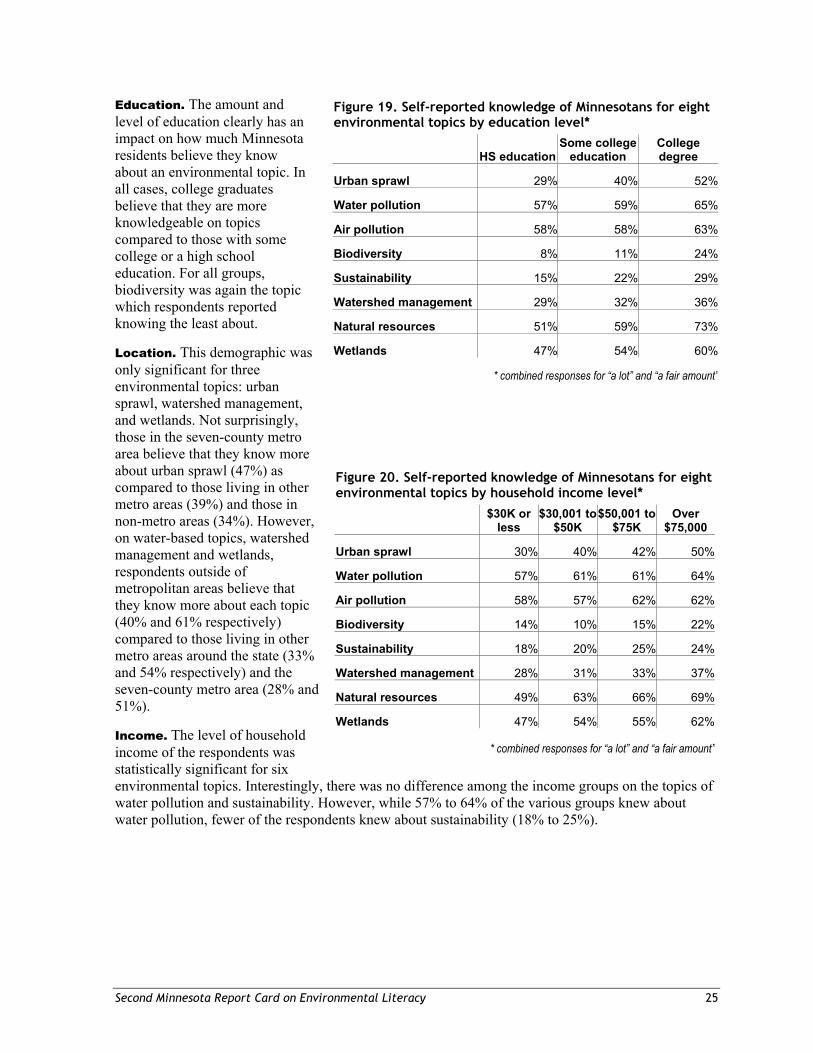
Education. The amount and level of education clearly has an impact on how much Minnesota residents believe they know about an environmental topic. In all cases, college graduates believe that they are more knowledgeable on topics compared to those with some college or a high school education. For all groups, biodiversity was again the topic which respondents reported knowing the least about.
Location. This demographic was only significant for three environmental topics: urban sprawl, watershed management, and wetlands. Not surprisingly, those in the seven-county metro area believe that they know more about urban sprawl (47%) as compared to those living in other metro areas (39%) and those in non-metro areas (34%). However, on water-based topics, watershed management and wetlands, respondents outside of metropolitan areas believe that they know more about each topic (40% and 61% respectively) compared to those living in other metro areas around the state (33% and 54% respectively) and the seven-county metro area (28% and 51%).
Income. The level of household income of the respondents was statistically significant for six environmental topics. Interestingly, there was no difference among the income groups on the topics of water pollution and sustainability. However, while 57% to 64% of the various groups knew about water pollution, fewer of the respondents knew about sustainability (18% to 25%).
Figure 19. Self-reported knowledge of Minnesotans for eight environmental topics by education level*
HS educationSome college
education College degree
Urban sprawl 29% 40% 52%
Water pollution 57% 59% 65%
Air pollution 58% 58% 63%
Biodiversity 8% 11% 24%
Sustainability 15% 22% 29%
Watershed management 29% 32% 36%
Natural resources 51% 59% 73%
Wetlands 47% 54% 60%
* combined responses for “a lot” and “a fair amount”
Figure 20. Self-reported knowledge of Minnesotans for eight environmental topics by household income level*
$30K or
less $30,001 to
$50K $50,001 to
$75K Over
$75,000
Urban sprawl 30% 40% 42% 50%
Water pollution 57% 61% 61% 64%
Air pollution 58% 57% 62% 62%
Biodiversity 14% 10% 15% 22%
Sustainability 18% 20% 25% 24%
Watershed management 28% 31% 33% 37%
Natural resources 49% 63% 66% 69%
Wetlands 47% 54% 55% 62%
* combined responses for “a lot” and “a fair amount”
26 Part 1 Environmental Knowledge
Connections with other research Previous surveys around the state and nation by other organizations have produced similar results for comparable questions. While the results may not be directly correlated, there are some similar patterns among the surveys. In 2002, the Minnesota Pollution Control Agency (MPCA) and Office of Environmental Assistance (OEA) conducted a survey of staff at 11 government agencies about their views on climate change as an issue of concern and their level of awareness about the causes and possible impacts.3 In addition, a 2001 Minnesota State Survey of the general public asked a question about electricity generation in Minnesota. Forty-three percent of the general public knew the primary source of electricity, compared to 71% of the agency staff that answered this correctly. The percentage response for the general public is very similar to the results of this survey (43% vs. 44% respectively).
In 2002, the Biodiversity Project published national survey results on Americans’ perspectives on biodiversity. When asked if they had heard about biodiversity, only 30% of Americans responded that they had. In this survey, 32% of Minnesota adults responded that they know only a little about biodiversity and only 14% stated that they are knowledgeable about this topic.
3 The state agencies surveyed for the MPCA and OEA survey were Department of Administration (Materials Management, Resource Recovery, and Travel Management Divisions), Department of Agriculture, Board of Water and Soil Resources, Department of Commerce–Energy Division, Department of Transportation, Department of Natural Resources, Department of Trade and Economic Development, Department of Health–Environmental Services Division, Office of Environmental Assistance, Minnesota Pollution Control Agency, and Minnesota Planning.
Second Minnesota Report Card on Environmental Literacy 27
Part 2 Environmental Attitudes To collect data about environmental attitudes, adult Minnesotans were asked a series of questions concerning attitudes toward the environment. The questions were divided into three sets: one dealing with environmental protection (Questions 3-7), the second based on who should be responsible for solving environmental problems (Questions 8A-D), and finally attitudes toward water quality in the state (Questions 20A-F and Questions 22 and 23).
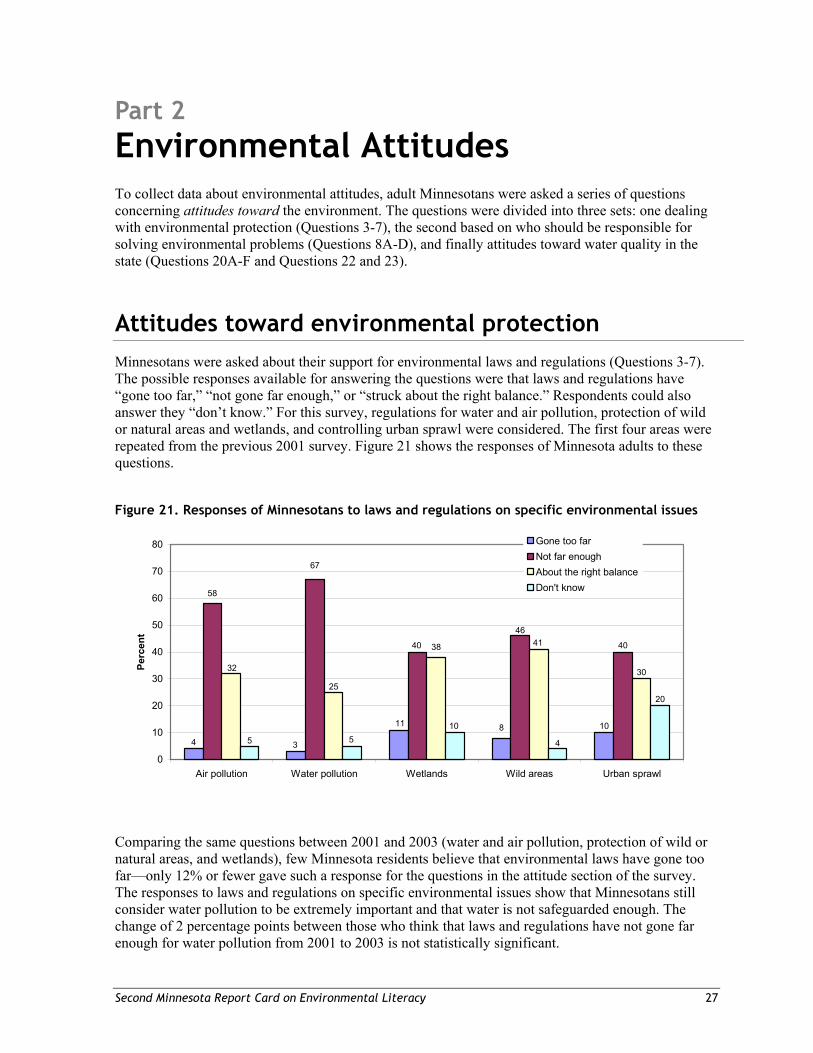
Attitudes toward environmental protection Minnesotans were asked about their support for environmental laws and regulations (Questions 3-7). The possible responses available for answering the questions were that laws and regulations have “gone too far,” “not gone far enough,” or “struck about the right balance.” Respondents could also answer they “don’t know.” For this survey, regulations for water and air pollution, protection of wild or natural areas and wetlands, and controlling urban sprawl were considered. The first four areas were repeated from the previous 2001 survey. Figure 21 shows the responses of Minnesota adults to these questions.
Figure 21. Responses of Minnesotans to laws and regulations on specific environmental issues
Comparing the same questions between 2001 and 2003 (water and air pollution, protection of wild or natural areas, and wetlands), few Minnesota residents believe that environmental laws have gone too far—only 12% or fewer gave such a response for the questions in the attitude section of the survey. The responses to laws and regulations on specific environmental issues show that Minnesotans still consider water pollution to be extremely important and that water is not safeguarded enough. The change of 2 percentage points between those who think that laws and regulations have not gone far enough for water pollution from 2001 to 2003 is not statistically significant.
8
58
38
1011
34
40
46
40
67
30
41
32
2520
4
1055
0
10
20
30
40
50
60
70
80
Air pollution Water pollution Wetlands Wild areas Urban sprawl
Perc
ent
Gone too farNot far enoughAbout the right balanceDon't know
28 Part 2 Environmental Attitudes
Governmental units own about 25% of
Minnesota land. Of this, the federal government
owns about 7%, while the state owns about
17%. http://www.house.leg.state.mn.us/ hrd/issinfo/sssoland.pdf
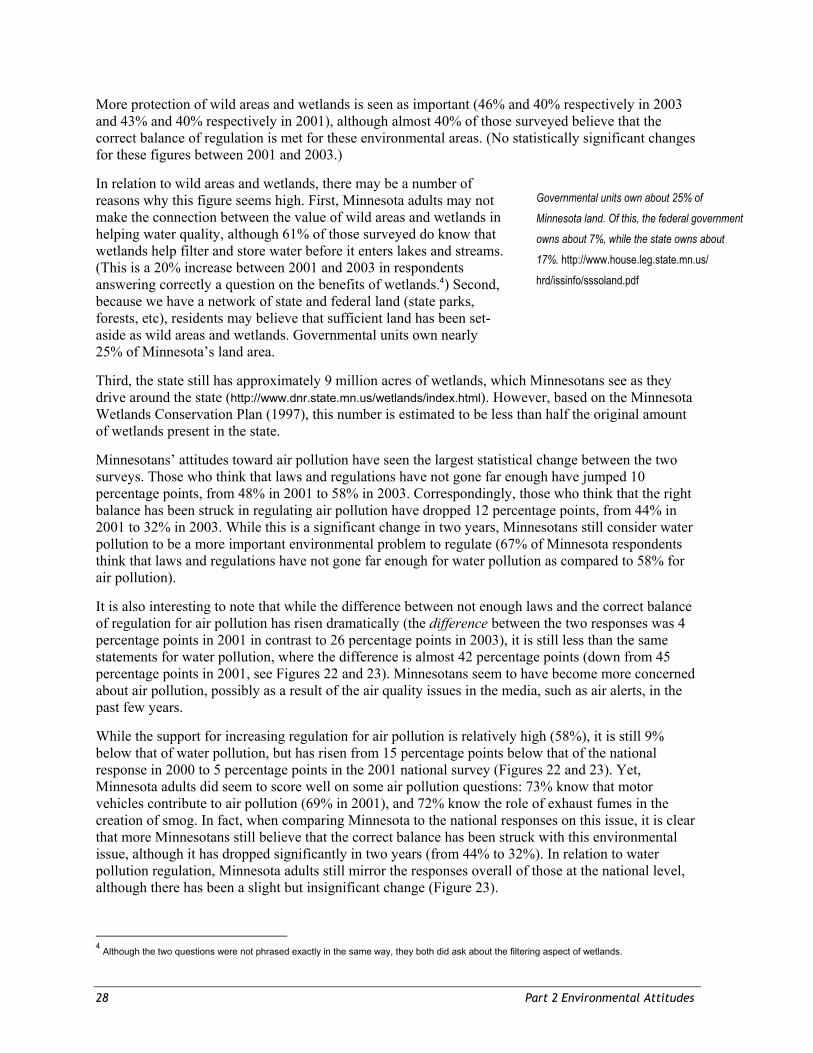
More protection of wild areas and wetlands is seen as important (46% and 40% respectively in 2003 and 43% and 40% respectively in 2001), although almost 40% of those surveyed believe that the correct balance of regulation is met for these environmental areas. (No statistically significant changes for these figures between 2001 and 2003.)
In relation to wild areas and wetlands, there may be a number of reasons why this figure seems high. First, Minnesota adults may not make the connection between the value of wild areas and wetlands in helping water quality, although 61% of those surveyed do know that wetlands help filter and store water before it enters lakes and streams. (This is a 20% increase between 2001 and 2003 in respondents answering correctly a question on the benefits of wetlands.4) Second, because we have a network of state and federal land (state parks, forests, etc), residents may believe that sufficient land has been set-aside as wild areas and wetlands. Governmental units own nearly 25% of Minnesota’s land area.
Third, the state still has approximately 9 million acres of wetlands, which Minnesotans see as they drive around the state (http://www.dnr.state.mn.us/wetlands/index.html). However, based on the Minnesota Wetlands Conservation Plan (1997), this number is estimated to be less than half the original amount of wetlands present in the state.
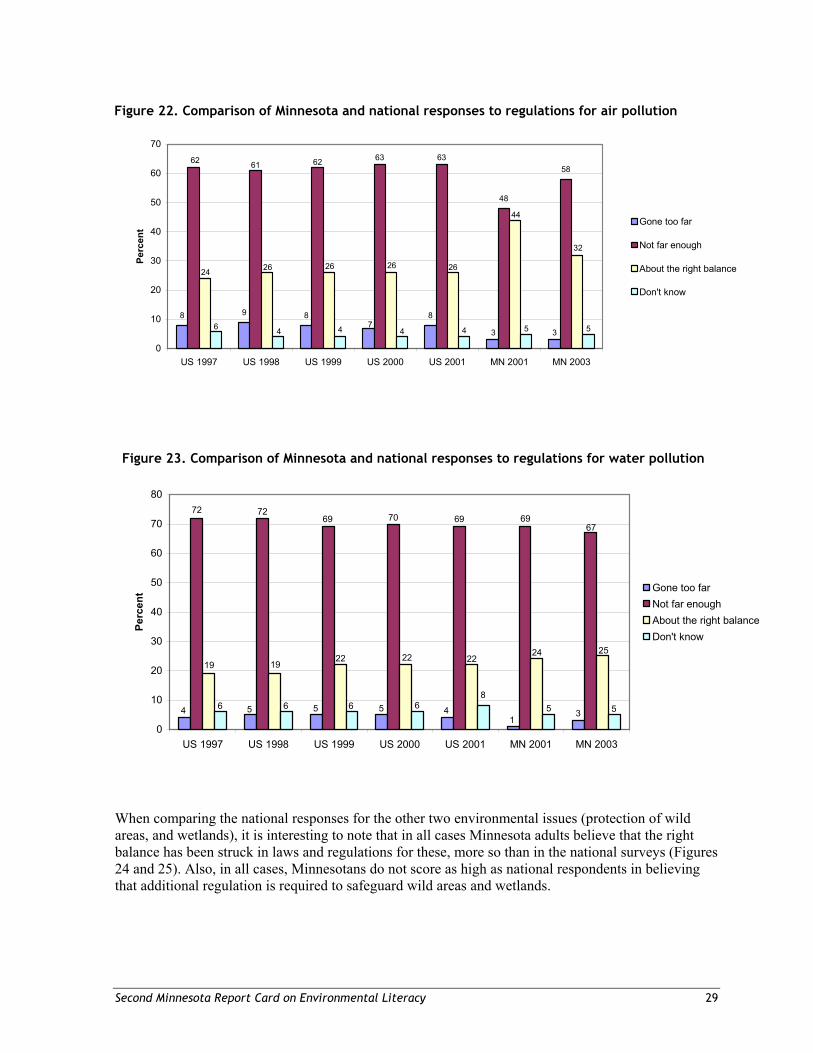
Minnesotans’ attitudes toward air pollution have seen the largest statistical change between the two surveys. Those who think that laws and regulations have not gone far enough have jumped 10 percentage points, from 48% in 2001 to 58% in 2003. Correspondingly, those who think that the right balance has been struck in regulating air pollution have dropped 12 percentage points, from 44% in 2001 to 32% in 2003. While this is a significant change in two years, Minnesotans still consider water pollution to be a more important environmental problem to regulate (67% of Minnesota respondents think that laws and regulations have not gone far enough for water pollution as compared to 58% for air pollution).
It is also interesting to note that while the difference between not enough laws and the correct balance of regulation for air pollution has risen dramatically (the difference between the two responses was 4 percentage points in 2001 in contrast to 26 percentage points in 2003), it is still less than the same statements for water pollution, where the difference is almost 42 percentage points (down from 45 percentage points in 2001, see Figures 22 and 23). Minnesotans seem to have become more concerned about air pollution, possibly as a result of the air quality issues in the media, such as air alerts, in the past few years.
While the support for increasing regulation for air pollution is relatively high (58%), it is still 9% below that of water pollution, but has risen from 15 percentage points below that of the national response in 2000 to 5 percentage points in the 2001 national survey (Figures 22 and 23). Yet, Minnesota adults did seem to score well on some air pollution questions: 73% know that motor vehicles contribute to air pollution (69% in 2001), and 72% know the role of exhaust fumes in the creation of smog. In fact, when comparing Minnesota to the national responses on this issue, it is clear that more Minnesotans still believe that the correct balance has been struck with this environmental issue, although it has dropped significantly in two years (from 44% to 32%). In relation to water pollution regulation, Minnesota adults still mirror the responses overall of those at the national level, although there has been a slight but insignificant change (Figure 23).
4 Although the two questions were not phrased exactly in the same way, they both did ask about the filtering aspect of wetlands.
Second Minnesota Report Card on Environmental Literacy 29
Figure 22. Comparison of Minnesota and national responses to regulations for air pollution
Figure 23. Comparison of Minnesota and national responses to regulations for water pollution
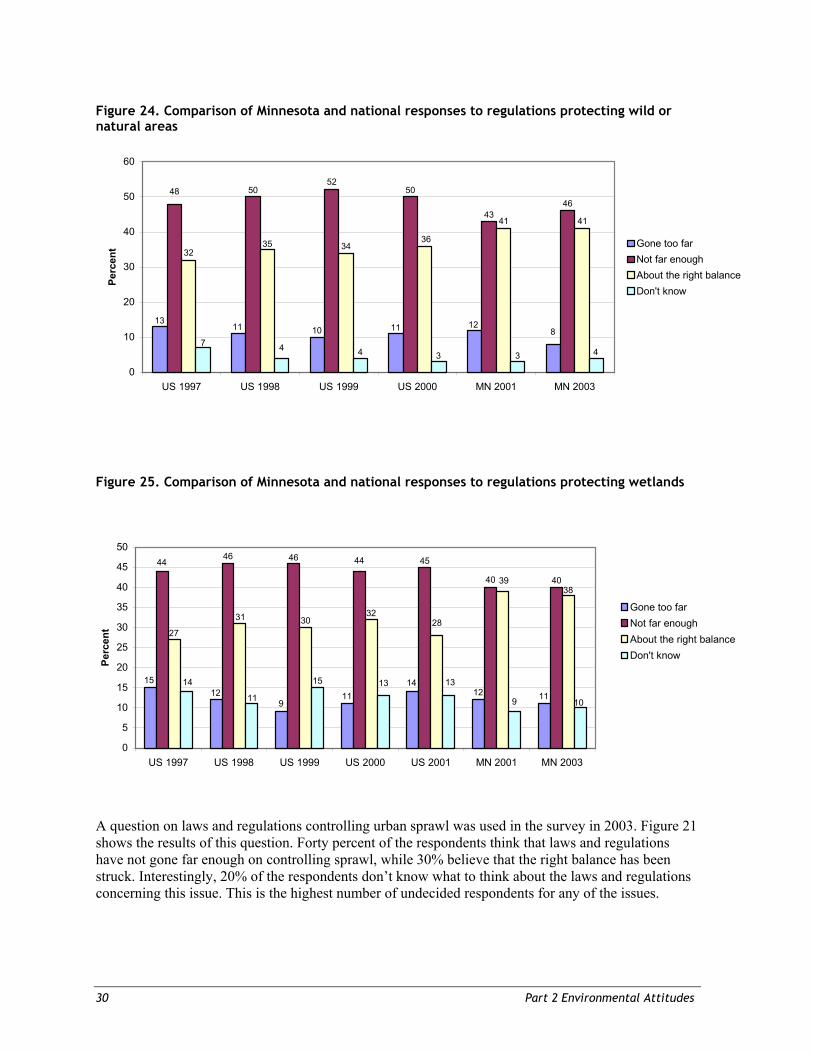
When comparing the national responses for the other two environmental issues (protection of wild areas, and wetlands), it is interesting to note that in all cases Minnesota adults believe that the right balance has been struck in laws and regulations for these, more so than in the national surveys (Figures 24 and 25). Also, in all cases, Minnesotans do not score as high as national respondents in believing that additional regulation is required to safeguard wild areas and wetlands.
8 9 8 8
48
58
73 3
6363626162
24 26 26
32
26 26
44
5 56 4 4 4 4
0
10
20
30
40
50
60
70
US 1997 US 1998 US 1999 US 2000 US 2001 MN 2001 MN 2003
Perc
ent
Gone too far
Not far enough
About the right balance
Don't know
85554 4
13
696970697272
67
221919
22 2224 25
666 6 5 5
0
10
20
30
40
50
60
70
80
US 1997 US 1998 US 1999 US 2000 US 2001 MN 2001 MN 2003
Perc
ent Gone too far
Not far enoughAbout the right balanceDon't know
30 Part 2 Environmental Attitudes
Figure 24. Comparison of Minnesota and national responses to regulations protecting wild or natural areas
A question on laws and regulations controlling urban sprawl was used in the survey in 2003. Figure 21 shows the results of this question. Forty percent of the respondents think that laws and regulations have not gone far enough on controlling sprawl, while 30% believe that the right balance has been struck. Interestingly, 20% of the respondents don’t know what to think about the laws and regulations concerning this issue. This is the highest number of undecided respondents for any of the issues.
Figure 25. Comparison of Minnesota and national responses to regulations protecting wetlands
4
1311 10 11 12
8
504852
50
4346
32
41
363435
41
74 3 3 4
0
10
20
30
40
50
60
US 1997 US 1998 US 1999 US 2000 MN 2001 MN 2003
Perc
ent Gone too far
Not far enoughAbout the right balanceDon't know
44
111214
11129
15
4040
45464644
38
2832
3031
27
39
14
11
15 13 13
9 10
0
5
10
15
20
25
30
35
40
45
50
US 1997 US 1998 US 1999 US 2000 US 2001 MN 2001 MN 2003
Perc
ent
Gone too farNot far enoughAbout the right balanceDon't know
Second Minnesota Report Card on Environmental Literacy 31
Demographics
The Pearson Chi-Square determines a statistical relationship between two variables, in this case, demographics and the questions.
Gender. A significant difference was found between female and male respondents for all regulations with the exception of urban sprawl. In this case, both groups (52% females, 49% males) clearly think that regulations have not gone far enough in controlling sprawl. For all other areas, more females than males think that regulations have not gone far enough (air pollution: females 67%, males 55%; water pollution: females 75%, males 64%; wetland areas: females 48%, males 41%; wild areas: females 52%, males 44%). This attitude toward environmental regulation is very interesting and significant considering the differences between male and female knowledge levels. This pattern is similar to the 2001 survey.
Age. No significant differences were reported for any question except regulations on wetland protection. Forty-one percent of those in age groups 35-44 and 65 or older think that regulations have not gone far enough whereas 48% and 47% of those in age groups 18-34 and 45-64 respectively think this is the case. For all other issues, the highest percentage of respondents in all age groups does not believe that regulations have gone far enough in fighting water and air pollution, protecting wild or natural areas, and urban sprawl.
Education. As with the 2001 survey, the more educated an adult, the more likely that he or she believes that regulation in all these areas has not gone far enough. Significant differences were found in education level for the questions concerning air pollution, wild areas, and urban sprawl, while there was no significant difference for water pollution and wetland protection.
While all groups (high school education or less, some college, and college degree) clearly believe that laws and regulations preventing water pollution have not gone far enough (68%, 70% and 73% respectively), all groups clearly think that regulations for wetland protection have struck the right balance (43%, 42%, and 40% respectively). In 2001, the water pollution question also received the highest score from all the education categories, (66%, 75%, and 77% respectively), while wetland protection received similar results (40%, 42%, 49% respectively). These natural wetland systems play an important role in cleaning water, yet adults do not seem to be making this connection. However, adults in two of the categories (high school education and college degree) do support additional protection of wild and natural areas—locations that can be important in watershed management.
Location. Significant differences were found among residents in the three locations and their attitudes toward regulations. Residents of the seven-county metro and other metro areas were more likely to think that regulations for preventing air and water pollution, for protecting wild/natural areas and wetlands, and for controlling urban sprawl have not gone far enough. As with education levels, preventing water pollution is clearly believed to be the most important issue for respondents, irrespective of location (75% seven-county metro, 68% other metro areas, 65% non-metro areas).
However, more residents of non-metro areas think that laws and regulations have struck the right balance for protecting wetlands and wild/natural areas (47% and 50% respectively) over residents of other locations. They are split almost equally for regulations controlling sprawl (45% “not far enough” and 44% “struck about the right balance”).
Income. As in the 2001 survey, no significant differences were found for income and regulations. However, in almost all cases, Minnesotans in each of the four income categories think that laws and regulations have not gone far enough for preventing air and water pollution, for protecting wild/natural areas and wetlands, and controlling urban sprawl. The only exception is for wetland protection, where
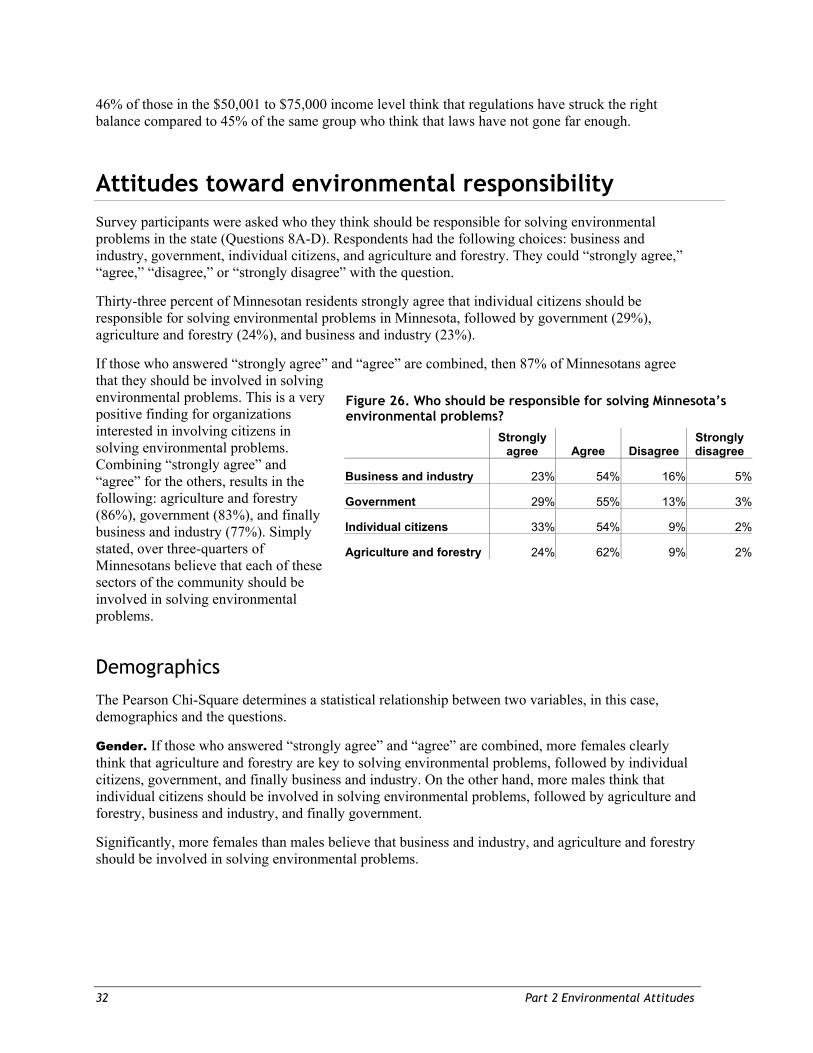
32 Part 2 Environmental Attitudes
46% of those in the $50,001 to $75,000 income level think that regulations have struck the right balance compared to 45% of the same group who think that laws have not gone far enough.
Attitudes toward environmental responsibility Survey participants were asked who they think should be responsible for solving environmental problems in the state (Questions 8A-D). Respondents had the following choices: business and industry, government, individual citizens, and agriculture and forestry. They could “strongly agree,” “agree,” “disagree,” or “strongly disagree” with the question.
Thirty-three percent of Minnesotan residents strongly agree that individual citizens should be responsible for solving environmental problems in Minnesota, followed by government (29%), agriculture and forestry (24%), and business and industry (23%).
If those who answered “strongly agree” and “agree” are combined, then 87% of Minnesotans agree that they should be involved in solving environmental problems. This is a very positive finding for organizations interested in involving citizens in solving environmental problems. Combining “strongly agree” and “agree” for the others, results in the following: agriculture and forestry (86%), government (83%), and finally business and industry (77%). Simply stated, over three-quarters of Minnesotans believe that each of these sectors of the community should be involved in solving environmental problems.
Demographics
The Pearson Chi-Square determines a statistical relationship between two variables, in this case, demographics and the questions.
Gender. If those who answered “strongly agree” and “agree” are combined, more females clearly think that agriculture and forestry are key to solving environmental problems, followed by individual citizens, government, and finally business and industry. On the other hand, more males think that individual citizens should be involved in solving environmental problems, followed by agriculture and forestry, business and industry, and finally government.
Significantly, more females than males believe that business and industry, and agriculture and forestry should be involved in solving environmental problems.
Figure 26. Who should be responsible for solving Minnesota’s environmental problems?
Strongly
agree Agree Disagree Strongly disagree
Business and industry 23% 54% 16% 5%
Government 29% 55% 13% 3%
Individual citizens 33% 54% 9% 2%
Agriculture and forestry 24% 62% 9% 2%
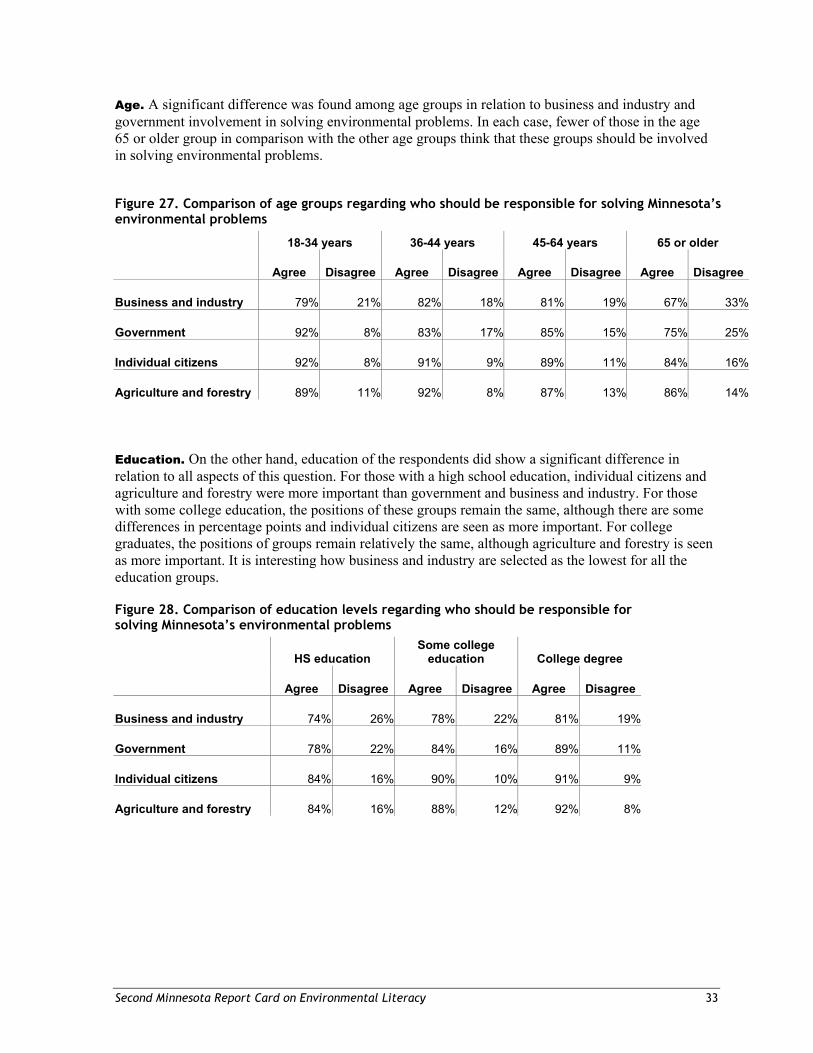
Second Minnesota Report Card on Environmental Literacy 33
Age. A significant difference was found among age groups in relation to business and industry and government involvement in solving environmental problems. In each case, fewer of those in the age 65 or older group in comparison with the other age groups think that these groups should be involved in solving environmental problems.
Figure 27. Comparison of age groups regarding who should be responsible for solving Minnesota’s environmental problems
18-34 years 36-44 years 45-64 years 65 or older
Agree Disagree Agree Disagree Agree Disagree Agree Disagree
Business and industry 79% 21% 82% 18% 81% 19% 67% 33%
Government 92% 8% 83% 17% 85% 15% 75% 25%
Individual citizens 92% 8% 91% 9% 89% 11% 84% 16%
Agriculture and forestry 89% 11% 92% 8% 87% 13% 86% 14%
Education. On the other hand, education of the respondents did show a significant difference in relation to all aspects of this question. For those with a high school education, individual citizens and agriculture and forestry were more important than government and business and industry. For those with some college education, the positions of these groups remain the same, although there are some differences in percentage points and individual citizens are seen as more important. For college graduates, the positions of groups remain relatively the same, although agriculture and forestry is seen as more important. It is interesting how business and industry are selected as the lowest for all the education groups.
Figure 28. Comparison of education levels regarding who should be responsible for solving Minnesota’s environmental problems
HS education Some college
education College degree
Agree Disagree Agree Disagree Agree Disagree
Business and industry 74% 26% 78% 22% 81% 19%
Government 78% 22% 84% 16% 89% 11%
Individual citizens 84% 16% 90% 10% 91% 9%
Agriculture and forestry 84% 16% 88% 12% 92% 8%
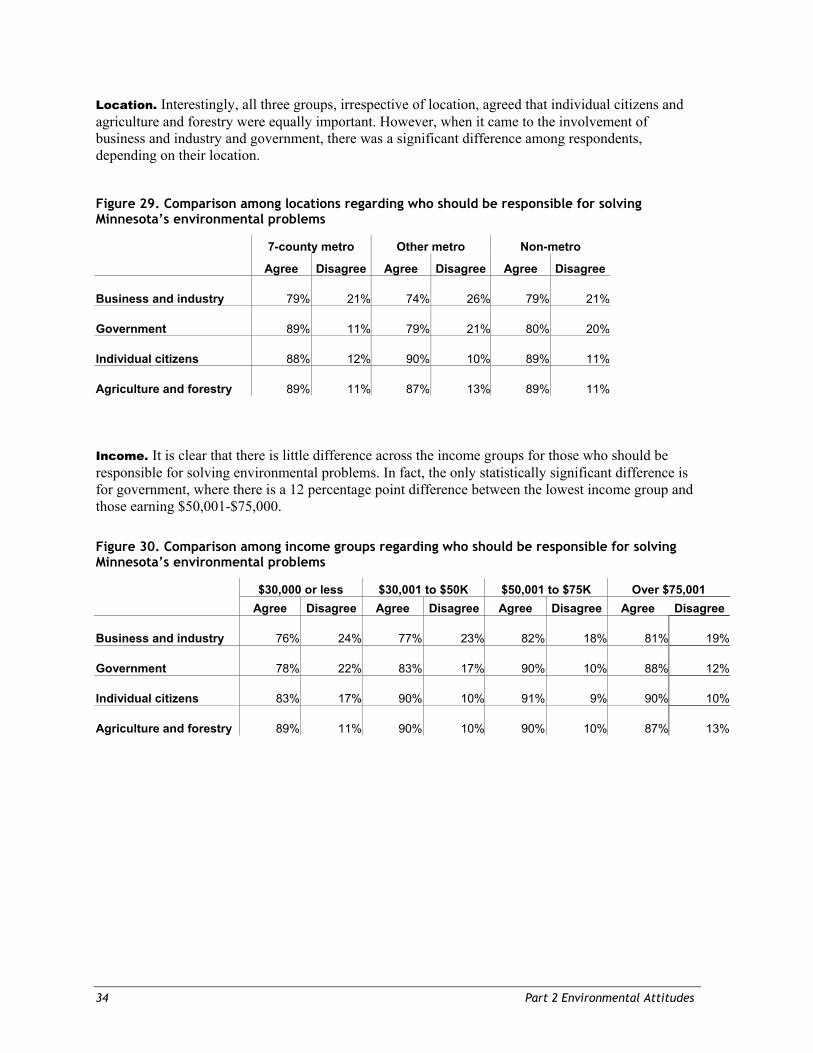
34 Part 2 Environmental Attitudes
Location. Interestingly, all three groups, irrespective of location, agreed that individual citizens and agriculture and forestry were equally important. However, when it came to the involvement of business and industry and government, there was a significant difference among respondents, depending on their location.
Figure 29. Comparison among locations regarding who should be responsible for solving Minnesota’s environmental problems
7-county metro Other metro Non-metro Agree Disagree Agree Disagree Agree Disagree
Business and industry 79% 21% 74% 26% 79% 21%
Government 89% 11% 79% 21% 80% 20%
Individual citizens 88% 12% 90% 10% 89% 11%
Agriculture and forestry 89% 11% 87% 13% 89% 11%
Income. It is clear that there is little difference across the income groups for those who should be responsible for solving environmental problems. In fact, the only statistically significant difference is for government, where there is a 12 percentage point difference between the lowest income group and those earning $50,001-$75,000.
Figure 30. Comparison among income groups regarding who should be responsible for solving Minnesota’s environmental problems
$30,000 or less $30,001 to $50K $50,001 to $75K Over $75,001 Agree Disagree Agree Disagree Agree Disagree Agree Disagree
Business and industry 76% 24% 77% 23% 82% 18% 81% 19%
Government 78% 22% 83% 17% 90% 10% 88% 12%
Individual citizens 83% 17% 90% 10% 91% 9% 90% 10%
Agriculture and forestry 89% 11% 90% 10% 90% 10% 87% 13%
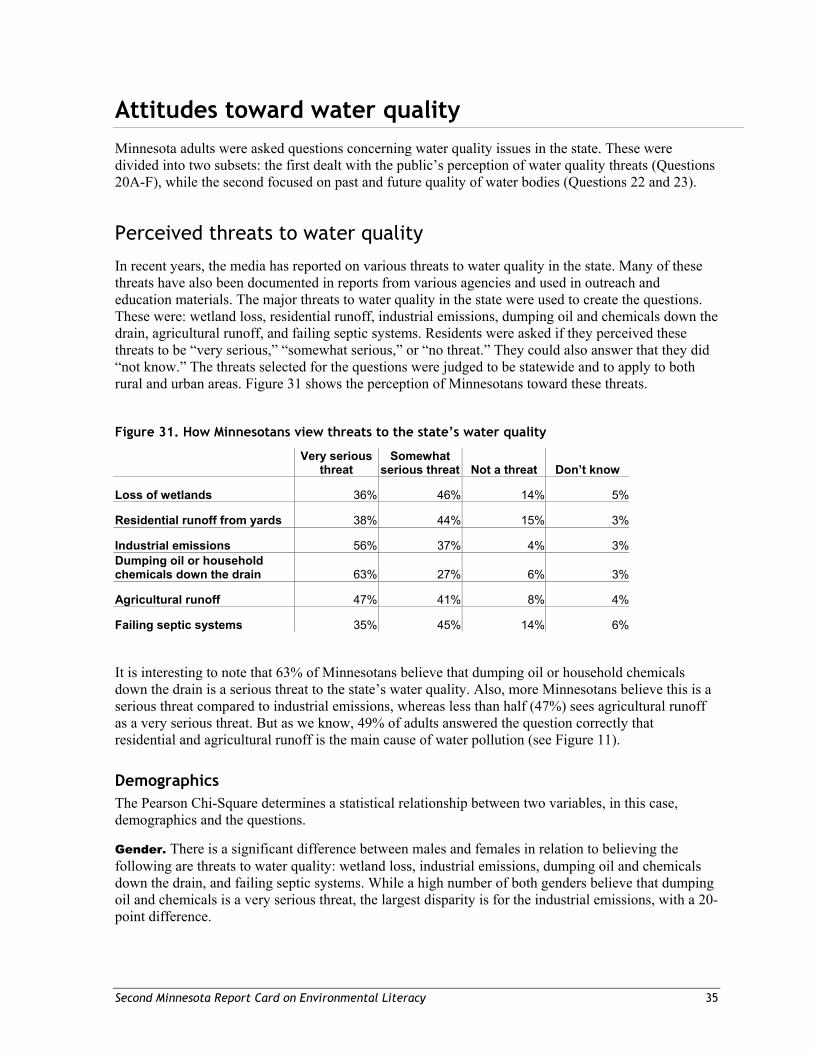
Second Minnesota Report Card on Environmental Literacy 35
Attitudes toward water quality Minnesota adults were asked questions concerning water quality issues in the state. These were divided into two subsets: the first dealt with the public’s perception of water quality threats (Questions 20A-F), while the second focused on past and future quality of water bodies (Questions 22 and 23).
Perceived threats to water quality
In recent years, the media has reported on various threats to water quality in the state. Many of these threats have also been documented in reports from various agencies and used in outreach and education materials. The major threats to water quality in the state were used to create the questions. These were: wetland loss, residential runoff, industrial emissions, dumping oil and chemicals down the drain, agricultural runoff, and failing septic systems. Residents were asked if they perceived these threats to be “very serious,” “somewhat serious,” or “no threat.” They could also answer that they did “not know.” The threats selected for the questions were judged to be statewide and to apply to both rural and urban areas. Figure 31 shows the perception of Minnesotans toward these threats.
Figure 31. How Minnesotans view threats to the state’s water quality
Very serious
threat Somewhat
serious threat Not a threat Don’t know
Loss of wetlands 36% 46% 14% 5%
Residential runoff from yards 38% 44% 15% 3%
Industrial emissions 56% 37% 4% 3%Dumping oil or household chemicals down the drain 63% 27% 6% 3%
Agricultural runoff 47% 41% 8% 4%
Failing septic systems 35% 45% 14% 6%
It is interesting to note that 63% of Minnesotans believe that dumping oil or household chemicals down the drain is a serious threat to the state’s water quality. Also, more Minnesotans believe this is a serious threat compared to industrial emissions, whereas less than half (47%) sees agricultural runoff as a very serious threat. But as we know, 49% of adults answered the question correctly that residential and agricultural runoff is the main cause of water pollution (see Figure 11).
Demographics The Pearson Chi-Square determines a statistical relationship between two variables, in this case, demographics and the questions.
Gender. There is a significant difference between males and females in relation to believing the following are threats to water quality: wetland loss, industrial emissions, dumping oil and chemicals down the drain, and failing septic systems. While a high number of both genders believe that dumping oil and chemicals is a very serious threat, the largest disparity is for the industrial emissions, with a 20-point difference.
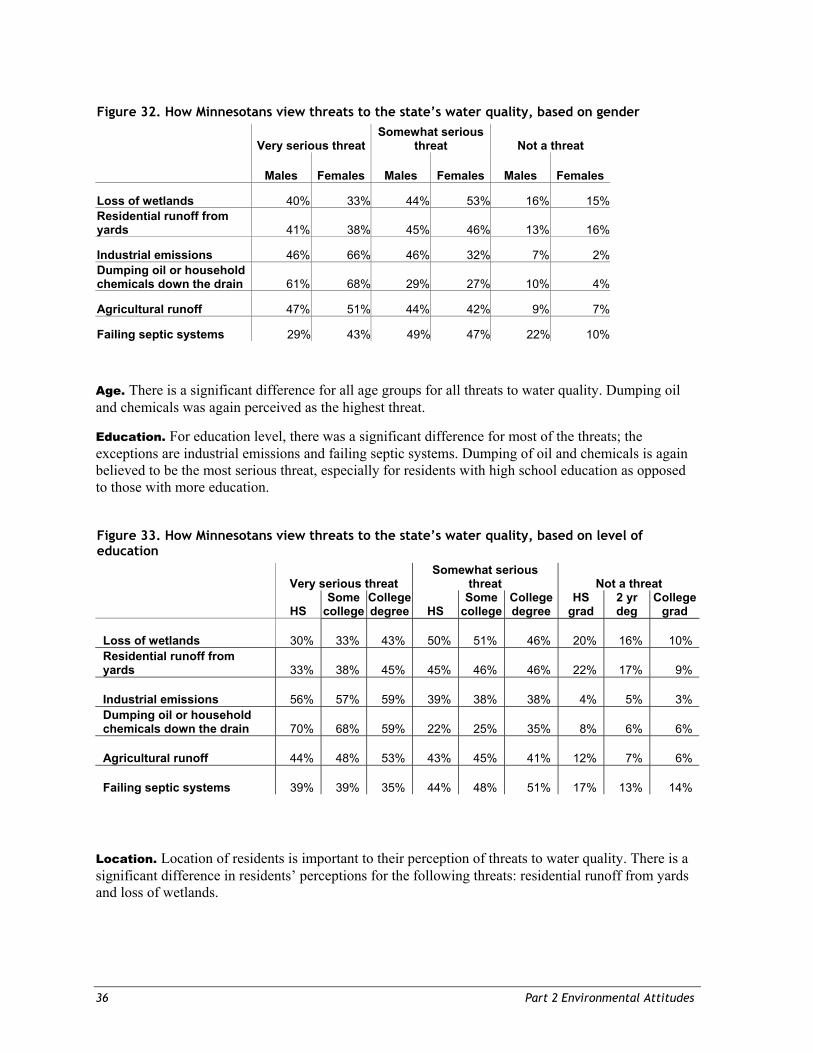
36 Part 2 Environmental Attitudes
Figure 32. How Minnesotans view threats to the state’s water quality, based on gender
Very serious threatSomewhat serious
threat Not a threat
Males Females Males Females Males Females
Loss of wetlands 40% 33% 44% 53% 16% 15%Residential runoff from yards 41% 38% 45% 46% 13% 16%
Industrial emissions 46% 66% 46% 32% 7% 2%Dumping oil or household chemicals down the drain 61% 68% 29% 27% 10% 4%
Agricultural runoff 47% 51% 44% 42% 9% 7%
Failing septic systems 29% 43% 49% 47% 22% 10%
Age. There is a significant difference for all age groups for all threats to water quality. Dumping oil and chemicals was again perceived as the highest threat.
Education. For education level, there was a significant difference for most of the threats; the exceptions are industrial emissions and failing septic systems. Dumping of oil and chemicals is again believed to be the most serious threat, especially for residents with high school education as opposed to those with more education.
Figure 33. How Minnesotans view threats to the state’s water quality, based on level of education
Very serious threat Somewhat serious
threat Not a threat
HS Some
collegeCollege degree HS
Some college
College degree
HS grad
2 yr deg
College grad
Loss of wetlands 30% 33% 43% 50% 51% 46% 20% 16% 10% Residential runoff from yards 33% 38% 45% 45% 46% 46% 22% 17% 9%
Industrial emissions 56% 57% 59% 39% 38% 38% 4% 5% 3% Dumping oil or household chemicals down the drain 70% 68% 59% 22% 25% 35% 8% 6% 6%
Agricultural runoff 44% 48% 53% 43% 45% 41% 12% 7% 6%
Failing septic systems 39% 39% 35% 44% 48% 51% 17% 13% 14%
Location. Location of residents is important to their perception of threats to water quality. There is a significant difference in residents’ perceptions for the following threats: residential runoff from yards and loss of wetlands.
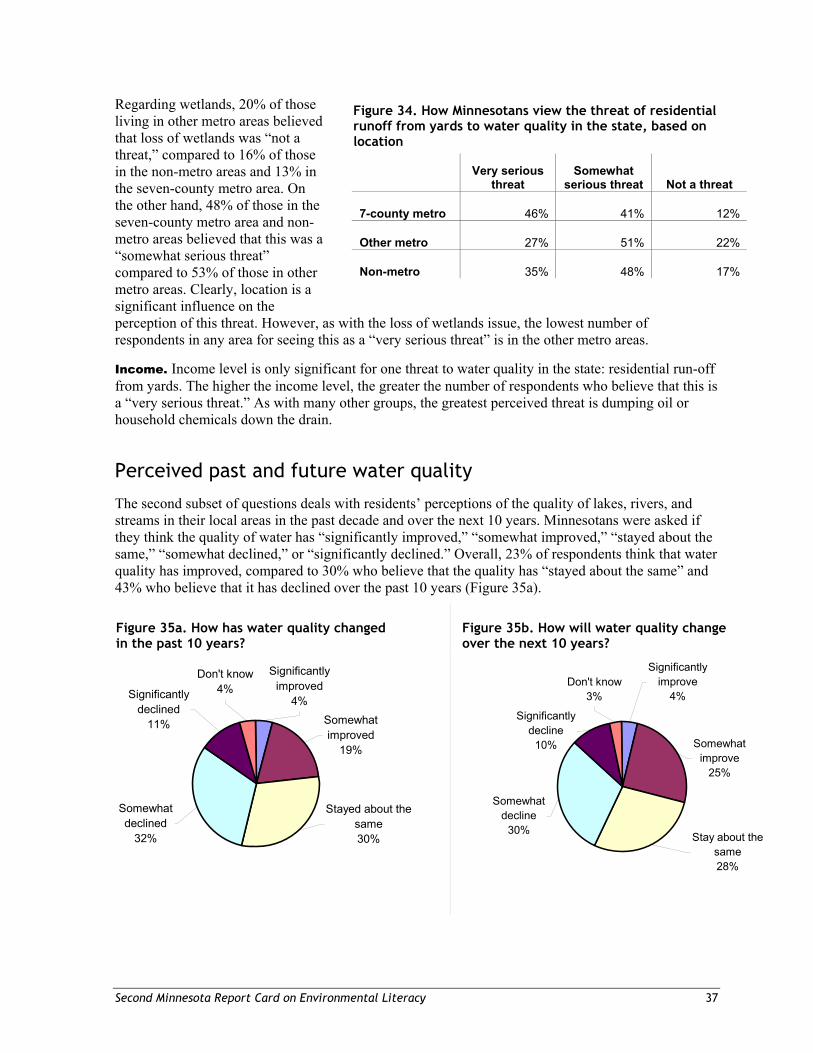
Second Minnesota Report Card on Environmental Literacy 37
Regarding wetlands, 20% of those living in other metro areas believed that loss of wetlands was “not a threat,” compared to 16% of those in the non-metro areas and 13% in the seven-county metro area. On the other hand, 48% of those in the seven-county metro area and non-metro areas believed that this was a “somewhat serious threat” compared to 53% of those in other metro areas. Clearly, location is a significant influence on the perception of this threat. However, as with the loss of wetlands issue, the lowest number of respondents in any area for seeing this as a “very serious threat” is in the other metro areas.
Income. Income level is only significant for one threat to water quality in the state: residential run-off from yards. The higher the income level, the greater the number of respondents who believe that this is a “very serious threat.” As with many other groups, the greatest perceived threat is dumping oil or household chemicals down the drain.
Perceived past and future water quality
The second subset of questions deals with residents’ perceptions of the quality of lakes, rivers, and streams in their local areas in the past decade and over the next 10 years. Minnesotans were asked if they think the quality of water has “significantly improved,” “somewhat improved,” “stayed about the same,” “somewhat declined,” or “significantly declined.” Overall, 23% of respondents think that water quality has improved, compared to 30% who believe that the quality has “stayed about the same” and 43% who believe that it has declined over the past 10 years (Figure 35a).
Figure 35a. How has water quality changed in the past 10 years?
Figure 35b. How will water quality change over the next 10 years?
Figure 34. How Minnesotans view the threat of residential runoff from yards to water quality in the state, based on location
Very serious
threat Somewhat
serious threat Not a threat
7-county metro 46% 41% 12%
Other metro 27% 51% 22%
Non-metro 35% 48% 17%
Somewhat declined
32%
Significantly declined
11%
Don't know4%
Stayed about the same30%
Somewhat improved
19%
Significantly improved
4%
Somewhat decline
30%
Significantly decline
10%
Don't know3%
Stay about the same28%
Somewhat improve
25%
Significantly improve
4%
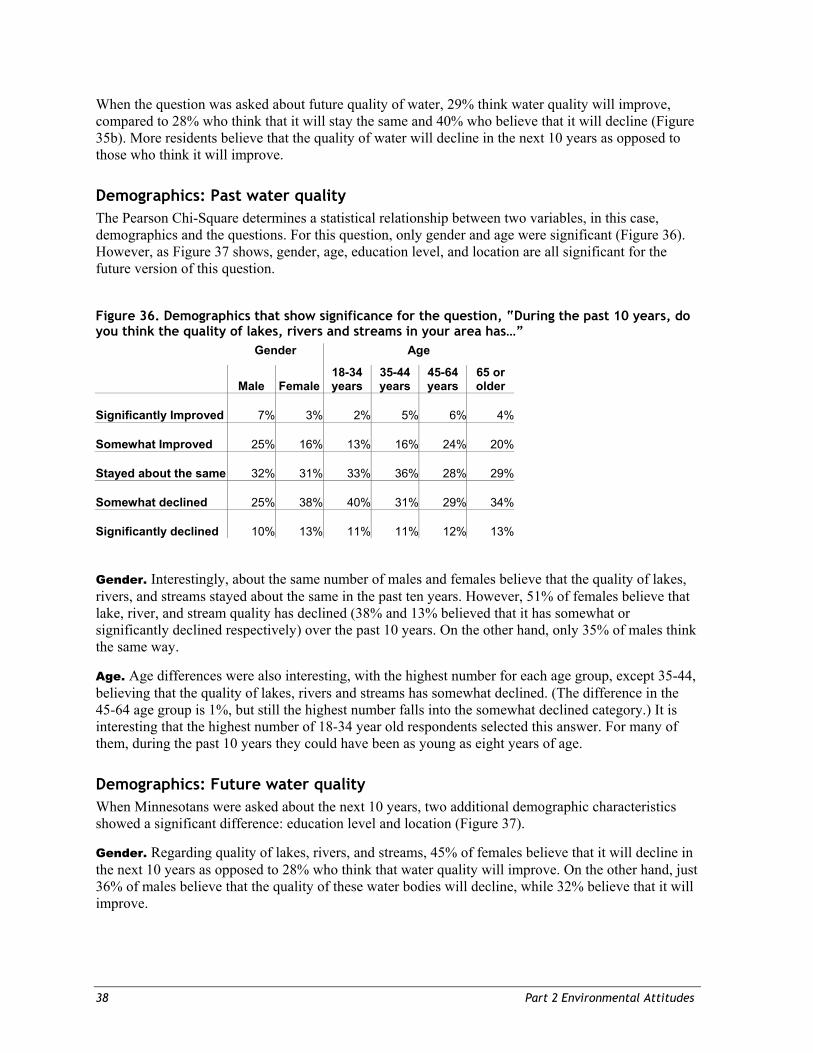
38 Part 2 Environmental Attitudes
When the question was asked about future quality of water, 29% think water quality will improve, compared to 28% who think that it will stay the same and 40% who believe that it will decline (Figure 35b). More residents believe that the quality of water will decline in the next 10 years as opposed to those who think it will improve.
Demographics: Past water quality The Pearson Chi-Square determines a statistical relationship between two variables, in this case, demographics and the questions. For this question, only gender and age were significant (Figure 36). However, as Figure 37 shows, gender, age, education level, and location are all significant for the future version of this question.
Figure 36. Demographics that show significance for the question, “During the past 10 years, do you think the quality of lakes, rivers and streams in your area has…”
Gender Age
Male Female 18-34 years
35-44 years
45-64 years
65 or older
Significantly Improved 7% 3% 2% 5% 6% 4%
Somewhat Improved 25% 16% 13% 16% 24% 20%
Stayed about the same 32% 31% 33% 36% 28% 29%
Somewhat declined 25% 38% 40% 31% 29% 34%
Significantly declined 10% 13% 11% 11% 12% 13%
Gender. Interestingly, about the same number of males and females believe that the quality of lakes, rivers, and streams stayed about the same in the past ten years. However, 51% of females believe that lake, river, and stream quality has declined (38% and 13% believed that it has somewhat or significantly declined respectively) over the past 10 years. On the other hand, only 35% of males think the same way.
Age. Age differences were also interesting, with the highest number for each age group, except 35-44, believing that the quality of lakes, rivers and streams has somewhat declined. (The difference in the 45-64 age group is 1%, but still the highest number falls into the somewhat declined category.) It is interesting that the highest number of 18-34 year old respondents selected this answer. For many of them, during the past 10 years they could have been as young as eight years of age.
Demographics: Future water quality When Minnesotans were asked about the next 10 years, two additional demographic characteristics showed a significant difference: education level and location (Figure 37).
Gender. Regarding quality of lakes, rivers, and streams, 45% of females believe that it will decline in the next 10 years as opposed to 28% who think that water quality will improve. On the other hand, just 36% of males believe that the quality of these water bodies will decline, while 32% believe that it will improve.
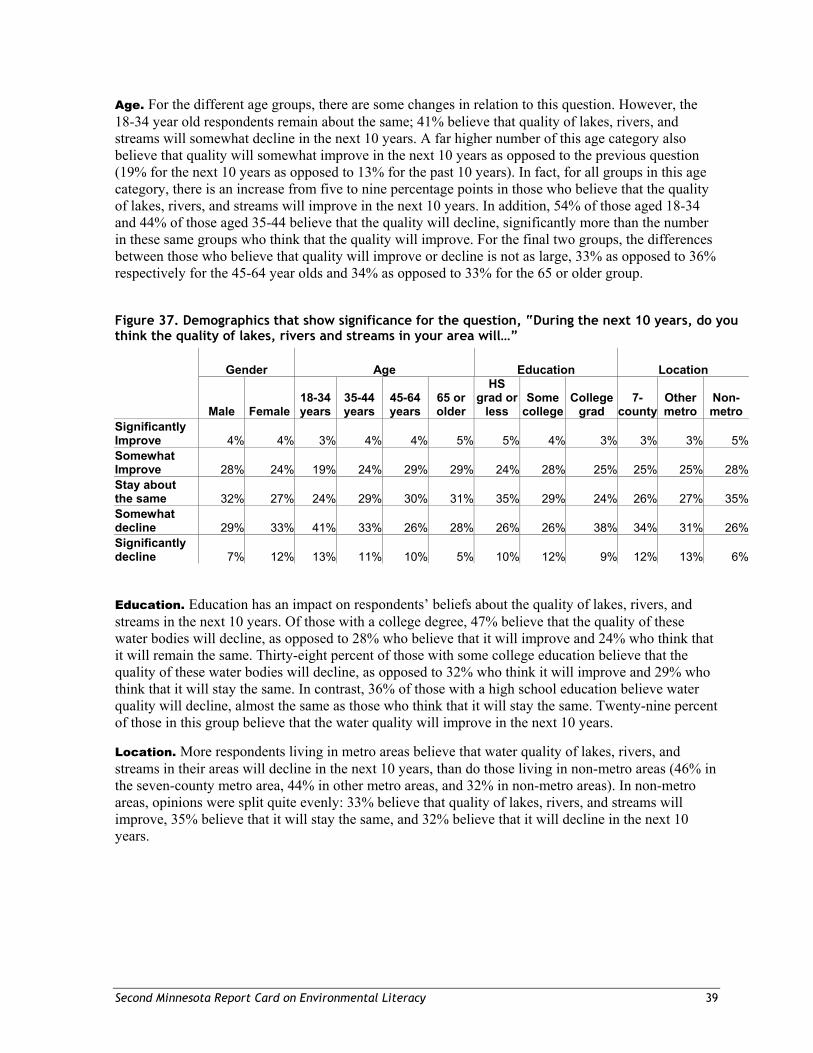
Second Minnesota Report Card on Environmental Literacy 39
Age. For the different age groups, there are some changes in relation to this question. However, the 18-34 year old respondents remain about the same; 41% believe that quality of lakes, rivers, and streams will somewhat decline in the next 10 years. A far higher number of this age category also believe that quality will somewhat improve in the next 10 years as opposed to the previous question (19% for the next 10 years as opposed to 13% for the past 10 years). In fact, for all groups in this age category, there is an increase from five to nine percentage points in those who believe that the quality of lakes, rivers, and streams will improve in the next 10 years. In addition, 54% of those aged 18-34 and 44% of those aged 35-44 believe that the quality will decline, significantly more than the number in these same groups who think that the quality will improve. For the final two groups, the differences between those who believe that quality will improve or decline is not as large, 33% as opposed to 36% respectively for the 45-64 year olds and 34% as opposed to 33% for the 65 or older group.
Figure 37. Demographics that show significance for the question, “During the next 10 years, do you think the quality of lakes, rivers and streams in your area will…”
Gender Age Education Location
Male Female 18-34 years
35-44 years
45-64 years
65 or older
HS grad or
less Some
collegeCollege
grad 7-
county Other metro
Non-metro
Significantly Improve 4% 4% 3% 4% 4% 5% 5% 4% 3% 3% 3% 5%Somewhat Improve 28% 24% 19% 24% 29% 29% 24% 28% 25% 25% 25% 28%Stay about the same 32% 27% 24% 29% 30% 31% 35% 29% 24% 26% 27% 35%Somewhat decline 29% 33% 41% 33% 26% 28% 26% 26% 38% 34% 31% 26%Significantly decline 7% 12% 13% 11% 10% 5% 10% 12% 9% 12% 13% 6%
Education. Education has an impact on respondents’ beliefs about the quality of lakes, rivers, and streams in the next 10 years. Of those with a college degree, 47% believe that the quality of these water bodies will decline, as opposed to 28% who believe that it will improve and 24% who think that it will remain the same. Thirty-eight percent of those with some college education believe that the quality of these water bodies will decline, as opposed to 32% who think it will improve and 29% who think that it will stay the same. In contrast, 36% of those with a high school education believe water quality will decline, almost the same as those who think that it will stay the same. Twenty-nine percent of those in this group believe that the water quality will improve in the next 10 years.
Location. More respondents living in metro areas believe that water quality of lakes, rivers, and streams in their areas will decline in the next 10 years, than do those living in non-metro areas (46% in the seven-county metro area, 44% in other metro areas, and 32% in non-metro areas). In non-metro areas, opinions were split quite evenly: 33% believe that quality of lakes, rivers, and streams will improve, 35% believe that it will stay the same, and 32% believe that it will decline in the next 10 years.
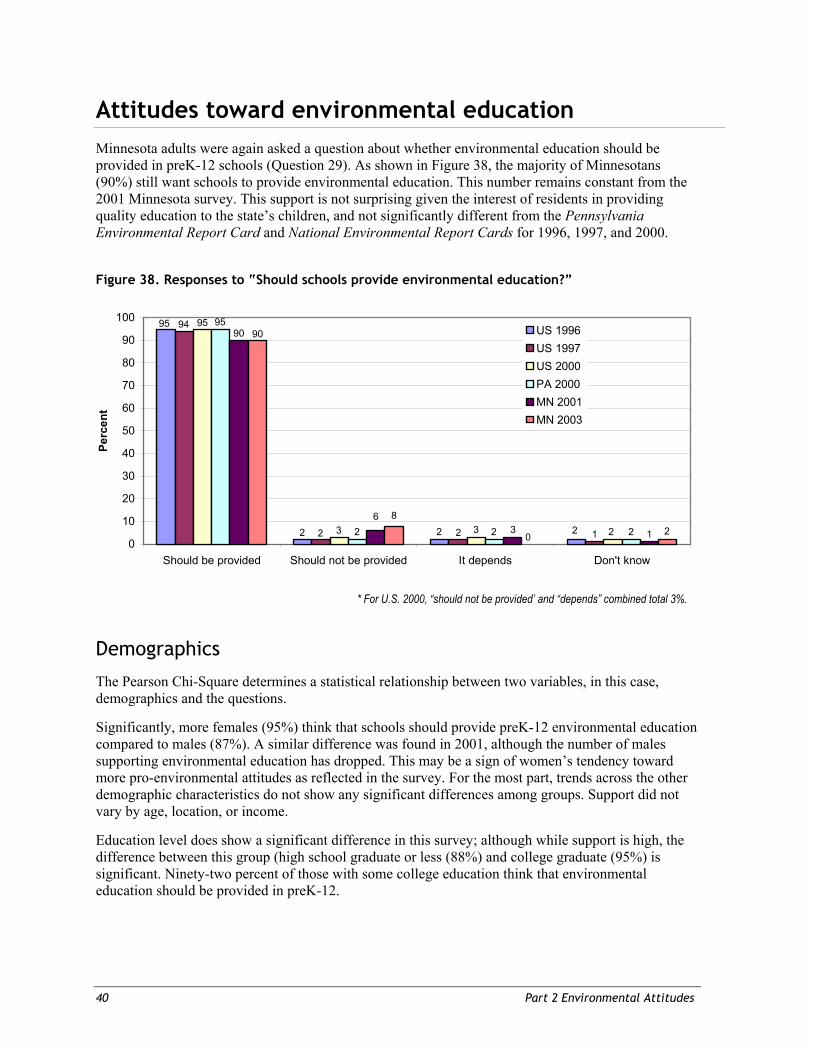
40 Part 2 Environmental Attitudes
Attitudes toward environmental education Minnesota adults were again asked a question about whether environmental education should be provided in preK-12 schools (Question 29). As shown in Figure 38, the majority of Minnesotans (90%) still want schools to provide environmental education. This number remains constant from the 2001 Minnesota survey. This support is not surprising given the interest of residents in providing quality education to the state’s children, and not significantly different from the Pennsylvania Environmental Report Card and National Environmental Report Cards for 1996, 1997, and 2000.
Figure 38. Responses to “Should schools provide environmental education?”
* For U.S. 2000, “should not be provided’ and “depends” combined total 3%.
Demographics
The Pearson Chi-Square determines a statistical relationship between two variables, in this case, demographics and the questions.
Significantly, more females (95%) think that schools should provide preK-12 environmental education compared to males (87%). A similar difference was found in 2001, although the number of males supporting environmental education has dropped. This may be a sign of women’s tendency toward more pro-environmental attitudes as reflected in the survey. For the most part, trends across the other demographic characteristics do not show any significant differences among groups. Support did not vary by age, location, or income.
Education level does show a significant difference in this survey; although while support is high, the difference between this group (high school graduate or less (88%) and college graduate (95%) is significant. Ninety-two percent of those with some college education think that environmental education should be provided in preK-12.
95
2 2 2
94
2 2 1
95
3 3 2
95
2 2 2
90
63 1
90
8
0 20
10
20
30
40
50
60
70
80
90
100
Should be provided Should not be provided It depends Don't know
Perc
ent
US 1996US 1997US 2000PA 2000MN 2001MN 2003
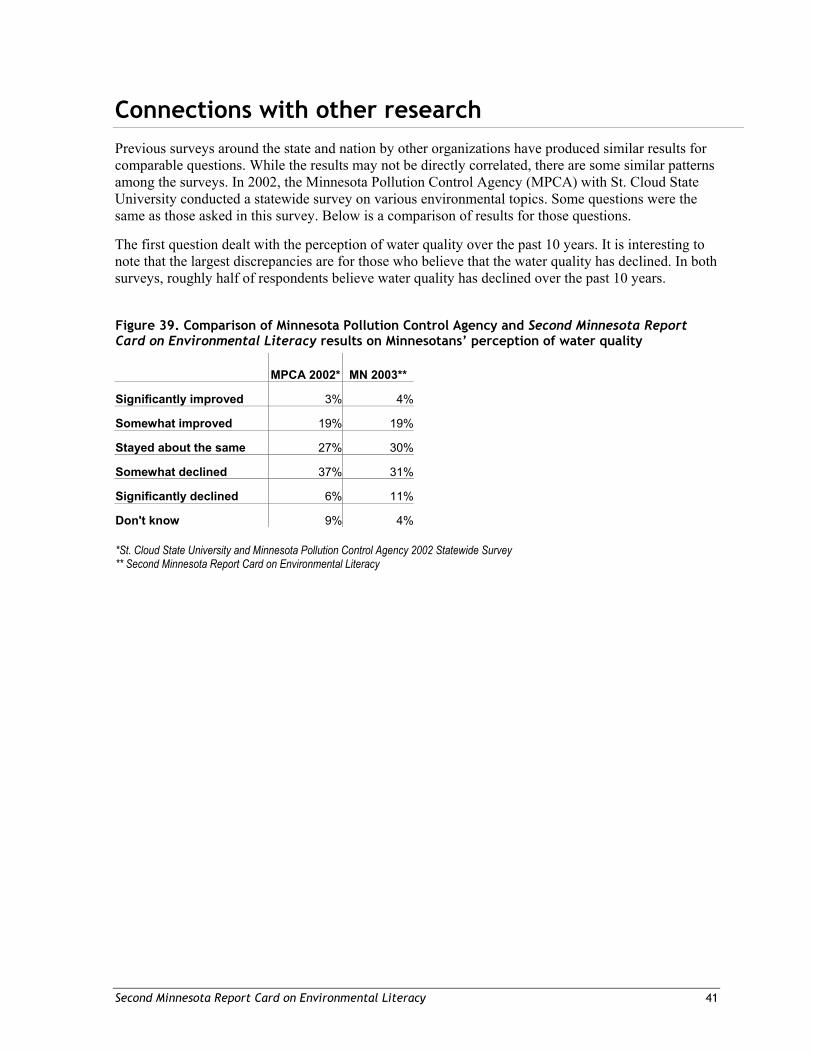
Second Minnesota Report Card on Environmental Literacy 41
Connections with other research Previous surveys around the state and nation by other organizations have produced similar results for comparable questions. While the results may not be directly correlated, there are some similar patterns among the surveys. In 2002, the Minnesota Pollution Control Agency (MPCA) with St. Cloud State University conducted a statewide survey on various environmental topics. Some questions were the same as those asked in this survey. Below is a comparison of results for those questions.
The first question dealt with the perception of water quality over the past 10 years. It is interesting to note that the largest discrepancies are for those who believe that the water quality has declined. In both surveys, roughly half of respondents believe water quality has declined over the past 10 years.
Figure 39. Comparison of Minnesota Pollution Control Agency and Second Minnesota Report Card on Environmental Literacy results on Minnesotans’ perception of water quality
MPCA 2002* MN 2003**
Significantly improved 3% 4%
Somewhat improved 19% 19%
Stayed about the same 27% 30%
Somewhat declined 37% 31%
Significantly declined 6% 11%
Don't know 9% 4%
*St. Cloud State University and Minnesota Pollution Control Agency 2002 Statewide Survey ** Second Minnesota Report Card on Environmental Literacy
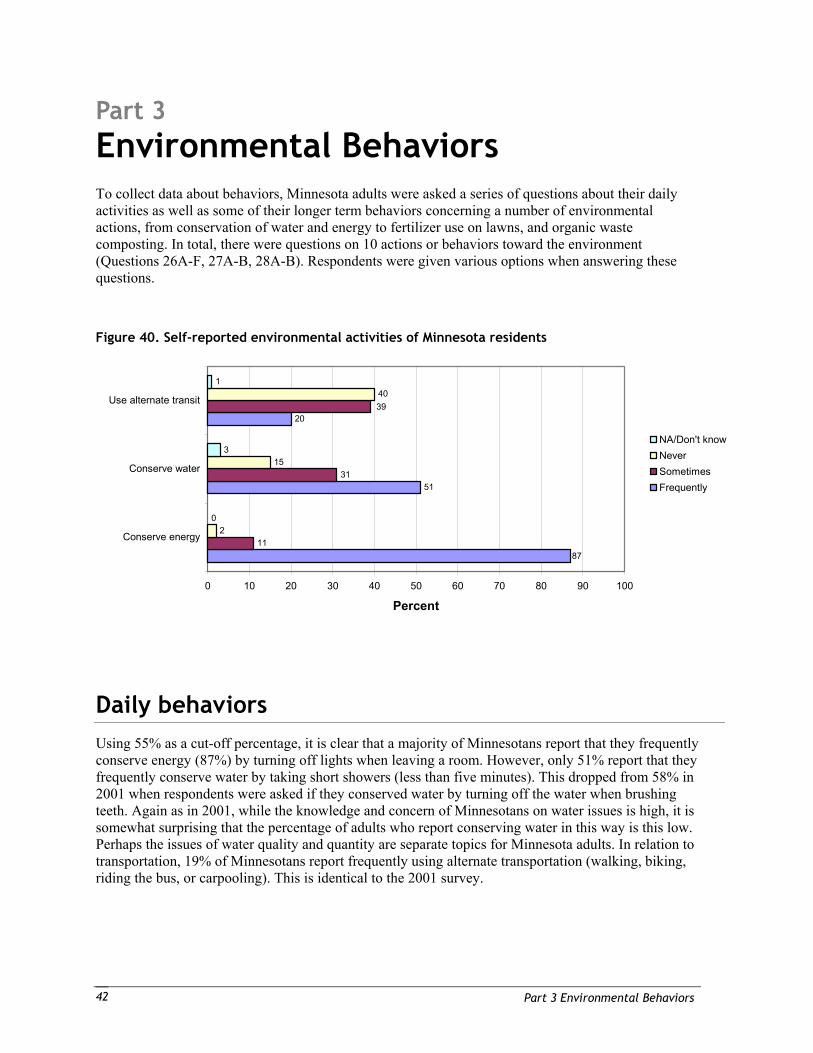
Part 3 Environmental Behaviors 42
Part 3 Environmental Behaviors
To collect data about behaviors, Minnesota adults were asked a series of questions about their daily activities as well as some of their longer term behaviors concerning a number of environmental actions, from conservation of water and energy to fertilizer use on lawns, and organic waste composting. In total, there were questions on 10 actions or behaviors toward the environment (Questions 26A-F, 27A-B, 28A-B). Respondents were given various options when answering these questions.
Figure 40. Self-reported environmental activities of Minnesota residents
Daily behaviors Using 55% as a cut-off percentage, it is clear that a majority of Minnesotans report that they frequently conserve energy (87%) by turning off lights when leaving a room. However, only 51% report that they frequently conserve water by taking short showers (less than five minutes). This dropped from 58% in 2001 when respondents were asked if they conserved water by turning off the water when brushing teeth. Again as in 2001, while the knowledge and concern of Minnesotans on water issues is high, it is somewhat surprising that the percentage of adults who report conserving water in this way is this low. Perhaps the issues of water quality and quantity are separate topics for Minnesota adults. In relation to transportation, 19% of Minnesotans report frequently using alternate transportation (walking, biking, riding the bus, or carpooling). This is identical to the 2001 survey.
51
20
11
31
2
15
40
0
3
1
87
39
0 10 20 30 40 50 60 70 80 90 100
Conserve energy
Conserve water
Use alternate transit
Percent
NA/Don't knowNeverSometimesFrequently
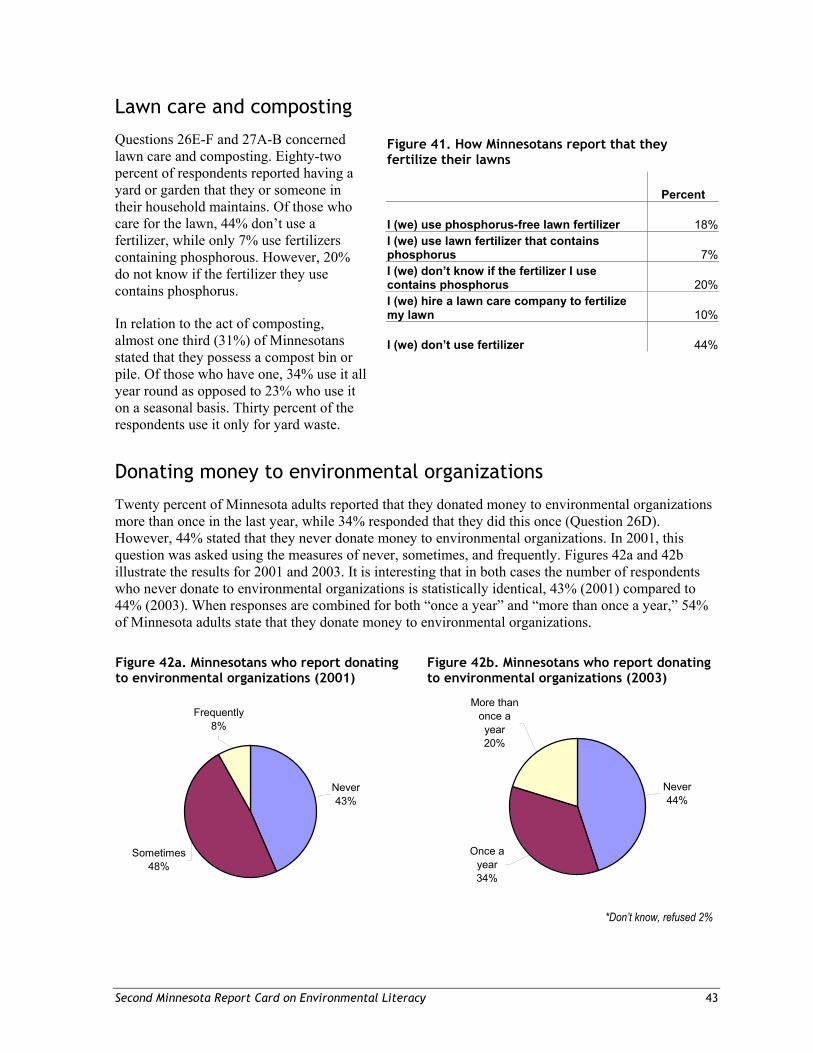
Second Minnesota Report Card on Environmental Literacy 43
Lawn care and composting
Questions 26E-F and 27A-B concerned lawn care and composting. Eighty-two percent of respondents reported having a yard or garden that they or someone in their household maintains. Of those who care for the lawn, 44% don’t use a fertilizer, while only 7% use fertilizers containing phosphorous. However, 20% do not know if the fertilizer they use contains phosphorus.
In relation to the act of composting, almost one third (31%) of Minnesotans stated that they possess a compost bin or pile. Of those who have one, 34% use it all year round as opposed to 23% who use it on a seasonal basis. Thirty percent of the respondents use it only for yard waste.
Donating money to environmental organizations
Twenty percent of Minnesota adults reported that they donated money to environmental organizations more than once in the last year, while 34% responded that they did this once (Question 26D). However, 44% stated that they never donate money to environmental organizations. In 2001, this question was asked using the measures of never, sometimes, and frequently. Figures 42a and 42b illustrate the results for 2001 and 2003. It is interesting that in both cases the number of respondents who never donate to environmental organizations is statistically identical, 43% (2001) compared to 44% (2003). When responses are combined for both “once a year” and “more than once a year,” 54% of Minnesota adults state that they donate money to environmental organizations.
Figure 42a. Minnesotans who report donating to environmental organizations (2001)
Figure 42b. Minnesotans who report donating to environmental organizations (2003)
*Don’t know, refused 2%
Figure 41. How Minnesotans report that they fertilize their lawns
Percent
I (we) use phosphorus-free lawn fertilizer 18%I (we) use lawn fertilizer that contains phosphorus 7%I (we) don’t know if the fertilizer I use contains phosphorus 20%I (we) hire a lawn care company to fertilize my lawn 10%
I (we) don’t use fertilizer 44%
Never44%
Once a year34%
More than once a year20%
Sometimes48%
Frequently8%
Never43%
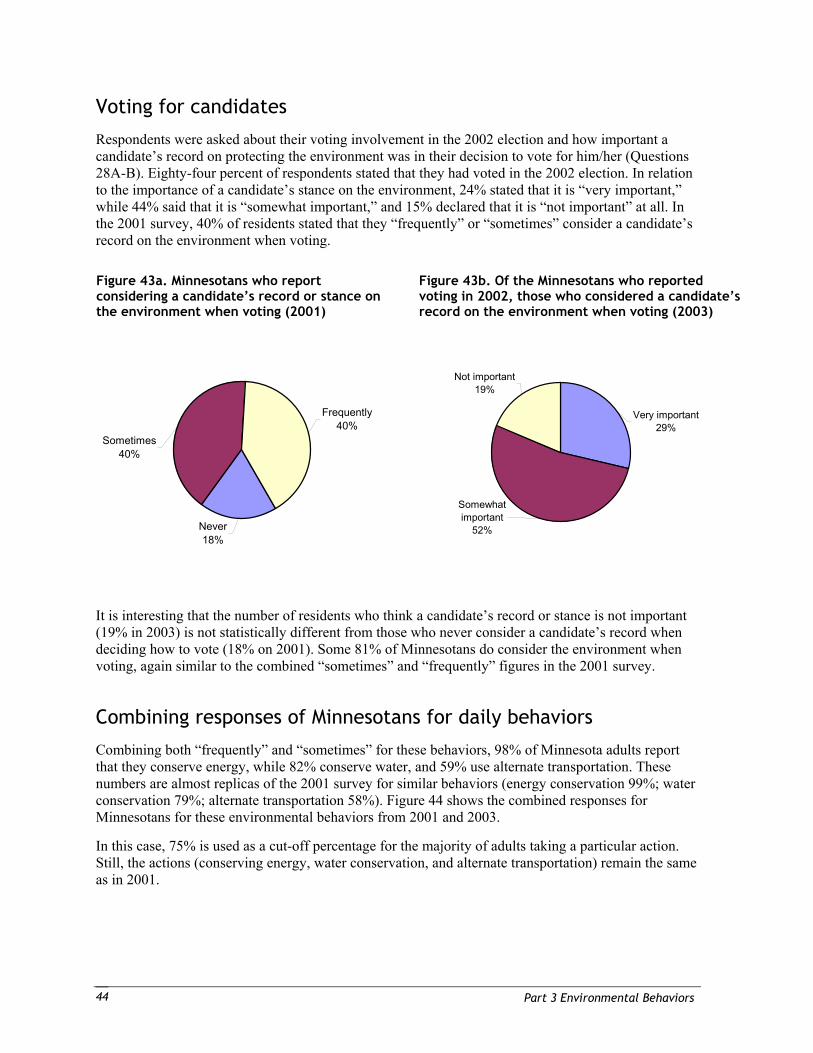
Part 3 Environmental Behaviors 44
Voting for candidates
Respondents were asked about their voting involvement in the 2002 election and how important a candidate’s record on protecting the environment was in their decision to vote for him/her (Questions 28A-B). Eighty-four percent of respondents stated that they had voted in the 2002 election. In relation to the importance of a candidate’s stance on the environment, 24% stated that it is “very important,” while 44% said that it is “somewhat important,” and 15% declared that it is “not important” at all. In the 2001 survey, 40% of residents stated that they “frequently” or “sometimes” consider a candidate’s record on the environment when voting.
Figure 43a. Minnesotans who report considering a candidate’s record or stance on the environment when voting (2001)
Figure 43b. Of the Minnesotans who reported voting in 2002, those who considered a candidate’srecord on the environment when voting (2003)
It is interesting that the number of residents who think a candidate’s record or stance is not important (19% in 2003) is not statistically different from those who never consider a candidate’s record when deciding how to vote (18% on 2001). Some 81% of Minnesotans do consider the environment when voting, again similar to the combined “sometimes” and “frequently” figures in the 2001 survey.
Combining responses of Minnesotans for daily behaviors
Combining both “frequently” and “sometimes” for these behaviors, 98% of Minnesota adults report that they conserve energy, while 82% conserve water, and 59% use alternate transportation. These numbers are almost replicas of the 2001 survey for similar behaviors (energy conservation 99%; water conservation 79%; alternate transportation 58%). Figure 44 shows the combined responses for Minnesotans for these environmental behaviors from 2001 and 2003.
In this case, 75% is used as a cut-off percentage for the majority of adults taking a particular action. Still, the actions (conserving energy, water conservation, and alternate transportation) remain the same as in 2001.
Sometimes40%
Never18%
Frequently40%
Somewhat important
52%
Not important19%
Very important29%
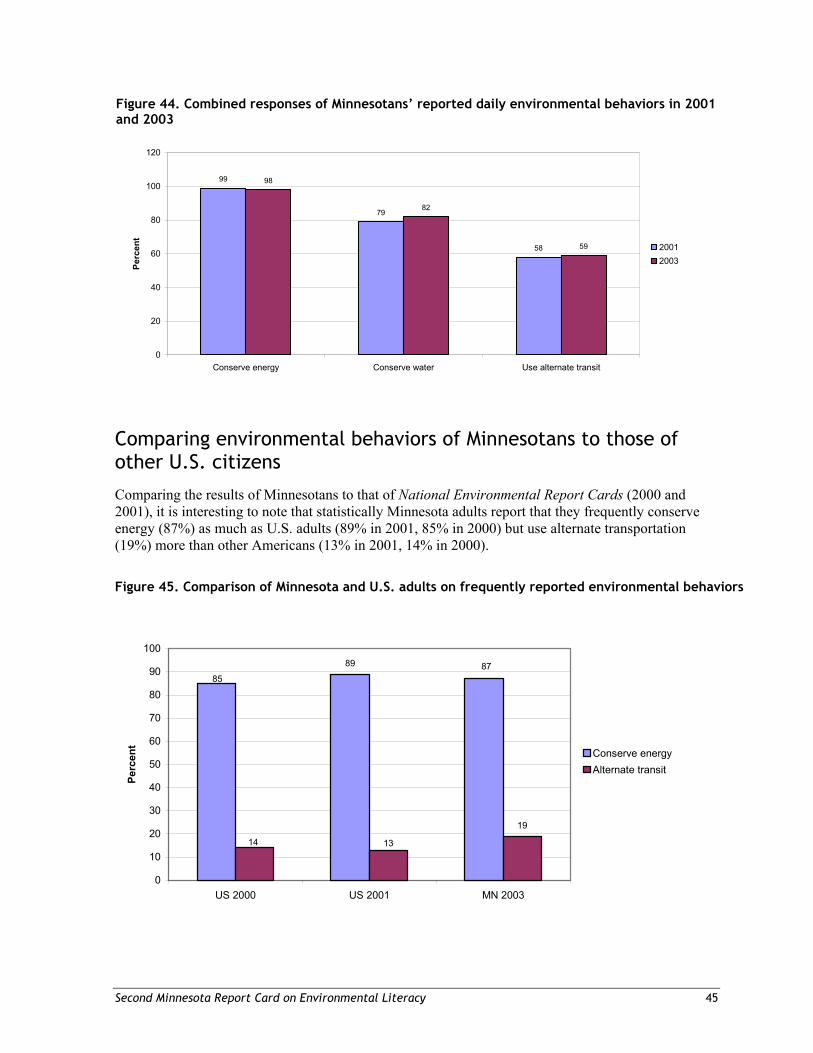
Second Minnesota Report Card on Environmental Literacy 45
Figure 44. Combined responses of Minnesotans’ reported daily environmental behaviors in 2001 and 2003
Comparing environmental behaviors of Minnesotans to those of other U.S. citizens
Comparing the results of Minnesotans to that of National Environmental Report Cards (2000 and 2001), it is interesting to note that statistically Minnesota adults report that they frequently conserve energy (87%) as much as U.S. adults (89% in 2001, 85% in 2000) but use alternate transportation (19%) more than other Americans (13% in 2001, 14% in 2000).
Figure 45. Comparison of Minnesota and U.S. adults on frequently reported environmental behaviors
89
19
8587
14 13
0
10
20
30
40
50
60
70
80
90
100
US 2000 US 2001 MN 2003
Perc
ent
Conserve energyAlternate transit
99
79
58
98
82
59
0
20
40
60
80
100
120
Conserve energy Conserve water Use alternate transit
Perc
ent
20012003
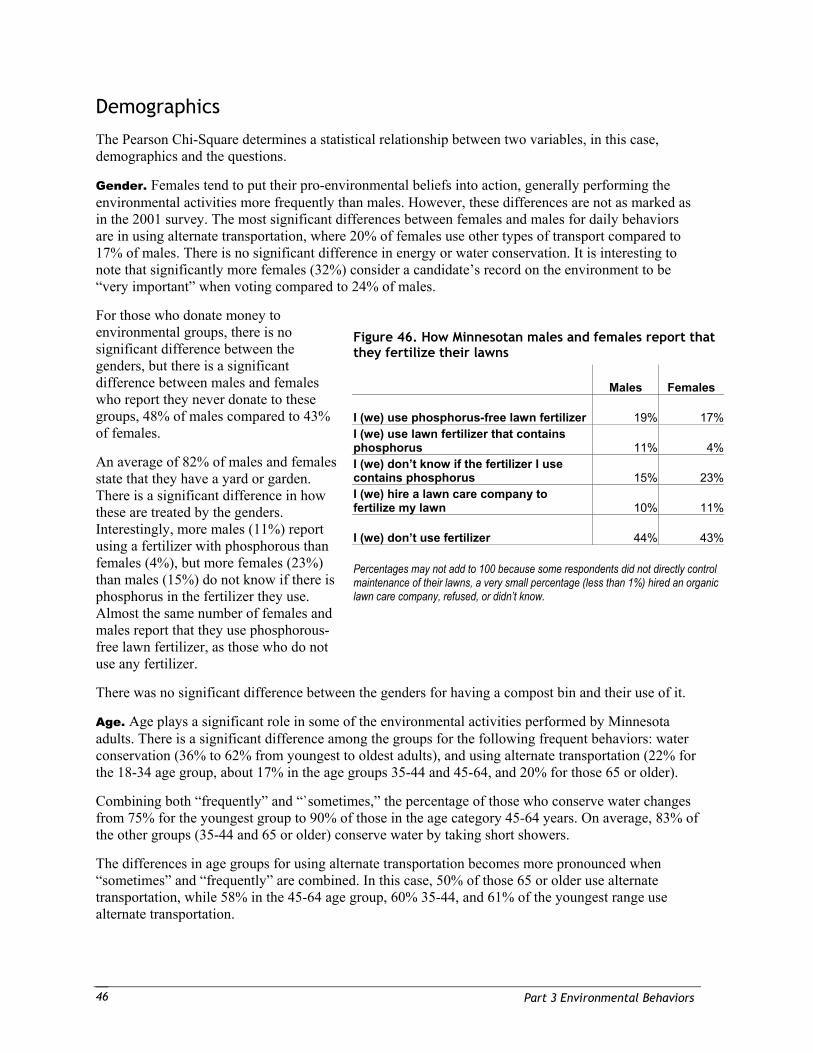
Part 3 Environmental Behaviors 46
Demographics
The Pearson Chi-Square determines a statistical relationship between two variables, in this case, demographics and the questions.
Gender. Females tend to put their pro-environmental beliefs into action, generally performing the environmental activities more frequently than males. However, these differences are not as marked as in the 2001 survey. The most significant differences between females and males for daily behaviors are in using alternate transportation, where 20% of females use other types of transport compared to 17% of males. There is no significant difference in energy or water conservation. It is interesting to note that significantly more females (32%) consider a candidate’s record on the environment to be “very important” when voting compared to 24% of males.
For those who donate money to environmental groups, there is no significant difference between the genders, but there is a significant difference between males and females who report they never donate to these groups, 48% of males compared to 43% of females.
An average of 82% of males and females state that they have a yard or garden. There is a significant difference in how these are treated by the genders. Interestingly, more males (11%) report using a fertilizer with phosphorous than females (4%), but more females (23%) than males (15%) do not know if there is phosphorus in the fertilizer they use. Almost the same number of females and males report that they use phosphorous-free lawn fertilizer, as those who do not use any fertilizer.
There was no significant difference between the genders for having a compost bin and their use of it.
Age. Age plays a significant role in some of the environmental activities performed by Minnesota adults. There is a significant difference among the groups for the following frequent behaviors: water conservation (36% to 62% from youngest to oldest adults), and using alternate transportation (22% for the 18-34 age group, about 17% in the age groups 35-44 and 45-64, and 20% for those 65 or older).
Combining both “frequently” and “`sometimes,” the percentage of those who conserve water changes from 75% for the youngest group to 90% of those in the age category 45-64 years. On average, 83% of the other groups (35-44 and 65 or older) conserve water by taking short showers.
The differences in age groups for using alternate transportation becomes more pronounced when “sometimes” and “frequently” are combined. In this case, 50% of those 65 or older use alternate transportation, while 58% in the 45-64 age group, 60% 35-44, and 61% of the youngest range use alternate transportation.
Figure 46. How Minnesotan males and females report that they fertilize their lawns
Males Females
I (we) use phosphorus-free lawn fertilizer 19% 17%I (we) use lawn fertilizer that contains phosphorus 11% 4%I (we) don’t know if the fertilizer I use contains phosphorus 15% 23%I (we) hire a lawn care company to fertilize my lawn 10% 11%
I (we) don’t use fertilizer 44% 43%
Percentages may not add to 100 because some respondents did not directly control maintenance of their lawns, a very small percentage (less than 1%) hired an organic lawn care company, refused, or didn’t know.
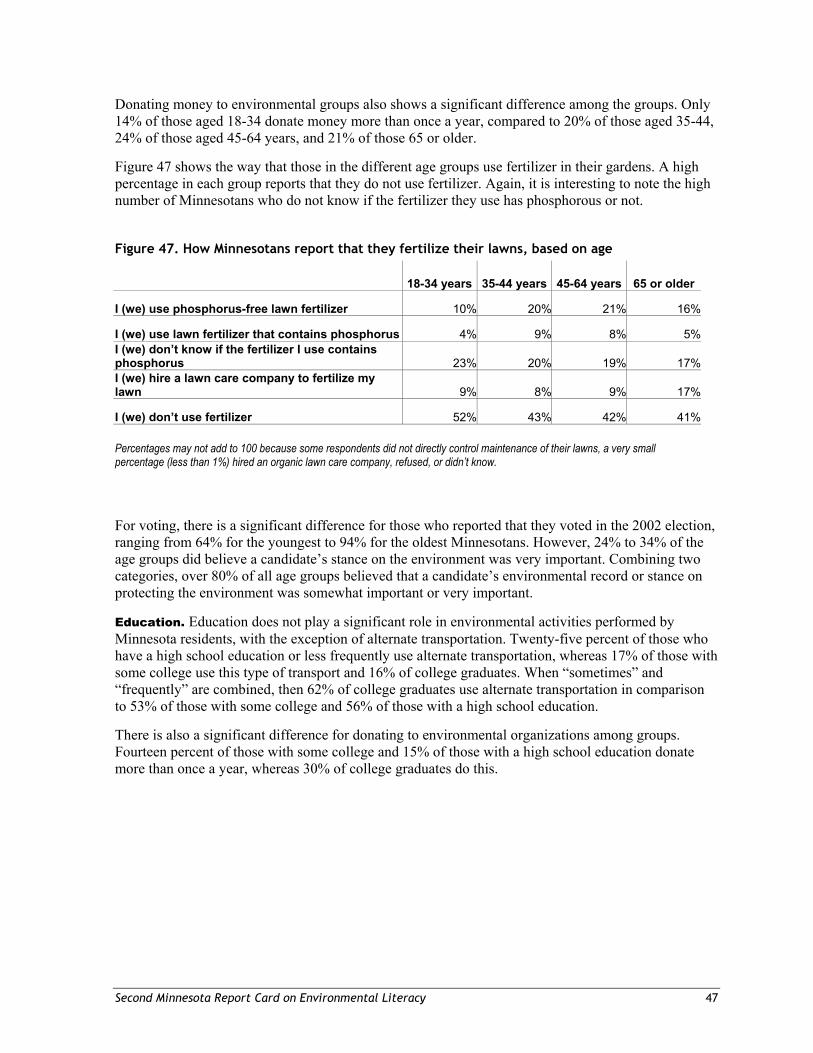
Second Minnesota Report Card on Environmental Literacy 47
Donating money to environmental groups also shows a significant difference among the groups. Only 14% of those aged 18-34 donate money more than once a year, compared to 20% of those aged 35-44, 24% of those aged 45-64 years, and 21% of those 65 or older.
Figure 47 shows the way that those in the different age groups use fertilizer in their gardens. A high percentage in each group reports that they do not use fertilizer. Again, it is interesting to note the high number of Minnesotans who do not know if the fertilizer they use has phosphorous or not.
Figure 47. How Minnesotans report that they fertilize their lawns, based on age
18-34 years 35-44 years 45-64 years 65 or older
I (we) use phosphorus-free lawn fertilizer 10% 20% 21% 16%
I (we) use lawn fertilizer that contains phosphorus 4% 9% 8% 5%I (we) don’t know if the fertilizer I use contains phosphorus 23% 20% 19% 17%I (we) hire a lawn care company to fertilize my lawn 9% 8% 9% 17%
I (we) don’t use fertilizer 52% 43% 42% 41%
Percentages may not add to 100 because some respondents did not directly control maintenance of their lawns, a very small percentage (less than 1%) hired an organic lawn care company, refused, or didn’t know.
For voting, there is a significant difference for those who reported that they voted in the 2002 election, ranging from 64% for the youngest to 94% for the oldest Minnesotans. However, 24% to 34% of the age groups did believe a candidate’s stance on the environment was very important. Combining two categories, over 80% of all age groups believed that a candidate’s environmental record or stance on protecting the environment was somewhat important or very important.
Education. Education does not play a significant role in environmental activities performed by Minnesota residents, with the exception of alternate transportation. Twenty-five percent of those who have a high school education or less frequently use alternate transportation, whereas 17% of those with some college use this type of transport and 16% of college graduates. When “sometimes” and “frequently” are combined, then 62% of college graduates use alternate transportation in comparison to 53% of those with some college and 56% of those with a high school education.
There is also a significant difference for donating to environmental organizations among groups. Fourteen percent of those with some college and 15% of those with a high school education donate more than once a year, whereas 30% of college graduates do this.
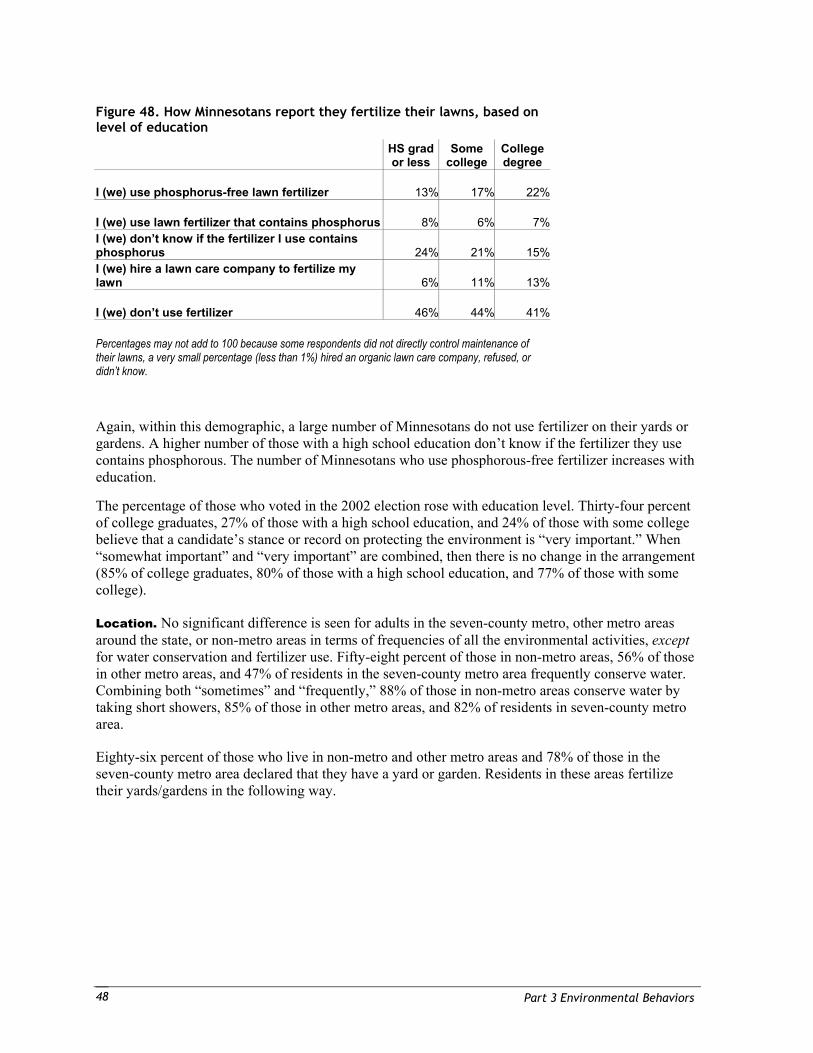
Part 3 Environmental Behaviors 48
Figure 48. How Minnesotans report they fertilize their lawns, based on level of education
HS grad or less
Some college
College degree
I (we) use phosphorus-free lawn fertilizer 13% 17% 22%
I (we) use lawn fertilizer that contains phosphorus 8% 6% 7%I (we) don’t know if the fertilizer I use contains phosphorus 24% 21% 15%I (we) hire a lawn care company to fertilize my lawn 6% 11% 13%
I (we) don’t use fertilizer 46% 44% 41%
Percentages may not add to 100 because some respondents did not directly control maintenance of their lawns, a very small percentage (less than 1%) hired an organic lawn care company, refused, or didn’t know.
Again, within this demographic, a large number of Minnesotans do not use fertilizer on their yards or gardens. A higher number of those with a high school education don’t know if the fertilizer they use contains phosphorous. The number of Minnesotans who use phosphorous-free fertilizer increases with education.
The percentage of those who voted in the 2002 election rose with education level. Thirty-four percent of college graduates, 27% of those with a high school education, and 24% of those with some college believe that a candidate’s stance or record on protecting the environment is “very important.” When “somewhat important” and “very important” are combined, then there is no change in the arrangement (85% of college graduates, 80% of those with a high school education, and 77% of those with some college).
Location. No significant difference is seen for adults in the seven-county metro, other metro areas around the state, or non-metro areas in terms of frequencies of all the environmental activities, except for water conservation and fertilizer use. Fifty-eight percent of those in non-metro areas, 56% of those in other metro areas, and 47% of residents in the seven-county metro area frequently conserve water. Combining both “sometimes” and “frequently,” 88% of those in non-metro areas conserve water by taking short showers, 85% of those in other metro areas, and 82% of residents in seven-county metro area.
Eighty-six percent of those who live in non-metro and other metro areas and 78% of those in the seven-county metro area declared that they have a yard or garden. Residents in these areas fertilize their yards/gardens in the following way.
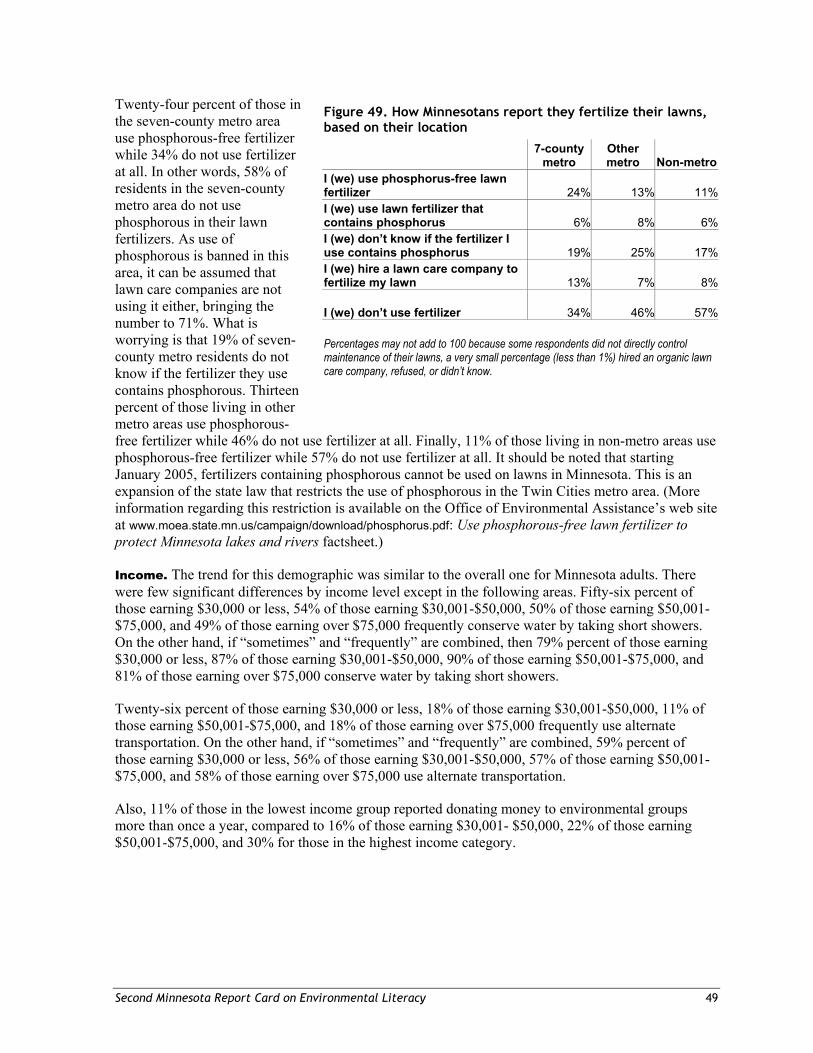
Second Minnesota Report Card on Environmental Literacy 49
Twenty-four percent of those in the seven-county metro area use phosphorous-free fertilizer while 34% do not use fertilizer at all. In other words, 58% of residents in the seven-county metro area do not use phosphorous in their lawn fertilizers. As use of phosphorous is banned in this area, it can be assumed that lawn care companies are not using it either, bringing the number to 71%. What is worrying is that 19% of seven-county metro residents do not know if the fertilizer they use contains phosphorous. Thirteen percent of those living in other metro areas use phosphorous-free fertilizer while 46% do not use fertilizer at all. Finally, 11% of those living in non-metro areas use phosphorous-free fertilizer while 57% do not use fertilizer at all. It should be noted that starting January 2005, fertilizers containing phosphorous cannot be used on lawns in Minnesota. This is an expansion of the state law that restricts the use of phosphorous in the Twin Cities metro area. (More information regarding this restriction is available on the Office of Environmental Assistance’s web site at www.moea.state.mn.us/campaign/download/phosphorus.pdf: Use phosphorous-free lawn fertilizer to protect Minnesota lakes and rivers factsheet.)
Income. The trend for this demographic was similar to the overall one for Minnesota adults. There were few significant differences by income level except in the following areas. Fifty-six percent of those earning $30,000 or less, 54% of those earning $30,001-$50,000, 50% of those earning $50,001-$75,000, and 49% of those earning over $75,000 frequently conserve water by taking short showers. On the other hand, if “sometimes” and “frequently” are combined, then 79% percent of those earning $30,000 or less, 87% of those earning $30,001-$50,000, 90% of those earning $50,001-$75,000, and 81% of those earning over $75,000 conserve water by taking short showers.
Twenty-six percent of those earning $30,000 or less, 18% of those earning $30,001-$50,000, 11% of those earning $50,001-$75,000, and 18% of those earning over $75,000 frequently use alternate transportation. On the other hand, if “sometimes” and “frequently” are combined, 59% percent of those earning $30,000 or less, 56% of those earning $30,001-$50,000, 57% of those earning $50,001-$75,000, and 58% of those earning over $75,000 use alternate transportation.
Also, 11% of those in the lowest income group reported donating money to environmental groups more than once a year, compared to 16% of those earning $30,001- $50,000, 22% of those earning $50,001-$75,000, and 30% for those in the highest income category.
Figure 49. How Minnesotans report they fertilize their lawns, based on their location
7-county
metro Other metro Non-metro
I (we) use phosphorus-free lawn fertilizer 24% 13% 11%I (we) use lawn fertilizer that contains phosphorus 6% 8% 6%I (we) don’t know if the fertilizer I use contains phosphorus 19% 25% 17%I (we) hire a lawn care company to fertilize my lawn 13% 7% 8%
I (we) don’t use fertilizer 34% 46% 57%
Percentages may not add to 100 because some respondents did not directly control maintenance of their lawns, a very small percentage (less than 1%) hired an organic lawn care company, refused, or didn’t know.
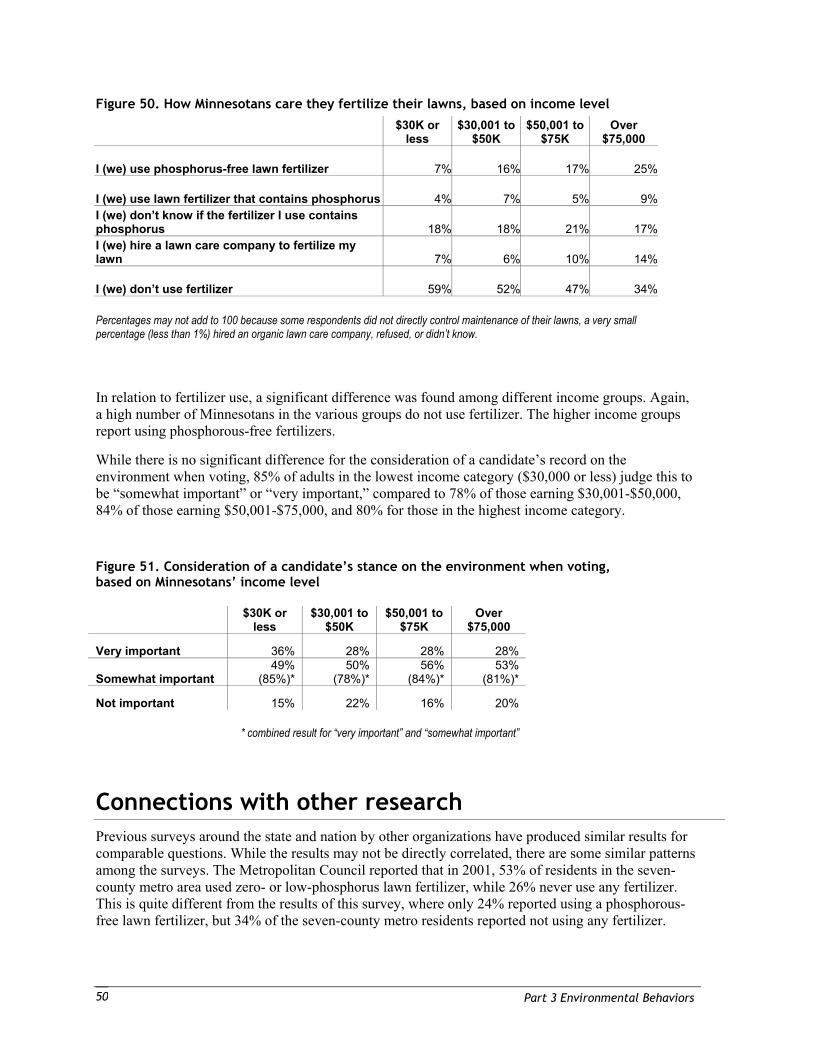
Part 3 Environmental Behaviors 50
Figure 50. How Minnesotans care they fertilize their lawns, based on income level
$30K or
less $30,001 to
$50K $50,001 to
$75K Over
$75,000
I (we) use phosphorus-free lawn fertilizer 7% 16% 17% 25%
I (we) use lawn fertilizer that contains phosphorus 4% 7% 5% 9%I (we) don’t know if the fertilizer I use contains phosphorus 18% 18% 21% 17%I (we) hire a lawn care company to fertilize my lawn 7% 6% 10% 14%
I (we) don’t use fertilizer 59% 52% 47% 34%
Percentages may not add to 100 because some respondents did not directly control maintenance of their lawns, a very small percentage (less than 1%) hired an organic lawn care company, refused, or didn’t know.
In relation to fertilizer use, a significant difference was found among different income groups. Again, a high number of Minnesotans in the various groups do not use fertilizer. The higher income groups report using phosphorous-free fertilizers.
While there is no significant difference for the consideration of a candidate’s record on the environment when voting, 85% of adults in the lowest income category ($30,000 or less) judge this to be “somewhat important” or “very important,” compared to 78% of those earning $30,001-$50,000, 84% of those earning $50,001-$75,000, and 80% for those in the highest income category.
Figure 51. Consideration of a candidate’s stance on the environment when voting, based on Minnesotans’ income level
$30K or less
$30,001 to $50K
$50,001 to $75K
Over $75,000
Very important 36% 28% 28% 28%
Somewhat important 49%
(85%)* 50%
(78%)* 56%
(84%)* 53%
(81%)*
Not important 15% 22% 16% 20%
* combined result for “very important” and “somewhat important”
Connections with other research Previous surveys around the state and nation by other organizations have produced similar results for comparable questions. While the results may not be directly correlated, there are some similar patterns among the surveys. The Metropolitan Council reported that in 2001, 53% of residents in the seven-county metro area used zero- or low-phosphorus lawn fertilizer, while 26% never use any fertilizer. This is quite different from the results of this survey, where only 24% reported using a phosphorous-free lawn fertilizer, but 34% of the seven-county metro residents reported not using any fertilizer.
Second Minnesota Report Card on Environmental Literacy 51
Part 4 Environmental Literacy Integrating knowledge, attitudes, and behavior This statewide survey has reported on Minnesota adults’ environmental knowledge, attitudes, and behaviors. This part of the report combines the results of the different sections in an integrated manner and examines the possible influences of each component (knowledge, attitudes, and behaviors) on the other ones.
Self-reported knowledge of the environment By their own estimation, Minnesota residents believe themselves to be fairly knowledgeable about environmental issues and problems. Sixty percent rate themselves as having a lot (8%) or a fair amount (52%) of knowledge about the environment (in 2001, 11% and 54% respectively), a decrease of 5 percentage points from the previous Minnesota survey. Thirty-three percent of respondents (in 2001, 31%) believe that they have only a little knowledge about environmental issues and problems, while 7% (in 2001, 5%) indicated that they know practically nothing about these topics. While these numbers seem to follow the U.S. trends overall (a lot 11%, a fair amount 59%, only a little 24%, and practically nothing 6%, as reported in the National Environmental Report Card, 2000), there seems to be a recognition that perhaps Minnesota residents are not as sure as they were two years ago about their depth of environmental knowledge.
Demographics
The Pearson Chi-Square determines a statistical relationship between two variables, in this case, demographics and the questions. The relationship between self-reported knowledge and education is significant, with 71% (in 2001, 74%) of college graduates believing that they are fairly knowledgeable about environmental issues and problems, compared to 57% (in 2001, 67%) of respondents with some college and 48% (in 2001, 51%) of those who are high school educated.
Significantly more respondents in higher income groups believe that they are more knowledgeable about environmental issues and problems than in the lower groups (67% for those earning over $75,000, 63% between $50,000-$75,000, 64% between $30,000-$50,000, and 49% of those earning $30,000 or less). Interestingly in 2001, 75% of those earning over $75,000, 67% earning $50,000-$75,000, 61% between $30,000-$50,000, and 54% of those earning $30,000 or less reported that they were fairly knowledgeable about environmental issues and problems. There is significant movement within these income groups except for the lower group.
Self-assessed knowledge is also significantly higher among men than women (70% vs. 53%; in 2001, 77% vs. 56%). This is a significant decrease for males from 2001. Age also shows some significance, with 65% of those aged 45-64 years reporting that they are fairly knowledgeable about environmental issues and problems while 62% of those aged 65 or older, 59% of those aged 35-44, and 50% of those aged 18-34 report that they are fairly knowledgeable about environmental issues and problems. Location is not significant in relation to self-reported knowledge.
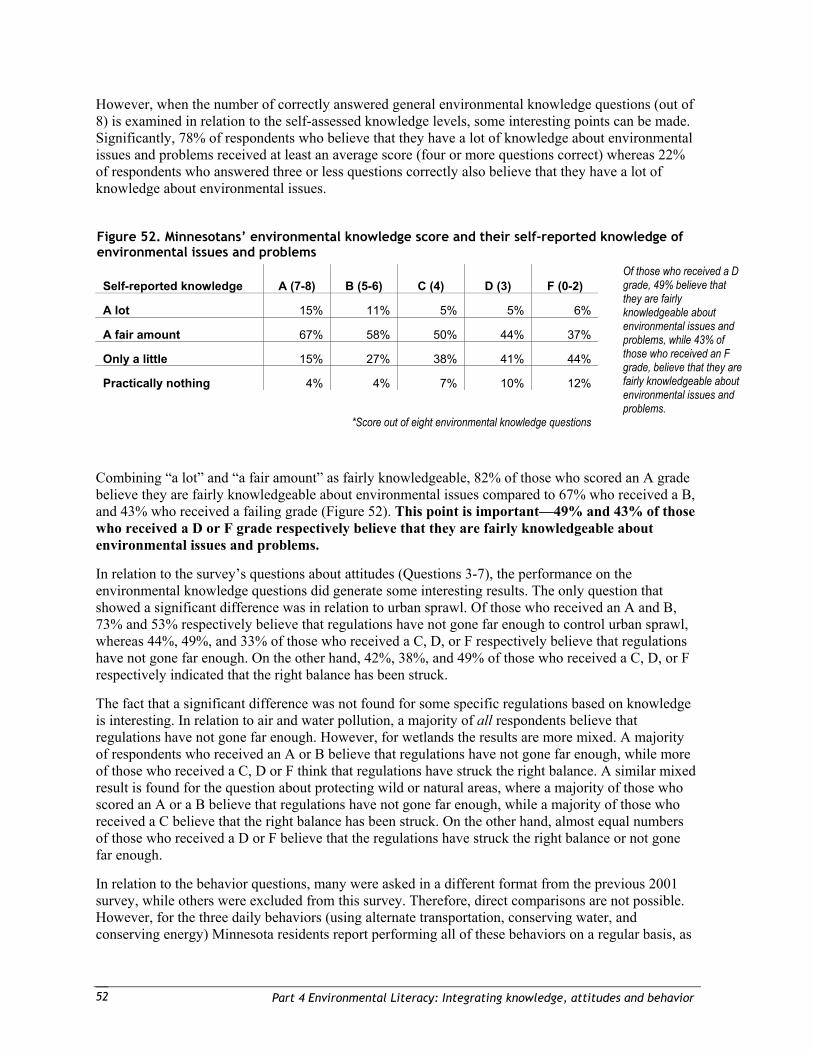
Part 4 Environmental Literacy: Integrating knowledge, attitudes and behavior 52
However, when the number of correctly answered general environmental knowledge questions (out of 8) is examined in relation to the self-assessed knowledge levels, some interesting points can be made. Significantly, 78% of respondents who believe that they have a lot of knowledge about environmental issues and problems received at least an average score (four or more questions correct) whereas 22% of respondents who answered three or less questions correctly also believe that they have a lot of knowledge about environmental issues.
Figure 52. Minnesotans’ environmental knowledge score and their self-reported knowledge of environmental issues and problems
Self-reported knowledge A (7-8) B (5-6) C (4) D (3) F (0-2)
A lot 15% 11% 5% 5% 6%
A fair amount 67% 58% 50% 44% 37%
Only a little 15% 27% 38% 41% 44%
Practically nothing 4% 4% 7% 10% 12%
*Score out of eight environmental knowledge questions
Of those who received a D grade, 49% believe that they are fairly knowledgeable about environmental issues and problems, while 43% of those who received an F grade, believe that they are fairly knowledgeable about environmental issues and problems.
Combining “a lot” and “a fair amount” as fairly knowledgeable, 82% of those who scored an A grade believe they are fairly knowledgeable about environmental issues compared to 67% who received a B, and 43% who received a failing grade (Figure 52). This point is important—49% and 43% of those who received a D or F grade respectively believe that they are fairly knowledgeable about environmental issues and problems.
In relation to the survey’s questions about attitudes (Questions 3-7), the performance on the environmental knowledge questions did generate some interesting results. The only question that showed a significant difference was in relation to urban sprawl. Of those who received an A and B, 73% and 53% respectively believe that regulations have not gone far enough to control urban sprawl, whereas 44%, 49%, and 33% of those who received a C, D, or F respectively believe that regulations have not gone far enough. On the other hand, 42%, 38%, and 49% of those who received a C, D, or F respectively indicated that the right balance has been struck.
The fact that a significant difference was not found for some specific regulations based on knowledge is interesting. In relation to air and water pollution, a majority of all respondents believe that regulations have not gone far enough. However, for wetlands the results are more mixed. A majority of respondents who received an A or B believe that regulations have not gone far enough, while more of those who received a C, D or F think that regulations have struck the right balance. A similar mixed result is found for the question about protecting wild or natural areas, where a majority of those who scored an A or a B believe that regulations have not gone far enough, while a majority of those who received a C believe that the right balance has been struck. On the other hand, almost equal numbers of those who received a D or F believe that the regulations have struck the right balance or not gone far enough.
In relation to the behavior questions, many were asked in a different format from the previous 2001 survey, while others were excluded from this survey. Therefore, direct comparisons are not possible. However, for the three daily behaviors (using alternate transportation, conserving water, and conserving energy) Minnesota residents report performing all of these behaviors on a regular basis, as
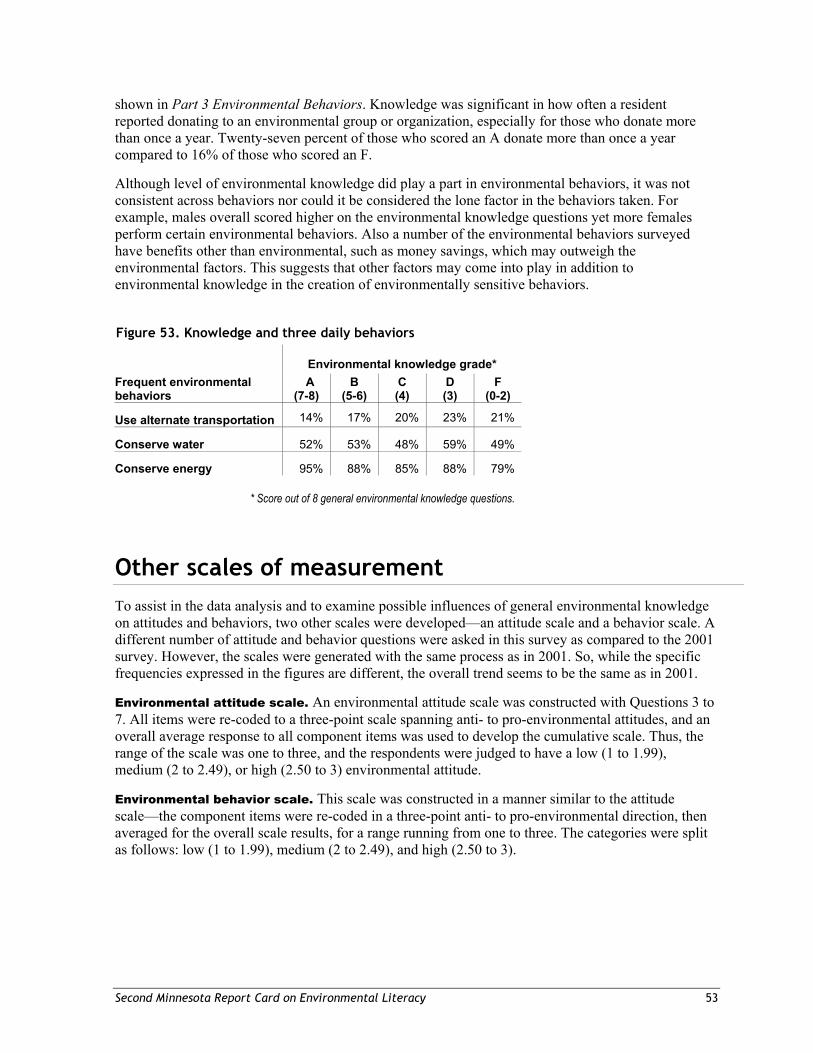
Second Minnesota Report Card on Environmental Literacy 53
shown in Part 3 Environmental Behaviors. Knowledge was significant in how often a resident reported donating to an environmental group or organization, especially for those who donate more than once a year. Twenty-seven percent of those who scored an A donate more than once a year compared to 16% of those who scored an F.
Although level of environmental knowledge did play a part in environmental behaviors, it was not consistent across behaviors nor could it be considered the lone factor in the behaviors taken. For example, males overall scored higher on the environmental knowledge questions yet more females perform certain environmental behaviors. Also a number of the environmental behaviors surveyed have benefits other than environmental, such as money savings, which may outweigh the environmental factors. This suggests that other factors may come into play in addition to environmental knowledge in the creation of environmentally sensitive behaviors.
Figure 53. Knowledge and three daily behaviors
Environmental knowledge grade* Frequent environmental behaviors
A (7-8)
B (5-6)
C (4)
D (3)
F (0-2)
Use alternate transportation 14% 17% 20% 23% 21%
Conserve water 52% 53% 48% 59% 49%
Conserve energy 95% 88% 85% 88% 79%
* Score out of 8 general environmental knowledge questions.
Other scales of measurement To assist in the data analysis and to examine possible influences of general environmental knowledge on attitudes and behaviors, two other scales were developed—an attitude scale and a behavior scale. A different number of attitude and behavior questions were asked in this survey as compared to the 2001 survey. However, the scales were generated with the same process as in 2001. So, while the specific frequencies expressed in the figures are different, the overall trend seems to be the same as in 2001.
Environmental attitude scale. An environmental attitude scale was constructed with Questions 3 to 7. All items were re-coded to a three-point scale spanning anti- to pro-environmental attitudes, and an overall average response to all component items was used to develop the cumulative scale. Thus, the range of the scale was one to three, and the respondents were judged to have a low (1 to 1.99), medium (2 to 2.49), or high (2.50 to 3) environmental attitude.
Environmental behavior scale. This scale was constructed in a manner similar to the attitude scale—the component items were re-coded in a three-point anti- to pro-environmental direction, then averaged for the overall scale results, for a range running from one to three. The categories were split as follows: low (1 to 1.99), medium (2 to 2.49), and high (2.50 to 3).
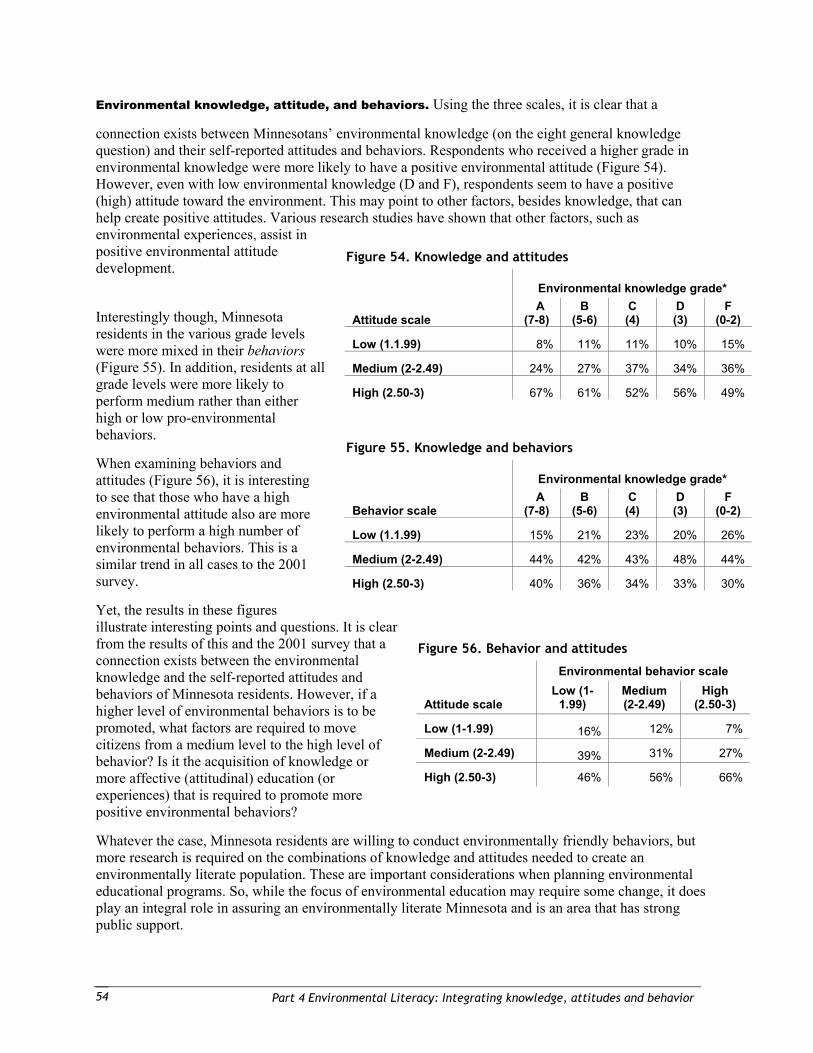
Part 4 Environmental Literacy: Integrating knowledge, attitudes and behavior 54
Environmental knowledge, attitude, and behaviors. Using the three scales, it is clear that a
connection exists between Minnesotans’ environmental knowledge (on the eight general knowledge question) and their self-reported attitudes and behaviors. Respondents who received a higher grade in environmental knowledge were more likely to have a positive environmental attitude (Figure 54). However, even with low environmental knowledge (D and F), respondents seem to have a positive (high) attitude toward the environment. This may point to other factors, besides knowledge, that can help create positive attitudes. Various research studies have shown that other factors, such as environmental experiences, assist in positive environmental attitude development.
Interestingly though, Minnesota residents in the various grade levels were more mixed in their behaviors (Figure 55). In addition, residents at all grade levels were more likely to perform medium rather than either high or low pro-environmental behaviors.
When examining behaviors and attitudes (Figure 56), it is interesting to see that those who have a high environmental attitude also are more likely to perform a high number of environmental behaviors. This is a similar trend in all cases to the 2001 survey.
Yet, the results in these figures illustrate interesting points and questions. It is clear from the results of this and the 2001 survey that a connection exists between the environmental knowledge and the self-reported attitudes and behaviors of Minnesota residents. However, if a higher level of environmental behaviors is to be promoted, what factors are required to move citizens from a medium level to the high level of behavior? Is it the acquisition of knowledge or more affective (attitudinal) education (or experiences) that is required to promote more positive environmental behaviors?
Whatever the case, Minnesota residents are willing to conduct environmentally friendly behaviors, but more research is required on the combinations of knowledge and attitudes needed to create an environmentally literate population. These are important considerations when planning environmental educational programs. So, while the focus of environmental education may require some change, it does play an integral role in assuring an environmentally literate Minnesota and is an area that has strong public support.
Figure 54. Knowledge and attitudes
Environmental knowledge grade*
Attitude scale A
(7-8) B
(5-6) C (4)
D (3)
F (0-2)
Low (1.1.99) 8% 11% 11% 10% 15%
Medium (2-2.49) 24% 27% 37% 34% 36%
High (2.50-3) 67% 61% 52% 56% 49%
Figure 55. Knowledge and behaviors
Environmental knowledge grade*
Behavior scale A
(7-8) B
(5-6) C (4)
D (3)
F (0-2)
Low (1.1.99) 15% 21% 23% 20% 26%
Medium (2-2.49) 44% 42% 43% 48% 44%
High (2.50-3) 40% 36% 34% 33% 30%
Figure 56. Behavior and attitudes
Environmental behavior scale
Attitude scale Low (1-
1.99) Medium (2-2.49)
High (2.50-3)
Low (1-1.99) 16% 12% 7%
Medium (2-2.49) 39% 31% 27%
High (2.50-3) 46% 56% 66%
Second Minnesota Report Card on Environmental Literacy 55
Appendix A Survey Instrument The questions used in this survey came either directly or were adapted from the following sources: various National Environmental Education Training Foundation/Roper Starch Worldwide Surveys, and the First Pennsylvania Environmental Readiness for the 21st Century Survey. Questions measured respondents’ knowledge, attitudes, and behaviors toward the environment. Asterisks (**) indicate the correct answers in the case of knowledge questions and a location for more information on the answer.
Survey instrument Introduction: This is not a sales call. My name is <interviewer name> calling from Wilder Research Center on behalf of Hamline University. We are calling to ask that you participate in a statewide research study about the environment. For this interview, may I please speak with the adult member of your household, age 18 or older, who most recently had a birthday? (RE-READ AS NEEDED). This is a research study; all answers will be kept confidential. The interview will take about 15 minutes. Is now a good time?
Q1. In general, how much do you feel you yourself know about environmental issues and problems? Would you say…
A lot, A fair amount, Only a little, or Practically nothing?
Q2A. How much do you feel you know about the following environmental issues. Urban sprawl? Would you say… (AS NEEDED: Sprawl is when a city or town and the area around it develops in a way that leaves a lot of space between homes and businesses.)
A lot, A fair amount, Only a little, or Practically nothing?
Q2B. Water pollution? Would you say…(AS NEEDED: How much do you feel you know about… A lot, A fair amount, Only a little, or Practically nothing?
Q2C. Air pollution? Would you say…(AS NEEDED: How much do you feel you know about… A lot, A fair amount, Only a little, or Practically nothing?
Appendix A: Survey Instrument 56
Q2D. Biodiversity? Would you say…(AS NEEDED: How much do you feel you know about…) A lot, A fair amount, Only a little, or Practically nothing?
Q2E. Sustainability? Would you say…(AS NEEDED: How much do you feel you know about…) A lot, A fair amount, Only a little, or Practically nothing?
Q2F. Watershed management? Would you say…(AS NEEDED: How much do you feel you know about…)
A lot, A fair amount, Only a little, or Practically nothing?
Q2G. The conservation of natural resources? Would you say…(AS NEEDED: How much do you feel you know about...)
A lot, A fair amount, Only a little, or Practically nothing?
Q2H. Wetlands? Would you say…(AS NEEDED: How much do you feel you know about…) A lot, A fair amount, Only a little, or Practically nothing?
Q3. Next I am going to ask you some questions about environmental laws and regulations. Please tell me if you think the following laws and regulations have gone too far, not far enough, or if they have struck the right balance. The first is air pollution. At the present time, do you think laws and regulations preventing air pollution have gone too far, not far enough, or have struck about the right balance?
Gone too far, Not far enough, or Struck about the right balance?
Second Minnesota Report Card on Environmental Literacy 57
Q4. How about preventing water pollution? (IF NEEDED: At the present time do you think laws and regulations preventing water pollution have gone too far, not far enough, or have struck about the right balance?)
Gone too far, Not far enough, or Struck about the right balance?
Q5. How about protecting wetland areas? (IF NEEDED: At the present time do you think laws and regulations protecting wetland areas have gone too far, not far enough, or have struck about the right balance?)
Gone too far, Not far enough, or Struck about the right balance?
Q6. How about protecting wild or natural areas? (IF NEEDED: At the present time do you think laws and regulations protecting wild or natural areas have gone too far, not far enough, or have struck about the right balance?)
Gone too far, Not far enough, or Struck about the right balance?
Q7. As you may know, sprawl is when a city or town and the area around it develops in such a way that leaves a lot of space between homes and businesses. At the present time do you think laws and regulations controlling sprawl have gone too far, not far enough, or have struck about the right balance?
Gone too far, Not far enough, or Struck about the right balance?
Q8A. Next, I’d like to ask for your opinion concerning who you think should be responsible for solving environmental problems in Minnesota. Please indicate how strongly you agree or disagree with the following statements. (First,) Business and Industry should be responsible for solving environmental problems in Minnesota? Would you say you…
Strongly agree, Agree, Disagree, or Strongly disagree?
Q8B. Government should be responsible for solving environmental problems in Minnesota? Would you say you…
Strongly agree, Agree, Disagree, or Strongly disagree?
Appendix A: Survey Instrument 58
Q8C. Individual citizens should be responsible for solving environmental problems in Minnesota? Would you say you…
Strongly agree, Agree, Disagree, or Strongly disagree?
Q8D. Agriculture and forestry should be responsible for solving environmental problems in Minnesota? Would you say you…
Strongly agree, Agree, Disagree, or Strongly disagree?
Q9. The next group of questions is about issues that have been covered in the media in the past couple of years. We are interested in seeing how much accurate information people are getting from television, newspapers, magazines, and other sources.
Please answer the following questions the best you can, and feel free to tell me if you don’t know. (First,) What is the most common cause of pollution of streams, rivers and oceans? Is it…
Dumping of garbage by cities, Surface water running off yards, city streets, paved lots, and farm fields,** Trash washed into the ocean from beaches, or Waste from factories? Other (DO NOT READ) ** U.S. Environmental Protection Agency, EPA841-F-96-004A: http://www.epa.gov/OWOW/NPS/facts/point1.htm
Q10. Thinking about the country as a whole, how is most of the electricity in the U.S. generated? Is it…
By burning fossil fuels, such as coal and oil,** With nuclear power, Through solar energy, or At hydroelectric power plants? Other (DO NOT READ) ** U.S. Department of Energy: http://www.eia.doe.gov/cneaf/electricity/st_profiles/us.pdf
Q11. Now, thinking only about Minnesota, how is most of the electricity in Minnesota generated? Is it…
By burning fossil fuels, such as coal and oil,** With nuclear power, Through wind energy, or At hydro power plants? Other (DO NOT READ) ** U.S. Department of Energy: http://www.eia.doe.gov/cneaf/electricity/st_profiles/minnesota.pdf, Minnesota Pollution Control Agency web site, http://www.pca.state.mn.us/programs/electricity.html
Second Minnesota Report Card on Environmental Literacy 59
Q12. Carbon monoxide is a major contributor to air pollution in the U.S. Which of the following is the biggest source of carbon monoxide? Is it…
Factories and businesses, People breathing, Motor vehicles**, or Trees? Other (DO NOT READ) ** U.S. Environmental Protection Agency: http://www.epa.gov/otaq/03-co.htm and Union of Concerned Scientists: http://www.ucsusa.org/vehicles/brief.problem.html
Q13. What is one of the main benefits of wetlands? Do they… Help to control global climate change, Help filter and store water before it enters lakes, streams, rivers or oceans,** Prevent the spread of undesirable plants and animals, or Provide good sites for landfills? Other (DO NOT READ)
Q14. Scientists have not determined the best solution for disposing of nuclear waste. In Minnesota, what do we do with it now? Do we…..
Reuse it as nuclear fuel, Send it to another state for storage and monitoring, Dump it in landfills, or Store and monitor it at the nuclear power plant**? Other (DO NOT READ)
Q15. What do you think is the main cause of global climate change, that is, the warming of the planet Earth? Is it…
A recent increase in oxygen in the atmosphere, Sunlight radiating more strongly through a hole in the upper ozone layer, More carbon emissions from autos, homes and industry,** Increased activity from volcanoes worldwide, or You don’t believe there is global climate change? (new option in this survey) ** U.S. Global Climate Change Information Office: http://www.gcrio.org/gwcc/part1.html
Q16. Many communities are concerned about running out of space in their community trash dumps and landfills. Is the greatest source of landfill material…
Disposable diapers, Lawn and garden clippings, trimmings and leaves, Paper products including newspapers, cardboard and packing**, or Glass and plastic bottles and aluminum and steel cans? Other (DO NOT READ) **U.S. EPA web site: http://www.epa.gov/epaoswer/non-hw/muncpl/pubs/msw2001.pdf (p. 79)
Appendix A: Survey Instrument 60
Q17. The Twin Cities area has had a number of air pollution alerts in the past few years, partially due to smog. What is the primary source of this smog? Is it…
Power plants, The exhaust of motor vehicles,** Waste incinerators, or Smoke from fireplaces? Other (DO NOT READ) ** Minnesota Pollution Control Agency site: http://www.pca.state.mn.us/publications/reports/ozonestudy2002.pdf, (p. 40)
Q18. Next, I have a true/false question. Urban sprawl generally helps people spend less time driving. (IF NEEDED: Urban sprawl is when a city or town and its surrounding suburbs are developed in a way that leaves a lot of space between homes and businesses.)
True False** IF VOLUNTEERED: it depends ** Sierra Club Sprawl Report: www.sierraclub.org/sprawl/report98/minneapolisstpaul.asp
Q20A. The next few questions are about water quality in Minnesota. In your opinion, how serious of a threat are the following things to water quality in Minnesota? For each please tell me if you think it is a very serious threat, a somewhat serious threat, or not a threat to water quality in Minnesota. (First,) Loss of wetlands? (IF NEEDED: Do you think loss of wetlands is a very serious threat, a somewhat serious threat, or not a threat to water quality in Minnesota?)
Very serious threat, Somewhat serious threat, or Not a threat?
Q20B. Residential runoff from yards? (IF NEEDED: Do you think residential run-off from yards is a very serious threat, a somewhat serious threat, or not a threat to water quality in Minnesota?)
Very serious threat, Somewhat serious threat, or Not a threat?
Q20C. Industrial emissions? (IF NEEDED: Do you think industrial emissions are a very serious threat, a somewhat serious threat, or not a threat to water quality in Minnesota?)
Very serious threat, Somewhat serious threat, or Not a threat?
Q20D. Dumping oil or household chemicals down the drain? (IF NEEDED: Do you think dumping oil or household chemicals down the drain is a very serious threat, a somewhat serious threat, or not a threat to water quality in Minnesota?)
Very serious threat, Somewhat serious threat, or Not a threat?
Second Minnesota Report Card on Environmental Literacy 61
Q20E. Agricultural runoff? (IF NEEDED: Do you think agricultural runoff is a very serious threat, a somewhat serious threat, or not a threat to water quality in Minnesota?)
Very serious threat, Somewhat serious threat, or Not a threat?
Q20F. Failing septic systems? (IF NEEDED: Do you think failing septic systems are a very serious threat, a somewhat serious threat, or not a threat to water quality in Minnesota?)
Very serious threat, Somewhat serious threat, or Not a threat?
Q21. Mercury from air pollution is a health concern in lakes because it settles out of the air into water. What is the largest source of mercury in Minnesota’s air?
Coal-burning power plants,** Exhaust from motor vehicles, Burning of batteries in incinerators, or Smoke from fireplaces? **Minnesota Pollution Control Agency site: http://www.pca.state.mn.us/publications/reports/mercury-emissionsreport-0304.pdf (p. 20)
Q22. During the past 10 years, do you think the quality of lakes, rivers, and streams in your area has… Significantly improved, Somewhat improved, Stayed about the same, Somewhat declined, or Significantly declined?
Q23. In the next 10 years, do you think the quality of lakes, rivers, and streams in your area will… Significantly improve, Somewhat improve, Stay about the same, Somewhat decline, or Significantly decline?
Q24. Most towns and cities in Minnesota have storm sewers that prevent flooding by draining rainwater from streets and parking lots. Where do you think water entering storm sewers goes? Does it go…
To wastewater treatment plants, To lakes, rivers, and wetlands,** or Into groundwater? **Minneapolis Park and Recreation Board site: http://www.minneapolisparks.org/default.asp? Page ID=833
Appendix A: Survey Instrument 62
Q25. Many lawn fertilizers and dishwashing detergents contain phosphorous which can be damaging to the environment. Which of the following is the major environmental impact of phosphorus?
It is poisonous to fish, It has an unpleasant smell, It promotes excessive plant and algae growth in lakes and rivers**, or It pollutes groundwater? ** Total Phosphorus and Phosphate Impact on Surface Waters, Wilkes University Center for Environmental Quality site: http://wilkes1.wilkes.edu/~eqc/phosphate.htm
Q26A. Now I would like to ask you about some of the things you may do in your day-to-day life. For each of the following things, would you please tell me whether you never do it, sometimes do it, or frequently do it. Conserve water by taking short showers, less than 5 minutes?
Never, Sometimes, or Frequently? Not applicable (I take showers)
Q26B. Turn off lights when leaving a room? Never, Sometimes, or Frequently?
Q26C. Use other types of transportation, such as walking, biking, riding the bus, or carpooling instead of driving alone?
Never, Sometimes, or Frequently? IF VOLUNTEERED: does not have a car
Q26D. In the last 12 months, how often have you donated money to groups or organizations that work to protect the environment?
Never, Once a year, or More than once a year?
Q26E. Does your home have a yard or garden that you or someone in your household maintains or cares for?
Yes No (GO TO 27A)
Second Minnesota Report Card on Environmental Literacy 63
Q26F. Which statement best describes how you fertilize your lawn (the yard or garden that you care for)?
I (we) use phosphorus-free lawn fertilizer, I (we) use lawn fertilizer that contains phosphorous, I don’t know if the fertilizer I use contains phosphorus, I (we) hire a lawn care company to fertilize my lawn, or I (we) don’t use fertilizer? IF VOLUNTEERED: I (we) don’t directly control the maintenance of my yard (e.g., lives in a town home) IF VOLUNTEERED: I hire a lawn care company, and I know that company uses non-phosphate/organic fertilizer
Q27A. Do you have a compost bin or pile? Yes No (GO TO Q28A)
Q27B. Which statement best describes how you use it? I use it all year round, for food and/or yard waste, I use it seasonally, for food and/or yard waste, I only use it occasionally, I only use it for yard waste, or I don’t use it?
Q28A. Did you vote in the 2002 election? (IF NEEDED: The 2002 election was when Tim Pawlenty was elected governor and Norm Coleman was elected to the U.S. Senate.)
Yes No (GO TO Q29)
Q28B. How important to your decision on who to vote for was a candidate’s record or stance on protecting the environment. Would you say it was..
Very important, Somewhat important, or Not important?
Q29. Do you think schools should provide environmental education in pre-kindergarten through 12th grade?
Yes No IF VOLUNTEERED: It depends
Q30. Now I have just a few questions to make sure we interview a representative cross-section of Minnesota residents. First, in what year were you born?
Appendix A: Survey Instrument 64
Q31. What is the highest level of education that you have completed? (DO NOT READ) Less than a high school diploma High school grad or GED Two-year degree (AA, AS, professional school if two-year degree) Some college College graduate (four-year degree, BA, BS) Graduate degree (Masters, MA, MS, MD, PhD, etc)
Q32. In which Minnesota county do you currently live? (Coded 1 through 87)
Q33. What is your zip code?
Q34A. What racial or ethnic group best describes you? (DO NOT READ) African American American Indian Asian, Asian American, or Pacific Islander White or Caucasian Hispanic, Latino, or Spanish origin Biracial or multiracial Some other group (GO TO Q.34B)
Q34B. SPECIFY
Q35. (For statistical purposes) It would be helpful to know the income group which comes closest to your total annual household income for 2002. This is the total household income for all members of the household, from all sources of income, before taxes. I am going to read some broad ranges. Please stop me when I read the correct range.
Less than $15,000 $15,001 to $30,000 $30,001 to $50,000 $50,001 to $75,000 $75,001 to $100,000, or Over $100,000
Q36. (Ask only if uncertain) Are you… Male Female
Thank you very much for helping with this important study!
Second Minnesota Report Card on Environmental Literacy 65
Appendix B Methodology The survey used a random-digit dial sample and randomized selection within the household. Random-digit dialing ensures an equal probability of selection for all residential telephone numbers within a specified locale. The sample of telephone numbers was purchased from Survey Sampling, Incorporated. Randomized selection within the household further equalizes selection probabilities. In this case, randomization within the household was attained by selecting the adult with the most recent birthday.
One thousand interviews were completed with adults throughout Minnesota. Given this sample size, relative to the adult population of Minnesota at the time (3,560,000), the sampling error is plus or minus 3.1 percentage points for results with a 50/50 proportional split. That is, if the survey results show 50 percent of the sample answering “yes” and 50 percent answering “no,” it is very likely that if we were to survey the entire adult population of Minnesota, the actual percentage of the population who give such answers would be somewhere between 46.9 and 53.1 percent. The sampling error is progressively smaller for results with uneven splits.
Interviewing began on August 2, 2003, and continued through November 9, 2003. Calls were made 9 a.m. to 9 p.m., Monday through Thursday; 9 a.m. to 3 p.m. Friday and Saturday; and 3 p.m. to 8:30 p.m. on Sundays. The industry-standard response rate (CASRO RR3) for the study was 60 percent (in 2001, 55%), with a refusal rate of 30 percent (in 2001, 16%).
In the creation of the report, percentages were rounded down if less that 0.5% and rounded up if greater than 0.5%.
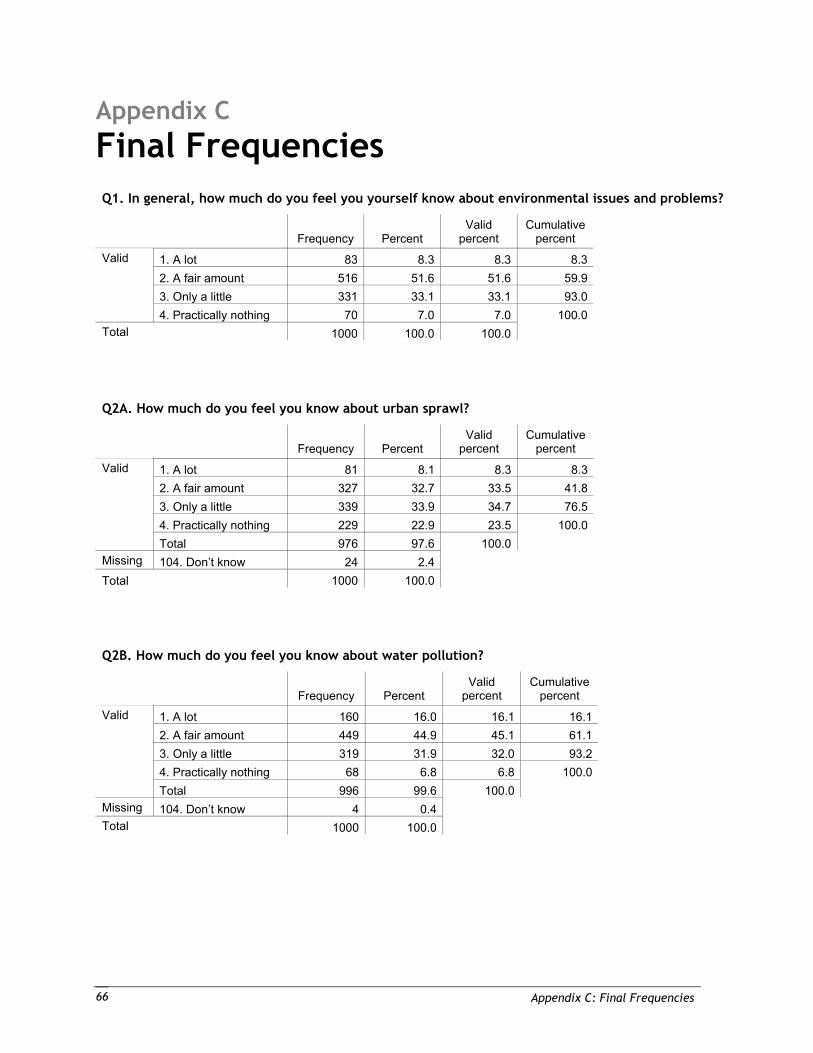
Appendix C: Final Frequencies 66
Appendix C Final Frequencies Q1. In general, how much do you feel you yourself know about environmental issues and problems?
Frequency Percent Valid
percent Cumulative
percent
1. A lot 83 8.3 8.3 8.3 2. A fair amount 516 51.6 51.6 59.9 3. Only a little 331 33.1 33.1 93.0
Valid
4. Practically nothing 70 7.0 7.0 100.0 Total 1000 100.0 100.0
Q2A. How much do you feel you know about urban sprawl?
Frequency Percent Valid
percent Cumulative
percent
1. A lot 81 8.1 8.3 8.3 2. A fair amount 327 32.7 33.5 41.8 3. Only a little 339 33.9 34.7 76.5 4. Practically nothing 229 22.9 23.5 100.0
Valid
Total 976 97.6 100.0 Missing 104. Don’t know 24 2.4 Total 1000 100.0
Q2B. How much do you feel you know about water pollution?
Frequency Percent Valid
percent Cumulative
percent
1. A lot 160 16.0 16.1 16.1 2. A fair amount 449 44.9 45.1 61.1 3. Only a little 319 31.9 32.0 93.2 4. Practically nothing 68 6.8 6.8 100.0
Valid
Total 996 99.6 100.0 Missing 104. Don’t know 4 0.4 Total 1000 100.0
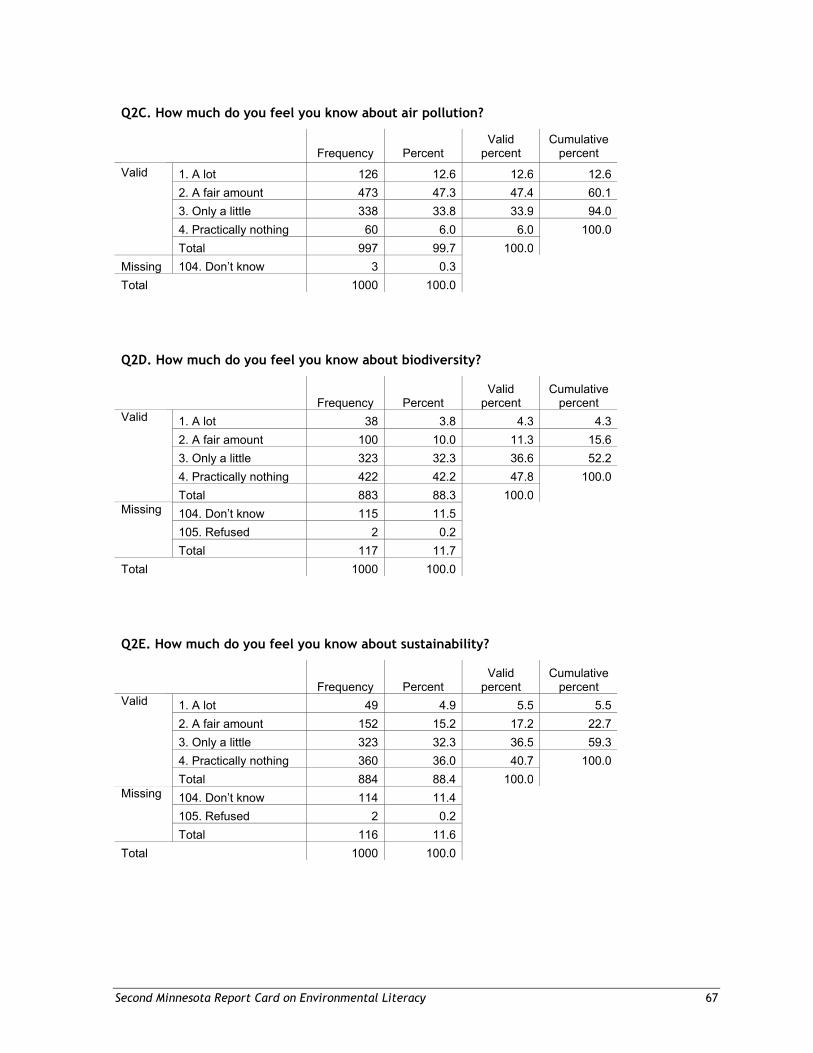
Second Minnesota Report Card on Environmental Literacy 67
Q2C. How much do you feel you know about air pollution?
Frequency Percent Valid
percent Cumulative
percent
1. A lot 126 12.6 12.6 12.6 2. A fair amount 473 47.3 47.4 60.1 3. Only a little 338 33.8 33.9 94.0 4. Practically nothing 60 6.0 6.0 100.0
Valid
Total 997 99.7 100.0 Missing 104. Don’t know 3 0.3 Total 1000 100.0
Q2D. How much do you feel you know about biodiversity?
Frequency Percent Valid
percent Cumulative
percent 1. A lot 38 3.8 4.3 4.3 2. A fair amount 100 10.0 11.3 15.6 3. Only a little 323 32.3 36.6 52.2 4. Practically nothing 422 42.2 47.8 100.0
Valid
Total 883 88.3 100.0 104. Don’t know 115 11.5 105. Refused 2 0.2
Missing
Total 117 11.7 Total 1000 100.0
Q2E. How much do you feel you know about sustainability?
Frequency Percent Valid
percent Cumulative
percent 1. A lot 49 4.9 5.5 5.5 2. A fair amount 152 15.2 17.2 22.7 3. Only a little 323 32.3 36.5 59.3 4. Practically nothing 360 36.0 40.7 100.0
Valid
Total 884 88.4 100.0 104. Don’t know 114 11.4 105. Refused 2 0.2
Missing
Total 116 11.6 Total 1000 100.0
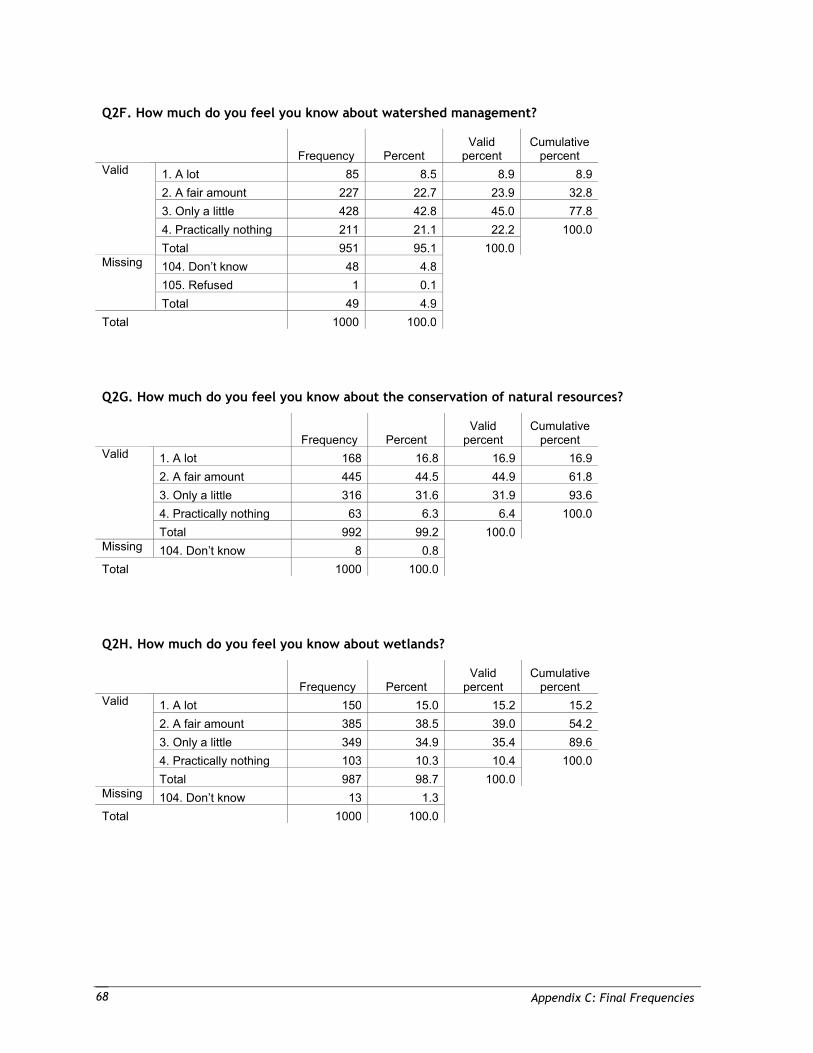
Appendix C: Final Frequencies 68
Q2F. How much do you feel you know about watershed management?
Frequency Percent Valid
percent Cumulative
percent 1. A lot 85 8.5 8.9 8.9 2. A fair amount 227 22.7 23.9 32.8 3. Only a little 428 42.8 45.0 77.8 4. Practically nothing 211 21.1 22.2 100.0
Valid
Total 951 95.1 100.0 104. Don’t know 48 4.8 105. Refused 1 0.1
Missing
Total 49 4.9 Total 1000 100.0
Q2G. How much do you feel you know about the conservation of natural resources?
Frequency Percent Valid
percent Cumulative
percent 1. A lot 168 16.8 16.9 16.9 2. A fair amount 445 44.5 44.9 61.8 3. Only a little 316 31.6 31.9 93.6 4. Practically nothing 63 6.3 6.4 100.0
Valid
Total 992 99.2 100.0 Missing 104. Don’t know 8 0.8 Total 1000 100.0
Q2H. How much do you feel you know about wetlands?
Frequency Percent Valid
percent Cumulative
percent 1. A lot 150 15.0 15.2 15.2 2. A fair amount 385 38.5 39.0 54.2 3. Only a little 349 34.9 35.4 89.6 4. Practically nothing 103 10.3 10.4 100.0
Valid
Total 987 98.7 100.0 Missing 104. Don’t know 13 1.3 Total 1000 100.0
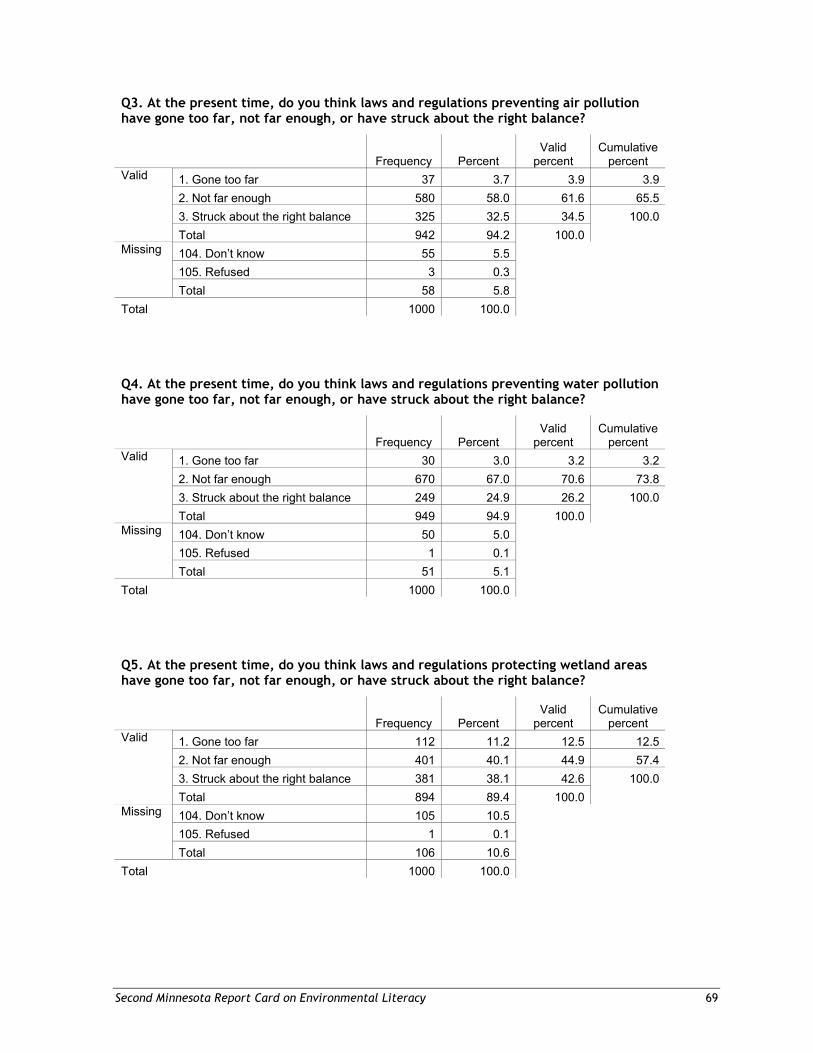
Second Minnesota Report Card on Environmental Literacy 69
Q3. At the present time, do you think laws and regulations preventing air pollution have gone too far, not far enough, or have struck about the right balance?
Frequency Percent Valid
percent Cumulative
percent 1. Gone too far 37 3.7 3.9 3.92. Not far enough 580 58.0 61.6 65.53. Struck about the right balance 325 32.5 34.5 100.0
Valid
Total 942 94.2 100.0 104. Don’t know 55 5.5 105. Refused 3 0.3
Missing
Total 58 5.8 Total 1000 100.0
Q4. At the present time, do you think laws and regulations preventing water pollution have gone too far, not far enough, or have struck about the right balance?
Frequency Percent Valid
percent Cumulative
percent 1. Gone too far 30 3.0 3.2 3.22. Not far enough 670 67.0 70.6 73.83. Struck about the right balance 249 24.9 26.2 100.0
Valid
Total 949 94.9 100.0 104. Don’t know 50 5.0 105. Refused 1 0.1
Missing
Total 51 5.1 Total 1000 100.0
Q5. At the present time, do you think laws and regulations protecting wetland areas have gone too far, not far enough, or have struck about the right balance?
Frequency Percent Valid
percent Cumulative
percent 1. Gone too far 112 11.2 12.5 12.52. Not far enough 401 40.1 44.9 57.43. Struck about the right balance 381 38.1 42.6 100.0
Valid
Total 894 89.4 100.0 104. Don’t know 105 10.5 105. Refused 1 0.1
Missing
Total 106 10.6 Total 1000 100.0
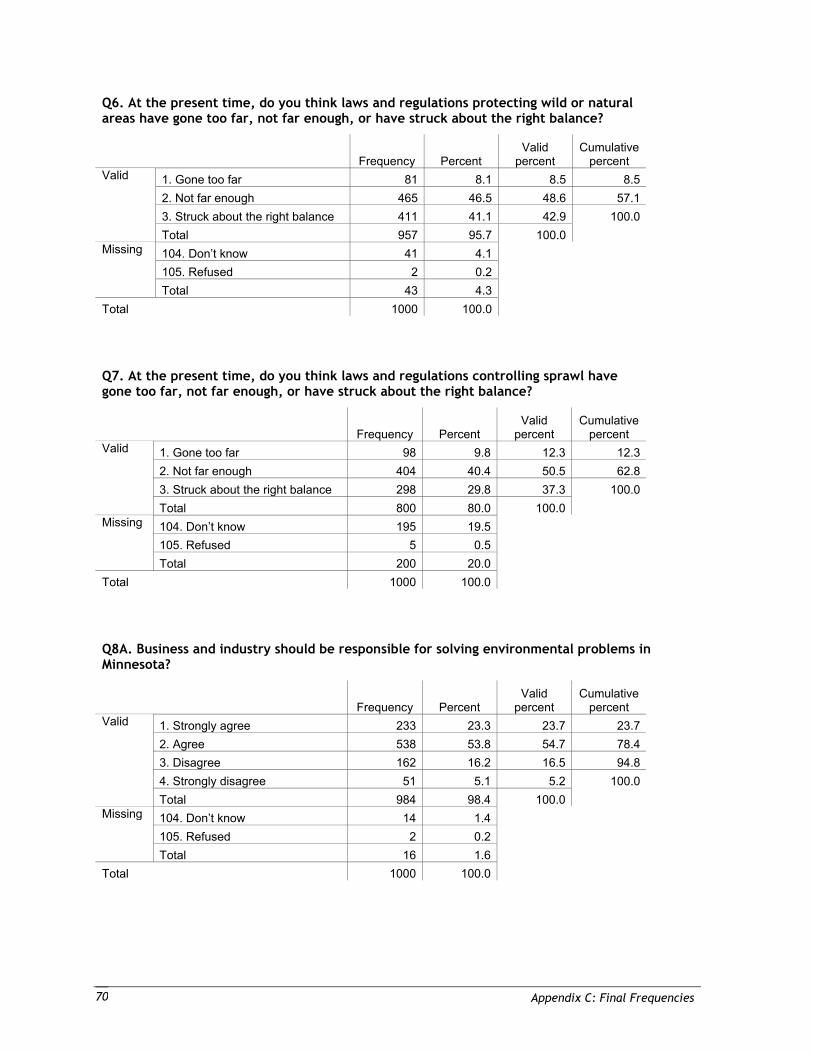
Appendix C: Final Frequencies 70
Q6. At the present time, do you think laws and regulations protecting wild or natural areas have gone too far, not far enough, or have struck about the right balance?
Frequency Percent Valid
percent Cumulative
percent 1. Gone too far 81 8.1 8.5 8.5 2. Not far enough 465 46.5 48.6 57.1 3. Struck about the right balance 411 41.1 42.9 100.0
Valid
Total 957 95.7 100.0 104. Don’t know 41 4.1 105. Refused 2 0.2
Missing
Total 43 4.3 Total 1000 100.0
Q7. At the present time, do you think laws and regulations controlling sprawl have gone too far, not far enough, or have struck about the right balance?
Frequency Percent Valid
percent Cumulative
percent 1. Gone too far 98 9.8 12.3 12.3 2. Not far enough 404 40.4 50.5 62.8 3. Struck about the right balance 298 29.8 37.3 100.0
Valid
Total 800 80.0 100.0 104. Don’t know 195 19.5 105. Refused 5 0.5
Missing
Total 200 20.0 Total 1000 100.0
Q8A. Business and industry should be responsible for solving environmental problems in Minnesota?
Frequency Percent Valid
percent Cumulative
percent 1. Strongly agree 233 23.3 23.7 23.7 2. Agree 538 53.8 54.7 78.4 3. Disagree 162 16.2 16.5 94.8 4. Strongly disagree 51 5.1 5.2 100.0
Valid
Total 984 98.4 100.0 104. Don’t know 14 1.4 105. Refused 2 0.2
Missing
Total 16 1.6 Total 1000 100.0
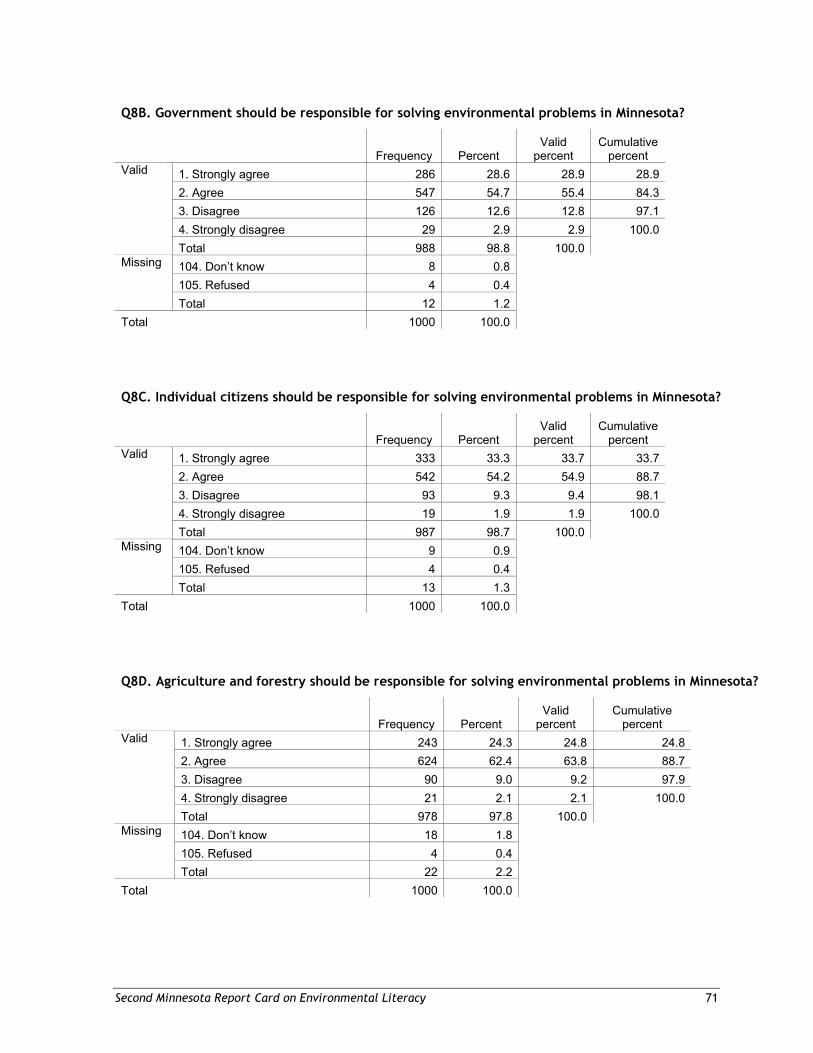
Second Minnesota Report Card on Environmental Literacy 71
Q8B. Government should be responsible for solving environmental problems in Minnesota?
Frequency Percent Valid
percent Cumulative
percent 1. Strongly agree 286 28.6 28.9 28.92. Agree 547 54.7 55.4 84.33. Disagree 126 12.6 12.8 97.14. Strongly disagree 29 2.9 2.9 100.0
Valid
Total 988 98.8 100.0 104. Don’t know 8 0.8 105. Refused 4 0.4
Missing
Total 12 1.2 Total 1000 100.0
Q8C. Individual citizens should be responsible for solving environmental problems in Minnesota?
Frequency Percent Valid
percent Cumulative
percent 1. Strongly agree 333 33.3 33.7 33.72. Agree 542 54.2 54.9 88.73. Disagree 93 9.3 9.4 98.14. Strongly disagree 19 1.9 1.9 100.0
Valid
Total 987 98.7 100.0 104. Don’t know 9 0.9 105. Refused 4 0.4
Missing
Total 13 1.3 Total 1000 100.0
Q8D. Agriculture and forestry should be responsible for solving environmental problems in Minnesota?
Frequency Percent Valid
percent Cumulative
percent 1. Strongly agree 243 24.3 24.8 24.82. Agree 624 62.4 63.8 88.73. Disagree 90 9.0 9.2 97.94. Strongly disagree 21 2.1 2.1 100.0
Valid
Total 978 97.8 100.0 104. Don’t know 18 1.8 105. Refused 4 0.4
Missing
Total 22 2.2 Total 1000 100.0
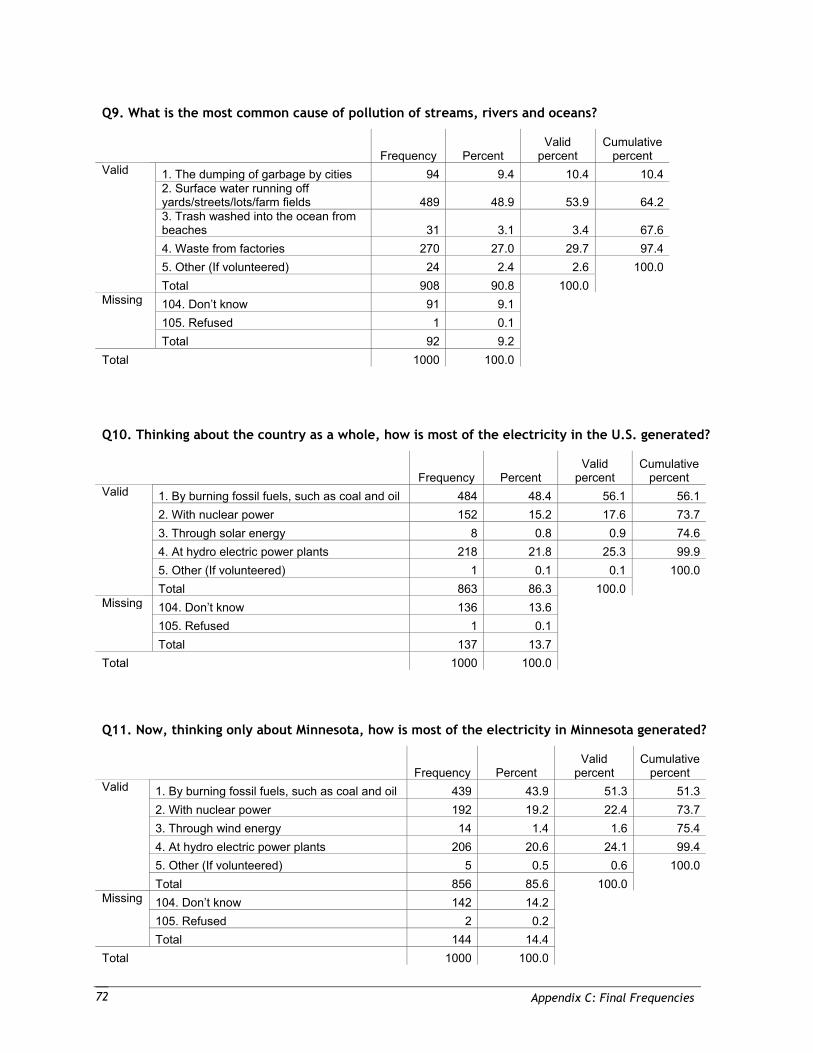
Appendix C: Final Frequencies 72
Q9. What is the most common cause of pollution of streams, rivers and oceans?
Frequency Percent Valid
percent Cumulative
percent 1. The dumping of garbage by cities 94 9.4 10.4 10.42. Surface water running off yards/streets/lots/farm fields 489 48.9 53.9 64.23. Trash washed into the ocean from beaches 31 3.1 3.4 67.64. Waste from factories 270 27.0 29.7 97.45. Other (If volunteered) 24 2.4 2.6 100.0
Valid
Total 908 90.8 100.0 104. Don’t know 91 9.1 105. Refused 1 0.1
Missing
Total 92 9.2 Total 1000 100.0
Q10. Thinking about the country as a whole, how is most of the electricity in the U.S. generated?
Frequency Percent Valid
percent Cumulative
percent 1. By burning fossil fuels, such as coal and oil 484 48.4 56.1 56.12. With nuclear power 152 15.2 17.6 73.73. Through solar energy 8 0.8 0.9 74.64. At hydro electric power plants 218 21.8 25.3 99.95. Other (If volunteered) 1 0.1 0.1 100.0
Valid
Total 863 86.3 100.0 104. Don’t know 136 13.6 105. Refused 1 0.1
Missing
Total 137 13.7 Total 1000 100.0
Q11. Now, thinking only about Minnesota, how is most of the electricity in Minnesota generated?
Frequency Percent Valid
percent Cumulative
percent 1. By burning fossil fuels, such as coal and oil 439 43.9 51.3 51.32. With nuclear power 192 19.2 22.4 73.73. Through wind energy 14 1.4 1.6 75.44. At hydro electric power plants 206 20.6 24.1 99.45. Other (If volunteered) 5 0.5 0.6 100.0
Valid
Total 856 85.6 100.0 104. Don’t know 142 14.2 105. Refused 2 0.2
Missing
Total 144 14.4 Total 1000 100.0
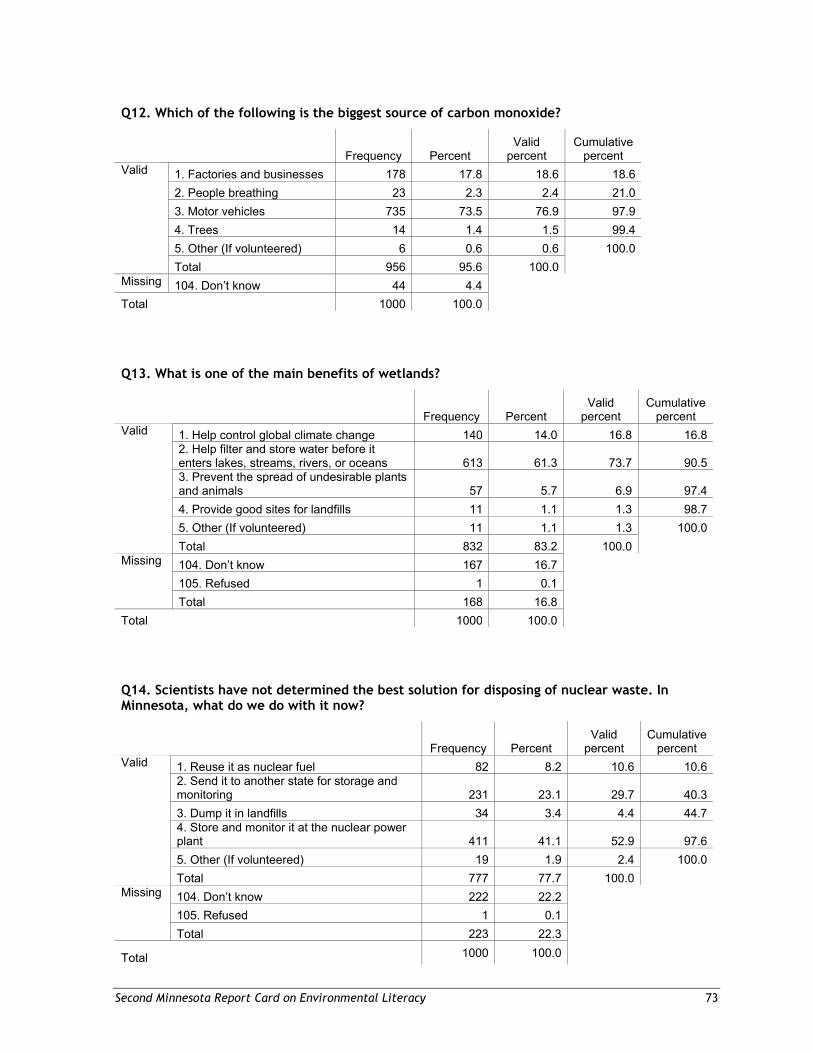
Second Minnesota Report Card on Environmental Literacy 73
Q12. Which of the following is the biggest source of carbon monoxide?
Frequency Percent Valid
percent Cumulative
percent 1. Factories and businesses 178 17.8 18.6 18.6 2. People breathing 23 2.3 2.4 21.0 3. Motor vehicles 735 73.5 76.9 97.9 4. Trees 14 1.4 1.5 99.4 5. Other (If volunteered) 6 0.6 0.6 100.0
Valid
Total 956 95.6 100.0 Missing 104. Don’t know 44 4.4 Total 1000 100.0
Q13. What is one of the main benefits of wetlands?
Frequency Percent Valid
percent Cumulative
percent 1. Help control global climate change 140 14.0 16.8 16.82. Help filter and store water before it enters lakes, streams, rivers, or oceans 613 61.3 73.7 90.53. Prevent the spread of undesirable plants and animals 57 5.7 6.9 97.44. Provide good sites for landfills 11 1.1 1.3 98.75. Other (If volunteered) 11 1.1 1.3 100.0
Valid
Total 832 83.2 100.0 104. Don’t know 167 16.7 105. Refused 1 0.1
Missing
Total 168 16.8 Total 1000 100.0
Q14. Scientists have not determined the best solution for disposing of nuclear waste. In Minnesota, what do we do with it now?
Frequency Percent Valid
percent Cumulative
percent 1. Reuse it as nuclear fuel 82 8.2 10.6 10.62. Send it to another state for storage and monitoring 231 23.1 29.7 40.33. Dump it in landfills 34 3.4 4.4 44.74. Store and monitor it at the nuclear power plant 411 41.1 52.9 97.65. Other (If volunteered) 19 1.9 2.4 100.0
Valid
Total 777 77.7 100.0 104. Don’t know 222 22.2 105. Refused 1 0.1
Missing
Total 223 22.3
Total 1000 100.0
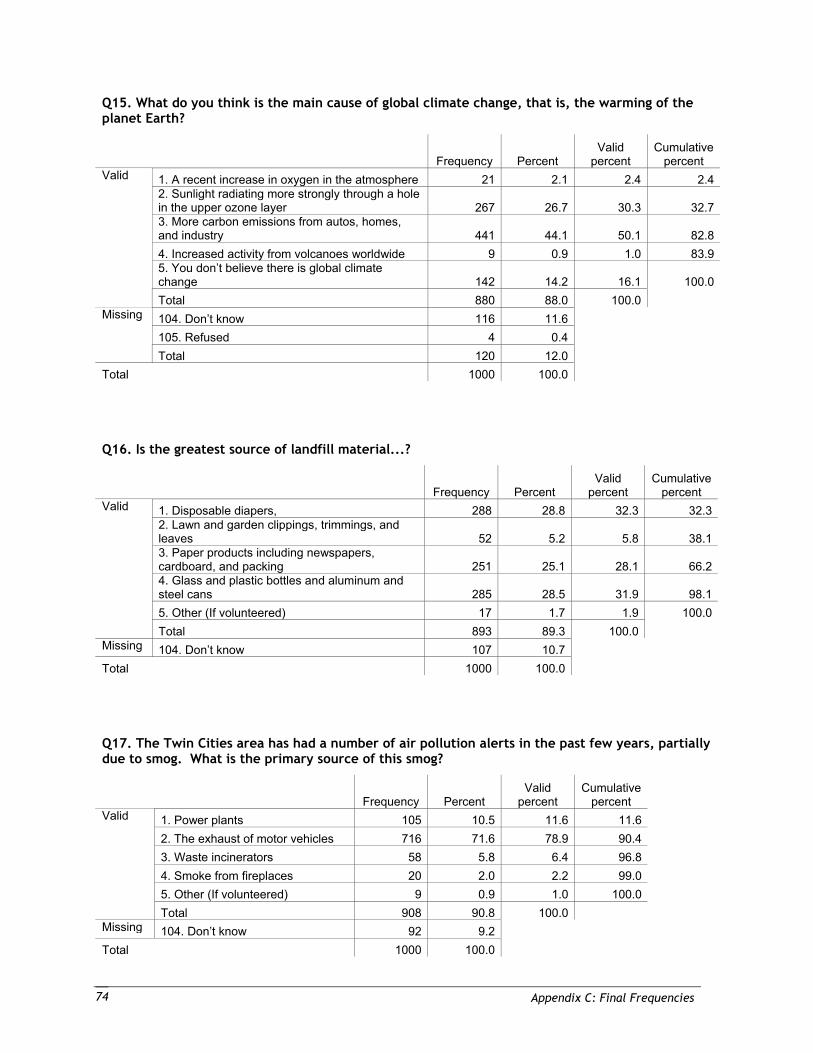
Appendix C: Final Frequencies 74
Q15. What do you think is the main cause of global climate change, that is, the warming of the planet Earth?
Frequency Percent Valid
percent Cumulative
percent 1. A recent increase in oxygen in the atmosphere 21 2.1 2.4 2.42. Sunlight radiating more strongly through a hole in the upper ozone layer 267 26.7 30.3 32.73. More carbon emissions from autos, homes, and industry 441 44.1 50.1 82.84. Increased activity from volcanoes worldwide 9 0.9 1.0 83.95. You don’t believe there is global climate change 142 14.2 16.1 100.0
Valid
Total 880 88.0 100.0 104. Don’t know 116 11.6 105. Refused 4 0.4
Missing
Total 120 12.0 Total 1000 100.0
Q16. Is the greatest source of landfill material...?
Frequency Percent Valid
percent Cumulative
percent 1. Disposable diapers, 288 28.8 32.3 32.32. Lawn and garden clippings, trimmings, and leaves 52 5.2 5.8 38.13. Paper products including newspapers, cardboard, and packing 251 25.1 28.1 66.24. Glass and plastic bottles and aluminum and steel cans 285 28.5 31.9 98.15. Other (If volunteered) 17 1.7 1.9 100.0
Valid
Total 893 89.3 100.0 Missing 104. Don’t know 107 10.7 Total 1000 100.0
Q17. The Twin Cities area has had a number of air pollution alerts in the past few years, partially due to smog. What is the primary source of this smog?
Frequency Percent Valid
percent Cumulative
percent 1. Power plants 105 10.5 11.6 11.6 2. The exhaust of motor vehicles 716 71.6 78.9 90.4 3. Waste incinerators 58 5.8 6.4 96.8 4. Smoke from fireplaces 20 2.0 2.2 99.0 5. Other (If volunteered) 9 0.9 1.0 100.0
Valid
Total 908 90.8 100.0 Missing 104. Don’t know 92 9.2 Total 1000 100.0
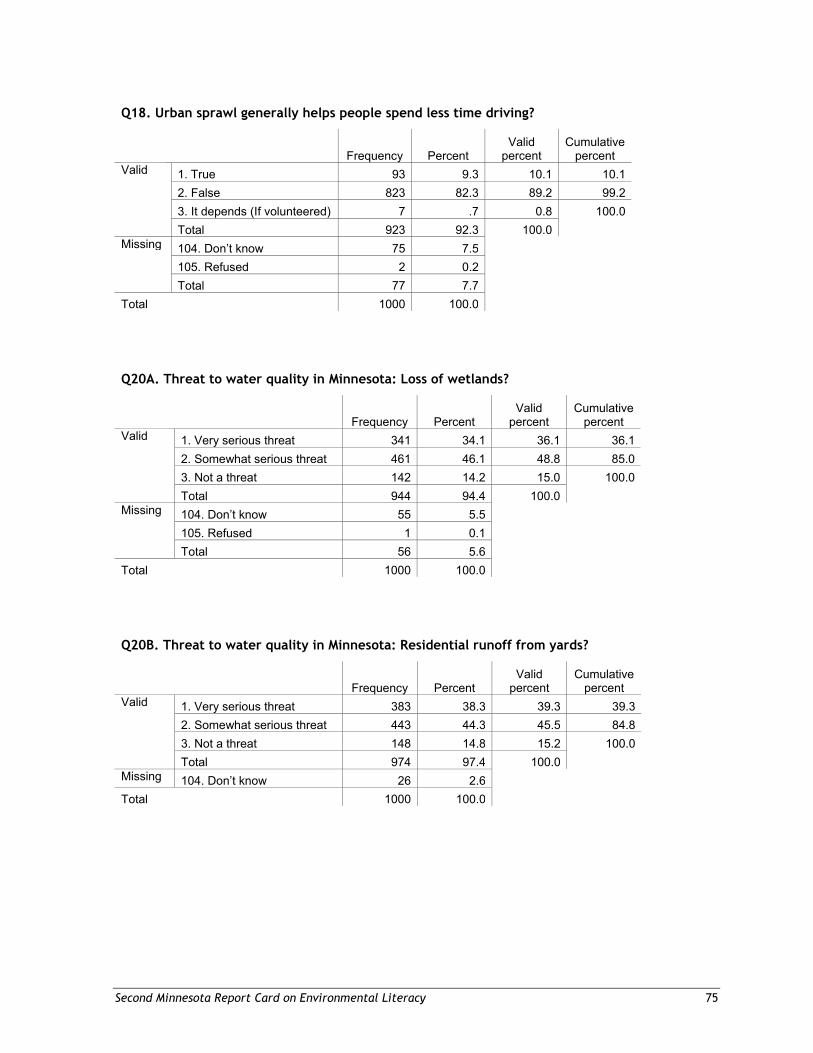
Second Minnesota Report Card on Environmental Literacy 75
Q18. Urban sprawl generally helps people spend less time driving?
Frequency Percent Valid
percent Cumulative
percent 1. True 93 9.3 10.1 10.1 2. False 823 82.3 89.2 99.2 3. It depends (If volunteered) 7 .7 0.8 100.0
Valid
Total 923 92.3 100.0 104. Don’t know 75 7.5 105. Refused 2 0.2
Missing
Total 77 7.7 Total 1000 100.0
Q20A. Threat to water quality in Minnesota: Loss of wetlands?
Frequency Percent Valid
percent Cumulative
percent 1. Very serious threat 341 34.1 36.1 36.1 2. Somewhat serious threat 461 46.1 48.8 85.0 3. Not a threat 142 14.2 15.0 100.0
Valid
Total 944 94.4 100.0 104. Don’t know 55 5.5 105. Refused 1 0.1
Missing
Total 56 5.6 Total 1000 100.0
Q20B. Threat to water quality in Minnesota: Residential runoff from yards?
Frequency Percent Valid
percent Cumulative
percent 1. Very serious threat 383 38.3 39.3 39.3 2. Somewhat serious threat 443 44.3 45.5 84.8 3. Not a threat 148 14.8 15.2 100.0
Valid
Total 974 97.4 100.0 Missing 104. Don’t know 26 2.6 Total 1000 100.0
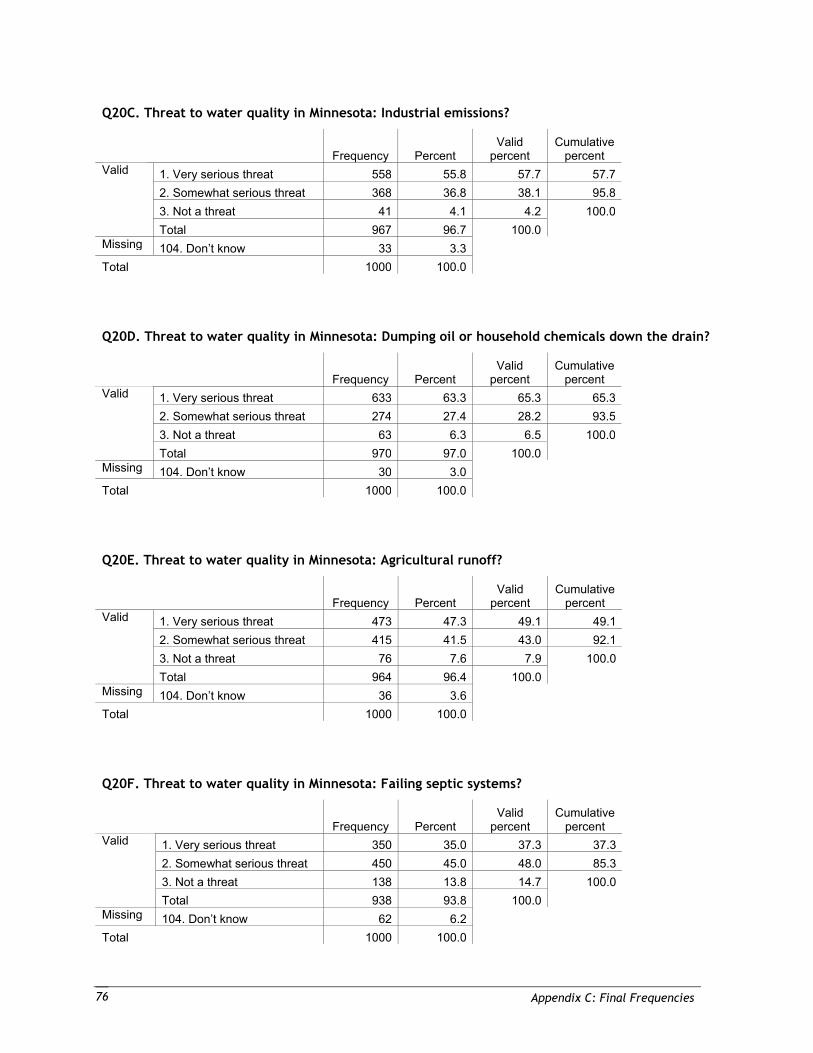
Appendix C: Final Frequencies 76
Q20C. Threat to water quality in Minnesota: Industrial emissions?
Frequency Percent Valid
percent Cumulative
percent 1. Very serious threat 558 55.8 57.7 57.7 2. Somewhat serious threat 368 36.8 38.1 95.8 3. Not a threat 41 4.1 4.2 100.0
Valid
Total 967 96.7 100.0 Missing 104. Don’t know 33 3.3 Total 1000 100.0
Q20D. Threat to water quality in Minnesota: Dumping oil or household chemicals down the drain?
Frequency Percent Valid
percent Cumulative
percent 1. Very serious threat 633 63.3 65.3 65.3 2. Somewhat serious threat 274 27.4 28.2 93.5 3. Not a threat 63 6.3 6.5 100.0
Valid
Total 970 97.0 100.0 Missing 104. Don’t know 30 3.0 Total 1000 100.0
Q20E. Threat to water quality in Minnesota: Agricultural runoff?
Frequency Percent Valid
percent Cumulative
percent 1. Very serious threat 473 47.3 49.1 49.1 2. Somewhat serious threat 415 41.5 43.0 92.1 3. Not a threat 76 7.6 7.9 100.0
Valid
Total 964 96.4 100.0 Missing 104. Don’t know 36 3.6 Total 1000 100.0
Q20F. Threat to water quality in Minnesota: Failing septic systems?
Frequency Percent Valid
percent Cumulative
percent 1. Very serious threat 350 35.0 37.3 37.3 2. Somewhat serious threat 450 45.0 48.0 85.3 3. Not a threat 138 13.8 14.7 100.0
Valid
Total 938 93.8 100.0 Missing 104. Don’t know 62 6.2 Total 1000 100.0
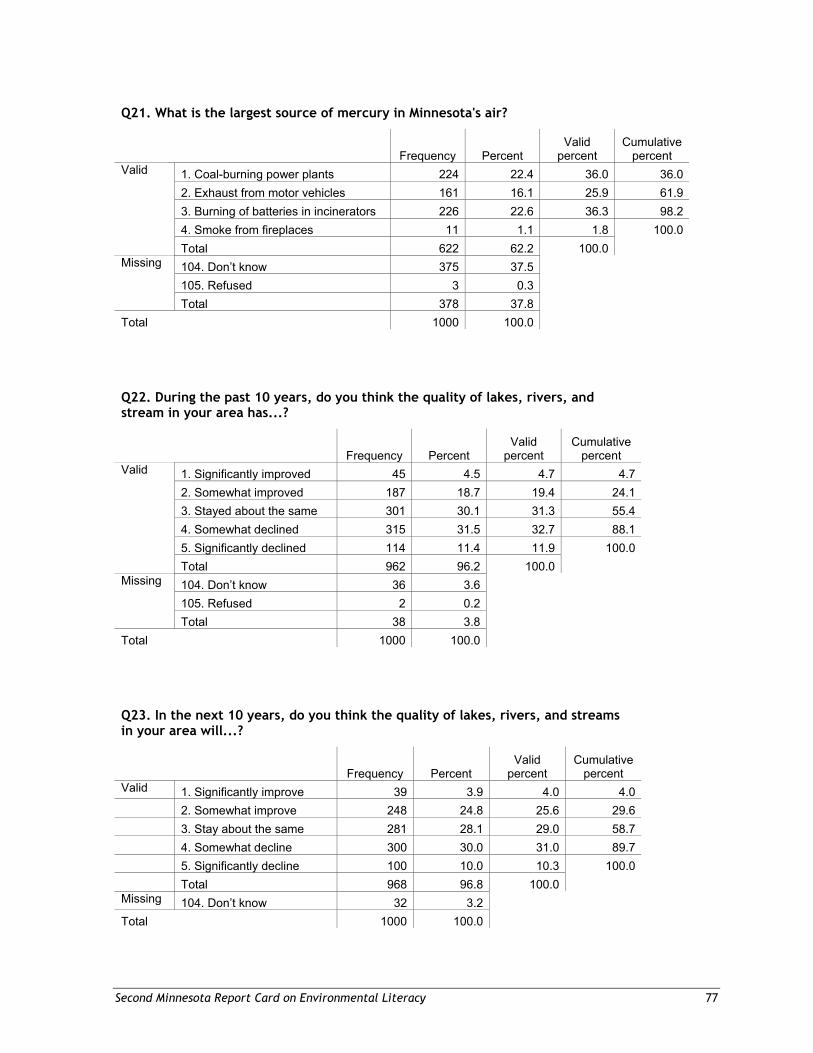
Second Minnesota Report Card on Environmental Literacy 77
Q21. What is the largest source of mercury in Minnesota's air?
Frequency Percent Valid
percent Cumulative
percent 1. Coal-burning power plants 224 22.4 36.0 36.02. Exhaust from motor vehicles 161 16.1 25.9 61.93. Burning of batteries in incinerators 226 22.6 36.3 98.24. Smoke from fireplaces 11 1.1 1.8 100.0
Valid
Total 622 62.2 100.0 104. Don’t know 375 37.5 105. Refused 3 0.3
Missing
Total 378 37.8 Total 1000 100.0
Q22. During the past 10 years, do you think the quality of lakes, rivers, and stream in your area has...?
Frequency Percent Valid
percent Cumulative
percent 1. Significantly improved 45 4.5 4.7 4.7 2. Somewhat improved 187 18.7 19.4 24.1 3. Stayed about the same 301 30.1 31.3 55.4 4. Somewhat declined 315 31.5 32.7 88.1 5. Significantly declined 114 11.4 11.9 100.0
Valid
Total 962 96.2 100.0 104. Don’t know 36 3.6 105. Refused 2 0.2
Missing
Total 38 3.8 Total 1000 100.0
Q23. In the next 10 years, do you think the quality of lakes, rivers, and streams in your area will...?
Frequency Percent Valid
percent Cumulative
percent Valid 1. Significantly improve 39 3.9 4.0 4.0 2. Somewhat improve 248 24.8 25.6 29.6 3. Stay about the same 281 28.1 29.0 58.7 4. Somewhat decline 300 30.0 31.0 89.7 5. Significantly decline 100 10.0 10.3 100.0 Total 968 96.8 100.0 Missing 104. Don’t know 32 3.2 Total 1000 100.0
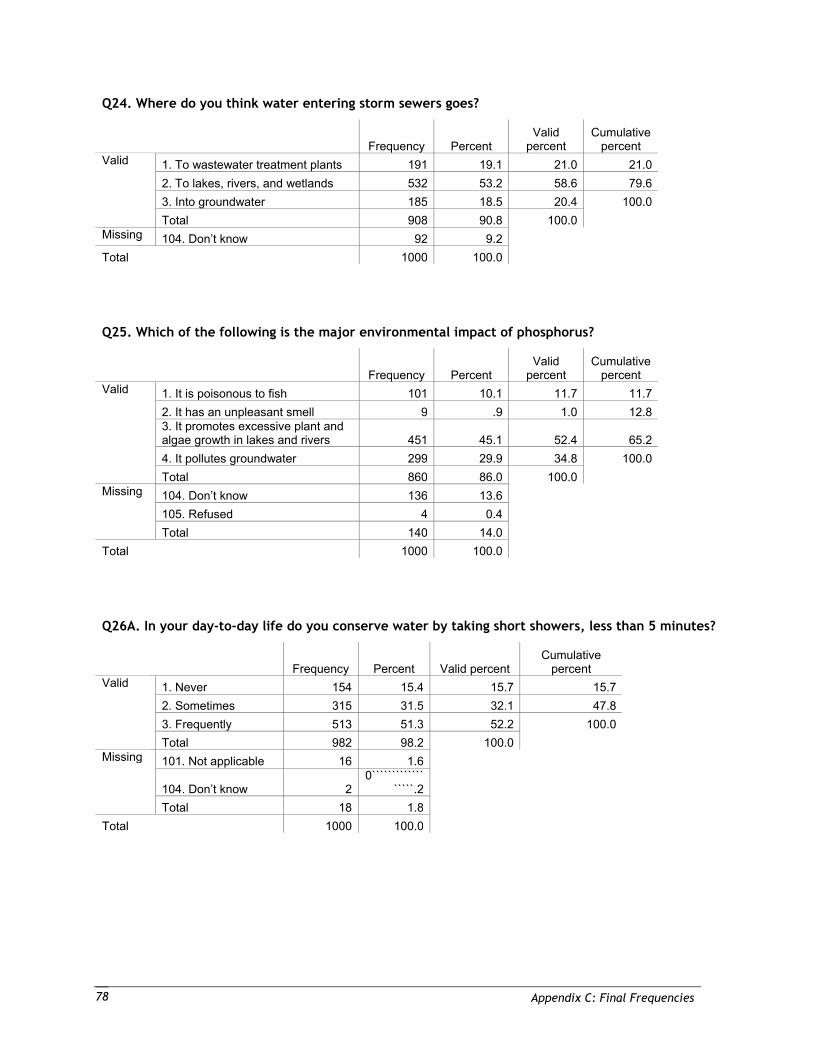
Appendix C: Final Frequencies 78
Q24. Where do you think water entering storm sewers goes?
Frequency Percent Valid
percent Cumulative
percent 1. To wastewater treatment plants 191 19.1 21.0 21.0 2. To lakes, rivers, and wetlands 532 53.2 58.6 79.6 3. Into groundwater 185 18.5 20.4 100.0
Valid
Total 908 90.8 100.0 Missing 104. Don’t know 92 9.2 Total 1000 100.0
Q25. Which of the following is the major environmental impact of phosphorus?
Frequency Percent Valid
percent Cumulative
percent 1. It is poisonous to fish 101 10.1 11.7 11.7 2. It has an unpleasant smell 9 .9 1.0 12.8 3. It promotes excessive plant and algae growth in lakes and rivers 451 45.1 52.4 65.2 4. It pollutes groundwater 299 29.9 34.8 100.0
Valid
Total 860 86.0 100.0 104. Don’t know 136 13.6 105. Refused 4 0.4
Missing
Total 140 14.0 Total 1000 100.0
Q26A. In your day-to-day life do you conserve water by taking short showers, less than 5 minutes?
Frequency Percent Valid percent Cumulative
percent 1. Never 154 15.4 15.7 15.7 2. Sometimes 315 31.5 32.1 47.8 3. Frequently 513 51.3 52.2 100.0
Valid
Total 982 98.2 100.0 101. Not applicable 16 1.6
104. Don’t know 20`````````````
`````.2
Missing
Total 18 1.8 Total 1000 100.0
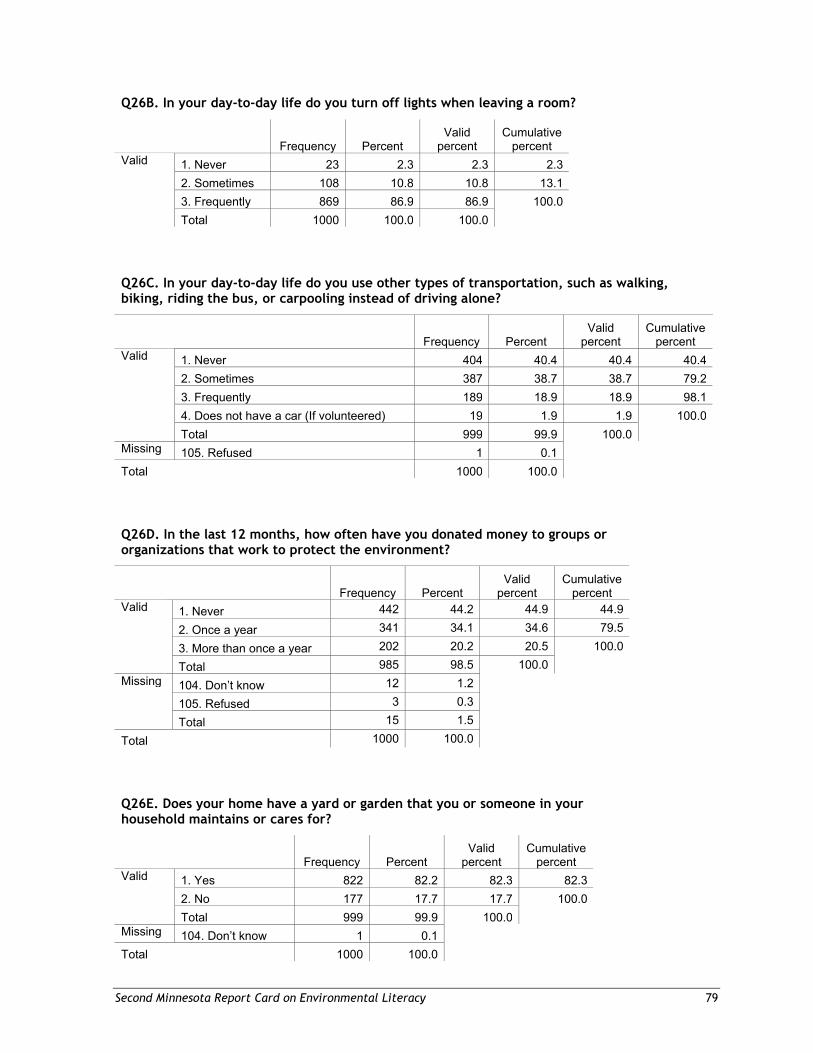
Second Minnesota Report Card on Environmental Literacy 79
Q26B. In your day-to-day life do you turn off lights when leaving a room?
Frequency Percent Valid
percent Cumulative
percent 1. Never 23 2.3 2.3 2.32. Sometimes 108 10.8 10.8 13.13. Frequently 869 86.9 86.9 100.0
Valid
Total 1000 100.0 100.0
Q26C. In your day-to-day life do you use other types of transportation, such as walking, biking, riding the bus, or carpooling instead of driving alone?
Frequency Percent Valid
percent Cumulative
percent 1. Never 404 40.4 40.4 40.42. Sometimes 387 38.7 38.7 79.23. Frequently 189 18.9 18.9 98.14. Does not have a car (If volunteered) 19 1.9 1.9 100.0
Valid
Total 999 99.9 100.0 Missing 105. Refused 1 0.1 Total 1000 100.0
Q26D. In the last 12 months, how often have you donated money to groups or organizations that work to protect the environment?
Frequency Percent Valid
percent Cumulative
percent 1. Never 442 44.2 44.9 44.9
2. Once a year 341 34.1 34.6 79.5
3. More than once a year 202 20.2 20.5 100.0
Valid
Total 985 98.5 100.0
104. Don’t know 12 1.2
105. Refused 3 0.3
Missing
Total 15 1.5
Total 1000 100.0
Q26E. Does your home have a yard or garden that you or someone in your household maintains or cares for?
Frequency Percent Valid
percent Cumulative
percent 1. Yes 822 82.2 82.3 82.3 2. No 177 17.7 17.7 100.0
Valid
Total 999 99.9 100.0 Missing 104. Don’t know 1 0.1 Total 1000 100.0
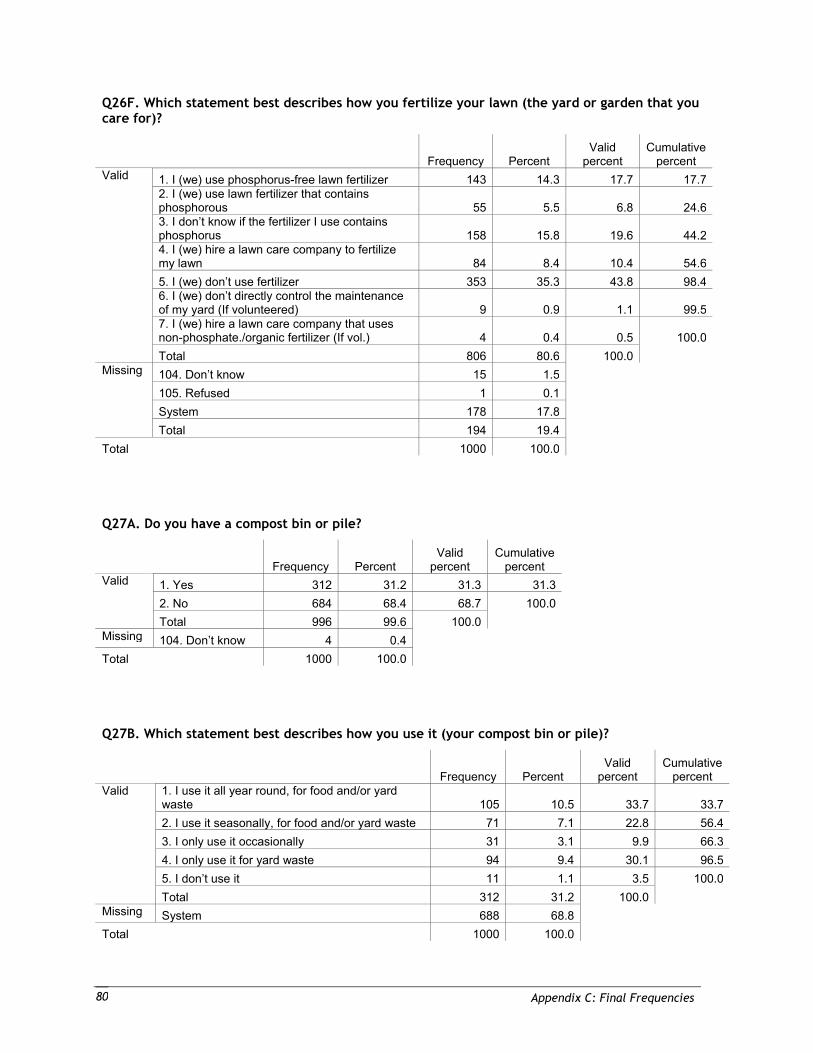
Appendix C: Final Frequencies 80
Q26F. Which statement best describes how you fertilize your lawn (the yard or garden that you care for)?
Frequency Percent Valid
percent Cumulative
percent 1. I (we) use phosphorus-free lawn fertilizer 143 14.3 17.7 17.72. I (we) use lawn fertilizer that contains phosphorous 55 5.5 6.8 24.63. I don’t know if the fertilizer I use contains phosphorus 158 15.8 19.6 44.24. I (we) hire a lawn care company to fertilize my lawn 84 8.4 10.4 54.65. I (we) don’t use fertilizer 353 35.3 43.8 98.46. I (we) don’t directly control the maintenance of my yard (If volunteered) 9 0.9 1.1 99.57. I (we) hire a lawn care company that uses non-phosphate./organic fertilizer (If vol.) 4 0.4 0.5 100.0
Valid
Total 806 80.6 100.0 104. Don’t know 15 1.5 105. Refused 1 0.1 System 178 17.8
Missing
Total 194 19.4 Total 1000 100.0
Q27A. Do you have a compost bin or pile?
Frequency Percent Valid
percent Cumulative
percent 1. Yes 312 31.2 31.3 31.32. No 684 68.4 68.7 100.0
Valid
Total 996 99.6 100.0 Missing 104. Don’t know 4 0.4 Total 1000 100.0
Q27B. Which statement best describes how you use it (your compost bin or pile)?
Frequency Percent Valid
percent Cumulative
percent 1. I use it all year round, for food and/or yard waste 105 10.5 33.7 33.72. I use it seasonally, for food and/or yard waste 71 7.1 22.8 56.43. I only use it occasionally 31 3.1 9.9 66.34. I only use it for yard waste 94 9.4 30.1 96.55. I don’t use it 11 1.1 3.5 100.0
Valid
Total 312 31.2 100.0 Missing System 688 68.8 Total 1000 100.0
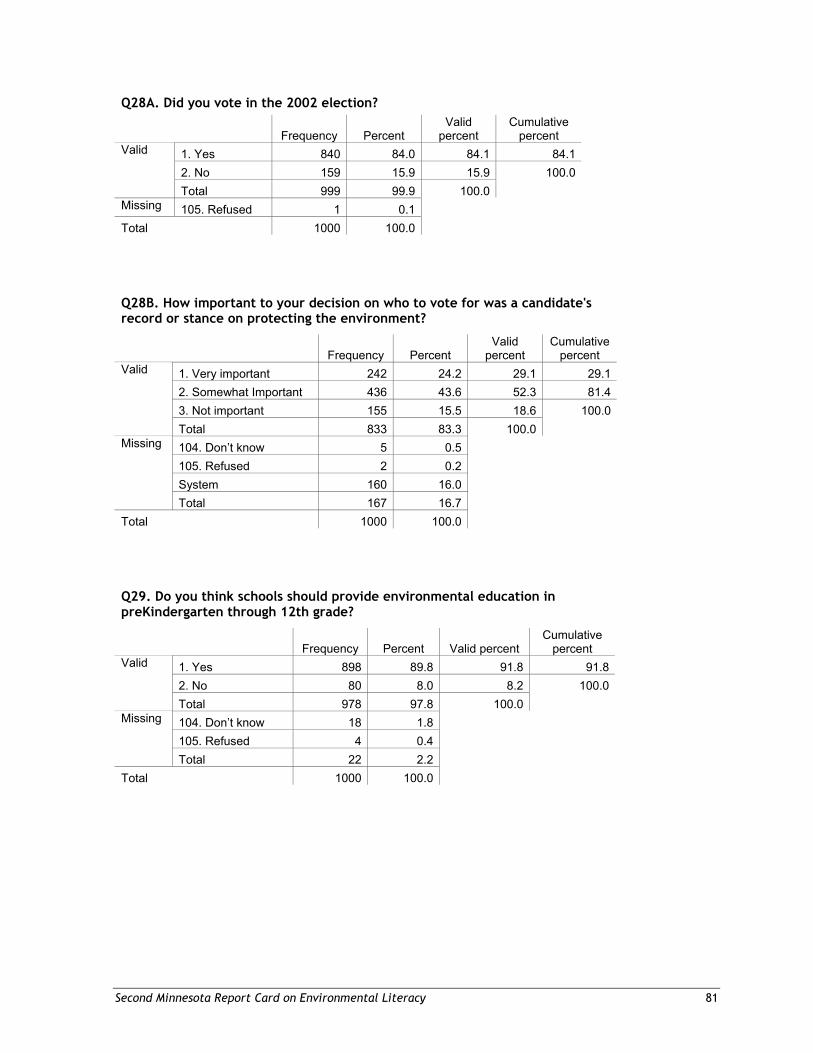
Second Minnesota Report Card on Environmental Literacy 81
Q28A. Did you vote in the 2002 election?
Frequency Percent Valid
percent Cumulative
percent 1. Yes 840 84.0 84.1 84.1 2. No 159 15.9 15.9 100.0
Valid
Total 999 99.9 100.0 Missing 105. Refused 1 0.1 Total 1000 100.0
Q28B. How important to your decision on who to vote for was a candidate's record or stance on protecting the environment?
Frequency Percent Valid
percent Cumulative
percent 1. Very important 242 24.2 29.1 29.1 2. Somewhat Important 436 43.6 52.3 81.4 3. Not important 155 15.5 18.6 100.0
Valid
Total 833 83.3 100.0 104. Don’t know 5 0.5 105. Refused 2 0.2 System 160 16.0
Missing
Total 167 16.7 Total 1000 100.0
Q29. Do you think schools should provide environmental education in preKindergarten through 12th grade?
Frequency Percent Valid percent Cumulative
percent 1. Yes 898 89.8 91.8 91.8 2. No 80 8.0 8.2 100.0
Valid
Total 978 97.8 100.0 104. Don’t know 18 1.8 105. Refused 4 0.4
Missing
Total 22 2.2 Total 1000 100.0
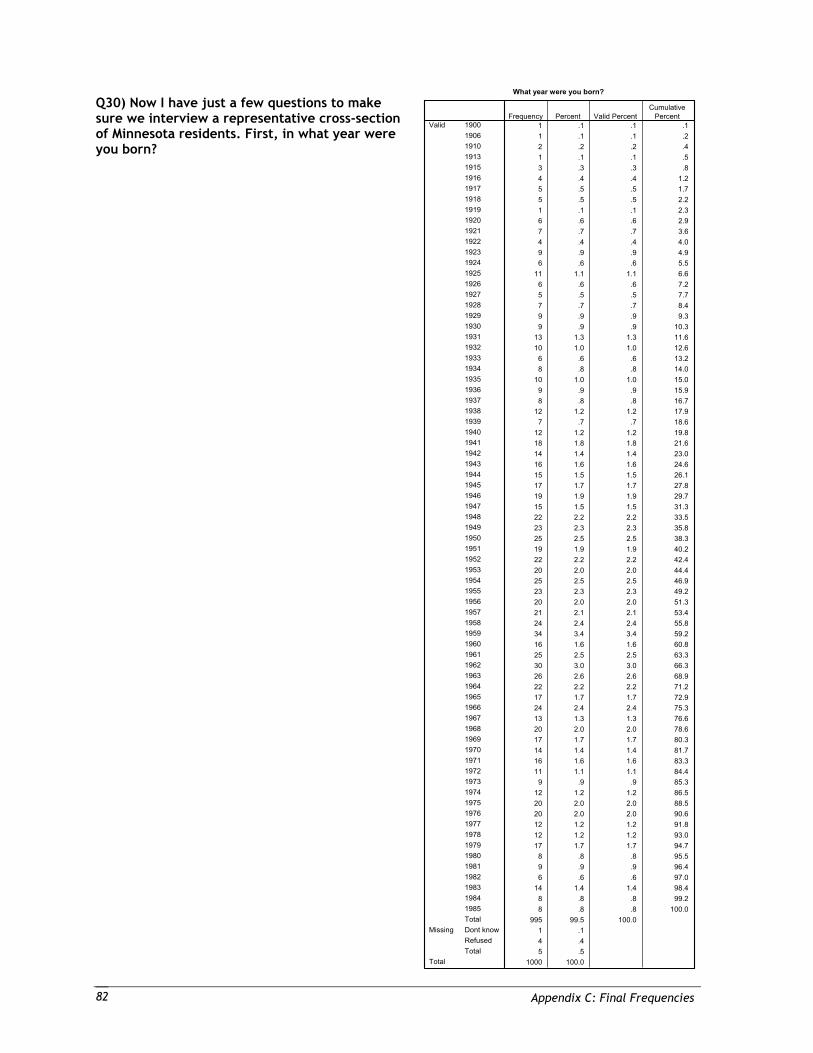
Appendix C: Final Frequencies 82
Q30) Now I have just a few questions to make sure we interview a representative cross-section of Minnesota residents. First, in what year were you born?
What year were you born?
1 .1 .1 .11 .1 .1 .22 .2 .2 .41 .1 .1 .53 .3 .3 .84 .4 .4 1.25 .5 .5 1.75 .5 .5 2.21 .1 .1 2.36 .6 .6 2.97 .7 .7 3.64 .4 .4 4.09 .9 .9 4.96 .6 .6 5.5
11 1.1 1.1 6.66 .6 .6 7.25 .5 .5 7.77 .7 .7 8.49 .9 .9 9.39 .9 .9 10.3
13 1.3 1.3 11.610 1.0 1.0 12.6
6 .6 .6 13.28 .8 .8 14.0
10 1.0 1.0 15.09 .9 .9 15.98 .8 .8 16.7
12 1.2 1.2 17.97 .7 .7 18.6
12 1.2 1.2 19.818 1.8 1.8 21.614 1.4 1.4 23.016 1.6 1.6 24.615 1.5 1.5 26.117 1.7 1.7 27.819 1.9 1.9 29.715 1.5 1.5 31.322 2.2 2.2 33.523 2.3 2.3 35.825 2.5 2.5 38.319 1.9 1.9 40.222 2.2 2.2 42.420 2.0 2.0 44.425 2.5 2.5 46.923 2.3 2.3 49.220 2.0 2.0 51.321 2.1 2.1 53.424 2.4 2.4 55.834 3.4 3.4 59.216 1.6 1.6 60.825 2.5 2.5 63.330 3.0 3.0 66.326 2.6 2.6 68.922 2.2 2.2 71.217 1.7 1.7 72.924 2.4 2.4 75.313 1.3 1.3 76.620 2.0 2.0 78.617 1.7 1.7 80.314 1.4 1.4 81.716 1.6 1.6 83.311 1.1 1.1 84.4
9 .9 .9 85.312 1.2 1.2 86.520 2.0 2.0 88.520 2.0 2.0 90.612 1.2 1.2 91.812 1.2 1.2 93.017 1.7 1.7 94.7
8 .8 .8 95.59 .9 .9 96.46 .6 .6 97.0
14 1.4 1.4 98.48 .8 .8 99.28 .8 .8 100.0
995 99.5 100.01 .14 .45 .5
1000 100.0
190019061910191319151916191719181919192019211922192319241925192619271928192919301931193219331934193519361937193819391940194119421943194419451946194719481949195019511952195319541955195619571958195919601961196219631964196519661967196819691970197119721973197419751976197719781979198019811982198319841985Total
Valid
Dont knowRefusedTotal
Missing
Total
Frequency Percent Valid PercentCumulative
Percent
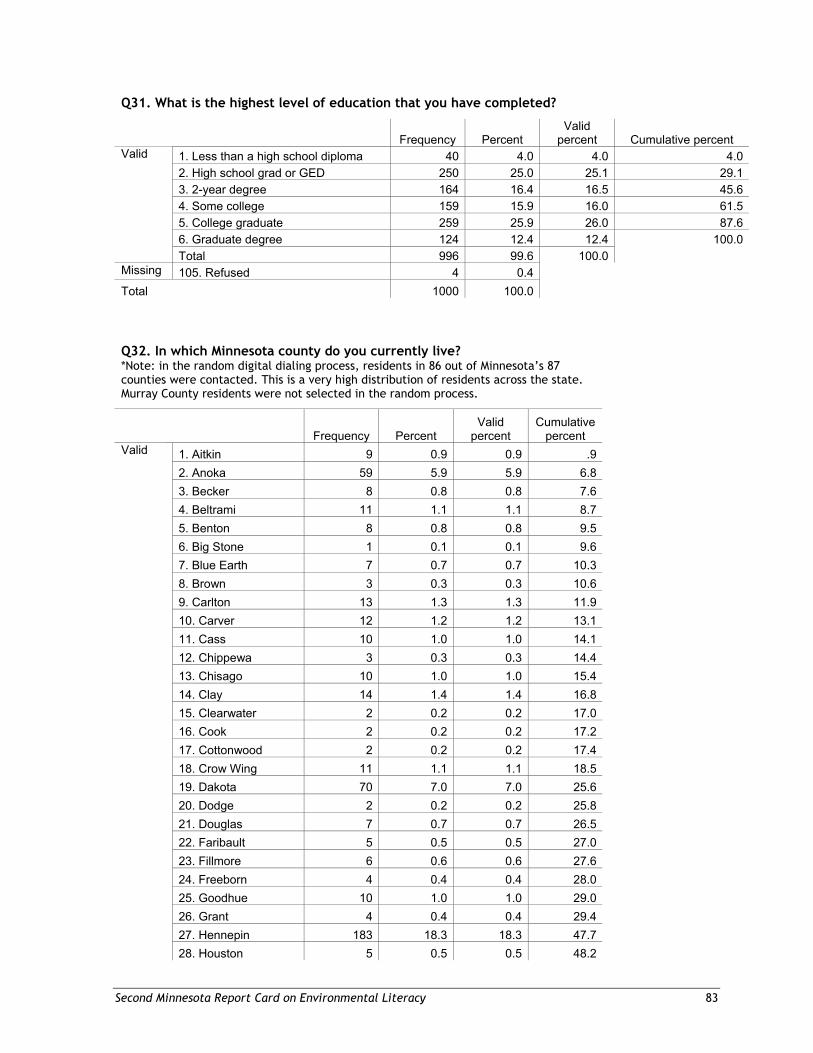
Second Minnesota Report Card on Environmental Literacy 83
Q31. What is the highest level of education that you have completed?
Frequency Percent Valid
percent Cumulative percent 1. Less than a high school diploma 40 4.0 4.0 4.02. High school grad or GED 250 25.0 25.1 29.13. 2-year degree 164 16.4 16.5 45.64. Some college 159 15.9 16.0 61.55. College graduate 259 25.9 26.0 87.66. Graduate degree 124 12.4 12.4 100.0
Valid
Total 996 99.6 100.0 Missing 105. Refused 4 0.4 Total 1000 100.0
Q32. In which Minnesota county do you currently live? *Note: in the random digital dialing process, residents in 86 out of Minnesota’s 87 counties were contacted. This is a very high distribution of residents across the state. Murray County residents were not selected in the random process.
Frequency Percent Valid
percent Cumulative
percent 1. Aitkin 9 0.9 0.9 .9 2. Anoka 59 5.9 5.9 6.8 3. Becker 8 0.8 0.8 7.6 4. Beltrami 11 1.1 1.1 8.7 5. Benton 8 0.8 0.8 9.5 6. Big Stone 1 0.1 0.1 9.6 7. Blue Earth 7 0.7 0.7 10.3 8. Brown 3 0.3 0.3 10.6 9. Carlton 13 1.3 1.3 11.9 10. Carver 12 1.2 1.2 13.1 11. Cass 10 1.0 1.0 14.1 12. Chippewa 3 0.3 0.3 14.4 13. Chisago 10 1.0 1.0 15.4 14. Clay 14 1.4 1.4 16.8 15. Clearwater 2 0.2 0.2 17.0 16. Cook 2 0.2 0.2 17.2 17. Cottonwood 2 0.2 0.2 17.4 18. Crow Wing 11 1.1 1.1 18.5 19. Dakota 70 7.0 7.0 25.6 20. Dodge 2 0.2 0.2 25.8 21. Douglas 7 0.7 0.7 26.5 22. Faribault 5 0.5 0.5 27.0 23. Fillmore 6 0.6 0.6 27.6 24. Freeborn 4 0.4 0.4 28.0 25. Goodhue 10 1.0 1.0 29.0 26. Grant 4 0.4 0.4 29.4 27. Hennepin 183 18.3 18.3 47.7
Valid
28. Houston 5 0.5 0.5 48.2
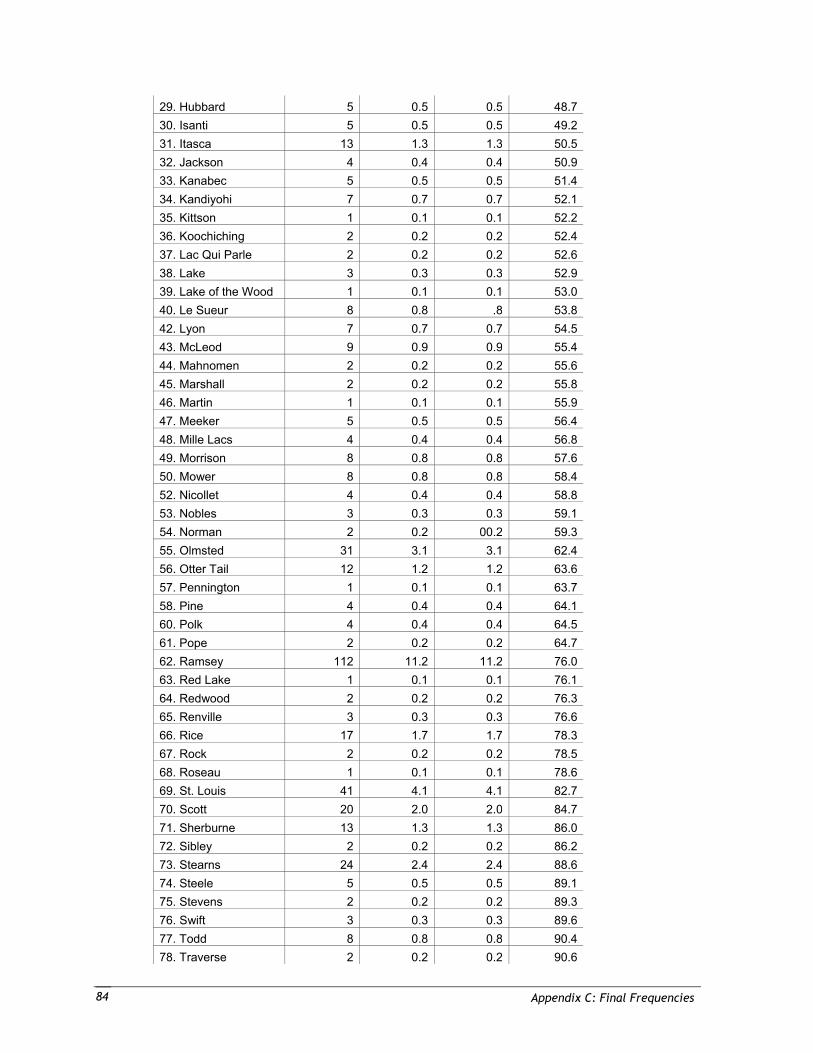
Appendix C: Final Frequencies 84
29. Hubbard 5 0.5 0.5 48.7 30. Isanti 5 0.5 0.5 49.2 31. Itasca 13 1.3 1.3 50.5 32. Jackson 4 0.4 0.4 50.9 33. Kanabec 5 0.5 0.5 51.4 34. Kandiyohi 7 0.7 0.7 52.1 35. Kittson 1 0.1 0.1 52.2 36. Koochiching 2 0.2 0.2 52.4 37. Lac Qui Parle 2 0.2 0.2 52.6 38. Lake 3 0.3 0.3 52.9 39. Lake of the Wood 1 0.1 0.1 53.0 40. Le Sueur 8 0.8 .8 53.8 42. Lyon 7 0.7 0.7 54.5 43. McLeod 9 0.9 0.9 55.4 44. Mahnomen 2 0.2 0.2 55.6 45. Marshall 2 0.2 0.2 55.8 46. Martin 1 0.1 0.1 55.9 47. Meeker 5 0.5 0.5 56.4 48. Mille Lacs 4 0.4 0.4 56.8 49. Morrison 8 0.8 0.8 57.6 50. Mower 8 0.8 0.8 58.4 52. Nicollet 4 0.4 0.4 58.8 53. Nobles 3 0.3 0.3 59.1 54. Norman 2 0.2 00.2 59.3 55. Olmsted 31 3.1 3.1 62.4 56. Otter Tail 12 1.2 1.2 63.6 57. Pennington 1 0.1 0.1 63.7 58. Pine 4 0.4 0.4 64.1 60. Polk 4 0.4 0.4 64.5 61. Pope 2 0.2 0.2 64.7 62. Ramsey 112 11.2 11.2 76.0 63. Red Lake 1 0.1 0.1 76.1 64. Redwood 2 0.2 0.2 76.3 65. Renville 3 0.3 0.3 76.6 66. Rice 17 1.7 1.7 78.3 67. Rock 2 0.2 0.2 78.5 68. Roseau 1 0.1 0.1 78.6 69. St. Louis 41 4.1 4.1 82.7 70. Scott 20 2.0 2.0 84.7 71. Sherburne 13 1.3 1.3 86.0 72. Sibley 2 0.2 0.2 86.2 73. Stearns 24 2.4 2.4 88.6 74. Steele 5 0.5 0.5 89.1 75. Stevens 2 0.2 0.2 89.3 76. Swift 3 0.3 0.3 89.6 77. Todd 8 0.8 0.8 90.4
78. Traverse 2 0.2 0.2 90.6
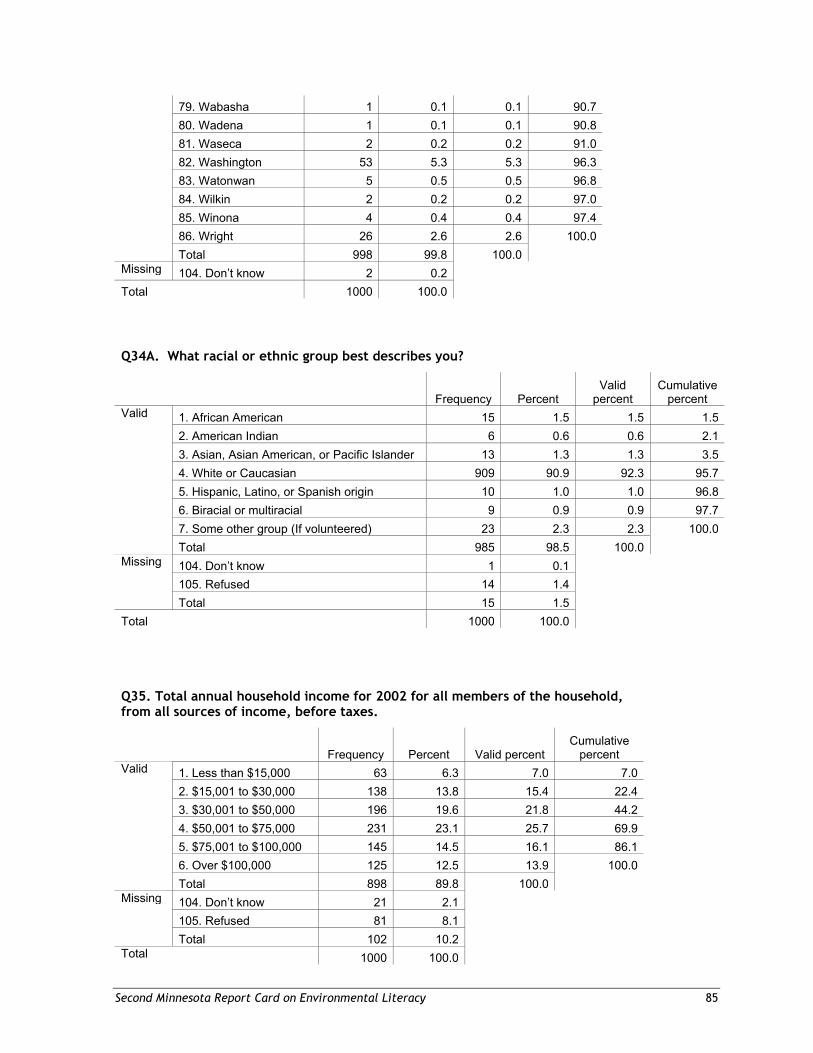
Second Minnesota Report Card on Environmental Literacy 85
79. Wabasha 1 0.1 0.1 90.7 80. Wadena 1 0.1 0.1 90.8 81. Waseca 2 0.2 0.2 91.0 82. Washington 53 5.3 5.3 96.3 83. Watonwan 5 0.5 0.5 96.8 84. Wilkin 2 0.2 0.2 97.0 85. Winona 4 0.4 0.4 97.4 86. Wright 26 2.6 2.6 100.0
Total 998 99.8 100.0 Missing 104. Don’t know 2 0.2 Total 1000 100.0
Q34A. What racial or ethnic group best describes you?
Frequency Percent Valid
percent Cumulative
percent 1. African American 15 1.5 1.5 1.52. American Indian 6 0.6 0.6 2.13. Asian, Asian American, or Pacific Islander 13 1.3 1.3 3.54. White or Caucasian 909 90.9 92.3 95.75. Hispanic, Latino, or Spanish origin 10 1.0 1.0 96.86. Biracial or multiracial 9 0.9 0.9 97.77. Some other group (If volunteered) 23 2.3 2.3 100.0
Valid
Total 985 98.5 100.0 104. Don’t know 1 0.1 105. Refused 14 1.4
Missing
Total 15 1.5 Total 1000 100.0
Q35. Total annual household income for 2002 for all members of the household, from all sources of income, before taxes.
Frequency Percent Valid percent Cumulative
percent 1. Less than $15,000 63 6.3 7.0 7.0 2. $15,001 to $30,000 138 13.8 15.4 22.4 3. $30,001 to $50,000 196 19.6 21.8 44.2 4. $50,001 to $75,000 231 23.1 25.7 69.9 5. $75,001 to $100,000 145 14.5 16.1 86.1 6. Over $100,000 125 12.5 13.9 100.0
Valid
Total 898 89.8 100.0 104. Don’t know 21 2.1 105. Refused 81 8.1
Missing
Total 102 10.2 Total 1000 100.0
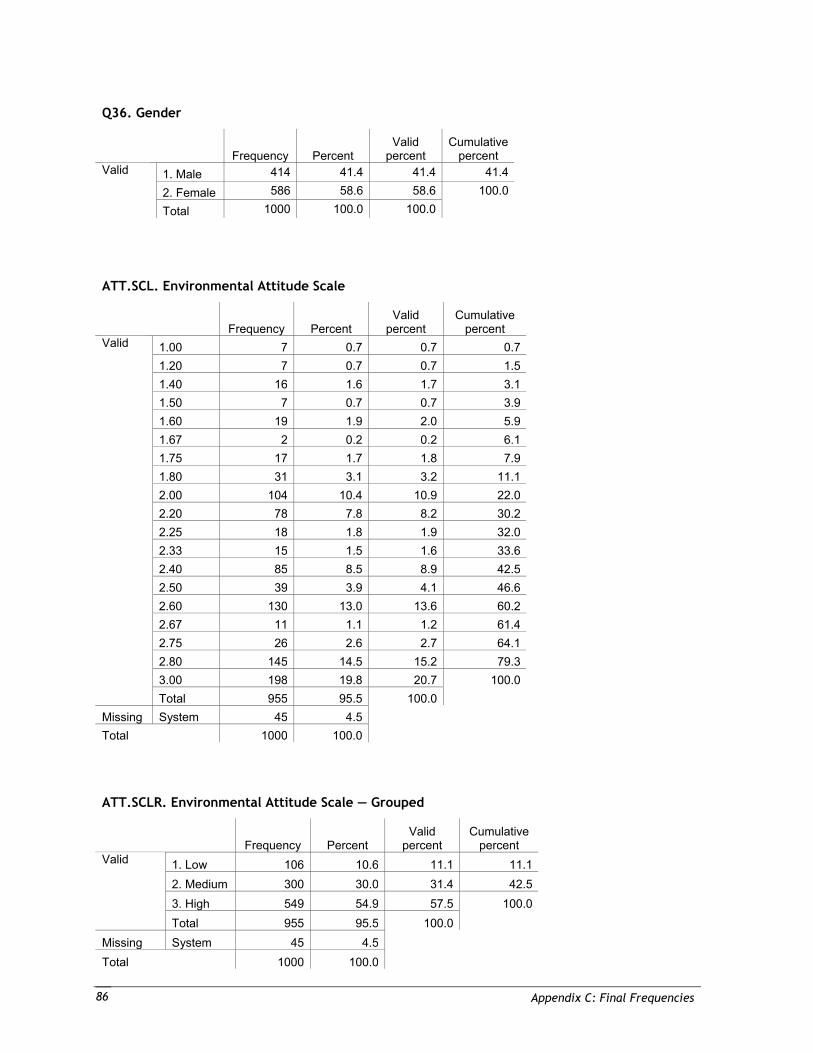
Appendix C: Final Frequencies 86
Q36. Gender
Frequency Percent Valid
percent Cumulative
percent 1. Male 414 41.4 41.4 41.4
2. Female 586 58.6 58.6 100.0
Valid
Total 1000 100.0 100.0
ATT.SCL. Environmental Attitude Scale
Frequency Percent Valid
percent Cumulative
percent 1.00 7 0.7 0.7 0.71.20 7 0.7 0.7 1.51.40 16 1.6 1.7 3.11.50 7 0.7 0.7 3.91.60 19 1.9 2.0 5.91.67 2 0.2 0.2 6.11.75 17 1.7 1.8 7.91.80 31 3.1 3.2 11.12.00 104 10.4 10.9 22.02.20 78 7.8 8.2 30.22.25 18 1.8 1.9 32.02.33 15 1.5 1.6 33.62.40 85 8.5 8.9 42.52.50 39 3.9 4.1 46.62.60 130 13.0 13.6 60.22.67 11 1.1 1.2 61.42.75 26 2.6 2.7 64.12.80 145 14.5 15.2 79.33.00 198 19.8 20.7 100.0
Valid
Total 955 95.5 100.0 Missing System 45 4.5 Total 1000 100.0
ATT.SCLR. Environmental Attitude Scale — Grouped
Frequency Percent Valid
percent Cumulative
percent 1. Low 106 10.6 11.1 11.12. Medium 300 30.0 31.4 42.53. High 549 54.9 57.5 100.0
Valid
Total 955 95.5 100.0 Missing System 45 4.5 Total 1000 100.0
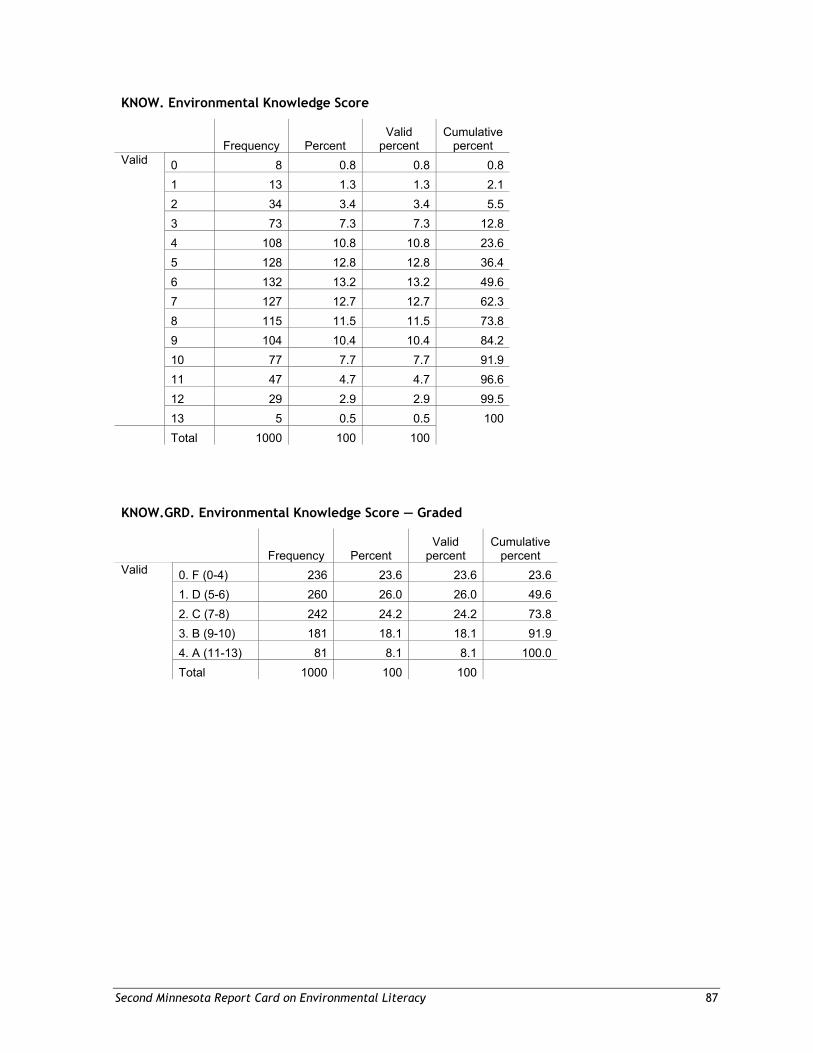
Second Minnesota Report Card on Environmental Literacy 87
KNOW. Environmental Knowledge Score
Frequency Percent Valid
percent Cumulative
percent 0 8 0.8 0.8 0.81 13 1.3 1.3 2.12 34 3.4 3.4 5.53 73 7.3 7.3 12.84 108 10.8 10.8 23.65 128 12.8 12.8 36.46 132 13.2 13.2 49.67 127 12.7 12.7 62.38 115 11.5 11.5 73.89 104 10.4 10.4 84.210 77 7.7 7.7 91.911 47 4.7 4.7 96.612 29 2.9 2.9 99.5
Valid
13 5 0.5 0.5 100 Total 1000 100 100
KNOW.GRD. Environmental Knowledge Score — Graded
Frequency Percent Valid
percent Cumulative
percent 0. F (0-4) 236 23.6 23.6 23.61. D (5-6) 260 26.0 26.0 49.62. C (7-8) 242 24.2 24.2 73.83. B (9-10) 181 18.1 18.1 91.94. A (11-13) 81 8.1 8.1 100.0
Valid
Total 1000 100 100
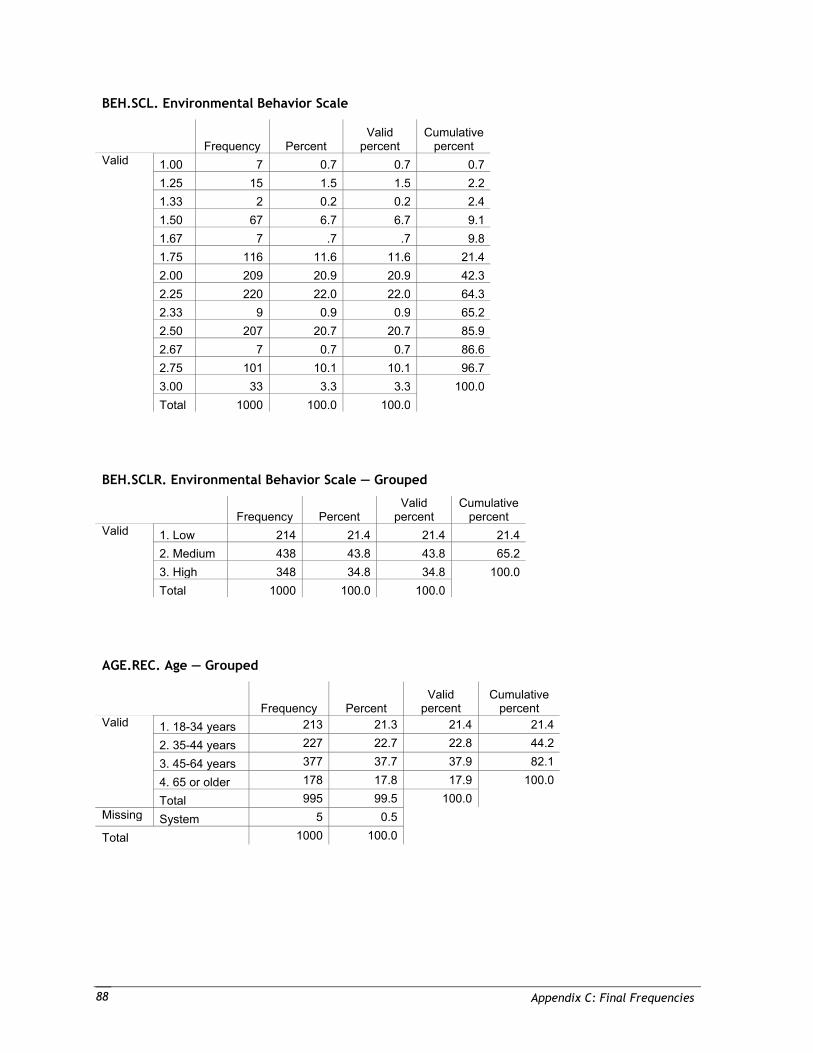
Appendix C: Final Frequencies 88
BEH.SCL. Environmental Behavior Scale
Frequency Percent Valid
percent Cumulative
percent 1.00 7 0.7 0.7 0.71.25 15 1.5 1.5 2.21.33 2 0.2 0.2 2.41.50 67 6.7 6.7 9.11.67 7 .7 .7 9.81.75 116 11.6 11.6 21.42.00 209 20.9 20.9 42.32.25 220 22.0 22.0 64.32.33 9 0.9 0.9 65.22.50 207 20.7 20.7 85.92.67 7 0.7 0.7 86.62.75 101 10.1 10.1 96.73.00 33 3.3 3.3 100.0
Valid
Total 1000 100.0 100.0
BEH.SCLR. Environmental Behavior Scale — Grouped
Frequency Percent Valid
percent Cumulative
percent 1. Low 214 21.4 21.4 21.42. Medium 438 43.8 43.8 65.23. High 348 34.8 34.8 100.0
Valid
Total 1000 100.0 100.0
AGE.REC. Age — Grouped
Frequency Percent Valid
percent Cumulative
percent 1. 18-34 years 213 21.3 21.4 21.4
2. 35-44 years 227 22.7 22.8 44.2
3. 45-64 years 377 37.7 37.9 82.1
4. 65 or older 178 17.8 17.9 100.0
Valid
Total 995 99.5 100.0 Missing System 5 0.5
Total 1000 100.0
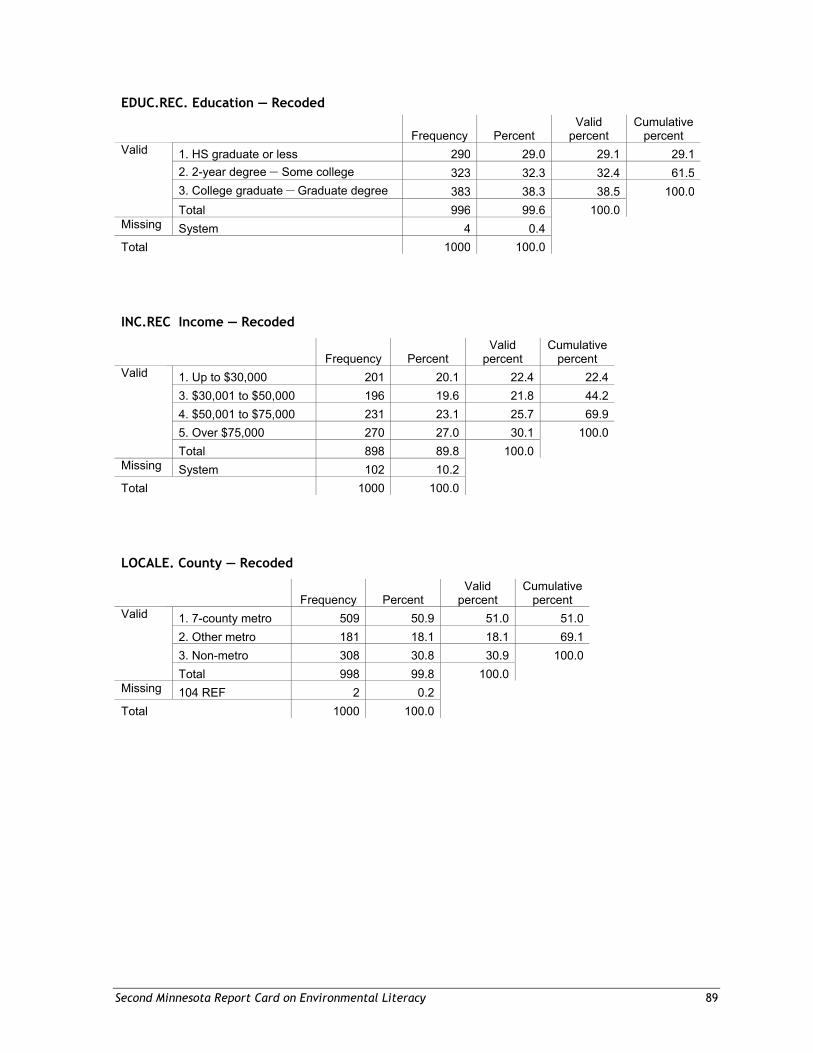
Second Minnesota Report Card on Environmental Literacy 89
EDUC.REC. Education — Recoded
Frequency Percent Valid
percent Cumulative
percent 1. HS graduate or less 290 29.0 29.1 29.12. 2-year degree – Some college 323 32.3 32.4 61.53. College graduate – Graduate degree 383 38.3 38.5 100.0
Valid
Total 996 99.6 100.0 Missing System 4 0.4 Total 1000 100.0
INC.REC Income — Recoded
Frequency Percent Valid
percent Cumulative
percent 1. Up to $30,000 201 20.1 22.4 22.4 3. $30,001 to $50,000 196 19.6 21.8 44.2 4. $50,001 to $75,000 231 23.1 25.7 69.9 5. Over $75,000 270 27.0 30.1 100.0
Valid
Total 898 89.8 100.0 Missing System 102 10.2 Total 1000 100.0
LOCALE. County — Recoded
Frequency Percent Valid
percent Cumulative
percent 1. 7-county metro 509 50.9 51.0 51.0 2. Other metro 181 18.1 18.1 69.1 3. Non-metro 308 30.8 30.9 100.0
Valid
Total 998 99.8 100.0 Missing 104 REF 2 0.2 Total 1000 100.0
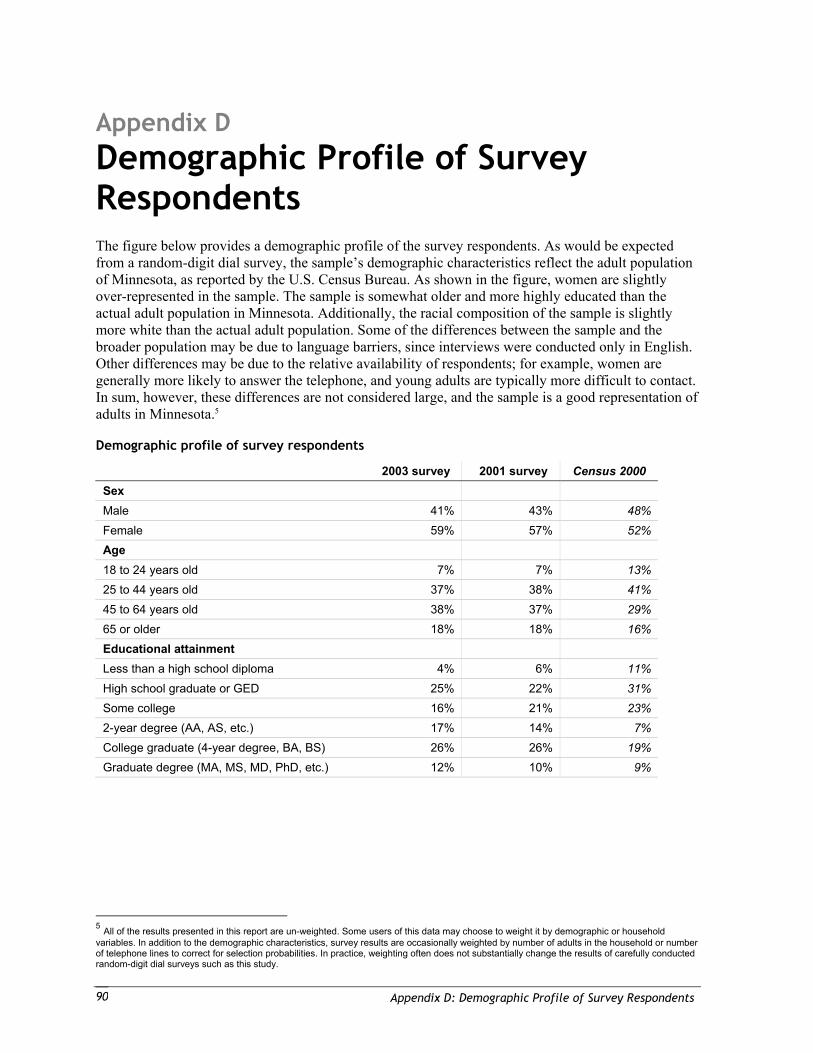
Appendix D: Demographic Profile of Survey Respondents 90
Appendix D Demographic Profile of Survey Respondents The figure below provides a demographic profile of the survey respondents. As would be expected from a random-digit dial survey, the sample’s demographic characteristics reflect the adult population of Minnesota, as reported by the U.S. Census Bureau. As shown in the figure, women are slightly over-represented in the sample. The sample is somewhat older and more highly educated than the actual adult population in Minnesota. Additionally, the racial composition of the sample is slightly more white than the actual adult population. Some of the differences between the sample and the broader population may be due to language barriers, since interviews were conducted only in English. Other differences may be due to the relative availability of respondents; for example, women are generally more likely to answer the telephone, and young adults are typically more difficult to contact. In sum, however, these differences are not considered large, and the sample is a good representation of adults in Minnesota.5
Demographic profile of survey respondents
2003 survey 2001 survey Census 2000 Sex Male 41% 43% 48% Female 59% 57% 52% Age 18 to 24 years old 7% 7% 13% 25 to 44 years old 37% 38% 41% 45 to 64 years old 38% 37% 29% 65 or older 18% 18% 16% Educational attainment Less than a high school diploma 4% 6% 11% High school graduate or GED 25% 22% 31% Some college 16% 21% 23% 2-year degree (AA, AS, etc.) 17% 14% 7% College graduate (4-year degree, BA, BS) 26% 26% 19% Graduate degree (MA, MS, MD, PhD, etc.) 12% 10% 9%
5 All of the results presented in this report are un-weighted. Some users of this data may choose to weight it by demographic or household variables. In addition to the demographic characteristics, survey results are occasionally weighted by number of adults in the household or number of telephone lines to correct for selection probabilities. In practice, weighting often does not substantially change the results of carefully conducted random-digit dial surveys such as this study.
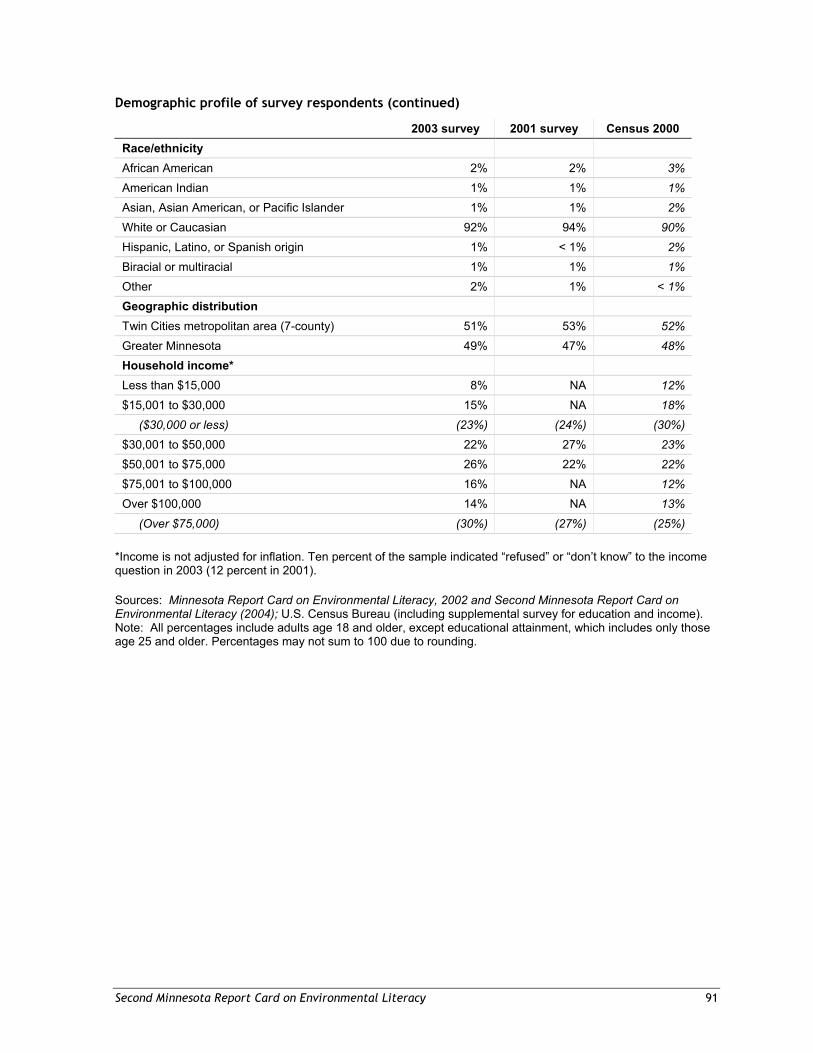
Second Minnesota Report Card on Environmental Literacy 91
Demographic profile of survey respondents (continued)
2003 survey 2001 survey Census 2000 Race/ethnicity African American 2% 2% 3% American Indian 1% 1% 1% Asian, Asian American, or Pacific Islander 1% 1% 2% White or Caucasian 92% 94% 90% Hispanic, Latino, or Spanish origin 1% < 1% 2% Biracial or multiracial 1% 1% 1% Other 2% 1% < 1% Geographic distribution Twin Cities metropolitan area (7-county) 51% 53% 52% Greater Minnesota 49% 47% 48% Household income* Less than $15,000 8% NA 12% $15,001 to $30,000 15% NA 18% ($30,000 or less) (23%) (24%) (30%) $30,001 to $50,000 22% 27% 23% $50,001 to $75,000 26% 22% 22% $75,001 to $100,000 16% NA 12% Over $100,000 14% NA 13% (Over $75,000) (30%) (27%) (25%)
*Income is not adjusted for inflation. Ten percent of the sample indicated “refused” or “don’t know” to the income question in 2003 (12 percent in 2001).
Sources: Minnesota Report Card on Environmental Literacy, 2002 and Second Minnesota Report Card on Environmental Literacy (2004); U.S. Census Bureau (including supplemental survey for education and income). Note: All percentages include adults age 18 and older, except educational attainment, which includes only those age 25 and older. Percentages may not sum to 100 due to rounding.
Appendix E: List of Referenced Reports 92
Appendix E List of Referenced Reports Biodiversity Project, 2002. Americans and Biodiversity: New Perspectives in 2002.
Fenske, M. J.; Fridell, A.; Livingston, S.; Ledermann, J.; and Miller, T.; State Agency Climate Change Survey Summary, 2002. Minnesota Pollution Control Agency and Minnesota Office of Environmental Assistance.
Livingston, S. and Zadak, C. St. Cloud State University and Minnesota Pollution Control Agency 2002 Statewide Survey.
Minnesota Department of Natural Resources, 1997. Minnesota Wetlands Conservation Plan. http://files.dnr.state.mn.us/ecological_services/wetlands/wetland.pdf. p. 16.
Minnesota Center for Survey Research, 2001. Twin Cities Area Survey, funded by the Metropolitan Council.
Minnesota State Survey of the general public conducted by the University of Minnesota.