Embed Size (px)
Citation preview
Includes:
EMPLOYEE SATISFACTIONQUALITY PROFILE™
Published date: March 9, 2011
RESIDENT SATISFACTION
previous initiatives.
initiate quality improvement efforts, track
referral sources, improve staff recruitment
and retention, and evaluate outcomes of FAMILY SATISFACTION
Minnesota Skilled Nursing Facilities
2010EXECUTIVE SUMMARY
This report provides information needed to
Prepared by
This CONFIDENTIAL Executive Summary was prepared by My InnerView.

MINNESOTAThis CONFIDENTIAL Executive Summary was prepared by My InnerView.
© My InnerView
FOREWORD
My InnerView, a subsidiary of National Research Corporation (NASDQ: NRCI), is the nation’s largest provider of performance measurement and benchmarking in the senior services sector. My InnerView currently conducts regular customer and staff satisfaction surveys in nearly half of the nation’s long-term care facilities, and possesses the largest private database of nursing home performance in existence. These surveys and other My InnerView evidence-based tools and programs are designed to assist service providers, government policy makers and consumers in their common efforts to enhance the quality and value available to the growing number of Americans who need reliable and affordable health and supportive services in nursing homes and other residential settings.
This Executive Summary Report presents aggregate measures of customer and employee satisfaction for large samples of Minnesota nursing facilities. Results are displayed for resident, family and employee satisfaction surveys conducted by My InnerView in 2010, with comparisons to similar data reported for 2009 and 2008. Surveys were conducted in coordination with Aging Services of Minnesota and Care Providers of Minnesota.
My InnerView produces other state-based reports and a national report each year on nursing home consumer and employee satisfaction levels. The 2009 National Survey of Consumer and Workforce Satisfaction in Nursing Homes can be viewed at www.myinnerview.com.
SATISFAcTION SuRvEy PARTIcIPATION IN 2010: MINNESOTA NuRSING FAcILITIES
MONTHLy PERFORMANcE DATA PARTIcIPATION
A total of 112 Minnesota nursing facilities used My InnerView's Quality Profile Web-based instrument to enter clinical, workforce and occupancy performance data on a monthly basis during 2010, as compared to 140 facilities in 2009.
SURVEY TYPEResidentFamily
Employee
FAC PARTICIPATING146187112
% STATE’S NF38%49%29%
RESPONDENTS2,6885,1647,928
MN RESPONSE RATE62%49%57%
MIV RESPONSE RATE*59%40%65%
* Most recent 12-month averages

MINNESOTAThis CONFIDENTIAL Executive Summary was prepared by My InnerView.
© My InnerView
DISTRIBuTION: Each participating facility provided My InnerView with the number of resident, family and employee surveys needed. Individually sealed packets containing a self-addressed, postage-paid envelope were sent to residents’ family members or other responsible parties. Packets containing the employee survey and postage-paid envelopes were distributed at each participating facility to its current staff members. The survey process was designed to communicate and ensure that response was voluntary, anonymous and confidential.
QuALITy ASSuRANcE: Responses are electronically compiled into a database, analyzed for integrity and subjected to a variety of statistical analyses.
RESuLTS: Each facility and provider organization has access to its satisfaction survey results and other performance results on My InnerView’s members-only Web site. The results provide benchmark information, enabling the facility to compare its performance to the average performance of all participating Minnesota facilities and to My InnerView’s nationwide database. For individual facilities, My InnerView provides a Priority Action Agenda™ that highlights from the satisfaction surveys those areas of performance that represent priority opportunities for quality improvement. A comparable Priority Action Agenda is included with this report based on the aggregate satisfaction survey results for all participating Minnesota facilities.
RESIDENT AND FAMILy SATISFAcTION SuRvEyS: These surveys included items grouped in four areas: (1) Overall Satisfaction, (2) Quality of Life, (3) Quality of Care and (4) Quality of Service.
EMPLOyEE SATISFAcTION SuRvEyS: This survey covers five areas: (1) Overall Satisfaction, (2) Training, (3) Work Environment, (4) Supervision and (5) Management.
FOREWORD

MINNESOTAThis CONFIDENTIAL Executive Summary was prepared by My InnerView.
© My InnerView
KEy FINDINGSInformation provided through regular assessments of customer and staff satisfaction help to fill a gap in traditional regulatory-based determinations of nursing home performance. Numerous research studies confirm that customer satisfaction in nursing homes is both an indicator of quality of care, and a component of quality of care. Further, customer satisfaction levels are strongly correlated with staff satisfaction. These findings reflect the reality that residents and their involved family members assess the motives and competence of caregivers through their personal interaction with them, rather than by reference to abstract standards of care. Staff satisfaction and commitment likewise turn on the quality of relationships with customers and other employees and their perception of the care and responsiveness of facility managers. Thus, the perceptions of direct users of nursing home care, and of the workers who provide that care, provide important guidance for continued quality improvement.
Global satisfaction domains: Percent “Excellent” or “Good”
Eighty-seven percent (87%) of the resident survey respondents gave an overall satisfaction rating of “excellent“ or “good,” with 86% also rating their willingness to recommend their facility to others as either “excellent” or “good.” Resident ratings during the year were nearly identical to My InnerView’s national benchmarks for resident global satisfaction when percentages of “excellent” and “good” ratings are combined.
Ninety percent (90%) of family survey respondents gave an overall rating of “excellent” or “good,” with 89% indicating a strong willingness to recommend to others the facility where their loved one was receiving care and services. These rating percentages were similar as compared to similar data from 2009, and exceeded the comparable national benchmarks. It is notable also that the vast majority of family survey respondents identified themselves as very frequent visitors to facilities.
Employee satisfaction levels declined smewhat during 2009 and are mixed relative to national norms. Sixty-seven percent (67%) of responding employees rated their overall satisfaction as either “excellent” or “good,” with 67% also giving an “excellent” or “good” recommendation of their facility to others as a place to work, and 75% saying they would recommend the facility as an “excellent” or “good” place to receive care.

MINNESOTAThis CONFIDENTIAL Executive Summary was prepared by My InnerView.
© My InnerView
KEy FINDINGS
All domains and items: Weighted average scores
This report also displays weighted average scores for global satisfaction, as well as for all other survey domains. These scores account for all respondent ratings, whether “excellent,” “good,” “fair” or “poor,” on a scale of 100. These average resident, family and employee satisfaction ratings for Minnesota for 2010 maintained an improving trend. Average resident and employee ratings, despite marginal improvement, tracked slightly below the current My InnerView national average satisfaction ratings across most surveyed domains and items. Family scores exceeded the national norms by material margins
Geographic differentiations
This report contains tables which separate weighted average satisfaction levels based on whether facilities were located in rural, suburban or urban areas. Satisfaction levels for Minnesota nursing home residents and family members continue to be consistently higher in rural communities than other locations. Employee satisfaction levels continued to be highest in suburban facilities.
___
Detailed charts included in this report provide item-specific results and comparisons pointing to priority areas for further improvement, and display benchmarked results against My InnerView’s skilled nursing facility database numbering close to 5,500 facilities during 2010.
Monthly clinical measures
RESIDENTS WITHOUT FALLS — The Minnesota participating facilities had little distincion as compared to the average of all facilities in My InnerView's national database. This measure has remained essentially unchanged since 2006.
RESIDENTS WITHOUT ANTIPSYCHOTIC DRUG USE — The Minnesota participant group continued to outperform the national benchmark by roughly 10 percentage points. Performance continues to be higher among facilities in rural and suburban locations.
RESIDENTS WITHOUT FACILITY-ACQUIRED CATHETERS — Both the Minnesota and My InnerView percentages remained relatively stable throughout 2010, differing by no more than one-and-a-half percentage points throughout the year
RESIDENTS WITHOUT ACQUIRED PHYSICAL RESTRAINTS — This metric is also one in which performance nationally and in Minnesota continues to be quite high in percentage terms, and where improvement has been continuous since 2006. The Minnesota restraint-avoidance record continued to climb in 2010.
RESIDENTS WITHOUT UNPLANNED WEIGHT GAIN OR LOSS — The Minnesota and national benchmarks were relatively unchanged from 2009 to 2010.
MINNESOTAThis CONFIDENTIAL Executive Summary was prepared by My InnerView.
© My InnerView
KEy FINDINGS
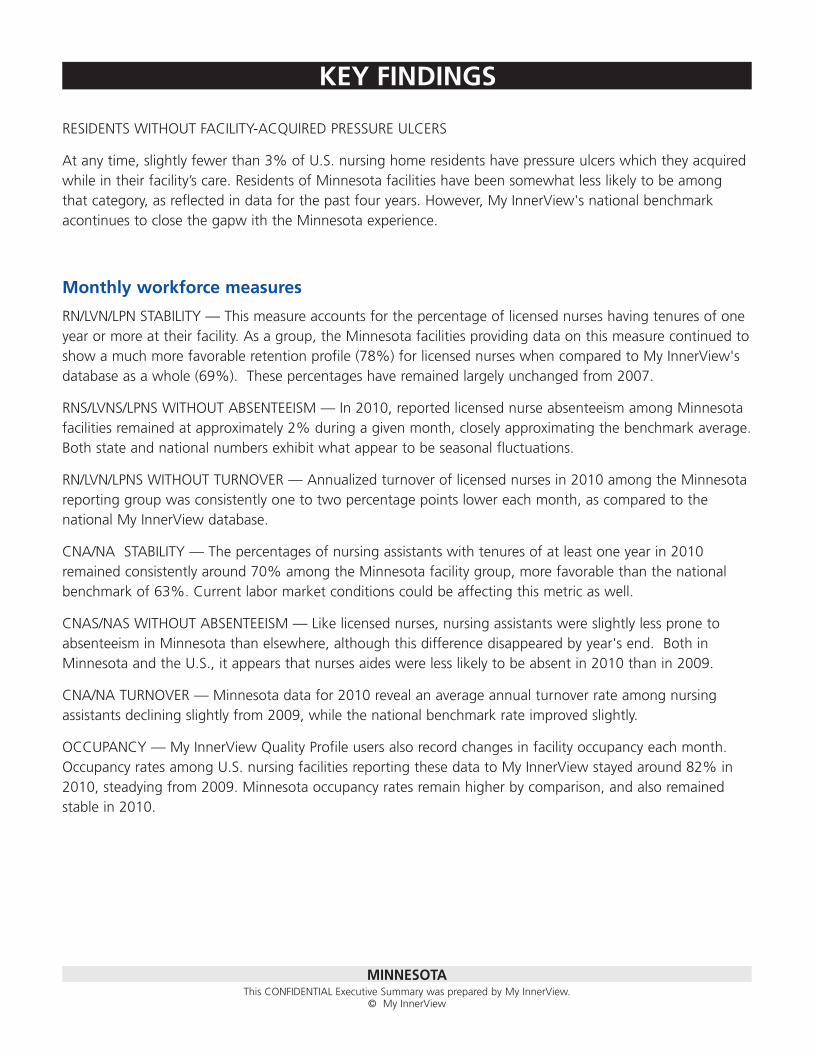
RESIDENTS WITHOUT FACILITY-ACQUIRED PRESSURE ULCERS
At any time, slightly fewer than 3% of U.S. nursing home residents have pressure ulcers which they acquired while in their facility’s care. Residents of Minnesota facilities have been somewhat less likely to be among that category, as reflected in data for the past four years. However, My InnerView's national benchmark acontinues to close the gapw ith the Minnesota experience.
Monthly workforce measures
RN/LVN/LPN STABILITY — This measure accounts for the percentage of licensed nurses having tenures of one year or more at their facility. As a group, the Minnesota facilities providing data on this measure continued to show a much more favorable retention profile (78%) for licensed nurses when compared to My InnerView's database as a whole (69%). These percentages have remained largely unchanged from 2007.
RNS/LVNS/LPNS WITHOUT ABSENTEEISM — In 2010, reported licensed nurse absenteeism among Minnesota facilities remained at approximately 2% during a given month, closely approximating the benchmark average. Both state and national numbers exhibit what appear to be seasonal fluctuations.
RN/LVN/LPNS WITHOUT TURNOVER — Annualized turnover of licensed nurses in 2010 among the Minnesota reporting group was consistently one to two percentage points lower each month, as compared to the national My InnerView database.
CNA/NA STABILITY — The percentages of nursing assistants with tenures of at least one year in 2010 remained consistently around 70% among the Minnesota facility group, more favorable than the national benchmark of 63%. Current labor market conditions could be affecting this metric as well.
CNAS/NAS WITHOUT ABSENTEEISM — Like licensed nurses, nursing assistants were slightly less prone to absenteeism in Minnesota than elsewhere, although this difference disappeared by year's end. Both in Minnesota and the U.S., it appears that nurses aides were less likely to be absent in 2010 than in 2009.
CNA/NA TURNOVER — Minnesota data for 2010 reveal an average annual turnover rate among nursing assistants declining slightly from 2009, while the national benchmark rate improved slightly.
OCCUPANCY — My InnerView Quality Profile users also record changes in facility occupancy each month. Occupancy rates among U.S. nursing facilities reporting these data to My InnerView stayed around 82% in 2010, steadying from 2009. Minnesota occupancy rates remain higher by comparison, and also remained stable in 2010.

RESIDENT SATISFACTIONGLOBAL SATISFACTION AND RATINGS BY DOMAIN FOR 2010 1ITEMS RANKED BY PERCENT ''EXCELLENT'' FOR 2010 2QUADRANT ANALYSIS: STRENGTHS AND OPPORTUNITIES 3ITEMS RANKED BY PERCENT ''EXCELLENT'' FOR 2008, 2009 AND 2010 4ITEMS RANKED WITHIN DOMAIN BY AVERAGE SCORES FOR 2010 5AVERAGE SCORES BY ITEM BY LOCATION TYPE FOR 2010 6DEMOGRAPHICS AND BACKGROUND INFORMATION FOR 2010 7AVERAGE SCORES FOR ''RECOMMENDATION TO OTHERS'' BY DEMOGRAPHICS FOR 2010 8DISTRIBUTION OF RESPONSE RATES FOR 2010 9
SKILLED NURSING RESIDENT SATISFACTION SURVEY REFERENCE
FAMILY SATISFACTIONGLOBAL SATISFACTION AND RATINGS BY DOMAIN FOR 2010 1ITEMS RANKED BY PERCENT ''EXCELLENT'' FOR 2010 2QUADRANT ANALYSIS: STRENGTHS AND OPPORTUNITIES 3ITEMS RANKED BY PERCENT ''EXCELLENT'' FOR 2008, 2009 AND 2010 4ITEMS RANKED WITHIN DOMAIN BY AVERAGE SCORES FOR 2010 5AVERAGE SCORES BY ITEM BY LOCATION TYPE FOR 2010 6DEMOGRAPHICS AND BACKGROUND INFORMATION FOR 2010 7AVERAGE SCORES FOR ''RECOMMENDATION TO OTHERS'' BY DEMOGRAPHICS FOR 2010 8DISTRIBUTION OF RESPONSE RATES FOR 2010 9
SKILLED NURSING FAMILY SATISFACTION SURVEY REFERENCE
EMPLOYEE SATISFACTIONGLOBAL SATISFACTION AND RATINGS BY DOMAIN FOR 2010 1ITEMS RANKED BY PERCENT ''EXCELLENT'' FOR 2010 2QUADRANT ANALYSIS: STRENGTHS AND OPPORTUNITIES 3ITEMS RANKED BY PERCENT ''EXCELLENT'' FOR 2008, 2009 AND 2010 4ITEMS RANKED WITHIN DOMAIN BY AVERAGE SCORES FOR 2010 5AVERAGE SCORES BY ITEM BY LOCATION TYPE FOR 2010 6DEMOGRAPHICS AND BACKGROUND INFORMATION FOR 2010 7AVERAGE SCORES FOR ''RECOMMENDATION FOR JOB'' BY DEMOGRAPHICS FOR 2010 8DISTRIBUTION OF RESPONSE RATES FOR 2010 9
SKILLED NURSING EMPLOYEE SATISFACTION SURVEY REFERENCE
QUALITY PROFILE™
RESIDENTS WITHOUT FALLS FOR 2009 AND 2010 1RESIDENTS WITHOUT ANTI-PSYCHOTIC MEDICATION USE FOR 2009 AND 2010 2RESIDENTS WITHOUT ACQUIRED CATHETERS FOR 2009 AND 2010 3RESIDENTS WITHOUT ACQUIRED PHYSICAL RESTRAINTS FOR 2009 AND 2010 4RESIDENTS WITHOUT UNPLANNED WEIGHT LOSS/GAIN FOR 2009 AND 2010 5RESIDENTS WITHOUT ACQUIRED PRESSURE ULCERS FOR 2009 AND 2010 6RNs/LVNs/LPNs: STABILITY FOR 2009 AND 2010 7RNs/LVNs/LPNs WITHOUT ABSENTEEISM FOR 2009 AND 2010 8RNs/LVNs/LPNs WITHOUT TURNOVER FOR 2009 AND 2010 9CNAs/NAs: STABILITY FOR 2009 AND 2010 10CNAs/NAs WITHOUT ABSENTEEISM FOR 2009 AND 2010 11CNAs/NAs WITHOUT TURNOVER FOR 2009 AND 2010 12OCCUPANCY FOR 2009 AND 2010 13
CHART NUMBER:
MINNESOTA
WHAT'S INSIDECHART
NUMBER:
CHART NUMBER:
CHART NUMBER:
This CONFIDENTIAL Executive Summary was prepared by My InnerView.

2010 2009 200862% 48% 49%
146 133 159
2,688 1,751 1,856
MINNESOTA
SURVEYS RECEIVED
FACILITIES SURVEYED
RESIDENT
RESPONSE RATE
SATISFACTION
This CONFIDENTIAL Executive Summary was prepared by My InnerView.

87% 86%
Averagescore
73
76
71
74
71
74
69
70
(May not total 100% due to rounding.)
POOR
(The total percentage listed may be higher or lower than individual rating totals due to rounding)
MINNESOTA
MN MIV MN MIV
GOOD
FOR GLOBAL SATISFACTION ITEMS
EXCELLENT
Overall satisfaction Recommendation to others89% 89%
FAIR
1GLOBAL SATISFACTION AND RATINGS BY DOMAIN FOR 2010RESIDENT SATISFACTION
PERCENT "EXCELLENT" AND "GOOD"
34%
32%
39%
32%
38%
33%
42%
37%
46%
48%
47%
52%
47%
51%
47%
49%
15%
15%
11%
13%
11%
12%
9%
11%
5%
3%
3%
3%
5%
3%
3%
2%
My InnerView
Minnesota
My InnerView
Minnesota
My InnerView
Minnesota
My InnerView
Minnesota
GLOBAL SATISFACTION
QUALITY OF LIFE
QUALITY OF CARE
QUALITY OF SERVICE
36% 41%
51% 48%
39% 44%
48% 45%
This CONFIDENTIAL Executive Summary was prepared by My InnerView.

EXCELLENT GOOD FAIR POOR
MINNESOTA
Items are ranked from highest to lowest on the percent of responses rated "Excellent." The percentages reflect averages survey respondents. (May not total 100% due to rounding.) See chart 4 for comparison to prior years.
2ITEMS RANKED BY PERCENT ''EXCELLENT'' FOR 2010RESIDENT SATISFACTION
22%
24%
27%
27%
28%
29%
31%
31%
31%
31%
31%
32%
32%
33%
33%
36%
36%
37%
40%
41%
42%
46%
52%
44%
50%
55%
55%
51%
56%
52%
49%
53%
54%
53%
53%
51%
51%
51%
51%
51%
48%
47%
47%
51%
48%
22%
19%
21%
16%
14%
14%
14%
11%
13%
14%
13%
11%
12%
12%
12%
11%
11%
9%
8%
9%
9%
7%
10%
5%
8%
4%
3%
4%
2%
4%
2%
3%
3%
44%
36%
39%
11%
10%
6%
6%
3%
3%
2%
3%
3%
1%
2%
2%
1%
2%
4%
Adequate staff to meet needs
Quality of dining experience
Quality of meals
Responsiveness of management
Attention to resident grooming
Choices/preferences
Meaningfulness of activities
Competency of staff
Quality of laundry services
Security of personal belongings
CNA/NA care
Resident-to-resident friendships
Resident-to-staff friendships
Rehabilitation therapy
Respect for privacy
Care (concern) of staff
Religious/spiritual opportunities
Commitment to family updates
RN/LVN/LPN care
Respectfulness of staff
Cleanliness of premises
Safety of facility
Overall satisfaction
Recommendation to others
This CONFIDENTIAL Executive Summary was prepared by My InnerView.

Quadrant A shows items of lower importance to "Recommendation" with a higher average score
Quadrant B shows items of higher importance to "Recommendation" with a higher average score
Quadrant C shows items of lower importance to "Recommendation" with a lower average score
Quadrant D shows items of higher importance to "Recommendation" with a lower average score
MINNESOTA
PRIM
AR
Y OPPO
RTU
NITIES
3QUADRANT ANALYSIS: STRENGTHS AND OPPORTUNITIESRESIDENT SATISFACTION
See actual satisfaction items and report labels at end of section
SEC
ON
DA
RY
OPP
OR
TUN
ITIE
S
LOW ← IMPORTANCE TO RECOMMEND THIS FACILITY TO OTHERS → HIGH
S
ECO
ND
AR
Y ST
REN
GTH
S
LO
W
←
Y
OU
R A
VER
AGE
SCO
RE
FOR
EAC
H IT
EM
→
HIG
HPR
IMA
RY STR
ENG
THS
The quadrant analysis plots the percentile rank of the average score on the satisfaction items against the percentile rank of the average "importance" score of each item and the question What is your recommendation of this facility to others? Items in the lower right quadrant are those that are most important to "Recommendation" but received the lowest scores.
1
2
34
5
6
7
8
9
10
11
12
13
14
15
16
17
18
19
2021
22
This CONFIDENTIAL Executive Summary was prepared by My InnerView.

4 Resident-to-resident friendships 14 Competency of staff5 Resident-to-staff friendships 15 Care (concern) of staff
13 Commitment to family updates 8 RN/LVN/LPN care10 Rehabilitation therapy 2 Respectfulness of staff7 Religious/spiritual opportunities 17 Safety of facility
19 Cleanliness of premises
18 Security of personal belongings20 Quality of meals6 Meaningfulness of activities3 Respect for privacy
22 Quality of laundry services
16
21
11
1129
Items with average scores below the midline but not as important to "Recommendation"
PRIMARY OPPORTUNITIESItems with average scores below the midline and more important to "Recommendation"
These are areas that represent a good opportunity for improvement.
Quality of dining experience
Responsiveness of management
CNA/NA care
Attention to resident grooming
Choices/preferences
Adequate staff to meet needs
MINNESOTA
3RESIDENT SATISFACTIONQUADRANT ANALYSIS: STRENGTHS AND OPPORTUNITIES
SECONDARY STRENGTHSItems with average scores above the midlinebut not as important to "Recommendation"
CONTINUED
If Quadrant D has less than five items, the Priority Action Agenda will list only those items in the quadrant.
PRIORITY ACTION AGENDA ™The top FIVE items in Quadrant D (Primary Opportunities) comprise your Priority Action Agenda and provide a focus for improving willingness to recommend your facility to others.
SECONDARY OPPORTUNITIES
PRIMARY STRENGTHSItems with average scores above the midline and more important to "Recommendation"
This CONFIDENTIAL Executive Summary was prepared by My InnerView.

2008 EXCELLENT GOOD FAIR POOR2009 EXCELLENT GOOD FAIR POOR2010 EXCELLENT GOOD FAIR POOR
ITEMS RANKED BY PERCENT ''EXCELLENT'' FOR 2008, 2009 AND 2010 4
MINNESOTA
RESIDENT SATISFACTION
Items are ranked from highest to lowest on the percent of responses rated "Excellent" for the most recent year. (May not total 100% due to rounding.)
32%
30%
33%
32%
33%
31%
36%
34%
36%
35%
37%
38%
40%
38%
41%
39%
42%
40%
44%
44%
36%
33%
39%
35%
53%
55%
53%
53%
51%
52%
51%
52%
51%
50%
51%
48%
51%
51%
48%
49%
47%
50%
47%
48%
51%
54%
48%
51%
12%12%13%
12%12%
12%
12%10%
14%
11%10%12%
11%8%
12%
9%10%11%
8%8%
10%
9%8%
10%
9%8%9%
7%7%7%
11%10%11%
10%10%10%
2%3%
2%
4%
2%2%
2%
1%1%
2%
2%
2%1%
2%2%
4%
36%
37%
34%
38%
40%
40%
43%
42%
42%
45%
36%
38%
49%
49%
53%
49%
49%
48%
48%
48%
48%
46%
52%
49%
3%
3%
3%
3%3%
2%
3%
2%
3%3%
3%
1%
2%
2%
2%2%
1%
2%
4%4%
0% 10% 20% 30% 40% 50% 60% 70% 80% 90% 100%
Resident-to-staff friendships
Rehabilitation therapy
Respect for privacy
Care (concern) of staff
Religious/spiritual opportunities
Commitment to family updates
RN/LVN/LPN care
Respectfulness of staff
Cleanliness of premises
Safety of facility
Overall satisfaction
Recommendation to others
This CONFIDENTIAL Executive Summary was prepared by My InnerView.

2008 EXCELLENT GOOD FAIR POOR2009 EXCELLENT GOOD FAIR POOR2010 EXCELLENT GOOD FAIR POOR
4ITEMS RANKED BY PERCENT ''EXCELLENT'' FOR 2008, 2009 AND 2010RESIDENT SATISFACTION
CONTINUED
MINNESOTA
Items are ranked from highest to lowest on the percent of responses rated "Excellent" for the most recent year. (May not total 100% due to rounding.)
22%
19%
24%
19%
27%
22%
27%
25%
28%
26%
29%
25%
31%
30%
31%
30%
31%
30%
31%
28%
31%
30%
32%
46%
47%
52%
54%
44%
46%
50%
51%
55%
57%
55%
56%
51%
51%
56%
56%
52%
54%
49%
49%
53%
53%
54%
53%
22%22%
24%
19%21%21%
21%22%
24%
16%16%
19%
14%12%
14%
14%14%
15%
14%14%
16%
11%12%12%
13%13%12%
14%13%
16%
13%13%
15%
11%13%
14%
10%10%
6%
8%
6%5%
3%
3%
3%3%
2%
4%
6%6%
2%2%
2%2%
23%
22%
25%
29%
29%
29%
34%
32%
31%
32%
34%
34%30%
46%
51%
46%
50%
56%
55%
49%
54%
53%
50%
51%
51%
10%
5%
5%
8%8%
6%
4%
3%
3%3%
4%
2%
2%
4%3%
6%
2%
3%
0% 10% 20% 30% 40% 50% 60% 70% 80% 90% 100%
Adequate staff to meet needs
Quality of dining experience
Quality of meals
Responsiveness of management
Attention to resident grooming
Choices/preferences
Meaningfulness of activities
Competency of staff
Quality of laundry services
Security of personal belongings
CNA/NA care
Resident-to-resident friendships
This CONFIDENTIAL Executive Summary was prepared by My InnerView.

20102009 2008 MIV
73 73 76
74 73 76
QUALITY OF LIFE 79 78 80
77 75 78
76 73 74
73 71 75
72 70 75
73 70 74
70 68 72
71 69 73
69 66 70
63 63 66
78 75 78
74 73 76
75 73 77
72 71 75
74 71 75
73 70 74
70 68 73
61 58 65
77 76 77
71 70 70
67 65 71
62 60 62QU
ALI
TY O
F SE
RVI
CE
MINNESOTA
5ITEMS RANKED WITHIN DOMAIN BY AVERAGE SCORES FOR 2010RESIDENT SATISFACTION
QU
ALI
TY O
F
LI
FEQ
UA
LITY
OF
C
AR
E
74
74
Recommendation toothers
Overall satisfaction
63
66
70
77
60
69
71
72
72
74
74
76
65
69
70
70
72
72
72
73
76
78
Quality of meals
Responsiveness of management
Quality of laundry services
Cleanliness of premises
Adequate staff to meet needs
Attention to resident grooming
CNA/NA care
Rehabilitation therapy
Competency of staff
Care (concern) of staff
Commitment to family updates
RN/LVN/LPN care
Quality of dining experience
Security of personal belongings
Meaningfulness of activities
Choices/preferences
Respect for privacy
Resident-to-resident friendships
Resident-to-staff friendships
Religious/spiritual opportunities
Respectfulness of staff
Safety of facility
This CONFIDENTIAL Executive Summary was prepared by My InnerView.

Minnesota Rural Suburban Urban
Overall satisfaction 74 75 72 70
Recommendation to others 74 76 73 68
Safety of facility 78 79 79 74
Respectfulness of staff 76 78 75 72
Religious/spiritual opportunities 73 76 71 68
Respect for privacy 72 73 71 69
Resident-to-resident friendships 72 73 72 70
Resident-to-staff friendships 72 72 72 69
Choices/preferences 70 71 69 66
Meaningfulness of activities 70 71 69 65
Security of personal belongings 69 70 66 66
Quality of dining experience 65 67 64 61
RN/LVN/LPN care 76 77 75 74
Commitment to family updates 74 75 73 70
Care (concern) of staff 74 75 72 71
Rehabilitation therapy 72 73 73 69
Competency of staff 72 73 71 70
CNA/NA care 71 73 69 69
Attention to resident grooming 69 70 68 66
Adequate staff to meet needs 60 60 60 59
Cleanliness of premises 77 78 75 75
Quality of laundry services 70 72 67 67
Responsiveness of management 66 68 66 62
Quality of meals 63 65 63 57
MINNESOTA
All scores represent average scores across survey respondents. Each item was measured on a four-point scale:Poor = 0 Fair = 33.3 Good = 66.7 Excellent = 100
QU
ALI
TY O
F
LI
FEQ
UA
LITY
OF
C
AR
EQ
UA
LITY
OF
SER
VIC
E
Items are listed by domain as they appear in the survey. The shading in the Rural, Suburban and Urban columns reflects a comparison to the state average: Green = higher than the state average; yellow = same as the state average; red = lower than the state average.
6AVERAGE SCORES BY ITEM BY LOCATION TYPE FOR 2010RESIDENT SATISFACTION
This CONFIDENTIAL Executive Summary was prepared by My InnerView.
Female 67% 19 or under 0%Male 33% 20 to 29 0%
30 to 39 1%40 to 49 2%50 to 59 5%60 to 69 10%70 to 79 17%80 to 89 39%
90 or older 26%
None 50% Convenient location 38% Less than 1 month 4%Only this one 21% Good reputation 18% 1 to 3 months 10%
Two 18% Doctor or hospital 16% 3 to 6 months 8%Three 7% Relative or friend 12% 6 months to 1 year 17%Four 2% Insurance requirement 2% 1 to 3 years 34%
Five or more 2% Other reason 15% 3 or more years 27%
Spouse 14% Less than once a year 1%Child 50% Once a year 1%
Brother or sister 12% Once every 3 months 5%Grandchild 3% Once a month or more 19%
Friend 12% Once a week or more 49%Another person 10% Almost daily 25%
By myself 22%With facility staff 39%
With family or friend 20%With another resident 1%With another person 19%
(May not total 100% due to rounding.)
VISITORPerson visiting most How often visited
MINNESOTA
Assistance with survey
74%
7
Gender of resident
FACILITY CHOICEHomes visited Reason for choosing
RESIDENT SATISFACTIONDEMOGRAPHICS AND BACKGROUND INFORMATION FOR 2010
61%
Age of residentRESIDENT
Length of stay
46%
This CONFIDENTIAL Executive Summary was prepared by My InnerView.

8
MINNESOTA
RESIDENT SATISFACTIONAVERAGE SCORES FOR ''RECOMMENDATION TO OTHERS'' BY DEMOGRAPHICS FOR 2010
7375
737374
72
7574
717475
55
6658
7770
8472
6873
76
3 years or more
1 to 3 years
6 months to 1 year
3 to 6 months
1 to 3 months
Less than 1 month
Almost daily
Once a week or more
Once a month or more
Once every 3 months
Once a year
Less than once a year
Other reason
Insurance requirement
Relative or friend
Doctor or hospital
Good reputation
Convenient location
Urban
Suburban
Rural
REASON FOR CHOOSING
HOW OFTEN VISITED
LENGTH OF STAY
LOCATION TYPE
This CONFIDENTIAL Executive Summary was prepared by My InnerView.

Response rate Number of facilities
96-100%
91-95%
86-90%
81-85%
76-80%
71-75%
66-70%
61-65%
56-60%
51-55%
46-50%
41-45%
36-40%
31-35%
26-30%
21-25%
16-20%
11-15%
6-10%
0-5%
SUMMARY
MINNESOTA
Lowest response rate
0%
Highest response rate100%
Overall state response rate62%
Results are for 146 participating facilities.
RESIDENT SATISFACTIONDISTRIBUTION OF RESPONSE RATES FOR 2010 9
11
0
3
3
5
7
11
10
10
12
3
3
10
6
3
8
5
4
9
23
This CONFIDENTIAL Executive Summary was prepared by My InnerView.

ITEM NUMBER/LABEL ORIGINAL SURVEY STATEMENT
23 Overall satisfaction How would you rate your overall satisfaction with this facility?24 Recommendation to others What is your recommendation of this facility to others?
Rate this facility on ...1 Choices/preferences Meeting your choices and preferences2 Respectfulness of staff The respect shown to you by staff3 Respect for privacy Meeting your need for privacy4 Resident-to-resident friendships Offering you opportunities for friendships with other residents5 Resident-to-staff friendships Offering you opportunities for friendships with staff6 Meaningfulness of activities Offering you meaningful activities7 Religious/spiritual opportunities Meeting your religious and spiritual needs
17 Safety of facility How safe it is for you18 Security of personal belongings The security of your personal belongings21 Quality of dining experience How enjoyable your dining experience is
Rate this facility on ...8 RN/LVN/LPN care The quality of care provided by the nurses (RNs/LVNs/LPNs)9 CNA/NA care The quality of care provided by the nursing assistants (CNAs/NAs)
10 Rehabilitation therapy The quality of rehabilitation therapy (occupational, physical, speech)11 Adequate staff to meet needs Providing an adequate number of nursing staff to meet care needs12 Attention to resident grooming Meeting your grooming needs13 Commitment to family updates Keeping you and your family informed about you14 Competency of staff The competency of staff15 Care (concern) of staff The staff's care and concern for you
Rate this facility on ...16 Responsiveness of management Management's responsiveness to your suggestions and concerns19 Cleanliness of premises The cleanliness of your room and surroundings20 Quality of meals The quality of the meals22 Quality of laundry services The quality of laundry services
25 Length of stay How long have you lived at this facility?26 Person visiting most Who visits you most often?27 How often visited How often does this person visit the you?28 Homes visited How many nursing homes did you (or your family) visit
before choosing this facility?29 Reason for choosing What is the most important reason you (or your family)
chose this facility?30 Gender of resident What is your gender?31 Age of resident What is your age?32 Assistance with survey How is this survey being completed?
RESIDENT SATISFACTION
GLOBAL SATISFACTION DOMAIN
© 1/7/09, My InnerView • Reproduction or duplication requires written permission from My InnerView (715) 848-2713
QUALITY OF SERVICE DOMAIN
DEMOGRAPHICS AND BACKGROUND INFORMATION
QUALITY OF LIFE DOMAIN
QUALITY OF CARE DOMAIN
SKILLED NURSING RESIDENT SATISFACTION SURVEY REFERENCE
This CONFIDENTIAL Executive Summary was prepared by My InnerView.

2010 2009 200849% 45% 45%
187 158 195
5,164 4,661 5,514
MINNESOTA
SURVEYS RECEIVED
FACILITIES SURVEYED
FAMILY
RESPONSE RATE
SATISFACTION
This CONFIDENTIAL Executive Summary was prepared by My InnerView.

90% 89%
Averagescore
76
74
75
73
74
73
71
68
(May not total 100% due to rounding.)
FOR GLOBAL SATISFACTION ITEMS
EXCELLENT
Overall satisfaction
FAIR
(The total percentage listed may be higher or lower than individual rating totals due to rounding.)
Recommendation to others87% 87%
MN MIV MN MIV
1GLOBAL SATISFACTION AND RATINGS BY DOMAIN FOR 2010FAMILY SATISFACTION
PERCENT "EXCELLENT" AND "GOOD"
MINNESOTA
POORGOOD
32%
33%
39%
41%
37%
39%
39%
41%
46%
49%
43%
45%
48%
48%
48%
48%
17%
14%
14%
12%
13%
11%
11%
8%
3%
3%
2%
2%
5%
4%
3%
3%
My InnerView
Minnesota
My InnerView
Minnesota
My InnerView
Minnesota
My InnerView
Minnesota
GLOBAL SATISFACTION
QUALITY OF LIFE
QUALITY OF CARE
QUALITY OF SERVICE
40% 38%
50% 49%
43% 41%
46% 46%
This CONFIDENTIAL Executive Summary was prepared by My InnerView.

EXCELLENT GOOD FAIR POOR
MINNESOTA
Items are ranked from highest to lowest on the percent of responses rated "Excellent." The percentages reflect averages across survey respondents. (May not total 100% due to rounding.) See chart 4 for comparison to prior years.
2ITEMS RANKED BY PERCENT ''EXCELLENT'' FOR 2010FAMILY SATISFACTION
24%
24%
27%
28%
29%
30%
35%
36%
37%
38%
39%
39%
42%
42%
43%
43%
44%
45%
48%
50%
52%
46%
53%
49%
48%
52%
50%
55%
46%
48%
46%
46%
50%
49%
48%
45%
47%
48%
45%
43%
42%
36%
41%
50%
46%
22%
19%
19%
19%
15%
16%
9%
13%
12%
12%
13%
10%
8%
9%
11%
8%
7%
8%
8%
6%
9%
5%
7%
3%
5%
4%
3%
1%
4%
3%
2%
1%
1%
54%
40%
43%
8%
8%
4%
3%
2%
2%
2%
1%
1%
1%
1%
3%
1%
2%
3%
Adequate staff to meet needs
Quality of dining experience
Security of personal belongings
Attention to resident grooming
Quality of laundry services
Quality of meals
Choices/preferences
Responsiveness of management
Rehabilitation therapy
Cleanliness of premises
Meaningfulness of activities
Resident-to-resident friendships
Competency of staff
Respect for privacy
CNA/NA care
Religious/spiritual opportunities
Safety of facility
Resident-to-staff friendships
Care (concern) of staff
RN/LVN/LPN care
Commitment to family updates
Respectfulness of staff
Overall satisfaction
Recommendation to others
This CONFIDENTIAL Executive Summary was prepared by My InnerView.
Quadrant A shows items of lower importance to "Recommendation" with a higher average score
Quadrant B shows items of higher importance to "Recommendation" with a higher average score
Quadrant C shows items of lower importance to "Recommendation" with a lower average score
Quadrant D shows items of higher importance to "Recommendation" with a lower average score
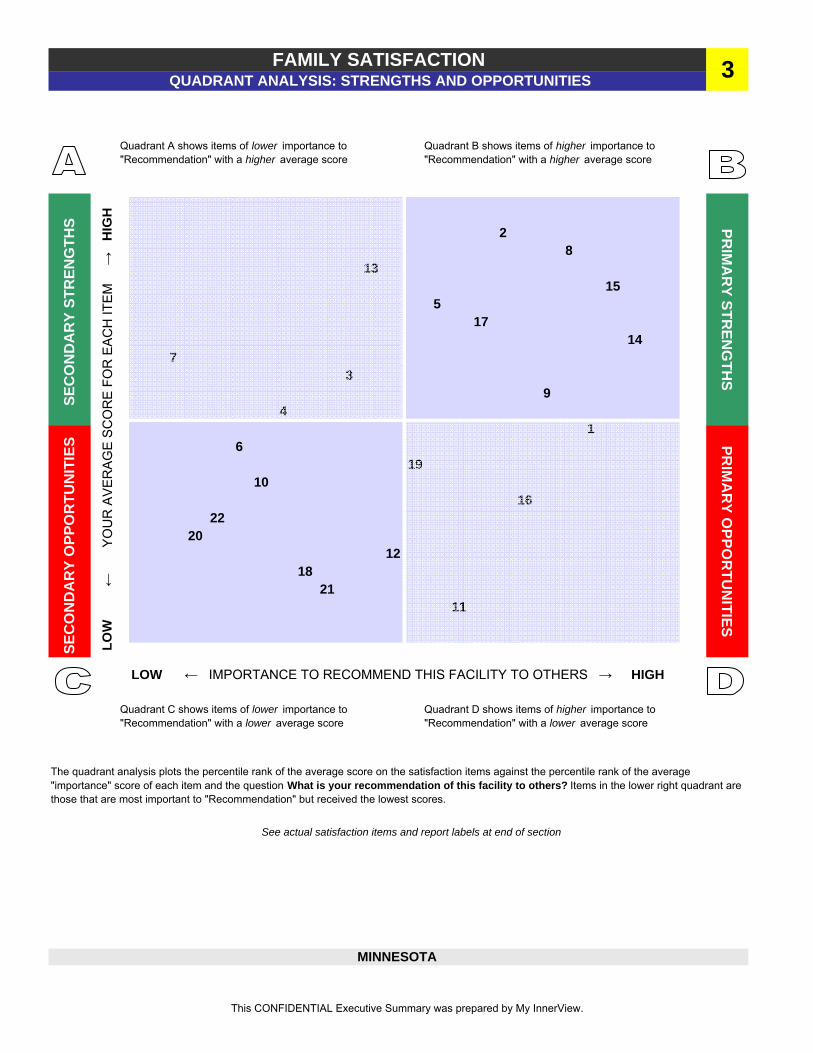
3QUADRANT ANALYSIS: STRENGTHS AND OPPORTUNITIESFAMILY SATISFACTION
See actual satisfaction items and report labels at end of section
SEC
ON
DA
RY
OPP
OR
TUN
ITIE
S
LOW ← IMPORTANCE TO RECOMMEND THIS FACILITY TO OTHERS → HIGH
S
ECO
ND
AR
Y ST
REN
GTH
S
LO
W
←
YO
UR
AVE
RAG
E SC
OR
E FO
R E
ACH
ITEM
→
H
IGH
PRIM
AR
Y STREN
GTH
S
The quadrant analysis plots the percentile rank of the average score on the satisfaction items against the percentile rank of the average "importance" score of each item and the question What is your recommendation of this facility to others? Items in the lower right quadrant are those that are most important to "Recommendation" but received the lowest scores.
MINNESOTA
PRIM
AR
Y OPPO
RTU
NITIES
1
2
3
4
5
6
7
8
9
10
11
12
13
14
15
16
17
18
19
20
21
22
This CONFIDENTIAL Executive Summary was prepared by My InnerView.

3 Respect for privacy 14 Competency of staff4 Resident-to-resident friendships 9 CNA/NA care
13 Commitment to family updates 15 Care (concern) of staff7 Religious/spiritual opportunities 8 RN/LVN/LPN care
17 Safety of facility5 Resident-to-staff friendships2 Respectfulness of staff
12 Attention to resident grooming21 Quality of dining experience18 Security of personal belongings10 Rehabilitation therapy20 Quality of meals22 Quality of laundry services6 Meaningfulness of activities
11
16
1
19
Items with average scores above the midline but not as important to "Recommendation"
3FAMILY SATISFACTIONQUADRANT ANALYSIS: STRENGTHS AND OPPORTUNITIES
SECONDARY STRENGTHS PRIMARY STRENGTHSItems with average scores above the midline and more important to "Recommendation"
CONTINUED
MINNESOTA
These are areas that represent a good opportunity for improvement.
If Quadrant D has less than five items, the Priority Action Agenda will list only those items in the quadrant.
Items with average scores below the midline and more important to "Recommendation"
Adequate staff to meet needs
Responsiveness of management
Cleanliness of premises
PRIORITY ACTION AGENDA ™The top FIVE items in Quadrant D (Primary Opportunities) comprise your Priority Action Agenda and provide a focus for improving willingness to recommend your facility to others.
Items with average scores below the midline but not as important to "Recommendation"
PRIMARY OPPORTUNITIES
SECONDARY OPPORTUNITIES
Choices/preferences
This CONFIDENTIAL Executive Summary was prepared by My InnerView.

2008 EXCELLENT GOOD FAIR POOR2009 EXCELLENT GOOD FAIR POOR2010 EXCELLENT GOOD FAIR POOR
ITEMS RANKED BY PERCENT ''EXCELLENT'' FOR 2008, 2009 AND 2010 4
MINNESOTA
FAMILY SATISFACTION
Items are ranked from highest to lowest on the percent of responses rated "Excellent" for the most recent year. (May not total 100% due to rounding.)
42%
40%
42%
38%
43%
39%
43%
44%
44%
41%
45%
43%
48%
46%
50%
47%
52%
49%
54%
50%
40%
38%
43%
41%
49%
49%
48%
50%
45%
46%
47%
46%
48%
49%
45%
46%
43%
43%
42%
44%
36%
37%
41%
42%
50%
51%
46%
47%
8%8%
9%
9%8%
10%
11%12%
13%
8%7%8%
7%7%
8%
8%8%
9%
8%8%
9%
6%6%
8%
9%9%
11%
5%5%
7%
8%9%
10%
8%9%
10%
1%1%
1%
2%
1%1%
1%
1%1%
1%
3%
0%1%
1%2%
3%
40%
39%
39%
45%
42%
43%
46%
48%
52%
52%
39%
42%
51%
51%
47%
46%
49%
48%
45%
45%
37%
42%
50%
47%
1%
2%
2%
2%2%
2%
1%
2%
1%1%
1%
1%
1%
1%
3%2%
1%
2%
3%2%
0% 10% 20% 30% 40% 50% 60% 70% 80% 90% 100%
Competency of staff
Respect for privacy
CNA/NA care
Religious/spiritual opportunities
Safety of facility
Resident-to-staff friendships
Care (concern) of staff
RN/LVN/LPN care
Commitment to family updates
Respectfulness of staff
Overall satisfaction
Recommendation to others
This CONFIDENTIAL Executive Summary was prepared by My InnerView.

2008 EXCELLENT GOOD FAIR POOR2009 EXCELLENT GOOD FAIR POOR2010 EXCELLENT GOOD FAIR POOR
4ITEMS RANKED BY PERCENT ''EXCELLENT'' FOR 2008, 2009 AND 2010
MINNESOTA
Items are ranked from highest to lowest on the percent of responses rated "Excellent" for the most recent year. (May not total 100% due to rounding.)
CONTINUED
FAMILY SATISFACTION
24%
21%
24%
22%
27%
25%
28%
27%
29%
27%
30%
29%
35%
33%
36%
34%
37%
36%
38%
37%
39%
39%
39%
46%
45%
53%
52%
49%
49%
48%
47%
52%
51%
50%
51%
55%
56%
46%
46%
48%
48%
46%
46%
46%
46%
50%
50%
22%24%
25%
19%21%
21%
19%20%19%
19%20%
21%
15%15%
17%
16%15%
16%
9%8%
10%
13%14%
15%
12%13%13%
12%13%
15%
13%12%12%
10%10%
10%
7%9%
3%
7%
4%5%
4%
4%
1%1%
3%
3%
2%3%
2%3%
1%2%
22%
23%
25%
26%
28%
30%
35%
35%
34%
38%
39%
39%38%
47%
53%
49%
49%
54%
52%
56%
47%
51%
47%
46%
50%
7%
3%
4%
5%6%
4%
4%
5%
3%3%
1%
4%
5%
3%3%
3%
2%
1%
0% 10% 20% 30% 40% 50% 60% 70% 80% 90% 100%
Adequate staff to meet needs
Quality of dining experience
Security of personal belongings
Attention to resident grooming
Quality of laundry services
Quality of meals
Choices/preferences
Responsiveness of management
Rehabilitation therapy
Cleanliness of premises
Meaningfulness of activities
Resident-to-resident friendships
This CONFIDENTIAL Executive Summary was prepared by My InnerView.
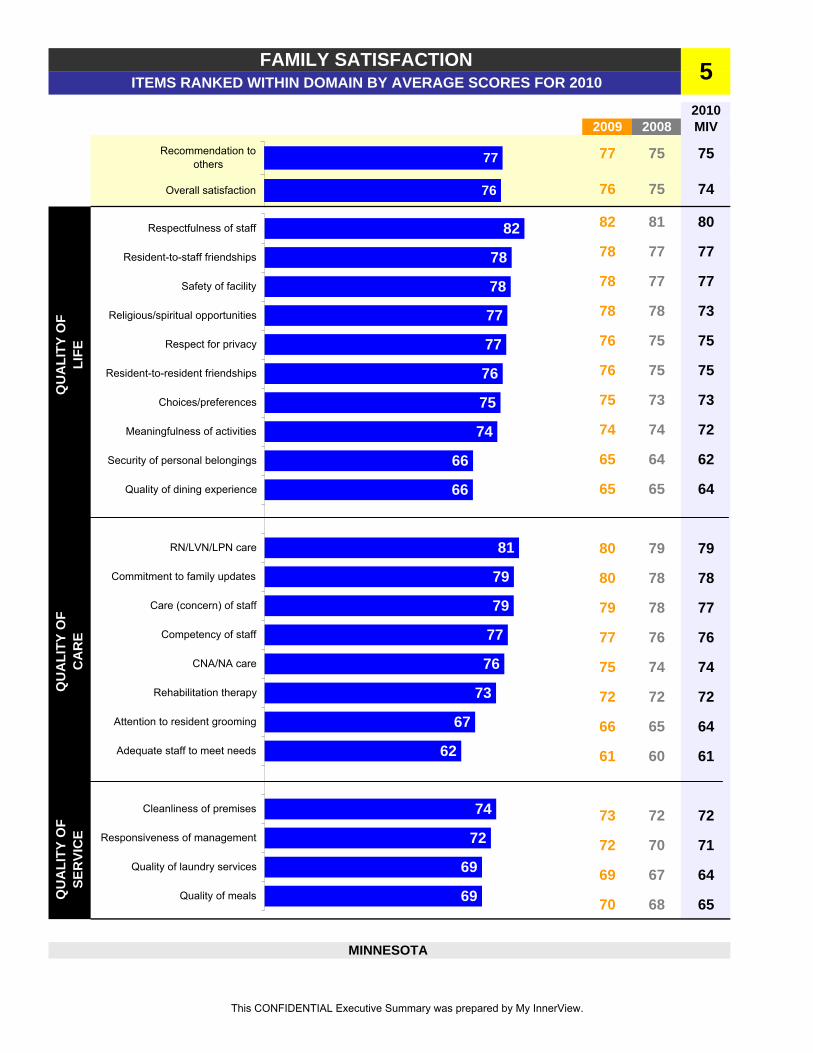
20102009 2008 MIV
77 75 75
76 75 74
QUALITY OF LIFE 82 81 80
78 77 77
78 77 77
78 78 73
76 75 75
76 75 75
75 73 73
74 74 72
65 64 62
65 65 64
80 79 79
80 78 78
79 78 77
77 76 76
75 74 74
72 72 72
66 65 64
61 60 61
73 72 72
72 70 71
69 67 64
70 68 65QU
ALI
TY O
F SE
RVI
CE
MINNESOTA
5ITEMS RANKED WITHIN DOMAIN BY AVERAGE SCORES FOR 2010FAMILY SATISFACTION
QU
ALI
TY O
F
LI
FEQ
UA
LITY
OF
C
AR
E
76
77
Overall satisfaction
Recommendation toothers
69
69
72
74
62
67
73
76
77
79
79
81
66
66
74
75
76
77
77
78
78
82
Quality of meals
Quality of laundry services
Responsiveness of management
Cleanliness of premises
Adequate staff to meet needs
Attention to resident grooming
Rehabilitation therapy
CNA/NA care
Competency of staff
Care (concern) of staff
Commitment to family updates
RN/LVN/LPN care
Quality of dining experience
Security of personal belongings
Meaningfulness of activities
Choices/preferences
Resident-to-resident friendships
Respect for privacy
Religious/spiritual opportunities
Safety of facility
Resident-to-staff friendships
Respectfulness of staff
This CONFIDENTIAL Executive Summary was prepared by My InnerView.

Minnesota Rural Suburban Urban
Recommendation to others 77 78 77 72
Overall satisfaction 76 78 76 72
Respectfulness of staff 82 84 83 79
Resident-to-staff friendships 78 79 78 76
Safety of facility 78 79 78 75
Respect for privacy 77 78 76 72
Religious/spiritual opportunities 77 78 77 74
Resident-to-resident friendships 76 77 74 72
Choices/preferences 75 76 75 71
Meaningfulness of activities 74 75 74 71
Security of personal belongings 66 69 64 61
Quality of dining experience 66 68 66 62
RN/LVN/LPN care 81 81 81 78
Commitment to family updates 79 81 79 74
Care (concern) of staff 79 80 79 76
Competency of staff 77 78 77 74
CNA/NA care 76 77 76 73
Rehabilitation therapy 73 74 74 72
Attention to resident grooming 67 68 67 63
Adequate staff to meet needs 62 63 63 60
Cleanliness of premises 74 76 72 67
Responsiveness of management 72 73 72 68
Quality of meals 69 70 70 64
Quality of laundry services 69 71 67 63
QU
ALI
TY O
F
LI
FEQ
UA
LITY
OF
C
AR
EQ
UA
LITY
OF
SER
VIC
E6AVERAGE SCORES BY ITEM BY LOCATION TYPE FOR 2010
FAMILY SATISFACTION
Items are listed by domain as they appear in the survey. The shading in the Rural, Suburban and Urban columns reflects a comparison to the state average: Green = higher than the state average; yellow = same as the state average; red = lower than the state average.
MINNESOTA
All scores represent average scores across survey respondents. Each item was measured on a four-point scale:Poor = 0 Fair = 33.3 Good = 66.7 Excellent = 100
This CONFIDENTIAL Executive Summary was prepared by My InnerView.
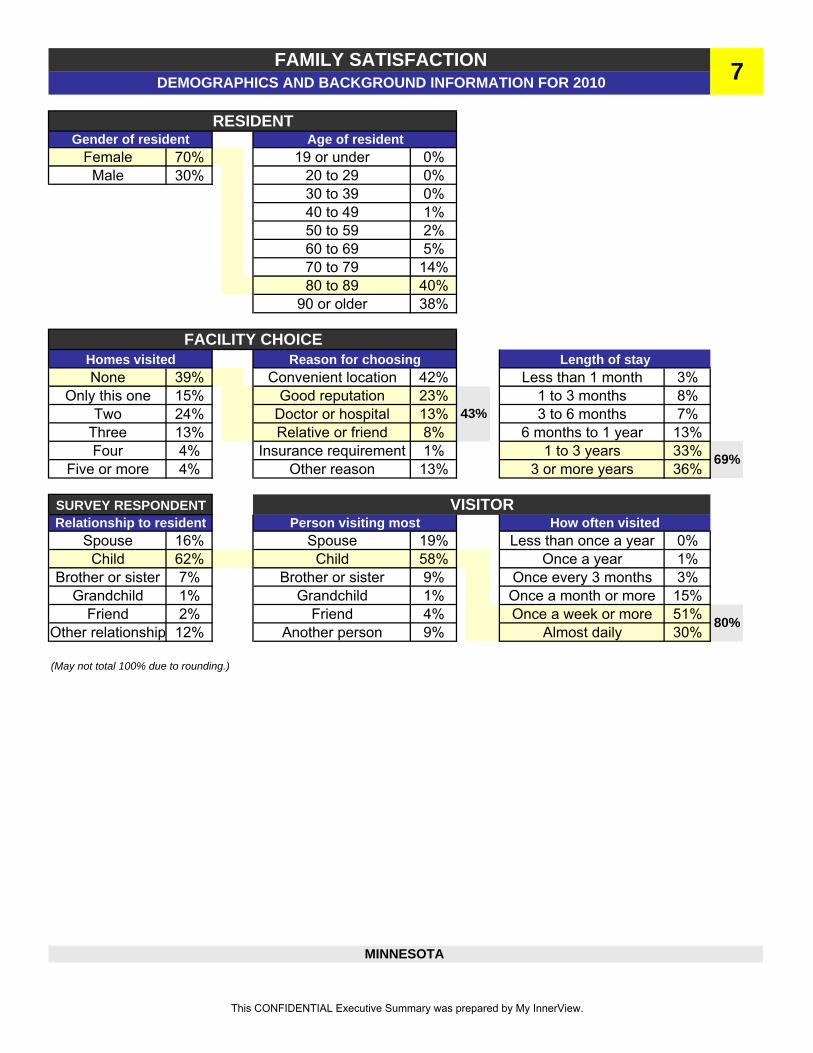
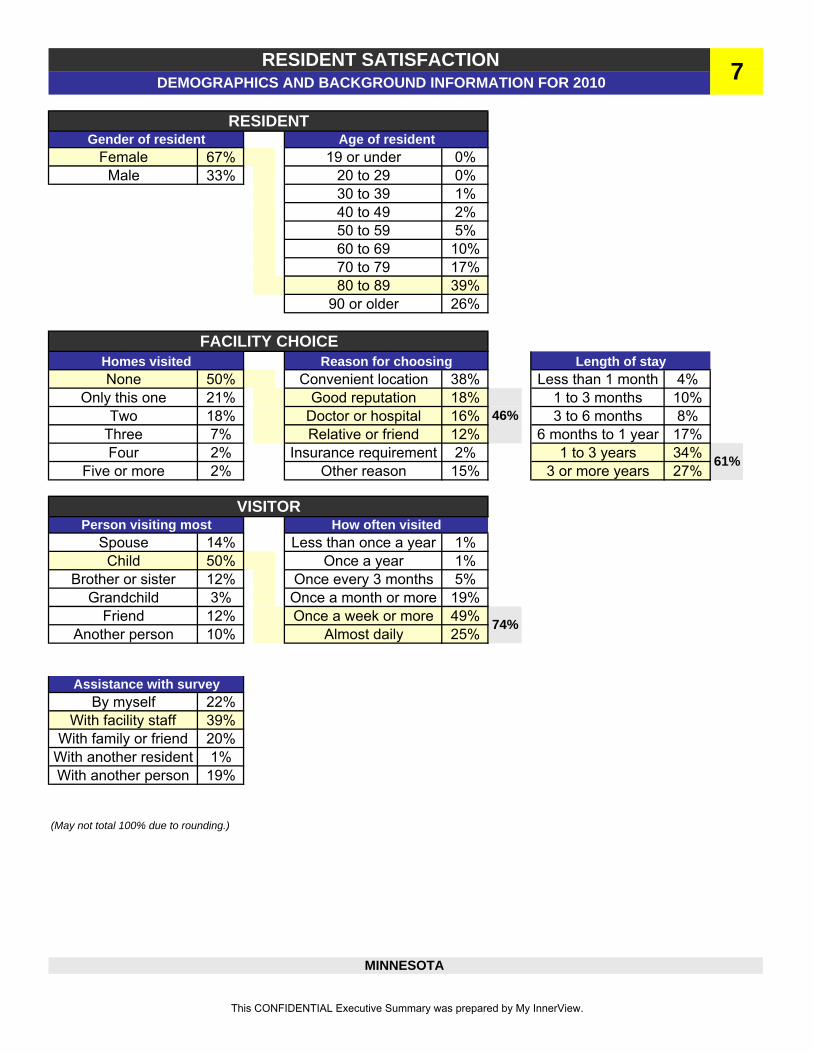
Female 70% 19 or under 0%Male 30% 20 to 29 0%
30 to 39 0%40 to 49 1%50 to 59 2%60 to 69 5%70 to 79 14%80 to 89 40%
90 or older 38%
None 39% Convenient location 42% Less than 1 month 3%Only this one 15% Good reputation 23% 1 to 3 months 8%
Two 24% Doctor or hospital 13% 3 to 6 months 7%Three 13% Relative or friend 8% 6 months to 1 year 13%Four 4% Insurance requirement 1% 1 to 3 years 33%
Five or more 4% Other reason 13% 3 or more years 36%
Spouse 16% Spouse 19% Less than once a year 0%Child 62% Child 58% Once a year 1%
Brother or sister 7% Brother or sister 9% Once every 3 months 3%Grandchild 1% Grandchild 1% Once a month or more 15%
Friend 2% Friend 4% Once a week or more 51%Other relationship 12% Another person 9% Almost daily 30%
(May not total 100% due to rounding.)
Length of stay
MINNESOTA
Person visiting mostVISITOR
How often visitedRelationship to residentSURVEY RESPONDENT
80%
69%
43%
FAMILY SATISFACTIONDEMOGRAPHICS AND BACKGROUND INFORMATION FOR 2010 7
Gender of residentRESIDENT
FACILITY CHOICEHomes visited Reason for choosing
Age of resident
This CONFIDENTIAL Executive Summary was prepared by My InnerView.

8
MINNESOTA
FAMILY SATISFACTIONAVERAGE SCORES FOR ''RECOMMENDATION TO OTHERS'' BY DEMOGRAPHICS FOR 2010
7678787877
7576
7980
8889
6865
8375
8773
727778
763 years or more
1 to 3 years
6 months to 1 year
3 to 6 months
1 to 3 months
Less than 1 month
Almost daily
Once a week or more
Once a month or more
Once every 3 months
Once a year
Less than once a year
Other reason
Insurance requirement
Relative or friend
Doctor or hospital
Good reputation
Convenient location
Urban
Suburban
Rural
REASON FOR CHOOSING
HOW OFTEN VISITED
LENGTH OF STAY
LOCATION TYPE
This CONFIDENTIAL Executive Summary was prepared by My InnerView.

Response rate Number of facilities
96-100%
91-95%
86-90%
81-85%
76-80%
71-75%
66-70%
61-65%
56-60%
51-55%
46-50%
41-45%
36-40%
31-35%
26-30%
21-25%
16-20%
11-15%
6-10%
0-5%
SUMMARY
MINNESOTA
Lowest response rate
14%
Highest response rate100%
Overall state response rate49%
Results are for 187 participating facilities.
FAMILY SATISFACTIONDISTRIBUTION OF RESPONSE RATES FOR 2010 9
9
0
1
1
4
4
11
15
26
32
31
26
12
11
3
0
0
0
0
1
This CONFIDENTIAL Executive Summary was prepared by My InnerView.

ITEM NUMBER/LABEL ORIGINAL SURVEY STATEMENT
23 Overall satisfaction How would you rate your overall satisfaction with this facility?24 Recommendation to others What is your recommendation of this facility to others?
Rate this facility on ...1 Choices/preferences Meeting the resident's/patient's choices and preferences2 Respectfulness of staff The respect shown to the resident/patient by staff3 Respect for privacy Meeting the resident's/patient's need for privacy4 Resident-to-resident friendships Offering the resident/patient opportunities for friendships 5 Resident-to-staff friendships Offering the resident/patient opportunities for friendships with staff6 Meaningfulness of activities Offering the resident/patient meaningful activities7 Religious/spiritual opportunities Meeting the resident's/patient's religious and spiritual needs
17 Safety of facility How safe it is for the resident/patient18 Security of personal belongings The security of the resident's/patient's personal belongings21 Quality of dining experience How enjoyable the dining experience is for the resident/patient
Rate this facility on ...8 RN/LVN/LPN care The quality of care provided by the nurses (RNs/LVNs/LPNs)9 CNA/NA care The quality of care provided by the nursing assistants (CNAs/NAs)
10 Rehabilitation therapy The quality of rehabilitation therapy (occupational, physical, speech)11 Adequate staff to meet needs Providing an adequate number of nursing staff to meet care needs12 Attention to resident grooming Meeting the resident's/patient's need for grooming13 Commitment to family updates Keeping you and your family informed about the resident/patient14 Competency of staff The competency of staff15 Care (concern) of staff The staff's care and concern for the resident/patient
Rate this facility on ...16 Responsiveness of management Management's responsiveness to your suggestions and concerns19 Cleanliness of premises The cleanliness of the room and surroundings20 Quality of meals The quality of the meals22 Quality of laundry services The quality of laundry services
25 Length of stay How long has the resident/patient lived at this facility?26 Person visiting most Who visits the resident/patient most often?27 How often visited How often does this person visit the resident/patient?28 Homes visited How many nursing homes did you (or your family) visit
before choosing this facility?29 Reason for choosing What is the most important reason you (or your family)
chose this facility?30 Gender of resident What is the resident's/patient's gender?31 Age of resident What is the resident's/patient's age?32 Relationship to resident What is your relationship to the resident/patient?
DEMOGRAPHICS AND BACKGROUND INFORMATION
© 1/7/09, My InnerView • Reproduction or duplication requires written permission from My InnerView (715) 848-2713
GLOBAL SATISFACTION DOMAIN
FAMILY SATISFACTIONSKILLED NURSING FAMILY SATISFACTION SURVEY REFERENCE
QUALITY OF LIFE DOMAIN
QUALITY OF CARE DOMAIN
QUALITY OF SERVICE DOMAIN
This CONFIDENTIAL Executive Summary was prepared by My InnerView.

2010 2009 200857% 53% 44%
112 115 136
7,928 7,718 8,242
MINNESOTA
SURVEYS RECEIVED
FACILITIES SURVEYED
EMPLOYEE
RESPONSE RATE
SATISFACTION
This CONFIDENTIAL Executive Summary was prepared by My InnerView.

67% 67% 67% 69% 75% 76%
MN MIV MN MIV MN MIV
POOR
62
63
56
59
58
59
60
61
50
51 (May not total 100% due to rounding.)
Average
for job
(The total percentage listed may be higher or lower than individual rating totals due to rounding.)
satisfaction
EMPLOYEE SATISFACTION 1
PERCENT "EXCELLENT" AND "GOOD"FOR GLOBAL SATISFACTION ITEMS
MINNESOTA
GLOBAL SATISFACTION AND RATINGS BY DOMAIN FOR 2010
EXCELLENT GOOD
Overall
FAIR
Recommendationfor care
Recommendation
score
18%
15%
30%
28%
23%
20%
21%
15%
26%
21%
35%
37%
36%
38%
42%
46%
45%
48%
45%
49%
29%
30%
22%
23%
23%
24%
25%
28%
23%
24%
18%
11%
11%
9%
7%
6%
18%
12%
12%
9%
My InnerView
Minnesota
My InnerView
Minnesota
My InnerView
Minnesota
My InnerView
Minnesota
My InnerView
Minnesota
GLOBAL SATISFACTION
TRAINING
WORK ENVIRONMENT
SUPERVISION
16% 21%
51% 46%
20% 25%
47% 44%
MANAGEMENT
27% 31%
48% 44%
This CONFIDENTIAL Executive Summary was prepared by My InnerView.

EXCELLENT GOOD FAIR POOR
MINNESOTA
Items are ranked from highest to lowest on the percent of responses rated "Excellent." The percentages reflect averages across facilities. (May not total 100% due to rounding.) See chart 4 for comparison to prior years.
2ITEMS RANKED BY PERCENT ''EXCELLENT'' FOR 2010EMPLOYEE SATISFACTION
7%
9%
9%
9%
12%
14%
16%
16%
19%
19%
20%
21%
24%
25%
26%
31%
31%
37%
16%
20%
27%
30%
34%
40%
36%
44%
36%
38%
53%
49%
52%
45%
56%
57%
42%
34%
38%
55%
49%
51%
47%
48%
37%
35%
35%
37%
33%
31%
30%
25%
24%
20%
26%
19%
16%
24%
24%
21%
12%
12%
26%
25%
20%
25%
22%
16%
11%
19%
16%
6%
9%
9%
3%
3%
18%
9%
9%
15%
10%
2%
2%
7%
7%
5%
Comparison of pay
Assistance with job stress
Staff-to-staff communication
Quality of family-related training
Quality of resident-related training
Attentiveness of management
Care (concern) of management
Quality of orientation
Adequacy of equipment/supplies
Fairness of evaluations
Quality of teamwork
Quality of in-service education
Safety of workplace
Communication by supervisor
Appreciation of supervisor
Care (concern) of supervisor
Respectfulness of staff
Sense of accomplishment
Overall satisfaction
Recommendation for job
Recommendation for care
This CONFIDENTIAL Executive Summary was prepared by My InnerView.

Quadrant A shows items of lower importance to "Recommendation" with a higher average score
Quadrant B shows items of higher importance to "Recommendation" with a higher average score
Quadrant C shows items of lower importance to "Recommendation" with a lower average score
Quadrant D shows items of higher importance to "Recommendation" with a lower average score
3QUADRANT ANALYSIS: STRENGTHS AND OPPORTUNITIESEMPLOYEE SATISFACTION
See actual satisfaction items and report labels at end of section
SEC
ON
DA
RY
OPP
OR
TUN
ITIE
S
LOW ← IMPORTANCE TO RECOMMEND FOR JOB → HIGH
S
ECO
ND
AR
Y ST
REN
GTH
S
LO
W
←
Y
OU
R A
VER
AGE
SCO
RE
FOR
EAC
H IT
EM
→
HIG
HPR
IMA
RY STR
ENG
THS
The quadrant analysis plots the percentile rank of the average score on the satisfaction items against the percentile rank of the average "importance" score of each item and the question What is your recommendation of this facility as a place to work? Items in the lower right quadrant are those that are most important to "Recommendation" but received the lowest scores.
MINNESOTA
PRIM
AR
Y OPPO
RTU
NITIES
1
2
3
4
5
6
7
8
910
11
12
13
14
15
16
17
18
This CONFIDENTIAL Executive Summary was prepared by My InnerView.
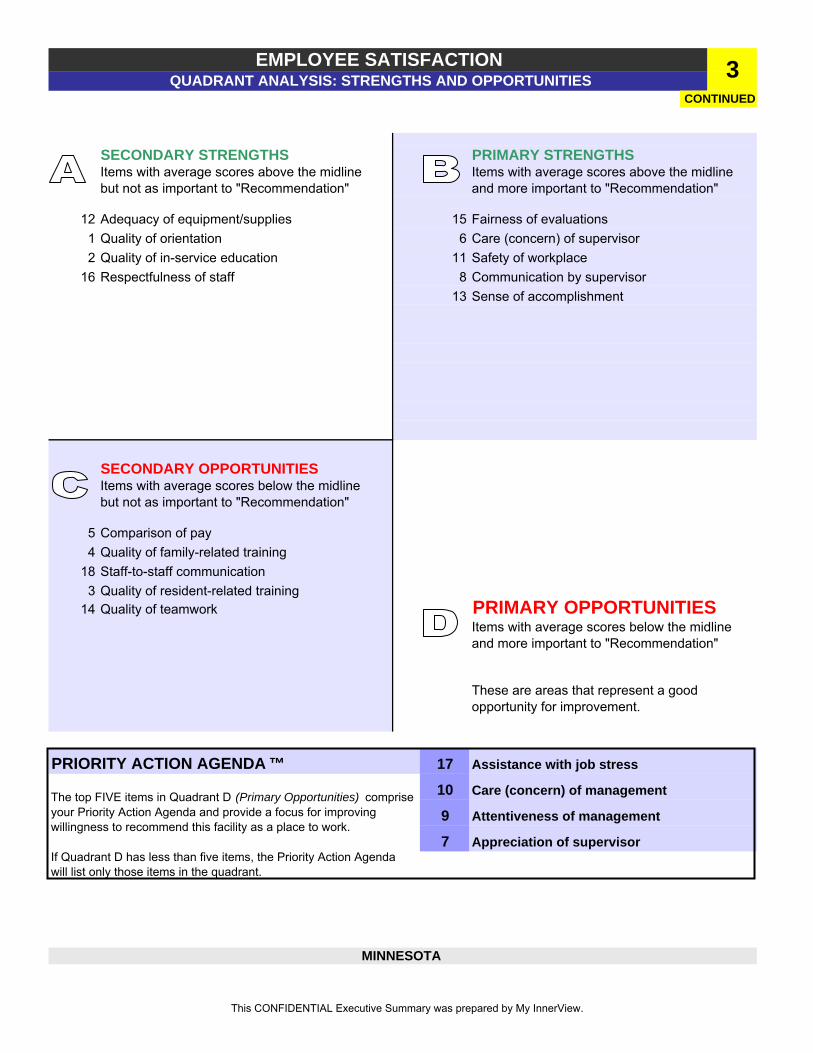
12 Adequacy of equipment/supplies 15 Fairness of evaluations1 Quality of orientation 6 Care (concern) of supervisor2 Quality of in-service education 11 Safety of workplace
16 Respectfulness of staff 8 Communication by supervisor13 Sense of accomplishment
5 Comparison of pay4 Quality of family-related training
18 Staff-to-staff communication3 Quality of resident-related training
14 Quality of teamwork
17
10
9
7
Care (concern) of management
Attentiveness of management
Appreciation of supervisor
Items with average scores above the midline but not as important to "Recommendation"
Items with average scores below the midline but not as important to "Recommendation"
PRIMARY OPPORTUNITIESItems with average scores below the midline and more important to "Recommendation"
If Quadrant D has less than five items, the Priority Action Agenda will list only those items in the quadrant.
The top FIVE items in Quadrant D (Primary Opportunities) comprise your Priority Action Agenda and provide a focus for improving willingness to recommend this facility as a place to work.
These are areas that represent a good opportunity for improvement.
SECONDARY OPPORTUNITIES
3EMPLOYEE SATISFACTIONQUADRANT ANALYSIS: STRENGTHS AND OPPORTUNITIES
SECONDARY STRENGTHS PRIMARY STRENGTHS
PRIORITY ACTION AGENDA ™
CONTINUED
Assistance with job stress
Items with average scores above the midline and more important to "Recommendation"
MINNESOTA
This CONFIDENTIAL Executive Summary was prepared by My InnerView.

2008 EXCELLENT GOOD FAIR POOR2009 EXCELLENT GOOD FAIR POOR2010 EXCELLENT GOOD FAIR POOR
ITEMS RANKED BY PERCENT ''EXCELLENT'' FOR 2008, 2009 AND 2010 4
MINNESOTA
EMPLOYEE SATISFACTION
Items are ranked from highest to lowest on the percent of responses rated "Excellent" for the most recent year. (May not total 100% due to rounding.)
20%
21%
21%
22%
24%
24%
25%
25%
26%
28%
31%
32%
31%
30%
37%
39%
16%
15%
20%
19%
27%
27%
45%
44%
56%
55%
57%
58%
42%
42%
34%
34%
38%
38%
55%
54%
49%
48%
51%
52%
47%
49%
48%
50%
26%25%26%
19%19%
19%
16%15%
16%
24%22%
23%
24%23%23%
21%20%20%
12%12%
14%
12%10%11%
26%25%
26%
25%24%
25%
20%18%19%
9%9%
3%
3%
9%10%
15%
2%2%
1%
6%
5%7%
4%5%
21%
23%
25%
26%
29%
33%
31%
40%
18%
21%
28%
45%
55%
57%
43%
34%
38%
55%
49%
53%
49%
50%
9%
3%
4%
3%2%
9%
15%
14%
10%9%
9%
2%
2%
2%
7%5%
7%
5%
0% 10% 20% 30% 40% 50% 60% 70% 80% 90% 100%
Quality of teamwork
Quality of in-service education
Safety of workplace
Communication by supervisor
Appreciation of supervisor
Care (concern) of supervisor
Respectfulness of staff
Sense of accomplishment
Overall satisfaction
Recommendation for job
Recommendation for care
This CONFIDENTIAL Executive Summary was prepared by My InnerView.

2008 EXCELLENT GOOD FAIR POOR2009 EXCELLENT GOOD FAIR POOR2010 EXCELLENT GOOD FAIR POOR
4ITEMS RANKED BY PERCENT ''EXCELLENT'' FOR 2008, 2009 AND 2010EMPLOYEE SATISFACTION
CONTINUED
MINNESOTA
Items are ranked from highest to lowest on the percent of responses rated "Excellent" for the most recent year. (May not total 100% due to rounding.)
7%
8%
9%
8%
9%
8%
9%
8%
12%
11%
14%
14%
16%
16%
16%
16%
19%
19%
19%
19%
30%
30%
34%
34%
40%
38%
36%
34%
44%
43%
36%
36%
38%
39%
53%
52%
49%
48%
52%
52%
37%36%
37%
35%33%
35%
35%34%
35%
37%36%
37%
33%31%
33%
31%30%
31%
30%29%
30%
25%24%
26%
24%24%
25%
20%20%
20%
22%25%
21%
18%
18%20%
12%
20%
14%16%
5%
8%
8%9%
8%
10%
9%
9%
13%
15%
17%
18%
19%
20%
34%
36%
40%
37%
44%
39%
40%
53%
49%
52%
25%
22%
23%
16%17%
18%
11%
13%
19%17%
16%
6%
6%
9%8%
9%
0% 10% 20% 30% 40% 50% 60% 70% 80% 90% 100%
Comparison of pay
Assistance with job stress
Staff-to-staff communication
Quality of family-related training
Quality of resident-related training
Attentiveness of management
Care (concern) of management
Quality of orientation
Adequacy of equipment/supplies
Fairness of evaluations
This CONFIDENTIAL Executive Summary was prepared by My InnerView.

20102009 2008 MIV
67 66 67
62 60 62
61 59 61
QUALITY OF LIFE 66 65 67
61 59 63
53 51 56
45 43 52
75 75 75
72 71 71
68 67 68
61 60 60
60 59 58
59 59 58
47 46 49
45 42 46
43 40 45
65 64 64
62 61 62
59 58 58
54 51 53
51 48 50
TRA
ININ
G5ITEMS RANKED WITHIN DOMAIN BY AVERAGE SCORES FOR 2010
EMPLOYEE SATISFACTIONW
OR
K E
NVI
RO
NM
ENT
MINNESOTA
SUPE
RVI
SIO
NM
AN
EGE-
MEN
T
59
60
66
Overall satisfaction
Recommendation for job
Recommendation for care
48
51
57
61
63
40
43
47
58
59
60
67
72
74
46
52
60
65
Attentiveness ofmanagement
Care (concern) ofmanagement
Appreciation ofsupervisor
Communication bysupervisor
Care (concern) ofsupervisor
Comparison of pay
Assistance with jobstress
Staff-to-staffcommunication
Quality of teamwork
Adequacy ofequipment/supplies
Fairness of evaluations
Safety of workplace
Respectfulness of staff
Sense ofaccomplishment
Quality of family-relatedtraining
Quality of resident-related training
Quality of orientation
Quality of in-serviceeducation
This CONFIDENTIAL Executive Summary was prepared by My InnerView.

Minnesota Rural Suburban Urban
Recommendation for care 66 64 69 67
Recommendation for job 60 58 63 63
Overall satisfaction 59 57 63 61
Quality of in-service education 65 63 66 68
Quality of orientation 60 58 65 62
Quality of resident-related training 52 50 55 55
Quality of family-related training 46 43 49 50
Sense of accomplishment 74 73 75 75
Respectfulness of staff 72 70 74 73
Safety of workplace 67 67 69 68
Fairness of evaluations 60 59 62 62
Adequacy of equipment/supplies 59 58 59 60
Quality of teamwork 58 56 62 60
Staff-to-staff communication 47 44 51 50
Assistance with job stress 43 41 45 46
Comparison of pay 40 37 46 42
Care (concern) of supervisor 63 62 66 65
Communication by supervisor 61 59 64 64
Appreciation of supervisor 57 55 59 60
Care (concern) of management 51 50 54 52
Attentiveness of management 48 46 52 50
SUPE
R-
VISI
ON
MA
NA
GE-
MEN
T
MINNESOTA
Items are listed by domain as they appear in the survey. The shading in the Rural, Suburban and Urban columns reflects a comparison to the state average: Green = higher than the state average; yellow = same as the state average; red = lower than the state average.
Poor = 0 Fair = 33.3 Good = 66.7 Excellent = 100All scores represent average scores across survey respondents. Each item was measured on a four-point scale:
TRA
ININ
GW
OR
K E
NVI
RO
NM
ENT
6AVERAGE SCORES BY ITEM BY LOCATION TYPE FOR 2010EMPLOYEE SATISFACTION
This CONFIDENTIAL Executive Summary was prepared by My InnerView.

19 and under 5% Female 87% Yes 95%20 to 29 24% Male 13% No 5%30 to 39 18%40 to 49 21%50 to 59 22%
60 or older 10%
CNA 37% Days 64% Less than 10 hours 4%Nurse 20% Evenings 23% 10 to 20 hours 12%
Nursing Administration 3% Nights 6% 20 to 30 hours 18%Food Service 13% Rotating 7% 30 to 40 hours 51%
Social Services 2% More than 40 hours 14%Hskg./Lndry./Maint. 10%
Activities 4%Therapy/Rehabilitation 1%
Business Office 3%Administration 2%Other Position 7%
Less than 1 month 2% Just this one 79%1 to 3 months 5% 2 to 3 20%
3 months to 1 year 12% 4 or more 1%1 to 2 years 15%2 to 5 years 25%
5 to 10 years 16%More than 10 years 25%
(May not total 100% due to rounding.)
7
English as first language
Job category Shift typically worked
EMPLOYEE SATISFACTIONDEMOGRAPHICS AND BACKGROUND INFORMATION FOR 2010
Gender of employeeEMPLOYEE
POSITION
Age of employee
Hours worked in typical week
MINNESOTA
66%
WORK HISTORY
65%
Homes worked in 3 yearsLength of employment
This CONFIDENTIAL Executive Summary was prepared by My InnerView.

8
MINNESOTA
EMPLOYEE SATISFACTIONAVERAGE SCORES FOR ''RECOMMENDATION FOR JOB'' BY DEMOGRAPHICS FOR 2010
665859
6467
59595961
646869
5557
6162
6480
706768
6171
6277
5757
6363
58
More than 40 hours
30 to 40 hours
20 to 30 hours
10 to 20 hours
Less than 10 hours
More than 10 years
5 to 10 years
2 to 5 years
1 to 2 years
3 months to 1 year
1 to 3 months
Less than 1 month
Rotating
Nights
Evenings
Days
Other
Administration
Business Office
Therapy/Rehab
Activities
Hskg/Laund/Maint
Social Services
Food Service
Nursing Administration
Nurse
CNA/NA
Urban
Suburban
Rural
JOB CATEGORY
SHIFT TYPICALLY WORKED
LENGTH OF EMPLOYMENT
LOCATION TYPE
HOURS WORKED IN A TYPICAL WEEK
This CONFIDENTIAL Executive Summary was prepared by My InnerView.

Response rate Number of facilities
96-100%
91-95%
86-90%
81-85%
76-80%
71-75%
66-70%
61-65%
56-60%
51-55%
46-50%
41-45%
36-40%
31-35%
26-30%
21-25%
16-20%
11-15%
6-10%
0-5%
SUMMARY
MINNESOTA
Lowest response rate
4%
Highest response rate100%
Overall state response rate57%
Results are for 112 participating facilities.
EMPLOYEE SATISFACTIONDISTRIBUTION OF RESPONSE RATES FOR 2010 9
1
0
1
1
4
3
6
3
8
9
7
12
8
9
10
8
6
6
3
7
This CONFIDENTIAL Executive Summary was prepared by My InnerView.

ITEM NUMBER/LABEL ORIGINAL SURVEY STATEMENT
19 Overall satisfaction How would you rate your overall satisfaction with this facility?20 Recommendation for job What is your recommendation of this facility as a place to work?21 Recommendation for care What is your recommendation of this facility as a place to receive
care?
Rate this facility on ...5 Comparison of pay The pay as compared to other facilities
11 Safety of workplace The safety of the workplace12 Adequacy of equipment/supplies The adequacy of equipment and supplies to do your job13 Sense of accomplishment How your work allows you to make a difference in people’s lives14 Quality of teamwork How your co-workers work together as a team15 Fairness of evaluations The fairness of your performance evaluations16 Respectfulness of staff The respect shown to the resident by staff17 Assistance with job stress Helping you to deal with job stress and burnout18 Staff-to-staff communication Staff communication between shifts
Rate this facility on ...1 Quality of orientation The quality of new staff orientation2 Quality of in-service education The quality of in-service education3 Quality of resident-related training The quality of training you receive to deal with difficult residents4 Quality of family-related training The quality of training you receive to deal with difficult family members
Rate this facility on ...6 Care (concern) of supervisor How your direct supervisor cares about you as a person7 Appreciation of supervisor How your direct supervisor regularly shows you appreciation for
a job well done8 Communication by supervisor How your direct supervisor regularly gives you important
work-related information
Rate this facility on ...9 Attentiveness of management How well facility management listens to employees
10 Care (concern) of management How facility management cares about employees
22 Age of employee What is your age?23 Gender of employee What is your gender?24 Job category What is your job category?25 Shift typically worked Which shift do you normally work?26 Length of employment How long have you worked at this facility?27 Homes worked in 3 years How many nursing homes have you worked at during the last
three years?28 English as first language Do you speak English as your first language?29 Hours worked in typical week How many hours during a typical week do you normally work
at this facility?
© 4/16/07, My InnerView • Reproduction or duplication requires written permission from My InnerView (715) 848-2713
DEMOGRAPHICS AND BACKGROUND INFORMATION
WORK ENVIRONMENT DOMAIN
SUPERVISION DOMAIN
MANAGEMENT DOMAIN
EMPLOYEE SATISFACTIONSKILLED NURSING EMPLOYEE SATISFACTION SURVEY REFERENCE
TRAINING DOMAIN
GLOBAL SATISFACTION DOMAIN
This CONFIDENTIAL Executive Summary was prepared by My InnerView.

™QUALITY
MINNESOTA
PROFILE
This CONFIDENTIAL Executive Summary was prepared by My InnerView.

1QUALITY PROFILE™RESIDENTS WITHOUT FALLS FOR 2009 AND 2010
MINNESOTA
0.0
10.0
20.0
30.0
40.0
50.0
60.0
70.0
80.0
90.0
100.0
PER
CEN
T O
F R
ESID
ENTS
Minnesota My InnerView
20102009
0.0
10.0
20.0
30.0
40.0
50.0
60.0
70.0
80.0
90.0
100.0
PER
CEN
T O
F R
ESID
ENTS
Rural Suburban Urban
20102009
This CONFIDENTIAL Executive Summary was prepared by My InnerView.

2QUALITY PROFILE™RESIDENTS WITHOUT ANTI-PSYCHOTIC MEDICATION USE FOR 2009 AND 2010
MINNESOTA
0.0
10.0
20.0
30.0
40.0
50.0
60.0
70.0
80.0
90.0
100.0
PER
CEN
T O
F R
ESID
ENTS
Minnesota My InnerView
20102009
0.0
10.0
20.0
30.0
40.0
50.0
60.0
70.0
80.0
90.0
100.0
PER
CEN
T O
F R
ESID
ENTS
Rural Suburban Urban
20102009
This CONFIDENTIAL Executive Summary was prepared by My InnerView.

3QUALITY PROFILE™RESIDENTS WITHOUT ACQUIRED CATHETERS FOR 2009 AND 2010
MINNESOTA
96.5
97.0
97.5
98.0
98.5
99.0
99.5
100.0
PER
CEN
T O
F R
ESID
ENTS
Minnesota My InnerView
20102009
96.0
96.5
97.0
97.5
98.0
98.5
99.0
99.5
100.0
PER
CEN
T O
F R
ESID
ENTS
Rural Suburban Urban
20102009
This CONFIDENTIAL Executive Summary was prepared by My InnerView.

4QUALITY PROFILE™RESIDENTS WITHOUT ACQUIRED PHYSICAL RESTRAINTS FOR 2009 AND 2010
MINNESOTA
95.0
95.5
96.0
96.5
97.0
97.5
98.0
98.5
99.0
99.5
100.0
PER
CEN
T O
F R
ESID
ENTS
Minnesota My InnerView
20102009
96.5
97.0
97.5
98.0
98.5
99.0
99.5
100.0
PER
CEN
T O
F R
ESID
ENTS
Rural Suburban Urban
20102009
This CONFIDENTIAL Executive Summary was prepared by My InnerView.

5QUALITY PROFILE™RESIDENTS WITHOUT UNPLANNED WEIGHT LOSS/GAIN FOR 2009 AND 2010
MINNESOTA
90.0
91.0
92.0
93.0
94.0
95.0
96.0
97.0
98.0
99.0
100.0
PER
CEN
T O
F R
ESID
ENTS
Minnesota My InnerView
20102009
86.0
88.0
90.0
92.0
94.0
96.0
98.0
100.0
PER
CEN
T O
F R
ESID
ENTS
Rural Suburban Urban
20102009
This CONFIDENTIAL Executive Summary was prepared by My InnerView.
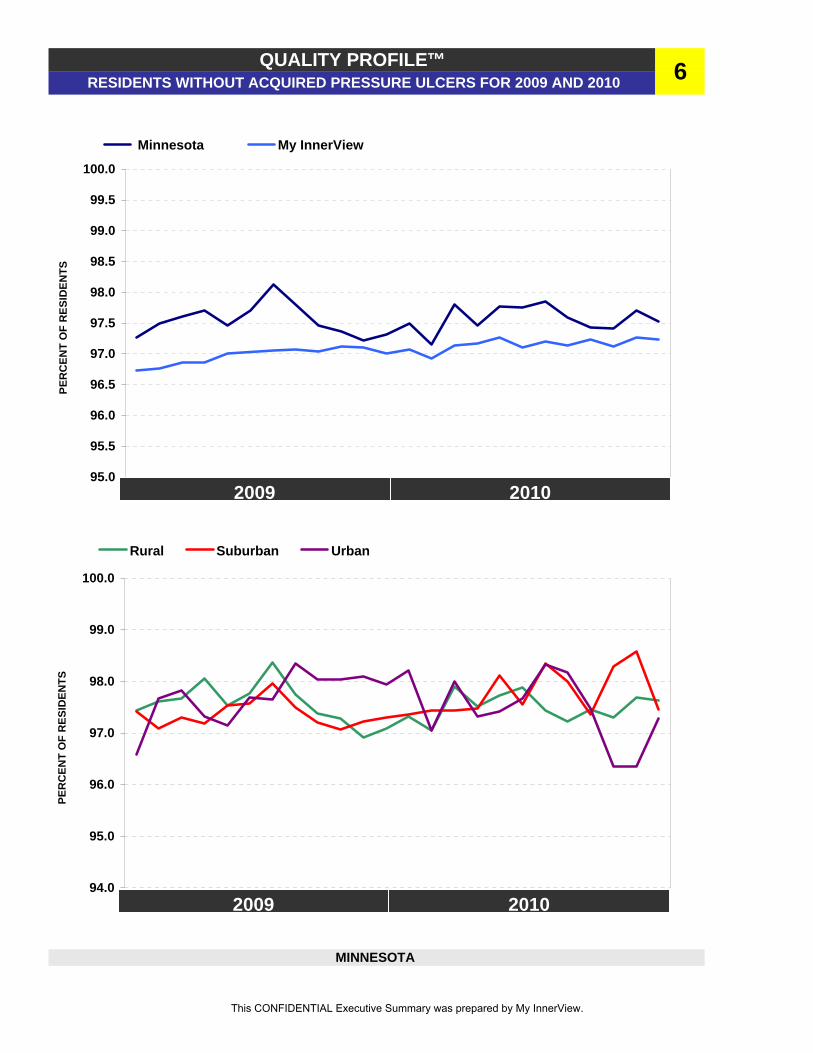
6QUALITY PROFILE™RESIDENTS WITHOUT ACQUIRED PRESSURE ULCERS FOR 2009 AND 2010
MINNESOTA
95.0
95.5
96.0
96.5
97.0
97.5
98.0
98.5
99.0
99.5
100.0
PER
CEN
T O
F R
ESID
ENTS
Minnesota My InnerView
20102009
94.0
95.0
96.0
97.0
98.0
99.0
100.0
PER
CEN
T O
F R
ESID
ENTS
Rural Suburban Urban
20102009
This CONFIDENTIAL Executive Summary was prepared by My InnerView.

7QUALITY PROFILE™RNs/LVNs/LPNs: STABILITY FOR 2009 AND 2010
MINNESOTA
0.0
10.0
20.0
30.0
40.0
50.0
60.0
70.0
80.0
90.0
100.0
PER
CEN
T O
F R
ESID
ENTS
Minnesota My InnerView
20102009
0.0
10.0
20.0
30.0
40.0
50.0
60.0
70.0
80.0
90.0
100.0
PER
CEN
T O
F R
ESID
ENTS
Rural Suburban Urban
20102009
This CONFIDENTIAL Executive Summary was prepared by My InnerView.
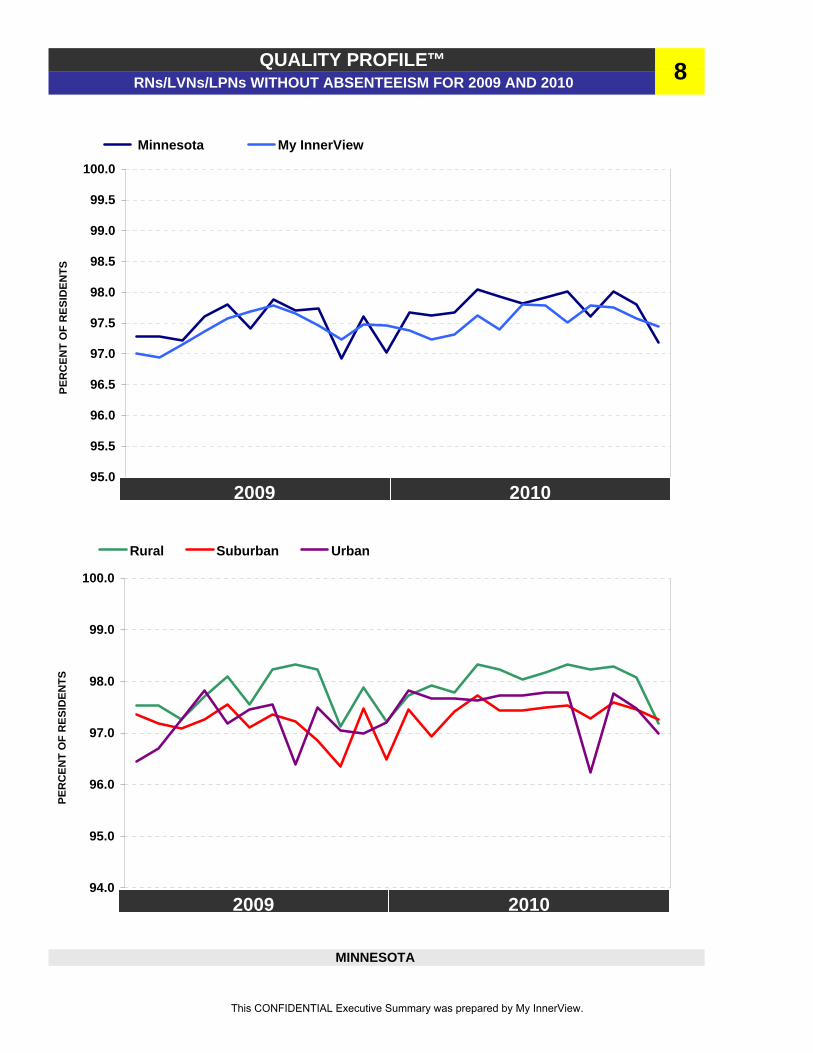
8QUALITY PROFILE™RNs/LVNs/LPNs WITHOUT ABSENTEEISM FOR 2009 AND 2010
MINNESOTA
95.0
95.5
96.0
96.5
97.0
97.5
98.0
98.5
99.0
99.5
100.0
PER
CEN
T O
F R
ESID
ENTS
Minnesota My InnerView
20102009
94.0
95.0
96.0
97.0
98.0
99.0
100.0
PER
CEN
T O
F R
ESID
ENTS
Rural Suburban Urban
20102009
This CONFIDENTIAL Executive Summary was prepared by My InnerView.

9QUALITY PROFILE™RNs/LVNs/LPNs WITHOUT TURNOVER FOR 2009 AND 2010
MINNESOTA
93.0
94.0
95.0
96.0
97.0
98.0
99.0
100.0
PER
CEN
T O
F R
ESID
ENTS
Minnesota My InnerView
20102009
93.0
94.0
95.0
96.0
97.0
98.0
99.0
100.0
PER
CEN
T O
F R
ESID
ENTS
Rural Suburban Urban
20102009
This CONFIDENTIAL Executive Summary was prepared by My InnerView.

10QUALITY PROFILE™CNAs/NAs: STABILITY FOR 2009 AND 2010
MINNESOTA
0.0
10.0
20.0
30.0
40.0
50.0
60.0
70.0
80.0
90.0
100.0
PER
CEN
T O
F R
ESID
ENTS
Minnesota My InnerView
20102009
0.0
10.0
20.0
30.0
40.0
50.0
60.0
70.0
80.0
90.0
100.0
PER
CEN
T O
F R
ESID
ENTS
Rural Suburban Urban
20102009
This CONFIDENTIAL Executive Summary was prepared by My InnerView.

11QUALITY PROFILE™CNAs/NAs WITHOUT ABSENTEEISM FOR 2009 AND 2010
MINNESOTA
92.0
93.0
94.0
95.0
96.0
97.0
98.0
99.0
100.0
PER
CEN
T O
F R
ESID
ENTS
Minnesota My InnerView
20102009
91.0
92.0
93.0
94.0
95.0
96.0
97.0
98.0
99.0
100.0
PER
CEN
T O
F R
ESID
ENTS
Rural Suburban Urban
20102009
This CONFIDENTIAL Executive Summary was prepared by My InnerView.

12QUALITY PROFILE™CNAs/NAs WITHOUT TURNOVER FOR 2009 AND 2010
MINNESOTA
90.0
91.0
92.0
93.0
94.0
95.0
96.0
97.0
98.0
99.0
100.0
PER
CEN
T O
F R
ESID
ENTS
Minnesota My InnerView
20102009
91.0
92.0
93.0
94.0
95.0
96.0
97.0
98.0
99.0
100.0
PER
CEN
T O
F R
ESID
ENTS
Rural Suburban Urban
20102009
This CONFIDENTIAL Executive Summary was prepared by My InnerView.

13QUALITY PROFILE™OCCUPANCY FOR 2009 AND 2010
MINNESOTA
0.0
10.0
20.0
30.0
40.0
50.0
60.0
70.0
80.0
90.0
100.0
PER
CEN
T O
F R
ESID
ENTS
Minnesota My InnerView
20102009
75.0
80.0
85.0
90.0
95.0
100.0
PER
CEN
T O
F R
ESID
ENTS
Rural Suburban Urban
20102009
This CONFIDENTIAL Executive Summary was prepared by My InnerView.


![When you say the word [NOSTRIL], you pronounce the [NOS] slightly louder, at a slightly higher pitch, and for a slightly longer duration than when](https://img.pdfslide.net/doc/110x75/56649f285503460f94c40d52/when-you-say-the-word-nostril-you-pronounce-the-nos-slightly-louder-at.jpg)