Embed Size (px)
Citation preview

Minnesota Strategic ITS Research and Development Plan
Prepared for:
Prepared by
and
August 2015

Minnesota Strategic ITS Research and Development Plan August 2015
i
TABLE OF CONTENTS
Executive Summary ............................................................................................................... 1
1. Introduction ................................................................................................................... 5
2. Minnesota ITS Development Objectives ......................................................................... 6
3. Analysis of Previous Work .............................................................................................. 8
3.1 Objective B: Increase Operational Efficiency and Reliability of the Transportation System ........ 8
3.2 Objective C: Enhance Mobility, Convenience, and Comfort for Transportation System Users.. 11
3.3 Objective D: Improve the Security of the Transportation System .............................................. 15
3.4 Objective E: Support Regional Economic Productivity and Development .................................. 16
3.5 Objective F: Preserve the Transportation System ...................................................................... 21
3.6 Objective G: Enhance the Integration and Connectivity of the Transportation System ............ 22
3.7 Objective H: Reduce Environmental Impacts ............................................................................. 23
3.8 MAP-21 Performance Measures ................................................................................................. 25
3.9 Identification of ITS Development Objectives for Further Analysis ............................................ 25
4. Analysis of ITS Development Objectives ....................................................................... 31
4.1 General Causes of Congestion .................................................................................................... 31
4.2 Performance Measures ............................................................................................................... 32
4.3 Emphasis Areas ........................................................................................................................... 49
5. ITS Strategies for Research and Development ............................................................... 51
5.1 Identifying Potential Strategies ................................................................................................... 51
5.2 Criteria for Selecting Strategies .................................................................................................. 51
5.3 Input from Key MnDOT Stakeholders ......................................................................................... 53
5.4 Use of Strategies in Future Development Efforts ....................................................................... 54
5.5 ITS Strategies ............................................................................................................................... 54
6. Conclusions .................................................................................................................. 72
Appendix A: Minnesota ITS Development Objectives (from 2014 Minnesota Statewide Regional ITS Architecture) ................................................................................................... 74
Appendix B: Other ITS Research and Development Strategies .............................................. 86
References .......................................................................................................................... 87

Minnesota Strategic ITS Research and Development Plan August 2015
ii
LIST OF FIGURES
Figure 1. General Sources of Traffic Congestion on Roadways .................................................................. 31
Figure 2. General Sources of Traffic Congestion on Roadways .................................................................. 32
Figure 3. Travel Time Comparisons, NB TH 100 .......................................................................................... 40
Figure 4. Travel Time Comparisons, SB TH 100 ........................................................................................... 40
Figure 5. Impact of Multiple Incidents on Travel Speeds along I-94 WB Segment at MM 234 .................. 45
Figure 6. Speed Comparisons on I-94 over 2014 Fishing Opener Weekend and Regular Weekend /
Weekday Travel ............................................................................................................................. 46
Figure 7. Travel Time Index along I-94 Westbound between Mileposts 230 and 240 ............................... 49
LIST OF TABLES
Table ES-1. Recommended ITS Strategies for Research and Development ................................................. 3
Table 1. Sample of Completed SHRP2 Projects Related to Improving Travel Time Reliability ................... 14
Table 2. Findings of the Analysis of Previous Work .................................................................................... 26
Table 3. Gaps in Analyses and Data Availability .......................................................................................... 27
Table 4. Key Performance Measures in Relation to ITS Development Objectives ..................................... 33
Table 5. Annual Hours of Delay Measured from Texas Transportation Institute Urban Mobility Report .. 34
Table 6. 2014 MnDOT PeMS Data on Top 50 Freeway Bottlenecks in Twin Cities Metro Area ................. 36
Table 7. Further Analysis of Top Freeway Bottlenecks in Twin Cities Metro Area ..................................... 37
Table 8. Delay at Arterial Signalized Intersections on TH 55, Sept. 2013 ................................................... 38
Table 9. Recommended Emphasis Areas for ITS Development Objective B-1: Reduce Overall Delay
Associated with Congestion ........................................................................................................... 39
Table 10. Summary of Total Vehicle Hours of Delay within Texas DOT Work Zone ................................... 41
Table 11. Recommended Emphasis Areas for ITS Development Objective B-3: Reduce Delays Due to
Work Zones .................................................................................................................................... 42
Table 12. Summary of Top 50 Freeway Segments by Incidents in 2014 ................................................... 43
Table 13. Incident Summary by Freeway ................................................................................................... 44
Table 14. Recommended Emphasis Areas for ITS Development Objective C-1: Reduce Incident-Related
Congestion and Delay for Travelers ............................................................................................... 47
Table 15. Recommended Emphasis Areas for ITS Development Objectives B-1, B-3, C-1, and C-2 and
Related Performance Measures .................................................................................................... 50
Table 16. Additional Emphasis Areas Based on Safety Analysis ................................................................. 50
Table 17. Primary Sources Scanned to Identify Potential ITS Strategies .................................................... 52
Table 18. Maturity Level Definitions and Development Needs .................................................................. 52
Table 19. ITS Strategies for Research and Development ............................................................................ 55

Minnesota Strategic ITS Research and Development Plan August 2015
1
Executive Summary
The purpose of the Minnesota Strategic Intelligent Transportation Systems (ITS) Research and Development Plan is to identify emphasis areas and ITS strategies for research and development to allow the Minnesota Department of Transportation (MnDOT) to strategically develop financially effective ITS solutions and countermeasures to improve operational efficiency and enhance safety and mobility for users of the state transportation system. The ITS Development Unit in MnDOT’s Office of Traffic, Safety & Technology is responsible for researching, developing, field testing, and providing technical support for new ITS technology, products, methods and systems. In order to focus on ITS research and development opportunities that will provide best benefits and improve financial effectiveness, the MnDOT ITS Development Unit developed this Strategic ITS Research and Development Plan to analyze ITS needs and development objectives, identify emphasis areas and ITS strategies to address ITS development needs, and recommend research and development actions to facilitate the development, testing and ultimately implementation of those ITS technology and strategies. The Minnesota Strategic ITS Research and Development Plan was developed using an objectives-driven, data-driven process that is similar to that was applied in the development of the Minnesota Strategic Highway Safety Plan (SHSP). The SHSP analyzed vast amounts of crash data to identify problem areas and needs, and recommend emphasis areas in which safety countermeasures could have the greatest impact improving the safety of travel by reducing the number of crash-related injuries and fatalities. The Minnesota Strategic ITS Research and Development Plan applied a similar data-driven process to examine ITS research and development needs; analyze available data to identify and investigate problem areas; identify emphasis areas for developing ITS solutions, and recommend strategies and countermeasures for ITS research and development that would have the greatest impact at addressing the needs. The development of the Minnesota Strategic ITS Research and Development Plan starts with investigating the level of analysis that has been performed on the Minnesota ITS development objectives. The Minnesota ITS development objectives were identified by stakeholder groups, including MnDOT, Minnesota State Patrol (MSP), Metro Transit, FHWA, and local transportation, transit and public safety agencies. The overarching goal of the Minnesota ITS development objectives is to enhance transportation through the safe and efficient movement of people, goods, and information, with greater mobility, fuel efficiency, less pollution and increased operating efficiency statewide. These objectives were documented in the 2014 Minnesota Statewide Regional ITS Architecture. The Minnesota ITS development objectives are grouped into eight areas. Each of the high-level objectives is further categorized into detailed, refined objectives so that they could be measurable to assess the amount of progress made towards the higher-level objectives. The high-level objectives are:
A. Improve the Safety of the State's Transportation System B. Increase Operational Efficiency and Reliability of the Transportation System C. Enhance Mobility, Convenience, and Comfort for Transportation System Users D. Improve the Security of the Transportation System E. Support Regional Economic Productivity and Development F. Preserve the Transportation System G. Enhance the Integration and Connectivity of the Transportation System H. Reduce Environmental Impacts

Minnesota Strategic ITS Research and Development Plan August 2015
2
Section 3 of the plan provides a narrative summary of past and current ITS studies and analyses that have been performed with respect to the Minnesota ITS development objectives. Based on the completeness of the studies and analyses, ITS development objectives where categorized in three levels:
Objectives with an adequate analysis preformed
Objectives with incomplete analysis performed
Objectives with no analysis performed It was found that the majority of objectives have some analysis performed but such analysis is not complete or additional analysis is underway. Data needs and availability for performing an adequate analysis for those objectives were also identified. Four objectives were selected for further analysis based on their critical impact to transportation system performance as well as data availability. The four objectives are:
Objective B-1: Reduce overall delay associated with congestion
Objective B-3: Reduce delays due to work zones
Objective C-1: Reduce congestion and incident-related delay for travelers
Objective C-2: Improve travel time reliability Section 4 provides a more in-depth analysis of the above ITS development objectives. This analysis facilitated the identification of emphasis areas for ITS research and development as well as potential ITS strategies and countermeasures. Replicate analyses on safety-related objectives were not performed as they have been performed in the 2007 and 2014 SHSP. Based on the findings of the analysis and the review of the SHSP, emphasis areas (including safety-related emphasis areas) for ITS research and development and associated performance measures were identified. The emphasis areas for ITS research and development are:
Traffic Management
Traveler Information
Incident Management
Other Demand Management
Intersections (safety-related, from SHSP)
Lane departure (safety-related, from SHSP)
Inattentive drivers (safety-related, from SHSP)
Speed (safety-related, from SHSP) This analysis along with identified emphasis areas and performance measures help MnDOT to objectively and quantitatively measure the effectiveness potential ITS strategies and solutions in achieving the corresponding ITS development objectives. Recommendations on ITS strategies for research and development are presented in Section 5 of the plan. The recommendations present “tried” and “experimental” ITS strategies and countermeasures that can help achieve these four ITS development objectives and their respective emphasis areas. The ITS strategies recommended by this plan will help guide MnDOT with future ITS development investment.
Minnesota Strategic ITS Research and Development Plan August 2015
3
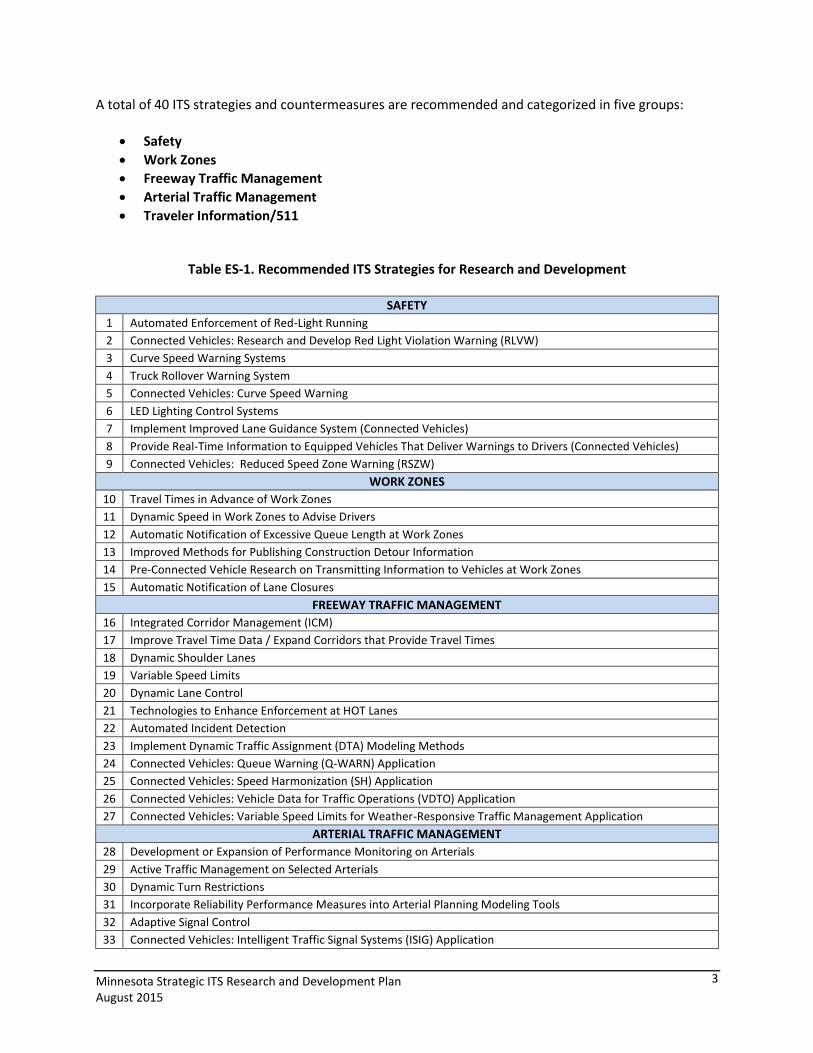
A total of 40 ITS strategies and countermeasures are recommended and categorized in five groups:
Safety
Work Zones
Freeway Traffic Management
Arterial Traffic Management
Traveler Information/511
Table ES-1. Recommended ITS Strategies for Research and Development
SAFETY
1 Automated Enforcement of Red-Light Running
2 Connected Vehicles: Research and Develop Red Light Violation Warning (RLVW)
3 Curve Speed Warning Systems
4 Truck Rollover Warning System
5 Connected Vehicles: Curve Speed Warning
6 LED Lighting Control Systems
7 Implement Improved Lane Guidance System (Connected Vehicles)
8 Provide Real-Time Information to Equipped Vehicles That Deliver Warnings to Drivers (Connected Vehicles)
9 Connected Vehicles: Reduced Speed Zone Warning (RSZW)
WORK ZONES
10 Travel Times in Advance of Work Zones
11 Dynamic Speed in Work Zones to Advise Drivers
12 Automatic Notification of Excessive Queue Length at Work Zones
13 Improved Methods for Publishing Construction Detour Information
14 Pre-Connected Vehicle Research on Transmitting Information to Vehicles at Work Zones
15 Automatic Notification of Lane Closures
FREEWAY TRAFFIC MANAGEMENT
16 Integrated Corridor Management (ICM)
17 Improve Travel Time Data / Expand Corridors that Provide Travel Times
18 Dynamic Shoulder Lanes
19 Variable Speed Limits
20 Dynamic Lane Control
21 Technologies to Enhance Enforcement at HOT Lanes
22 Automated Incident Detection
23 Implement Dynamic Traffic Assignment (DTA) Modeling Methods
24 Connected Vehicles: Queue Warning (Q-WARN) Application
25 Connected Vehicles: Speed Harmonization (SH) Application
26 Connected Vehicles: Vehicle Data for Traffic Operations (VDTO) Application
27 Connected Vehicles: Variable Speed Limits for Weather-Responsive Traffic Management Application
ARTERIAL TRAFFIC MANAGEMENT
28 Development or Expansion of Performance Monitoring on Arterials
29 Active Traffic Management on Selected Arterials
30 Dynamic Turn Restrictions
31 Incorporate Reliability Performance Measures into Arterial Planning Modeling Tools
32 Adaptive Signal Control
33 Connected Vehicles: Intelligent Traffic Signal Systems (ISIG) Application

Minnesota Strategic ITS Research and Development Plan August 2015
4
TRAVELER INFORMATION/511
34 Work Zone Restriction Information Automation
35 Enhanced Data Entry and Integration of Work Zone Info into 511
36 Automated entry of 511 road weather information
37 Enhance Traveler Information for Transit and Other Modes
38 Advanced Notice of Park and Ride Availability and Transit Options
39 Connected Vehicles: Advanced Traveler Information System (ATIS)
40 Connected Vehicles: Road Weather Advisories and Warnings for Motorists
It should be noted that “proven” ITS strategies, such as dynamic message signs and closed-circuit television (CCTV) cameras, are the focus of a separate document – the Minnesota Statewide ITS Plan – which has been created by the MnDOT ITS Development Unit to provide guidance for utilizing MnDOT capital and operating funds to deploy, operate, and maintain those “proven” ITS technologies throughout the state. The Minnesota Strategic ITS Research and Development Plan focuses primarily on the research and development priority for ITS technology and strategies that are not yet considered “proven.” The Minnesota Strategic ITS Research and Development Plan is not the only source of research and development projects considered by the MnDOT ITS Development Unit. The recommended ITS strategies in this plan compliment other sources of project ideas where others outside the ITS Development Unit bring forth for research, testing, and development. These external sources include the ITS Innovative Idea Program, internal management initiatives, and federal grant opportunities. This plan and its associated strategies provide research and development initiatives as determined through an objectives-driven, data-driven process conducted by the ITS Development Unit.
Minnesota Strategic ITS Research and Development Plan August 2015
5
1. Introduction
The Intelligent Transportation Systems (ITS) Development Unit in Minnesota Department of Transportation’s (MnDOT’s) Office of Traffic, Safety & Technology is responsible for researching, developing, field testing, and providing technical support for new ITS technology, products, methods and systems. In order to focus on ITS research and development opportunities that will provide best benefits and improve financial effectiveness, the MnDOT ITS Development Unit developed this Strategic ITS Research and Development Plan to analyze ITS needs and development objectives to identify emphasis areas, identify ITS strategies to address those areas, and recommend research and development needs to implement those ITS strategies. The Minnesota Statewide Regional ITS Architecture includes information from various stakeholder groups identifying high priority needs, ITS development objectives, and potential ITS project concepts and research needs. The ITS development objectives identified by the stakeholders and documented in the Minnesota Statewide Regional ITS Architecture provide the basis for the needs analysis for ITS research and development for this plan. Extensive analysis has already been perform for some of the ITS development objectives. For example, safety related ITS development objectives have been examined extensively in the Minnesota Strategic Highway Safety Plan (MSHP) by analyzing crash data, reviewing national and local safety planning documents, identifying critical emphasis areas, and identifying strategies to pursue related to the emphasis areas. Many of the ITS development objectives, however, do not currently have data available or exiting performance measures to perform an analysis in a clear and extensive way similar to the safety analysis performed in the MSHP. In order for MnDOT to identify areas of ITS research and development opportunities and strategically develop financially effective ITS solutions and countermeasures, analysis of ITS development objectives that have not been adequately analyzed is needed. This purpose of this plan is to identify emphasis areas and opportunities in ITS research and development for MnDOT to pursue. The emphasis areas along with the associated performance measures help MnDOT to objectively and quantitatively measure the effectiveness of potential ITS strategies and solutions in achieving the corresponding ITS needs and development objectives. The ITS strategies and countermeasures recommended by this plan will help guide MnDOT with future ITS development investment. It should be noted that MnDOT has developed multiple ITS planning documents. The Minnesota Statewide ITS Plan serves as a planning tool to provide guidance for utilizing MnDOT capital and operating funds to deploy, operate, and maintain ITS technologies that are “proven” to be effective and worthwhile to deploy throughout the state. The Minnesota Statewide Regional ITS Architecture includes a list of potential ITS strategies, both “proven” and “to-be-proven,” at a conceptual level. This Strategic ITS Research and Development Plan focuses primarily on the research and development priority for ITS technology and solutions that are not yet considered “proven.” This Strategic ITS Research and Development Plan, nonetheless, is not the only source of research and development projects considered by the MnDOT ITS Development Unit. The recommended ITS strategies in this plan compliment other sources of project ideas where others outside the ITS Development Unit bring forth for research, testing, and development. These external sources include the ITS Innovative Idea Program, internal management initiatives, and federal grant opportunities. This

Minnesota Strategic ITS Research and Development Plan August 2015
6
plan and its associated strategies provide research and development initiatives as determined through an objectives-driven, data-driven process conducted by the ITS Development Unit. The Strategic ITS Research and Development Plan is organized in the following sections:
Section 1: Introduction provides a brief project overview and the purpose of this plan. Section 2: Minnesota ITS Development Objectives provides an overview of the Minnesota ITS
development objectives. Section 3: Analysis of Previous Work describes, for each ITS development objective, the level of
analysis that has been performed on the problems related to the objective. This includes discussions on whether adequate analyses have or have not been performed, as well as additional efforts and data collection are recommended that would assist in arriving at adequate analyses of the problems and objectives. This section also recommends a list of ITS development objectives for further analysis.
Section 4: Analysis of ITS Development Objectives provides an in-depth analysis of the ITS development objectives that were recommended for further analysis. The analysis facilitates the identification of emphasis areas for ITS research and development as well as potential ITS strategies and solutions.
Section 5: ITS Strategies for Research and Development provides a list of ITS strategies that could be used by MnDOT to address the selected development objectives within the emphasis areas.
Section 6: Conclusions presents key findings and conclusions for this research effort.
2. Minnesota ITS Development Objectives
In 2006, stakeholders from FHWA, MnDOT, Minnesota State Patrol (MSP), Metro Transit, and local transportation, transit and public safety agencies collectively discusses and developed a comprehensive list of Minnesota ITS development objectives. The overarching goal of the Minnesota ITS development objectives is to enhance transportation through the safe and efficient movement of people, goods, and information, with greater mobility, fuel efficiency, less pollution and increased operating efficiency statewide. These objectives were revised slightly in 2014 so they are better aligned with the 2014 Minnesota Statewide Regional ITS Architecture and consistent with the National ITS Architecture (Version 7.0). The Minnesota ITS development objectives are grouped into eight areas. Each of the high-level objectives is further categorized into detailed, refined objectives so that they could be measurable to assess the amount of progress made towards the higher-level objectives. The high-level objectives are listed on the next page. A complete list of the Minnesota ITS development objectives and more detailed, refined objectives is included in Appendix A. A. Improve the Safety of the State's Transportation System
A-1 Reduce crash frequency A-2 Reduce fatalities and life changing injuries A-3 Reduce crashes in work zones
B. Increase Operational Efficiency and Reliability of the Transportation System
B-1 Reduce overall delay associated with congestion B-2 Increase average vehicle occupancy and facility throughput B-3 Reduce delays due to work zones B-4 Reduce traffic delays during evacuation from homeland security and Hazmat incidents

Minnesota Strategic ITS Research and Development Plan August 2015
7
C. Enhance Mobility, Convenience, and Comfort for Transportation System Users
C-1 Reduce congestion and incident-related delay for travelers C-2 Improve travel time reliability C-3 Increase choice of travel modes C-4 Reduce stress caused by transportation
D. Improve the Security of the Transportation System
D-1 Enhance traveler security D-2 Safeguard the motoring public from homeland security and/or Hazmat incidents
E. Support Regional Economic Productivity and Development
E-1 Reduce travel time for freight, transit and businesses E-2 Improve the efficiency of freight movement, permitting and credentials process E-3 Improve travel time reliability for freight, transit and businesses E-4 Increase agency efficiency E-5 Reduce vehicle operating costs E-6 Enhance efficiency at borders
F. Preserve the Transportation System
F-1 Safeguard existing infrastructure G. Enhance the Integration and Connectivity of the Transportation System
G-1 Aid in transportation infrastructure and operations planning G-2 Reduce need for new facilities
H. Reduce Environmental Impacts
H-1 Reduce emissions/energy impacts and use associated with congestion H-2 Reduce negative impacts of the transportation system on communities
For some of the Minnesota ITS development objectives extensive analyses ready exist. For example, Objective A – Improve the Safety of the State’s Transportation System has been analyzed through the Minnesota Strategic Highway Safety Plan (SHSP) published in 2007 and a recent updated version in 2014. The 2007 and 2014 MSHP examined extensive crash data, reviewed existing national and local safety planning documents, identified critical emphasis/focus areas and priorities, and identified strategies to pursue related to the emphasis/focus areas. Similar extensive analyses may or may not exist for objectives categorized under B through H. In addition, many of those objectives may not have existing performance measures or available data that can be utilized to help analyze them. The focus of this document is to assess previous work completed with respect to those 21 objectives under B through H and identify which objectives should be further analyzed for this project.

Minnesota Strategic ITS Research and Development Plan August 2015
8
3. Analysis of Previous Work
This section provides a summary of existing studies and reports that have been completed to date with respect to the 21 ITS development objectives categorized under the B through H objectives listed in Section 2. For each objective, the studies and reports that were found revealed that either: 1) an adequate analysis of the objective had been performed, 2) an analysis has been partially performed and additional analysis is required to understand how the objective was being met, or 3) no analysis or studies have been performed to date with respect to the objective.
3.1 Objective B: Increase Operational Efficiency and Reliability of the Transportation System
This objective is broken out into four additional sub-level objectives as discussed below with respect to increasing the operational efficiency and reliability of the transportation system. 3.1.1. Objective B-1: Reduce overall delay associated with congestion
The general problem associated with congestion (recurring and non-recurring) is that can lead to travel delays for users of the transportation system. MnDOT produces an annual report called the Metropolitan Freeway System Congestion Report1 that in which congestion is defined as traffic flowing at speeds less than or equal to 45 Miles per Hour (MPH). This definition does not include delays that may occur at speeds greater than 45 MPH. The 45 MPH speed limit was selected since it is the speed where “shock waves” can propagate. These conditions also pose higher risks of crashes. Although shock waves can occur above 45 MPH there is a distinct difference in traffic flow above and below the 45 MPH limit. MnDOT derives congestion data using two sources of data: 1) Surveillance detectors in roadways (exists on 90% of the metro area freeway system) and 2) field observations. Data is collected on metro area freeways only during the month of October, since this reflects regular patterns of traffic that are not influenced by non-recurring events, such as the summer vacation season, large summer road construction projects, or severe weather events. Therefore, this data can reveal increases or decreases in recurring congestion in the Twin Cities metro area. The report notes that the Twin Cities freeway system experienced a decrease in the percentage of miles of freeway system congested, from 21.4% in 2012 to 19.9%. This measurement is reported on an annual basis along with other system-level performance measures. The MnDOT Metropolitan District 20-year Highway Investment Plan2 has also identified several strategies for addressing congestion. These include Active Traffic Management systems such as those installed on I-35W and I-94, spot mobility improvements focused on geometric design or safety hazards, and MnPASS system expansion. Based on the above, an adequate analysis has been performed for the freeway system in the Twin Cities metro area. Regarding congestion data along arterial roadways, Steve Misgen of MnDOT has noted that MnDOT recently worked with the University of Minnesota to implement a SMART-SIGNAL (Systematic Monitoring of Arterial Road Traffic and Signals) system.3 This system can automate the process of collecting arterial traffic data by using data collection units installed in signal cabinets to record traffic data (from existing in-pavement sensors) and send it to a central server at the RTMC. The data requires

Minnesota Strategic ITS Research and Development Plan August 2015
9
further analysis to detect emerging congestion patterns, at which point traffic signal timings can be adjusted accordingly. The system was first installed on an 11-intersection arterial corridor along France Avenue in Hennepin County, and has since been expanded to 22 intersections along TH 7 and 40 intersections along TH 65 and TH 10, with an additional expansion to TH 61 from Highway 36 north through White Bear Lake, MN.4 Steve Misgen has noted that while the data is useful for signal timing purposes, the effort requires further analysis by traffic engineers to understand how timing improvements could be made. A current effort aimed at developing algorithms to automatically generate signal timing plans for MnDOT staff will be completed in the fall of 2014. Another planned effort to be completed by the fall of 2015 is to develop an Arterial Congestion Report that would be similar to the Freeway Congestion Report that MnDOT publishes on an annual basis. This report would track the annual degradation of arterial performance measures for better prioritization of traffic signal retiming projects. This report would include the SMART Signal corridors as noted previously, as well as other signalized arterials based on a representative sample of intersections on those corridors. As such, an adequate analysis related to arterial congestion has been partially performed and additional analyses are currently underway. Limited data related to congestion in areas outside of the Twin Cities metro area has been collected, analyzed or studied. Conducting an adequate analysis related to congestion in the Greater Minnesota remains a gap. Non-recurring congestion is typically caused by incidents, work zones, and others such as weather events, special events, etc. Issues related to congestion and delays caused by incidents and work zones are discussed subsequently in Objectives C-1 and B-3, respectively. 3.1.2 Objective B-2: Increase average vehicle occupancy and facility throughput
This objective is aimed at improving roadway facility throughput primarily by means of increasing passenger occupancy of vehicles. Strategies for this objective include reducing the number of single-occupancy vehicles (SOVs) on the roadway, promoting usage of carpools, vanpools and transit, and improving transit performance. An increase in average vehicle occupancy and facility throughput could be achieved through the continued expansion of MnPASS lanes in the metro area and improving transit services and performance. Improving roadway capacity can also increase facility throughput; however, this typically is not considered as an ITS strategy and therefore is not focus for this analysis. In addition, transit service improvements are primarily managed and implemented by transit service providers. As such, MnDOT’s focuses for this objective are on reducing the number of single-occupancy vehicles on the roadway and enhancing the performance of roadway facilities dedicated to high-occupancy vehicles (HOVs) and transit services (such as MnPASS lanes, bus-only shoulder lanes and HOV bypass ramps). As previously noted, the MnDOT Metropolitan District 20-year Highway Investment Plan identified several strategies and projects for addressing congestion, which include the MnPASS system expansion and other areas of roadway improvements. A recent study completed on the I-35W MnPASS lanes revealed that the new I-35W lanes have attracted new MnPASS customers and maintained travel-time savings and trip-time reliability for buses and carpools5. One conclusion though was that further research was recommended in examining the potential decline in carpoolers along the corridor, since a general decrease in carpools was observed

Minnesota Strategic ITS Research and Development Plan August 2015
10
from a 2008 to 2011 timeframe. This decline was based on data gathered from vehicle loop detection along the corridor for all vehicles, less tolled vehicles, violators, and buses. Previous studies of the I-394 MnPASS lanes have concluded that travel speeds have increased for traffic in both the general purpose lanes and the HOT lanes along the corridor. A study conducted by the University of Minnesota Humphrey Institute noted that drivers utilizing the MnPASS lanes could expect a 20 MPH increase in speeds, while those using the general purpose lanes could also expect a small increase in travel speeds.6 The 2013 Annual MnPASS report for the 2012-2013 reporting period also noted that the I-394 and I-35W MnPASS Lanes recorded 11.7% and 23.8% more trips, respectively, than the previous reporting period (2011-2012), which demonstrates an increase in facility throughput.7
Performance measures and data to support the measures related to this objective include:
Passenger occupancy counts: This is usually gathered through manual counts on managed lane facilities but not for the entire roadway facility. Research and development on automated passenger counting technology is an on-going effort. Current technology and products in this area have not been proven for delivering accurate counts and for wide-spread implementation.
Vehicle counts: This is usually gathered from loop detectors installed along the roadway specific to HOV/HOT lanes and general purpose lanes as well.
Transit ridership: transit ridership data exist and can be extrapolated to support an analysis for this objective.
Vehicle throughput: This measure can be derived directly using vehicle count data.
Passenger throughput: This measure can be derived from passenger occupancy counts and vehicle counts.
Based on the I-35W MnPASS report, data exist with respect to analyzing average vehicle occupancy in MnPASS lanes, but an adequate analysis of decline in the number of carpoolers has not been performed. Further research as suggested in the I-35W MnPASS report is needed to determine declines in the number of carpools that were observed. 3.1.3 Objective B-3: Reduce delays due to work zones
This objective is aimed at reducing traffic delays due to work zones, a form of non-recurring congestion that is not included in measurements of congestion data as noted above. A key strategy of MnDOT staff as noted in discussions with Brain Kary and Tiffany Dagon of MnDOT is managing congestion in work zones through providing travel time information that may help drivers find alternate routes or change travel patterns. Brian Kary of MnDOT noted a few projects that are utilizing temporary trailer-mounted traffic detection units through work zones along Highway 100 in the Twin Cities to determine travel times and make that available to the general public through existing methods (i.e. DMS and the 511 system)8. An upcoming project on the I-94 corridor from St. Paul to McKnight Road will be using Wavetronix sensors and potentially Doppler radar sensors to collect traffic volume and speed data and calculate travel times in the work zones. This information can then also be disseminated to the general public through DMS and the 511 system. Tiffany Dagon of MnDOT noted that data collected on travel times and delays in work zones has only recently been collected and is beginning to be analyzed9. A systematic analysis was performed in 2013

Minnesota Strategic ITS Research and Development Plan August 2015
11
on how much delay was experienced in several work zones, but there was not an indication of how delay had decreased as a result of ITS efforts such as providing travel time information based on travel time data collected in those work zones. Tiffany Dagon noted that MnDOT is beginning to estimate delay in work zones prior to construction, and then compare that estimate to actual delays measured through the work zones as an effort in measuring the travel and work zone performance. MnDOT is early in the process of performing this analysis and no data currently exists on the comparison of estimated vs. actual delays. Steve Misgen of MnDOT has also noted that a current MnDOT Innovative Ideas project related to measuring the impact of construction on traffic patterns along arterial roadways will begin in 2014.10 This report will determine the before-and-after impacts to delays along arterial roadways that are adjacent to construction zones that are established along highways and interstate roads. Existing reports with respect to delays in work zones have been produced or are currently being evaluated. A recent perception tracking study examined how drivers value travel time information provided to them in advance of work zones. The study found positive results in terms of the value of the information, and also found that many respondents took an alternate route in response to travel time information provided on DMS.11 Similar to Objective B-2 noted above, data exist to support an evaluation on this objective, but an adequate analysis is still to be completed. 3.1.4 Objective B-4: Reduce traffic delays during evacuation from homeland security and Hazmat
incidents
This objective is aimed at the problem of traffic delays caused during evacuations as a result of homeland security and Hazmat incidents. Existing reports have been produced regarding traffic management plans under varying scenarios of evacuations, but there have not been studies or reports based on delay or congestion data measured during these types of incidents. An adequate analysis of the problem has not been performed. The data that would need to be collected and analyzed is similar to traffic detection data used to analyze travel times and congestion under objectives B-1 and B-3. Data on congestion and travel times would need to be collected before, during, and after the evacuation events and then evaluated to understand how well MnDOT is performing under these types of events.
3.2 Objective C: Enhance Mobility, Convenience, and Comfort for Transportation System Users
This objective is broken out into four sub-level objectives as discussed below with respect to enhancing the mobility and convenience of the transportation system. 3.2.1 Objective C-1: Reduce congestion and incident-related delay for travelers
This objective is aimed at the problem of delays due to traffic incidents, a form of non-recurring congestion. Traffic congestion in general is also discussed under Objective B-1 earlier in this document, and the focus of Objective C-1 is on incident-related delay. The FHWA estimates that roughly half of the congestion experienced throughout the country is caused by non-recurring congestion, of which the three main causes are traffic incidents (25% of congestion), work zones (10% of congestion), and

Minnesota Strategic ITS Research and Development Plan August 2015
12
weather (15% of congestion).12 The reduction of non-recurring congestion not only reduces general travel times for passenger vehicles, but also improves the efficiency of freight operations that can increase U.S. competitiveness with other nations. The 2010 Annual Minnesota Transportation Performance Report notes that four minutes of congestion generally results from each minute of time that a traffic lane is blocked by an incident.13 Clearing incidents from the freeway system can help to reduce congestion and secondary crashes that may result from them. MnDOT utilizes the Freeway Incident Response Safety Team (FIRST) program and has noted that the program has a benefit-cost ratio of about 16 to 1 based on reduced delay, crashes, fuel consumption and emissions. MnDOT also currently monitors and collects data on clearance times for urban freeway incidents and reports this as an annual performance measure. The measure tracks the time (in minutes) it takes MnDOT and its partners to clear incidents on the Metro Area freeway system, which includes stalled cars, crashes, and other events or objects that disrupt normal traffic flow. In 2011, MnDOT reported that average clearance times decreased, coming in under the 35 minute target for the first time since 2000.14 This could be due a number of factors, namely the expansion of the FIRST program over the years to reduce incident-related delay. While data exists for freeway incident clearance times, an analysis of arterial incident clearance times has not been performed to date and is a potential gap in data collection and analysis. While additional data on incident clearance times could also be collected in outstate area outside of the Twin Cities metro area, an adequate analysis of this objective with regard to freeway operations is performed on an annual basis through the reporting of incident clearance times. 3.2.2 Objective C-2: Improve travel time reliability
This objective is aimed at the problem of unreliable travel times on the transportation system that can result from either recurring or non-recurring congestion. Among the objectives in the Metro District Highway Investment Plan is an increase in travel time reliability. The noted performance indicator within the plan is the percent or miles of new managed lanes such as High Occupancy Vehicles (HOV), Bus Rapid Transit (BRT) and High Occupancy Toll (HOT) that are added to the system.15 These types of systems have demonstrated travel time reliability improvements along corridors where they were previously not installed. As noted in the I-35 South evaluation of the MnPASS lanes, while the lanes attracted new MnPASS customers as single-occupancy vehicles, travel-time savings and trip-time reliability for buses and carpools was still maintained from previous levels prior to the HOT lane implementation.16 The Travel Time Index (TTI) for the region can also be used to assess the objective of improving travel time reliability. This measure is reported on nationally by the Texas Transportation Institute through its Urban Mobility Report. 17 By definition, the TTI is a measure of the ratio of the travel time during the peak period to the time required to make the same trip at free-flow speeds. For example, a TTI value of 1.2 would indicate that a 20-minute free-flow trip requires 24 minutes during the peak period. For the Twin Cities metro area overall, the TTI has gradually increased from 1.04 in 1982 to 1.21 as recently as 2012.

Minnesota Strategic ITS Research and Development Plan August 2015
13
At the federal level, the Strategic Highway Research Program 2 (SHRP2) has also published a series of travel time reliability studies, of which some have been completed and some are underway.18 Table 1 contains a partial listing of those projects that have been completed to date that could provide guidance and direction on efforts at the state level to improve travel time reliability. Given the data collected analyzed with respect to managed lane facilities and TTI measures, an adequate analysis of the problem with travel time reliability has been completed on MnPASS lanes. Data needed for conducting a similar analysis for freeway general purpose lanes in the Twin Cities metro area are available; however an adequate analysis has not yet been performed. With regard to arterial travel time reliability, data suitable for an adequate analysis have not been fully collected. Implementing data collection systems to gather travel time data on arterials is needed to perform an adequately analysis. 3.2.3 Objective C-3: Increase choice of travel modes
This objective is aimed at the problem of a lack of travel modes for users of the transportation system, which can lead to inconvenience to certain travelers or community. Lacking choices of travel mode may also lead to congestion resulting from heavy SOV usage on roadway corridors. Offering additional modes of transportation, such as public transit, carpool/vanpool, or bicycle/pedestrian pathways can provide alternative means of transportation that may have a positive impact on corridor travel times and trip reliability. While there is data reported on annual transit ridership in the metro area, as well as throughout the state, there are no reports that show how an increase in travel modes specifically has an impact on congestion, delay, travel times or travel time reliability in a specific region. Therefore, an adequate analysis of the problem has not been performed with respect to this objective. Further data collection and research would need to be performed to understand the impacts of increasing travel mode choices in a specific region. This research could be performed with a recently developed software tool produced through research titled “The Effect of Smart Growth Policies on Travel Demand” 19 funded by SHRP2. The purpose of this August 2012 research was to address a lack of practical guidance and tools for translating the application of Smart Growth policies, among which include providing a variety of transportation choices, on travel demand within a region. A software program was produced and tested for various metropolitan areas under different scenarios, which guided them in understanding how Smart Growth policies impact travel demand under different conditions. The potential use of this program could allow state, regional and local agencies to engage in the evaluation of smart growth strategies, such as increasing transportation modes in a region, to understand their impacts on travel demand. The program was also designed to be accessible to land use and transportation planners with no modeling experience.

Minnesota Strategic ITS Research and Development Plan August 2015
14
Table 1. Sample of Completed SHRP2 Projects Related to Improving Travel Time Reliability
SHRP2 Project Number
SHRP2 Project Title SHRP2 Project Summary
SHRP 2 L02
Establishing Monitoring Programs for Mobility and Travel Time Reliability
Provides a blueprint for designing programs to monitor travel-time reliability and a guidebook for designing, building, operating, and maintaining those systems. The guidebook is applicable to freeways, toll roads, and urban arterials, and provides direction on technical, analytical, economic, and institutional implementation issues.
SHRP 2 L04
Incorporating Reliability Performance Measures in Operations and Planning Modeling Tools
Includes a number of reports and guides for incorporating travel time reliability into microscopic and mesoscopic simulation models and for integrating demand and network models.
SHRP 2 L05
Incorporating Reliability Performance Measures into the Transportation Planning and Programming Processes
Includes a guide, technical reference, spreadsheets applied to case studies, and other material to help agencies address travel time reliability in their plans and programs.
SHRP 2 L08
Incorporation of Travel Time Reliability into the Highway Capacity Manual
Addresses new analytical procedures that have been developed, and includes chapters on Freeway Facilities and Urban Streets that have been prepared for potential incorporation of travel-time reliability in the Highway Capacity Manual (HCM).
SHRP 2 L10
Feasibility of Using In-Vehicle Video Data to Explore How to Modify Driver Behavior that Causes Non-Recurring Congestion
Presents a report that provides technical guidance on the features, technologies, and supplementary data sets that researchers and practitioners should consider when designing instrumented in-vehicle data collection studies. Also includes a new modeling approach for travel time reliability performance measurement.
SHRP 2 L11
Evaluating Alternative Operations Strategies to Improve Travel Time Reliability
Includes a report useful for planning and systems engineering with regard to travel time reliability. It sets out requirements for reliability for both person travel and freight. It identifies alternative future scenarios for 2030 and a concept of operations. The study determines the cost effectiveness of a large number of different actions that can enhance reliability and explores a novel method for imputing the economic value of improving travel time reliability.
SHRP 2 L14
Traveler Information and Travel Time Reliability
Presents a report that describes how transportation agencies can best communicate information about travel time reliability to motorists so they can make informed decisions and better plan to arrive at their destination on time

Minnesota Strategic ITS Research and Development Plan August 2015
15
3.2.4 Objective C-4: Reduce stress caused by transportation
This objective is aimed at the problem of stress caused to users of the transportation system resulting from congestion and unreliable trip times on roads and highways throughout the state. In general, this objective can be indirectly achieved through strategies that can successfully address of other ITS development objectives that focus on reducing congestion and incident-related delay (Objective C-1) and improving travel time reliability (Objective C-2). One solution that MnDOT is currently testing includes a truck parking space availability system that will provide parking space availability to commercial vehicle operators during their route via DMS and other means of information dissemination.20 While the primary benefits include improved safety of travel for all vehicles along the roadway, the main benefits in terms of travel efficiency include better trip and operations management by drivers and carriers, given that federal hours of service rules require truck drivers to stop and rest after 11 hours of driving. The ability to determine when and where to stop within hours of service requirements will help drivers and carriers make better overall trip and operations decisions. The system was tested at one site in 2012 and has been expanded to other MnDOT rest areas near the cities of Avon and St. Cloud, and will also be deployed at a private truck stop in the near future. John Tompkins of MnDOT noted that the truck parking availability system was tested as a proof-of-concept demonstration with the University of Minnesota Center for Transportation Studies. 21 While the technology deployed proved to be very accurate at identifying parking availability in difficult weather conditions, future deployments will need to consider how the business model should be designed, specifically how much of the system costs should be borne by MnDOT and trucking companies that utilize the system. Other neighboring states, including Wisconsin and Michigan, have undergone similar demonstrations, but with different business models that may be more feasible for larger deployments. Expansion of the truck parking availability system, beyond the proof-of-concept stage, is not expected until after a business model is determined in the coming years. Given its close relationship with Objectives C-1 and C-2, Objective C-4 is not recommended for further analysis.
3.3 Objective D: Improve the Security of the Transportation System
3.3.1 Objective D-1: Enhance traveler security
This objective is aimed at the general problem of potential personal security issues when traveling along Minnesota roads and highways. ITS strategies and countermeasures for this problem focus primarily on providing surveillance to monitor transportation facilities and detect and verify security incidents that may occur. Enhancing traveler security can be achieved through the expansion of CCTV surveillance cameras along roads, highways and infrastructures such as bridges and tunnels. While it is not assumed that there is a current lack of security monitoring capability for key transportation infrastructure, enhancements could be made in the area of providing greater coverage as well as enhancing technology for security monitoring, detection and alerts. In general, expanding CCTV coverage allows for MnDOT to more accurately confirm the location of security incidents along roadways and notify incident response personnel of the incident location. Incidents involving hazardous materials and homeland security events can also be confirmed by MnDOT RTMC staff through CCTV surveillance and used to assist emergency response personnel that are
Minnesota Strategic ITS Research and Development Plan August 2015
16
traveling to the incident. MnDOT RTMC staff can currently safeguard the large traveling public by presenting alternate route information around the incident through the regular means of traveler information dissemination, including DMS and the 511 telephone and internet systems. MnDOT has also deployed CCTV cameras with infra-red capabilities in some areas to detect the presence of individuals in restricted areas and near key infrastructure. One example includes the recently completed I-35W bridge over the Mississippi river in Minneapolis. Cameras have been installed under the bridge deck and are checked when reports are made to MnDOT staff that suspicious objects and/or individuals are in the area. The cameras could create automate alerts to MnDOT staff, however the large number of people and movement in the area would potentially set off too many alerts for MnDOT staff to monitor. MnDOT is planning to expand the use of these infra-red cameras to the recently completed US 61 bridge location in Hastings, MN.22 While there is data on the number of CCTV cameras deployed throughout the metro and within the state, there are no reports to quantify the relationship between increased CCTV camera coverage and perceived traveler security in general. Data that would need to be collected would likely include surveys of the traveling public to gauge their level of perceived safety from the impact of increased CCTV coverage. In summary, the problem associated with traveler security is understood, and the objective of enhancing traveler security is met through the expansion of CCTV/security camera coverage to areas in need of this type of surveillance. Therefore, this objective is not recommended for further analysis. 3.3.2 Objective D-2: Safeguard the motoring public from homeland security and/or Hazmat
incidents
This objective is focused on the problem caused by homeland security and/or hazardous materials (Hazmat) incidents and the safety impacts on the traveling public on Minnesota roads and highways. This objective is very closely related to Objective D-1 discussed above, in which the problems and needs are well understood and an adequate analysis of the problem may not be necessary. Therefore, this objective is not recommended for further analysis.
3.4 Objective E: Support Regional Economic Productivity and Development
There are six sub-level objectives that fall under this Objective of supporting regional economic productivity and development in Minnesota, focusing on improving efficiency of freight, transit and business related transportation movements. It should be noted that the Minnesota Statewide Freight Plan update is underway and expected to be completed by July 2015. It will be developed to provide guidelines in project development, investment, and operational decisions in accordance with the federal MAP-21 legislation, as well as highlight best practices and current Minnesota initiatives. As part of the update, an Implementation Plan will identify low-cost “freight” projects and operational strategies that MnDOT can quickly pursue in the near term to demonstrate the responsiveness of government to business needs. 3.4.1 Objective E-1: Reduce travel time for freight, transit and businesses
This objective is focused on the general problem associated with lengthy travel times for commercial vehicles delivering freight, public transportation, and the negative impact it can have on businesses and regional economies. The objective of reducing travel times specifically for commercial vehicle and public

Minnesota Strategic ITS Research and Development Plan August 2015
17
transit operators can be achieved through numerous technology solutions such as the use of signal priority technologies and notifications of road conditions and incidents provided through the 511 systems and social media outlets; as well as non-technology solutions such as designated truck or bus lanes and general roadway improvements. There are existing systems that have been tested with respect to signal priority for both freight and public transit systems. MnDOT tested a truck priority system in 2004 that consisted of loop detectors installed at a traffic signal along Highway 169 in the city of Belle Plaine23. The intersection was selected based on a set of pre-determined criteria for commercial vehicles and the signal controller was successfully connected with loop detectors that provided the intended request for signal priority. The results of the study showed mixed results in that mainline requests for signal priority created negative impacts on commercial vehicles waiting the cross street, and also that the four-lane highway configuration complicated the overall evaluation of the project. A recommendation was made for further deployment and analysis on a two-lane highway with an evaluation on its impacts that could better demonstrate the positive impacts of truck priority. Metro Transit has also equipped transit vehicles in the metro area with Transit Signal Priority (TSP) equipment that is only used to assist buses that fall behind schedule by a number of minutes as measured by their AVL system. This system requires on-board equipment to communicate with separately installed intersection equipment connected to the signal controller in order to provide signal priority. Metro Transit has implemented this system on the Central Avenue corridor between Minneapolis and Columbia Heights and on the Cedar Avenue corridor in Apple Valley and intends to expand the system over the coming years. Performance measure data that is available at a statewide level that relate to freight operations includes Inter-Regional Corridor (IRC) Travel Speeds. Each IRC has a targeted speed that a traveler should be able to average (55, 60 or 65 mph) over a corridor length trip. MnDOT compares these targets to estimates of actual travel speed that are based on a corridor’s volume, congestion, and number of stops. Overall, 2,580 miles of state highways are designated as IRCs.24 The 2012 Annual Minnesota Transportation Performance Report noted that 98 percent of IRC system-miles have performed at or above targeted speed each of the last 10 years, and that the outlook is expected to remain stable over the coming years. While these systems could be applied specifically to commercial vehicles and transit vehicles to achieve this objective, improvements in travel times for these vehicles will also generally result from efforts made to improve all travel times along the transportation system in general. These are discussed under ITS development objectives B and C with respect to reducing overall congestion and delay on the transportation system. Therefore, Objective E-1 is not recommended for further analysis. 3.4.2 Objective E-2: Improve the efficiency of freight movement, permitting and credentials process
This objective is focused on the general problem associated with the efficiency of freight movement and the permitting and credentials process. This objective can be achieved through improvements to commercial vehicle permitting, credentialing, and safety and security inspection processes. Ward Briggs of MnDOT has noted that there is currently an effort to streamline and improve the permitting process for commercial vehicles.25 Currently, permits need to be obtained separately for each roadway jurisdiction through which commercial vehicles travel, which is an administrative burden for operators.

Minnesota Strategic ITS Research and Development Plan August 2015
18
To address this problem, MnDOT is currently upgrading the website through which commercial vehicle operators obtain their permits, known as RouteBuilder.26 Operators will be able to enter in a designated route for their vehicles on the website, which can then determine the amount of permits needed based on the roads that will be traveled on by those vehicles. At that time, the permits needed at all required levels (i.e. county, city, state, etc.) will be provided to the commercial vehicle operator that entered in the route designation. This initiative will be completed by end of 2014 and is expected to improve the efficiency of the permitting process for commercial vehicle operators throughout the state. Currently, there is the ability for commercial vehicle operators to apply for state-level permits from both Minnesota and Wisconsin through a joint effort by both state DOTs that has improved permitting for operators traveling through both states on longer distance routes. A future effort regarding multi-state permitting for longer-distance commercial vehicle travel is planned that would be similar to the RouteBuilder effort for intra-state commercial vehicle travel. With regards to overweight vehicle movement, Weigh-in-Motion (WIM) data gathered from MnDOT sites could potentially be used for overweight vehicle enforcement purposes. MnDOT currently has a total of 26 WIM sites throughout the state. Historical WIM Data from a number of sites is collected by the MnDOT Transportation Data and Analysis (TDA) group. This data could reveal areas where high numbers of overweight vehicles have been detected so that law enforcement can target areas in need of increased enforcement presence by the State Patrol. Ted Coulianos of the MnDOT Office of Freight noted however, that the WIM data is not actively used by law enforcement for the purpose of identifying where to target overweight vehicle enforcement.27 There are plans to deploy more WIM sites in outstate Minnesota that will help to better identify where the need is for better enforcement of overweight vehicles. In addition, Ted noted that a research study will be undertaken using WIM data to investigate how MnDOT and law enforcement can use the data and determine where enforcement would be most needed, as well as by the time of day for when overweight vehicles are traveling. In addition, Ben Timerson with the TDA office noted that some data is currently being shared in real-time with enforcement personnel for enhanced enforcement at 11 of the WIM sites.28 State patrol officers parked near the site can access the data and receive a camera image and notification when a commercial vehicle is deemed overweight by the WIM sensors. State patrol officers can then act upon the notification and lead the vehicle to a static weigh scale where more specific weight data is gathered for the purposes of issuing a citation to the driver. Ben Timerson also noted that license plate reader (LPR) technology has been tested at a WIM site in Winona as a means of permit enforcement for oversize / overweight vehicles.29 However, given the challenges in utilizing camera images of license plates for enforcement by state patrol, this effort will not be continued on a statewide basis. These challenges included state legislation regarding the length of time which images could be stored and collected, as well as the state patrol staff that would be required to issue citations based on the LPR data that had been collected. Given the efforts associated with the efficiency of freight movement, permitting, and credentialing process, an adequate analysis of the problem has not been completed to date. Further data to be gathered could include WIM station data that would provide detailed information about overweight
Minnesota Strategic ITS Research and Development Plan August 2015
19
vehicle statistics through the state and where an increased enforcement could be focused on commercial vehicle compliance as well as preserving roadway and bridge infrastructure in those areas. 3.4.3 Objective E-3: Improve travel time reliability for freight, transit and businesses
This objective is focused on the problem associated with travel time reliability specifically for commercial vehicles and public transit vehicles that can have a negative impact on businesses and regional economies in general. Improving the reliability of travel times between the destinations of commercial and public transit vehicles can have a positive impact on the efficiency of freight movement and the regional economy in general. This objective is closely related to Objective C-2 that focuses on improving travel time reliability in general for the transportation system. It was previously noted that an adequate analysis of Objective C-2 has not been completed, but that existing studies and reports are underway to further address the objective. 3.4.4 Objective E-4: Increase agency efficiency
This objective is focused on the problem associated with agency level inefficiencies, not only with respect to commercial vehicle operations on Minnesota roads and highways, but also with respect to transportation operations in general. The objective can be achieved through improved sharing of information with regards to freight and commercial vehicle operations, as well as improved information sharing and reporting capabilities throughout the state. With regards to the efficiency of reporting on traveler information through the 511 system and other dissemination methods, Brian Kary of MnDOT has noted that MnDOT has not performed an internal efficiency review in terms of information accuracy and reliability.30 However, there are recent federal requirements that MnDOT does plan to follow to demonstrate the timeliness of its real-time information. The FHWA has developed a Real-Time System Management Information Program that sets the minimum requirements, such as timeliness and reliability, for state DOT’s to follow in demonstrating their data collection and reporting efficiency.31 MnDOT plans to complete a reporting procedure for only the metro area by a reporting deadline of November 2014. Similar reporting information on additional “routes of significance” in the outstate areas will be required by November of 2016. While there is a process that will be identified for the metro area, it is unknown at this point how MnDOT will report on additional routes of significance to meet the November 2016 reporting deadline. Given the current efforts at reporting on the efficiency of traveler information within the metro area, reporting on traveler information accuracy and efficiency in outstate Minnesota remains an area in which an adequate analysis has not been performed. Coordination with MnDOT staff currently working on the metro area reporting process could be beneficial to understand the data that would need to be collected to report on outstate information accuracy and efficiency. 3.4.5 Objective E-5: Reduce vehicle operating costs
This objective focuses on the problem associated with high vehicle operating costs that can result from congestion and delay on the transportation system. As congestion rises, vehicle operating costs rise from increased braking, accelerating and operating time, which in turn lead to increased fuel consumption and vehicle maintenance activities.

Minnesota Strategic ITS Research and Development Plan August 2015
20
In general, the objective of reducing vehicle operating costs can be achieved through reducing overall delay associated with recurring and non-recurring congestion, which is discussed under Objectives B-1, B-3, and C-1. As noted previously, an adequate analysis of Objectives B-1 and C-1 has been performed, though an adequate analysis of Objective B-3 has not been performed. Given this relationship between these objectives, Objective E-5 is not recommended for further analysis. 3.4.6 Objective E-6: Enhance efficiency at borders
Border crossings are potential bottlenecks in the freight transportation network. This objective is developed to address the problem of lengthy crossing times at Minnesota-Canada border crossings for commercial vehicles that may be caused due to time required for inspection and clearance as well as increased freight traffic on both sides of the border. Reducing crossing times can thus enhance the efficiency of freight shipments via border crossings and increase economic productivity in the state. The FHWA has published a series of reports focused on calculating border crossing times at several crossing points throughout the country. These studies provided guidance on estimating crossing times to use as a benchmark for evaluation,32 as well as evaluating sensor technologies that could potentially calculate truck travel times at border crossing sites.33 Given that an estimate of commercial vehicle crossing times between Minnesota and Canada is not actively monitored or reported on, these studies can provide assistance to MnDOT in developing measures for future reporting. John Tompkins from MnDOT noted that freight traffic between Minnesota and Canada is primarily transported via rail lines as opposed to commercial vehicles.34 The major commercial vehicle crossing that impacts Minnesota occurs at the I-29 crossing on the eastern edge of North Dakota. That crossing provides commercial vehicles with more capacity and the route contains infrastructure sufficient to support travel on both the Canadian side of the border and the North Dakota side down to the I-29 / I-94 interchange that leads into Minnesota. The volume of freight transported at the border is the primary concern of MnDOT and North Dakota DOT (NDDOT) staff that supports freight operations at the border. While there is coordination between MnDOT and NDDOT, implementing ITS technologies to reduce the inspection and clearance time for commercial vehicles would primarily be the responsibility of NDDOT. While there is no known data collected by MnDOT for measured border crossing times that can be evaluated as a performance measure, there are options for pre-screening that can reduce inspection time. The NEXUS program is administered by the U.S. Customs and Border Protection (CBP) and allows travelers expedited processing at dedicated processing lanes at a number of border ports of entry, as well as specific Canadian preclearance airports and marine reporting locations.35 A Radio Frequency Identification (RFID) card is issued that communicates the pre-screening information and simplifies passage for pre-approved travelers. The increased usage of this program can increase the efficiency of inspection by CBP staff and generally reduce overall crossing times. In summary, while there is data available with respect to freight volumes crossing the border with Canada, an adequate analysis of the problem with respect to crossing times has not been completed. Additional data that would need to be gathered would include crossing times and an evaluation of the times at key crossing points would need to be performed to understand which crossing points would benefit the most from ITS and/or technology improvements.

Minnesota Strategic ITS Research and Development Plan August 2015
21
3.5 Objective F: Preserve the Transportation System
3.5.1 Objective F-1: Safeguard existing infrastructure
This objective is focused on the problem associated with monitoring and maintaining the health of existing transportation infrastructure throughout the state that can deteriorate over time from usage by heavy vehicles and large amounts of traffic in general, as well as damage from inclement weather events, such as flooding and tornados. MnDOT annually publishes performance measures with respect to Asset Management that focus on Ride Quality and Bridge Condition.36 The Ride Quality measure is assessed using a Ride Quality Index, which is a measure of pavement smoothness as perceived by the typical driver. The measure reports on the percent of the system that is perceived as poor by drivers, which may cause them to use an alternate route or slow their travel speeds. Bridge Condition is calculated from the results of inspections performed at least every two years on all state highway bridges part of the National Highway System (NHS). The amount of NHS bridges in “poor” condition as a percentage of all NHS bridge deck area in the state is reported on an annual basis. Those bridges rated as poor are still deemed safe to drive on, but have reached a point where significant repair or bridge replacement is needed. Ted Coulianos noted that WIM sites used for data collection purposes on overweight vehicles can support the effort identifying where overweight vehicles may be traveling over bridge infrastructure that has been deemed to be in a poor or critical condition.37 For example, it is known where permitted overweight vehicles carrying timber products or sugar beets during harvesting season may begin their travel through the state, but the exact routes they take across various bridges throughout the state are not known. Additional WIM sites could provide more data on where overweight vehicles are traveling and provide information on whether travel on critical bridge infrastructure should be prohibited from further travel by overweight vehicles to limit further stress on that infrastructure. Ted Coulianos also noted that portable WIM sites are currently being tested and evaluated by the State Patrol as a supplement to the fixed WIM sites. State Patrol is testing three different systems from various manufacturers to evaluate the different operational features of the systems, as well as understand how the systems meet their needs for overweight vehicle enforcement purposes. Unlike the fixed WIM sites, the portable WIM sites are limited to measuring vehicles traveling around 30 MPH, but they could provide State Patrol with data that they do not currently receive from the fixed WIM sites on when enforcement could best be targeted. The evaluation is expected to be completed in 2016, at which time further recommendations may be made on the use of portable WIM sites, which could be placed near bridge infrastructure that is in either a poor or critical condition. A recent report was also completed in March 2014 on the use of acoustic monitoring tools as a health monitoring systems for fracture-critical bridges.38 The overall goal of the project was to demonstrate that acoustic emission technology could be used for global monitoring of fracture-critical steel bridges. The report documents the acquisition, testing and installation of a 16-sensor acoustic emission monitoring system in the Cedar Avenue Bridge, which is a fracture-critical tied arch bridge in Burnsville, Minnesota and involved the collection of field data for a period of 22 months. The report was successful in its demonstration that the technology could be used for global monitoring of fracture-critical steel bridges. With respect to damage to transportation infrastructure from inclement weather events, there are not many readily available reports regarding the impacts of flooding events on the health of the

Minnesota Strategic ITS Research and Development Plan August 2015
22
infrastructure. Flood protection infrastructure, such as dams and river dikes, has been installed in various locations along the Red River valley to prevent damages during major flooding events. The need for additional investment in the Fargo-Moorhead is well understood and current efforts are underway at a comprehensive solution to address river flooding and its impact on surrounding transportation and other infrastructures. Also, as discussed under Objective D – Improve the Security of the Transportation System, CCTV cameras with infra-red capabilities have been installed at critical infrastructure areas under the I-35W bridge over the Mississippi River in Minneapolis, with plans to expand the use of these cameras to the US 61 bridge in Hastings, MN. These cameras can confirm the presence of suspicious individuals that can be used to alert law enforcement personnel of the need to address potential concerns in those areas. In summary, while MnDOT has gathered data on the conditions of road and bridge infrastructure, as well as data on overweight vehicles traveling in specific areas of the state, an adequate analysis of the problem associated with maintaining the health of existing transportation infrastructure has not been completed. Additional data that would need to be gathered could include sensor data that could alert MnDOT staff to when roadway and bridge conditions deteriorate over time in existing infrastructure. Additional analysis of WIM station data on the presence of overweight vehicles traveling throughout the state could also be performed to identify potential areas where targeted enforcement may be necessary or where travel by overweight vehicles could be prohibited to protect critical road and bridge infrastructure.
3.6 Objective G: Enhance the Integration and Connectivity of the Transportation System
3.6.1 Objective G-1: Aid in transportation infrastructure and operations planning
This objective aims to address the problem of being able to use quantitative data to support transportation infrastructure and operations planning. There are current efforts at the federal level related to the SHRP2 program in which MnDOT is near the completion of a report on estimating travel time reliability along three segments of roadway throughout the state. The findings of the report will help to understand the causes of congestion experienced along those segments under recurring and non-recurring conditions. Mike Sobolewski of MnDOT has been involved with the report and has noted that a future pilot project in the metro area will aim to refine and automate the methods of estimating travel time reliability.39 Ultimately, the process could be applied to estimating travel time reliability on a statewide basis which could also be used for planning purposes going forward. This would be related to performance measure reporting required under the future federal transportation authorization bill known as MAP-21 (Moving Ahead for Progress in the 21st Century). Brian Kary of MnDOT has also noted that MnDOT is currently using a Performance Monitoring System (PeMS) to analyze vast amounts of ITS data going back to 1995 to understand travel patterns in the region and assist in decision making with regards to infrastructure projects. Corridor studies that are performed prior to construction projects can utilize CORSIM and VISSIM simulations that are calibrated against historical data within PeMS for specific roadways and corridors. This calibration of the modeling processes is performed before roadway alternatives are proposed, thus improving the quality of the alternatives being recommended on a corridor project.

Minnesota Strategic ITS Research and Development Plan August 2015
23
The Federal Highway Administration (FHWA) has also made available benefit-cost analysis tools that could assist MnDOT with the decision to expand the use of various ITS deployments. The Tool for Operations Benefit Cost Analysis (TOPS-BC) is a planning-level decision support model that can provide benefit/cost analysis guidance on a wide range of operations strategies.40 The primary purpose of the tool is to screen multiple types of strategies that could be used by transportation practitioners and provide quantitative order-of-magnitude estimates in terms of benefits and costs. While existing studies and reports are underway to understand how data on travel time reliability could be used for planning purposes, an adequate analysis of the problem has not been completed at this point. Additional efforts needed would include the completion of the pilot project noted earlier, as well as additional travel time data gathered in a similar manner as the study to be completed under the SHRP2 program. The successful use of this data for federal performance measure reporting would be needed to understand if the objective is adequately being achieved. 3.6.2 Objective G-2: Reduce need for new facilities
This objective is focused on addressing the general problem associated with the need for new transportation facilities to support travelers on Minnesota roads and highways. Potential methods for achieving this objective could be related to existing efforts under Objectives B and C that are focused on reducing travel congestion and delay, as well as efforts under Objective E focused on improving freight efficiency throughout the state. As noted previously, MnDOT annually publishes performance measures with respect to asset management that focus on ride quality and bridge condition. These measures together can indicate the progress towards maintaining existing facilities which can indirectly determine the need for new facilities on a statewide basis. An adequate analysis of the problem associated with pavement and infrastructure conditions has been performed. Given the close relationship between the congestion/delay aspect of this objective and Objectives B and C mentioned above, additional analysis for this objective can be achieved through the analyses of those related objectives. As such, this objective is not recommended for further analysis.
3.7 Objective H: Reduce Environmental Impacts
3.7.1 Objective H-1: Reduce emissions/energy impacts and use associated with congestion
This objective is focused on addressing the general problem associated with high levels of emissions and excess consumption of fuel that results from congestion (recurring and non-recurring). MnDOT tracks fuel consumption as an existing performance measure, with the goal to reduce fuel consumption from previous years. The current measurement of fuel consumption tracks all taxable sales of gasoline and diesel fuel in the state, and to be consistent with other reports, it includes sales of gasoline and diesel for off-road use (for boats, ATVs, dirt bikes, snowmobiles), but does not include sales of fuel for aviation. The MnDOT 2012 Transportation Results Scorecard41 noted that fuel consumption rose slightly in 2012 but is still below its 2004 peak. The report tracks fuel use as a proxy for transportation's impact on air quality. In general, lower amounts of fuel consumption will have a positive impact on air quality.

Minnesota Strategic ITS Research and Development Plan August 2015
24
The Minnesota Pollution Control Agency (MPCA) is required to gather data and publish reports on measures of emissions from various sectors of the state, including transportation, given the state’s 2007 Next Generation Energy Act that has established a goal to reduce greenhouse gas (GHG) emissions to a level 15% below 2005 emissions by 2015. In 2010, it was reported that GHG emissions in Minnesota declined by about 3% over the 2005 to 2010 timeframe, with the most significant reductions coming from electric power utilities and transportation energy use42. It was also noted in the report that from 2005 to 2008, total transportation emissions decreased by about 10%. A general conclusion of the MPCA report is that the decline in Minnesota’s economic output and resulting decrease in energy were the primary drivers in the decrease in GHG emissions. While there is data available on the fuel consumption and emissions from these sources, there is no specific report tied to reductions in emissions that are the direct result of reductions in congestion, either recurring or non-recurring. This would require more detailed and site-specific data collection on emissions resulting from transportation, which would likely prove cost-prohibitive given the efforts involved in measuring and isolating emissions from transportation. Rather, it is generally assumed that a reduction in traffic congestion will lead to reductions in emissions and fuel consumption. Therefore, this objective is not recommended for further analysis. Potential methods for achieving this objective could be related to existing efforts under Objectives B and C that are focused on reducing travel congestion and delay, as well as efforts under Objective E focused on improving freight efficiency throughout the state. Therefore, Objective H-1 is not recommended for further analysis. 3.7.2 Objective H-2: Reduce negative impacts of the transportation system on communities
This objective is focused on addressing the general problem associated with negative impacts on communities that result from decreased air quality from high levels of vehicle emissions and fuel consumption in the transportation system. In general, it can be assumed that air quality has an inverse relationship with vehicle emissions that result from fuel consumption within the transportation system. As emissions and fuel consumption increase, air quality decreases from higher levels of carbon dioxide in the atmosphere. As noted earlier under Objective H-1, fuel consumption is tracked by MnDOT as a performance measure and the MPCA produces a report on GHG emissions from various sectors of the state. However, while there is data available from these sources, there is no specific report that can quantify the inverse relationship between air quality and vehicle emissions that result from fuel consumption. This would require more detailed and site-specific data collection on air quality within specific communities and the levels of emissions resulting from transportation in those communities, which would likely prove cost-prohibitive given the efforts involved in measuring and isolating emissions within specific communities. Therefore, this objective is not recommended for further analysis. Additional efforts to reduce negative impacts of the transportation system on communities come from the use of environmentally friendly de-icing materials used on roadways during winter maintenance activities. The Minnesota Maintenance Operations Research (MOR) program performs research efforts that include snow and ice control technology / winter maintenance activities. One example of a recent project with respect to de-icing chemicals involved measuring the amount of salt brine mixed with rock salt. Applying salt brine to rock salt allows for the salt to melt ice faster, and also reduces the amount of

Minnesota Strategic ITS Research and Development Plan August 2015
25
rock salt needed for winter maintenance, which has a secondary impact of reducing the negative impact of salt on nearby lakes and rivers. MnDOT has also participated in past years in the Maintenance Decision Support Systems (MDSS) Pooled Fund Study led by the FHWA. The purpose of the MDSS study is to develop a system that analyzes real-time information on road and air temperatures (among other variables) collected from snow plows and other weather stations and recommends treatment during winter activities. The recommendations take into account the amount upcoming weather forecasts to determine how much chemicals should be applied and when to apply them. While the recommendations are intended as a guide for maintenance supervisors and snow plow operators, agencies could realize cost savings in terms of the amount of chemicals used to treat roadways, which can also have a secondary impact of reducing the negative impacts caused to nearby lakes and rivers from excessive road salt usage. Potential methods for achieving Objective H-2 could be related to existing efforts under Objectives B and C that are focused on reducing travel congestion and delay, as well as efforts under Objective E focused on improving freight efficiency throughout the state. Therefore, Objective H-2 is not recommended for further analysis.
3.8 MAP-21 Performance Measures
Within the framework of the federal transportation reauthorization of MAP-21 (Moving Ahead for Progress in the 21st Century), MnDOT will be required to establish performance measures in the seven general categories listed below:
1. Pavement condition on the Interstate System and on remainder of the National Highway System (NHS)
2. Performance of the Interstate System and the remainder of the NHS 3. Bridge condition on the NHS 4. Fatalities and serious injuries—both number and rate per vehicle mile traveled--on all public
roads 5. Traffic congestion 6. On-road mobile source emissions 7. Freight movement on the Interstate System
A number of these performance measure categories are reflected in the MnDOT ITS development objectives in the previous sections of this document.
3.9 Identification of ITS Development Objectives for Further Analysis
Findings of the analysis of previous work relevant to the Minnesota ITS development objectives are summarized below. Findings are presented in three categories:
Objectives with an adequate analysis preformed
Objectives with incomplete analysis performed
Objectives with no analysis performed Table 2 summarizes the findings as related to the three categories with information on the status and current gaps of the analysis for each objective.

Minnesota Strategic ITS Research and Development Plan August 2015
26
Table 2. Findings of the Analysis of Previous Work
Objective Status/Note
1. Objectives with Adequate Analysis
No ITS development objectives were assessed as having an adequate analysis of the associated problems.
2. Objectives with Incomplete Analysis
B-1: Reduce overall delay associated with congestion
Adequate analysis has been performed on metro freeways; analysis for arterials is underway and additional analysis may be needed; an adequate analysis on roadways in Greater Minnesota has not been performed
B-2: Increase average vehicle occupancy and facility throughput
Partial analysis has been performed
B-3: Reduce delays due to work zones Analysis is underway; data to support an adequate analysis may not exist
C-1: Reduce congestion and incident-related delay for travelers
An adequate analysis has been performed on metro freeways; an adequate analysis has not been performed on arterials; potential gaps in arterial data collection.
C-2: Improve travel time reliability
An adequate analysis has been performed on MnPASS lanes; an adequate analysis has not been performed on freeway general purpose lanes or arterials; potential gaps in arterial data collection.
C-4: Reduce stress caused by transportation Closely related to Objectives C-1 and C-2
E-1: Reduce travel time for freight, transit and businesses
Directly related to Objectives B-1 and C-1
E-2: Improve the efficiency of freight movement, permitting and credentials process
Further analysis of overweight freight vehicle movement in the state could be performed through use of additional WIM station data.
E-3: Improve travel time reliability for freight, transit and businesses
Closely related to Objective C-2
E-4: Increase agency efficiency Some analysis has been performed but additional analysis is needed
E-5: Reduce vehicle operating costs Can be achieved through reducing overall delay associated with recurring and non-recurring congestion (Objectives B-1, B-3, and C-1)
E-6: Enhance efficiency at borders Some analysis has been performed
F-1: Safeguard existing infrastructure Some analysis has been performed; additional sensor data could reveal more on conditions of infrastructure
G-1: Aid in transportation infrastructure and operations planning
Analysis is underway; additional analysis may be needed

Minnesota Strategic ITS Research and Development Plan August 2015
27
Objective Status/Note
G-2: Reduce need for new facilities Partial analysis is performed; additional analysis needed can be achieved through the analyses of Objectives B and C
H-1: Reduce emissions/energy impacts and use associated with congestion
Objective can be achieved through a reduction in traffic congestion which is closely related to Objectives B and C
H-2: Reduce negative impacts of the transportation system on communities
Can be achieved through reducing overall delay associated with recurring and non-recurring congestion (Objectives B-1, B-3, and C-1)
3. Objectives with No Analysis Performed
B-4: Reduce traffic delays during evacuation from homeland security and Hazmat incidents
No analysis has been performed
C-3: Increase choice of travel modes No analysis has been performed
D-1: Enhance traveler security No analysis has been performed
D-2: Safeguard the motoring public from homeland security and/or Hazmat incidents
Closely related to Objective D-1. No analysis has been performed.
As presented in Table 2, the majority of objectives have some analysis performed but such analysis is not complete or additional analysis is underway. No research and studies have been identified on the four objectives listed towards the bottom of Table 2. In order to provide recommendations for further analysis, it is necessary to identify data needed and availability for performing an adequate analysis for those objectives that currently do not have an adequate analysis completed. Table 3 summarizes the availability or gaps of data needed for an adequate analysis for those objectives.
Table 3. Gaps in Analyses and Data Availability
Objective Analysis Gap Data Availability
Objectives with Incomplete Analysis
B-1: Reduce overall delay associated with congestion
An analysis on metro arterials
An analysis of outstate freeways and arterials
Data exists with respect to analyzing delay and congestion on metro freeways. Data to support an adequate analysis on metro arterials are available but additional data collection may be needed. Data to support an analysis on outstate roadway is limited but may be sufficient for analyses on specific corridors.

Minnesota Strategic ITS Research and Development Plan August 2015
28
Objective Analysis Gap Data Availability
B-2: Increase average vehicle occupancy and facility throughput
An analysis on trends/changes in MnPASS lanes
An analysis on urban arterials and outstate roadway throughputs
Data exists with respect to analyzing decline in the number of carpoolers. Data exists to support an analysis of throughput on metro freeway, but additional data is needed for an analysis on arterials and outstate roadways.
B-3: Reduce delays due to work zones
Efforts are underway to estimate delay in work zones prior to construction, and then compare that estimate to actual delays measured through the work zones
Data is available to support an adequate analysis.
C-1: Reduce congestion and incident-related delay for travelers
An analysis on metro arterials
An analysis of outstate freeways and arterials
Data exists with respect to analyzing delay and congestion on metro freeways. Data to support an adequate analysis on metro arterials are available but additional data collection may be needed. Data to support an analysis on outstate roadway is limited but may be sufficient for analyses on specific corridors.
C-2: Improve travel time reliability
An analysis on metro freeways and arterials
Data to support an adequate analysis on metro freeways are available. Additional travel time data collection on arterials is needed for an analysis on arterials.
C-4: Reduce stress caused by transportation
An adequate analysis can be supported through analyzing Objectives C-1 and C-2
See above for Objectives C-1 and C-2.
E-1: Reduce travel time for freight, transit and businesses
An adequate analysis can be supported through analyzing Objectives B-1 and C-1
See above for Objectives B-1 and C-1.
E-2: Improve the efficiency of freight movement, permitting and credentials process
Analysis of movement of overweight vehicles based on data from WIM sites.
Data is available from WIM sites and requires further research to determine how the data can be used to understand overweight freight movement in the state.
E-3: Improve travel time reliability for freight, transit and businesses
An adequate analysis can be supported through analyzing Objective C-2
See above for Objective C-2.

Minnesota Strategic ITS Research and Development Plan August 2015
29
Objective Analysis Gap Data Availability
E-4: Increase agency efficiency
Many areas with respect to agency efficiency can be analyzed, including efficiency regarding data collection, processing and dissemination; implementation of operational and management strategies; asset management; and decision-making process
Data to support certain areas of analysis is available but may not be sufficient to perform an adequate analysis for all areas.
E-5: Reduce vehicle operating costs
An adequate analysis can be supported through analyzing Objectives B-1, B-3 and C-1
See above for Objectives B-1, B-3, and C-1.
E-6: Enhance efficiency at borders
Evaluation of crossing times and delay at key crossing points
Freight volume data crossing the border is available. Border crossing times for commercial vehicles need to be collected.
F-1: Safeguard existing infrastructure
Sensor data that could reveal more on conditions of infrastructure
Some ITS data has been collected through a bridge monitoring study in 2014, but is not widely used on other infrastructure.
G-1: Aid in transportation infrastructure and operations planning
Evaluation of how ITS data is used for planning, operations and management
Some ITS data is collected and stored in systems such as PeMS, MDSS and other databases. Additional data may need to be collected, and data management tools may need to be enhanced.
G-2: Reduce need for new facilities
Additional analysis can be supported through analyzing Objectives B-1, B-2, B-3, C-1 and C-2
See above for Objectives B-1, B-2, B-3, C-1 and C-2.
H-1: Reduce emissions/energy impacts and use associated with congestion
Additional analysis can be supported through analyzing Objectives B-1, B-2, B-3, and C-1
See above for Objectives B-1, B-2, B-3, and C-1.
H-2: Reduce negative impacts of the transportation system on communities
Additional analysis can be supported through analyzing Objectives B-1, B-3, and C-1
See above for Objectives B-1, B-3, and C-1. Data from MDSS is available to support an analysis of impacts of winter operations on environment.
Objectives with No Analysis Performed
B-4: Reduce traffic delays during evacuation from homeland security and Hazmat incidents
Traffic management plans were developed but no studies based on actual data have been performed
Data to support an adequate analysis related to evacuation is not currently available.

Minnesota Strategic ITS Research and Development Plan August 2015
30
Objective Analysis Gap Data Availability
C-3: Increase choice of travel modes
Studies have been performed at a national level
Additional analysis is needed to understand how policies impact travel demand and modal choices
Data at a national level is available to support studies using a software tool recently developed through SHRP2.
D-1: Enhance traveler security
An analysis has not been performed
Data to support an adequate analysis is not available. May need to collect perception data from the public.
D-2: Safeguard the motoring public from homeland security and/or Hazmat incidents
An analysis has not been performed
Data to support an adequate analysis is not available.
Based on the above findings and discussion with MnDOT, the following objectives are selected for further analysis:
Objective B-1: Reduce overall delay associated with congestion.
Objective B-3: Reduce delays due to work zones.
Objective C-1: Reduce congestion and incident-related delay for travelers.
Objective C-2: Improve travel time reliability.

Minnesota Strategic ITS Research and Development Plan August 2015
31
4. Analysis of ITS Development Objectives
This section provides a more in-depth analysis of the ITS development objectives that were selected for further analysis. This purpose of this analysis is to facilitate identification of emphasis areas for ITS development as well as potential ITS strategies and solutions. This analysis along with identified emphasis areas will help MnDOT to objectively and quantitatively measure the effectiveness potential ITS strategies and solutions in achieving the corresponding ITS development objectives. ITS development objectives selected for this analysis include:
Objective B-1: Reduce overall delay associated with congestion
Objective B-3: Reduce delays due to work zones
Objective C-1: Reduce congestion and incident-related delay for travelers
Objective C-2: Improve travel time reliability
4.1 General Causes of Congestion
As noted in discussion of Objectives B-1 and C-1 previously, traffic congestion is generally categorized as recurring and non-recurring. Recurring congestion is due to the number of vehicles trying to use the highway system exceeds the available capacity. The three main causes of non-recurring congestion are: incidents, ranging from a flat tire to an overturned hazardous material truck; work zones; and weather. Nearly half of all congestion caused on roadways can be considered as recurring and the other half can be considered as non-recurring. Figure 1 contains a percentage summary of the types of congestion, where bottlenecks and poor signal timing represent recurring congestion and other types represent non-recurring congestion.43
Figure 1. General Sources of Traffic Congestion on Roadways Further studies have attempted to quantify the amount of time that is lost to due to congestion. A study funded by the FHWA in 2004 found that non-recurring congestion, such as work zones, adverse weather conditions, and traffic incidents, caused over three and a half billion estimated vehicle-hours of

Minnesota Strategic ITS Research and Development Plan August 2015
32
delay on U.S. freeways and principal arterials in 1999, which translated into nearly six billion person-hours of delay. This study included all urban and rural freeways and principal arterials in the nation’s highway system for 1999. The highways within the scope of the study accounted for about 54 percent of the highway vehicle-miles of travel (VMT) in 199944. Figure 2 compares the vehicle hours to other studies completed by the Texas Transportation Institute (TTI).
Figure 2. General Sources of Traffic Congestion on Roadways While these two studies provide high-level estimates of congestion by type, further studies have not examined traffic congestion to a greater level of detail that would identify precisely why those types of traffic congestion occur, and precisely what amount of congestion could be reduced with the implementation of various types of ITS solutions. As noted earlier, the following analysis in this section will help to identify Emphasis Areas for ITS development, as well as potential ITS strategies and solutions, to help MnDOT measure the effectiveness of the potential ITS strategies and solutions in achieving the corresponding ITS development objectives.
4.2 Performance Measures
Performance measures can be used to evaluate and provide a good representation of how well the ITS development objectives are met. Table 4 identifies the key performance measures related to the ITS development objectives that are selected for further analysis. The key performance measures listed in Table 4 were selected from a larger set of relevant performance measures based on factors including
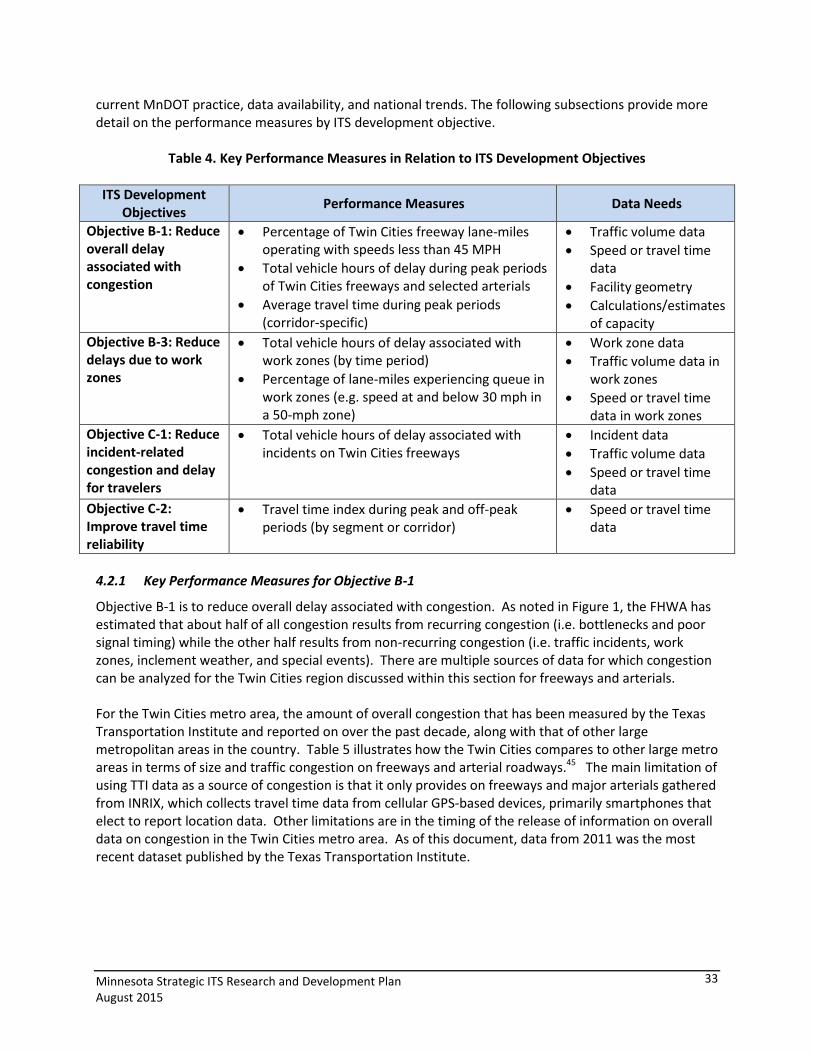
Minnesota Strategic ITS Research and Development Plan August 2015
33
current MnDOT practice, data availability, and national trends. The following subsections provide more detail on the performance measures by ITS development objective.
Table 4. Key Performance Measures in Relation to ITS Development Objectives
ITS Development Objectives
Performance Measures Data Needs
Objective B-1: Reduce overall delay associated with congestion
Percentage of Twin Cities freeway lane-miles operating with speeds less than 45 MPH
Total vehicle hours of delay during peak periods of Twin Cities freeways and selected arterials
Average travel time during peak periods (corridor-specific)
Traffic volume data
Speed or travel time data
Facility geometry
Calculations/estimates of capacity
Objective B-3: Reduce delays due to work zones
Total vehicle hours of delay associated with work zones (by time period)
Percentage of lane-miles experiencing queue in work zones (e.g. speed at and below 30 mph in a 50-mph zone)
Work zone data
Traffic volume data in work zones
Speed or travel time data in work zones
Objective C-1: Reduce incident-related congestion and delay for travelers
Total vehicle hours of delay associated with incidents on Twin Cities freeways
Incident data
Traffic volume data
Speed or travel time data
Objective C-2: Improve travel time reliability
Travel time index during peak and off-peak periods (by segment or corridor)
Speed or travel time data
4.2.1 Key Performance Measures for Objective B-1
Objective B-1 is to reduce overall delay associated with congestion. As noted in Figure 1, the FHWA has estimated that about half of all congestion results from recurring congestion (i.e. bottlenecks and poor signal timing) while the other half results from non-recurring congestion (i.e. traffic incidents, work zones, inclement weather, and special events). There are multiple sources of data for which congestion can be analyzed for the Twin Cities region discussed within this section for freeways and arterials. For the Twin Cities metro area, the amount of overall congestion that has been measured by the Texas Transportation Institute and reported on over the past decade, along with that of other large metropolitan areas in the country. Table 5 illustrates how the Twin Cities compares to other large metro areas in terms of size and traffic congestion on freeways and arterial roadways.45 The main limitation of using TTI data as a source of congestion is that it only provides on freeways and major arterials gathered from INRIX, which collects travel time data from cellular GPS-based devices, primarily smartphones that elect to report location data. Other limitations are in the timing of the release of information on overall data on congestion in the Twin Cities metro area. As of this document, data from 2011 was the most recent dataset published by the Texas Transportation Institute.

Minnesota Strategic ITS Research and Development Plan August 2015
34
Table 5. Annual Hours of Delay Measured from Texas Transportation Institute Urban Mobility Report
Minneapolis Saint Paul Area and Roads 2002 2003 2004 2005 2006 2007 2008 2009 2010 2011
Population (1,000's) 2,440 2,475 2,490 2,520 2,570 2,620 2,670 2,697 2,730 2,757
Rank 16 16 16 16 16 16 16 16 16 16
Peak Period Travelers (1,000's) 1,313 1,351 1,367 1,391 1,429 1,467 1,506 1,527 1,551 1,571
Commuters (1,000's) 1,220 1,255 1,270 1,292 1,327 1,363 1,399 1,418 1,441 1,460
Freeway Daily VMT's (1,000's) 27,300 27,580 27,400 28,140 28,610 29,000 28,835 29,300 30,085 30,383
Lane-Miles (1,000's) 1,590 1,590 1,600 1,630 1,660 1,700 1,780 1,835 1,965 2,054
Arterial Daily VMT's (1,000's) 23,105 23,205 23,535 23,830 24,000 24,350 24,475 23,741 23,685 23,919
Lane-Miles (1,000's) 4,785 4,800 4,850 5,005 5,100 5,220 5,250 5,270 5,289 5,289
Congested Travel (% of Peak VMT) 13% 11% 10% 10% 6% 4% 1% -12% -10% -10%
Congested System (% of lane-miles) -10% -11% -11% -11% -20% -19% -16% -26% -25% -24%
Number of Rush Hours
(time when system may be congested) 29% 15% 1% 17% 17%
Annual Hours of Delay (1,000's) 57,867 58,685 60,100 65,819 62,438 61,122 64,572 56,808 60,193 60,788
Rank of Large Metro Areas 19 20 19 19 20 20 17 19 19 19
Annual Hours of Delay per Peak Auto
Commuter 37 37 37 40 37 36 37 32 34 34
Rank of Large Metro Areas 42 45 54 43 53 54 35 47 44 44
Annual Congestion Cost (in Millions) 48% 43% 41% 49% 42% 42% 64% 42% 47% 47%
Rank of Large Metro Areas 21 20 20 18 20 20 19 19 19 19
Annual Congestion Cost per Auto
Commuter (dollars) 17% 16% 15% 23% 17% -16% -2% -17% -12% -11%
Rank of Large Metro Areas 50 52 52 45 53 58 42 55 45 45
Travel Time Index (MSP) 1.28 1.28 1.28 1.30 1.28 1.27 1.22 1.19 1.21 1.21
Large Metro Average 1.23 1.24 1.24 1.24 1.24 1.23 1.20 1.19 1.20 1.20
MSP Rank of Large Metro Areas 11 13 16 13 18 20 20 31 25 25
Commuter Stress Index 1.41 1.33 1.29 1.31 1.29
Large Metro Average 1.27 1.23 1.23 1.24 1.25
MSP Rank of Large Metro Areas 6 7 14 11 18
MSP System Performance Compared to Large Metro Areas
Minnesota Strategic ITS Research and Development Plan August 2015
35
Other sources of overall delay on Twin Cities freeways can be obtained from the MnDOT PeMS. PeMS is a real-time Archive Data Management System for transportation freeways and roadways that collects raw detector data in real-time. PeMS stores and processes the raw detector data, and then provides graphical, web-based interface that can be used to analyze the performance of the freeway system at varying scales and time periods that can be defined by system users. The main limitation of the PeMS for MnDOT is that will only allow for an analysis of ITS development objectives along state roadways where traffic detectors have been implemented for the purposes of monitoring traffic. Other limitations to using the data are noted within the data glossary and frequently asked questions portions of the PeMS website that is maintained by the system provider. While these limitations may restrict the deployment of ITS technologies in subsequent tasks of this project to areas only where detection has been implemented, the analysis of how effective the technologies are at achieving the ITS development objectives can be performed at a much greater level of detail that would otherwise not be possible in more rural areas of the state whose roadways are not equipped with detection. PeMS provides other detailed quantitative statistics that can be aggregated in a useful form to analyze how well ITS development objectives are being achieved on various scales, ranging from district-wide levels to corridor-specific levels defined by mileposts on MnDOT roadways. Data from PeMS can be gathered to report on the number and percentage of Twin Cities freeways that are operating with speeds less than 45 miles per hour, which is a key figure reported on within the Freeway Congestion Report developed by MnDOT on an annual basis. Table 6 provides 2014 data gathered from PeMS on the Top 50 bottlenecks in the Twin Cities metro area. The table also indicates where those bottlenecks were ranked in 2013. Bottlenecks are defined as specific locations, at a specific 5-minute time point, when there is a large enough speed drop from one detector station to the next. For each bottleneck, the duration, distance upstream, and the total delay are recorded. The bottlenecks are ranked by the number of days active column, which lists the number of days that a bottleneck was detected. Further details can be gathered from the PeMS help site on this subject46. Table 7 provides a more detailed at the top bottlenecks that were consistently ranked high among the Top 50 bottlenecks with across both 2013 and 2014. The top 10 bottlenecks comprise about 30% of the total delay in vehicle hours experienced among the top 50 bottlenecks from 2014, and about 36% of the average duration those bottlenecks were present. The top 20 bottlenecks account for 54% and 48%, respectively, of the total delay and average duration among the top 50 bottlenecks from 2014. Some of these bottlenecks can be considered as affected by work zone construction activity, such as the I-94 westbound corridor in Albertville at Co. Rd. 19, while some of them experience recurring congestion to geometric roadway limitations, such as the I-394 eastbound corridor approaching the Lowry Hill tunnel area. In general though, bottlenecks and traffic congestion result when vehicle demand for use of a roadway exceeds the capacity of the roadway to support travel at an acceptable speed.

Minnesota Strategic ITS Research and Development Plan August 2015
36
Table 6. 2014 MnDOT PeMS Data on Top 50 Freeway Bottlenecks in Twin Cities Metro Area
2014
Rank
2013
RankStation Name Type Shift Freeway
# Days
Active
Avg Extent
(Miles)
Avg Delay
(veh-hrs)
Avg
Duration
(mins)
1 9 55001210 Co Rd 19 ML NOON I94-W 363 2.01 558.81 297.98
2 12 55001210 Co Rd 19 ML PM I94-W 363 2 555.95 297.44
3 10 55001210 Co Rd 19 ML AM I94-W 363 2 319.5 292.88
4 7 55000076 T.H.65 ML PM I94-W 307 1.74 488.73 92.52
5 5 55000064 Franklin Ave ML PM SR65-N 294 2.8 336.14 183.52
6 55000196 France Ave ML PM I494-E 275 0.89 41.3 32.91
7 15 55000851 W. 7th St ML PM I35E-S 268 0.71 176.5 203.79
8 23 55000565 Park Ave ML PM I35W-N 258 1.31 218.51 99.88
9 55001494 Co Rd J ML PM I35E-N 257 0.31 30.48 167.41
10 4 55000586 Park Ave ML PM I35W-S 255 1.11 250.47 165.22
11 8 55000288 Dunwoody Blvd ML PM I394-E 254 1.67 461.89 149.47
12 55001077 Lexington Ave ML PM I694-E 254 1.45 208.28 89.86
13 16 55000316 Wooddale Ave ML PM SR62-E 248 2.41 381.05 123.43
14 55000196 France Ave ML NOON I494-E 248 0.88 86.93 76.53
15 19 55000141 S of I-394 ML PM I94-E 245 0.74 51.14 61.02
16 13 55000322 Portland Ave ML PM SR62-E 243 1.18 131.83 136.6
17 55001028 E Jct I-94 ML PM I694-E 242 1.24 167.45 114.75
18 20 55000192 E Bush Lake Rd ML PM I494-E 242 2.53 154.79 30.02
19 55000620 Jackson St ML PM I35E-N 241 0.68 195.25 161.31
20 22 55000141 S of I-394 ML AM I94-E 241 0.98 88.69 74.61
21 32 55000721 Co Rd 6 ML PM I494-W 239 1.44 56.58 35.63
22 36 55000478 Marth Rd ML PM I494-E 238 3.5 419.73 53.15
23 31 55000002 Franklin Ave ML PM SR65-S 235 3 592.41 111.02
24 44 55000409 27th St ML PM SR100-S 230 0.98 196.71 101.43
25 55000763 54th Ave ML PM US169-N 229 3.24 342.27 82.4
26 55000565 Park Ave ML AM I35W-N 228 1.63 300.64 92.52
27 46 55000281 E of T.H.100 ML PM I394-E 227 0.76 75.1 58.61
28 35 55000659 I-694 ML PM I35W-N 226 2.86 359.91 83.36
29 11 55000194 T.H.100 ML PM I494-E 226 1.85 66.95 21.19
30 55000935 France Ave ML PM SR100-N 224 1.61 268.27 104.44
31 25 55000592 Snelling Ave ML PM SR36-E 224 1.37 76.99 46.52
32 55000103 N of Tunnel ML PM I94-E 224 1.08 58.89 39.78
33 27 55000035 Cliff Rd ML AM I35W-N 219 1.74 166.45 74.25
34 43 55000851 W. 7th St ML AM I35E-S 218 0.62 144.27 284.95
35 24 55000066 France Ave ML PM SR62-E 217 1.69 224.28 76.18
36 14 55000086 LaSalle Ave ML PM I94-W 216 3.16 1284.9 150.44
37 45 55000386 T.H.7 ML PM SR100-N 215 1.68 354.31 105.49
38 55000720 S of Co Rd 6 ML PM I494-W 215 2.07 113.12 41.44
39 55000004 26th St ML PM I35W-S 214 0.62 47.44 38.88
40 37 55000062 26th St ML PM I35W-N 213 1.1 162.68 68.4
41 55001144 Anderson Lakes Pkwy ML AM US169-N 210 3.28 261.54 63.79
42 30 55000289 I-94 ML PM I394-W 210 1.18 182.17 93.05
43 55000851 W. 7th St ML NOON I35E-S 210 0.6 166.04 299.21
44 55000499 John Ireland Blvd ML PM I94-E 208 1.64 371.19 78.58
45 39 55000764 49th Ave ML PM US169-N 208 1.37 51.07 28.51
46 55001717 E of I-35W ML PM SR62-E 207 0.71 15.15 36.3
47 55001461 E of Rice St ML AM I694-W 204 1.5 168.7 83.38
48 55001112 T.H.101 ML PM I94-W 203 3.08 659.67 140.12
49 55000062 26th St ML AM I35W-N 200 1.88 200.5 43.6
50 55000076 T.H.65 ML NOON I94-W 199 0.83 83 45.75

Minnesota Strategic ITS Research and Development Plan August 2015
37
Table 7. Further Analysis of Top Freeway Bottlenecks in Twin Cities Metro Area
To fill the gap of understanding vehicle hours of delay on arterial roadways, MnDOT could use a similar system that is currently under development for arterial roadways. MnDOT is developing an Arterial Congestion Report as a complement the current Freeway Congestion Report currently released by MnDOT to illustrate the extent of delay on arterials where detailed delay data is gathered from SMART Signal equipment installed at a total 46 signal controller cabinets along TH 13 (12 signals), TH 55 (10 signals), TH 7 (19 signals), and TH 10 (5 signals). Similar to PeMS, an online tool has been developed to allow users to gather performance metrics on the amount of delay experienced at intersections. It is anticipated that the final report and website will be completed by the fall of 2015. Preliminary data from the report is illustrated in Table 8. Signalized approaches are “congested” if they operate at Level of Service “D” or worse (i.e. average delay > 35 seconds/Vehicle) during the AM and PM peak periods. Table 8 illustrates those signals along TH 55 that were operating with an average delay of 35 seconds or worse in September 2013.47 These figures can be converted into hours of congestion experienced on a daily basis as well through the use of the SMART signal equipment.
Bottleneck2014
Rank
2013
RankStation Freeway Crossroad Type Shift
# Days
Active
Avg Extent
(Miles)
Avg Delay
(veh-hrs)
Avg Duration
(mins)
1 1 9 55001210 I94-W Co Rd 19 ML NOON 363 2.01 558.81 297.98
2 5 5 55000064 SR65-N Franklin Ave ML PM 294 2.8 336.14 183.52
3 4 7 55000076 I94-W T.H.65 ML PM 307 1.74 488.73 92.52
4 3 10 55001210 I94-W Co Rd 19 ML AM 363 2 319.5 292.88
5 2 12 55001210 I94-W Co Rd 19 ML PM 363 2 555.95 297.44
6 10 4 55000586 I35W-S Park Ave ML PM 255 1.11 250.47 165.22
7 11 8 55000288 I394-E Dunwoody Blvd ML PM 254 1.67 461.89 149.47
8 7 15 55000851 I35E-S W. 7th St ML PM 268 0.71 176.5 203.79
9 13 16 55000316 SR62-E Wooddale Ave ML PM 248 2.41 381.05 123.43
10 16 13 55000322 SR62-E Portland Ave ML PM 243 1.18 131.83 136.6
3,660.87 1,942.85
30% 36%
11 8 23 55000565 I35W-N Park Ave ML PM 258 1.31 218.51 99.88
12 15 19 55000141 I94-E S of I-394 ML PM 245 0.74 51.14 61.02
13 18 20 55000192 I494-E E Bush Lake Rd ML PM 242 2.53 154.79 30.02
14 29 11 55000194 I494-E T.H.100 ML PM 226 1.85 66.95 21.19
15 20 22 55000141 I94-E S of I-394 ML AM 241 0.98 88.69 74.61
16 36 14 55000086 I94-W LaSalle Ave ML PM 216 3.16 1284.9 150.44
17 21 32 55000721 I494-W Co Rd 6 ML PM 239 1.44 56.58 35.63
18 23 31 55000002 SR65-S Franklin Ave ML PM 235 3 592.41 111.02
19 31 25 55000592 SR36-E Snelling Ave ML PM 224 1.37 76.99 46.52
20 22 36 55000478 I494-E Marth Rd ML PM 238 3.5 419.73 53.15
6,671.56 2,626.33
54% 48%
Totals Among Top 10 Bottlenecks from 2013-2014
Percent Total of Top 50 2014 Bottlenecks
Totals Among Top 20 Bottlenecks from 2013-2014
Percent Total of Top 50 2014 Bottlenecks

Minnesota Strategic ITS Research and Development Plan August 2015
38
Table 8. Delay at Arterial Signalized Intersections on TH 55, Sept. 2013
< 10 Sec. 10~20 Sec. 20~35 Sec. 35~55 Sec. 55~80 Sec. >80 Sec.
Revere Boone Winnetka Rhode Island Glenwood Douglas HW 100 Schaper Meadow Wirth
5:00 AM 0.0 0.0 0.0 0.0 0.0 0.0 0.0 0.0 0.0 0.0
5:15 AM 0.0 0.0 0.0 0.0 0.0 0.0 0.0 0.0 0.0 0.0
5:30 AM 1.2 0.7 0.0 0.0 0.0 1.9 11.2 0.0 0.2 0.0
5:45 AM 0.0 6.4 2.2 0.0 0.2 4.5 16.2 0.0 0.4 0.0
6:00 AM 2.1 8.7 1.5 0.0 0.1 2.2 24.6 0.0 0.4 0.0
6:15 AM 3.1 14.1 3.6 0.0 1.1 3.7 31.4 0.3 1.2 1.7
6:30 AM 3.8 25.3 7.5 0.0 2.8 8.2 42.5 1.9 1.9 5.5
6:45 AM 9.5 36.7 7.4 0.5 2.8 9.9 43.1 4.1 1.9 6.2
7:00 AM 5.4 76.7 15.9 2.3 0.7 23.5 77.9 2.3 1.0 22.0
7:15 AM 10.1 70.4 58.2 5.4 0.6 53.8 68.9 4.2 1.5 21.9
7:30 AM 23.3 60.4 44.8 4.3 0.7 41.3 75.6 6.0 1.7 29.7
7:45 AM 32.9 65.3 43.0 6.0 0.9 55.7 75.1 5.9 1.4 44.6
8:00 AM 31.2 75.1 60.8 4.8 0.9 30.8 70.5 12.9 1.7 49.5
8:15 AM 22.9 69.2 47.4 6.9 0.7 25.9 62.2 6.2 3.4 48.2
8:30 AM 16.3 37.8 28.2 2.0 5.0 12.6 42.5 4.2 4.3 26.5
8:45 AM 9.5 32.5 15.5 3.2 3.9 11.3 47.1 4.0 3.9 18.9
9:00 AM 9.1 33.5 21.3 1.5 3.8 9.0 40.4 2.8 3.1 14.1
9:15 AM 10.4 23.8 13.1 0.0 1.2 13.6 31.4 2.6 0.8 7.4
9:30 AM 10.6 24.3 7.9 0.0 1.2 13.2 35.3 2.1 0.0 13.2
9:45 AM 10.0 20.6 12.9 0.0 1.2 12.0 35.3 2.3 1.5 6.0
10:00 AM 8.7 23.1 10.9 0.0 1.0 9.4 33.6 1.9 0.9 7.2
10:15 AM 9.0 18.9 11.6 0.0 0.9 9.9 32.7 1.9 0.0 9.8
10:30 AM 10.0 24.0 12.7 0.0 0.7 8.7 35.3 1.8 1.4 10.8
10:45 AM 10.0 18.4 14.8 0.0 0.5 10.9 37.8 2.2 1.6 5.9
11:00 AM 10.7 23.2 15.6 0.9 0.9 11.2 35.4 2.1 2.0 9.3
11:15 AM 14.5 24.9 28.0 1.4 1.0 12.9 35.3 2.4 2.3 9.8
11:30 AM 18.8 29.9 37.7 3.0 2.1 13.4 38.0 3.4 2.9 7.4
11:45 AM 18.7 30.2 38.9 4.3 2.4 12.7 35.9 4.0 3.6 7.5
12:00 PM 18.8 30.2 37.2 6.2 2.8 13.7 38.2 3.9 4.0 8.9
12:15 PM 20.5 29.6 38.8 5.1 1.6 13.5 38.0 3.7 2.6 13.1
12:30 PM 20.4 34.0 33.6 5.2 2.1 14.2 42.4 3.8 3.4 12.4
12:45 PM 20.8 30.7 32.8 3.3 1.4 14.8 41.1 3.7 3.9 11.2
1:00 PM 20.7 30.3 32.2 4.2 1.5 12.5 38.9 3.5 3.5 10.5
1:15 PM 17.1 30.2 29.2 2.6 1.6 14.0 38.0 3.4 3.7 16.4
1:30 PM 14.8 30.2 20.4 2.1 1.7 12.1 41.0 3.6 4.5 8.9
1:45 PM 16.7 29.8 27.0 3.0 1.5 12.0 40.0 2.7 2.2 12.9
2:00 PM 18.5 29.8 24.2 4.3 2.3 14.1 40.4 4.4 1.9 10.2
2:15 PM 24.8 37.6 49.0 3.4 1.4 17.8 48.5 2.1 2.4 18.0
2:30 PM 11.4 56.4 44.8 1.3 2.0 15.4 48.5 1.7 2.5 21.1
2:45 PM 16.6 38.1 45.7 0.7 2.1 18.6 57.0 1.5 2.6 17.9
3:00 PM 18.3 37.6 41.8 1.2 1.5 16.6 51.0 2.3 3.4 21.1
3:15 PM 14.7 50.8 44.7 0.8 1.6 17.7 54.2 2.2 3.6 31.7
3:30 PM 40.9 52.5 59.0 1.9 2.6 46.6 74.5 4.5 2.6 29.3
3:45 PM 24.6 66.4 67.0 1.6 2.6 39.9 67.7 6.3 2.0 59.4
4:00 PM 37.2 70.6 58.4 1.5 2.2 40.6 71.1 9.2 2.1 49.5
4:15 PM 41.0 57.4 53.1 1.9 3.7 60.9 72.0 7.8 3.9 44.6
4:30 PM 37.0 69.1 64.7 1.8 4.3 35.4 71.1 9.0 3.7 44.6
4:45 PM 36.5 69.9 67.1 2.3 3.8 33.2 65.8 8.6 4.2 52.1
5:00 PM 46.2 69.9 63.7 4.3 3.8 32.4 71.7 14.2 5.0 44.5
5:15 PM 37.3 69.8 69.1 3.9 4.7 35.1 75.2 9.9 3.0 30.2
5:30 PM 25.2 64.5 70.4 2.4 4.7 34.0 69.8 8.6 4.2 51.6
5:45 PM 42.7 57.4 66.4 1.9 5.0 34.0 72.7 6.7 3.2 51.2
6:00 PM 32.8 49.8 69.7 1.1 2.8 31.9 69.9 5.6 3.6 43.1
6:15 PM 17.8 37.4 50.8 3.8 2.7 16.6 52.9 1.7 5.2 27.5
6:30 PM 15.2 37.5 45.7 1.2 1.8 12.7 50.4 1.6 3.1 28.5
6:45 PM 10.1 36.9 35.0 0.6 2.1 16.9 53.9 0.5 3.4 25.3
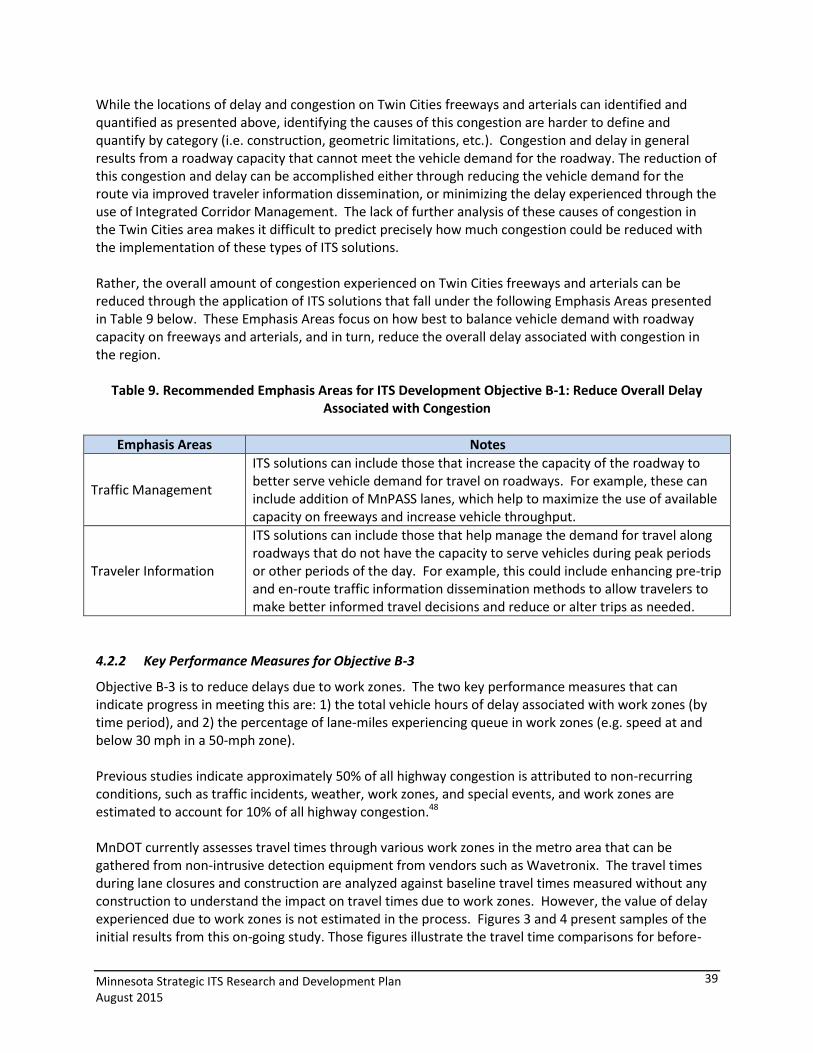
Minnesota Strategic ITS Research and Development Plan August 2015
39
While the locations of delay and congestion on Twin Cities freeways and arterials can identified and quantified as presented above, identifying the causes of this congestion are harder to define and quantify by category (i.e. construction, geometric limitations, etc.). Congestion and delay in general results from a roadway capacity that cannot meet the vehicle demand for the roadway. The reduction of this congestion and delay can be accomplished either through reducing the vehicle demand for the route via improved traveler information dissemination, or minimizing the delay experienced through the use of Integrated Corridor Management. The lack of further analysis of these causes of congestion in the Twin Cities area makes it difficult to predict precisely how much congestion could be reduced with the implementation of these types of ITS solutions. Rather, the overall amount of congestion experienced on Twin Cities freeways and arterials can be reduced through the application of ITS solutions that fall under the following Emphasis Areas presented in Table 9 below. These Emphasis Areas focus on how best to balance vehicle demand with roadway capacity on freeways and arterials, and in turn, reduce the overall delay associated with congestion in the region.
Table 9. Recommended Emphasis Areas for ITS Development Objective B-1: Reduce Overall Delay
Associated with Congestion
Emphasis Areas Notes
Traffic Management
ITS solutions can include those that increase the capacity of the roadway to better serve vehicle demand for travel on roadways. For example, these can include addition of MnPASS lanes, which help to maximize the use of available capacity on freeways and increase vehicle throughput.
Traveler Information
ITS solutions can include those that help manage the demand for travel along roadways that do not have the capacity to serve vehicles during peak periods or other periods of the day. For example, this could include enhancing pre-trip and en-route traffic information dissemination methods to allow travelers to make better informed travel decisions and reduce or alter trips as needed.
4.2.2 Key Performance Measures for Objective B-3
Objective B-3 is to reduce delays due to work zones. The two key performance measures that can indicate progress in meeting this are: 1) the total vehicle hours of delay associated with work zones (by time period), and 2) the percentage of lane-miles experiencing queue in work zones (e.g. speed at and below 30 mph in a 50-mph zone). Previous studies indicate approximately 50% of all highway congestion is attributed to non-recurring conditions, such as traffic incidents, weather, work zones, and special events, and work zones are estimated to account for 10% of all highway congestion.48 MnDOT currently assesses travel times through various work zones in the metro area that can be gathered from non-intrusive detection equipment from vendors such as Wavetronix. The travel times during lane closures and construction are analyzed against baseline travel times measured without any construction to understand the impact on travel times due to work zones. However, the value of delay experienced due to work zones is not estimated in the process. Figures 3 and 4 present samples of the initial results from this on-going study. Those figures illustrate the travel time comparisons for before-

Minnesota Strategic ITS Research and Development Plan August 2015
40
construction and during-construction on the TH 100 Construction Project. During the construction period, TH 100 was reduced from three lanes to two lanes for each direction. The baseline travel time was measures from the same time in 2014.
Figure 3. Travel Time Comparisons, NB TH 100
Figure 4. Travel Time Comparisons, SB TH 100
Other studies throughout the country have attempted to quantify delay experienced in work zones with lane closures. The Texas DOT released a study of the impacts of lane closures on travel times and delays experienced on Interstate 35 in 2008. Researchers calculated these measures based on average speeds and volumes at sensor locations used to detect vehicle queue presence during the lane closures. Table 10 contains the total vehicle hours of delay experienced by daily travel in the work zone.49

Minnesota Strategic ITS Research and Development Plan August 2015
41
Measurements of the lane-miles experiencing queue in work zones can be made by detecting segments where vehicle speeds are traveling at or below 30 MPH in a work zone. MnDOT could perform a similar type of data collection as currently performed to understand the number of freeway lane-miles traveling at or below 45 MPH for the Freeway Congestion Report. For the report, data from loop detectors and other detection stations are collected and broken down into five minute segments. The median speed value for each five minute segment for the month is then selected, and a five minute time period is defined as being congested if the speed is below 45 mph. The number of five minute time periods that are congested are then added up to report different congestion levels (i.e. Less than one hour, 1-2 hours, 2-3 hours, more than 3 hours).
Table 10. Summary of Total Vehicle Hours of Delay within Texas DOT Work Zone
Similar to Objective B-1, while the extent of delay within work zones can be identified and quantified as presented above, identifying the root causes of delays due to work zones are harder to define given a lack of further analysis on these root causes. Congestion and delay within the work zone results from a reduced roadway capacity that cannot meet the vehicle demand for traveling through the work zone.

Minnesota Strategic ITS Research and Development Plan August 2015
42
The reduction of this congestion and delay can be accomplished either through reducing the demand for the route via improved traveler information dissemination, or minimizing the delay experienced in the work zone through the use of zipper or late merge systems. A lack of further analysis on how these types of applications reduce congestion and delay overall makes it difficult to predict precisely how much delay could be reduced with the implementation of these types ITS solutions. Rather, the overall amount of delay experienced in work zones could be reduced through the general application of ITS solutions that fall under the following Emphasis Areas presented in Table 11 below. These Emphasis Areas focus on how best to balance vehicle demand with roadway capacity on freeways and arterials, and in turn, reduce the overall delay associated with congestion in the region.
Table 11. Recommended Emphasis Areas for ITS Development Objective B-3: Reduce Delays Due to
Work Zones
Emphasis Areas Notes
Traveler Information
ITS solutions can include those that help manage the demand for travel along roadways that do not have the capacity to serve vehicles during peak periods or other periods of the day. For example, this could include enhancing pre-trip and en-route traffic information dissemination methods allows travelers to make better informed travel decisions and reduce or alter trips as needed around work zones.
Traffic Management
ITS solutions can include those that increase the capacity of the roadway to better serve vehicle demand for travel on roadways. For example, these can include connected Vehicle technology focuses on maximizing use of roadway capacity through vehicle-to-vehicle communications and reducing congestion through other vehicle-to-infrastructure communications. Applications related to work zones can alert motorists to potential alternate routes. Other solutions that help to increase the capacity of the roadway could also include Zipper / Late Merge systems. MnDOT encourages use of zipper / late merge strategies in work zones to reduce congestion in areas where a lane of traffic is closed. This has the effect of reducing the length of vehicle queues delayed in work zones, and also reduces the speed differential between two lanes of traffic, making it safer to merge and reducing potential incidents.
Other Demand Management
ITS solutions can include those that help manage the demand for travel along roadways that do not have the capacity to serve vehicles during peak periods or other periods of the day. These solutions could also include Dynamic Traffic Assignment (DTA) tools that can assist in determining alternate routes around work zones to recommend prior to construction activity. Further research is required prior to recommending routes, and could also lead to real-time DTA implementation that could recommend routes based on the prior research and development.
4.2.3 Key Performance Measures for Objective C-1
Objective C-1 is to reduce incident-related congestion and delay for travelers. The MnDOT PeMS can be used to gather information on the most frequent locations of incidents occurring in the Twin Cities metro area and the impacts of those incidents on travel speeds and delays. Table 12 displays the top 50 freeway segments in the metro area by the amount of incidents occurring within a 3-mile segment on

Minnesota Strategic ITS Research and Development Plan August 2015
43
that freeway. The table also provides summary statistics on incident duration. Nearly half of all incidents recorded in PeMS averaged between 10 and 20 minutes in duration. Table 13 provides a summary of incidents by freeway facility, along with measures of delay experienced and VMT traveled on those segments.
Table 12. Summary of Top 50 Freeway Segments by Incidents in 2014 50
Rank Freeway Postmile Bin (3 miles) # Incidents Incident Duration (min)
1 I35-N 103 891 Duration %
2 I35-S 103 722 <2.5 0
3 I94-W 234 561 5 0
4 I35-N 90 416 10 8.9
5 I94-E 232 398 15 19.6
6 I35-S 89 347 20 21.4
7 I35-N 112 325 25 7.1
8 I35-S 112 317 30 10.7
9 I94-E 236 314 35 5.4
10 I94-E 241 290 40 1.8
11 I394-E 8 290 45 5.4
12 I35-S 109 286 50 0
13 I494-W 19 265 55 5.4
14 I35-N 108 243 60 0
15 I494-E 20 226 65 3.6
16 I94-W 242 218 70 0
17 I35-N 96 162 75 3.6
18 US169-N 126 161 80 1.8
19 I35-N 94 161 85 0
20 SR62-E 4 156 90 1.8
21 I394-W 8 138 95 0
22 I694-W 8 134 100 0
23 I35-N 92 131 105 0
24 I494-W 37 130 110 0
25 I494-W 35 125 115 0
26 I35-S 96 122 120 0
27 SR62-W 5 122 >120 3.6
28 SR36-W 1 121
29 SR36-E 1 117
30 SR100-S 6 116
31 I35-S 94 116
32 I694-E 13 115
33 I94-W 224 112
34 SR100-N 7 111
35 SR77-N 10 108
36 SR100-S 1 107
37 SR62-W 9 104
38 I694-E 8 104
39 I494-W 6 102
40 I94-W 226 102
41 SR100-N 3 101
42 SR280-S 1 101
43 I94-E 222 100
44 I35-S 119 99
45 US169-S 129 99
46 I94-E 224 98
47 SR36-W 4 98
48 I94-E 226 93
49 SR280-N 1 92
50 US169-S 123 92

Minnesota Strategic ITS Research and Development Plan August 2015
44
Delay(45)
(x10 3 )
Inc/Delay(45)
(x10 -3 )
Normalized
Inc/Delay(45)
(x10 -3 )
VMT
(x10 6 )
Inc/VMT
(x10 -6 )
Normalized
Inc/VMT
(x10 -6 )
I35E-N 39.472 39.462 0 0.000 317.71 0.00 0.00 446.92 0.00 0.00 82
I35E-S 39.83 39.809 0 0.000 412.83 0.00 0.00 470.83 0.00 0.00 82
I35-N 259.411 21.824 2595 10.003 106.97 24.26 2.04 253.06 10.25 0.86 92
I35-S 259.407 21.889 2399 9.248 57.16 41.97 3.54 251.60 9.54 0.80 95
I35W-N 42.143 42.127 0 0.000 851.25 0.00 0.00 710.26 0.00 0.00 91
I35W-S 42.189 42.162 0 0.000 525.00 0.00 0.00 701.60 0.00 0.00 93
I394-E 11.203 11.589 489 43.649 295.50 1.65 1.71 184.53 2.65 2.74 84
I394-W 11.223 11.233 332 29.582 97.07 3.42 3.42 184.76 1.80 1.80 84
I494-E 42.867 44.326 1109 25.871 1034.89 1.07 1.11 788.15 1.41 1.45 88
I494-W 42.724 44.228 1301 30.451 781.36 1.67 1.72 796.03 1.63 1.69 83
I694-E 29.992 25.645 540 18.005 346.93 1.56 1.33 391.72 1.38 1.18 85
I694-W 30.027 25.131 528 17.584 237.31 2.22 1.86 370.33 1.43 1.19 74
I94-E 259.057 73.5 2075 8.010 920.56 2.25 0.64 1149.60 1.80 0.51 89
I94-W 259.136 73.462 2240 8.644 2458.42 0.91 0.26 1172.55 1.91 0.54 91
MN52-E 353.859 0 0 0.000 0.00 0.00 0.00 0.00 0.00 0.00 0
MN52-W 328.513 0 0 0.000 0.00 0.00 0.00 0.00 0.00 0.00 0
SR100-N 15.769 15.761 428 27.142 333.86 1.28 1.28 241.45 1.77 1.77 90
SR100-S 15.753 15.749 414 26.281 222.07 1.86 1.86 239.48 1.73 1.73 94
SR101-N 7.096 4.08 8 1.127 1.69 4.73 2.72 27.82 0.29 0.17 97
SR101-S 6.91 4.082 5 0.724 5.69 0.88 0.52 26.39 0.19 0.11 96
SR13-N 111.594 0 0 0.000 0.00 0.00 0.00 0.00 0.00 0.00 0
SR13-S 111.567 0 0 0.000 0.00 0.00 0.00 0.00 0.00 0.00 0
SR252-N 3.792 2.5 0 0.000 20.26 0.00 0.00 17.70 0.00 0.00 92
SR252-S 4.056 2.682 0 0.000 8.50 0.00 0.00 30.46 0.00 0.00 95
SR280-N 3.44 3.438 106 30.814 19.18 5.53 5.52 30.85 3.44 3.43 90
SR280-S 3.445 3.443 108 31.350 18.09 5.97 5.97 27.93 3.87 3.86 90
SR36-E 21.927 13.5 235 10.717 92.52 2.54 1.56 149.95 1.57 0.96 84
SR36-W 21.651 13.04 266 12.286 77.99 3.41 2.05 134.75 1.97 1.19 87
SR47-N 123.881 5 3 0.024 2.32 1.29 0.05 22.96 0.13 0.01 95
SR47-S 123.933 5.724 1 0.008 1.38 0.72 0.03 36.11 0.03 0.00 80
SR51-N 11.563 0 0 0.000 0.00 0.00 0.00 0.00 0.00 0.00 0
SR51-S 11.422 0 2 0.175 0.00 0.00 0.00 0.00 0.00 0.00 0
SR55-E 220.368 16.51 62 0.281 10.35 5.99 0.45 92.55 0.67 0.05 97
SR55-W 219.769 11.364 71 0.323 38.80 1.83 0.09 48.29 1.47 0.08 96
SR5-E 85.961 9.763 37 0.430 25.10 1.47 0.17 79.46 0.47 0.05 94
SR5-W 85.795 9.748 21 0.245 5.59 3.76 0.43 83.11 0.25 0.03 94
SR610-E 10.052 7.623 17 1.691 1.76 9.68 7.34 49.45 0.34 0.26 96
SR610-W 10.055 7.637 27 2.685 8.13 3.32 2.52 42.42 0.64 0.48 92
SR62-E 12.461 12.455 343 27.526 265.18 1.29 1.29 145.17 2.36 2.36 92
SR62-W 12.423 12.421 331 26.644 170.41 1.94 1.94 156.02 2.12 2.12 86
SR65-N 272.245 2.82 64 0.235 277.03 0.23 0.00 44.98 1.42 0.01 96
SR65-S 272.37 3 0 0.000 133.96 0.00 0.00 47.23 0.00 0.00 97
SR77-N 10.87 10.968 257 23.643 90.32 2.85 2.87 130.50 1.97 1.99 91
SR77-S 10.863 10.952 144 13.256 25.08 5.74 5.79 127.49 1.13 1.14 95
SR7-E 193.526 0 10 0.052 0.00 0.00 0.00 0.00 0.00 0.00 0
SR7-W 193.512 0 7 0.036 0.00 0.00 0.00 0.00 0.00 0.00 0
US10-E 274.414 16.718 112 0.408 74.72 1.50 0.09 216.21 0.52 0.03 93
US10-W 274.559 16.487 122 0.444 123.38 0.99 0.06 205.05 0.59 0.04 92
US169-N 357.705 29.075 671 1.876 496.83 1.35 0.11 339.29 1.98 0.16 92
US169-S 358.139 29.055 503 1.404 264.87 1.90 0.15 345.55 1.46 0.12 89
US212-E 161.303 15.371 85 0.527 43.49 1.95 0.19 123.32 0.69 0.07 95
US212-W 161.297 15.347 81 0.502 19.87 4.08 0.39 126.97 0.64 0.06 94
US61-E 15.343 0 0 0.000 0.00 0.00 0.00 0.00 0.00 0.00 0
US61-W 15.341 0 0 0.000 0.00 0.00 0.00 0.00 0.00 0.00 0
%
Observed
Delay VMT
FreewayFreeway
Miles
Monitored
Miles
#
Incidents
Inc/Fwy
Miles
Table 13. Incident Summary by Freeway 51

Minnesota Strategic ITS Research and Development Plan August 2015
45
PeMS can also provide illustrations of how multiple incidents along one freeway segment can impact travel speeds. Figure 5 displays a table and time-space diagrams of I-94 westbound at milepost 234. On Jan. 30th, 2014, there were multiple incidents recorded over the course of the day. The first time-space diagram shows the level of congestion in terms of travel speed between 6:00 am to 6:00 pm on January 30th, 2014. Areas in blue and dark-blue correspond to speeds between 10 and 20 MPH, as shown in the scale bar at the bottom of the diagram. The bottom time-space diagram illustrates travel speeds recorded the prior day when no incidents were present. Examples such as these can help to illustrate the scale of delay that can be caused by traffic incidents, as well as multiple incidents, in the metro area.
Incident Id Start Time Duration
(mins) Freeway State PM Abs PM Road Dir Location Type
2014013008495740 1/30/2014 8:49 50 I94-W 178.049 234.08 I-94 WB @ I-35W CD SB INCIDENT_CRASH
2014013012295060 1/30/2014 12:29 180 I94-W 178.049 235.596 I-94 WB @ Riverside Ave INCIDENT_CRASH
2014013014042350 1/30/2014 14:04 85 I94-W 178.049 236.048 I-94 WB @ Huron St INCIDENT_CRASH
2014013015393260 1/30/2014 15:39 13 I94-W 178.049 234.207 I-94 WB @ Hiawatha Ave INCIDENT_CRASH
2014013015572220 1/30/2014 15:57 11 I94-W 178.049 234.734 I-94 WB @ 5th St INCIDENT_CRASH
2014013017371930 1/30/2014 17:37 20 I94-W 178.049 235.004 I-94 WB W of 25th Ave INCIDENT_STALL
Figure 5. Impact of Multiple Incidents on Travel Speeds along I-94 WB Segment at MM 234

Minnesota Strategic ITS Research and Development Plan August 2015
46
PeMS can also provide illustrations of how recreational travel can impact travel speeds and cause congestion and delay as well. Figure 6 displays multiple time-space diagrams of I-94 westbound between Maple Grove and St. Cloud, MN. The upper time-space diagram illustrates travel speeds on the Friday prior to the 2014 Fishing Opener. The bottom time-space diagrams illustrate travel speeds recorded on a typical weekend and typical weekday that would not have been impacted by recreational travel. Areas in blue and dark-blue correspond to speeds between 10 and 20 MPH, as shown in the scale bar at the bottom of the diagrams. Similar to the analysis of incidents in Figure 5, examples such as these gathered from PeMS can help to illustrate the level of congestion and the scale of delay that can be caused by recreational travel.
2014 Fishing Opener Weekend
2014 Non-Recreational Weekend 2014 Non-Recreational Weekday
Figure 6. Speed Comparisons on I-94 over 2014 Fishing Opener Weekend and Regular Weekend / Weekday Travel
Similar to Objectives B-1 and B-3, while the extent of incident-related congestion and delay can be identified and quantified as presented above, identifying the root causes are harder to define given a lack of further analysis on these root causes. As noted earlier, congestion and delay results from a roadway capacity that cannot meet vehicle demand. The reduction of this congestion and delay can be accomplished either through reducing the demand for the route via improved traveler information dissemination, or minimizing the delay experienced through the reduction of incident clearance times. The lack of further analysis on these root causes makes it difficult to predict precisely how much incident-related delay could be reduced with the implementation of these types of ITS solutions.

Minnesota Strategic ITS Research and Development Plan August 2015
47
Rather, the overall amount of incident-related delay and congestion experienced by travelers could be reduced through the application of ITS solutions that fall under the following Emphasis Areas presented in Table 14 below. These Emphasis Areas focus on how best to balance vehicle demand with roadway capacity on freeways and arterials, and in turn, reduce the overall delay associated with congestion in the region. The first three Emphasis Areas were presented under ITS Development Objectives B-1 and B-3, but they also apply to reducing incident-related delays and congestion for travelers. Table 14. Recommended Emphasis Areas for ITS Development Objective C-1: Reduce Incident-Related
Congestion and Delay for Travelers
Emphasis Areas Notes
Traffic Management
ITS solutions can include those that increase the capacity of the roadway to better serve vehicle demand for travel on roadways. For example, these can include Integrated Corridor Management (ICM) strategies that can balance existing vehicle capacity on freeways and parallel arterials and reduce overall amount of congestion on corridor caused by traffic incidents. Other solutions that help to increase the capacity of the roadway could also include Dynamic Speed Feedback signs can provide drivers with real-time updates on their speeds approaching an area where reduced speeds are implemented due to work zones or other restrictions. Drivers can reduce speeds as needed and, in turn, reduce the potential for incidents resulting from speed differentials between lanes of traffic.
Traveler Information
ITS solutions can include those that help manage the demand for travel along roadways that do not have the capacity to serve vehicles during peak periods or other periods of the day. For example, this could include enhancing pre-trip and en-route traffic information dissemination methods allows travelers to make better informed travel decisions and reduce or alter trips as needed due to traffic incidents.
Incident Management
ITS solutions can include those that help increase the capacity of a roadway temporarily impacted by traffic incidents. For example, this could include technology that can automatically detect incidents on the roadway can help reduce the amount of time between the incident and the time when it has been identified, as well as reduce the amount of time to clear the incident from the roadway. This technology can also provide greater surveillance for MnDOT on roadways with a high frequency of incidents that cause delays to traffic.
Other Demand Management
ITS solutions can include those that help manage the demand for travel along roadways that do not have the capacity to serve vehicles during peak periods or other periods of the day. These solutions could also include Dynamic Traffic Assignment (DTA) tools that can assist in determining alternate routes around areas impacted by traffic incidents to recommend after the incidents. Further research is required prior to recommending routes, and could also lead to real-time DTA implementation that could recommend routes based on the prior research and development.
Minnesota Strategic ITS Research and Development Plan August 2015
48
4.2.4 Key Performance Measures for Objective C-2
Objective C-2 is to improve travel time reliability. As noted under Objective B-1, the Texas Transportation Institute has reported on Travel Time Index (TTI) experienced in large and small metro areas throughout the county over the past decade. However, the MnDOT PeMS can also be used to gather TTI information on freeway segments that can be defined based on any milepost range in the Twin Cities metro area. As noted earlier, TTI is a measure of the ratio of the travel time during the peak period to the time required to make the same trip at free-flow speeds. For example, a TTI value of 1.2 would indicate that a 20-minute free-flow trip requires 24 minutes during the peak period. Figure 7 below displays the Travel Time Index along I-94 between mileposts 230 and 240 that were previously used to illustrate the impact of multiple incidents on travel speeds. If a free-flow speed over this 10 mile segment is assumed to be 60 MPH, it would take approximately 10 minutes to travel from milepost 240 westbound on I-94 to milepost 230. With that assumption, it is possible to multiply the TTI values by 10 and determine the actual travel times on the segment based on the TTI values, as well as an amount of delay in minutes that occurred beyond the estimated 10-minute trip. As noted for the previous ITS development objectives, while the extent of travel time reliability can be identified and quantified as presented above, identifying the root causes of why it increases is harder to define given a lack of further analysis on these root causes. As noted earlier, congestion and delay results from a roadway capacity that cannot meet vehicle demand. The reduction of this congestion and delay can be accomplished through multiple means of reducing vehicle demand or increasing the capacity of the roadway to carry more vehicles. The lack of further analysis on these root causes makes it difficult to predict precisely how much travel time reliability could be improved with the implementation of various types of ITS solutions. Rather, the travel time reliability could be improved through the application of ITS solutions that fall under the Emphasis Areas that have been presented in for ITS Development Objectives B-1, B-3, and C-1. These Emphasis Areas focus on how best to balance vehicle demand with roadway capacity on freeways and arterials, and in turn, reduce the overall delay associated with congestion in the region. The first three Emphasis Areas were presented under ITS Development Objectives B-1 and B-3, but they also apply to reducing incident-related delays and congestion for travelers.

Minnesota Strategic ITS Research and Development Plan August 2015
49
Data Gathered from PeMS 52
Data Calculated Based on PeMS
Results
Date / Time TTI # Lane Points % Observed Trip Duration
(mins.) Total Delay
(mins.)
1/30/2014 6:00 1.73 936 95 17.3 7.3
1/30/2014 7:00 2.8 936 95 28 18
1/30/2014 8:00 3.59 936 95 35.9 25.9
1/30/2014 9:00 2.76 936 95 27.6 17.6
1/30/2014 10:00 2.12 936 95 21.2 11.2
1/30/2014 11:00 1.75 936 95 17.5 7.5
1/30/2014 12:00 1.57 936 95 15.7 5.7
1/30/2014 13:00 1.83 936 95 18.3 8.3
1/30/2014 14:00 2.53 936 94 25.3 15.3
1/30/2014 15:00 2.8 936 93 28 18
1/30/2014 16:00 3.45 936 90 34.5 24.5
1/30/2014 17:00 3.54 936 90 35.4 25.4
1/30/2014 18:00 2.23 936 90 22.3 12.3
1/30/2014 19:00 1.45 936 90 14.5 4.5
1/30/2014 20:00 1.22 936 90 12.2 2.2
Figure 7. Travel Time Index along I-94 Westbound between Mileposts 230 and 240
4.3 Emphasis Areas
Each of the ITS development objectives recommended for further analysis can be refined to develop emphasis areas in order to identify the amount of progress being made towards accomplishing the ITS development objectives. The emphasis areas have been defined based on the ITS development objectives, as well as the types of quantitative performance measures that can be readily located and gathered by using the MnDOT Performance Measurement Systems (PeMS) and other available sources. Table 15 presents the recommended Emphasis Areas for the development of ITS strategies and countermeasures to address the ITS development objectives that are most likely to provide financial effectiveness to MnDOT. The Emphasis Areas are traced back to the ITS development objectives as

Minnesota Strategic ITS Research and Development Plan August 2015
50
presented in Section 4.2 above, and are also linked to the Performance Measures identified at the beginning of Section 4.2. In addition, as noted in Section 2, replicate analyses were not performed on safety-related objectives as they have been performed in the 2007 and 2014 SHSP. Although ITS is not the only solution to roadway safety issues, it can offer many effective countermeasures to improve roadway safety. Based on the findings of the SHSP, safety-related emphasis areas for ITS development are identified and summarized in Table 16.
Table 15. Recommended Emphasis Areas for ITS Development Objectives B-1, B-3, C-1, and C-2 and Related Performance Measures
Emphasis Areas ITS Development Objectives Performance Measures
Traffic Management Objective B-1: Reduce overall delay associated with congestion; Objective B-3: Reduce delays due to work zones; Objective C-1: Reduce congestion and incident-related delay for travelers; Objective C-2: Improve travel time reliability
Percentage of Twin Cities freeway lane-miles operating with speeds less than 45 MPH
Total vehicle hours of delay during peak periods of Twin Cities freeways and selected arterials
Average travel time during peak periods (corridor-specific)
Total vehicle hours of delay associated with work zones (by time period)
Percentage of lane-miles experiencing queue in work zones (e.g. speed at and below 30 mph in a 50-mph zone)
Total vehicle hours of delay associated with incidents on Twin Cities freeways
Travel time index during peak and off-peak periods (by segment or corridor)
Traveler Information
Incident Management
Other Demand Management
Table 16. Additional Emphasis Areas Based on Safety Analysis53
Emphasis Areas ITS Development Objectives Performance Measures
Intersections
Objective A-1: Reduce crash frequency; Objective A-2: Reduce fatalities and life changing injuries
Number of vehicle crashes per VMT
Number of fatal and serious injury crashes
Lane departure
Inattentive drivers
Speed

Minnesota Strategic ITS Research and Development Plan August 2015
51
5. ITS Strategies for Research and Development
This section provides a list of ITS strategies that could be used by MnDOT to address the selected development objectives within the emphasis areas identified in Section 4. The selected strategies contain ITS approaches (i.e. countermeasures) that are worthy of research and development by the MnDOT ITS Development Unit, to make strides toward addressing the chosen ITS development objectives. A 3-step process was used to identify and select ITS strategies for inclusion in the plan:
1. Identify Potential Strategies: Relevant published resources were searched to identify potential strategies. It is important to note that that this plan acknowledges other Minnesota planning documents and identifies linkages through reference to these documents.
2. Select Strategies Using Defined Criteria: A defined set of criteria were used to select strategies that would provide the best benefit to MnDOT and be the most appropriate for the ITS Development Section to pursue.
3. Utilize Expertise of Key MnDOT Stakeholders: During the final step, meetings were held with key MnDOT stakeholders, to review the initial list of strategies and gather input. This step utilized in-place expertise to ensure that the final list of ITS strategies reflects MnDOT’s past investigations, current practices, and future direction within the selected emphasis areas.
5.1 Identifying Potential Strategies
Table 17 lists the primary sources that were scanned to help generate an initial list of potential ITS strategies for inclusion in the plan. Some of the sources listed did not yield strategy-level approaches; however they are listed for completeness. Additional ITS strategies were located through an online search of relevant publications such as technical papers and research reports.
5.2 Criteria for Selecting Strategies
The following criteria were used to select ITS strategies for inclusion in this plan:
Meets at least one ITS development objective
Meets at least one emphasis area
Can be completed by MnDOT
- MnDOT does not need to be the sole implementer. However, MnDOT would need to complete critical aspects of the strategy (e.g. for connected vehicles, MnDOT would implement the required infrastructure).
ITS strategies that require research or development (experimental and tried) are preferred over on-road deployment (proven) strategies that are currently used in MnDOT’s ongoing project programming process.
This plan’s focus on tried and experimental strategies is consistent with the ITS Development Unit’s responsibilities related to researching, developing, field testing and providing technical support for new ITS products, methods and systems. See Table 18 for an overview of definitions for maturity level (proven, tried, and experimental) and associated research and development needs.

Minnesota Strategic ITS Research and Development Plan August 2015
52
Table 17. Primary Sources Scanned to Identify Potential ITS Strategies
Primary Sources Scanned
Minnesota Statewide Regional ITS Architecture, Volume 9 – Version 201454
Minnesota Strategic Highway Safety Plan 2014-201955
MnDOT Metropolitan Freeway System 2014 Congestion Report56
Strategic Highway Safety Program (SHRP2) Reports: - SHRP2 S2-L02-RR-2 Guide to Establishing Monitoring Programs for Mobility and Travel Time
Reliability57
- SHRP2 S2-L04-RW-2 Incorporating Reliability Performance Measures in Operations and Planning Modeling Tools: Application Guidelines58
- SHRP2 Report S2-L11-RR-1 Evaluating Alternative Operations Strategies to Improve Travel Time Reliability59
- SHRP2 Report S2-C05-RW-1 Understanding the Contribution of Operations, Technology, and Design to Meeting Highway Capacity Needs60
USDOT ITS Benefits Database61
USDOT 2014-2019 ITS Strategic Plan62
USDOT National ITS Architecture: Service Packages63
Connected Vehicle Reference Implementation Architecture(CVRIA)64
State ITS Regional Architectures containing strategy-level ITS project initiatives: - Michigan DOT Regional ITS Architectures and Deployment Plans65
- Florida DOT Statewide and Regional ITS Architectures66
Table 18. Maturity Level Definitions and Development Needs
Maturity Level
Definition Development Need
Proven
- Proven in Minnesota to be effective and worthwhile to deploy
None needed. These strategies are either programmed or currently considered as part of MnDOT’s ongoing project programming process. This includes “core” ITS tools such as detection devices, CCTV cameras, DMS, and RWIS.
Tried
- Proven elsewhere but not fully tried/tested in Minnesota; or
- Tried in Minnesota or elsewhere on a limited basis, but benefits are not fully known
Field operational testing or limited deployment and evaluation is needed, to build confidence in deploying a technology widely.
Experimental - Very conceptual in nature
Research or basic development is needed to enable future on-road testing. This may include simulation, enhanced data collection, or infrastructure investment for exploration of experimental concepts such as connected vehicle applications.

Minnesota Strategic ITS Research and Development Plan August 2015
53
As noted in Table 17, “proven” strategies include those that are either programmed or being considered as part of MnDOT’s ongoing project programming process. For instance, the 20-Year Minnesota State Highway Investment Plan 2014-2033 (MnSHIP)67 contains programmed projects that may include ITS technologies chosen because they are considered “proven” by MnDOT, and research and development is not needed. In addition, the Minnesota Statewide ITS Plan is planning document created by the ITS Development Unit to provide guidance for utilizing MnDOT capital and operating funds to deploy, operate, and maintain “proven” ITS technologies throughout the state. For the purposes of this plan, examples of “proven” ITS strategies include, but are not limited to:
Safety: Intersection conflict warning systems (ICWS), dynamic speed (“your speed is”) signs, LED-enhanced signing, and advanced warning of stop signs or traffic signals.
Freeway Traffic Management: Expansion of core ITS infrastructure (e.g. detection, CCTV cameras, DMS), ramp meters, High Occupancy Toll (HOT) lanes, and performance measurement and monitoring systems such as MnDOT’s Performance Measurement System – PeMS.
Arterial Traffic Management: Expansion of core ITS infrastructure (e.g. detection, CCTV cameras, DMS), signal re-timing, and traffic responsive signal operations.
Work Zones: Dynamic merge systems, queue warning systems, changeable work zone speed limit signs, and dynamic speed display (“your speed is”) signs.
Traveler Information/511: Displays of congestion (red, yellow, green), travel times, winter driving conditions, road construction reports, incident reports, and road closure information; and basic features in the MnDOT 511 mobile app.
5.3 Input from Key MnDOT Stakeholders
After an initial list of ITS strategies was developed, meetings were conducted with key MnDOT stakeholders to review the draft list and provide input. Stakeholders were consulted in the areas of freeway traffic management, arterial traffic management, work zones, and traveler information. The following MnDOT personnel provided input during facilitated meetings on the dates as shown:
Freeway Traffic Management and Traveler Information: 7/22/15 meeting with Brian Kary, Morris Luke, Kelly Braunig, and Jesse Larson
Arterial Traffic Management: 7/21/15 meeting with Steve Misgen and Michael Fairbanks
Work Zones: 7/22/15 meeting with Ken Johnson
During review of the initial list of strategies, stakeholders were asked to consider the following questions:
What strategies hold the most promise, per your experience?
What has already been tried?
Where do gaps exist?
What are your biggest issues?
What research and development is needed? This review by MnDOT stakeholders resulted in refinement of the strategies list, including adding and removing strategies, and areas of focus for research and development. Appendix B contains a list of other ITS strategies suggested by stakeholders that were not included in this plan. While the strategies listed in Appendix B have merit, they were not selected for inclusion in this plan because they do not meet one of the ITS development objectives or emphasis areas selected in this plan. The MnDOT ITS Development Unit is interested in documenting these strategies for future reference.

Minnesota Strategic ITS Research and Development Plan August 2015
54
5.4 Use of Strategies in Future Development Efforts
The ITS strategies identified for this plan will be used by the MnDOT ITS Development Unit as a starting point when considering strategic research and development opportunities. The list is not intended to reflect every effort to be conducted; the list contains far more strategies than could be conducted in the near-term (i.e. 0-5 years) or even in the long term (i.e. 10 years.) Recognizing that ITS technologies will continue to change and MnDOT’s ITS priorities will continue to evolve, the strategies will not stay static over time. It is important to note that new strategies and priorities that are not included in this plan will inevitably emerge over time. The plan is not intended to rule out new ideas or emerging needs in the future. However, the plan provides a documentation of a systematic process used to identify areas where development of ITS strategies can make the biggest impact on the ITS development objectives. In the future, the ITS Development Unit will use the strategies in this plan to help identify strategic research and development activities as funding opportunities arise. As these opportunities arise, the strategies will be reviewed and assessed in conjunction with the following factors: 1) Level of funding available; 2) MnDOT’s current ITS activities and priorities; and 3) Input from MnDOT stakeholders in the appropriate functional area(s). During this review and assessment process, the ITS Development Unit will choose relevant strategies and develop specific project scopes that outline detailed research or development tasks. The “Development Needs” identified in Table 18 for “tried” and “experimental” strategies will be the basis for developing more specific research and development project scopes. This Strategic ITS Research and Development Plan is not the only source of research and development projects considered by the ITS Development Unit. The strategies in this plan compliment other sources of project ideas where others outside the ITS Development Unit bring forth ITS strategies for development; these external sources include the ITS Innovative Idea Program, internal management initiatives, and federal grant opportunities. This plan, and its associated strategies as described in the following section, provide research and development initiatives as determined through a data-driven process conducted by the ITS Development Unit.
5.5 ITS Strategies
Table 19 contains ITS Strategies selected for inclusion in this plan, to be considered by the MnDOT ITS Development Unit as opportunities arise to conduct strategic research and development. Table 19 contains columns that present the following information for each ITS strategy:
Column 1: Strategy title
Column 2: Brief description of the strategy
Column 3: Maturity level (Experimental, Tried, or Proven)
Column 4: Indication of the emphasis area(s) addressed
Column 5: Source(s) from which the strategy is referenced. As available, selected examples of where a strategy has been tried or benefits are noted.
Column 6: Considerations that include input gathered from MnDOT stakeholders during review of strategies in July 2015. These considerations will change over time.

Minnesota Strategic ITS Research and Development Plan August 2015
55
Table 19. ITS Strategies for Research and Development
Re
fere
nce
Nu
mb
er
Strategy Brief Description Maturity
Level
ITS Development Objectives
ITS Development Objectives
Source(s)
*Considerations
(*NOTE: Considerations include input gathered from MnDOT stakeholders during review of strategies in July 2015. Considerations will
change over time.)
A-1: Reduce crash frequency; A-2:
Reduce fatalities and life changing
injuries
B-1: Reduce overall delay associated with congestion; B-3: Reduce delays due to work zones; C-1: Reduce congestion and incident-
related delay; C-2: Improve Travel Time Reliability
Emphasis Areas Emphasis Areas
Inte
rse
ctio
ns
Lan
e D
ep
artu
re
Inat
ten
tive
Spe
ed
Traf
fic
Man
age
me
nt
Inci
de
nt
Man
age
me
nt
Trav
ele
r
Info
rmat
ion
Oth
er
Dem
and
Man
age
me
nt
SAFETY
1
Automated Enforcement of Red-Light Running
Supplement conventional red-light running enforcement with traffic signal technology enhancements that support enforcement efforts. Tried X
2014 MN Statewide Regional
ITS Architecture (S21)54
Technologies to support enforcement: MN Strategic Highway Safety Plan 2014-
2019 (key strategy)55
FHWA “Red Light Cameras/Automated
Enforcement” web page68
2
Connected Vehicles: Research and Develop Red Light Violation Warning (RLVW)
Research and develop RLVW: Enables vehicle approaching a signalized intersection to receive info about signal timing and geometry. Vehicle uses its speed and acceleration profile to determine if it appears likely that it will enter the intersection in violation of a traffic signal; warns the driver.
Experi-mental X
USDOT Connected Vehicle Reference Implementation
Architecture (CVRIA)64
MN Strategic Highway Safety Plan 2014-2019 (key
strategy)55

Minnesota Strategic ITS Research and Development Plan August 2015
56
Re
fere
nce
Nu
mb
er
Strategy Brief Description Maturity
Level
ITS Development Objectives
ITS Development Objectives
Source(s)
*Considerations
(*NOTE: Considerations include input gathered from MnDOT stakeholders during review of strategies in July 2015. Considerations will
change over time.)
A-1: Reduce crash frequency; A-2:
Reduce fatalities and life changing
injuries
B-1: Reduce overall delay associated with congestion; B-3: Reduce delays due to work zones; C-1: Reduce congestion and incident-
related delay; C-2: Improve Travel Time Reliability
Emphasis Areas Emphasis Areas
Inte
rse
ctio
ns
Lan
e D
ep
artu
re
Inat
ten
tive
Spe
ed
Traf
fic
Man
age
me
nt
Inci
de
nt
Man
age
me
nt
Trav
ele
r
Info
rmat
ion
Oth
er
Dem
and
Man
age
me
nt
3 Curve Speed Warning Systems
Deploy and test speed warning systems at curves with recurring adverse roadway conditions and/or high crash rates. Tried X X
2014 MN Statewide Regional
ITS Architecture (M31)54
4 Truck Rollover Warning System
Deploy and test truck rollover warning systems (type of curve speed warning system) to provide dynamic speed feedback at high-instance or high-risk curve locations in Minnesota. Tried X
USDOT ITS Benefits Database
(PA Turnpike - 2006)69 Truck
rollover warning system immediately reduced truck rollover crashes.
USDOT ITS Benefits Database
(Wash DC - 1998)70 500
trucks activated warning signs, reduced average speed by 8.3 mph. No rollovers.
Tried in Minnesota: I-694 truck rollover system.
5
Connected Vehicles: Curve Speed Warning
Research and develop Curve Speed Warning: Provides a warning regarding an upcoming curve, its recommended speed, and warnings if actual speed exceeds recommended speed.
Experi-mental X X
USDOT Connected Vehicle Reference Implementation
Architecture (CVRIA)64

Minnesota Strategic ITS Research and Development Plan August 2015
57
Re
fere
nce
Nu
mb
er
Strategy Brief Description Maturity
Level
ITS Development Objectives
ITS Development Objectives
Source(s)
*Considerations
(*NOTE: Considerations include input gathered from MnDOT stakeholders during review of strategies in July 2015. Considerations will
change over time.)
A-1: Reduce crash frequency; A-2:
Reduce fatalities and life changing
injuries
B-1: Reduce overall delay associated with congestion; B-3: Reduce delays due to work zones; C-1: Reduce congestion and incident-
related delay; C-2: Improve Travel Time Reliability
Emphasis Areas Emphasis Areas
Inte
rse
ctio
ns
Lan
e D
ep
artu
re
Inat
ten
tive
Spe
ed
Traf
fic
Man
age
me
nt
Inci
de
nt
Man
age
me
nt
Trav
ele
r
Info
rmat
ion
Oth
er
Dem
and
Man
age
me
nt
6 LED Lighting Control Systems
Testing new LED lighting and control systems. Test efficiency, level of automation, and benefits of dynamically dimming, etc.
Experi-mental X
7/21/15 meeting with Steve Misgen.
Enhanced lighting at intersections: MN Strategic Highway Safety Plan 2014-
2019 (key strategy)55
WSDOT Adaptive LED
Lighting Pilot Project71
Benefits include increased efficiency and lower operating costs compared to traditional lighting.
7
Implement Improved Lane Guidance System (Connected Vehicles)
Provide drivers/vehicles with route guidance through the use of magnetics, GPS, and pavement markings. Consider how to identify lanes in work zones where lane reductions and changes are common.
Experi-mental X
2014 MN Statewide Regional ITS Architecture Vol. 9
(M74)54
This important in work zones where lane markings change during construction.
8
Provide Real-Time Information to Equipped Vehicles That Deliver Warnings to Drivers (Connected Vehicles)
This system includes technologies to notify drivers of the posted speed limit based on location, indications hazardous roadway locations, alignment changes, upcoming work zones, crash spots, or bridge surface conditions.
Experi-mental X X X X
2014 MN Statewide Regional ITS Architecture Vol. 9
(M73)54

Minnesota Strategic ITS Research and Development Plan August 2015
58
Re
fere
nce
Nu
mb
er
Strategy Brief Description Maturity
Level
ITS Development Objectives
ITS Development Objectives
Source(s)
*Considerations
(*NOTE: Considerations include input gathered from MnDOT stakeholders during review of strategies in July 2015. Considerations will
change over time.)
A-1: Reduce crash frequency; A-2:
Reduce fatalities and life changing
injuries
B-1: Reduce overall delay associated with congestion; B-3: Reduce delays due to work zones; C-1: Reduce congestion and incident-
related delay; C-2: Improve Travel Time Reliability
Emphasis Areas Emphasis Areas
Inte
rse
ctio
ns
Lan
e D
ep
artu
re
Inat
ten
tive
Spe
ed
Traf
fic
Man
age
me
nt
Inci
de
nt
Man
age
me
nt
Trav
ele
r
Info
rmat
ion
Oth
er
Dem
and
Man
age
me
nt
9
Connected Vehicles: Reduced Speed Zone Warning (RSZW)
Research and develop RSZW: Provides vehicles approaching a reduced speed zone (e.g. work/school zones) with posted speed limit and configuration changes (lane closures/shifts); uses info to determine alerts to drivers. *ENTERPRISE has created draft Planning Guidance for this application.
Experi-mental X X X
USDOT Connected Vehicle Reference Implementation
Architecture (CVRIA)64
WORK ZONES
10
Travel Times in Advance of Work Zones
Provide travel times in advance of work zones. Continue testing in rural areas. Focus on improving methods to communicate this information to the public (e.g. 511). Tried X X X
ITS Strategic Development Plan: Interview with Tiffany Dagon (7/1/14)
Comparative Analysis Report: The Benefits of Using Intelligent Transportation Systems in Work Zones
(FHWA 2008)72
This is a proven strategy in the metro area. Focus on rural areas and improved methods to communicate information to motorists (e.g. 511)
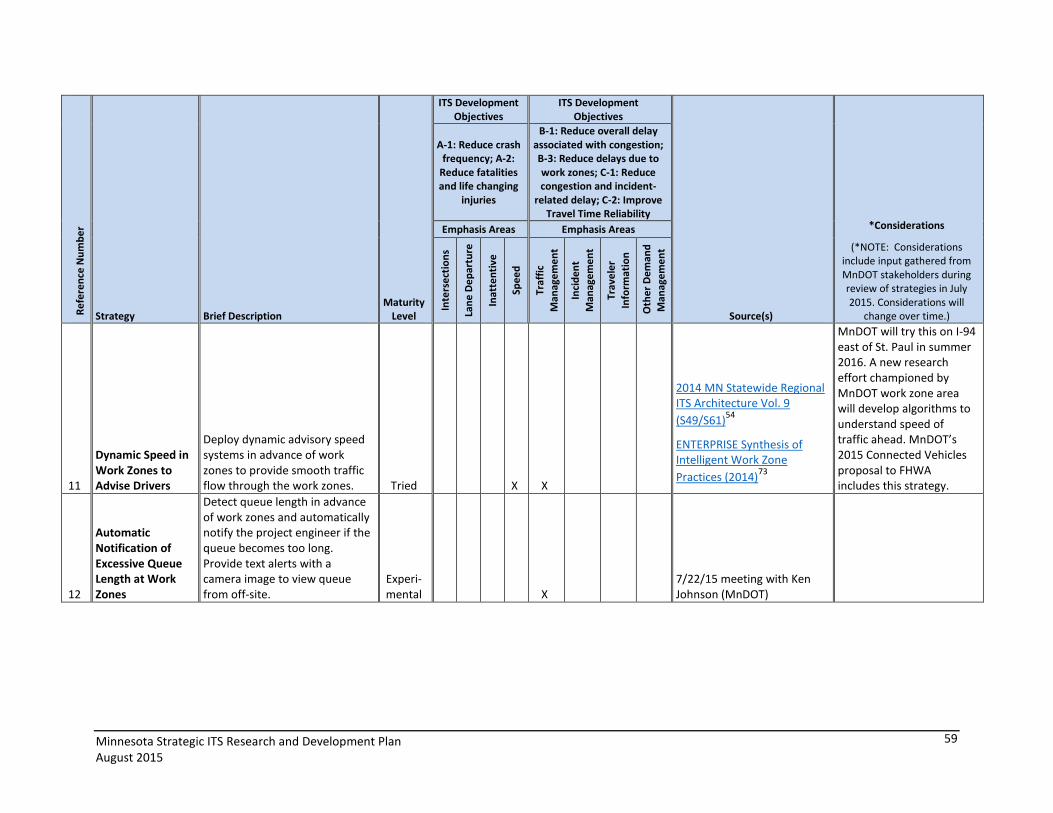
Minnesota Strategic ITS Research and Development Plan August 2015
59
Re
fere
nce
Nu
mb
er
Strategy Brief Description Maturity
Level
ITS Development Objectives
ITS Development Objectives
Source(s)
*Considerations
(*NOTE: Considerations include input gathered from MnDOT stakeholders during review of strategies in July 2015. Considerations will
change over time.)
A-1: Reduce crash frequency; A-2:
Reduce fatalities and life changing
injuries
B-1: Reduce overall delay associated with congestion; B-3: Reduce delays due to work zones; C-1: Reduce congestion and incident-
related delay; C-2: Improve Travel Time Reliability
Emphasis Areas Emphasis Areas
Inte
rse
ctio
ns
Lan
e D
ep
artu
re
Inat
ten
tive
Spe
ed
Traf
fic
Man
age
me
nt
Inci
de
nt
Man
age
me
nt
Trav
ele
r
Info
rmat
ion
Oth
er
Dem
and
Man
age
me
nt
11
Dynamic Speed in Work Zones to Advise Drivers
Deploy dynamic advisory speed systems in advance of work zones to provide smooth traffic flow through the work zones. Tried X X
2014 MN Statewide Regional ITS Architecture Vol. 9
(S49/S61)54
ENTERPRISE Synthesis of Intelligent Work Zone
Practices (2014)73
MnDOT will try this on I-94 east of St. Paul in summer 2016. A new research effort championed by MnDOT work zone area will develop algorithms to understand speed of traffic ahead. MnDOT’s 2015 Connected Vehicles proposal to FHWA includes this strategy.
12
Automatic Notification of Excessive Queue Length at Work Zones
Detect queue length in advance of work zones and automatically notify the project engineer if the queue becomes too long. Provide text alerts with a camera image to view queue from off-site.
Experi-mental X
7/22/15 meeting with Ken Johnson (MnDOT)

Minnesota Strategic ITS Research and Development Plan August 2015
60
Re
fere
nce
Nu
mb
er
Strategy Brief Description Maturity
Level
ITS Development Objectives
ITS Development Objectives
Source(s)
*Considerations
(*NOTE: Considerations include input gathered from MnDOT stakeholders during review of strategies in July 2015. Considerations will
change over time.)
A-1: Reduce crash frequency; A-2:
Reduce fatalities and life changing
injuries
B-1: Reduce overall delay associated with congestion; B-3: Reduce delays due to work zones; C-1: Reduce congestion and incident-
related delay; C-2: Improve Travel Time Reliability
Emphasis Areas Emphasis Areas
Inte
rse
ctio
ns
Lan
e D
ep
artu
re
Inat
ten
tive
Spe
ed
Traf
fic
Man
age
me
nt
Inci
de
nt
Man
age
me
nt
Trav
ele
r
Info
rmat
ion
Oth
er
Dem
and
Man
age
me
nt
13
Improved Methods for Publishing Construction Detour Information
Develop improved methods for publishing construction detour information (hard closures, road closed open to traffic, and detours) for use by 3rd party traveler information providers (e.g. WAZE, Garmin) Modify current MnDOT data fields as needed, to publish this info.
Experi-mental X X X
7/22/15 meeting with Ken Johnson (MnDOT)
14
Pre-Connected Vehicle Research on Transmitting Information to Vehicles at Work Zones
Explore ways to transmit messages about work zones to the vehicle (e.g. cell phone or other): What should the messages be? How to transmit information to vehicles? What will activate messages? (e.g. moving cones)
Experi-mental X X X X
7/22/15 meeting with Ken Johnson (MnDOT)
Related to various Connected Vehicle Applications. A related research effort championed by MnDOT’s work zone area is underway.
15
Automatic Notification of Lane Closures
Investigate technologies to create and send automatic notification of lane closures to the TMC, 511, DMS, etc.
Experi-mental X X
7/22/15 meeting with Ken Johnson
Caltrans is experimenting with the use of iCones for this application. As the first iCone in a work zone is moved, a message could be sent to the TMC to indicate the lane closure.
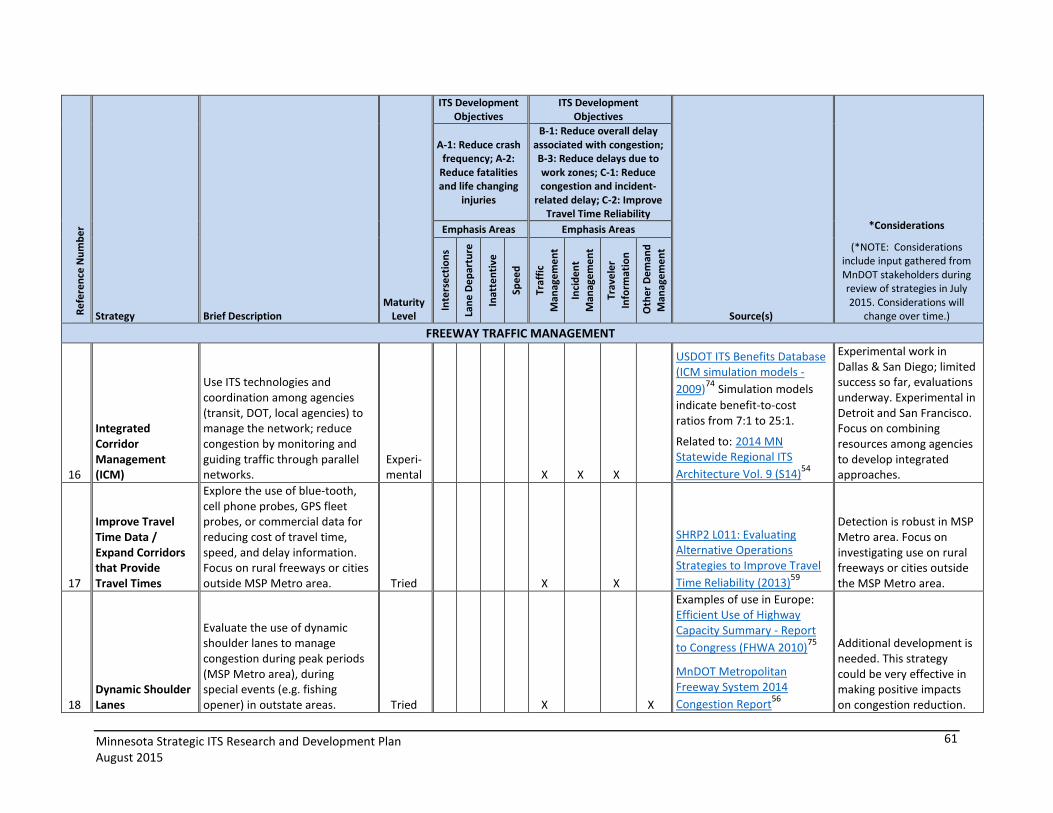
Minnesota Strategic ITS Research and Development Plan August 2015
61
Re
fere
nce
Nu
mb
er
Strategy Brief Description Maturity
Level
ITS Development Objectives
ITS Development Objectives
Source(s)
*Considerations
(*NOTE: Considerations include input gathered from MnDOT stakeholders during review of strategies in July 2015. Considerations will
change over time.)
A-1: Reduce crash frequency; A-2:
Reduce fatalities and life changing
injuries
B-1: Reduce overall delay associated with congestion; B-3: Reduce delays due to work zones; C-1: Reduce congestion and incident-
related delay; C-2: Improve Travel Time Reliability
Emphasis Areas Emphasis Areas
Inte
rse
ctio
ns
Lan
e D
ep
artu
re
Inat
ten
tive
Spe
ed
Traf
fic
Man
age
me
nt
Inci
de
nt
Man
age
me
nt
Trav
ele
r
Info
rmat
ion
Oth
er
Dem
and
Man
age
me
nt
FREEWAY TRAFFIC MANAGEMENT
16
Integrated Corridor Management (ICM)
Use ITS technologies and coordination among agencies (transit, DOT, local agencies) to manage the network; reduce congestion by monitoring and guiding traffic through parallel networks.
Experi-mental X X X
USDOT ITS Benefits Database (ICM simulation models -
2009)74 Simulation models
indicate benefit-to-cost ratios from 7:1 to 25:1.
Related to: 2014 MN Statewide Regional ITS
Architecture Vol. 9 (S14)54
Experimental work in Dallas & San Diego; limited success so far, evaluations underway. Experimental in Detroit and San Francisco. Focus on combining resources among agencies to develop integrated approaches.
17
Improve Travel Time Data / Expand Corridors that Provide Travel Times
Explore the use of blue-tooth, cell phone probes, GPS fleet probes, or commercial data for reducing cost of travel time, speed, and delay information. Focus on rural freeways or cities outside MSP Metro area. Tried X X
SHRP2 L011: Evaluating Alternative Operations Strategies to Improve Travel
Time Reliability (2013)59
Detection is robust in MSP Metro area. Focus on investigating use on rural freeways or cities outside the MSP Metro area.
18 Dynamic Shoulder Lanes
Evaluate the use of dynamic shoulder lanes to manage congestion during peak periods (MSP Metro area), during special events (e.g. fishing opener) in outstate areas. Tried X X
Examples of use in Europe: Efficient Use of Highway Capacity Summary - Report
to Congress (FHWA 2010)75
MnDOT Metropolitan Freeway System 2014
Congestion Report56
Additional development is needed. This strategy could be very effective in making positive impacts on congestion reduction.

Minnesota Strategic ITS Research and Development Plan August 2015
62
Re
fere
nce
Nu
mb
er
Strategy Brief Description Maturity
Level
ITS Development Objectives
ITS Development Objectives
Source(s)
*Considerations
(*NOTE: Considerations include input gathered from MnDOT stakeholders during review of strategies in July 2015. Considerations will
change over time.)
A-1: Reduce crash frequency; A-2:
Reduce fatalities and life changing
injuries
B-1: Reduce overall delay associated with congestion; B-3: Reduce delays due to work zones; C-1: Reduce congestion and incident-
related delay; C-2: Improve Travel Time Reliability
Emphasis Areas Emphasis Areas
Inte
rse
ctio
ns
Lan
e D
ep
artu
re
Inat
ten
tive
Spe
ed
Traf
fic
Man
age
me
nt
Inci
de
nt
Man
age
me
nt
Trav
ele
r
Info
rmat
ion
Oth
er
Dem
and
Man
age
me
nt
19 Variable Speed Limits
Conduct further field testing of variable speed limits to smooth traffic flow and reduce crashes that lead to additional congestion during peak periods. Tried X X
Evaluation of Variable Speed Limits on I‐270/I‐255 in St.
Louis (2010)76- VSL did not
perform as desired in improving overall mobility, but limited benefits to some segments. Noticeable benefits seen with reduction in number of crashes.
Tried in MSP Metro area, but not proven. Needs additional trial and evaluation.
20 Dynamic Lane Control
Conduct further field testing of dynamic lane control to smooth traffic flow and reduce crashes that lead to additional congestion during peak periods. Tried X X
Washington State DOT Active Traffic and Demand
Management77 - Considered
work in progress.
M42 Active Traffic Management Scheme, Birmingham, United
Kingdom78 - Tried in the UK.
Tried in MSP Metro area, but not proven. Results so far haven’t been favorable. Needs additional trial and evaluation.
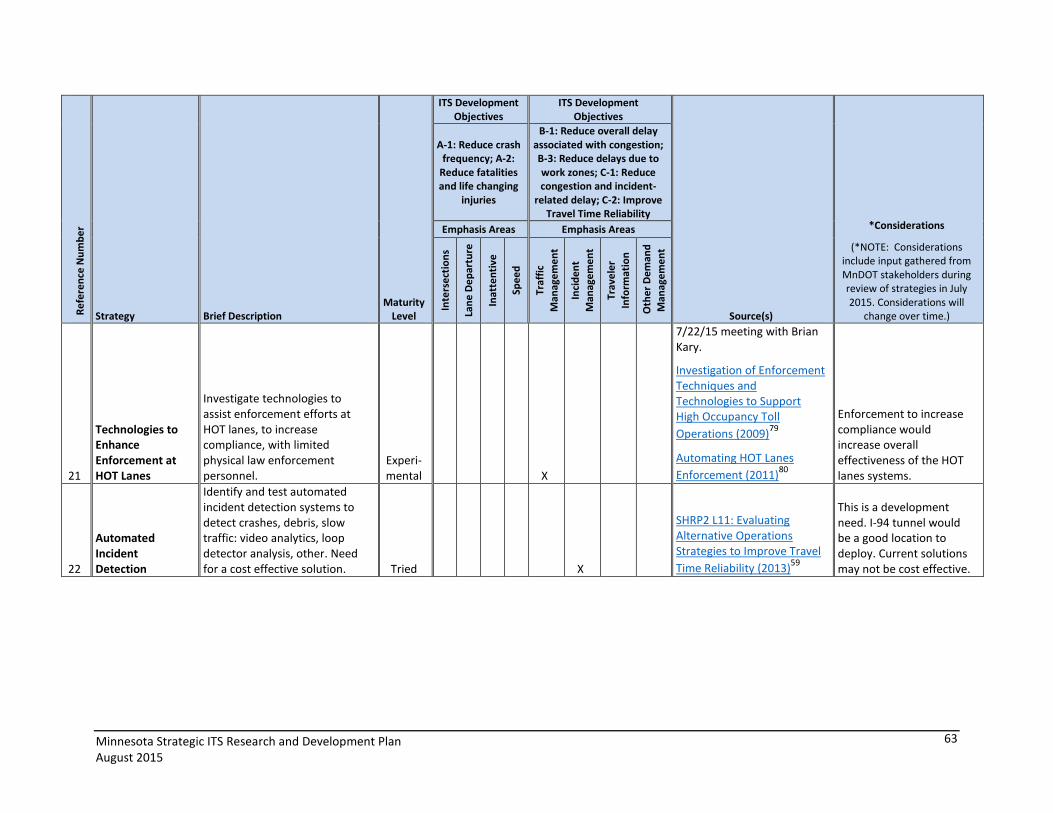
Minnesota Strategic ITS Research and Development Plan August 2015
63
Re
fere
nce
Nu
mb
er
Strategy Brief Description Maturity
Level
ITS Development Objectives
ITS Development Objectives
Source(s)
*Considerations
(*NOTE: Considerations include input gathered from MnDOT stakeholders during review of strategies in July 2015. Considerations will
change over time.)
A-1: Reduce crash frequency; A-2:
Reduce fatalities and life changing
injuries
B-1: Reduce overall delay associated with congestion; B-3: Reduce delays due to work zones; C-1: Reduce congestion and incident-
related delay; C-2: Improve Travel Time Reliability
Emphasis Areas Emphasis Areas
Inte
rse
ctio
ns
Lan
e D
ep
artu
re
Inat
ten
tive
Spe
ed
Traf
fic
Man
age
me
nt
Inci
de
nt
Man
age
me
nt
Trav
ele
r
Info
rmat
ion
Oth
er
Dem
and
Man
age
me
nt
21
Technologies to Enhance Enforcement at HOT Lanes
Investigate technologies to assist enforcement efforts at HOT lanes, to increase compliance, with limited physical law enforcement personnel.
Experi-mental X
7/22/15 meeting with Brian Kary.
Investigation of Enforcement Techniques and Technologies to Support High Occupancy Toll
Operations (2009)79
Automating HOT Lanes
Enforcement (2011)80
Enforcement to increase compliance would increase overall effectiveness of the HOT lanes systems.
22
Automated Incident Detection
Identify and test automated incident detection systems to detect crashes, debris, slow traffic: video analytics, loop detector analysis, other. Need for a cost effective solution. Tried X
SHRP2 L11: Evaluating Alternative Operations Strategies to Improve Travel
Time Reliability (2013)59
This is a development need. I-94 tunnel would be a good location to deploy. Current solutions may not be cost effective.

Minnesota Strategic ITS Research and Development Plan August 2015
64
Re
fere
nce
Nu
mb
er
Strategy Brief Description Maturity
Level
ITS Development Objectives
ITS Development Objectives
Source(s)
*Considerations
(*NOTE: Considerations include input gathered from MnDOT stakeholders during review of strategies in July 2015. Considerations will
change over time.)
A-1: Reduce crash frequency; A-2:
Reduce fatalities and life changing
injuries
B-1: Reduce overall delay associated with congestion; B-3: Reduce delays due to work zones; C-1: Reduce congestion and incident-
related delay; C-2: Improve Travel Time Reliability
Emphasis Areas Emphasis Areas
Inte
rse
ctio
ns
Lan
e D
ep
artu
re
Inat
ten
tive
Spe
ed
Traf
fic
Man
age
me
nt
Inci
de
nt
Man
age
me
nt
Trav
ele
r
Info
rmat
ion
Oth
er
Dem
and
Man
age
me
nt
23
Implement Dynamic Traffic Assignment (DTA) Modeling Methods
Implement DTA modeling methods that take into account spatial and temporal effects of congestion in determining route choice, time of departure choice, and mode choice. Use to analyze incidents, construction zones, Active Transportation and Demand Management, ICM, & ITS/operational strategies. Use DTA in real-time to provide travel times and route options, especially for work zones. Tried X X
FHWA Guidebook on the Use of Dynamic Traffic Assignment in Modeling
(2012)81
San Francisco Co. Transp. Authority: City-wide DTA
traffic model82
FDOT - DTA effective for planning/operating managed lanes: Application of Dynamic Traffic Assignment to Advanced Managed Lane
Modeling (2013)83
DTA has been used at MnDOT to analyze work zones. Not currently foreseen as a tool for use in real time. However, DTA is a strategy that holds potential.
24
Connected Vehicles: Queue Warning (Q-WARN) Application
Research and Develop Q-WARN: Enables vehicles within the queue to automatically broadcast their status information to upstream vehicles and to infrastructure-based central entities (such as the TMC) in order to minimize or prevent rear-end or other secondary collisions.
Experi-mental X X X X
USDOT Connected Vehicle Reference Implementation
Architecture (CVRIA)64
Queue detection/warning in advance of work zones has been effective. Portable systems are “proven” at MnDOT. Use with connected vehicles is a good way to expand the technology.
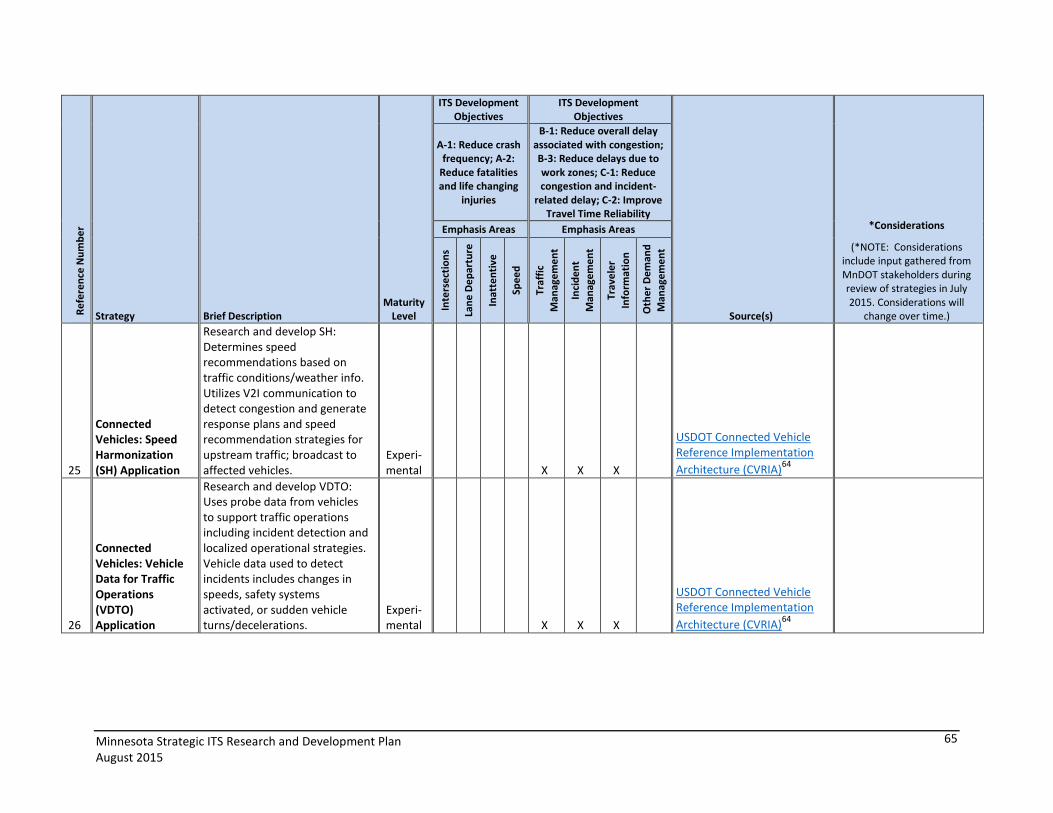
Minnesota Strategic ITS Research and Development Plan August 2015
65
Re
fere
nce
Nu
mb
er
Strategy Brief Description Maturity
Level
ITS Development Objectives
ITS Development Objectives
Source(s)
*Considerations
(*NOTE: Considerations include input gathered from MnDOT stakeholders during review of strategies in July 2015. Considerations will
change over time.)
A-1: Reduce crash frequency; A-2:
Reduce fatalities and life changing
injuries
B-1: Reduce overall delay associated with congestion; B-3: Reduce delays due to work zones; C-1: Reduce congestion and incident-
related delay; C-2: Improve Travel Time Reliability
Emphasis Areas Emphasis Areas
Inte
rse
ctio
ns
Lan
e D
ep
artu
re
Inat
ten
tive
Spe
ed
Traf
fic
Man
age
me
nt
Inci
de
nt
Man
age
me
nt
Trav
ele
r
Info
rmat
ion
Oth
er
Dem
and
Man
age
me
nt
25
Connected Vehicles: Speed Harmonization (SH) Application
Research and develop SH: Determines speed recommendations based on traffic conditions/weather info. Utilizes V2I communication to detect congestion and generate response plans and speed recommendation strategies for upstream traffic; broadcast to affected vehicles.
Experi-mental X X X
USDOT Connected Vehicle Reference Implementation
Architecture (CVRIA)64
26
Connected Vehicles: Vehicle Data for Traffic Operations (VDTO) Application
Research and develop VDTO: Uses probe data from vehicles to support traffic operations including incident detection and localized operational strategies. Vehicle data used to detect incidents includes changes in speeds, safety systems activated, or sudden vehicle turns/decelerations.
Experi-mental X X X
USDOT Connected Vehicle Reference Implementation
Architecture (CVRIA)64

Minnesota Strategic ITS Research and Development Plan August 2015
66
Re
fere
nce
Nu
mb
er
Strategy Brief Description Maturity
Level
ITS Development Objectives
ITS Development Objectives
Source(s)
*Considerations
(*NOTE: Considerations include input gathered from MnDOT stakeholders during review of strategies in July 2015. Considerations will
change over time.)
A-1: Reduce crash frequency; A-2:
Reduce fatalities and life changing
injuries
B-1: Reduce overall delay associated with congestion; B-3: Reduce delays due to work zones; C-1: Reduce congestion and incident-
related delay; C-2: Improve Travel Time Reliability
Emphasis Areas Emphasis Areas
Inte
rse
ctio
ns
Lan
e D
ep
artu
re
Inat
ten
tive
Spe
ed
Traf
fic
Man
age
me
nt
Inci
de
nt
Man
age
me
nt
Trav
ele
r
Info
rmat
ion
Oth
er
Dem
and
Man
age
me
nt
27
Connected Vehicles: Variable Speed Limits for Weather-Responsive Traffic Management Application
Research and develop “Variable Speed Limits for Weather-Responsive Traffic Management”: Uses road weather information from connected vehicles as well as current and historical data from multiple sources to determine the appropriate safe speed. Provides real-time information on appropriate speeds and warns drivers of coming road conditions.
Experi-mental X X X
USDOT Connected Vehicle Reference Implementation
Architecture (CVRIA)64
ARTERIAL TRAFFIC MANAGEMENT
28
Development or Expansion of Performance Monitoring on Arterials
Additional research, further development of user tools or automatic re-timing, or expansion of performance monitoring efforts. Tried X X
MnDOT ITS Strategic Development Plan: Interview Steve Misgen (7/31/14)
MnDOT is using SMART Signal and an open source system developed in Utah. Need for tools to utilize the systems to monitor and conduct re-timing in real time. Also a need for additional testing of open source Utah system.
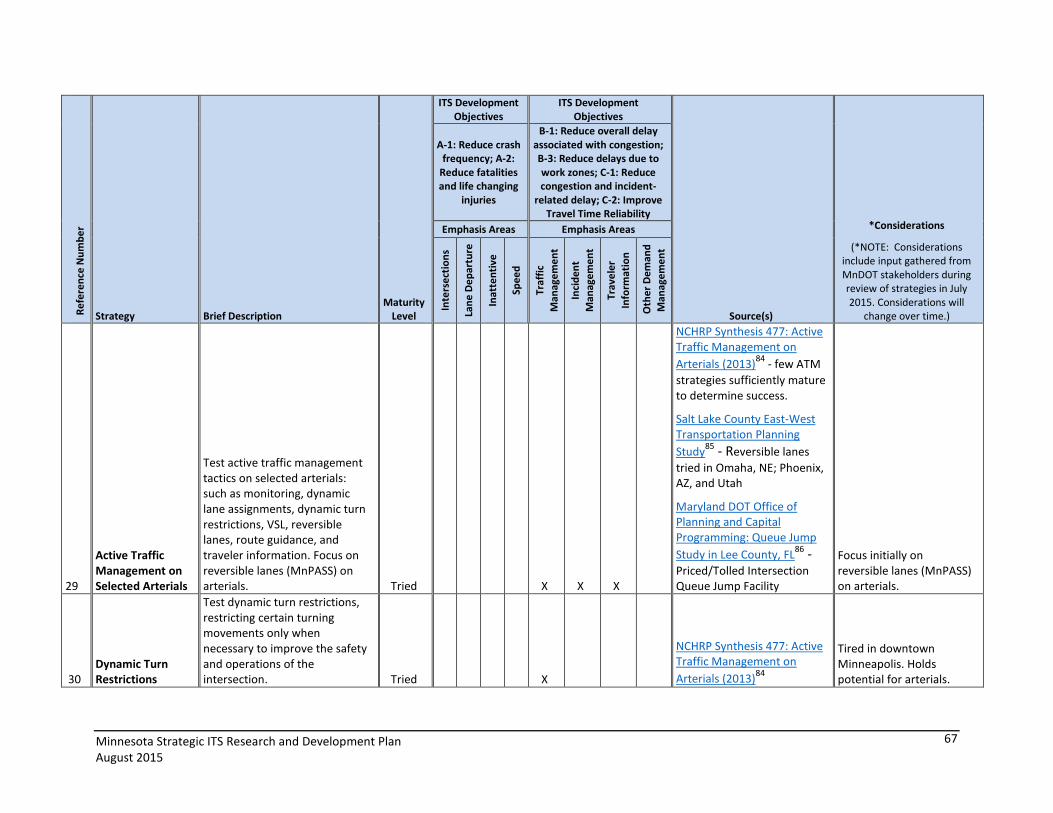
Minnesota Strategic ITS Research and Development Plan August 2015
67
Re
fere
nce
Nu
mb
er
Strategy Brief Description Maturity
Level
ITS Development Objectives
ITS Development Objectives
Source(s)
*Considerations
(*NOTE: Considerations include input gathered from MnDOT stakeholders during review of strategies in July 2015. Considerations will
change over time.)
A-1: Reduce crash frequency; A-2:
Reduce fatalities and life changing
injuries
B-1: Reduce overall delay associated with congestion; B-3: Reduce delays due to work zones; C-1: Reduce congestion and incident-
related delay; C-2: Improve Travel Time Reliability
Emphasis Areas Emphasis Areas
Inte
rse
ctio
ns
Lan
e D
ep
artu
re
Inat
ten
tive
Spe
ed
Traf
fic
Man
age
me
nt
Inci
de
nt
Man
age
me
nt
Trav
ele
r
Info
rmat
ion
Oth
er
Dem
and
Man
age
me
nt
29
Active Traffic Management on Selected Arterials
Test active traffic management tactics on selected arterials: such as monitoring, dynamic lane assignments, dynamic turn restrictions, VSL, reversible lanes, route guidance, and traveler information. Focus on reversible lanes (MnPASS) on arterials. Tried X X X
NCHRP Synthesis 477: Active Traffic Management on
Arterials (2013)84
- few ATM
strategies sufficiently mature to determine success.
Salt Lake County East-West Transportation Planning
Study85 - Reversible lanes
tried in Omaha, NE; Phoenix, AZ, and Utah
Maryland DOT Office of Planning and Capital Programming: Queue Jump
Study in Lee County, FL86 -
Priced/Tolled Intersection Queue Jump Facility
Focus initially on reversible lanes (MnPASS) on arterials.
30 Dynamic Turn Restrictions
Test dynamic turn restrictions, restricting certain turning movements only when necessary to improve the safety and operations of the intersection. Tried X
NCHRP Synthesis 477: Active Traffic Management on
Arterials (2013)84
Tired in downtown Minneapolis. Holds potential for arterials.

Minnesota Strategic ITS Research and Development Plan August 2015
68
Re
fere
nce
Nu
mb
er
Strategy Brief Description Maturity
Level
ITS Development Objectives
ITS Development Objectives
Source(s)
*Considerations
(*NOTE: Considerations include input gathered from MnDOT stakeholders during review of strategies in July 2015. Considerations will
change over time.)
A-1: Reduce crash frequency; A-2:
Reduce fatalities and life changing
injuries
B-1: Reduce overall delay associated with congestion; B-3: Reduce delays due to work zones; C-1: Reduce congestion and incident-
related delay; C-2: Improve Travel Time Reliability
Emphasis Areas Emphasis Areas
Inte
rse
ctio
ns
Lan
e D
ep
artu
re
Inat
ten
tive
Spe
ed
Traf
fic
Man
age
me
nt
Inci
de
nt
Man
age
me
nt
Trav
ele
r
Info
rmat
ion
Oth
er
Dem
and
Man
age
me
nt
31
Incorporate Reliability Performance Measures into Arterial Planning Modeling Tools
Incorporate travel time reliability into microscopic and mesoscopic simulation models, for policy and project evaluation. Inputs include scenarios such as incidents, weather, etc. Tried X X
SHRP2 L04 Incorporating Reliability Performance Measures in Operations and Planning Modeling Tools
(2014)58
Not done currently; not feasible with limited staff to do the modeling. Keep this as a potential future strategy.
32 Adaptive Signal Control
Pilot the use of adaptive signal control to accommodate changing traffic patterns and ease congestion. Tried X
2014 MN Statewide Regional
ITS Architecture (S06)54
Overall, not a positive experience within MSP Metro. Could be appropriate for individual signals; but not corridor-wide in MSP Metro.
33
Connected Vehicles: Intelligent Traffic Signal Systems (ISIG) Application
Research and develop ISIG: Utilizes vehicle location to adjust signal timing in order to improve traffic flow, including allowing platoon flow through the intersection.
Experi-mental X X
USDOT Connected Vehicle Reference Implementation
Architecture (CVRIA)64
Good next step for signal systems.

Minnesota Strategic ITS Research and Development Plan August 2015
69
Re
fere
nce
Nu
mb
er
Strategy Brief Description Maturity
Level
ITS Development Objectives
ITS Development Objectives
Source(s)
*Considerations
(*NOTE: Considerations include input gathered from MnDOT stakeholders during review of strategies in July 2015. Considerations will
change over time.)
A-1: Reduce crash frequency; A-2:
Reduce fatalities and life changing
injuries
B-1: Reduce overall delay associated with congestion; B-3: Reduce delays due to work zones; C-1: Reduce congestion and incident-
related delay; C-2: Improve Travel Time Reliability
Emphasis Areas Emphasis Areas
Inte
rse
ctio
ns
Lan
e D
ep
artu
re
Inat
ten
tive
Spe
ed
Traf
fic
Man
age
me
nt
Inci
de
nt
Man
age
me
nt
Trav
ele
r
Info
rmat
ion
Oth
er
Dem
and
Man
age
me
nt
TRAVELER INFORMATION/511
34
Work Zone Restriction Information Automation
Automate commercial vehicle (CV) restriction data due to work zone data entered into CARS and Automated Permit Routing System (APRS). CV operators and use APRS to generate routes based on size and weight requirements.
Experi-mental X X
2014 MN Statewide Regional ITS Architecture Vol. 9
(M55)54
This needs development; has potential to make a significant impact.
35
Enhanced Data Entry and Integration of Work Zone Info into 511
Expand capability of entering work zone data via web-enabled cell phone. Improve level of detail and simplify data entry system.
Experi-mental X X
2014 MN Statewide Regional ITS Architecture Vol. 9
(S56)54
Create a smart phone app to use in real time to enter/confirm lane closures; as DMS are updated, automatically updates 511. Use for mobile work zones such as pothole patching. Synergy with cameras in MnDOT maintenance vehicles.

Minnesota Strategic ITS Research and Development Plan August 2015
70
Re
fere
nce
Nu
mb
er
Strategy Brief Description Maturity
Level
ITS Development Objectives
ITS Development Objectives
Source(s)
*Considerations
(*NOTE: Considerations include input gathered from MnDOT stakeholders during review of strategies in July 2015. Considerations will
change over time.)
A-1: Reduce crash frequency; A-2:
Reduce fatalities and life changing
injuries
B-1: Reduce overall delay associated with congestion; B-3: Reduce delays due to work zones; C-1: Reduce congestion and incident-
related delay; C-2: Improve Travel Time Reliability
Emphasis Areas Emphasis Areas
Inte
rse
ctio
ns
Lan
e D
ep
artu
re
Inat
ten
tive
Spe
ed
Traf
fic
Man
age
me
nt
Inci
de
nt
Man
age
me
nt
Trav
ele
r
Info
rmat
ion
Oth
er
Dem
and
Man
age
me
nt
36
Automated entry of 511 road weather information
Automate the entry of road weather information into MnDOT's 511 system. Tried X
Related to: 2014 MN Statewide Regional ITS
Architecture vol. 9 (L02)54
Weather data is currently not updated often enough. MnDOT will try crowdsourcing in winter 2016 to attempt more frequent updates. MDSS system (uses radar and RWIS) is very reliable and holds great potential for additional development.
37
Enhance Traveler Information for Transit and Other Modes
Expand 511 to provide travel information on public transit and other modes of transportation. Tried X X
2014 MN Statewide Regional ITS Architecture Vol. 9 (M09)
Sacramento Region Travel
Info/51187
Supportive of exploring this, as a way to shift demand. (e.g. “next LRT train at 5:12 pm.”)
38
Advanced Notice of Park and Ride Availability and Transit Options
Provide advanced information (e.g. DMS or 511) about availability at park and ride facilities or transit info (e.g. “next LRT train at 5:12 pm.”) Tried X X
Virginia DOT Statewide Park and Ride Program Best
Practices (2013)88
Combined strategy – roadside signage (DMS) and information via 511.

Minnesota Strategic ITS Research and Development Plan August 2015
71
Re
fere
nce
Nu
mb
er
Strategy Brief Description Maturity
Level
ITS Development Objectives
ITS Development Objectives
Source(s)
*Considerations
(*NOTE: Considerations include input gathered from MnDOT stakeholders during review of strategies in July 2015. Considerations will
change over time.)
A-1: Reduce crash frequency; A-2:
Reduce fatalities and life changing
injuries
B-1: Reduce overall delay associated with congestion; B-3: Reduce delays due to work zones; C-1: Reduce congestion and incident-
related delay; C-2: Improve Travel Time Reliability
Emphasis Areas Emphasis Areas
Inte
rse
ctio
ns
Lan
e D
ep
artu
re
Inat
ten
tive
Spe
ed
Traf
fic
Man
age
me
nt
Inci
de
nt
Man
age
me
nt
Trav
ele
r
Info
rmat
ion
Oth
er
Dem
and
Man
age
me
nt
39
Connected Vehicles: Advanced Traveler Information System (ATIS)
Research and develop ATIS: Provides for the collection, aggregation, and dissemination of information (e.g. traffic, transit, road weather, work zone, and connected vehicle data.) *ENTERPRISE created draft planning guidance for En-Route On-Road Dynamic Signing to Support Travel Times
Experi-mental X X X
USDOT Connected Vehicle Reference Implementation
Architecture (CVRIA)64
40
Connected Vehicles: Road Weather Advisories and Warnings for Motorists
Research and Develop “Road Weather Advisories and Warnings for Motorists”: Provides capability to collect road weather data from vehicles and develop short term warnings or advisories.
Experi-mental X X
USDOT Connected Vehicle Reference Implementation
Architecture (CVRIA)64
Minnesota Strategic ITS Research and Development Plan August 2015
72
6. Conclusions
The Minnesota Strategic ITS Research and Development Plan utilizes a data-driven process to analyze and identify ITS strategies and countermeasures to provide the best benefits for MnDOT’s ITS research and development and to guide MnDOT with future ITS development investment. Based on the analysis, four ITS development objectives are identified with critical importance and with data that are currently available for performing detailed analysis to understand the problems, needs, and potential solutions associated with them. The four ITS development objectives are:
Objective B-1: Reduce overall delay associated with congestion
Objective B-3: Reduce delays due to work zones
Objective C-1: Reduce congestion and incident-related delay for travelers
Objective C-2: Improve travel time reliability Four key emphasis areas for ITS research and development were identified as a result of the detailed analysis on the four ITS development objectives, as well as based on the types of quantitative performance measures that can be readily located and gathered via available sources. The emphasis areas for ITS research and development are:
Traffic Management
Traveler Information
Incident Management
Other Demand Management The emphasis areas along with the performance measures help MnDOT to objectively and quantitatively measure the amount of progress being made and the effectiveness of potential ITS strategies in achieving the corresponding ITS development objectives. The Strategic ITS Research and Development further presents forty (40) “tried” and “experimental” ITS strategies and countermeasures that can help achieve these four ITS development objectives and their respective emphasis areas. The recommendation of “tried” and “experimental” countermeasures is consistent with the ITS Development Unit’s responsibilities related to researching, developing, field testing and providing technical support for new ITS products, methods and systems. The 40 recommended ITS strategies and countermeasures cover the following five categories:
Safety: Nine (9) recommended ITS strategies and countermeasures.
Work Zones: Six (6) recommended ITS strategies and countermeasures.
Freeway Traffic Management: Twelve (12) recommended ITS strategies and countermeasures.
Arterial Traffic Management: Six (6) recommended ITS strategies and countermeasures.
Traveler Information/511: Seven (7) recommended ITS strategies and countermeasures. Stakeholders also suggested other ITS strategies that are not directly associated with the ITS development objectives or emphasis areas selected in this plan. While those strategies have merit, they are not included in the 40 recommended ITS strategies and countermeasures. Those strategies, however, are documented in Appendix B for future reference.

Minnesota Strategic ITS Research and Development Plan August 2015
73
The ITS strategies identified in this plan can be used by the MnDOT ITS Development Unit as a starting point when considering strategic research and development opportunities. The list is not intended to reflect every effort to be conducted; the list contains far more strategies than could be conducted in the near-term (i.e. 0-5 years) or even in the long term (i.e. 10 years.). Finally, this Strategic ITS Research and Development Plan is not the only source of research and development projects considered by the ITS Development Unit. The strategies in this plan compliment other sources of project ideas where others outside the ITS Development Unit bring forth ITS strategies for development; these external sources include the ITS Innovative Idea Program, internal management initiatives, and federal grant opportunities.

Minnesota Strategic ITS Research and Development Plan August 2015
74
Appendix A: Minnesota ITS Development Objectives (from 2014 Minnesota Statewide Regional ITS Architecture)
General Purpose: Create a system that enhances transportation through the safe and efficient movement of people, goods, and information, with greater mobility and fuel efficiency, less pollution, and increased operating efficiency in Minnesota. A. Improve the Safety of the State's Transportation System
A-1 Reduce crash frequency (ATIS, ATMS, APTS, CVO, EM, MCM & AVSS) A-1-01 Reduce number of vehicle crashes A-1-02 Reduce number of vehicle crashes per VMT A-1-03 Reduce number of crashes due to road weather conditions A-1-04 Reduce number of crashes due to unexpected congestion A-1-05 Reduce number of crashes due to red-light running A-1-06 Reduce number of crashes involving large trucks and buses A-1-07 Reduce number of crashes due to commercial vehicle safety violations A-1-08 Reduce number of crashes due to inappropriate lane departure, crossing and merging A-1-09 Reduce number of crashes at railroad crossings A-1-10 Reduce number of crashes at signalized intersections A-1-11 Reduce number of crashes at un-signalized intersections A-1-12 Reduce number of crashes due to excessive speeding A-1-13 Reduce number of crashes related to driving while intoxicated A-1-14 Reduce number of crashes related to driver inattention and distraction A-1-15 Reduce number of crashes involving pedestrians and non-motorized vehicles A-1-16 Reduce number of crashes at intersections due to inappropriate crossing A-1-17 Reduce number of crashes due to roadway/geometric restrictions A-1-18 Reduce number of crashes involving younger drivers (under 21) A-1-19 Reduce number of all secondary crashes
A-2 Reduce fatalities and life changing injuries (ATIS, ATMS, APTS, CVO, EM, MCM & AVSS) A-2-01 Reduce number of roadway fatalities A-2-02 Reduce number of roadway fatalities per VMT A-2-03 Reduce number of fatalities due to road weather conditions A-2-04 Reduce number of fatalities due to unexpected congestion A-2-05 Reduce number of fatalities due to red-light running A-2-06 Reduce number of fatalities involving large trucks and buses A-2-07 Reduce number of fatalities due to commercial vehicle safety violations A-2-08 Reduce number of transit fatalities A-2-09 Reduce number of fatalities due to inappropriate lane departure, crossing and
merging A-2-10 Reduce number of fatalities at railroad crossings A-2-11 Reduce number of fatalities at signalized intersections A-2-12 Reduce number of fatalities at un-signalized intersections A-2-13 Reduce number of fatalities due to excessive speeding A-2-14 Reduce number of fatalities related to driving while intoxicated A-2-15 Reduce number of fatalities related to driver inattention and distraction A-2-16 Reduce number of fatalities involving pedestrians and non-motorized vehicles

Minnesota Strategic ITS Research and Development Plan August 2015
75
A-2-17 Reduce number of fatalities at intersections due to inappropriate crossing A-2-18 Reduce number of fatalities due to roadway/geometric restrictions A-2-19 Reduce number of fatalities involving younger drivers (under 21) A-2-20 Reduce number of fatalities involving unbelted vehicle occupants A-2-21 Reduce number of hazardous materials transportation incidents involving fatalities A-2-22 Reduce number of roadway injuries A-2-23 Reduce number of roadway injuries per VMT A-2-24 Reduce number of injuries due to road weather conditions A-2-25 Reduce number of injuries due to unexpected congestion A-2-26 Reduce number of injuries due to red-light running A-2-27 Reduce number of injuries involving large trucks and buses A-2-28 Reduce number of injuries due to commercial vehicle safety violations A-2-29 Reduce number of transit injuries A-2-30 Reduce number of injuries due to inappropriate lane departure, crossing and merging A-2-31 Reduce number of injuries at railroad crossings A-2-32 Reduce number of injuries at signalized intersections A-2-33 Reduce number of injuries at un-signalized intersections A-2-34 Reduce number of injuries due to excessive speeding A-2-35 Reduce number of injuries related to driving while intoxicated A-2-36 Reduce number of injuries related to driver inattention and distraction A-2-37 Reduce number of injuries involving pedestrians and non-motorized vehicles A-2-38 Reduce number of injuries at intersections due to inappropriate crossing A-2-39 Reduce number of injuries due to roadway/geometric restrictions A-2-40 Reduce number of injuries involving younger drivers (under 21) A-2-41 Reduce number of injuries involving unbelted vehicle occupants A-2-42 Reduce number of hazardous materials transportation incidents involving injuries A-2-43 Reduce number of speed violations A-2-44 Reduce number of traffic law violations
A-3 Reduce crashes in work zones (ATIS, ATMS, EM, MCM & AVSS) A-3-01 Reduce number of crashes in work zones A-3-02 Reduce number of fatalities in work zones A-3-03 Reduce number of motorist injuries in work zones A-3-04 Reduce number of workers injured by vehicles in work zones B. Increase Operational Efficiency and Reliability of the Transportation System
B-1 Reduce overall delay associated with congestion (ATIS, ATMS, MCM & AVSS) B-1-01 Reduce the percentage of facility miles (highway, arterial, rail, etc.) experiencing
recurring congestion during the peak period B-1-02 Reduce the percentage of Twin Cities freeway miles congested in weekday peak
periods B-1-03 Reduce the share of major intersections operating at LOS F B-1-04 Maintain the rate of growth in facility miles experiencing recurring congestion as less
than the population growth rate (or employment growth rate) B-1-05 Reduce the daily hours of recurring congestion on major freeways B-1-06 Reduce the number of hours per day that the top 20 most congested roadways
experience recurring congestion B-1-07 Reduce the regional average travel time index

Minnesota Strategic ITS Research and Development Plan August 2015
76
B-1-08 Annual rate of change in regional average commute travel time will not exceed regional rate of population growth
B-1-09 Improve average travel time during peak periods B-1-10 Reduce hours of delay per capita B-1-11 Reduce hours of delay per driver B-1-12 Reduce the average of the 90th (or 95th) percentile travel times for (a group of
specific travel routes or trips in the region) B-1-13 Reduce the 90th (or 95th) percentile travel times for each route selected B-1-14 Reduce the variability of travel time on specified routes during peak and off-peak
periods B-1-15 Reduce mean incident notification time B-1-16 Reduce mean time for needed responders to arrive on-scene after notification B-1-17 Reduce mean incident clearance time per incident B-1-18 Reduce mean incident clearance time for Twin Cities urban freeway incidents
B-2 Increase average vehicle occupancy and facility throughput (ATMS & APTS) B-2-01 Increase annual transit ridership B-2-02 Increase annual express bus ridership B-2-03 Increase annual light rail ridership B-2-04 Increase annual commuter rail ridership B-2-05 Maintain agency pre-defined performance targets for rides per hour of transit service B-2-06 Maintain transit passengers per capita rate for service types B-2-07 Maintain the cost efficiency of the statewide public transit network B-2-08 Maintain the service effectiveness of the statewide public transit network in terms of
passengers/service hour and passengers/mile B-2-09 Maintain the cost effectiveness of the statewide public transit network in terms of
cost per service hour, cost per passenger trip, and revenue recovery percentage B-2-10 Maintain the availability of the statewide public transit network in terms of hours
(span) of service and frequency B-2-11 Reduce per capita single occupancy vehicle commute trip rate B-2-12 Increase the percentage of major employers actively participating in transportation
demand management programs B-2-13 Reduce commuter vehicle miles traveled (VMT) per regional job B-2-14 Create a transportation access guide, which provides concise directions to reach
destinations by alternative modes (transit, walking, bike, etc.) B-2-15 Improve average on-time performance for specified transit routes/facilities B-2-16 Increase use of automated fare collection system per year B-2-17 Increase the percent of transfers performed with automated fare cards B-2-18 Increase the miles of bus-only shoulder lanes in the metro area B-2-19 Increase the number of carpools B-2-20 Increase use of vanpools B-2-21 Provide carpool/vanpool matching and ridesharing information services B-2-22 Reduce trips per year in region through carpools/vanpools B-2-23 Increase vehicle throughput on specified routes B-2-24 Increase AM/PM peak hour vehicle throughput on specified routes B-2-25 Increase AM/PM peak hour person throughput on specified routes

Minnesota Strategic ITS Research and Development Plan August 2015
77
B-3 Reduce delays due to work zones (ATIS, ATMS, EM, MCM & AVSS) B-3-01 Reduce total vehicle hours of delay by time period (peak, off-peak) caused by work
zones B-3-02 Reduce the percentage of vehicles traveling through work zones that are queued B-3-03 Reduce the average and maximum length of queues, when present, B-3-04 Reduce the average time duration (in minutes) of queue length greater than some
threshold (e.g., 0.5 mile) B-3-05 Reduce the variability of travel time in work zones during peak and off-peak periods
B-4 Reduce traffic delays during evacuation from homeland security and Hazmat incidents (ATIS, ATMS, APTS, CVO, EM, MCM & AVSS)
B-4-01 Reduce vehicle hours of delay per capita during evacuation from homeland security and Hazmat incidents
C. Enhance Mobility, Convenience, and Comfort for Transportation System Users
C-1 Reduce congestion and incident-related delay for travelers (ATIS, ATMS, APTS, EM & AVSS) B-1-01 Reduce the percentage of facility miles (highway, arterial, rail, etc.) experiencing
recurring congestion during the peak period B-1-02 Reduce the percentage of Twin Cities freeway miles congested in weekday peak
periods B-1-03 Reduce the share of major intersections operating at LOS F B-1-04 Maintain the rate of growth in facility miles experiencing recurring congestion as less
than the population growth rate (or employment growth rate) B-1-05 Reduce the daily hours of recurring congestion on major freeways B-1-06 Reduce the number of hours per day that the top 20 most congested roadways
experience recurring congestion B-1-07 Reduce the regional average travel time index B-1-08 Annual rate of change in regional average commute travel time will not exceed
regional rate of population growth B-1-09 Improve average travel time during peak periods B-1-10 Reduce hours of delay per capita B-1-11 Reduce hours of delay per driver B-1-12 Reduce the average of the 90th (or 95th) percentile travel times for (a group of
specific travel routes or trips in the region) B-1-13 Reduce the 90th (or 95th) percentile travel times for each route selected B-1-14 Reduce the variability of travel time on specified routes during peak and off-peak
periods B-1-15 Reduce mean incident notification time B-1-16 Reduce mean time for needed responders to arrive on-scene after notification B-1-17 Reduce mean incident clearance time per incident B-1-18 Reduce mean incident clearance time for Twin Cities urban freeway incidents C-1-01 Reduce the vehicle hours of total delay associated with traffic incidents during peak
and off-peak periods C-1-02 Increase percentage of incident management agencies in the region that participate in
a multi-modal information exchange network C-1-03 Increase percentage of incident management agencies in the region that use
interoperable voice communications

Minnesota Strategic ITS Research and Development Plan August 2015
78
C-1-04 Increase percentage of incident management agencies in the region that participate in a regional coordinated incident response team
C-1-05 Increase the number of corridors in the region covered by regional coordinated incident response teams
C-1-06 Maintain a percentage of transportation operating agencies have a plan in place for a representative to be at the local or State Emergency Operations Center (EOC) to coordinate strategic activities and response planning for transportation during emergencies
C-1-07 Conduct joint training exercises among operators and emergency responders in the region
C-1-08 Maintain a percentage of staff in region with incident management responsibilities who have completed the National Incident Management System (NIMS) Training and a percentage of transportation responders in the region are familiar with the incident command structure (ICS)
C-1-09 Increase number of regional road miles covered by ITS-related assets (e.g., roadside cameras, dynamic message signs, vehicle speed detectors) in use for incident detection / response
C-1-10 Increase number of traffic signals equipped with emergency vehicle preemption
C-2 Improve travel time reliability (ATIS, ATMS, APTS & AVSS) B-1-07 Reduce the regional average travel time index B-1-12 Reduce the average of the 90th (or 95th) percentile travel times for (a group of
specific travel routes or trips in the region) B-1-14 Reduce the variability of travel time on specified routes during peak and off-peak
periods B-2-15 Improve average on-time performance for specified transit routes/facilities B-2-16 Increase use of automated fare collection system per year B-2-17 Increase the percent of transfers performed with automated fare cards C-2-01 Decrease the average buffer index for multiple routes or trips C-2-02 Reduce the average planning time index for specific routes in region C-2-03 Increase the miles of bus-only shoulder lanes in the metro area
C-3 Increase choice of travel modes (ATIS, ATMS & APTS) B-2-01 Increase annual transit ridership B-2-11 Reduce per capita single occupancy vehicle commute trip rate B-2-12 Increase the percentage of major employers actively participating in transportation
demand management programs B-2-13 Reduce commuter vehicle miles traveled (VMT) per regional job B-2-14 Create a transportation access guide, which provides concise directions to reach
destinations by alternative modes (transit, walking, bike, etc.) C-3-01 Increase active (bicycle/pedestrian) mode share C-3-02 Reduce single occupancy vehicle trips through travel demand management strategies
(e.g., employer or residential rideshare) C-3-03 Increase the percent of alternative (non-single occupancy vehicle) mode share in
transit station communities (or other areas) C-3-04 Increase transit mode share C-3-05 Increase transit mode share during peak periods C-3-06 Increase average transit load factor

Minnesota Strategic ITS Research and Development Plan August 2015
79
C-3-07 Increase passenger miles traveled per capita on transit C-3-08 Reduce the travel time differential between transit and auto during peak periods per
year C-3-09 Increase the percent of the transportation system in which travel conditions can be
detected remotely via CCTV, speed detectors, etc. C-3-10 Increase the percent of transportation facilities whose owners share their traveler
information with other agencies in the region C-3-11 Increase number of 511 calls per year C-3-12 Increase number of visitors to traveler information website per year C-3-13 Increase number of users of notifications for traveler information (e.g., e-mail, text
message) C-3-14 Increase the number of transit routes with information being provided by ATIS C-3-15 Increase the number of specifically tailored traveler information messages provided C-3-16 Increase annual transit ridership reported by urbanized area transit providers C-3-17 Increase annual transit ridership reported by rural area transit providers
C-4 Reduce stress caused by transportation (ATIS, ATMS, APTS, EM, MCM & AVSS) A-2-43 Reduce number of speed violations A-2-44 Reduce number of traffic law violations B-1-01 Reduce the percentage of facility miles (highway, arterial, rail, etc.) experiencing
recurring congestion during the peak period B-1-02 Reduce the percentage of Twin Cities freeway miles congested in weekday peak
periods B-1-03 Reduce the share of major intersections operating at LOS F B-1-04 Maintain the rate of growth in facility miles experiencing recurring congestion as less
than the population growth rate (or employment growth rate) B-1-05 Reduce the daily hours of recurring congestion on major freeways B-1-06 Reduce the number of hours per day that the top 20 most congested roadways
experience recurring congestion B-1-07 Reduce the regional average travel time index B-1-08 Annual rate of change in regional average commute travel time will not exceed
regional rate of population growth B-1-09 Improve average travel time during peak periods B-1-10 Reduce hours of delay per capita B-1-11 Reduce hours of delay per driver B-1-12 Reduce the average of the 90th (or 95th) percentile travel times for (a group of
specific travel routes or trips in the region) B-1-13 Reduce the 90th (or 95th) percentile travel times for each route selected B-1-14 Reduce the variability of travel time on specified routes during peak and off-peak
periods B-1-15 Reduce mean incident notification time B-1-16 Reduce mean time for needed responders to arrive on-scene after notification C-3-11 Increase number of 511 calls per year C-3-12 Increase number of visitors to traveler information website per year C-3-13 Increase number of users of notifications for traveler information (e.g., e-mail, text
message) C-3-14 Increase the number of transit routes with information being provided by ATIS C-3-15 Increase the number of specifically tailored traveler information messages provided

Minnesota Strategic ITS Research and Development Plan August 2015
80
C-4-01 Reduce the speed differential between lanes of traffic on multi-lane highways C-4-02 Increase the number of users aware of park-and-ride lots in their region C-4-03 Increase the number parking facilities with electronic fee collection C-4-04 Increase the number of parking facilities with automated occupancy counting and
space management C-4-05 Increase the number of parking facilities with advanced parking information to
customers C-4-06 Increase the number of parking facilities with coordinated electronic payment systems C-4-07 Increase the number of parking facilities with coordinated availability information D. Improve the Security of the Transportation System
D-1 Enhance traveler security (APTS & EM) C-3-09 Increase the percent of the transportation system in which travel conditions can be
detected remotely via CCTV, speed detectors, etc. D-1-01 Reduce on an annual basis the number of complaints per 1,000 boarding passengers D-1-02 Increase the number of closed circuit television (CCTV) cameras installed on platforms,
park-n-ride lots, vehicles, and other transit facilities D-1-03 Increase customer service and personal safety ratings D-1-04 Reduce the number of reported personal safety incidents D-1-05 Decrease the number of security incidents on roadways D-1-06 Increase the percent of major and minor arterials are equipped with and operating
with closed circuit television (CCTV) cameras D-1-07 Increase the number of critical sites with security surveillance D-1-08 Reduce the number of security incidents on transportation infrastructure D-1-09 Increase the number of critical sites with hardened security enhancements
D-2 Safeguard the motoring public from homeland security and/or Hazmat incidents (ATIS, ATMS, APTS, CVO, EM, MCM & AVSS)
B-1-16 Reduce mean time for needed responders to arrive on-scene after notification C-3-09 Increase the percent of the transportation system in which travel conditions can be
detected remotely via CCTV, speed detectors, etc. D-1-01 Reduce on an annual basis the number of complaints per 1,000 boarding passengers D-1-02 Increase the number of closed circuit television (CCTV) cameras installed on platforms,
park-n-ride lots, vehicles, and other transit facilities D-1-03 Increase customer service and personal safety ratings D-1-04 Reduce the number of reported personal safety incidents D-1-05 Decrease the number of security incidents on roadways D-1-06 Increase the percent of major and minor arterials are equipped with and operating
with closed circuit television (CCTV) cameras D-1-07 Increase the number of critical sites with security surveillance D-1-08 Reduce the number of security incidents on transportation infrastructure D-1-09 Increase the number of critical sites with hardened security enhancements D-2-01 Reduce the number of Hazmat incidents D-2-02 Reduce the number of homeland security incidents D-2-03 Increase the number of travelers routed around Hazmat incidents D-2-04 Increase the number of travelers routed around homeland security incidents D-2-05 Reduce the Hazmat incident response time D-2-06 Reduce the homeland security incident response time

Minnesota Strategic ITS Research and Development Plan August 2015
81
D-2-07 Increase the number of Hazmat shipments tracked in real-time E. Support Regional Economic Productivity and Development
E-1 Reduce travel time for freight, transit and businesses (ATIS, ATMS, APTS, CVO & AVSS) B-1-14 Reduce the variability of travel time on specified routes during peak and off-peak
periods B-2-15 Improve average on-time performance for specified transit routes/facilities B-2-16 Increase use of automated fare collection system per year B-2-17 Increase the percent of transfers performed with automated fare cards C-2-09 Increase the miles of bus-only shoulder lanes in the metro area C-3-08 Reduce the travel time differential between transit and auto during peak periods per
year E-1-01 Maintain a travel time differential between transit and auto during peak periods E-1-02 Improve average transit travel time compared to auto in major corridors E-1-03 Decrease the annual average travel time index for selected freight-significant
highways E-1-04 Decrease point-to-point travel times on selected freight-significant highways E-1-05 Decrease hours of delay per 1,000 vehicle miles traveled on selected freight-
significant highways
E-2 Improve the efficiency of freight movement, permitting and credentials process (ATIS & CVO) E-2-01 Increase the percent (or number) of commercial vehicles tracked by trucking
companies E-2-02 Increase the percent (or number) of freight shipment tracked E-2-03 Increase the percent of agencies involved in CVO inspection, administration,
enforcement, and emergency management in the region with interoperable communications
E-2-04 Increase the use of electronic credentialing at weigh stations and border crossings E-2-05 Increase the number of automated permits/credentials issued E-2-06 Reduce the frequency of delays per month at intermodal facilities E-2-07 Reduce the average duration of delays per month at intermodal facilities
E-3 Improve travel time reliability for freight, transit and businesses (ATMS, APTS, CVO & AVSS) B-1-14 Reduce the variability of travel time on specified routes during peak and off-peak
periods B-2-15 Improve average on-time performance for specified transit routes/facilities B-2-16 Increase use of automated fare collection system per year B-2-17 Increase the percent of transfers performed with automated fare cards C-1-06 Increase percentage of incident management agencies in the region that participate in
a multi-modal information exchange network C-2-09 Increase the miles of bus-only shoulder lanes in the metro area C-3-09 Increase the percent of the transportation system in which travel conditions can be
detected remotely via CCTV, speed detectors, etc. C-3-10 Increase the percent of transportation facilities whose owners share their traveler
information with other agencies in the region C-3-13 Increase number of users of notifications for traveler information (e.g., e-mail, text
message)

Minnesota Strategic ITS Research and Development Plan August 2015
82
E-1-08 Decrease the annual average travel time index for selected freight-significant highways
E-2-04 Increase the use of electronic credentialing at weigh stations and border crossings E-3-01 Reduce average crossing times at international borders
E-4 Increase agency efficiency (ADMS, ATMS, APTS, CVO, EM & MCM) B-2-15 Improve average on-time performance for specified transit routes/facilities B-2-16 Increase use of automated fare collection system per year B-2-17 Increase the percent of transfers performed with automated fare cards C-2-09 Increase the miles of bus-only shoulder lanes in the metro area E-2-01 Increase the percent (or number) of commercial vehicles tracked by trucking
companies E-2-03 Increase the percent of agencies involved in CVO inspection, administration,
enforcement, and emergency management in the region with interoperable communications
E-4-01 Increase the number of ITS-related assets tracked E-4-02 Reduce the number of pavement miles damaged by commercial vehicles E-4-03 Increase the rate of on-time completion of construction projects E-4-04 Increase the rate at which equipment is utilized E-4-05 Increase the percentage of fleet / equipment within its lifecycle E-4-06 Increase the number of fleet vehicles with maintenance diagnostic equipment E-4-07 Increase the number of vehicles operating under CAD
E-5 Reduce vehicle operating costs (ATMS, APTS, CVO & AVSS) B-1-01 Reduce the percentage of facility miles (highway, arterial, rail, etc.) experiencing
recurring congestion during the peak period B-1-02 Reduce the percentage of Twin Cities freeway miles congested in weekday peak
periods B-1-03 Reduce the share of major intersections operating at LOS F B-1-04 Maintain the rate of growth in facility miles experiencing recurring congestion as less
than the population growth rate (or employment growth rate) B-1-05 Reduce the daily hours of recurring congestion on major freeways B-1-06 Reduce the number of hours per day that the top 20 most congested roadways
experience recurring congestion B-1-07 Reduce the regional average travel time index B-1-08 Annual rate of change in regional average commute travel time will not exceed
regional rate of population growth B-1-09 Improve average travel time during peak periods B-1-10 Reduce hours of delay per capita B-1-11 Reduce hours of delay per driver B-1-12 Reduce the average of the 90th (or 95th) percentile travel times for (a group of
specific travel routes or trips in the region) B-1-13 Reduce the 90th (or 95th) percentile travel times for each route selected B-1-14 Reduce the variability of travel time on specified routes during peak and off-peak
periods
E-6 Enhance efficiency at borders (ATIS & CVO) E-2-04 Increase the use of electronic credentialing at weigh stations and border crossings

Minnesota Strategic ITS Research and Development Plan August 2015
83
E-3-11 Reduce average crossing times at international borders F. Preserve the Transportation System
F-1 Safeguard existing infrastructure (ATMS, CVO, EM & MCM) C-3-09 Increase the percent of the transportation system in which travel conditions can be
detected remotely via CCTV, speed detectors, etc. D-1-06 Increase the percent of major and minor arterials are equipped with and operating
with closed circuit television (CCTV) cameras D-1-07 Increase the number of critical sites with security surveillance D-1-08 Reduce the number of security incidents on transportation infrastructure D-1-09 Increase the number of critical sites with hardened security enhancements E-2-03 Increase the percent of agencies involved in CVO inspection, administration,
enforcement, and emergency management in the region with interoperable communications
E-4-03 Increase the rate of on-time completion of construction projects F-1-01 Decrease the number of pavement miles damaged by commercial vehicles F-1-02 Decrease the number of size and weight violations G. Enhance the Integration and Connectivity of the Transportation System
G-1 Aid in transportation infrastructure and operations planning (ALL) G-1-01 Increase the amount of data gathered from ITS enhancements used in infrastructure
and operations planning G-1-02 Increase the number of planning activities using data from ITS systems G-1-03 Increase the number of years of data in database that is easily searchable and
extractable G-1-04 Reduce project schedule deviation G-1-05 Reduce project cost deviation G-1-06 Reduce operations cost deviation G-1-07 Reduce administrative support rate (as part of overall project budget)
G-2 Reduce need for new facilities (ATMS, CVO, MCM & AVSS) B-1-01 Reduce the percentage of facility miles (highway, arterial, rail, etc.) experiencing
recurring congestion during the peak period B-1-02 Reduce the percentage of Twin Cities freeway miles congested in weekday peak
periods B-1-03 Reduce the share of major intersections operating at LOS F B-1-04 Maintain the rate of growth in facility miles experiencing recurring congestion as less
than the population growth rate (or employment growth rate) B-1-05 Reduce the daily hours of recurring congestion on major freeways B-1-06 Reduce the number of hours per day that the top 20 most congested roadways
experience recurring congestion B-1-07 Reduce the regional average travel time index B-1-08 Annual rate of change in regional average commute travel time will not exceed
regional rate of population growth B-1-09 Improve average travel time during peak periods B-1-10 Reduce hours of delay per capita B-1-11 Reduce hours of delay per driver

Minnesota Strategic ITS Research and Development Plan August 2015
84
B-1-12 Reduce the average of the 90th (or 95th) percentile travel times for (a group of specific travel routes or trips in the region)
B-1-13 Reduce the 90th (or 95th) percentile travel times for each route selected B-1-14 Reduce the variability of travel time on specified routes during peak and off-peak
periods E-2-04 Increase the use of electronic credentialing at weigh stations and border crossings E-2-05 Increase the number of automated permits/credentials issued E-3-11 Reduce average crossing times at international borders H. Reduce Environmental Impacts
H-1 Reduce emissions/energy impacts and use associated with congestion (ATIS, ATMS, CVO & AVSS) B-1-01 Reduce the percentage of facility miles (highway, arterial, rail, etc.) experiencing
recurring congestion during the peak period B-1-02 Reduce the percentage of Twin Cities freeway miles congested in weekday peak
periods B-1-03 Reduce the share of major intersections operating at LOS F B-1-04 Maintain the rate of growth in facility miles experiencing recurring congestion as less
than the population growth rate (or employment growth rate) B-1-05 Reduce the daily hours of recurring congestion on major freeways B-1-06 Reduce the number of hours per day that the top 20 most congested roadways
experience recurring congestion B-1-07 Reduce the regional average travel time index B-1-08 Annual rate of change in regional average commute travel time will not exceed
regional rate of population growth B-1-09 Improve average travel time during peak periods B-1-10 Reduce hours of delay per capita B-1-11 Reduce hours of delay per driver B-1-12 Reduce the average of the 90th (or 95th) percentile travel times for (a group of
specific travel routes or trips in the region) B-1-13 Reduce the 90th (or 95th) percentile travel times for each route selected B-1-14 Reduce the variability of travel time on specified routes during peak and off-peak
periods H-1-01 Reduce excess fuel consumed due to congestion H-1-02 Reduce total fuel consumed per capita for transportation H-1-03 Reduce vehicle miles traveled per capita H-1-04 Reduce MnDOT fleet gasoline use H-1-05 Reduce MnDOT fleet diesel use H-1-06 Reduce the amount of all emissions in the atmosphere H-1-07 Reduce the amount of carbon dioxide emissions measured
H-2 Reduce negative impacts of the transportation system on communities (ATMS, APTS, EM & MCM)
A-2-44 Reduce number of traffic law violations B-2-01 Increase annual transit ridership B-2-12 Increase the percentage of major employers actively participating in transportation
demand management programs B-2-13 Reduce commuter vehicle miles traveled (VMT) per regional job

Minnesota Strategic ITS Research and Development Plan August 2015
85
B-2-14 Create a transportation access guide, which provides concise directions to reach destinations by alternative modes (transit, walking, bike, etc.)
B-2-19 Increase the number of carpools B-2-20 Increase use of vanpools B-2-21 Provide carpool/vanpool matching and ridesharing information services B-2-22 Reduce trips per year in region through carpools/vanpools H-2-01 Increase the average vehicle occupancy rate in HOV lanes H-2-02 Increase the amount of environmentally friendly de-icing material used ADMS: Archived Data Management Systems AVSS: Advanced Vehicle Safety Systems APTS: Advanced Public Transportation Systems CVO: Commercial Vehicle Operations ATIS: Advanced Traveler Information Systems EM: Emergency Management ATMS: Advanced Traffic Management Systems MCM: Maintenance and Construction Management

Minnesota Strategic ITS Research and Development Plan August 2015
86
Appendix B: Other ITS Research and Development Strategies
The following ITS strategies were suggested during meetings with key MnDOT stakeholders held on 7/21/15 and7/22/15. While these strategies have merit, they were not selected for inclusion in this Strategic ITS Research and Development Plan because they do not meet one of the selected ITS development objectives or emphasis areas as identified in this plan. The MnDOT ITS Development Unit is interested in documenting these strategies for future reference.
Strategy Brief Description Maturity
Level Source(s)
*Considerations (*NOTE: Considerations will
change over time.)
Arterial Traffic Management
Alternative Detection Technologies at Signalized Intersections
Investigate the use of new types of traffic detection technologies for use at signalized intersections. Explore effectiveness of non-intrusive detection devices.
Experi-mental
7/21/15 meeting with Steve Misgen.
This is timely, as it has been quite some time since MnDOT has investigated alternative traffic detection devices for signal use.
48 Volt DC Signal Cabinets
Test the use of 48 volt DC traffic signal cabinets. This is a new technology, experimental concept.
Experi-mental
7/21/15 meeting with Steve Misgen.
Benefits include potentially significant cost savings.
Work Zones
Technologies to Assist Flaggers
Systems to assist flaggers (horns, pilot car, arrow to direct traffic, vests equipped with detection/alert) for 2-lane, 2-way highways. Help navigate traffic through the work zone and improve safety for the flagger.
Experi-mental/
Tried 7/22/15 meeting with Ken Johnson.
Automated Flagger Assistance Devices have been tried. Other approaches are more experimental.
Automated Alerts and/or Enforcement of Dimension Limits through Work Zones
Automated alerts and/or enforcement for trucks that proceed through work zones where the vehicle dimensions exceed the navigable space, especially through curves.
Experi-mental
7/22/15 meeting with Ken Johnson.
Curve geometry that does not accommodate heavy trucks (due to length/width of trucks) through work zones is often unavoidable due to geometric constraints. Need a way to automated alerts and enforcement.

Minnesota Strategic ITS Research and Development Plan August 2015
87
References
1 Metropolitan Freeway System 2013 Congestion Report. Available at:
http://www.dot.state.mn.us/rtmc/reports/congestionreport2013.pdf
2 MnDOT Metropolitan District 20-year Highway Investment Plan. Available at:
http://www.dot.state.mn.us/metro/programmanagement/pdf/longrangeplan.pdf
3 Phone conversation on July 31, 2014.
4 Project summary available at: http://www.dot.state.mn.us/research/TS/2013/201306TS.pdf
5 I-35W South MnPASS Hot Lanes, Authored by Katherine F. Turnbull, Ken Buckeye, Nick Thompson, TRB 2013
Annual Meeting. Available at: http://docs.trb.org/prp/13-2146.pdf
6 I-394 MnPASS: A New Choice for Commuters. Available at: http://www.mnpass.org/pdfs/mnpassreport-
uofm0306.pdf
7 MnPASS Express Lanes Annual Report, April 1, 2012 – March 31, 2013. Report dated April 23, 2013. Available at:
http://www.dot.state.mn.us/rtmc/reports/mnpassreport2013.pdf
8 Phone conversation June 30
th, 2014.
9 Phone conversation July 1
st, 2014.
10 Phone conversation July 31
st, 2014.
11 Work Zone Detection Presentation by Terry Haukom and Brian Kary. March 2013. Available at:
http://www.google.com/url?sa=t&rct=j&q=&esrc=s&frm=1&source=web&cd=1&cad=rja&uact=8&ved=0CB0QFjAA&url=http%3A%2F%2Fwww.dot.state.mn.us%2Fconsult%2Fdocuments%2Fevents%2F2013-acec%2Fterry-haukom.pptx&ei=HAnIU4iWJM6uyAS1zIDwAw&usg=AFQjCNHu6S1PteSCSzGuHqJ3iblTG1Ud1g
12 FHWA Office of Operations. http://www.ops.fhwa.dot.gov/aboutus/opstory.htm. Last modified: April 3, 2013.
13 2010 Annual Minnesota Transportation Performance Report, Available at:
http://www.dot.state.mn.us/measures/ada.html#incidentclearance
14 2011 Annual Minnesota Transportation Performance Report, Available at:
http://www.dot.state.mn.us/measures/pdf/2011_Scorecard_10-19-12.pdf
15 MnDOT Metropolitan District 20-year Highway Investment Plan. Available at:
http://www.dot.state.mn.us/planning/stateplan/Final%20Plan%20Documents/Highway%20Investment%20Plans/District/PDF/Metro%20District%20Highway%20Investment%20Plan.pdf
16 I-35W South MnPASS Hot Lanes, Authored by Katherine F. Turnbull, Ken Buckeye, Nick Thompson, TRB 2013
Annual Meeting. Available at: http://docs.trb.org/prp/13-2146.pdf
17 2012 Urban Mobility Report, Texas Transportation Institute, December 2012. Authored by: David Schrank, Bill
Eisele, Tim Lomax
18 Transportation Research Board, Strategic Highway Research Program Reliability Projects. Available at:
http://www.trb.org/StrategicHighwayResearchProgram2SHRP2/Pages/Reliability_Projects_302.aspx
19 The Effect of Smart Growth Policies on Travel Demand. SHRP 2 Capacity Project C16. August 2012. Prepared by
Resource Systems Group, Fehr & Peers, Dr. Robert Cervero, Dr. Kara Kockelman, and Renaissance Planning Group. Available at: http://onlinepubs.trb.org/onlinepubs/shrp2/SHRP2prepubC16.pdf
20 Truck Parking Availability Study: Demonstration Project. Available at:
http://www.cts.umn.edu/Research/featured/truckparking/
21 Phone conversation July 24, 2014.

Minnesota Strategic ITS Research and Development Plan August 2015
88
22
Phone conversation with Brian Kary, August, 7th
, 2014.
23 Truck Priority at Signalized Intersections. Produced by S.E.H., Inc. Dated Dec. 15, 2004.
24 2012 Annual Minnesota Transportation Performance Report. Available at:
http://www.dot.state.mn.us/measures/
25 Meeting on July 2, 2014.
26 Available at: https://osowpermits.dot.state.mn.us/rbnet/HelpFiles/Main.htm
27 Meeting on July 8, 2015.
28 Phone conversation July 23, 2014.
29 Phone conversation July 23, 2014.
30 Phone conversation August 7
th, 2014.
31 Available at: http://ops.fhwa.dot.gov/1201/factsheet/
32 Evaluation of Travel Time Methods to Support Mobility Performance Monitoring: FY 2001 Synthesis Report, Final
Report, April 2002, Available at: http://ops.fhwa.dot.gov/freight/documents/brdr_synthesis.pdf
33 Assessment of Automated Data Collection Technologies for Calculation of Commercial Motor Vehicle Border
Crossing Travel Time Delay, Final Report, April 2002. Available at: http://ops.fhwa.dot.gov/freight/freight_analysis/auto_tech/index.htm#toc
34 Phone conversation July 24
th, 2014.
35 http://www.cbp.gov/travel/trusted-traveler-programs/nexus
36 2012 Annual Minnesota Transportation Performance Report, Minnesota 2012 Transportation Results Scorecard.
Available at: http://www.dot.state.mn.us/measures/pdf/Standalone%20Scorecard.pdf
37 Meeting on July 8, 2015.
38 Acoustic Emission Monitoring of a Fracture-Critical Bridge. Prepared by Arturo E. Schultz, Daniel L. Morton,
Anton S. Tillmann, Javier E. Campos, David J. Thompson, Alexandria J. Lee-Norris, and Ryan M. Ballard. March 2014. Available at: http://www.dot.state.mn.us/research/TS/2014/201415.pdf
39 Phone conversation on June 30
th, 2014.
40 U.S. Department of Transportation, Planning for Operations. Tool for Operations Benefit Cost Analysis (TOPS-
BC). Available at: http://www.plan4operations.dot.gov/topsbctool/index.htm.
41 2012 Annual Minnesota Transportation Performance Report, Prepared by MnDOT. Available at:
42 Greenhouse Gas Emissions Reduction: Biennial Report to the Minnesota Legislature, January 2013. Available at:
http://www.pca.state.mn.us/index.php/topics/climate-change/climate-change-in-minnesota/report-on-greenhouse-gas-emissions-in-minnesota.html
43 Traffic Congestion and Reliability: Trends and Advanced Strategies for Congestion Mitigation. Available at:
http://www.ops.fhwa.dot.gov/congestion_report/chapter3.htm#1
44 Chin, S.M., Franzese, O., Greene, D.L., Hwang, H.L., and Gibson, R.C., Temporary Losses of Highway Capacity and
Impacts on Performance: Phase 2. November 2004. Available at: http://cta.ornl.gov/cta/Publications/Reports/ORNL_TM_2004_209.pdf
45 Texas Transportation Institute Annual Urban Mobility Report. http://tti.tamu.edu/documents/ums/congestion-
data/complete-data.xls
46 MnDOT Performance Management System (PeMS). Available at: http://mndot.bt-
systems.com/?dnode=Help&content=help_topic&t=bn

Minnesota Strategic ITS Research and Development Plan August 2015
89
47
Develop Annual Arterial Congestion Report. Prepared by Henry X. Liu, SMART Signal Technologies, Inc. April 2015.
48 Traffic Congestion and Reliability: Trends and Advanced Strategies for Congestion Mitigation. Available at:
http://www.ops.fhwa.dot.gov/congestion_report/chapter3.htm#1
49 Gerald L. Ullman, Richard J. Porter, and Ganesh J. Karkee. Monitoring Work Zone Safety and Mobility Impacts in
Texas. May 2009. Available at: http://d2dtl5nnlpfr0r.cloudfront.net/tti.tamu.edu/documents/0-5771-1.pdf
50 Accessed from PeMS. Report Available by Clicking Here.
51 MnDOT PeMS. Report Available by Clicking Here.
52 PeMS Data. Report Available by Clicking Here.
53 2014 MSHSP. Emphasis Areas for ITS Development Objectives A-1, A-2, and A-3 are selected from relevant focus
areas from the 2014 MSHSP.
54 Minnesota Statewide Regional ITS Architecture, Volume 9 – Version 2014. Minnesota Department of
Transportation. http://www.dot.state.mn.us/guidestar/2006_2010/mnitsarchitecture.html
55 Minnesota Strategic Highway Safety Plan 2014-2019. Minnesota Department of Transportation.
http://www.dot.state.mn.us/trafficeng/safety/shsp/Minnesota_SHSP_2014.pdf
56 MnDOT Metropolitan Freeway System 2014 Congestion Report. Minnesota Department of Transportation.
http://www.dot.state.mn.us/rtmc/reports/2014congestionreport.pdf
57 George F. List, Billy Williams, and Nagui Rouphail. (2014). SHRP2 S2-L02-RR-2 Guide to Establishing Monitoring
Programs for Mobility and Travel Time Reliability. Transportation Research Board, Washington DC. http://www.trb.org/Main/Blurbs/168764.aspx
58 Hani S. Mahmassani, et al. (2014). SHRP2 S2-L04-RW-2 Incorporating Reliability Performance Measures in
Operations and Planning Modeling Tools: Application Guidelines. Transportation Research Board, Washington DC. http://www.trb.org/Main/Blurbs/170717.aspx
59 Kittelson & Associates, Inc. (2013). SHRP2 Report S2-L11-RR-1 Evaluating Alternative Operations Strategies to
Improve Travel Time Reliability. Transportation Research Board, Washington DC. http://www.trb.org/Main/Blurbs/168142.aspx
60 Kittelson & Associates, Inc. (2014). SHRP2 Report S2-C05-RW-1 Understanding the Contribution of Operations,
Technology, and Design to Meeting Highway Capacity Needs. Transportation Research Board, Washington DC. http://www.trb.org/Main/Blurbs/166939.aspx
61 USDOT ITS Benefits Database. Retrieved 7/27/15. United States Department of Transportation website.
http://www.itsbenefits.its.dot.gov/
62 USDOT 2014-2019 ITS Strategic Plan. Retrieved 7/27/15. United States Department of Transportation website.
http://www.its.dot.gov/strategicplan/
63 USDOT National ITS Architecture: Service Packages. Retrieved 7/27/15. United States Department of
Transportation website. http://www.iteris.com/itsarch/html/mp/mpindex.htm
64 Connected Vehicle Reference Implementation Architecture (CVRIA). Retrieved 7/27/15. United States
Department of Transportation website. http://www.iteris.com/cvria/html/applications/applications.html
65 Michigan DOT Regional ITS Architectures and Deployment Plans. Retrieved on 7/27/15. Michigan Department of
Transportation website. http://www.michigan.gov/mdot/0,4616,7-151-9615_44489-211021--,00.html
66 Florida DOT Statewide and Regional ITS Architectures. Retrieved on 7/27/15. Florida Department of
Transportation website. http://www.consystec.com/florida/default.htm

Minnesota Strategic ITS Research and Development Plan August 2015
90
67
20-Year Minnesota State Highway Investment Plan 2014-2033 (MnSHIP). Minnesota Department of Transportation. http://www.dot.state.mn.us/planning/mnship/
68 FHWA “Red Light Cameras/Automated Enforcement” web page. Retrieved on 7/27/15. United States
Department of Transportation website. http://safety.fhwa.dot.gov/intersection/redlight/cameras/
69 USDOT ITS Benefits Database (PA Turnpike – 2006). Retrieved 7/27/15. United States Department of
Transportation website. http://www.itsbenefits.its.dot.gov/ITS/benecost.nsf/ID/3FE801DA286793B4852573DA0063E9BA?OpenDocument&Query=Home
70 USDOT ITS Benefits Database (Wash DC – 1998). Retrieved 7/27/15. United States Department of Transportation
website. http://www.itsbenefits.its.dot.gov/ITS/benecost.nsf/ID/22D73F749A104372852569610051E2DF?OpenDocument&Query=Home
71 WSDOT Adaptive LED Lighting Pilot Project web page. Retrieved on 7/27/15. Washington State Department of
Transportation website. http://www.wsdot.wa.gov/Design/Traffic/Electrical/LEDPilotProject
72 Comparative Analysis Report: The Benefits of Using Intelligent Transportation Systems in Work Zones. (2008).
Federal Highway Administration. Washington, DC. http://www.ops.fhwa.dot.gov/wz/its/wz_comp_analysis/comp_anl_rpt_08.pdf
73 Tina Roelofs and Chris Brookes. Synthesis of Intelligent Work Zone Practices. (2014). ENTERPRISE Pooled Fund
Program, Michigan Department of Transportation. Lansing, MI. http://enterprise.prog.org/Projects/2010_Present/iwz/ENT_SynthesisofIWZPractices_FINALReport_June2014.pdf
74 USDOT ITS Benefits Database (ICM simulation models -2009). Retrieved 7/27/15. United States Department of
Transportation website. http://www.itsbenefits.its.dot.gov/its/benecost.nsf/ID/CCE9E850E04CFC9285257663006F8FFA?OpenDocument&Query=Home
75 Beverly Kuhn. (2010). Efficient Use of Highway Capacity Summary - Report to Congress. Federal Highway
Administration. Washington, DC. http://www.ops.fhwa.dot.gov/publications/fhwahop10023/fhwahop10023.pdf
76 Ghulam H. Bham, et al. (2010). Evaluation of Variable Speed Limits on I‐270/I‐255 in St. Louis. Missouri
Department of Transportation. Jefferson City, MO. http://library.modot.mo.gov/RDT/reports/Ri08025/or11014rpt.pdf
77 WSDOT Active Traffic and Demand Management web page. Retrieved on 7/27/15. Washington State
Department of Transportation website. http://www.wsdot.wa.gov/Operations/Traffic/ActiveTrafficManagement/
78 M42 Active Traffic Management Scheme, Birmingham, United Kingdom. Retrieved on 7/2715 from roadtraffic-
technology.com website. http://www.roadtraffic-technology.com/projects/m42/
79 Brian L. Smith, et al. (2009). Investigation of Enforcement Techniques and Technologies to Support High
Occupancy Toll Operations. Virginia Department of Transportation. Richmond, VA. http://www.virginiadot.org/vtrc/main/online_reports/pdf/10-cr1.pdf
80 Robert W. Poole, Jr. (2011). Automating HOT Lanes Enforcement. Reason Foundation. Los Angeles, CA.
http://reason.org/files/automating_hot_lanes_enforcement.pdf
81 Jaimison Sloboden, et al. (2012). FHWA Guidebook on the Use of Dynamic Traffic Assignment in Modeling.
Federal Highway Administration. Washington, DC. http://ops.fhwa.dot.gov/publications/fhwahop13015/fhwahop13015.pdf
82 San Francisco Transportation Authority Dynamic Traffic Assignment (DTA) web page. Retrieved on 7/27/15. San
Francisco Transportation Authority website. http://www.sfcta.org/modeling-and-travel-forecasting/dynamic-traffic-assignment-dta

Minnesota Strategic ITS Research and Development Plan August 2015
91
83
Mohammed Hadi, et al. (2013). Application of Dynamic Traffic Assignment to Advanced Managed Lane Modeling. Florida Department of Transportation. Tallahassee, FL. http://www.dot.state.fl.us/research-center/Completed_Proj/Summary_PL/FDOT-BDK80-977-30-rpt.pdf
84 Richard G. Dowling and Aaron Elias. (2013). NCHRP Synthesis 477: Active Traffic Management on Arterials.
Transportation Research Board. Washington, DC. http://onlinepubs.trb.org/onlinepubs/nchrp/nchrp_syn_447.pdf
85 Utah Department of Transportation Salt Lake County East-West Transportation Planning Study – Chapter 10.
http://www.udot.utah.gov/main/uconowner.gf?n=2377303674913208
86 Maryland Department of Transportation Office of Planning and Capital Programming: Queue Jump Study in Lee
County, FL. http://www.mdot.maryland.gov/Office_of_Planning_and_Capital_Programming/Express_Toll_Lanes/Documents/FinalQueueJumpBoard.pdf
87 Sacramento Region Travel Info/511 website. Retrieved on 7/27/15. http://www.sacregion511.org/
88 Virginia Department of Transportation Statewide Park and Ride Program Best Practices. (2013).
http://www.virginiadot.org/travel/resources/parkAndRide/Final_PR_Best_Practices_021113.pdf