Embed Size (px)
Citation preview

© 2016 Minnesota Workers’ Compensation Insurers Association, Inc.
Minnesota Workers’ Compensation
State of the Market

State of the Market
Pure Premium
Predictability
Consistent Low Loss
Ratios
Assigned Risk Plan
Depopulation
Significant Payroll
Increases
Permanent Injury
Reductions
Medical Payment
Shifts
Ongoing Net Case
Reserve Reductions
1

Employer Costs
2

-9.0
-7.6-6.3
10.2 10.6
5.3 5.1
8.0
3.7
-6.4
-12.5 -12.3
-3.6
9.610.9
8.3
5.7
4.0
1.4
-.5
-15
-10
-5
0
5
10
15
2008 2009 2010 2011 2012 2013 2014 2015 2016 2017
Perc
ent C
hang
e (%
)
Calendar Year
Essentially Mirroring National Results through 2016, the 2017 Decrease Was Driven Primarily by Rate Reductions
Minnesota
Countrywide
Source: Direct Written Premium from A.M. Best's Market Share Reports/One Year Premiums and Loss Study
3

838
768706
774
861
931968
10491092
1027
0
100
200
300
400
500
600
700
800
900
1000
1100
2008 2009 2010 2011 2012 2013 2014 2015 2016 2017
$ M
illio
ns
Calendar Year
In Spite of the 2017 Decrease, Insured Premium Has Grown over 45% Since 2010
Assigned Risk Plan
Voluntary
Source: Direct Earned Premium from A.M. Best's Market Share Reports/One Year Premiums and Loss Study and Actuarial Advisors
4

42
3532 32
45
5860
62
55
43
5.0% 4.6% 4.5% 4.1% 5.2% 6.2% 6.2% 5.9% 5.0% 4.2%
0
10
20
30
40
50
60
70
2008 2009 2010 2011 2012 2013 2014 2015 2016 2017
$ M
illio
ns(M
arke
t Sha
re)
Calendar Year
The Assigned Risk Market Share Has Decreased to a Level Last Seen Six Years Ago
Source: Direct Earned Premium from Actuarial Advisors
5

0.7
4.1
-2.1
6.4
4.2
5.0
3.3
4.4
1.4
3.9
3.2
4.8
-3
-2
-1
0
1
2
3
4
5
6
7
Ratemaking Cycle 2009 to 2016 Ratemaking Cycle 2017 to 2019
Aver
age
Annu
al C
hang
e (%
)After Several Seasons of Decreases, Contracting Payroll Improvement
Has Driven Statewide Growth in Recent Years
Manufacturing Contracting Office & Clerical Goods & Services Miscellaneous Statewide
Source: Unit Statistical Data
6

69
7476
68
6360 60
58
52 52
63
68
75
6568
60 6157
5450
0
10
20
30
40
50
60
70
80
2008 2009 2010 2011 2012 2013 2014 2015 2016 2017
Perc
ent (
%)
Calendar Year
Comparable to National Results, Loss Ratios Have Decreased 24% Since 2010
MinnesotaCountrywide
Source: A.M. Best's Market Share Reports/One Year Premiums and Loss Study
7

-2.4-1.7
-2.7
-.8-2.0 -2.5
2.0
-12.1
-6.7
1.2
-25.1
-30
-25
-20
-15
-10
-5
0
5
2010 2011 2012 2013 2014 2015 2016 2017 2018 2019
Perc
ent C
hang
e (%
)
Year
The Average Pure Premium Rate HasDropped 25% over the Last Ten Years
Individual
Cumulative
Source: MWCIA Ratemaking Reports
8
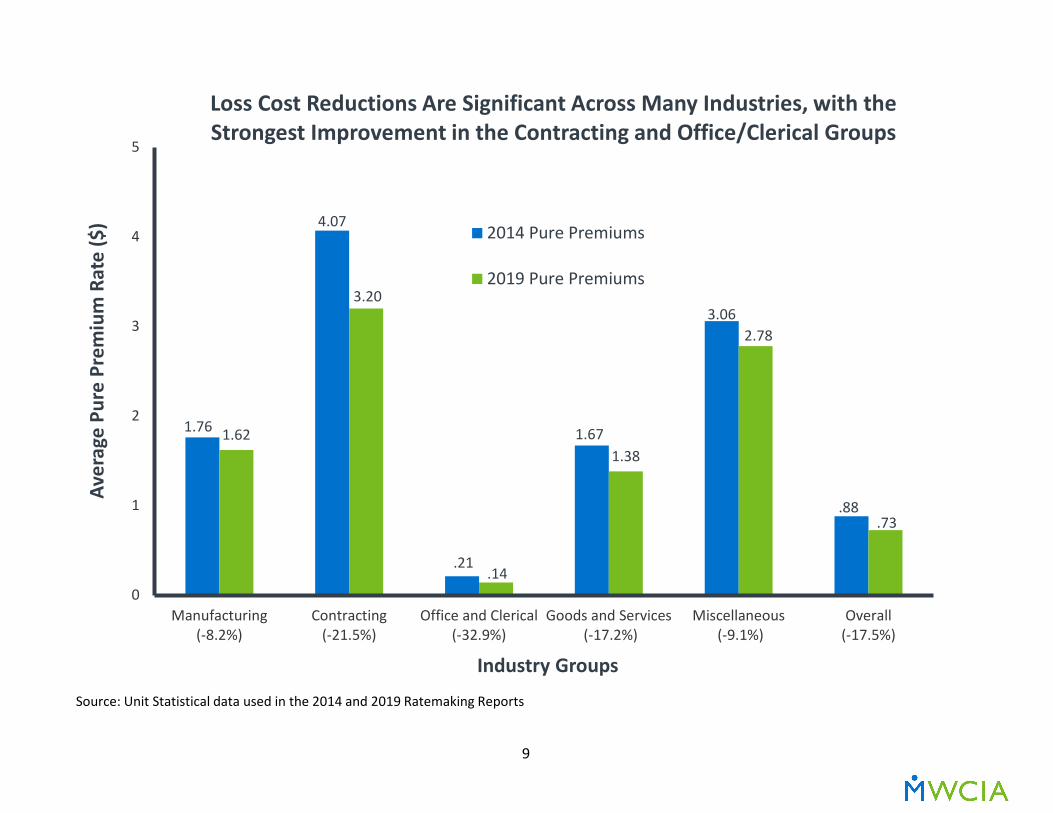
1.76
4.07
.21
1.67
3.06
.88
1.62
3.20
.14
1.38
2.78
.73
0
1
2
3
4
5
Manufacturing(-8.2%)
Contracting(-21.5%)
Office and Clerical(-32.9%)
Goods and Services (-17.2%)
Miscellaneous (-9.1%)
Overall(-17.5%)
Aver
age
Pure
Pre
miu
m R
ate
($)
Industry Groups
Loss Cost Reductions Are Significant Across Many Industries, with the Strongest Improvement in the Contracting and Office/Clerical Groups
2014 Pure Premiums
2019 Pure Premiums
Source: Unit Statistical data used in the 2014 and 2019 Ratemaking Reports
9

Claim Frequency
10

30.232.3 31.9
38.2
35.4 35.933.9
31.7
19.321.2
16.4
23.2
20.5
23.3
20.3 20.0
0
5
10
15
20
25
30
35
40
Metro(-36.2%)
ExtendedMetro
(-34.3%)
Southeast(-48.6%)
Southwest(-39.2%)
Central(-42.2%)
Northeast(-35.2%)
Northwest(-40.1%)
Statewide(-36.9%)
Case
s per
$1M
Pur
e Pr
emiu
m
Region (PY 2006-2015 Change)
There Have Been Dramatic Declines in Indemnity Case Frequency Across All Regions over the Last Ten Years
Policy Year 2006 Policy Year 2015Source: Unit Statistical data
11

.004
.005
.005
.006
.006
.008
.011
.014
.014
.023
.006
.007
.009
.010
.014
.013
.025
.022
.014
.048
Abdomen Including Groin ($16,006)
Foot ($21,312)
Hand ($20,611)
Ankle ($20,668)
Wrist ($23,351)
Finger ($17,173)
Multiple Body Parts ($49,600)
Knee ($25,581)
Shoulder ($39,240)
Low Back Area ($22,002)
.00 .01 .02 .03 .04 .05
Part
of B
ody
Inju
red
(PY
2015
Ann
ual A
vera
ge C
ost P
er C
ase)
Lost-Time Cases/$1M Payroll
The Relative Frequencies of Low Back & Multiple Body Part Injuries Have Been More Than Halved
Policy Year 2006
Policy Year 2015
Source: Unit Statistical Data, First Report Lost-Time Cases Per $1 Million of Payroll
12

.003
.003
.003
.004
.008
.009
.012
.014
.014
.055
.006
.001
.006
.003
.013
.022
.020
.017
.021
.097
Hernia ($16,483)
Concussion ($34,647)
Inflammation ($23,679)
Multiple Physical Injuries Only ($61,064)
Laceration ($14,518)
All Other ($31,841)
Sprain ($25,622)
Contusion ($20,166)
Fracture ($43,432)
Strain ($23,697)
.00 .02 .04 .06 .08 .10
Nat
ure
of In
jury
(PY
2015
Ann
ual A
vera
ge C
ost P
er C
ase)
Lost-Time Cases/$1M Payroll
The Relative Frequencies of Strains & Sprains Have Decreased Markedly
Policy Year 2006
Policy Year 2015
Source: Unit Statistical Data, First Report Lost-Time Cases Per $1 Million of Payroll
13

.004
.004
.005
.006
.006
.007
.007
.009
.012
.021
.006
.005
.008
.012
.005
.010
.016
.012
.021
.039
Falling Or Flying Object ($24,507)
Twisting ($20,395)
From Different Level (Elevation) ($55,162)
Repetitive Motion (strain or injury by) ($28,062)
Ice Or Snow ($28,959)
Fall, Slip, or Trip on Same Level ($27,197)
Strain or Injury by Pushing or Pulling ($26,959)
Fall, Slip, or Trip ($26,898)
Strain or Injury ($25,346)
Strain or Injury by Lifting ($22,416)
.00 .01 .02 .03 .04
Caus
e of
Inju
ry(P
Y 20
15 A
nnua
l Ave
rage
Cos
t Per
Cas
e)
Lost-Time Cases/$1M Payroll
The Relative Frequencies of Injuries Caused by Strains & SprainsHave Also Been Nearly Halved
Policy Year 2006
Policy Year 2015
Source: Unit Statistical Data, First Report Lost-Time Cases Per $1 Million of Payroll
14

.624
.827
.905
.936.956 .963
.622
.851
.922
.951.962 .963
.5
.6
.7
.8
.9
1.0
1st 2nd 3rd 4th 5th 6th
Clos
ed to
Tota
l Los
t-Ti
me
Case
Cou
nts
Report Level(Policy Year Basis)
Claim Closure Improvement is Especially Evident from Second to Fourth Reports of Injury
Valuation Year 2013Valuation Year 2017
Source: MWCIA Financial Call Data
15

Claim Severity
16

18.2 18.5 18.018.8 18.9
19.718.3
19.920.9
21.222.1 22.2 21.6 21.8 21.6 22.3 22.6 22.8
23.424.4
0
5
10
15
20
25
30
2008 2009 2010 2011 2012 2013 2014 2015 2016 2017p
$ T
hous
ands
Accident Year
Indemnity Case-Incurred Severities HaveGrown by a Modest 1.7% Per Year Since 2008
Minnesota
NCCI States
Source: MWCIA Financial Call Data valued as of 12/31/2017, Losses and Claim Counts Developed to Ultimate ReportNCCI State of the Market Report presented at 2018 Annual Issues Symposium
17

0%
20%
40%
60%
80%
100%
120%
Cum
ulat
ive
Chan
ge
Accident Year
Changes in Indemnity Severity Have Fallen Below Changes in the Statewide Average Weekly Wage Over the Past Eight Years
Indemnity Severity
SAWW
Source: MWCIA Financial Data Valued as of 12/31/2017, Minnesota Department of Labor and Industry
Annual Average Change (2007-2017p)Indemnity Severity: +1.9%
SAWW: +2.4%
Annual Average Change (1997-2007)Indemnity Severity: +7.4%
SAWW: +3.9%
18

23.8 23.2 23.2 24.0 23.6
26.2
23.0 23.7 24.425.6
24.225.2 25.2 25.8 26.0 26.5
27.4 27.2
28.829.9
0
5
10
15
20
25
30
35
2008 2009 2010 2011 2012 2013 2014 2015 2016 2017p
$ T
hous
ands
Accident Year
Lost-Time Medical Case-Incurred Severities Have Grown an Annual Average of 0.8% Since 2008, Well below NCCI-State Results
MinnesotaNCCI States
Source: MWCIA Financial Call Data valued as of 12/31/2017, Losses and Claim Counts Developed to Ultimate ReportNCCI State of the Market Report presented at 2018 Annual Issues Symposium
19

0%
20%
40%
60%
80%
100%
120%
Cum
ulat
ive
Chan
ge
Accident Year
Annual Changes in Both Lost-Time Medical Claim Severity and Countrywide Medicare Care Prices Have
Slowed Down Considerably Over the Past Ten Years
Lost-Time Medical Severity
Chain-Weighted PHC Index
Source: MWCIA Financial Data Valued as of 12/31/2017 Countrywide Chain-Weighted Personal Health Care (CW-PHC) Price Index from Centers for Medicare & Medicaid Services
Annual Average Change (1997-2007)Lost-Time Medical Severity: +8.2%Chain-Weighted PHC Index: +3.0%
Annual Average Change (2007-2017)Lost-Time Medical Severity: +2.0%Chain-Weighted PHC Index: +1.8%
20

55.5% 56.2%58.3%
59.7%62.9%
64.6%62.2%
68.6%
0%
10%
20%
30%
40%
50%
60%
70%
2012 2013 2014 2015 2016 2017 2018 2019Perc
enta
ge o
f Ulti
mat
e M
edic
al L
osse
s Pai
d at
3rd
Rpt
Ratemaking Report Year
The Percentage of Ultimate Medical Costs Paid at Third Reports Has Improved 13% Since 2012
Source: MWCIA Financial Data
21

Cost Distributions
22
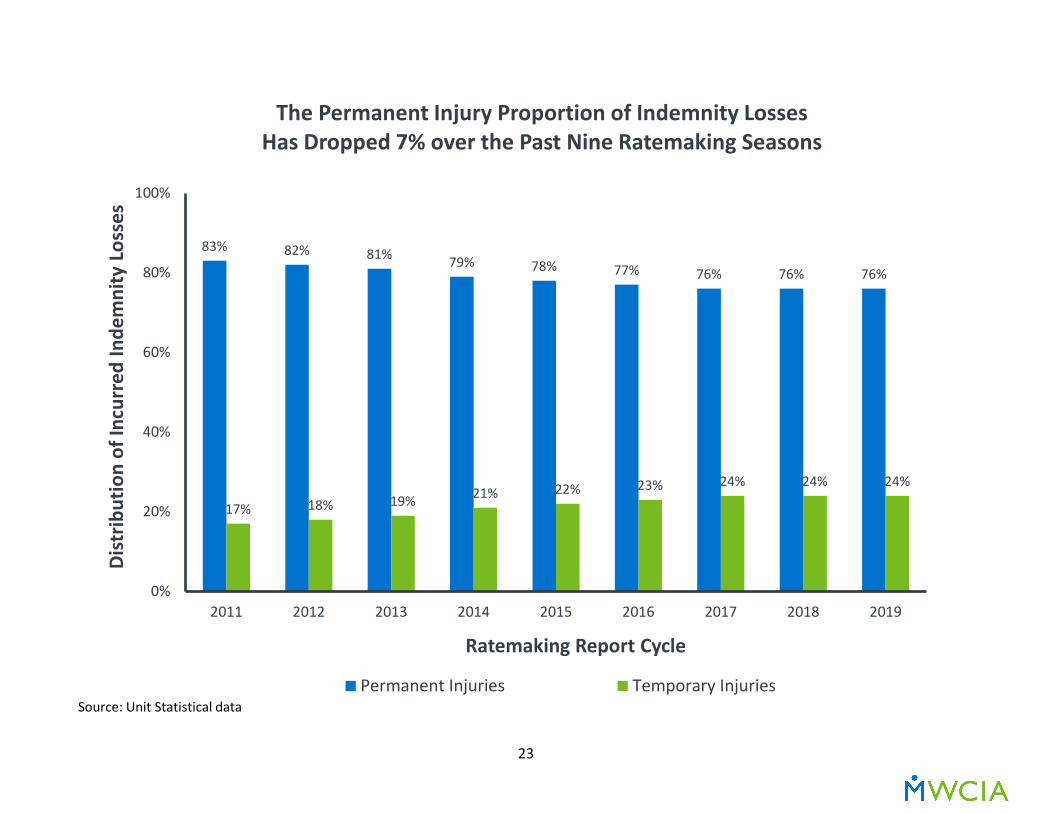
83% 82% 81% 79% 78% 77% 76% 76% 76%
17% 18% 19% 21% 22% 23% 24% 24% 24%
0%
20%
40%
60%
80%
100%
2011 2012 2013 2014 2015 2016 2017 2018 2019
Dist
ribut
ion
of In
curr
ed In
dem
nity
Los
ses
Ratemaking Report Cycle
The Permanent Injury Proportion of Indemnity Losses Has Dropped 7% over the Past Nine Ratemaking Seasons
Permanent Injuries Temporary InjuriesSource: Unit Statistical data
23
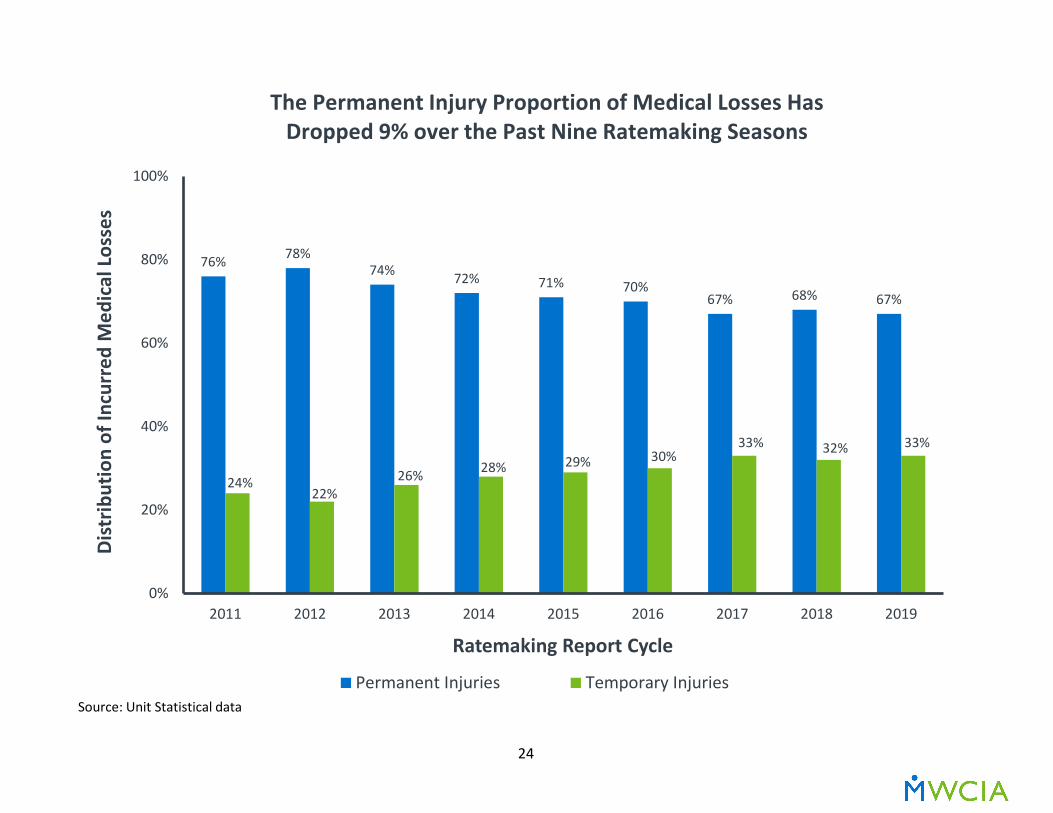
76% 78%74% 72% 71% 70%
67% 68% 67%
24%22%
26% 28% 29% 30%33% 32% 33%
0%
20%
40%
60%
80%
100%
2011 2012 2013 2014 2015 2016 2017 2018 2019
Dist
ribut
ion
of In
curr
ed M
edic
al L
osse
s
Ratemaking Report Cycle
The Permanent Injury Proportion of Medical Losses Has Dropped 9% over the Past Nine Ratemaking Seasons
Permanent Injuries Temporary InjuriesSource: Unit Statistical data
24
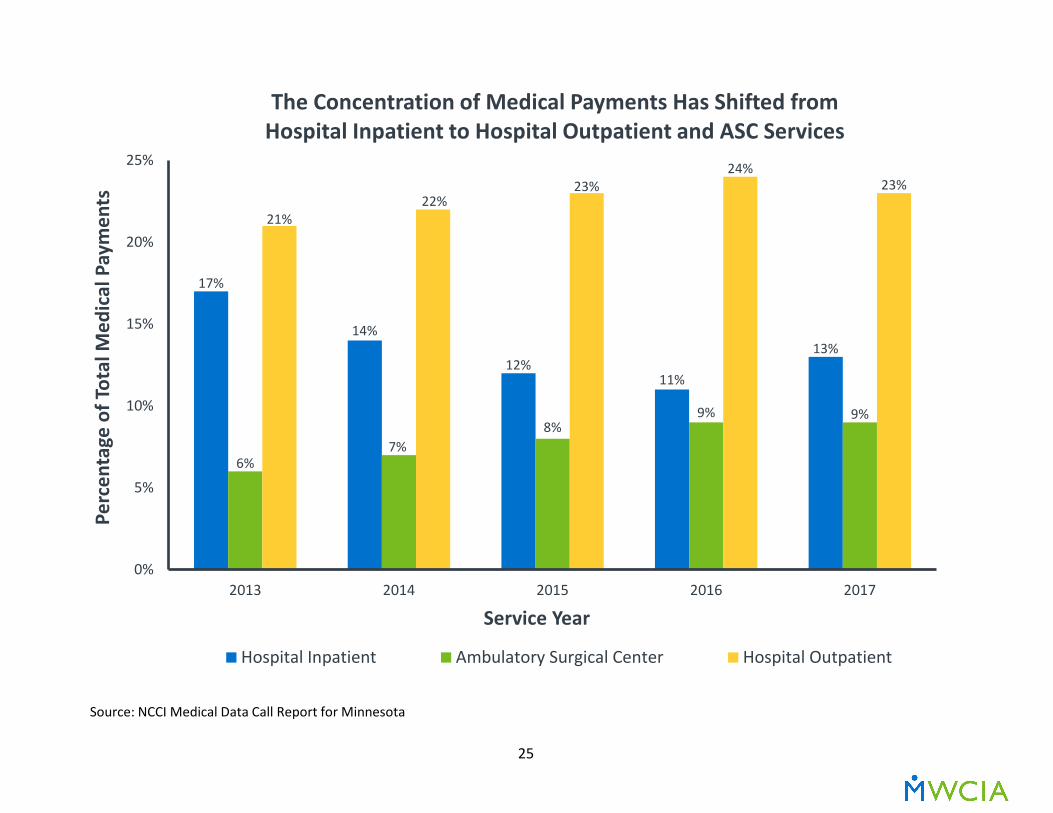
17%
14%
12%11%
13%
6%7%
8%9% 9%
21%22%
23%24%
23%
0%
5%
10%
15%
20%
25%
2013 2014 2015 2016 2017
Perc
enta
ge o
f Tot
al M
edic
al P
aym
ents
Service Year
The Concentration of Medical Payments Has Shifted from Hospital Inpatient to Hospital Outpatient and ASC Services
Hospital Inpatient Ambulatory Surgical Center Hospital Outpatient
Source: NCCI Medical Data Call Report for Minnesota
25

3.4
3.0
2.52.8
2.42.6
4.8
4.2
3.7
2.7 2.72.5
0
1
2
3
4
5
2011 2012 2013 2014 2015 2016
Shar
e of
Cla
ims w
ith In
patie
nt E
piso
des (
%)
Injury Year
Reductions in Inpatient Surgical Episodes Have Led toDecreases in Claims Requiring Inpatient Care
Nonsurgical Inpatient Surgical Inpatient
WCRI CompScope™ Medical Benchmarks for Minnesota, 19th Edition Claims With > 7 Days Of Lost Time At 12 Months Of Experience, Not Adjusted For Injury/Industry Mix
26

13.1
15.2 15.0 15.2 15.1 14.4
24.3
22.4 22.521.5
20.7
19.0
0
5
10
15
20
25
2011 2012 2013 2014 2015 2016
Shar
e of
Cla
ims w
ith F
acili
ty S
ervi
ces (
%)
Injury Year
Increases in ASC Services Have Led to Decreases in Hospital Outpatient Claims
Ambulatory Surgery Center (ASC) Hospital Outpatient
WCRI CompScope™ Medical Benchmarks for Minnesota, 19th Edition Claims With > 7 Days Of Lost Time At 12 Months Of Experience, Not Adjusted For Injury/Industry Mix
27

Case Reserves
28

7159 61 67
76 7263 62 67 72
-90-79
-92 -91 -97-105
-96-84 -85 -86
-150
-100
-50
0
50
100
150
2008 2009 2010 2011 2012 2013 2014 2015 2016 2017
$ M
illio
ns
Calendar Year
Net Indemnity Case Reserve Releases from Prior Accident Years Continue to Outstrip Establishment of Current Year Reserves
Latest Accident Year
All Prior Accident Years
Source: MWCIA Financial Call data
29

143
118134 142 143
158 160142
157 157
-60
-87-74
-126 -122 -127 -133 -139-152
-162
-200
-150
-100
-50
0
50
100
150
200
2008 2009 2010 2011 2012 2013 2014 2015 2016 2017
$ M
illio
ns
Calendar Year
The Establishment of Case Reserves on New Medical Claims Are Beginning to Be Counterbalanced by Net Reserve Releases from Prior Years
Latest Accident Year
All Prior Accident Years
Source: MWCIA Financial Call data
30

-19 -20
-31
-24 -21
-33 -33
-22-18
-14
83
31
60
1621
3127
3 5
-5
-40
-20
0
20
40
60
80
100
2008 2009 2010 2011 2012 2013 2014 2015 2016 2017
$ M
illio
ns
Calendar Year
2017 Saw Both Medical and Total Net Case Reserve Releases for the First Time in Modern History
Indemnity
Medical
Source: MWCIA Financial Call data
31