Embed Size (px)
Citation preview
Minority Student and Teaching Assistant Interactions in STEM
Graduate student teaching assistants from underrepresented groups may provide salient role models and enhanced instruction to minority students in STEM fields. We explore minority student-TA interactions in an important course in the sciences and STEM – introductory chemistry labs – at a large public university. The uncommon assignment method of students to TA instructors in these chemistry labs overcomes selection problems, and the small and active learning classroom setting with required attendance provides frequent interactions with the TA. We find evidence that underrepresented minority students are less likely to drop courses and are more likely to pass courses when assigned to minority TAs, but we do not find evidence of effects for grades and medium-term outcomes. The effects for the first-order outcomes are large with a decrease in the drop rate by 5.5 percentage points on a base of 6 percent, and an increase in the pass rate of 4.8 percentage points on a base of 93.6 percent. The findings are similar when we focus on Latinx student - Latinx TA interactions. The findings are robust to first-time vs. multiple enrollments in labs, specifications with different levels of fixed effects, limited choice of TA race, limited information of TAs, and low registration priority students. The findings have implications for debates over increasing diversity among PhD students in STEM fields because of spillovers to minority undergraduates.
Suggested citation: Oliver, Daniel, Robert Fairlie, Glenn Millhauser, and Randa Roland. (2021). Minority Student and Teaching Assistant Interactions in STEM. (EdWorkingPaper: 21-389). Retrieved from Annenberg Institute at Brown University: https://doi.org/10.26300/19z4-k987
VERSION: April 2021
EdWorkingPaper No. 21-389
Daniel OliverTulane University
Robert FairlieUniversity of California, Santa Cruz
Glenn MillhauserUniversity of California, Santa Cruz
Randa RolandUniversity of California, Santa Cruz
0
Minority Student and Teaching Assistant Interactions in STEM
Daniel Oliver1, Robert Fairlie2,3, Glenn Millhauser4 and Randa Roland4
1Tulane University 2University of California, Santa Cruz
3National Bureau of Economic Research 4Department of Chemistry, UC Santa Cruz
April, 19, 2021
Abstract Graduate student teaching assistants from underrepresented groups may provide salient role models and enhanced instruction to minority students in STEM fields. We explore minority student-TA interactions in an important course in the sciences and STEM – introductory chemistry labs – at a large public university. The uncommon assignment method of students to TA instructors in these chemistry labs overcomes selection problems, and the small and active learning classroom setting with required attendance provides frequent interactions with the TA. We find evidence that underrepresented minority students are less likely to drop courses and are more likely to pass courses when assigned to minority TAs, but we do not find evidence of effects for grades and medium-term outcomes. The effects for the first-order outcomes are large with a decrease in the drop rate by 5.5 percentage points on a base of 6 percent, and an increase in the pass rate of 4.8 percentage points on a base of 93.6 percent. The findings are similar when we focus on Latinx student - Latinx TA interactions. The findings are robust to first-time vs. multiple enrollments in labs, specifications with different levels of fixed effects, limited choice of TA race, limited information of TAs, and low registration priority students. The findings have implications for debates over increasing diversity among PhD students in STEM fields because of spillovers to minority undergraduates. Keywords: Minority students, achievement gap, STEM, role models, diversity, Latinx students JEL Codes: I23, I24, J15 Acknowledgements: We thank Ian Allen, Lori Etow, Steven Luis, Karen Meece, Lisa Morgan, Samantha Sweeney, Justyn Vanderplas and Travis Wiggans for assistance with the data, and with general questions about the undergraduate program and the scheduling of lab sections. We thank Rebecca London for comments and suggestions. We also thank the University of California, Santa Cruz Chancellor’s Office and Graduate Division for partial funding for the project.
1
1 Introduction Educational attainment is a pivotal source of economic inequality through its long-term effects on
occupational opportunities, income, and wealth.1 Inequality in education is conspicuous by race,
especially for underrepresented minorities (i.e. African-Americans, Latinx and Native-Americans).
Underrepresented minority students have lower high school completion rates, college attendance
rates, and college graduation rates than non-minority students (U.S. Department of Education,
2019a). A popular policy prescription to address these inequalities in educational attainment is to
expand the representation of minority instructors at all levels of the educational system.2 At the
post-secondary level, for example, only 11 percent of all full-time instructional faculty are Black,
Latinx or Native American, while these groups comprise 40 percent of all college students (U.S.
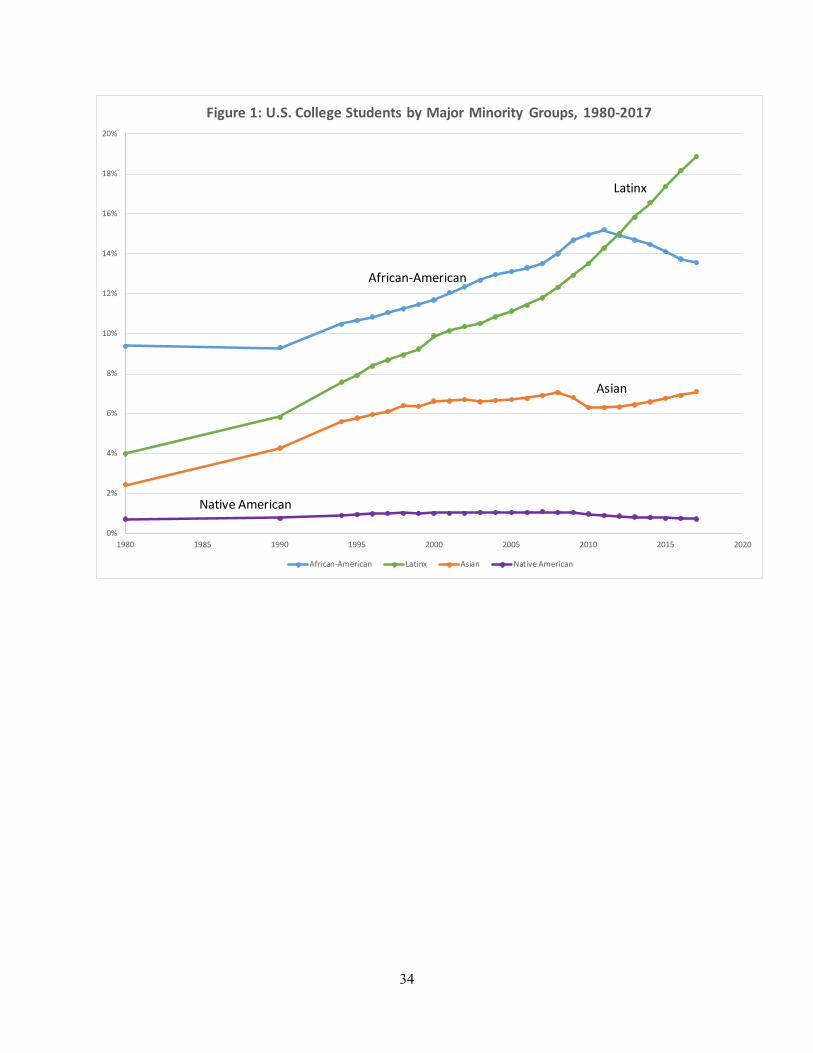
Department of Education, 2019a, 2019b). Latinx instructors are the most underrepresented group
with only 5 percent of faculty but 20 percent of all college students (growing rapidly from only 6
percent of all college students in 1990, see Figure 1).3 The scarcity of underrepresented minority
instructors imposes severe limits on the availability of role models, increases the likelihood of
“stereotype threats” and discrimination against minority students, restricts exposure to instructors
with similar cultures and languages, and possibly reduces a sense of belonging at the university
and major.
Racial inequality in STEM fields is even more severe, and has important long-term
economic consequences. Currently, underrepresented minorities comprise 26 percent of the adult
population, but only account for 13 percent of science and engineering degree holders with a
1 See Altonji and Blank, (1999), Card (1999) and Jencks and Phillips (1998). 2 For example, all levels of the public higher education system in California actively have policies to increase diversity among instructors (UCOP 2018; CSUS 2016; CCCO 2020). 3 In some states Latinx students have much higher representation. For example, Latinx students comprise 25 percent of all students in the University of California (UC) system, 45 percent of students in the California State University (CSU) system, and 47 percent of students in the California Community College system. As recently as 2000, Latinx students only represented 12 percent, 21 percent, and 26 percent of all students in each system, respectively.
2
bachelor’s degree or higher and 10 percent of the workforce in science and engineering and
(National Science Board 2015).4 These disparities have profound economic impacts: within four
years after graduation, STEM bachelor’s degree holders earn approximately $15,000 more in
annual earnings compared to their non-STEM counterparts (Cataldi et al., 2014). Even after
adjusting for demographic characteristics and potential labor market outcomes, the gap in wages
between majors can be as high as the gap between college degree holders and high school graduates
(Altonji et al., 2012).
In this paper, we provide the first study of whether underrepresented minority students
(primarily Latinx students) experience achievement gains from being taught by underrepresented
minority teaching assistants in STEM. The focus on interactions between minority students and
minority graduate student teaching assistants is important due to the lack of previous research on
the question, extensive and growing involvement of teaching assistants in the education of
undergraduates at large universities, and severe underrepresentation of minority graduate students
TAs. Underrepresented minorities account for only 6.8 percent of STEM PhDs conferred (U.S.
Department of Education 2020).5
We study interactions in introductory chemistry laboratory classes to better understand the
importance of minority instructors in STEM environments. These courses provide a useful test
because: i) the assignment method of students to TAs is as close to random as possible in higher
education, ii) teaching assistants interact closely and frequently with the same assigned students
throughout the entire term due to required attendance, iii) lab courses involve active learning with
18 students per lab instead of larger section reviews, and iv) they are an important gateway course
4 Underrepresented students are found to have lower grades, persistence and other academic outcomes within STEM (see, for example, Kokkelenberg & Sinha, 2010; Griffith 2010; Arcidiacono, Aucejo, and Hotz 2016). 5 In 2018-19, the number of STEM PhDs conferred were 733 for blacks, 1,234 for Latinx, and 52 for Native Americans (U.S. Department of Education 2020).
3
for the Sciences, pre-Med majors, and many other STEM majors.6 Introductory chemistry labs
also provide an interaction with TAs early in students’ STEM college experience – a juncture at
which they are especially vulnerable to leaving a STEM major (Goodman, 2002).
Our study involves more than 4,000 students and 6,000 course observations over five
academic years, 2014-15 to 2018-19 at a large, public university that is designated as a Hispanic-
Serving Institution (HSI). Detailed administrative data from the university allow for estimating
interactions on a wide range of course outcomes, including course drops, pass rates, grades and
downstream outcomes such as continuation to more advanced chemistry courses or selection of a
chemistry or other STEM major.
It is well known that random assignment of students to classes does not occur at colleges
outside a few exceptions such as the military post-secondary educational system. 7 However,
chemistry labs provide a rare, almost “as-good-as random” setting in higher education that helps
us address concerns over selection bias. The Chemistry Department provides limited offerings of
lab sections because of the need for specialized classrooms, equipment, and safety requirements
(maximum of 18 students per lab). Student registration for lab sections occurs at least a month
prior to when TA assignments to labs are made, and sections fill rapidly and completely by the
end of the first two weeks of the registration period. The assigned times and locations for TAs are
not distributed to TAs until the initial TA meeting which takes place after the quarter officially
starts partly because of scheduling constraints imposed by research labs (which is different than
most other fields).Thus, both students and TAs have no information about assignments prior to the
6 The Introduction to Chemistry sequence which includes the labs is the gateway requirement to STEM majors, including Chemistry, Biology, Bioengineering, Environmental Studies, Environmental Science, Earth Sciences, Ecology and Neuroscience. It is also commonly taken by students in many other STEM majors (e.g. Physics, Computer Science, and Cognitive Science). 7 Random assignment takes place at the U.S. Air Force Academy that provides undergraduate education for officers in the U.S. Air Force (Carrell et al., 2010). A relatively new literature uses random assignment of registration priorities providing exogenous variation in the level of course choice (Kurlaender et al., 2014; Neering 2019).
4
first day of section.8 We build on these institutional features that essentially eliminate the ability
to choose TAs by conducting several analyses. First, we estimate regression models that include
classroom fixed effects which use variation between underrepresented minority (URM) and non-
URM students when assigned to the same teaching assistant in the same lab section for
identification. The models eliminate biases originating from teaching assistant and classroom
specific differences common across classmates (e.g. overall TA ability, section time, non-
standardized grading, etc..,). Second, we focus on first-time student enrollments to further limit
information and the possibility of choice based on that information. Third, the inclusion of prior
GPAs and Chemistry 1A grades controls for student differences in ability, and when we expand
the model to include all lab sections we include student fixed effects. Fourth, we generate samples
of students and TAs in which the incidence of endogenous sorting is minimized, including only
low-registration priority students, time slots with limited variation in TA race, excluding chemistry
majors, and limiting to only first-time TAs. Finally, we conduct several sorting tests to verify that
this setting is “as-good-as random.” When we implement such tests using a rich set of observables
such as a student’s grade in the first introductory chemistry course and prior GPA, we do not
uncover any evidence of differential sorting.
We find that URM students are substantially less likely to drop and are more likely to pass
a course when they are assigned to a lab section with an URM teaching assistant, but find no
evidence of effects on grades and medium-term outcomes. We estimate a large decrease in the
drop rate by 5.5 percentage points on a base of 6 percent. The unconditional pass rate also increases
by 4.8 percentage points on a base of 93.6 percent. The findings for drop and pass rates are driven
by Latinx students interacting with Latinx TAs, who comprise the bulk of URM students and TAs.
8 In the registration system, only the instructor of record (who is a professor) is listed. For the TA assignment only “Staff” is reported because they are not assigned yet.
5
The findings of large effects on drop and pass rates are robust across first-time observations and
all observations from lab sections, specifications with different levels of fixed effects, low
registration priority students, limited choice of TA race, and limited information about TAs.
Minority TAs appear to influence minority undergraduates through behavioral channels increasing
the likelihood of staying in the lab course and ultimately completing it, but possibly not through
getting a better grade in the course.
Our paper contributes to three strands of the literature. First, we contribute to the broader
literature on the effects of minority teachers and instructors on minority students across all levels
of education. Previous studies find evidence of positive student-teacher interactions by race at the
elementary, middle, and high school educational levels (e.g. Dee, 2004, 2005; Egalite et al., 2015;
Ehrenberg et al., 1995; Gershenson et al., 2016, 2018). In higher education, Fairlie et al. (2014)
find that minority instructors have positive effects on academic outcomes of minority students in
community colleges, and Birdsall et al. (2020) find that having a same-race instructor, especially
among non-white students, increases the likelihood of receiving a good grade at a top-ranked law
school. Second, to our knowledge, only one study of minority instructor effects focuses on STEM.9
Price (2010) finds that first-term black students enrolled in STEM courses at public universities in
Ohio are more likely to persist in STEM when they are exposed to more black instructors.
Third, our findings contribute to the relatively sparse literature on TA interaction effects.
This omission might be important because teaching assistants are likely to serve as more salient
role models for students than professors due to proximity in age and more frequent one-on-one
office hours or small section settings. As class sizes expand due to budget constraints at large
public universities the demand for teaching assistants will increase even further. Earlier work on
9 The literature on female instructor effects in STEM is larger. See Bettinger & Long (2005), Hoffmann & Oreopoulos (2009) Carrell, Page and West (2010), Solanki & Xu (2018) for example.
6
TA interactions focuses on the role of nationality of teaching assistants in economics courses and
finds that students (especially native students) receive lower grades with international TAs (Borjas
2000; Marvasti 2007). More recent work focuses on race. Griffith (2010) studies several student
and institutional factors affecting persistence in STEM and finds that minority students are more
likely to persist in a STEM major at institutions with a higher percentage of STEM graduate
students that are minority (which might be partly due to TA interactions). The most closely related
paper to ours, Lusher et al. (2018) examines whether students perform better in economics classes
taken with TAs who are of a similar race at a large, public university. The paper focuses on Asian
students and finds a 0.08 standard deviation increase in course grades when Asian students in
economics are assigned to Asian TAs relative to being assigned to non-Asian TAs. Building on
these findings and leveraging the HSI status of the university, our study provides the first
examination of effects stemming from the interactions between URM students (Latinx students in
particular10) and URM teaching assistants in STEM.11 We also build on this work and previous
work by focusing on required chemistry labs removing concerns over potential biases resulting
from student selection of courses or majors.
The remainder of the paper is organized as follows. In Section 2, we describe the
institutional setting, lab course registration procedure, and data. Section 3 describes the
econometric models for outcome and sorting tests, and provides the findings from the sorting tests.
Section 4 presents our results. Section 5 concludes.
10 There is limited literature focusing on Latinx students in higher education (see Hull 2017; Fry 2005; Ganderton and Santos 1995 for example). 11 Another important difference in our Chemistry lab setting is that each student is only assigned one TA instead of multiple TAs in economics courses in which students have some choice over (resulting in a range of TA values for race, such as 0, 1/3, 2/3, or 1).
7
2 Institutional Setting, Lab Course Registration and Data
2.1 Institutional and Course Setting
We study minority student and teaching assistant interactions in STEM at a large, public university.
The university has a total enrollment of roughly 20,000 students. Important for the study, the
university is designated as a Hispanic-serving institution, which is federally defined as an
accredited, degree-granting, college in which Hispanic students comprise at least 25 percent of
total undergraduate enrollment. The racially diverse university we examine is 27 percent
Hispanic/Latinx, 4 percent African-American, 1 percent Native American, 28 percent Asian, 30
percent white, and 8 percent international.
At the university, we follow every student enrolled in one of the two lab courses (Chemistry
1M or 1N) in the Introduction to Chemistry sequence over the five academic years from 2014-15
to 2018-19. The sequence also includes a full year of large-lecture courses, Chemistry 1A, 1B and
1C. Students enroll in chemistry labs after taking Chemistry 1A, and enrollment in the chemistry
labs is independent of the subsequent lecture courses, Chemistry 1B and 1C. The faculty instructor
of record for the labs is also separate from faculty assigned to the lecture courses. Total enrollment
in all labs observed for our study is 6,313 (4,288 students). Enrollment in the 420 unique chemistry
lab section offerings is capped at 18 students (mean=16.6) because of lab space and equipment.
Each quarter there are, on average, 16 sections offered of each of the lab courses with multiple
offerings during each time slot (e.g. Tu 10:00AM-01:00PM).
These chemistry labs provide an important setting in which to study minority student and
teaching assistant interactions for several reasons. First, these courses are important – they are
8
essential gateway course for the Sciences, pre-Med majors, and many other STEM majors.12
Second, the introductory chemistry labs allow us to evaluate whether minority students experience
positive interaction effects from minority TAs early in their in their STEM college experience – a
juncture at which they are especially vulnerable to leaving a STEM major. Third, teaching
assistants interact closely and frequently with students throughout the entire term. The intensive
interactions between TAs and students are a natural consequence of mandatory attendance and an
enrollment cap of 18 students per lab section. Fourth, the allocation of students and TAs to lab
sections is done in way that essentially rules out selection as we discuss in further detail below.
Fifth, lab sections are standardized in content and assessments. Most of the grading is done
objectively and by an online system, thus removing concerns regarding favoritism by teaching
assistants towards specific students. Sixth, the chemistry labs involve active learning and cover
new material which likely creates more student interaction with TAs than the more common role
of TAs helping students with course material taught in lecture by professors. In these chemistry
labs, the TAs are the primary and essentially sole source of instruction and interaction.13
The Introduction to Chemistry sequence at the university covers a standard set of topics,
similar to other large research universities. The laboratory classes associated with this sequence
are also standard. The sequence requires a minimum of pre-calculus before enrolling, but most
students have already taken calculus. The use of math is extensive throughout the course. Average
enrollment in the large-lecture introductory chemistry courses is 348. The two labs (Chem 1M and
1N) are associated with the second and third quarter courses in the sequence, respectively. Chem
12 The Introduction to Chemistry sequence which includes the labs is the gateway requirement to STEM majors, including Chemistry, Biology, Bioengineering, Environmental Studies, Environmental Science, Earth Sciences, Ecology and Neuroscience. It is also commonly taken by students in many other STEM majors (e.g. Physics, Computer Science, and Cognitive Science) and even non-STEM majors (e.g. Economics, Psychology). 13 Chemistry lab sections are self-contained courses with no outside instruction. The assigned TA provides all of the instruction to the students in the labs, but the instructor of record, who is a chemistry professor, manages the curriculum, grading policies, TAs, and official records.
9
1M requires Chem 1B as a prerequisite or with concurrent enrollment; the same holds for Chem
1N and Chem 1C. However, these laboratory courses are not interdependent on each other and
may be taken in either order.
The overall object of the chemistry labs is the development of a broad skillset including a
strong mathematical component (e.g. statistics, linear regression, physical processes, experimental
measurement, and instrumentation). With regard to topics, Chem 1M emphasizes analytical
techniques, such as determination of empirical formulas, along with chemical kinetics and
introductory spectroscopy. Chem 1N emphasizes chemical thermodynamics, acids and bases,
solubility and electrochemistry. The experiments are similar to those traditionally found in other
introductory chemistry series and are designed to emphasize concepts covered in the Chem 1B and
1C lectures. Although Chem 1M is not a prerequisite for Chem 1N, the majority of students
nevertheless take them in that order.
2.2 Registration for Lab Courses
In our setting, it is nearly impossible for students to select TAs in chemistry labs for several reasons
specific to how they are assigned. First, the course registration period begins at least a month
before courses start, well before TAs are assigned to sections.14 TA assignment to sections are
made after the start of the term during their initial TA meeting, but prior to the first day of labs.
During registration, students can only determine the instructor of record (who is a professor). All
section TAs are listed as “Staff” in the system because they are not assigned yet. Second, because
of high demand a vast majority of the lab sections fill completely within the first week of the
14 For example, spring 2019 registration began on February 26, 2019 with a term start date of April 1, 2019. Winter 2019 registration began on November 14, 2018 with a term start date of January 4, 2019. Fall 2018 registration began May 14, 2018 with a term start date of September 22, 2018.
10
registration period and begin to accumulate waitlists.15 The long period between registration and
the first day of lab classes limits information, choice and flexibility. Third, even on the first day of
labs, most TAs are only aware of the time slot in which they will be teaching since the location of
all the laboratories are centrally located and they must first check-in at the equipment office for
their laboratory assignment, student rosters, student locker combinations and teaching materials.
The assignment of TAs to courses and time slots is complicated (and different than most other
fields) because of the importance of input from thesis advisors and coordinators for schedules of
team meetings and work in research labs.16 TAs also do not know anything about the students
enrolled in their lab section until right before the lab starts. Finally, many of the undergraduate
students taking chemistry labs are not majoring in Chemistry, and do not have strong ties to the
department which limits their information on TAs.
The TA assignment procedure and early registration in labs by undergraduate students
creates an assignment which we argue rules out selection. We provide evidence against any sorting
by students supporting this argument.
2.3 Data
Matching several administrative datasets from the university, we are able to examine an extensive
set of course and long-term outcomes as well as detailed demographic characteristics for every
student attending an introductory chemistry lab from winter quarter of 2015 to spring quarter of
2019. Administrative data provided by the university include grades, course credits, and course
15 In instances where the department overestimates the demand for sections, they combine sections prior to the start of the term further reducing information and choice. 16 In the physical sciences, many thesis advisers (professors) and graduates students commonly conduct research in coordinated teams (these are commonly referred to as Professor XYZ’s “lab”). This imposes great degree of scheduling constraints.
11
dropout behaviour for every lab course and introductory lecture course in chemistry. We are able
to match these data to detailed data on demographic characteristics of students and teaching
assistants, such as race, ethnicity, and gender. The course-level dataset allows us to match students
to classes that students enrol in, regardless of whether they completed the class or not (which is
important for fully capturing drop out behaviour). Administrative data from the university also
provide information on enrolment in Organic Chemistry (which is the next sequence in Chemistry)
and major declarations in Chemistry, the Sciences, and other STEM fields.
In the analysis, we focus on four primary academic outcomes. First, we measure the first-
order outcome of whether the student dropped the lab course that term, which is important for
interest, continuation and trajectory in chemistry and science more generally. Second, we measure
performance using whether the student passed the course, which is similarly important. Third, we
measure performance in the course using the numeric continuous score (i.e. scale of 0-100).17 We
rescale this score by demeaning and dividing by the standard deviation. Fourth, we measure
performance in the course using the letter grade converted to a 4-point scale (i.e. scaled similarly
as a GPA measure, 0-4.3).
A key measure to control for student ability used in the analysis is the student’s grade in
Chemistry 1A, which is the first lecture course taken in the introductory sequence. Chemistry 1A
is taken in a prior term to enrollment in the labs. To control more thoroughly for differences across
student abilities in chemistry we include the full set of dummy variables for letter grades. As
expected, grades in Chemistry 1A are a very strong predictor of performance in the lab.
Additionally, we have a measure of student’s performance in all previous courses (i.e. prior GPA).
17 The requirements for the course include the following assignments: Written procedure and data tables (7 assignments) 25%; Online prelabs (7) 5%; Online in-lab assignments (7) 35%; Online reviews (7) 5%; Formal abstracts (2) 10%; Online quizzes (7) 10%; Scholarship and week 1 worksheet 10%.
12
Additional controls used in the analysis are baseline lab section fixed effects, a detailed set of
race/ethnicity indicators, Education Opportunity Program (EOP) (i.e. first generation, low-income
or educationally disadvantaged) status, year in college, major interest, and declaration of major.
2.4 Summary Statistics
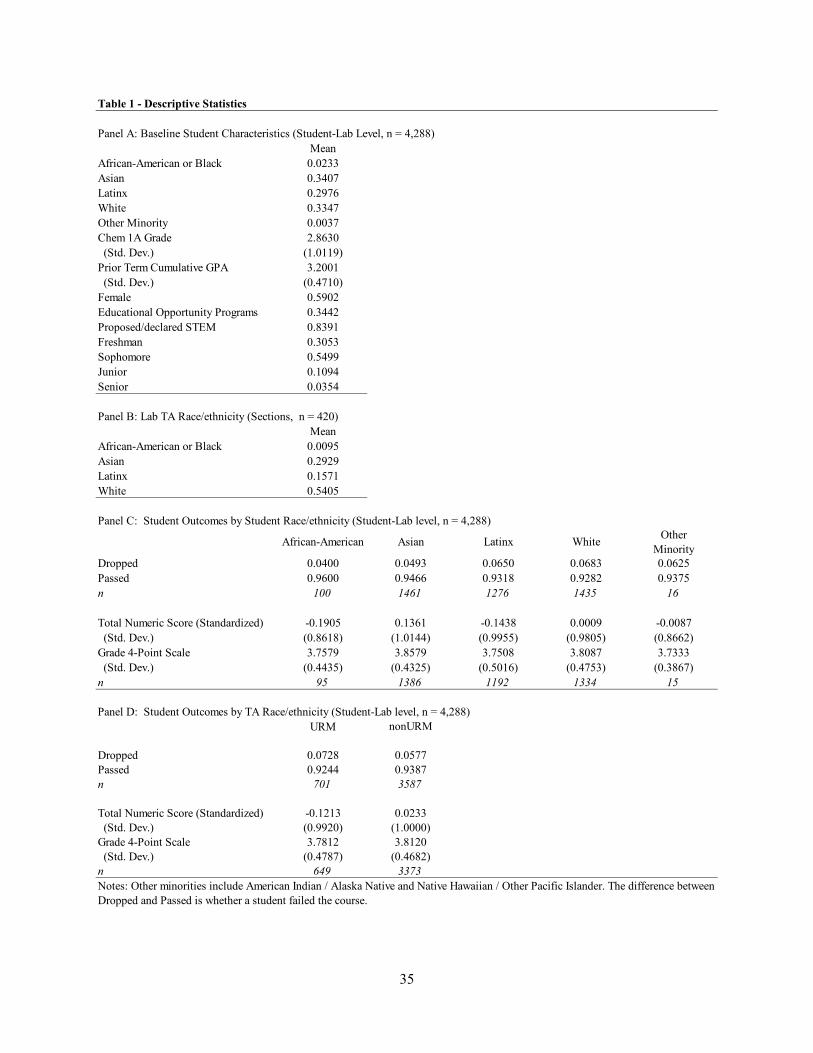
Table 1 reports these descriptive statistics for the analysis sample. Panel A reports a summary of
baseline student characteristics at the student-lab level. The racial and ethnic diversity of the
students enrolled in the Chem labs reflects the diversity of the campus: 2 percent are African-
American/black, 30 percent are Latinx, 34 percent are Asian, 33 percent are white, and less than 1
percent are other minorities (Native-American or Native-Alaskan). The relatively large percentage
of Latinx students reflects the HSI status of the university. The mean Chemistry 1A grade (where
4.0 is equivalent to an A) is 2.86. Females account for 59 percent of the sample.18 EOP students
account for 34 percent of students. Eighty-four percent of students are proposed or declared STEM
majors. A majority of the students taking labs are sophomores (55 percent). Frosh make up the
next largest group (31 percent), whereas juniors (11 percent) and seniors (4 percent) comprise
fewer students.
Panel B reports the ethnic and racial composition of graduate student TAs running the labs
at the lab section level. Underrepresented minorities comprise 17 percent of the instruction of lab
sections (16 percent Latinx and 1 percent African-American). Asian TAs account for 29 percent
of lab section instruction and white TAs account for 54 percent of lab instruction.
In Panel C, we document differences in outcomes by race. African-American students are
the least likely to drop the lab and have a mean drop rate of 4.0 percent. Asian students are the
18 See Fairlie, et al. (2019) for an analysis of gender differences.
13
second least likely to drop and have a mean drop rate of 4.9 percent. Latinx, white, and other
minorities have higher drop rates that are above 6 percent. For numeric scores in the lab class
which are normalized to have mean 0 and standard deviation 1, we find that Asians have the highest
average scores (0.14), followed by whites (0.00). Latinx and black students have lower mean
scores at -0.14 and -0.19, respectively.
In terms of grades (based on grade point levels with a 4.0 being the equivalent of an A),
we find similar patterns with Asians having the highest average grades, whites the second highest,
and underrepresented groups having lower grade averages.
In Panel D we report average outcomes for students assigned to URM TAs and students
assigned to non-URM TAs. The only difference that is statistically significant is for the
standardized numeric score in the lab course, in which students assigned to URM TAs have lower
scores than students assigned to non-URM TAs.
3 Econometric Methods
3.1 Outcomes Regression Model
We turn to the description of the econometric models for the student outcome variables, 𝑦𝑦𝑖𝑖𝑖𝑖𝑖𝑖𝑖𝑖𝑖𝑖 ,
such as course dropout behaviour and grade. We index students by i , graduate teaching assistant
instructors by 𝑗𝑗, lab courses by 𝑘𝑘, lab sections by 𝑠𝑠, and term (i.e. quarter) by 𝑡𝑡. Let 𝑈𝑈𝑈𝑈𝑈𝑈𝑖𝑖 and
𝑈𝑈𝑈𝑈𝑈𝑈_𝑇𝑇𝑇𝑇𝑖𝑖 be indicator variables that are equal to one if student 𝑖𝑖 and TA instructor 𝑗𝑗 belong to an
underrepresented minority group, respectively, and let 𝑋𝑋𝑖𝑖𝑖𝑖𝑖𝑖𝑖𝑖𝑖𝑖 and 𝑢𝑢𝑖𝑖𝑖𝑖𝑖𝑖𝑖𝑖𝑖𝑖 be vectors of observable
and unobservable variables affecting outcomes. A simple test of whether minority students gain
from being taught by a minority TA would be to regress 𝑦𝑦𝑖𝑖𝑖𝑖𝑖𝑖𝑖𝑖𝑖𝑖 on 𝑈𝑈𝑈𝑈𝑈𝑈_𝑇𝑇𝑇𝑇𝑖𝑖 for a sample of
minority students. However, this regression would only work under two conditions: i) students are
14
randomly assigned to treatment (minority TA) and control (nonminority TA), and ii) the treatment
is standardized such that everything except the race of the TA is identical. Although a field
experiment (or quasi-experiment) could (attempt to) fix the first problem, it cannot fix the second
problem. For example, average teaching abilities and grading standards of minority and non-
minority instructors in the sample may not be the same. To address this problem, we specify an
empirical model that is estimated on the full sample of both minority and non-minority students
which allows for classroom fixed effects (see Fairlie et al. 2014). We thus estimate the relative
student-instructor interaction effect, 3α , from the regression:
(3.1) 𝑦𝑦𝑖𝑖𝑗𝑗𝑘𝑘𝑠𝑠𝑡𝑡 = 𝛼𝛼0 + 𝛼𝛼1 ∗ 𝑈𝑈𝑈𝑈𝑈𝑈𝑖𝑖 + 𝛼𝛼2 ∗ 𝑈𝑈𝑈𝑈𝑈𝑈_𝑇𝑇𝑇𝑇𝑗𝑗 + 𝛼𝛼3 ∗ 𝑈𝑈𝑈𝑈𝑈𝑈𝑖𝑖 ∗ 𝑈𝑈𝑈𝑈𝑈𝑈_𝑇𝑇𝑇𝑇𝑗𝑗 + 𝑋𝑋𝑖𝑖𝑗𝑗𝑘𝑘𝑠𝑠𝑡𝑡′ 𝛽𝛽+ 𝑢𝑢𝑖𝑖𝑗𝑗𝑘𝑘𝑠𝑠𝑡𝑡.
The parameter of interest is 3α which represents the minority TA effect on minority students
relative to non-minority students. The parameter, 3α , is consistently estimated if
𝑐𝑐𝑐𝑐𝑐𝑐�𝑢𝑢𝑖𝑖𝑗𝑗𝑘𝑘𝑠𝑠𝑡𝑡; 𝑖𝑖𝑖𝑖𝑡𝑡𝑖𝑖𝑖𝑖𝑖𝑖𝑐𝑐𝑡𝑡𝑖𝑖𝑖𝑖� = 0 where 𝑖𝑖𝑖𝑖𝑡𝑡𝑖𝑖𝑖𝑖𝑖𝑖𝑐𝑐𝑡𝑡𝑖𝑖𝑖𝑖 = 𝑈𝑈𝑈𝑈𝑈𝑈𝑖𝑖 ∗ 𝑈𝑈𝑈𝑈𝑈𝑈_𝑇𝑇𝑇𝑇𝑖𝑖 .
The focus on the interaction term of students’ and TAs’ minority status allows us to include
classroom fixed effects in the regressions. The inclusion of classroom fixed effects implicitly
controls for TA fixed effects since a student can enrol only in one section and each section is taught
by exactly one TA. Unless TAs discriminate against certain groups of students, consciously or
subconsciously, students within a class are subject to identical TA-level and classroom-level
shocks such as a TA’s teaching performance or philosophy, the time of day, or external disruptions.
We also include detailed student background characteristics and prior overall and Chemistry-
specific performance measures in our regressions to control for differences between students
taking lab sections with minority teaching assistants and those with non-minority TAs. But, this is
unlikely to be a concern in our setting because students are unable to choose their TA (which is
testable as discussed below).
15
While our specification addresses many potential threats, it cannot directly control for
differential sorting across minority student groups that may arise due to correlations between
unobserved characteristics and the interaction term. Such correlations exist if, for example, highly
motivated minority students systematically sort into minority-taught lab sections, while highly
motivated non-minority students systematically sort into non-minority-taught sections. We test for
evidence for or against these correlations below.
3.2 Sorting Tests
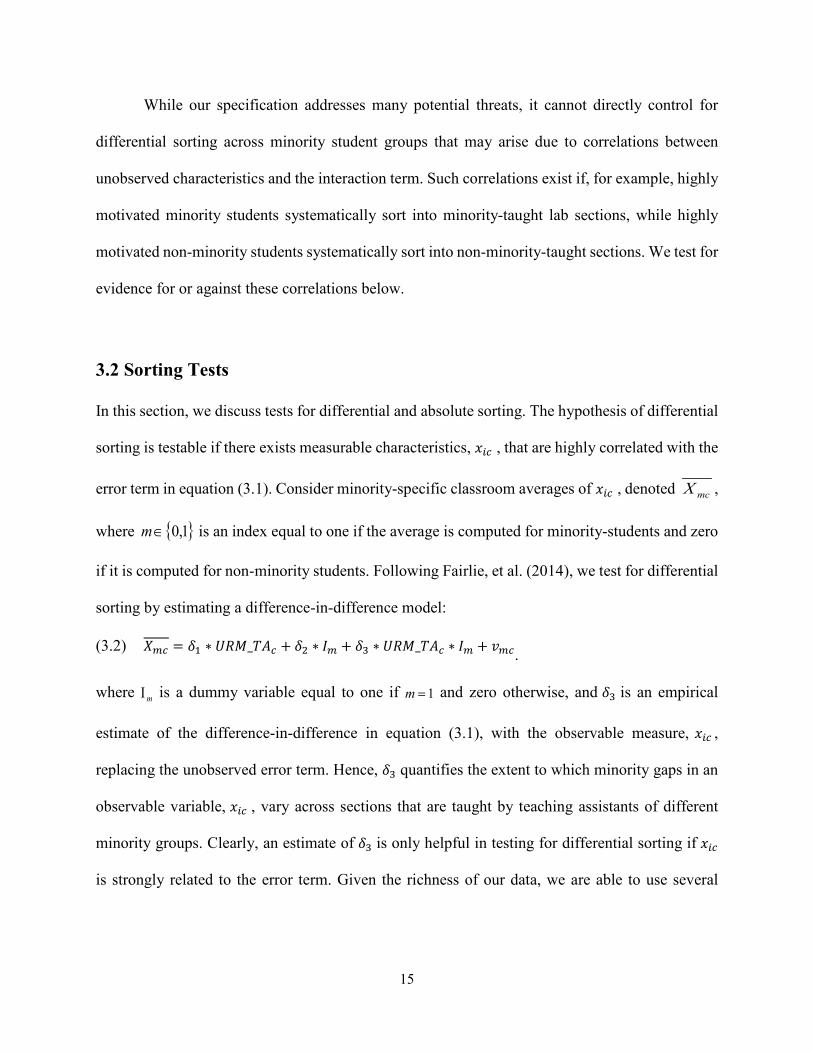
In this section, we discuss tests for differential and absolute sorting. The hypothesis of differential
sorting is testable if there exists measurable characteristics, 𝑥𝑥𝑖𝑖𝑖𝑖 , that are highly correlated with the
error term in equation (3.1). Consider minority-specific classroom averages of 𝑥𝑥𝑖𝑖𝑖𝑖 , denoted mcX ,
where { }1,0∈m is an index equal to one if the average is computed for minority-students and zero
if it is computed for non-minority students. Following Fairlie, et al. (2014), we test for differential
sorting by estimating a difference-in-difference model:
(3.2) 𝑋𝑋𝑚𝑚𝑖𝑖 = 𝛿𝛿1 ∗ 𝑈𝑈𝑈𝑈𝑈𝑈_𝑇𝑇𝑇𝑇𝑖𝑖 + 𝛿𝛿2 ∗ 𝐼𝐼𝑚𝑚 + 𝛿𝛿3 ∗ 𝑈𝑈𝑈𝑈𝑈𝑈_𝑇𝑇𝑇𝑇𝑖𝑖 ∗ 𝐼𝐼𝑚𝑚 + 𝑐𝑐𝑚𝑚𝑖𝑖.
where mΙ is a dummy variable equal to one if 1=m and zero otherwise, and 𝛿𝛿3 is an empirical
estimate of the difference-in-difference in equation (3.1), with the observable measure, 𝑥𝑥𝑖𝑖𝑖𝑖 ,
replacing the unobserved error term. Hence, 𝛿𝛿3 quantifies the extent to which minority gaps in an
observable variable, 𝑥𝑥𝑖𝑖𝑖𝑖 , vary across sections that are taught by teaching assistants of different
minority groups. Clearly, an estimate of 𝛿𝛿3 is only helpful in testing for differential sorting if 𝑥𝑥𝑖𝑖𝑖𝑖
is strongly related to the error term. Given the richness of our data, we are able to use several
16
variables, including past academic performance in chemistry and overall as measureable
characteristics to estimate several “sorting regressions” such as equation (3.2).
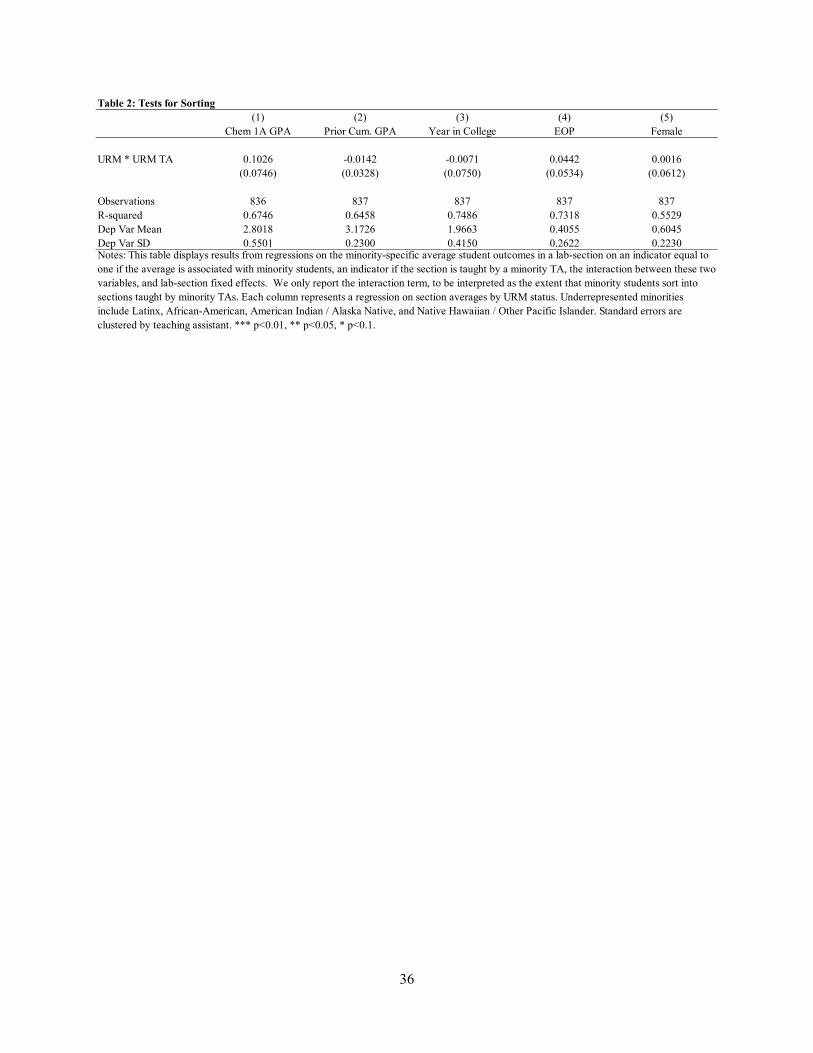
Results using several different student background variables are presented in Table 2.
Standard errors are clustered at the TA level. We use the following five outcome variables,
corresponding to the variable 𝑋𝑋𝑚𝑚𝑖𝑖 in equation (3.2): prior Chemistry 1A grade, prior cumulative
grade point average, student’s year in college, EOP status, and gender. Chemistry 1A is the first
lecture course taken in the introductory sequence and is taken in a prior term to enrollment in the
introductory labs. As noted below it is a strong predictor of course outcomes and is a particularly
good measure of a potential unobserved student component that might be related to differential
selection. We also have a measure of the student’s cumulative GPA prior to enrolment in the first
lab. As past GPA and current grades are highly correlated, this variable is also very useful for the
sorting test. If the minority-non-minority gap of previous grades prior to enrolment in the current
course is different in lab sections that are taught by minority instructors, our assumption of no
differential sorting is most likely violated.
We do not find evidence of differential sorting: None of the estimates are statistically
significant at any conventional level. Most importantly, minority gaps in accumulated GPA prior
to course enrolment do not depend on TA race. In other words, we do not find evidence that high-
ability minority students are more likely to take minority-taught labs compared with high-ability
non-minority students.
Unlike differential sorting, absolute sorting is not a threat to validity for our identification.
Nonetheless, we strongly believe that it is infeasible for students to select their TAs and that this
form of absolute sorting is testable by examining correlations between TA race and student
characteristics. We test this hypothesis by regressing an indicator of TA race or minority status on
17
student characteristics. These results are reported on Table A1 and confirm that there is no
evidence that students are sorting. Similarly, we replicate the falsification test outlined by Lusher
et al. (2018) to see whether class average characteristics can predict TA assignment and we find
no evidence of sorting (as reported in Table A2). Separately, we also test to see if the URM status
of the first assigned TA can predict future assignments, and we find no sorting in this dimension.
We interpret the results from these tests as strong evidence in favour of our working hypothesis of
no sorting, which is consistent with the TA assignment process.
4 Results
4.1 Main Results
To examine the effects of minority student and graduate student teaching assistant interactions on
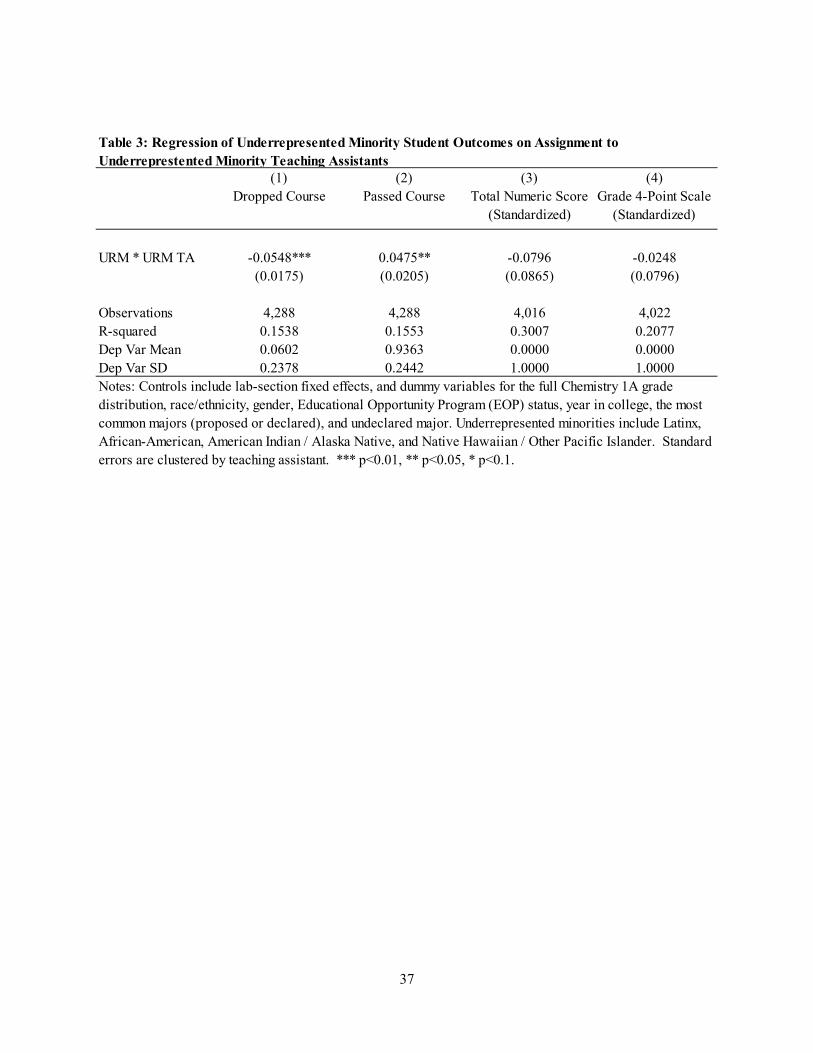
course performance in the chemistry labs, we estimate Equation (3.1). Estimates are reported in
Table 3 for the main course outcomes. Specification 1 reports coefficient estimates for the minority
student/minority TA interaction for the dependent variable – whether the student dropped the
course.19 Minority students are substantially less likely to drop chemistry labs when assigned to a
minority TA. We find an interaction coefficient of -0.055 which is statistically significant and large
relative to the base drop level of 0.060. We also find a large positive effect on passing the course
unconditionally. Estimates of the URM student - URM TA interaction indicate that passing the
course increases by 0.048 on a base of 0.936. Most of the effect is driven by drops but some
students do not pass the course conditional on enrolment. Passing the lab course is essential for
19 Drops here are defined as dropping the lab course that term independent of the section. The results are very similar if we measure dropped sections instead. Because of the restrictions noted above it is extremely difficult for a student to drop a lab course section and switch to a different one that term.
18
completing the required introductory sequence in chemistry and might lead to disruptions in
continuation (which we examine below).
We turn to performance in the lab course conditional on receiving a score or grade in the
system. Specification 3 reports estimates for the continuous score in the lab course (standardized
to have mean zero and standard deviation one). For the continuous score we do not find evidence
of an effect of having a minority TA for minority students. The results are similar when we focus
on the numeric version of the letter grade in the course, also standardized (Specification 4). Our
estimates do not provide evidence that minority student grades are affected when assigned to a
minority TA. But, both point estimates are imprecise, and we cannot rule out large negative or
large positive effects.20
The negative coefficient on the minority student-TA interaction in the dropped course
regression suggests that there is a potential for differential selection into who receives total scores
and grades in the lab class. If having a minority TA makes it less likely to drop a course then the
students who remain in the class and ultimately receive a grade might be lower ability (thus
resulting in estimates with no effect on course scores). There is no method of directly testing this
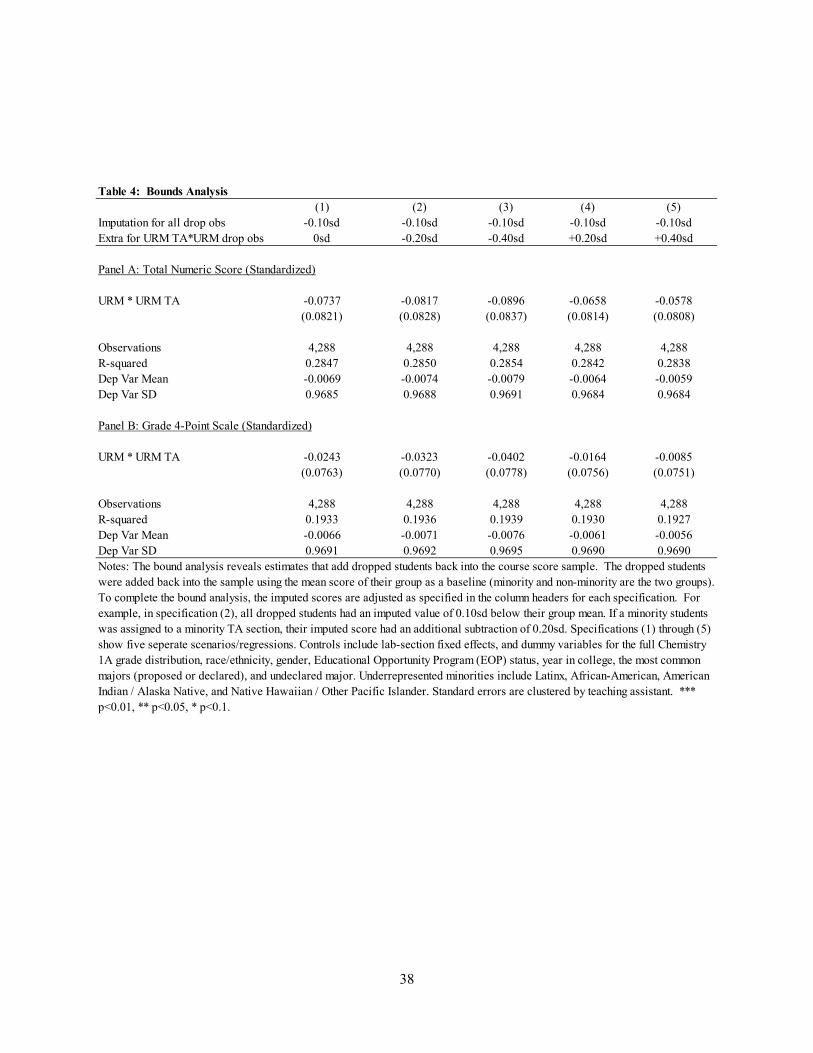
assertion so we instead conduct a bounds analysis.21 Specifically, we impute scores for those
students who dropped or are missing the lab course score using information from students who did
not drop the course.22 Table 4 reports estimates from the bounds analysis. As a benchmark we first
assume that all dropped students would have received lower scores in the course and impute their
scores by taking the mean for their subgroup among non-missing observations and subtracting 0.1
20 But, we find that the sign of the point estimates is not very robust to alternative specifications whereas the lack of statistical significance is. 21 We estimate specifications with an interaction between high-ability URM students and URM TAs and find no evidence of a differential effect on drop rates or pass rates. See Table A3 for estimates. 22 Dropped courses comprise 95 percent of missing grade information.
19
standard deviations (reported in Specification 1). Second, because the focus is on the minority
student-TA interaction we impute grades for dropped minority students who are assigned to
minority TAs by adding an additional component to this negative selection. We then add these
observations to the sample and re-estimate the equation using the full sample of non-dropped
students and dropped students. We simulate minority student-TA interactions for dropped students
of -0.20, -0.40, +0.20 and +0.40 from the full sample of minority students in the spirit of Fairlie et
al. (2014) (reported in Specifications 2-5, respectively). The bounds analysis reveals that adding
the dropped students back into the course score sample and assuming that those students would
have had very large minority TA effects (either negative or positive) continues to indicate null
estimates on course scores.23 The imprecision in point estimates, however, does not allow us to
rule out large negative or positive effects.
The results are consistent with the small differences in observable characteristics between
students without grade observations and students with grade observations (Table A5). Dropped
students do slightly worse in Chem 1A (0.27 grade points), and are younger and less likely to have
already declared or proposed a STEM major, but the differences are relatively small. Overall, the
small percentage of students dropping the course or having missing information, and the minor
differences in observables suggest that attrition bias due to drops is unlikely to have much of an
influence on our estimates for lab course scores and grades.
In all of our main regressions for lab course outcomes we focus on the student-TA
interactions for first time lab course enrolment because not only do students have less information
in their first enrolled lab course but also because the results would be confounded by dynamic
accumulation effects otherwise. We relax this constraint and include observations from both lab
23 Lee (2009) bounds are reported in Table A4 and show roughly similar results.
20
courses (Chem 1M and Chem 1N) in the Introductory to Chemistry sequence. Table 5 reports these
estimates. We continue to find that minority students are less likely to drop the course and are
more likely to pass the course if assigned a minority TA. The effects are smaller in magnitude but
continue to be large and statistically significant especially relative to the base levels. The drop
effect is -0.034 relative to a base of 0.052, and the pass effect is 0.029 relative to a base of 0.945.
Expanding the sample to include the second lab course enrolment, we find similarly no evidence
of effects on course scores or grades.
As noted above in Table 1, Latinx students comprise the bulk of underrepresented minority
students (91.7 percent). African-American students and other underrepresented minority students
comprise only 7.2 and 1.1 percent of the group, respectively. Similarly Latinx TAs comprise nearly
all URM TAs. In Table 6, we report estimates in which we separate the three largest groups (Latinx,
Asian, and white) instead of using the aggregated URM vs non-URM comparison. White TAs
comprise roughly 54 percent of all TAs and represent the left-out category for estimating
interactions. The estimates for the Latinx student – Latinx TA interactions are very similar to the
URM vs nonURM interaction estimates. We find a large negative and statistically significant
coefficient on the Latinx interaction for drops of -0.066. For the pass rate, we find a Latinx
interaction coefficient of 0.054. We find no effects, however, on course scores or grades. We also
do not find evidence of differential effects for Latinx students when assigned to Asian TAs and do
not find differential effects for Asian students when assigned to Latinx TAs. Latinx students and
TAs are clearly driving the results for URM student-TA interactions in the regressions which is
consistent with their large share of the total URM population of undergraduate and graduate
students.
21
4.2 Robustness Checks
We check the main results for robustness along several dimensions. First, we examine whether the
model is sensitive to the inclusion of different controls and fixed effects. The main specifications
include lab section fixed effects which subsume several different fixed effects such as TA,
course/term and time/day fixed effects. Estimates are similar when: i) only controlling for student
and TA race and the lab course (1M or 1N labs) in which students are enrolled, ii) adding course
by term fixed effects, and iii) adding TA fixed effects. The results are robust to various levels of
fixed effects.
Using the larger sample that includes both lab courses, we can estimate models that further
include student fixed effects. Table A6 reports these estimates. We lose statistical significance on
the drop and pass specifications but the point estimates remain large and similar to what we find
for our first lab section regressions (Table 3) and both lab section regressions (Table 5). For the
course score and grade regressions we do not find evidence of effects, similar to the previous
regression results. Although we cannot read too much into these estimates because of the lack of
statistical significance, the point estimates are in line with our main results. Given that students
take at most two lab sections in the sample, students have more information for their second choice,
and complications because of dynamic accumulation effects, we return to our preferred models
using only the first observed lab section for each student.
A key control included in all regressions is the student’s grade in Chemistry 1A, which is
the first lecture course taken in the introductory sequence and taken prior to enrollment in the labs.
We include the full set of dummy variables for letter grades as controls. As expected, grades in
Chemistry 1A are a very strong predictor of performance in the lab. As a robustness check we
22
replace Chemistry 1A grades with cumulative GPA prior to enrollment in the labs. The results are
robust to the inclusion of this variable or both variables
4.3 Additional Outcomes
Dropping the course or not passing the course could have subsequent consequences such as
disrupting the student’s trajectory in the sciences or even causing the student to leave STEM. We
examine additional outcomes to evaluate these consequences. Table 7 reports estimates for total
Chemistry units earned that quarter (Specification 1). We find a point estimate of 0.27, but the
coefficient is statistically insignificant. Although the point estimate is statistically insignificant, it
is larger than implied mechanically by the coefficient estimate on the minority student/TA
interaction reported in Table 3. By multiplying that coefficient by 2 units (i.e. units earned for the
chemistry labs) we would find a 0.095 reduction in total Chemistry units earned that term
mechanically from not passing the lab course. The point estimate implies that there might be an
additional effect on increasing interest in chemistry. Unfortunately, we do not have the precision
to make any conclusions on this point.
Specification 2 reports estimates for total units earned that quarter. We find a -0.36 point
estimate on total units, but the coefficient is not statistically significant. A priori, the effect on total
units earned during the quarter is ambiguous because students could replace the 2-unit lab by
taking another non-chemistry course for more units (i.e. most courses are 5 units). This may be
motivated by financial aid receipt requiring at least 12 units per term, students needing enough
units to graduate, and/or tuition being based on full-time enrolment and not on how many enrolled
units.
Minority student-TA interactions may have longer-term consequences such as encouraging
minority students to continue in chemistry, the sciences or STEM more generally. We first
23
examine whether students enrol in the lab in a future term (Specification 3). We find no evidence
of an effect. We also examine whether minority TAs influence subsequent course taking in
chemistry. We examine enrolment in the first set of required courses (Introductory Chemistry 1A,
1B, 1C and Organic Chemistry 8A). The estimates reported in Specification 4 of Table 7 also do
not show evidence of an effect. We also examine majoring in chemistry, the sciences or STEM
(Specifications 5-7). We find no effect on these measures. For all of the measures of longer-term
interest in continuing in STEM, we do not find evidence of positive effects of being assigned a
minority TA. Although minority TAs encourage minority students to remain enrolled in and pass
the labs, our estimates do not provide evidence that these effects translate into improving longer
term outcomes. Other barriers to continue in STEM might be too large to overcome or the effects
stemming from just one class might be too small to detect.
4.4 Further Limiting Choice
Although the institutional setting limits choice of lab TAs which is confirmed by our sorting tests,
we explore several methods of further limiting student choice among lab sections. First, we
estimate equation (3.1) using a sample of students who have the lowest registration priority status.
We find similar estimates. Second, we consider a specification that drops observations for which
the lab sections in the same time slot in a quarter are taught by both minority and non-minority
TAs. Identification of minority student-instructor interactions therefore comes only from across
time slot variation in TA race. As noted above, undergraduate students enrol in their lab sections
choosing their time slot more than a month before TA assignments. Students cannot enrol in more
than one time slot and must make a choice based on their schedule of other chosen courses during
that term. This sample restriction thus removes any choice over TA race conditional on their time
24
slot chosen. Table A7 reports these estimates. We continue to find large positive effects on drop
and pass rates, but now find a negative effect on course score (although not on course grade).
We also limit the effects of possible TA choice on the estimates by aggregating the share
of TAs that are minority at the time slot level. For example, if the Tuesday, 10:00AM-1:00PM,
Fall 2017 time slot has one minority TA and 4 non-minority TAs then the TA share variable would
be equal to 0.20. Although we lose information by aggregating TA race, this limits the effects of
choice across sections within a time slot.24 Table A8 reports these estimates. We find a statistically
significant decrease on drops, but no evidence of effects on other outcomes.
These specifications assume that the time slot choice is first and restrict choice after that
point. What if a student instead has a lot of flexibility in time slots based on their planned course
schedule that term and tries to find a TA through this choice. The only way to do this is to choose
a time slot with only one section offered (and of course somehow know months in advance who
the TA is even before the TA knows). Nevertheless, this is easy to check by instead removing all
lab sections from the sample with only one offering in that time slot. We find similar results.
Overall, no matter what we assume about student selection of section time slots we find that the
results are robust providing further evidence that our main results are not due to selection bias.
Alternatively, there is a potential that effects are driven by students who are more informed.
First, undergraduates majoring in chemistry may have more information about the chemistry lab
TAs. To eliminate this potential, we estimate equation (3.1) using a sample of students who are
not chemistry majors (proposed or declared). Second, some students may investigate the full list
of chemistry lab TAs from the previous quarters. To rule out this scenario, we estimate equation
24 The approach is also useful for comparison to Lusher et al. (2018) who measure the percentage of Asian TAs for their economics courses.
25
(3.1) including only sections led by first-time chemistry lab TAs.25 In both scenarios, we find
similar and statistically significant estimates as our main results.
Overall, the results are not sensitive to these alternative samples and methods. We find that
even with additional restrictions on choice or information, minority students are much less likely
to drop lab courses when assigned to minority TAs. The robustness of findings to these sample
restrictions further limiting choice and information to undergraduate students is not surprising
because registration into lab sections is done months in advance of when TA assignments to
sections are made (as discussed above).
4.5 Discussion of Potential Mechanisms
In this section, we explore the potential mechanisms driving the student-TA interactions that we
estimate above. One key question is whether our positive estimates are due to students or teaching
assistants behaving differently. An obvious potential source of instructor bias is through grading
which could even be at an unconscious level. However, chemistry labs use online quizzes, online
pre-labs, and multiple choice questions over potentially more "subjectively" graded essays, reports
or problem sets. The TA has little ability to grade subjectively or inflate grades based on personal
taste or subconscious behaviour. We also find significant, robust, and sizable minority student-TA
interaction effects for course dropout behaviour. The minority student response in this outcome
decreases by over 5 percentage points relative to a base of 6 percent if the class is taught by a
minority teaching assistant. The decision to drop out of the class is made entirely by the student
and must be made in the first few weeks of a term, well before final grades are assigned. Thus, our
25 Most of the TAs in introductory chemistry labs are new TAs because they are still in very early stages of their graduate programs and the course material in introductory chemistry labs are general across the physical sciences.
26
interaction estimates are likely due to students behaving differently in response to the TA’s race
rather than vice versa (which would include grading bias). Interestingly, we do not find evidence
that once enrolled in the lab, minority students obtain better scores and grades in the class when
assigned to minority TAs, and these results do not appear to be driven by selection on dropping
the labs.
In the chemistry labs, minority students might benefit from having minority TAs because:
i) they are inspired by having an uncommon minority TAs as a role model in the sciences or STEM,
ii) they are more comfortable talking to and interacting with minority TAs, iii) they are more likely
to believe that they will learn from minority TAs who share similar backgrounds and languages,
and iv) they increase a sense of belonging to the university and field of study. The positive effects
that we find do not appear to be due to a conscious or subconscious TA grading bias either. Our
study occurs in an environment where grading is objective and potential grading bias is minimized.
5 Conclusions
Using a crucial and broadly-attended gateway course in the sciences – introductory chemistry labs,
we estimate for the first time the importance of interactions between underrepresented minority
TA instructors and underrepresented minority students in STEM. The procedure of assigning TAs
to sections is done after the official start of the term at the initial TA meeting and more than a
month after students enrol in courses for the term resulting in an uncommon exogenous assignment
of college students to TAs (partly because of scheduling constraints with research labs). The
estimation of fixed effect models and models that limit choice and information available to
students address many remaining concerns over potential biases in estimating racial interactions.
We find that underrepresented minority students are substantially less likely to drop a course and
27
are more likely to pass a course when assigned to an underrepresented minority TA, but do not
find evidence of effects on grades or medium-term outcomes. The effects on first-order drop and
pass rates are large relative to base rates. For example, we find that the drop rate decreases by 5.5
percentage points when a minority student is assigned to a minority TA relative to a base rate of
6.0 percent. The pass rate increases by 4.8 percentage points relative to a base rate of 93.6 percent.
These results are primarily driven by the interactions between Latinx students and Latinx TAs.
The effects on grades and medium-term outcomes might be more difficult to detect because of less
variation in outcomes, additional unobserved factors, and being less of a behavioral outcome.
Other barriers to continue in STEM might be too large to overcome or the effects stemming from
just one class might be too small to detect.
The institutional setting and large sample sizes allow us to run several checks to further
allay concerns over selection bias. First, the findings from all of the different sorting tests provide
consistent support for the random assignment assumption. Second, we focus on first-time lab
course enrolment because these students have less information in their first enrolled lab course,
but estimates are robust to including multiple labs enrolments. Third, the results are robust to
changing the level of fixed effects, and estimating models that further include student fixed effects
using the multiple lab course sample. Fourth, the results are robust to including only students with
limited choice in time slots (i.e. lowest registration priority), and limited choice in TA race for lab
sections (i.e. remove all sections with variation in TA race and aggregate TA race by time slot).
Fifth, we restrict student information about TA race and characteristics by excluding students in
the Chemistry Department, and by including only new graduate students in the TA sample. The
results are robust to these restrictions providing further evidence that our findings are not being
driven by selection.
28
The findings have implications for future trends in racial inequality in education and the
labor market. The underrepresented minority student population continues to grow rapidly
throughout the nation (primarily because of the growth in Latinx students as seen in Figure 1), yet
the share of underrepresented minority faculty and TAs lags far behind (U.S. Department of
Education 2020; Heilig et al., 2019). As noted above, for example, only 6.8 percent of PhDs in
STEM are granted to underrepresented minority students. Our results indicate that a lack of access
to similar race role models in classrooms may inhibit the recruitment of minority students into
STEM fields.
Public attitudes and policy are changing to address racial inequities in education especially
in STEM. A recent federal example includes the bipartisan supported America COMPETES Act
and subsequent re-authorization. This act has sought to improve training for future STEM workers
with an emphasis on increasing diversity in the STEM workforce and reducing racial disparities.
Many public universities and systems are also actively seeking to increase minority participation
among faculty and instructors (e.g. UCOP 2018; CSUS 2016; CCCCO 2020) and some private
universities have new initiatives based on recent events (e.g. Stanford University 2020). Recently,
the California State Senate voted to place a proposed constitutional amendment on the November
2021 ballot to reverse the long-standing Proposition 209, which prohibits affirmative action
including the consideration of race in admissions and hiring by public universities. These
initiatives highlight the growing view that increasing minority faculty and graduate student TAs is
important especially in STEM fields, but the evidence from careful research designs is lagging.
Graduate student TAs may play an underappreciated role in helping universities educate
and motivate a growingly diverse student population. In addition to providing role models for
undergraduates in the present, minority graduate students might provide role models in the STEM

29
workforce in the future. Although this study provides some quantitative evidence of the benefits
to minority students of increasing diversity among graduate student TAs, more research is clearly
needed to inform the continuing debates over policy solutions such as affirmative action.
30
References
Altonji, J. G., & Blank, R. M. (1999). Race and gender in the labor market. Handbook of Labor Economics, 3, 3143–3259.
Altonji, J. G., Blom, E., & Meghir, C. (2012). Heterogeneity in Human Capital Investments:
High School Curriculum, College Major, and Careers. Annual Review of Economics, 4, 185–223.
Arcidiacono, P., Aucejo, E. M., & Hotz, V. J. (2016). University differences in the graduation of minorities in STEM fields: Evidence from California. American Economic Review, 106(3), 525–562.
Bettinger, E. P., & Long, B. T. (2005). Do faculty serve as role models? The impact of instructor gender on female students. American Economic Review, 95(2), 152–157.
Birdsall, C., Gershenson, S., & Zuniga, R. (2020). The effects of demographic mismatch in an
elite professional school setting. Education Finance and Policy, 15(3), 457–486.
Borjas, G. J. (2000). Foreign-born teaching assistants and the academic performance of undergraduates. American Economic Review, 90(2), 355–359.
Card, D. (1999). The causal effect of education on earnings. In Handbook of labor economics (Vol. 3, pp. 1801–1863). Elsevier.
Carrell, S. E., Page, M. E., & West, J. E. (2010). Sex and science: How professor gender
perpetuates the gender gap. The Quarterly Journal of Economics, 125(3), 1101–1144. Cataldi, E. F., Siegel, P., Shepherd, B., & Cooney, J. (2014). Baccalaureate and Beyond: A First
Look at the Employment Experiences and Lives of College Graduates, 4 Years On (B&B: 08/12). NCES 2014-141. National Center for Education Statistics.
California Community Colleges Chancellor’s Office. 2020. “Vision for Success Diversity,
Equity and Inclusion Task Force,” https://www.cccco.edu/-/media/CCCCO-Website/Reports/CCCCO_DEI_Report.pdf?la=en&hash=69E11E4DAB1DEBA3181E053BEE89E7BC3A709BEE
California State University System. 2016. “Inclusive Excellence,”
https://www2.calstate.edu/impact-of-the-csu/diversity/inclusive-excellence/Pages/default.aspx
Dee, T. S. (2004). Teachers, race, and student achievement in a randomized experiment. Review
of Economics and Statistics, 86(1), 195–210. Dee, T. S. (2005). A teacher like me: Does race, ethnicity, or gender matter? American Economic
Review, 95(2), 158–165.
31
Egalite, A. J., Kisida, B., & Winters, M. A. (2015). Representation in the classroom: The effect of own-race teachers on student achievement. Economics of Education Review, 45, 44–52.
Ehrenberg, R. G., Goldhaber, D. D., & Brewer, D. J. (1995). Do teachers’ race, gender, and
ethnicity matter? Evidence from the National Educational Longitudinal Study of 1988. ILR Review, 48(3), 547–561.
Fairlie, R. W., Hoffmann, F., & Oreopoulos, P. (2014). A community college instructor like me:
Race and ethnicity interactions in the classroom. American Economic Review, 104(8), 2567–2591.
Fry, Richard Allan. 2005. Recent changes in the entry of Hispanic and White youth into college.
Washington, DC: Pew Hispanic Center, 2005. Ganderton, Philip T., and Richard Santos. 1995. "Hispanic college attendance and completion:
Evidence from the high school and beyond surveys." Economics of Education Review 14.1 (1995): 35-46.
Gershenson, S., Hart, C., Hyman, J., Lindsay, C., & Papageorge, N. W. (2018). The long-run
impacts of same-race teachers. Gershenson, S., Holt, S. B., & Papageorge, N. W. (2016). Who believes in me? The effect of
student--teacher demographic match on teacher expectations. Economics of Education Review, 52, 209–224.
Goodman, I. F. (2002). Final Report of the Women’s Experiences in College Engineering
(WECE) Project. Online Submission. Griffith, A. L. (2010). Persistence of women and minorities in STEM field majors: Is it the
school that matters? Economics of Education Review, 29(6), 911–922. Heilig, J. V., Flores, I. W., Barros Souza, A. E., Barry, J. C., & Monroy, S. B. (2019).
Considering the Ethnoracial and Gender Diversity of Faculty in United States College and University Intellectual Communities. Hisp. JL & Pol’y, 1.
Hoffmann, F., & Oreopoulos, P. (2009). A professor like me the influence of instructor gender
on college achievement. Journal of Human Resources, 44(2), 479–494. Hull, Marie C. 2017. "The academic progress of Hispanic immigrants." Economics of Education
Review 57 (2017): 91-110. Jencks, C., & Phillips, M. (1998). The black-white test score gap: An introduction. The Black-
White Test Score Gap, 1(9), 26. Kokkelenberg, E. C., & Sinha, E. (2010). Who succeeds in STEM studies? An analysis of
Binghamton University undergraduate students. Economics of Education Review, 29(6),
32
935–946. Kurlaender, M., Jackson, J., Howell, J. S., & Grodsky, E. (2014). College course scarcity and
time to degree. Economics of Education Review, 41, 24–39. Lee, D. S. (2009). Training, wages, and sample selection: Estimating sharp bounds on treatment
effects. The Review of Economic Studies, 76(3), 1071-1102. Lusher, L., Campbell, D., & Carrell, S. (2018). TAs like me: Racial interactions between
graduate teaching assistants and undergraduates. Journal of Public Economics, 159, 203–224.
Marvasti, A. (2007). Foreign-born teaching assistants and student achievement: an ordered probit analysis. The American Economist, 51(2), 61–71.
National Science Board. (2015). Revisiting the stem workforce: A companion to science and engineering indicators 2014. National Science Foundation VA.
Neering, Kyle F. 2018. “Course Closed: The Short- and Long-Run Impacts of Course Shutouts on University Students.” Working Paper.
Price, J. (2010). The effect of instructor race and gender on student persistence in STEM fields.
Economics of Education Review, 29(6), 901–910. UCOP 2018. “UC launches major push to increase faculty diversity,” UC Office of the President,
Wednesday, September 26, 2018, https://www.universityofcalifornia.edu/press-room/uc-launches-major-push-increase-faculty-diversity
U.S. Department of Education. 2019a. “Table 306.30. Fall enrollment of U.S. residents in
degree-granting postsecondary institutions, by race/ethnicity: Selected years, 1976 through 2028,” https://nces.ed.gov/programs/digest/d18/tables/dt18_306.30.asp?referrer=report
U.S. Department of Education. 2019b. “Table 314.40. Employees in degree-granting
postsecondary institutions, by race/ethnicity, sex, employment status, control and level of institution, and primary occupation: Fall 2017,” https://nces.ed.gov/programs/digest/d18/tables/dt18_314.40.asp?referrer=report
U.S. Department of Education. 2020. “Table 318.45. Number and percentage distribution of
science, technology, engineering, and mathematics (STEM) degrees/certificates conferred by postsecondary institutions, by race/ethnicity, level of degree/certificate, and sex of student: 2009-10 through 2018-19,” https://nces.ed.gov/programs/digest/d20/tables/dt20_318.45.asp
Solanki, S. M., & Xu, D. (2018). Looking Beyond Academic Performance: The Influence of
Instructor Gender on Student Motivation in STEM Fields. American Educational Research

33
Journal, 0002831218759034.
34
0%
2%
4%
6%
8%
10%
12%
14%
16%
18%
20%
1980 1985 1990 1995 2000 2005 2010 2015 2020
Figure 1: U.S. College Students by Major Minority Groups, 1980-2017
African-American Latinx Asian Native American
African-American
Latinx
Asian
Native American
35
Table 1 - Descriptive Statistics
Panel A: Baseline Student Characteristics (Student-Lab Level, n = 4,288)Mean
African-American or Black 0.0233Asian 0.3407Latinx 0.2976White 0.3347Other Minority 0.0037Chem 1A Grade 2.8630 (Std. Dev.) (1.0119)Prior Term Cumulative GPA 3.2001 (Std. Dev.) (0.4710)Female 0.5902Educational Opportunity Programs 0.3442Proposed/declared STEM 0.8391Freshman 0.3053Sophomore 0.5499Junior 0.1094Senior 0.0354
Panel B: Lab TA Race/ethnicity (Sections, n = 420)Mean
African-American or Black 0.0095Asian 0.2929Latinx 0.1571White 0.5405
Panel C: Student Outcomes by Student Race/ethnicity (Student-Lab level, n = 4,288)
African-American Asian Latinx White OtherMinority
Dropped 0.0400 0.0493 0.0650 0.0683 0.0625Passed 0.9600 0.9466 0.9318 0.9282 0.9375n 100 1461 1276 1435 16
Total Numeric Score (Standardized) -0.1905 0.1361 -0.1438 0.0009 -0.0087 (Std. Dev.) (0.8618) (1.0144) (0.9955) (0.9805) (0.8662)Grade 4-Point Scale 3.7579 3.8579 3.7508 3.8087 3.7333 (Std. Dev.) (0.4435) (0.4325) (0.5016) (0.4753) (0.3867)n 95 1386 1192 1334 15
Panel D: Student Outcomes by TA Race/ethnicity (Student-Lab level, n = 4,288)URM nonURM
Dropped 0.0728 0.0577Passed 0.9244 0.9387n 701 3587
Total Numeric Score (Standardized) -0.1213 0.0233 (Std. Dev.) (0.9920) (1.0000)Grade 4-Point Scale 3.7812 3.8120 (Std. Dev.) (0.4787) (0.4682)n 649 3373Notes: Other minorities include American Indian / Alaska Native and Native Hawaiian / Other Pacific Islander. The difference between Dropped and Passed is whether a student failed the course.
36
Table 2: Tests for Sorting(1) (2) (3) (4) (5)
Chem 1A GPA Prior Cum. GPA Year in College EOP Female
URM * URM TA 0.1026 -0.0142 -0.0071 0.0442 0.0016(0.0746) (0.0328) (0.0750) (0.0534) (0.0612)
Observations 836 837 837 837 837R-squared 0.6746 0.6458 0.7486 0.7318 0.5529Dep Var Mean 2.8018 3.1726 1.9663 0.4055 0.6045Dep Var SD 0.5501 0.2300 0.4150 0.2622 0.2230Notes: This table displays results from regressions on the minority-specific average student outcomes in a lab-section on an indicator equal to one if the average is associated with minority students, an indicator if the section is taught by a minority TA, the interaction between these two variables, and lab-section fixed effects. We only report the interaction term, to be interpreted as the extent that minority students sort into sections taught by minority TAs. Each column represents a regression on section averages by URM status. Underrepresented minorities include Latinx, African-American, American Indian / Alaska Native, and Native Hawaiian / Other Pacific Islander. Standard errors are clustered by teaching assistant. *** p<0.01, ** p<0.05, * p<0.1.
37
(1) (2) (3) (4)Dropped Course Passed Course Total Numeric Score
(Standardized)Grade 4-Point Scale
(Standardized)
URM * URM TA -0.0548*** 0.0475** -0.0796 -0.0248(0.0175) (0.0205) (0.0865) (0.0796)
Observations 4,288 4,288 4,016 4,022R-squared 0.1538 0.1553 0.3007 0.2077Dep Var Mean 0.0602 0.9363 0.0000 0.0000Dep Var SD 0.2378 0.2442 1.0000 1.0000Notes: Controls include lab-section fixed effects, and dummy variables for the full Chemistry 1A grade distribution, race/ethnicity, gender, Educational Opportunity Program (EOP) status, year in college, the most common majors (proposed or declared), and undeclared major. Underrepresented minorities include Latinx, African-American, American Indian / Alaska Native, and Native Hawaiian / Other Pacific Islander. Standard errors are clustered by teaching assistant. *** p<0.01, ** p<0.05, * p<0.1.
Table 3: Regression of Underrepresented Minority Student Outcomes on Assignment to Underreprestented Minority Teaching Assistants
38
Table 4: Bounds Analysis(1) (2) (3) (4) (5)
Imputation for all drop obs -0.10sd -0.10sd -0.10sd -0.10sd -0.10sdExtra for URM TA*URM drop obs 0sd -0.20sd -0.40sd +0.20sd +0.40sd
Panel A: Total Numeric Score (Standardized)
URM * URM TA -0.0737 -0.0817 -0.0896 -0.0658 -0.0578(0.0821) (0.0828) (0.0837) (0.0814) (0.0808)
Observations 4,288 4,288 4,288 4,288 4,288R-squared 0.2847 0.2850 0.2854 0.2842 0.2838Dep Var Mean -0.0069 -0.0074 -0.0079 -0.0064 -0.0059Dep Var SD 0.9685 0.9688 0.9691 0.9684 0.9684
Panel B: Grade 4-Point Scale (Standardized)
URM * URM TA -0.0243 -0.0323 -0.0402 -0.0164 -0.0085(0.0763) (0.0770) (0.0778) (0.0756) (0.0751)
Observations 4,288 4,288 4,288 4,288 4,288R-squared 0.1933 0.1936 0.1939 0.1930 0.1927Dep Var Mean -0.0066 -0.0071 -0.0076 -0.0061 -0.0056Dep Var SD 0.9691 0.9692 0.9695 0.9690 0.9690Notes: The bound analysis reveals estimates that add dropped students back into the course score sample. The dropped students were added back into the sample using the mean score of their group as a baseline (minority and non-minority are the two groups). To complete the bound analysis, the imputed scores are adjusted as specified in the column headers for each specification. For example, in specification (2), all dropped students had an imputed value of 0.10sd below their group mean. If a minority students was assigned to a minority TA section, their imputed score had an additional subtraction of 0.20sd. Specifications (1) through (5) show five seperate scenarios/regressions. Controls include lab-section fixed effects, and dummy variables for the full Chemistry 1A grade distribution, race/ethnicity, gender, Educational Opportunity Program (EOP) status, year in college, the most common majors (proposed or declared), and undeclared major. Underrepresented minorities include Latinx, African-American, American Indian / Alaska Native, and Native Hawaiian / Other Pacific Islander. Standard errors are clustered by teaching assistant. *** p<0.01, ** p<0.05, * p<0.1.
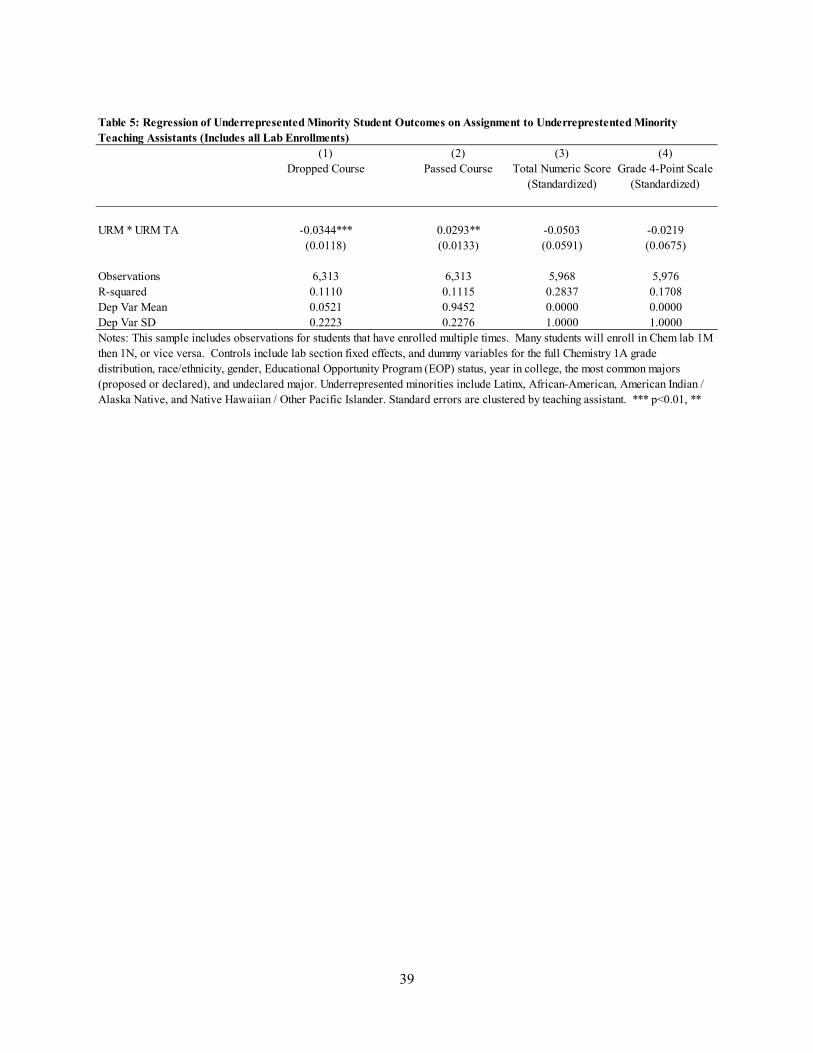
39
(1) (2) (3) (4)Dropped Course Passed Course Total Numeric Score
(Standardized)Grade 4-Point Scale
(Standardized)
URM * URM TA -0.0344*** 0.0293** -0.0503 -0.0219(0.0118) (0.0133) (0.0591) (0.0675)
Observations 6,313 6,313 5,968 5,976R-squared 0.1110 0.1115 0.2837 0.1708Dep Var Mean 0.0521 0.9452 0.0000 0.0000Dep Var SD 0.2223 0.2276 1.0000 1.0000Notes: This sample includes observations for students that have enrolled multiple times. Many students will enroll in Chem lab 1M then 1N, or vice versa. Controls include lab section fixed effects, and dummy variables for the full Chemistry 1A grade distribution, race/ethnicity, gender, Educational Opportunity Program (EOP) status, year in college, the most common majors (proposed or declared), and undeclared major. Underrepresented minorities include Latinx, African-American, American Indian / Alaska Native, and Native Hawaiian / Other Pacific Islander. Standard errors are clustered by teaching assistant. *** p<0.01, **
Table 5: Regression of Underrepresented Minority Student Outcomes on Assignment to Underreprestented Minority Teaching Assistants (Includes all Lab Enrollments)
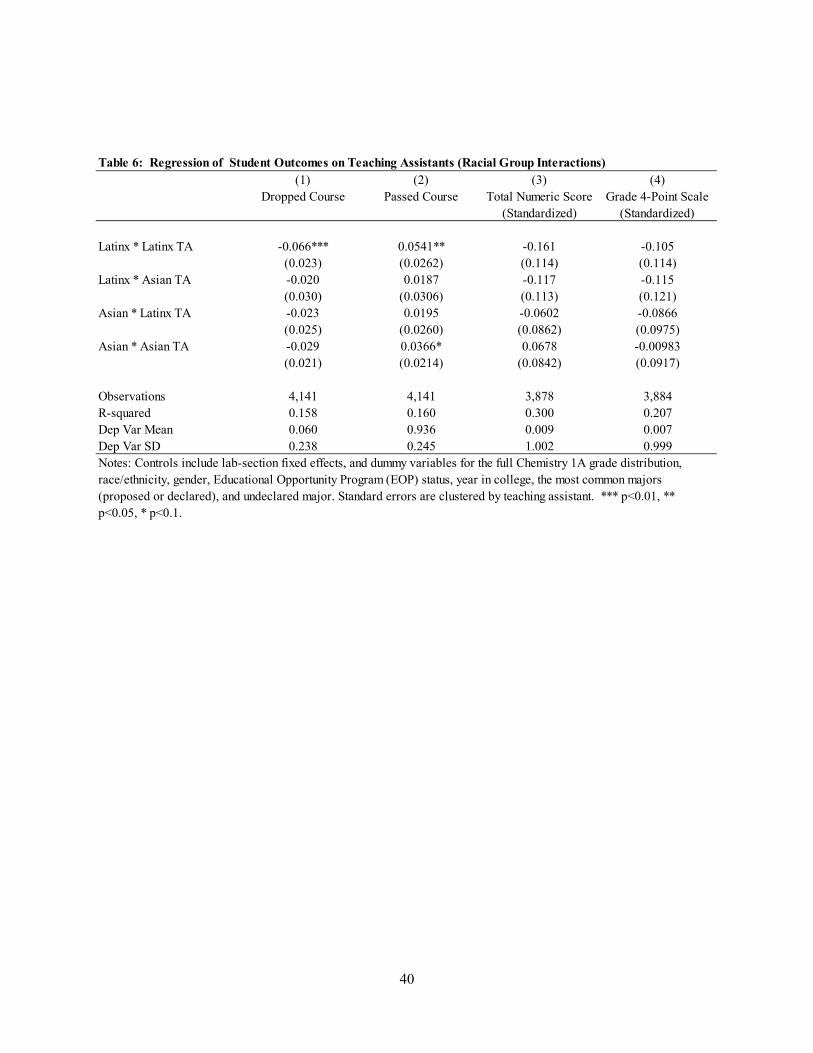
40
(1) (2) (3) (4)Dropped Course Passed Course Total Numeric Score
(Standardized)Grade 4-Point Scale
(Standardized)
Latinx * Latinx TA -0.066*** 0.0541** -0.161 -0.105(0.023) (0.0262) (0.114) (0.114)
Latinx * Asian TA -0.020 0.0187 -0.117 -0.115(0.030) (0.0306) (0.113) (0.121)
Asian * Latinx TA -0.023 0.0195 -0.0602 -0.0866(0.025) (0.0260) (0.0862) (0.0975)
Asian * Asian TA -0.029 0.0366* 0.0678 -0.00983(0.021) (0.0214) (0.0842) (0.0917)
Observations 4,141 4,141 3,878 3,884R-squared 0.158 0.160 0.300 0.207Dep Var Mean 0.060 0.936 0.009 0.007Dep Var SD 0.238 0.245 1.002 0.999Notes: Controls include lab-section fixed effects, and dummy variables for the full Chemistry 1A grade distribution, race/ethnicity, gender, Educational Opportunity Program (EOP) status, year in college, the most common majors (proposed or declared), and undeclared major. Standard errors are clustered by teaching assistant. *** p<0.01, ** p<0.05, * p<0.1.
Table 6: Regression of Student Outcomes on Teaching Assistants (Racial Group Interactions)
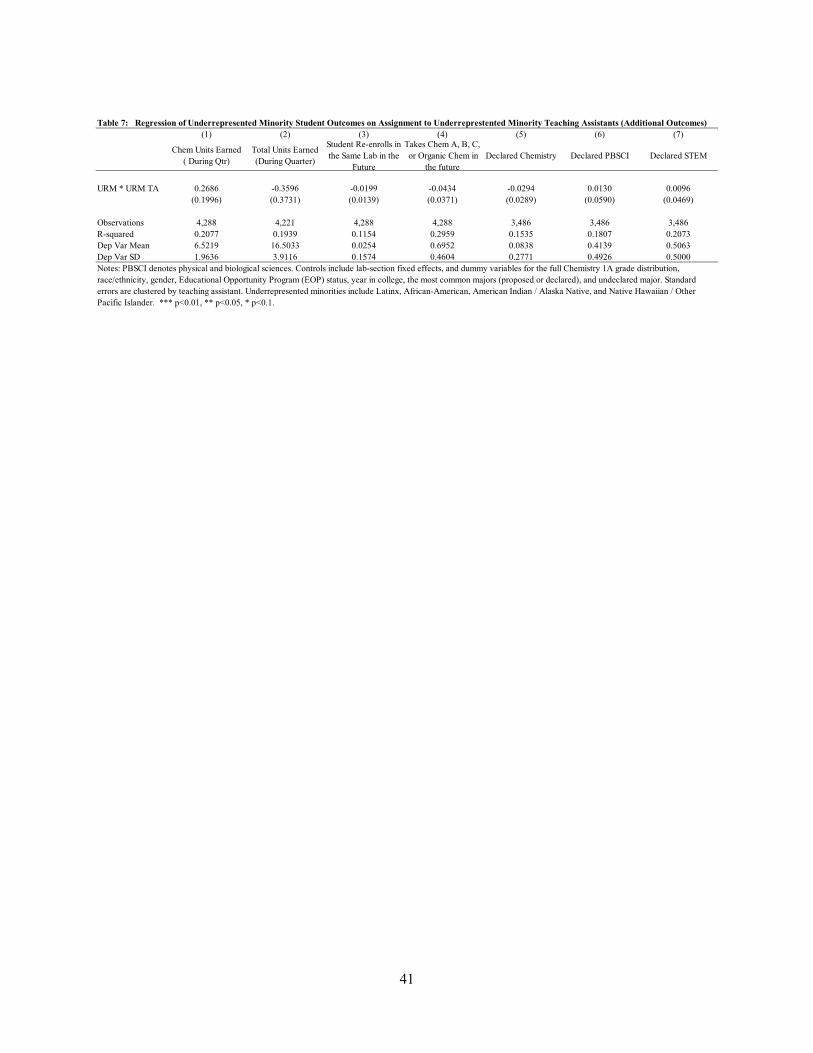
41
Table 7: Regression of Underrepresented Minority Student Outcomes on Assignment to Underreprestented Minority Teaching Assistants (Additional Outcomes)(1) (2) (3) (4) (5) (6) (7)
Chem Units Earned ( During Qtr)
Total Units Earned (During Quarter)
Student Re-enrolls in the Same Lab in the
Future
Takes Chem A, B, C, or Organic Chem in
the futureDeclared Chemistry Declared PBSCI Declared STEM
URM * URM TA 0.2686 -0.3596 -0.0199 -0.0434 -0.0294 0.0130 0.0096(0.1996) (0.3731) (0.0139) (0.0371) (0.0289) (0.0590) (0.0469)
Observations 4,288 4,221 4,288 4,288 3,486 3,486 3,486R-squared 0.2077 0.1939 0.1154 0.2959 0.1535 0.1807 0.2073Dep Var Mean 6.5219 16.5033 0.0254 0.6952 0.0838 0.4139 0.5063Dep Var SD 1.9636 3.9116 0.1574 0.4604 0.2771 0.4926 0.5000Notes: PBSCI denotes physical and biological sciences. Controls include lab-section fixed effects, and dummy variables for the full Chemistry 1A grade distribution, race/ethnicity, gender, Educational Opportunity Program (EOP) status, year in college, the most common majors (proposed or declared), and undeclared major. Standard errors are clustered by teaching assistant. Underrepresented minorities include Latinx, African-American, American Indian / Alaska Native, and Native Hawaiian / Other Pacific Islander. *** p<0.01, ** p<0.05, * p<0.1.
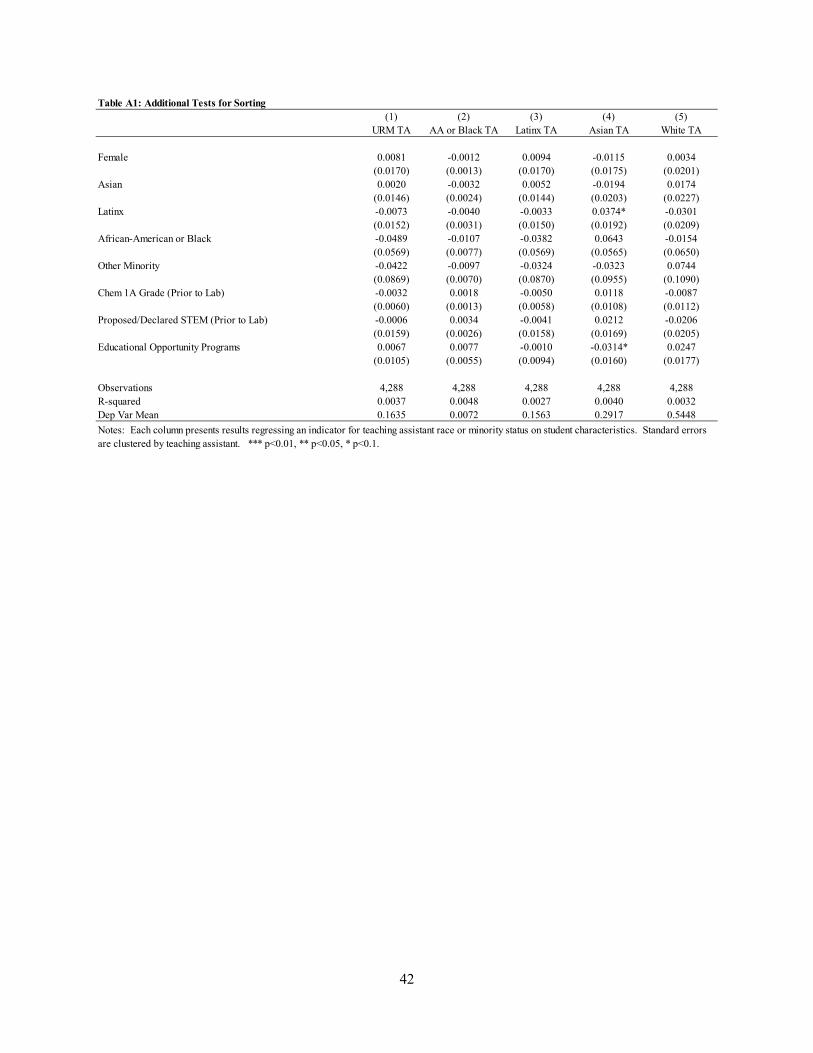
42
Table A1: Additional Tests for Sorting(1) (2) (3) (4) (5)
URM TA AA or Black TA Latinx TA Asian TA White TA
Female 0.0081 -0.0012 0.0094 -0.0115 0.0034(0.0170) (0.0013) (0.0170) (0.0175) (0.0201)
Asian 0.0020 -0.0032 0.0052 -0.0194 0.0174(0.0146) (0.0024) (0.0144) (0.0203) (0.0227)
Latinx -0.0073 -0.0040 -0.0033 0.0374* -0.0301(0.0152) (0.0031) (0.0150) (0.0192) (0.0209)
African-American or Black -0.0489 -0.0107 -0.0382 0.0643 -0.0154(0.0569) (0.0077) (0.0569) (0.0565) (0.0650)
Other Minority -0.0422 -0.0097 -0.0324 -0.0323 0.0744(0.0869) (0.0070) (0.0870) (0.0955) (0.1090)
Chem 1A Grade (Prior to Lab) -0.0032 0.0018 -0.0050 0.0118 -0.0087(0.0060) (0.0013) (0.0058) (0.0108) (0.0112)
Proposed/Declared STEM (Prior to Lab) -0.0006 0.0034 -0.0041 0.0212 -0.0206(0.0159) (0.0026) (0.0158) (0.0169) (0.0205)
Educational Opportunity Programs 0.0067 0.0077 -0.0010 -0.0314* 0.0247(0.0105) (0.0055) (0.0094) (0.0160) (0.0177)
Observations 4,288 4,288 4,288 4,288 4,288R-squared 0.0037 0.0048 0.0027 0.0040 0.0032Dep Var Mean 0.1635 0.0072 0.1563 0.2917 0.5448Notes: Each column presents results regressing an indicator for teaching assistant race or minority status on student characteristics. Standard errors are clustered by teaching assistant. *** p<0.01, ** p<0.05, * p<0.1.
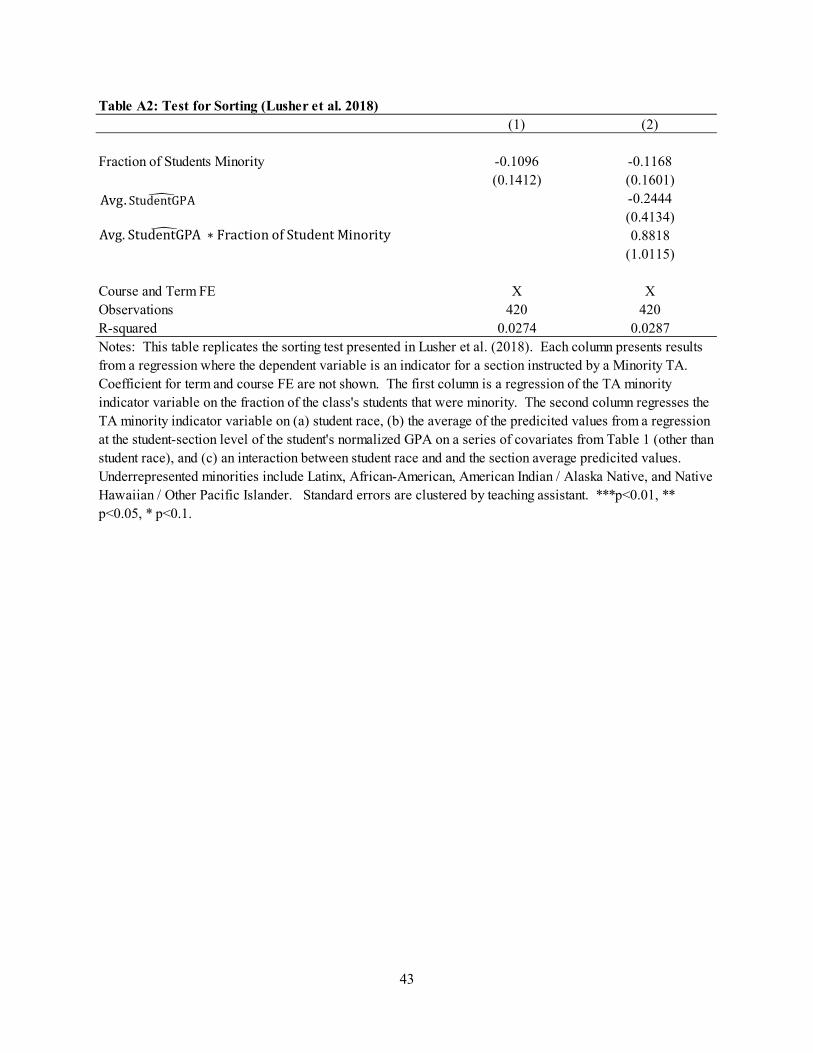
43
Table A2: Test for Sorting (Lusher et al. 2018)(1) (2)
Fraction of Students Minority -0.1096 -0.1168(0.1412) (0.1601)
-0.2444(0.4134)0.8818
(1.0115)
Course and Term FE X XObservations 420 420R-squared 0.0274 0.0287Notes: This table replicates the sorting test presented in Lusher et al. (2018). Each column presents results from a regression where the dependent variable is an indicator for a section instructed by a Minority TA. Coefficient for term and course FE are not shown. The first column is a regression of the TA minority indicator variable on the fraction of the class's students that were minority. The second column regresses the TA minority indicator variable on (a) student race, (b) the average of the predicited values from a regression at the student-section level of the student's normalized GPA on a series of covariates from Table 1 (other than student race), and (c) an interaction between student race and and the section average predicited values. Underrepresented minorities include Latinx, African-American, American Indian / Alaska Native, and Native Hawaiian / Other Pacific Islander. Standard errors are clustered by teaching assistant. ***p<0.01, ** p<0.05, * p<0.1.
Avg. StudentGPA�
Avg. StudentGPA� ∗ Fraction of Student Minority
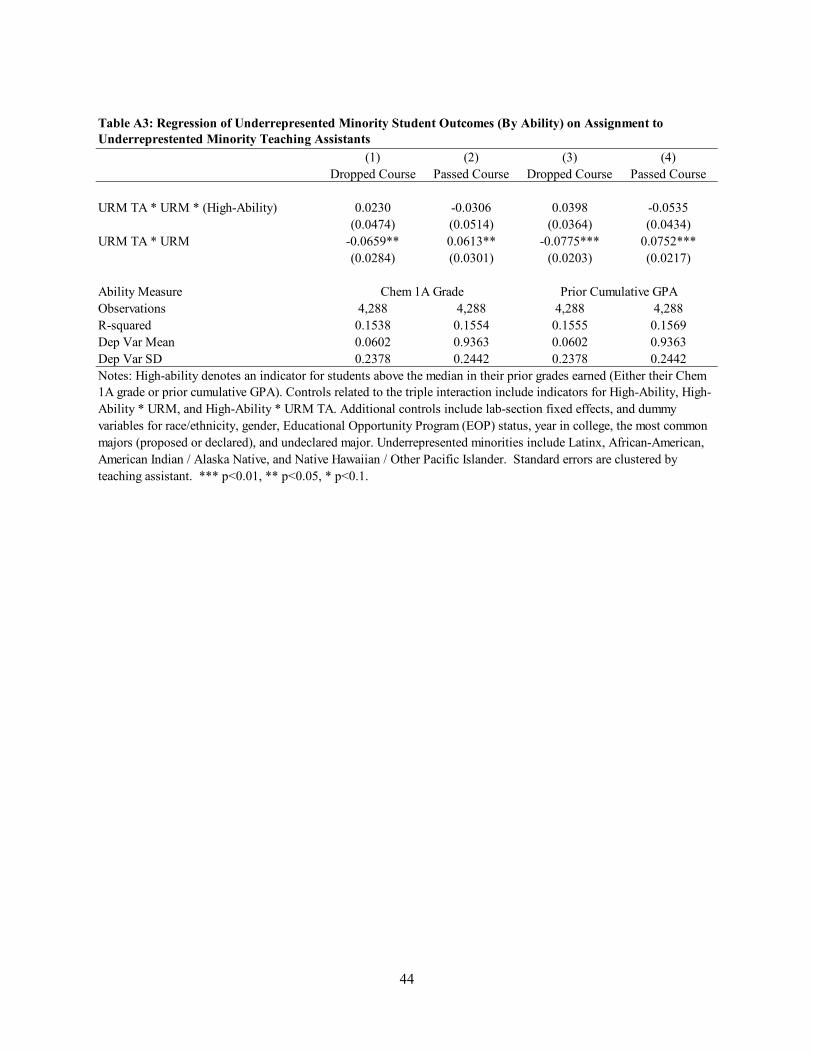
44
(1) (2) (3) (4)Dropped Course Passed Course Dropped Course Passed Course
URM TA * URM * (High-Ability) 0.0230 -0.0306 0.0398 -0.0535(0.0474) (0.0514) (0.0364) (0.0434)
URM TA * URM -0.0659** 0.0613** -0.0775*** 0.0752***(0.0284) (0.0301) (0.0203) (0.0217)
Ability MeasureObservations 4,288 4,288 4,288 4,288R-squared 0.1538 0.1554 0.1555 0.1569Dep Var Mean 0.0602 0.9363 0.0602 0.9363Dep Var SD 0.2378 0.2442 0.2378 0.2442
Table A3: Regression of Underrepresented Minority Student Outcomes (By Ability) on Assignment to Underreprestented Minority Teaching Assistants
Chem 1A Grade Prior Cumulative GPA
Notes: High-ability denotes an indicator for students above the median in their prior grades earned (Either their Chem 1A grade or prior cumulative GPA). Controls related to the triple interaction include indicators for High-Ability, High-Ability * URM, and High-Ability * URM TA. Additional controls include lab-section fixed effects, and dummy variables for race/ethnicity, gender, Educational Opportunity Program (EOP) status, year in college, the most common majors (proposed or declared), and undeclared major. Underrepresented minorities include Latinx, African-American, American Indian / Alaska Native, and Native Hawaiian / Other Pacific Islander. Standard errors are clustered by teaching assistant. *** p<0.01, ** p<0.05, * p<0.1.
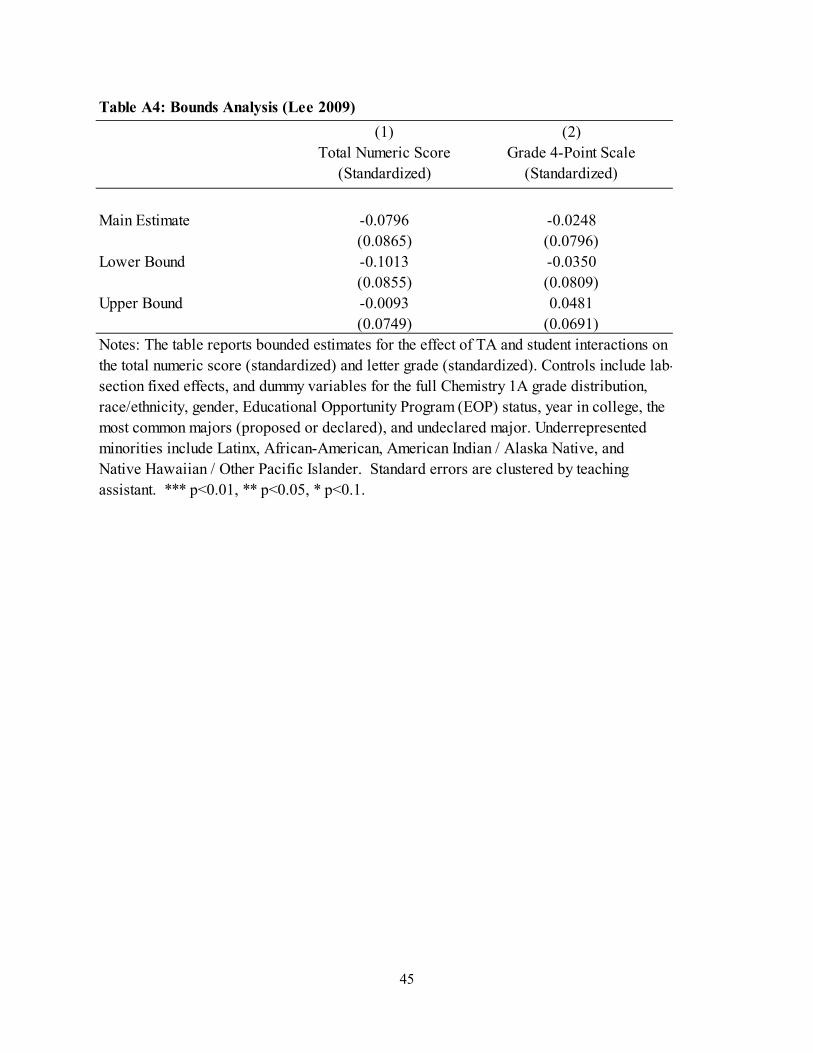
45
(1) (2)Total Numeric Score
(Standardized)Grade 4-Point Scale
(Standardized)
Main Estimate -0.0796 -0.0248(0.0865) (0.0796)
Lower Bound -0.1013 -0.0350(0.0855) (0.0809)
Upper Bound -0.0093 0.0481(0.0749) (0.0691)
Table A4: Bounds Analysis (Lee 2009)
Notes: The table reports bounded estimates for the effect of TA and student interactions on the total numeric score (standardized) and letter grade (standardized). Controls include lab-section fixed effects, and dummy variables for the full Chemistry 1A grade distribution, race/ethnicity, gender, Educational Opportunity Program (EOP) status, year in college, the most common majors (proposed or declared), and undeclared major. Underrepresented minorities include Latinx, African-American, American Indian / Alaska Native, and Native Hawaiian / Other Pacific Islander. Standard errors are clustered by teaching assistant. *** p<0.01, ** p<0.05, * p<0.1.
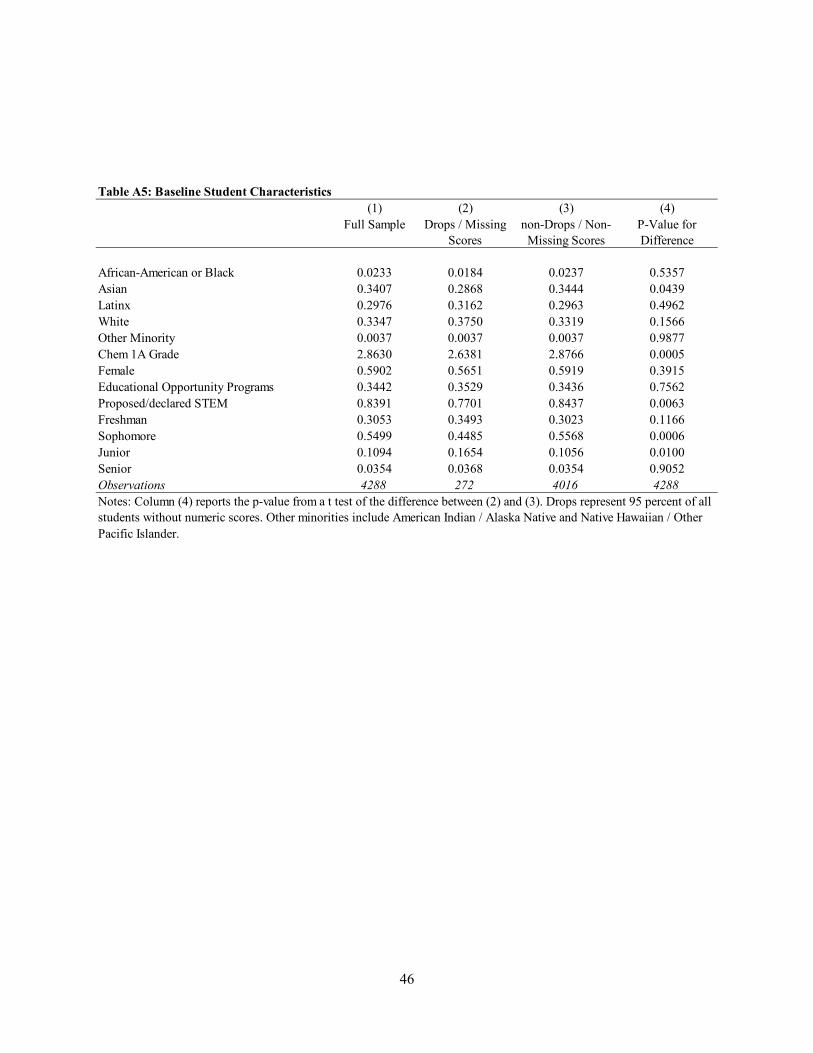
46
Table A5: Baseline Student Characteristics(1) (2) (3) (4)
Full Sample Drops / Missing Scores
non-Drops / Non-Missing Scores
P-Value for Difference
African-American or Black 0.0233 0.0184 0.0237 0.5357Asian 0.3407 0.2868 0.3444 0.0439Latinx 0.2976 0.3162 0.2963 0.4962White 0.3347 0.3750 0.3319 0.1566Other Minority 0.0037 0.0037 0.0037 0.9877Chem 1A Grade 2.8630 2.6381 2.8766 0.0005Female 0.5902 0.5651 0.5919 0.3915Educational Opportunity Programs 0.3442 0.3529 0.3436 0.7562Proposed/declared STEM 0.8391 0.7701 0.8437 0.0063Freshman 0.3053 0.3493 0.3023 0.1166Sophomore 0.5499 0.4485 0.5568 0.0006Junior 0.1094 0.1654 0.1056 0.0100Senior 0.0354 0.0368 0.0354 0.9052Observations 4288 272 4016 4288Notes: Column (4) reports the p-value from a t test of the difference between (2) and (3). Drops represent 95 percent of all students without numeric scores. Other minorities include American Indian / Alaska Native and Native Hawaiian / Other Pacific Islander.
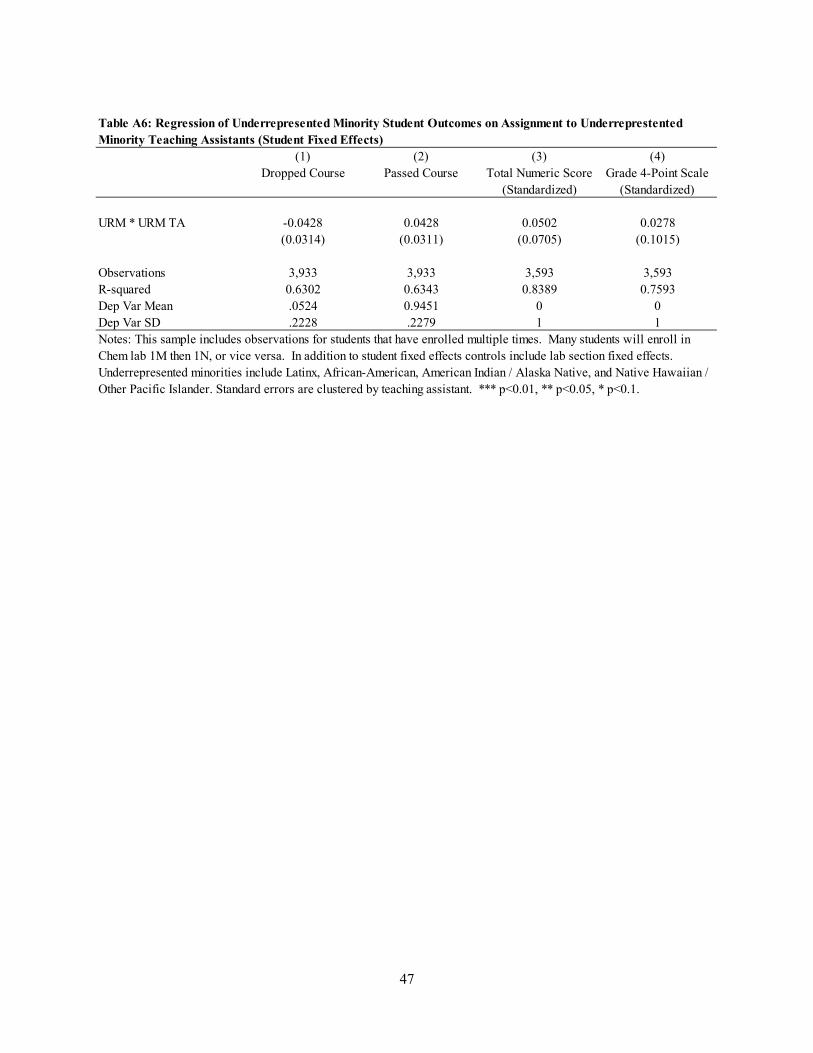
47
(1) (2) (3) (4)Dropped Course Passed Course Total Numeric Score
(Standardized)Grade 4-Point Scale
(Standardized)
URM * URM TA -0.0428 0.0428 0.0502 0.0278(0.0314) (0.0311) (0.0705) (0.1015)
Observations 3,933 3,933 3,593 3,593R-squared 0.6302 0.6343 0.8389 0.7593Dep Var Mean .0524 0.9451 0 0Dep Var SD .2228 .2279 1 1Notes: This sample includes observations for students that have enrolled multiple times. Many students will enroll in Chem lab 1M then 1N, or vice versa. In addition to student fixed effects controls include lab section fixed effects. Underrepresented minorities include Latinx, African-American, American Indian / Alaska Native, and Native Hawaiian / Other Pacific Islander. Standard errors are clustered by teaching assistant. *** p<0.01, ** p<0.05, * p<0.1.
Table A6: Regression of Underrepresented Minority Student Outcomes on Assignment to Underreprestented Minority Teaching Assistants (Student Fixed Effects)
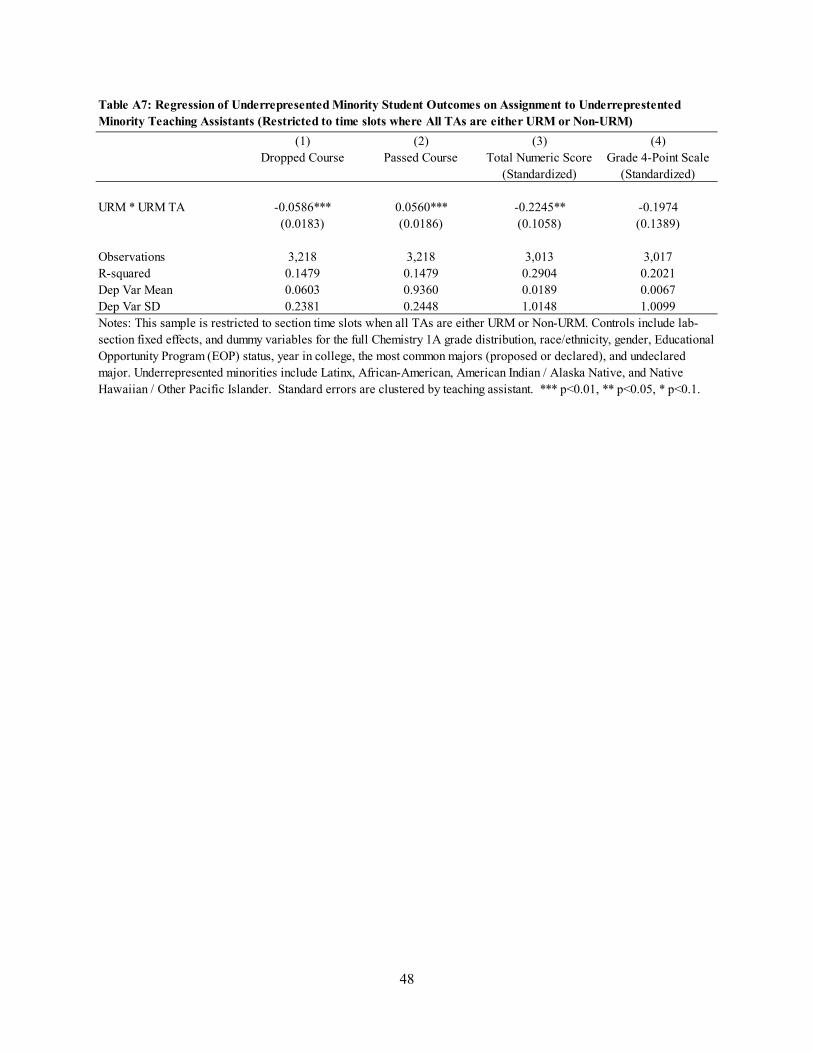
48
(1) (2) (3) (4)Dropped Course Passed Course Total Numeric Score
(Standardized)Grade 4-Point Scale
(Standardized)
URM * URM TA -0.0586*** 0.0560*** -0.2245** -0.1974(0.0183) (0.0186) (0.1058) (0.1389)
Observations 3,218 3,218 3,013 3,017R-squared 0.1479 0.1479 0.2904 0.2021Dep Var Mean 0.0603 0.9360 0.0189 0.0067Dep Var SD 0.2381 0.2448 1.0148 1.0099Notes: This sample is restricted to section time slots when all TAs are either URM or Non-URM. Controls include lab-section fixed effects, and dummy variables for the full Chemistry 1A grade distribution, race/ethnicity, gender, Educational Opportunity Program (EOP) status, year in college, the most common majors (proposed or declared), and undeclared major. Underrepresented minorities include Latinx, African-American, American Indian / Alaska Native, and Native Hawaiian / Other Pacific Islander. Standard errors are clustered by teaching assistant. *** p<0.01, ** p<0.05, * p<0.1.
Table A7: Regression of Underrepresented Minority Student Outcomes on Assignment to Underreprestented Minority Teaching Assistants (Restricted to time slots where All TAs are either URM or Non-URM)
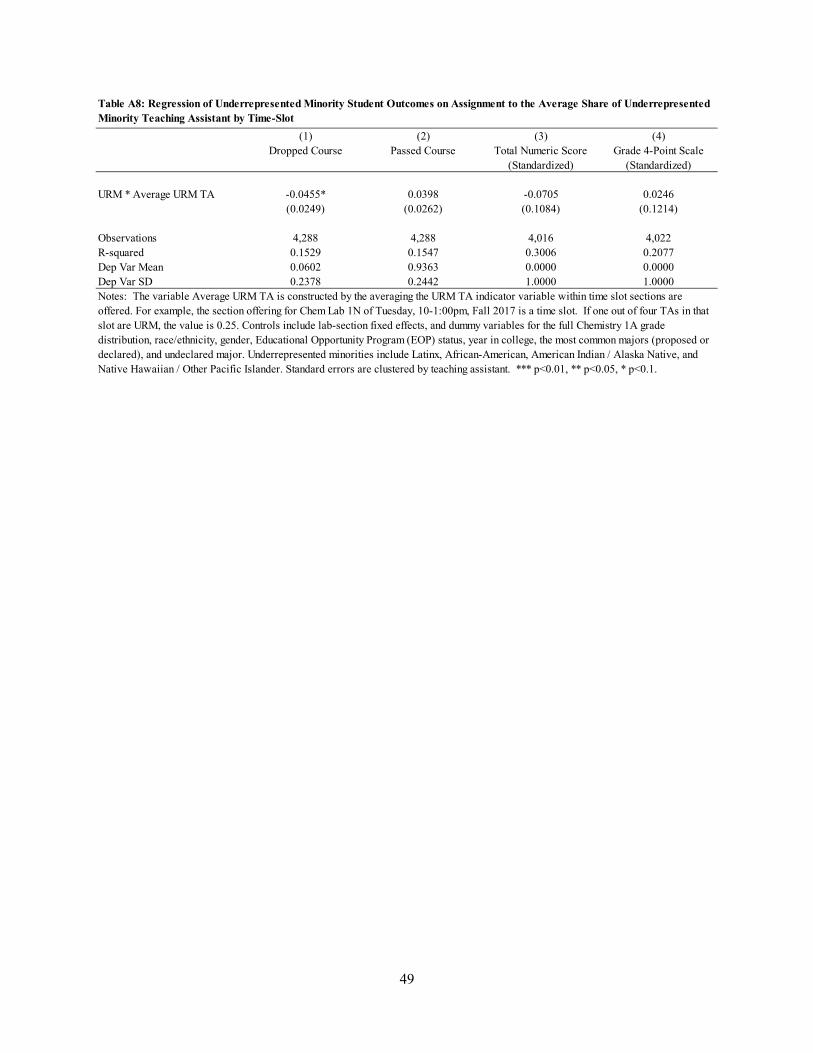
49
(1) (2) (3) (4)Dropped Course Passed Course Total Numeric Score
(Standardized)Grade 4-Point Scale
(Standardized)
URM * Average URM TA -0.0455* 0.0398 -0.0705 0.0246(0.0249) (0.0262) (0.1084) (0.1214)
Observations 4,288 4,288 4,016 4,022R-squared 0.1529 0.1547 0.3006 0.2077Dep Var Mean 0.0602 0.9363 0.0000 0.0000Dep Var SD 0.2378 0.2442 1.0000 1.0000Notes: The variable Average URM TA is constructed by the averaging the URM TA indicator variable within time slot sections are offered. For example, the section offering for Chem Lab 1N of Tuesday, 10-1:00pm, Fall 2017 is a time slot. If one out of four TAs in that slot are URM, the value is 0.25. Controls include lab-section fixed effects, and dummy variables for the full Chemistry 1A grade distribution, race/ethnicity, gender, Educational Opportunity Program (EOP) status, year in college, the most common majors (proposed or declared), and undeclared major. Underrepresented minorities include Latinx, African-American, American Indian / Alaska Native, and Native Hawaiian / Other Pacific Islander. Standard errors are clustered by teaching assistant. *** p<0.01, ** p<0.05, * p<0.1.
Table A8: Regression of Underrepresented Minority Student Outcomes on Assignment to the Average Share of Underrepresented Minority Teaching Assistant by Time-Slot