Embed Size (px)
Citation preview
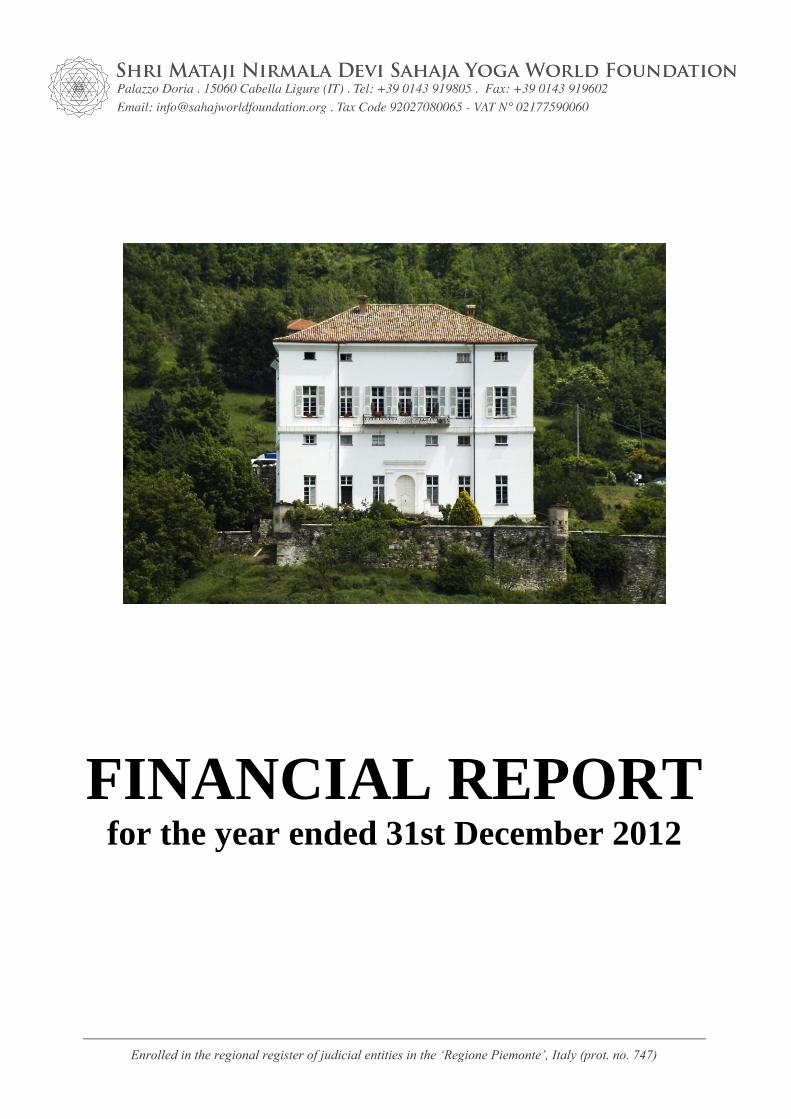
Enrolled in the regional register of judicial entities in the ‘Regione Piemonte’, Italy (prot. no. 747)
FINANCIAL REPORT for the year ended 31st December 2012
CONTENTS
Balance Sheet .......................................................................................................... 1
Income & Charges Report ....................................................................................... 3
Income & Charges Report by activity ..................................................................... 5
Cash Flow Statement ............................................................................................... 7
Accompanying Notes .............................................................................................. 8
Auditors’ Report ................................................................................................... 16
Appendix I – Expense Details
Appendix II – Income Details
Appendix III – Tax Calculation
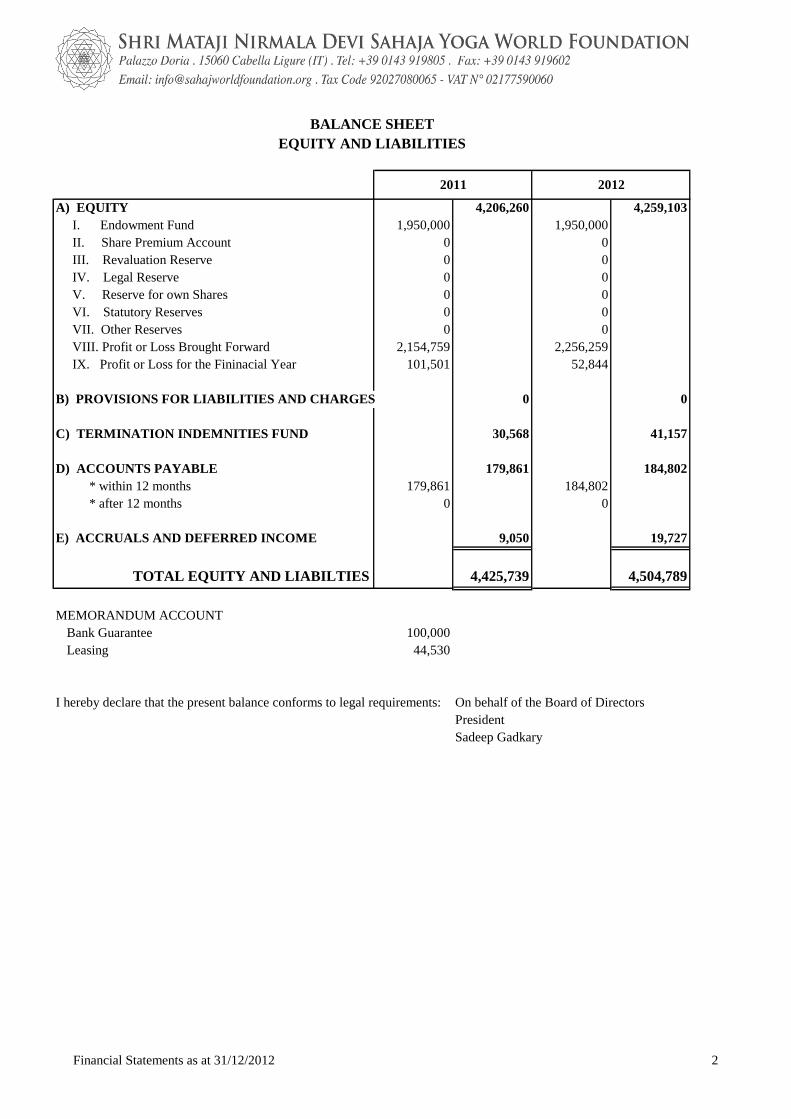
A) EQUITY 4,206,260 4,259,103
I. Endowment Fund 1,950,000 1,950,000
II. Share Premium Account 0 0
III. Revaluation Reserve 0 0
IV. Legal Reserve 0 0
V. Reserve for own Shares 0 0
VI. Statutory Reserves 0 0
VII. Other Reserves 0 0
VIII. Profit or Loss Brought Forward 2,154,759 2,256,259
IX. Profit or Loss for the Fininacial Year 101,501 52,844
B) PROVISIONS FOR LIABILITIES AND CHARGES 0 0
C) TERMINATION INDEMNITIES FUND 30,568 41,157
D) ACCOUNTS PAYABLE 179,861 184,802
* within 12 months 179,861 184,802
* after 12 months 0 0
E) ACCRUALS AND DEFERRED INCOME 9,050 19,727
TOTAL EQUITY AND LIABILTIES 4,425,739 4,504,789
MEMORANDUM ACCOUNT
Bank Guarantee 100,000
Leasing 44,530
I hereby declare that the present balance conforms to legal requirements: On behalf of the Board of Directors
President
Sadeep Gadkary
2011 2012
EQUITY AND LIABILITIES
BALANCE SHEET
Financial Statements as at 31/12/2012 2
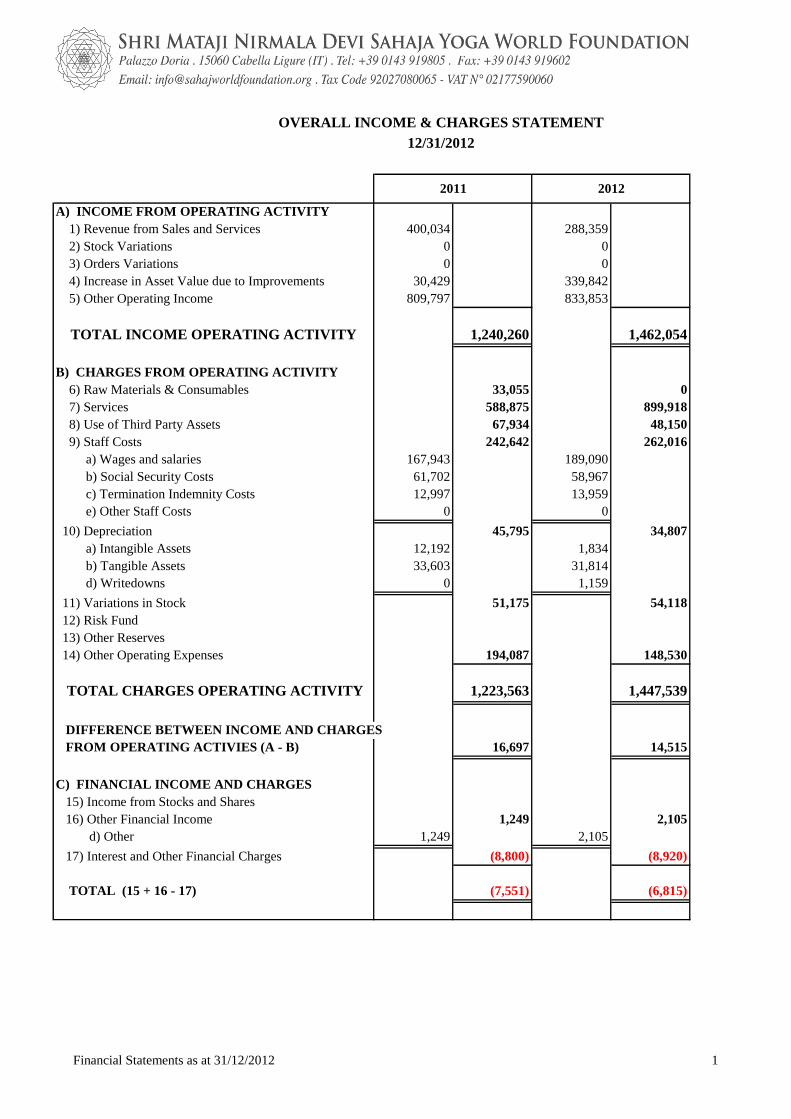
A) INCOME FROM OPERATING ACTIVITY
1) Revenue from Sales and Services 400,034 288,359
2) Stock Variations 0 0
3) Orders Variations 0 0
4) Increase in Asset Value due to Improvements 30,429 339,842
5) Other Operating Income 809,797 833,853
TOTAL INCOME OPERATING ACTIVITY 1,240,260 1,462,054
B) CHARGES FROM OPERATING ACTIVITY
6) Raw Materials & Consumables 33,055 0
7) Services 588,875 899,918
8) Use of Third Party Assets 67,934 48,150
9) Staff Costs 242,642 262,016
a) Wages and salaries 167,943 189,090
b) Social Security Costs 61,702 58,967
c) Termination Indemnity Costs 12,997 13,959
e) Other Staff Costs 0 0
10) Depreciation 45,795 34,807
a) Intangible Assets 12,192 1,834
b) Tangible Assets 33,603 31,814
d) Writedowns 0 1,159
11) Variations in Stock 51,175 54,118
12) Risk Fund
13) Other Reserves
14) Other Operating Expenses 194,087 148,530
TOTAL CHARGES OPERATING ACTIVITY 1,223,563 1,447,539
DIFFERENCE BETWEEN INCOME AND CHARGES
FROM OPERATING ACTIVIES (A - B) 16,697 14,515
C) FINANCIAL INCOME AND CHARGES
15) Income from Stocks and Shares
16) Other Financial Income 1,249 2,105
d) Other 1,249 2,105
17) Interest and Other Financial Charges (8,800) (8,920)
TOTAL (15 + 16 - 17) (7,551) (6,815)
2011 2012
OVERALL INCOME & CHARGES STATEMENT
12/31/2012
Financial Statements as at 31/12/2012 1
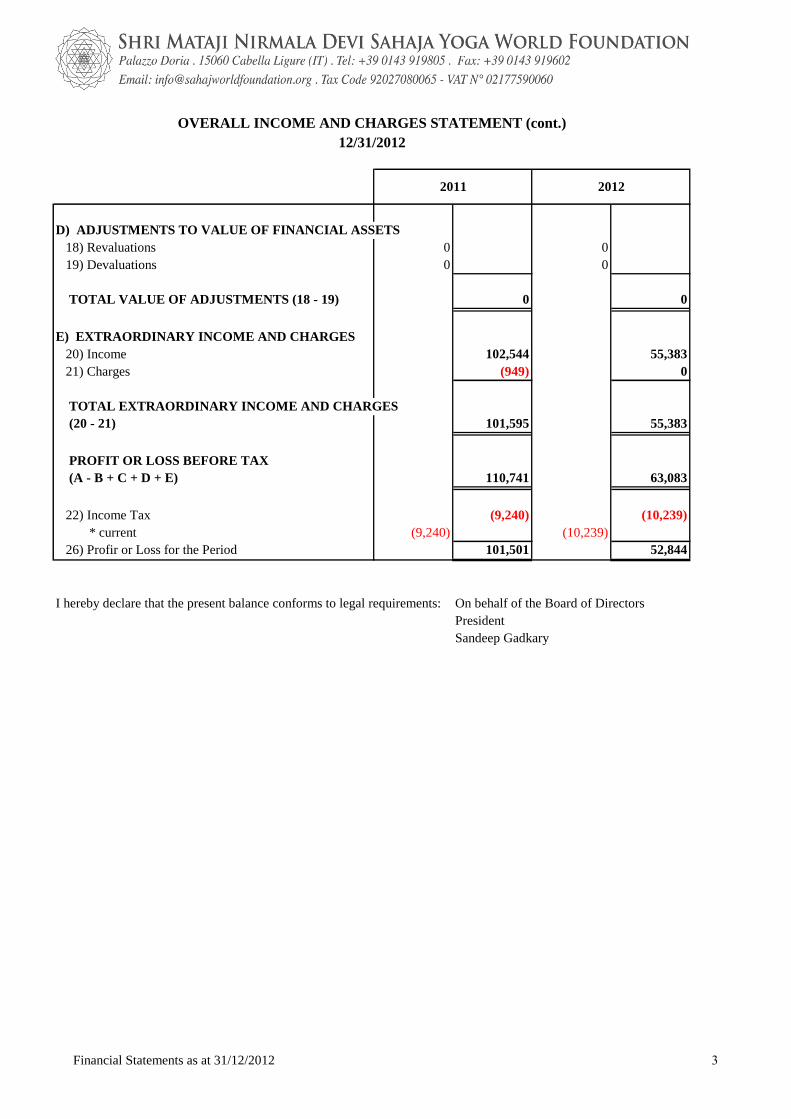
D) ADJUSTMENTS TO VALUE OF FINANCIAL ASSETS
18) Revaluations 0 0
19) Devaluations 0 0
TOTAL VALUE OF ADJUSTMENTS (18 - 19) 0 0
E) EXTRAORDINARY INCOME AND CHARGES
20) Income 102,544 55,383
21) Charges (949) 0
TOTAL EXTRAORDINARY INCOME AND CHARGES
(20 - 21) 101,595 55,383
PROFIT OR LOSS BEFORE TAX
(A - B + C + D + E) 110,741 63,083
22) Income Tax (9,240) (10,239)
* current (9,240) (10,239)
26) Profir or Loss for the Period 101,501 52,844
I hereby declare that the present balance conforms to legal requirements: On behalf of the Board of Directors
President
Sandeep Gadkary
OVERALL INCOME AND CHARGES STATEMENT (cont.)
20122011
12/31/2012
Financial Statements as at 31/12/2012 3
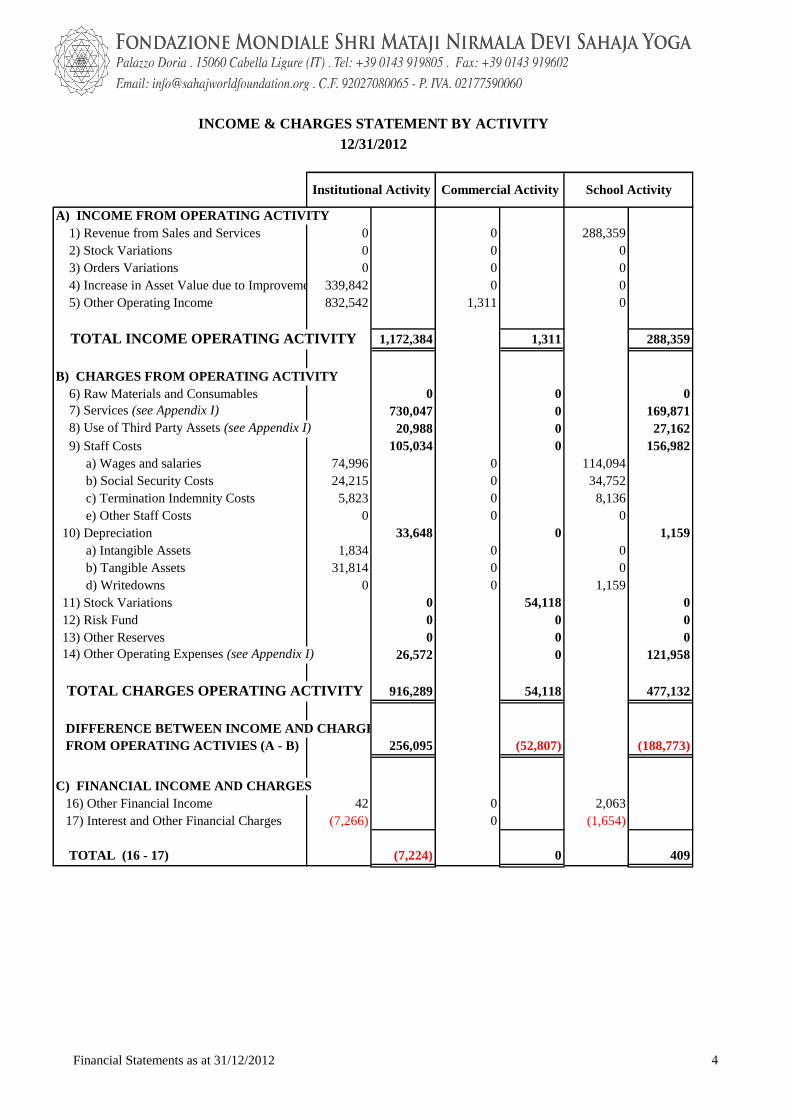
A) INCOME FROM OPERATING ACTIVITY
1) Revenue from Sales and Services 0 0 288,359
2) Stock Variations 0 0 0
3) Orders Variations 0 0 0
4) Increase in Asset Value due to Improvements339,842 0 0
5) Other Operating Income 832,542 1,311 0
TOTAL INCOME OPERATING ACTIVITY 1,172,384 1,311 288,359
B) CHARGES FROM OPERATING ACTIVITY
6) Raw Materials and Consumables 0 0 0
7) Services (see Appendix I) 730,047 0 169,871
8) Use of Third Party Assets (see Appendix I) 20,988 0 27,162
9) Staff Costs 105,034 0 156,982
a) Wages and salaries 74,996 0 114,094
b) Social Security Costs 24,215 0 34,752
c) Termination Indemnity Costs 5,823 0 8,136
e) Other Staff Costs 0 0 0
10) Depreciation 33,648 0 1,159
a) Intangible Assets 1,834 0 0
b) Tangible Assets 31,814 0 0
d) Writedowns 0 0 1,159
11) Stock Variations 0 54,118 0
12) Risk Fund 0 0 0
13) Other Reserves 0 0 0
14) Other Operating Expenses (see Appendix I) 26,572 0 121,958
TOTAL CHARGES OPERATING ACTIVITY 916,289 54,118 477,132
DIFFERENCE BETWEEN INCOME AND CHARGES
FROM OPERATING ACTIVIES (A - B) 256,095 (52,807) (188,773)
C) FINANCIAL INCOME AND CHARGES
16) Other Financial Income 42 0 2,063
17) Interest and Other Financial Charges (7,266) 0 (1,654)
TOTAL (16 - 17) (7,224) 0 409
INCOME & CHARGES STATEMENT BY ACTIVITY
12/31/2012
Institutional Activity Commercial Activity School Activity
Financial Statements as at 31/12/2012 4
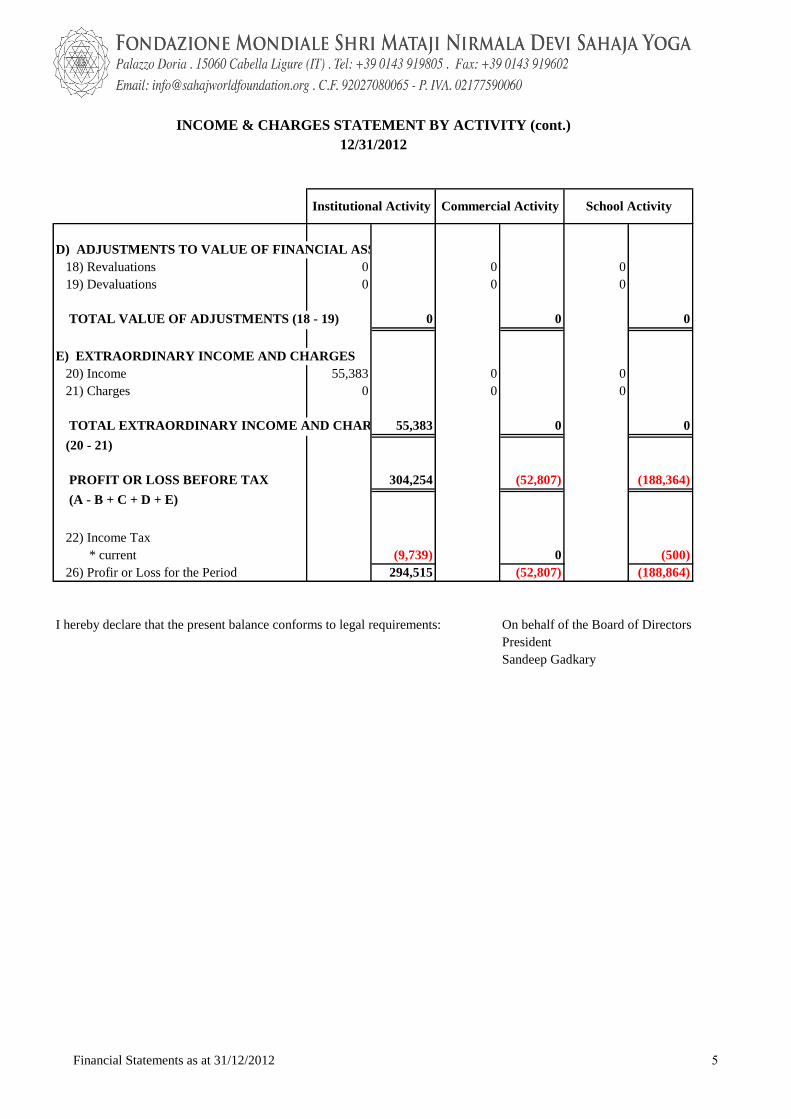
D) ADJUSTMENTS TO VALUE OF FINANCIAL ASSETS
18) Revaluations 0 0 0
19) Devaluations 0 0 0
TOTAL VALUE OF ADJUSTMENTS (18 - 19) 0 0 0
E) EXTRAORDINARY INCOME AND CHARGES
20) Income 55,383 0 0
21) Charges 0 0 0
TOTAL EXTRAORDINARY INCOME AND CHARGES55,383 0 0
(20 - 21)
PROFIT OR LOSS BEFORE TAX 304,254 (52,807) (188,364)
(A - B + C + D + E)
22) Income Tax
* current (9,739) 0 (500)
26) Profir or Loss for the Period 294,515 (52,807) (188,864)
I hereby declare that the present balance conforms to legal requirements: On behalf of the Board of Directors
President
Sandeep Gadkary
12/31/2012
Institutional Activity Commercial Activity School Activity
INCOME & CHARGES STATEMENT BY ACTIVITY (cont.)
Financial Statements as at 31/12/2012 5
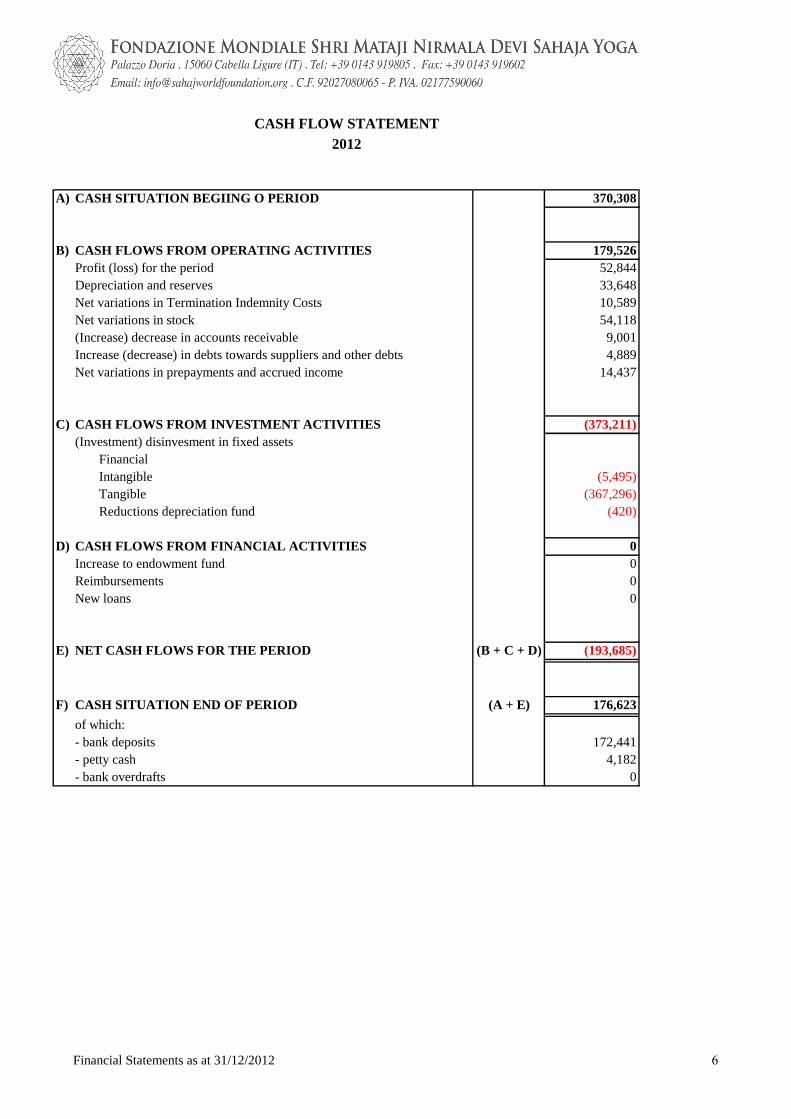
A) CASH SITUATION BEGIING O PERIOD 370,308
B) CASH FLOWS FROM OPERATING ACTIVITIES 179,526
Profit (loss) for the period 52,844
Depreciation and reserves 33,648
Net variations in Termination Indemnity Costs 10,589
Net variations in stock 54,118
(Increase) decrease in accounts receivable 9,001
Increase (decrease) in debts towards suppliers and other debts 4,889
Net variations in prepayments and accrued income 14,437
C) CASH FLOWS FROM INVESTMENT ACTIVITIES (373,211)
(Investment) disinvesment in fixed assets
Financial
Intangible (5,495)
Tangible (367,296)
Reductions depreciation fund (420)
D) CASH FLOWS FROM FINANCIAL ACTIVITIES 0
Increase to endowment fund 0
Reimbursements 0
New loans 0
E) NET CASH FLOWS FOR THE PERIOD (B + C + D) (193,685)
F) CASH SITUATION END OF PERIOD (A + E) 176,623
of which:
- bank deposits 172,441
- petty cash 4,182
- bank overdrafts 0
CASH FLOW STATEMENT
2012
Financial Statements as at 31/12/2012 6
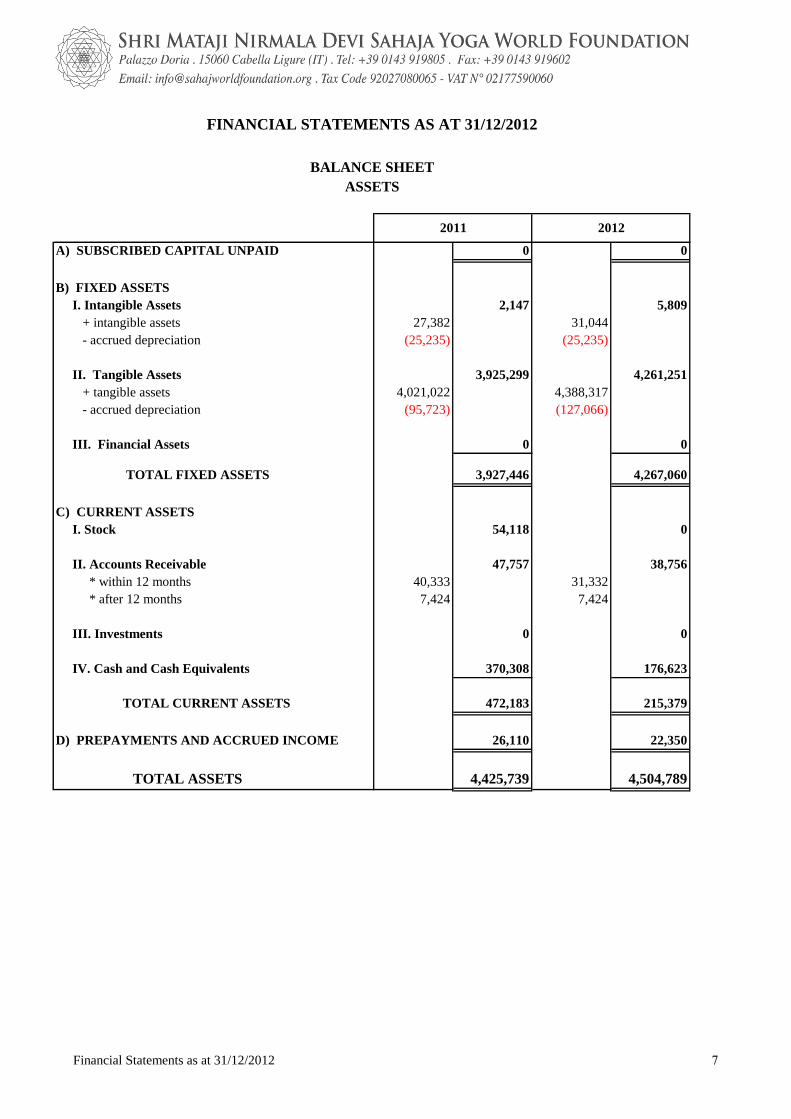
A) SUBSCRIBED CAPITAL UNPAID 0 0
B) FIXED ASSETS
I. Intangible Assets 2,147 5,809
+ intangible assets 27,382 31,044
- accrued depreciation (25,235) (25,235)
II. Tangible Assets 3,925,299 4,261,251
+ tangible assets 4,021,022 4,388,317
- accrued depreciation (95,723) (127,066)
III. Financial Assets 0 0
TOTAL FIXED ASSETS 3,927,446 4,267,060
C) CURRENT ASSETS
I. Stock 54,118 0
II. Accounts Receivable 47,757 38,756
* within 12 months 40,333 31,332
* after 12 months 7,424 7,424
III. Investments 0 0
IV. Cash and Cash Equivalents 370,308 176,623
TOTAL CURRENT ASSETS 472,183 215,379
D) PREPAYMENTS AND ACCRUED INCOME 26,110 22,350
TOTAL ASSETS 4,425,739 4,504,789
FINANCIAL STATEMENTS AS AT 31/12/2012
BALANCE SHEET
ASSETS
2011 2012
Financial Statements as at 31/12/2012 7
Accompanying Notes to the Financial Statements as at 31/12/2012 8
ACOMAPNYING NOTES TO THE FINANCIAL STATEMENTS
for the year ended 31/12/2012
1. STRUCTURE AND CONTENT
The Foundation’s Financial Statements have been drawn up based on criteria established by the
Accountants Commission for non-profit organizations.
The Financial Statements for the year ended December 31, 2012 comprise the Balance Sheet, the
Income and Charges Report, the Income and Charges Report for the Commercial Activity, the
Notes, the Cash Flow Statement and Auditors’ Report.
Where possible, the Financial Statements for 2012 have been set alongside those of 2011 so as to
assist comparison between the figures and to highlight variations.
The Foundation is a non-profit organization with the following object: “perpetuating, documenting
and spreading all over the world, the knowledge of the teachings of Mrs. Shrivastava Chandrika
Prasad Nirmala, and of supporting, all over the world, the practice of meditation founded by Her,
known as Sahaja Yoga”.
In 2012 Board of Directors reaffirmed its commitment to perpetuate the mission of the Foundation
and to implement the guidelines provided by Shri Mataji in the years following the establishment of
the Foundation.
In particular they reconfirmed the decision to use the Foundation’s properties in the Val Borbera as
a World Centre of experimentation and study of the teachings of Shri Mataji, a place of
international convergence and exchange linked to cultural initiatives inspired by Sahaja Yoga, the
meditation discovered by Shri Mataji and practiced throughout the world. On this basis, as in
previous years, in 2012 over 10 separate seminars end events were organized on the properties of
the Foundation in Cabella Ligure, Albera Ligure and Carrega Ligure, attracting around 10,000
people from all over the globe. The economic impact and substance of these events are reflected in
the financial statements.
Also reconfirmed is the decision to develop in the Val Borbera a centre of excellence in education,
a project that was launched by the founder herself. The home schooling project in Cabella is the
first project of this sort. Established in 2008, it has slowly grown over the years, with enrolments
for 2013 predicted at around 100 pupils. In 2012 major improvements were made to the
infrastructure of the school, which will be completed in 2013.
Also reconfirmed was the commitment to offer financial support for the digitalization and long-term
preservation of the recordings of about 3,000 lectures and presentations conducted by H.H. Shri
Mataji Nirmala Devi, executed by a specialist Austrian company, Devi Productions.
The Foundation keeps separate accounts for any commercial activity it is involved in, recording
VAT and preparing sectional income and charges statements, as required by Italian law.
1.1 Evaluation Criteria
The key evaluation criteria used in drawing up the financial report remain substantially unchanged
from last financial year and, in observance of art. 2426 c.c., are as follows:
Intangible Fixed Assets
These are recorded at the original cost of purchase or production, including subsidiary costs, and
systematically depreciated over the period of their predicted useful lifetime.
Accompanying Notes to the Financial Statements as at 31/12/2012 9
Tangible Fixed Assets
Tangible assets are classified into categories and recorded at their purchase price or cost of
production and have been depreciated based on the economic opportunities they still offer.
Valued net of accrued depreciation, they are systematically depreciated every financial year based
on established rates, as recorded below.
For assets acquired in the current financial year, the rate of depreciation is reduced by 50%, taking
into account the average, useful lifetime of the property.
Maintenance costs, being an ordinary expense, are recorded in their entirety in the Income and
Charges Report.
Stock
Unsold stock is recorded at the average cost purchase over the financial year.
Accounts Receivable
Accounts receivable are recorded at their presumed conversion value.
Investments which do not involve fixed assets
Investments are valued at the purchase or subscription cost, duly reduced in the case of a downturn
in share value.
Cash and Cash Equivalents
These are recorded at their nominal value.
Prepayments and Accrued Income
Income and charges common to two or more financial years are recorded in this category so as to
respect the principles of accrual based accounting. The division of the amounts is calculated based
on the concept of time of realisation.
Termination Indemnity Fund
The termination indemnity fund is set aside to cover the debt owed to employees in conformity with
Italian law and national collective labour contracts.
Accounts Payable
Accounts payable are recorded at their nominal value.
Taxes
Income tax is set aside so as to comply with Italian law, taking into account any applicable
exemptions.
Accompanying Notes to the Financial Statements as at 31/12/2012 10
1.2 Other Information
Income and charges have been calculated according to the principles of accrual based accounting,
such that the effects of transactions and other events are recognised when they occur, and not when
cash or cash equivalents are received or paid. They are recorded in the accounting records and
reported in the Financial Statements of the periods to which they relate.
The criteria used to establish values are based on the principle of neutrality and remain unvaried
with respect to the preceding financial year.
Currency
Unless otherwise indicated, the figures reported in the financial statements (Balance Sheet, Income
& Charges Report and Notes) are expressed in Euros, rounded off to the nearest whole number.
2. NOTES ON BALANCE SHEET ITEMS UNDER ‘ASSETS’
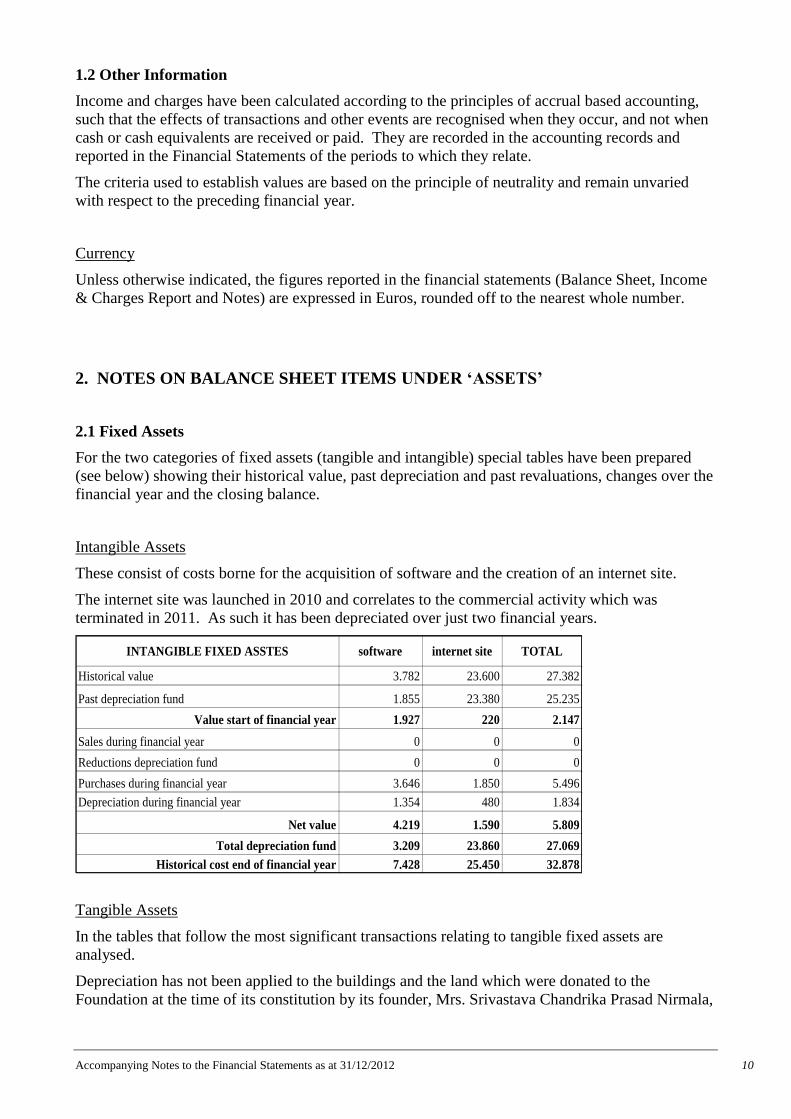
2.1 Fixed Assets
For the two categories of fixed assets (tangible and intangible) special tables have been prepared
(see below) showing their historical value, past depreciation and past revaluations, changes over the
financial year and the closing balance.
Intangible Assets
These consist of costs borne for the acquisition of software and the creation of an internet site.
The internet site was launched in 2010 and correlates to the commercial activity which was
terminated in 2011. As such it has been depreciated over just two financial years.
INTANGIBLE FIXED ASSTES software internet site TOTAL
Historical value 3.782 23.600 27.382
Past depreciation fund 1.855 23.380 25.235
Value start of financial year 1.927 220 2.147
Sales during financial year 0 0 0
Reductions depreciation fund 0 0 0
Purchases during financial year 3.646 1.850 5.496
Depreciation during financial year 1.354 480 1.834
Net value 4.219 1.590 5.809
Total depreciation fund 3.209 23.860 27.069
Historical cost end of financial year 7.428 25.450 32.878
Tangible Assets
In the tables that follow the most significant transactions relating to tangible fixed assets are
analysed.
Depreciation has not been applied to the buildings and the land which were donated to the
Foundation at the time of its constitution by its founder, Mrs. Srivastava Chandrika Prasad Nirmala,
Accompanying Notes to the Financial Statements as at 31/12/2012 11
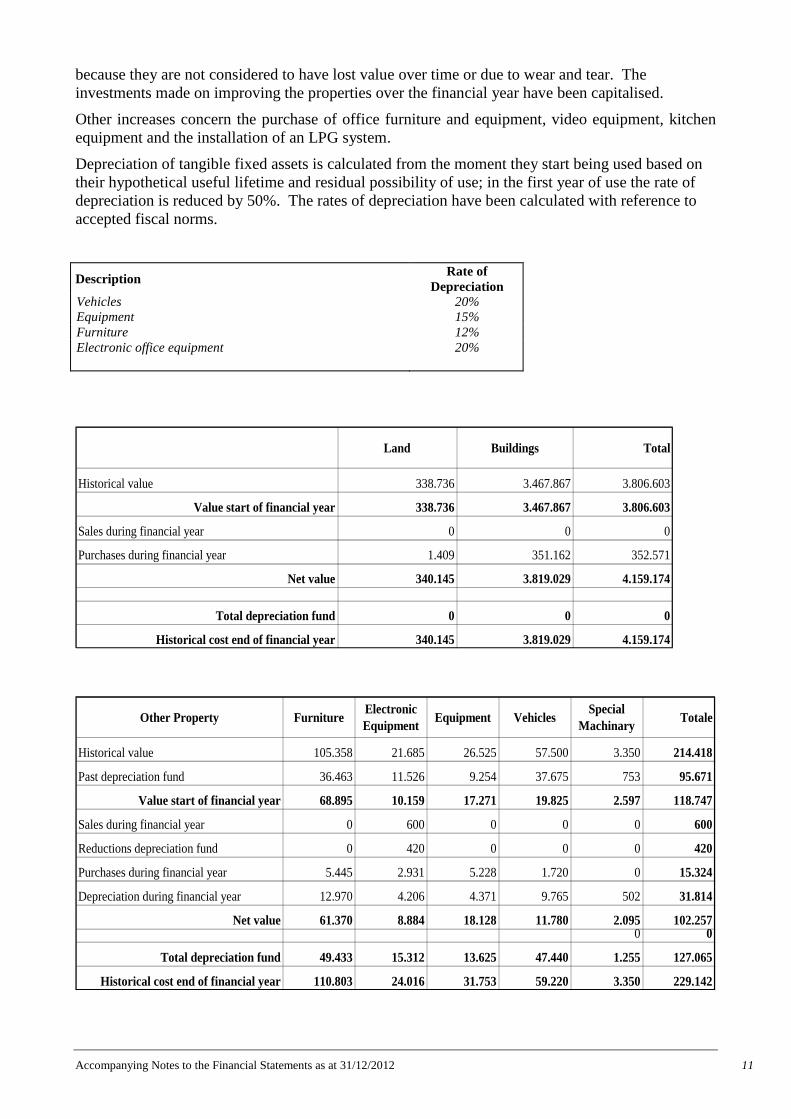
because they are not considered to have lost value over time or due to wear and tear. The
investments made on improving the properties over the financial year have been capitalised.
Other increases concern the purchase of office furniture and equipment, video equipment, kitchen
equipment and the installation of an LPG system.
Depreciation of tangible fixed assets is calculated from the moment they start being used based on
their hypothetical useful lifetime and residual possibility of use; in the first year of use the rate of
depreciation is reduced by 50%. The rates of depreciation have been calculated with reference to
accepted fiscal norms.
Description Rate of
Depreciation
Vehicles 20%
Equipment 15%
Furniture 12%
Electronic office equipment 20%
Land Buildings Total
Historical value 338.736 3.467.867 3.806.603
Value start of financial year 338.736 3.467.867 3.806.603
Sales during financial year 0 0 0
Purchases during financial year 1.409 351.162 352.571
Net value 340.145 3.819.029 4.159.174
Total depreciation fund 0 0 0
Historical cost end of financial year 340.145 3.819.029 4.159.174
Other Property FurnitureElectronic
EquipmentEquipment Vehicles
Special
MachinaryTotale
Historical value 105.358 21.685 26.525 57.500 3.350 214.418
Past depreciation fund 36.463 11.526 9.254 37.675 753 95.671
Value start of financial year 68.895 10.159 17.271 19.825 2.597 118.747
Sales during financial year 0 600 0 0 0 600
Reductions depreciation fund 0 420 0 0 0 420
Purchases during financial year 5.445 2.931 5.228 1.720 0 15.324
Depreciation during financial year 12.970 4.206 4.371 9.765 502 31.814
Net value 61.370 8.884 18.128 11.780 2.095 102.2570 0
Total depreciation fund 49.433 15.312 13.625 47.440 1.255 127.065
Historical cost end of financial year 110.803 24.016 31.753 59.220 3.350 229.142
Accompanying Notes to the Financial Statements as at 31/12/2012 12
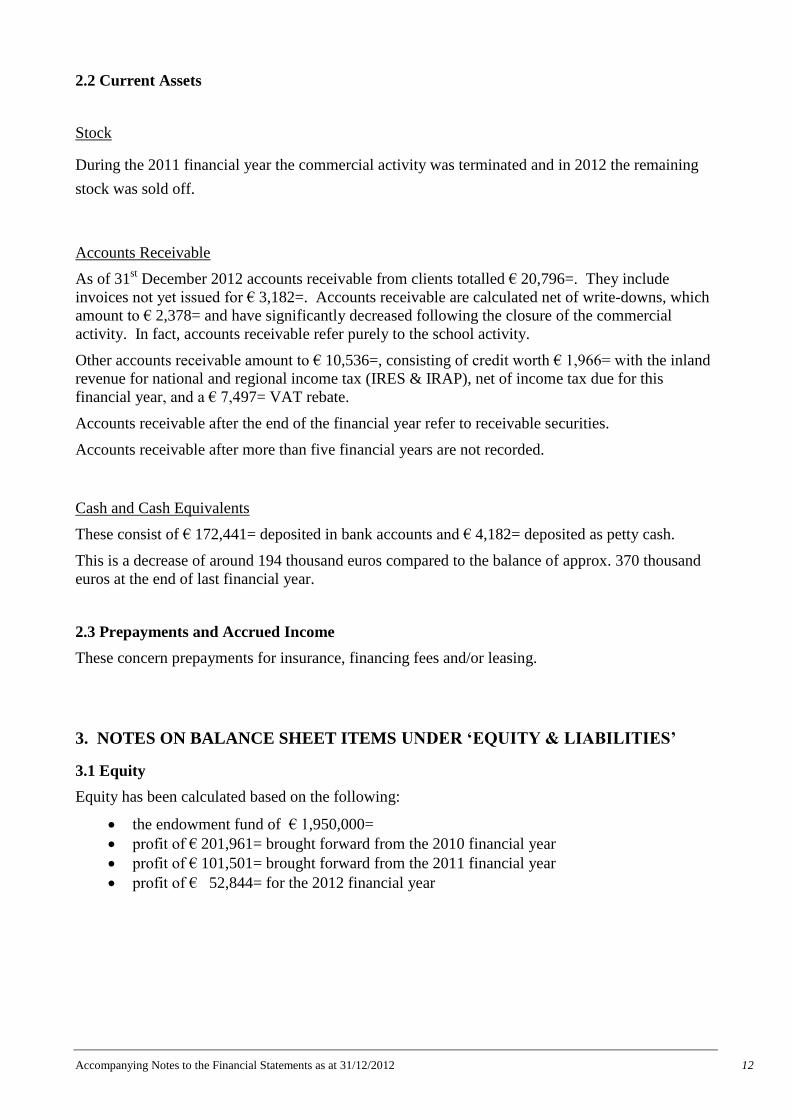
2.2 Current Assets
Stock
During the 2011 financial year the commercial activity was terminated and in 2012 the remaining
stock was sold off.
Accounts Receivable
As of 31st December 2012 accounts receivable from clients totalled € 20,796=. They include
invoices not yet issued for € 3,182=. Accounts receivable are calculated net of write-downs, which
amount to € 2,378= and have significantly decreased following the closure of the commercial
activity. In fact, accounts receivable refer purely to the school activity.
Other accounts receivable amount to € 10,536=, consisting of credit worth € 1,966= with the inland
revenue for national and regional income tax (IRES & IRAP), net of income tax due for this
financial year, and a € 7,497= VAT rebate.
Accounts receivable after the end of the financial year refer to receivable securities.
Accounts receivable after more than five financial years are not recorded.
Cash and Cash Equivalents
These consist of € 172,441= deposited in bank accounts and € 4,182= deposited as petty cash.
This is a decrease of around 194 thousand euros compared to the balance of approx. 370 thousand
euros at the end of last financial year.
2.3 Prepayments and Accrued Income
These concern prepayments for insurance, financing fees and/or leasing.
3. NOTES ON BALANCE SHEET ITEMS UNDER ‘EQUITY & LIABILITIES’
3.1 Equity
Equity has been calculated based on the following:
the endowment fund of € 1,950,000=
profit of € 201,961= brought forward from the 2010 financial year
profit of € 101,501= brought forward from the 2011 financial year
profit of € 52,844= for the 2012 financial year
Accompanying Notes to the Financial Statements as at 31/12/2012 13
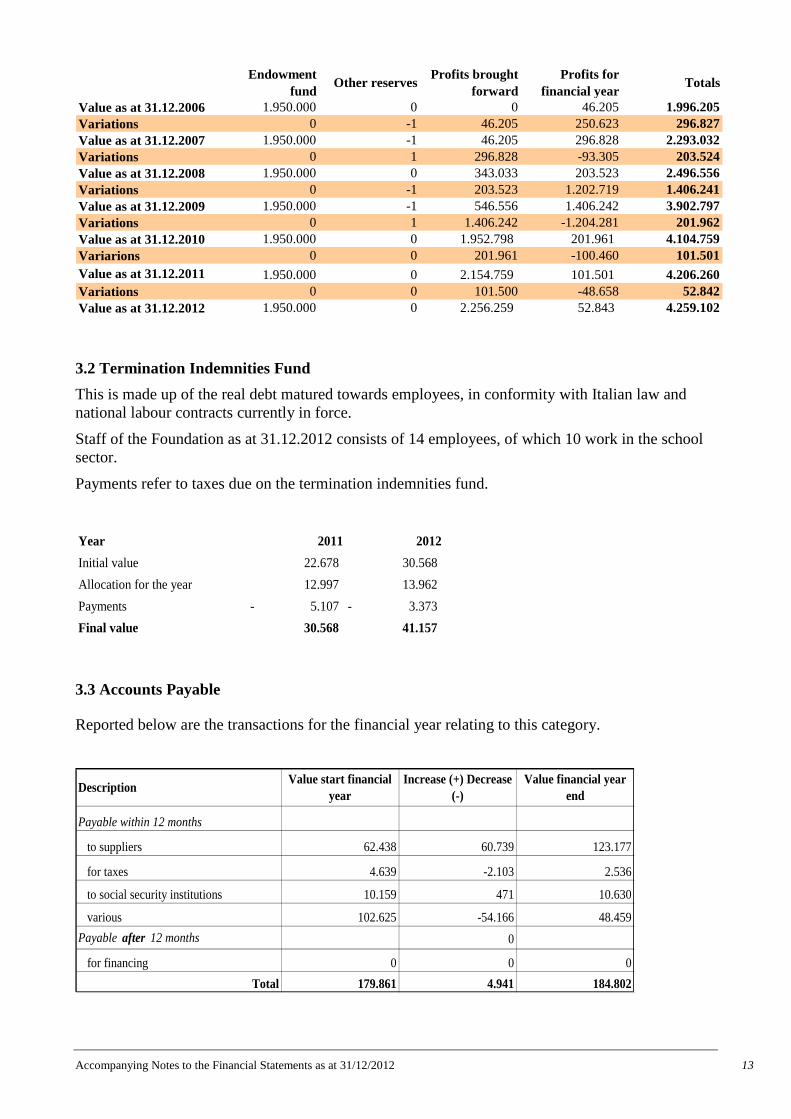
Endowment
fundOther reserves
Profits brought
forward
Profits for
financial yearTotals
Value as at 31.12.2006 1.950.000 0 0 46.205 1.996.205
Variations 0 -1 46.205 250.623 296.827
Value as at 31.12.2007 1.950.000 -1 46.205 296.828 2.293.032
Variations 0 1 296.828 -93.305 203.524
Value as at 31.12.2008 1.950.000 0 343.033 203.523 2.496.556
Variations 0 -1 203.523 1.202.719 1.406.241
Value as at 31.12.2009 1.950.000 -1 546.556 1.406.242 3.902.797
Variations 0 1 1.406.242 -1.204.281 201.962
Value as at 31.12.2010 1.950.000 0 1.952.798 201.961 4.104.759
Variarions 0 0 201.961 -100.460 101.501
Value as at 31.12.2011 1.950.000 0 2.154.759 101.501 4.206.260
Variations 0 0 101.500 -48.658 52.842
Value as at 31.12.2012 1.950.000 0 2.256.259 52.843 4.259.102
3.2 Termination Indemnities Fund
This is made up of the real debt matured towards employees, in conformity with Italian law and
national labour contracts currently in force.
Staff of the Foundation as at 31.12.2012 consists of 14 employees, of which 10 work in the school
sector.
Payments refer to taxes due on the termination indemnities fund.
Year 2011 2012
Initial value 22.678 30.568
Allocation for the year 12.997 13.962
Payments 5.107- 3.373-
Final value 30.568 41.157
3.3 Accounts Payable
Reported below are the transactions for the financial year relating to this category.
DescriptionValue start financial
year
Increase (+) Decrease
(-)
Value financial year
end
Payable within 12 months
to suppliers 62.438 60.739 123.177
for taxes 4.639 -2.103 2.536
to social security institutions 10.159 471 10.630
various 102.625 -54.166 48.459
Payable after 12 months 0
for financing 0 0 0
Total 179.861 4.941 184.802
Accompanying Notes to the Financial Statements as at 31/12/2012 15
and seminars and € 18,174 for the rent of staff accommodation. It also includes the cost of leasing
the school bus (€ 9,691= for the lease started in 2009 and closed in the 2012 financial year, and €
17.472= for the lease started in 2010 and still open.
Other Operating Expenses: the main items in this category are made up of costs associated with the
school activity (food, school supplies) and also stationary, stamps and other taxes.
5.3 Financial Income and Charges
This relates to bank charges and bank interest (positive and negative).
5.4 Extraordinary Income and Charges
Income: this relates to non-operating income resulting from Mrs. Srivastava’s estate renouncing its
claim to the royalties due for 2011, amounting to € 55,383=.
5.5 Profit (Loss) for the Financial Year
Income Tax includes IRES (national taxes) of € 5,300= and IRAP (regional taxes) of € 4,939= for
the financial year, applied only to the commercial activity and the properties owned.
Profit (or Loss) for the Period amounts to € 52,844=.
The present financial report, made up of the Balance Sheet, Income and Charges Statement and
Notes to the Financial Statements, are a true and accurate reflection of the financial position and
financial performance of the Foundation, including profit and loss for the period, and are the result
of the ledger entries for the financial year 2012.
Sandeep Gadkary
President
Accompanying Notes to the Financial Statements as at 31/12/2012 14
Debts towards suppliers include € 31,804= for invoices yet to be received.
Tax debts comprise IRPEF withholding tax in relation to the last month of the year, paid in January
2013.
Social security debts include the amount due to the relevant institutions for the last month of the
2012 financial year and paid in January 2013.
Debts various include € 34,461= payable to employees (unused holidays and 14th
month etc.),
royalty payments of € 8,156= for the 2012 financial year and other modest amounts.
3.4 Accruals and Deferred Income
Deferred income refers to income from the school activity amounting to € 14,189=, invoiced in
2012 but relative to 2013.
4. MEMORANDUM ACCOUNTS (i.e. authorised but not contracted for)
The bank guarantee relates to the € 100,000= contribution from the Regione Piemeonte.
The Leasing account refers to remaining commitments (installments) on the school bus, net of the
redemption amount.
5. NOTES ON ITEMS OF THE INCOME AND CHARGES STATEMENT
The income and charges statement includes all the activities of the Foundation, including the
commercial activity. A sectional income and charges statement is included in the Financial Report,
as required by Italian fiscal norms, highlighting separately the results obtained from the institutional
activity and the commercial activity.
5.1 Income from Operating Activity
Revenue from Sales and Services: this amounts to € 288,359= and relate to the school activity. This
is a decrease of about 112 thousand compared to the previous financial year, explained by the
closure in 2011 of the commercial unit of the Foundation.
Other Operation Income: this refers to € 814,988= in donations received including those from
participants at events held in Cabella during the financial year and those deriving from the
international fundraising efforts. It also includes € 16,312= that came in as indirect sales.
See Appendix II for a more detailed breakdown of income.
5.2 Charges from Operating Activity
Services: the most significant items in this category are maintenance and development of properties,
of which € 339.842= have been classified as an increase in asset value, legal, administrative and
technical consultancy services, utility charges (telephone, gas, electricity etc.) and expense claims.
Also included in this category are the royalties payable on sales (€ 8,156=). The amount has
increased by about 200 thousand Euros compared to last financial year.
Use of Third Party Assets: this refers principally to € 2,811= for the rent of additional space and
facilities (gym, meeting rooms, kitchens, toilet facilities etc.) on the occasion of international events
Board of Auditors Report on the 2012 Financial Report 16
BOARD OF AUDITORS REPORT
FINANCIAL REPORT FOR THE YEAR ENDING 31ST
DECEMBER 2012
OF THE SHRI MATAJI NIRMALA DEVI SAHAJA YOGA WORLD FOUNDATION
The Board of Auditors received the 2012 Financial Report from the Board of Directors comprising:
Balance Sheet,
Income and Charges Statements,
Accompanying Notes,
Cash Flow Statement.
It was given sufficient time to prepare its report and express its opinion on the content.
The responsibilities of the Board of Auditors, as per article 2409 of the Civil Code, are to carry out
periodic audits and to write up reports on their outcome. During these audits we have been able to
verify that the company books and accounts have been properly kept.
The Foundation manages commercial activity for which separate accounts and VAT records are
kept, as required by Italian fiscal law. A separate income and charges statement related to the
commercial activity is included in the financial statements.
The Foundation’s 2012 Financial Report has been drawn up based on criteria established by the
Accountants Commission for non-profit organizations. The year closes with a profit of € 52,844=,
net of depreciation and allocations of € 34,807=. Equity on the 31st December 2012 stood at €
4,259,103 = compared to € 4,206,260= at the end of the previous financial year; an increase of €
52,843=.
The cash flow situation is shown in the cash flow statement and highlights the way in which funds
were absorbed by operating activities, investments and financial activities.
The preparation and drawing up of the Financial Report is the task of the administrative body of the
Foundation, while it is the responsibility of the Board of Auditors to express their professional
opinion on the financial statements based on the outcome of their audit.
Having carefully audited the financial statements we can affirm that the information reported in the
Balance Sheet, Income and Charges Statements and Accompanying Notes corresponds to the
figures recorded in the company books, which are kept according to the norms established by Italian
law and in the Foundation’s statute.
The audit of the financial statements and the periodic audit of the accounts and of the bookkeeping
were carried out using procedures and methodologies appropriate to the functions and the
dimension of the activity, so as to provide a reasonable basis from which to express a professional
opinion and to exclude the possibility of significant error.
Board of Auditors Report on the 2012 Financial Report 17
The evaluation criteria adopted for the Balance Sheet and the modality in which they have been
represented are substantially unchanged compared to last financial year. The criteria have been
communicated to us and we can confirm that they comply with Italian accounting principles and
norms.
The Accompanying Notes provide the required complementary information for a proper
understanding of the financial statements and the cover statement adequately describes the activities
of the Foundation.
In conclusion, we believe that the outcome of our audit shows that the Financial Report of the Shri
Mataji Nirmala Devi Sahaja Yoga World Foundation for the year ending 31st December 2012 is
credible, complies with the norms that govern the compilation of such a document and is an
accurate statement of the assets and liabilities of the Foundation, of its financial position and of the
outcome of the financial year.
As such, we invite you to approve the Financial Report for the year ending 31st December 2012.
The Board of Auditors:
Maria Gallo
Ilaria Cinotto
Cristina Ciartano
14th
June 2013
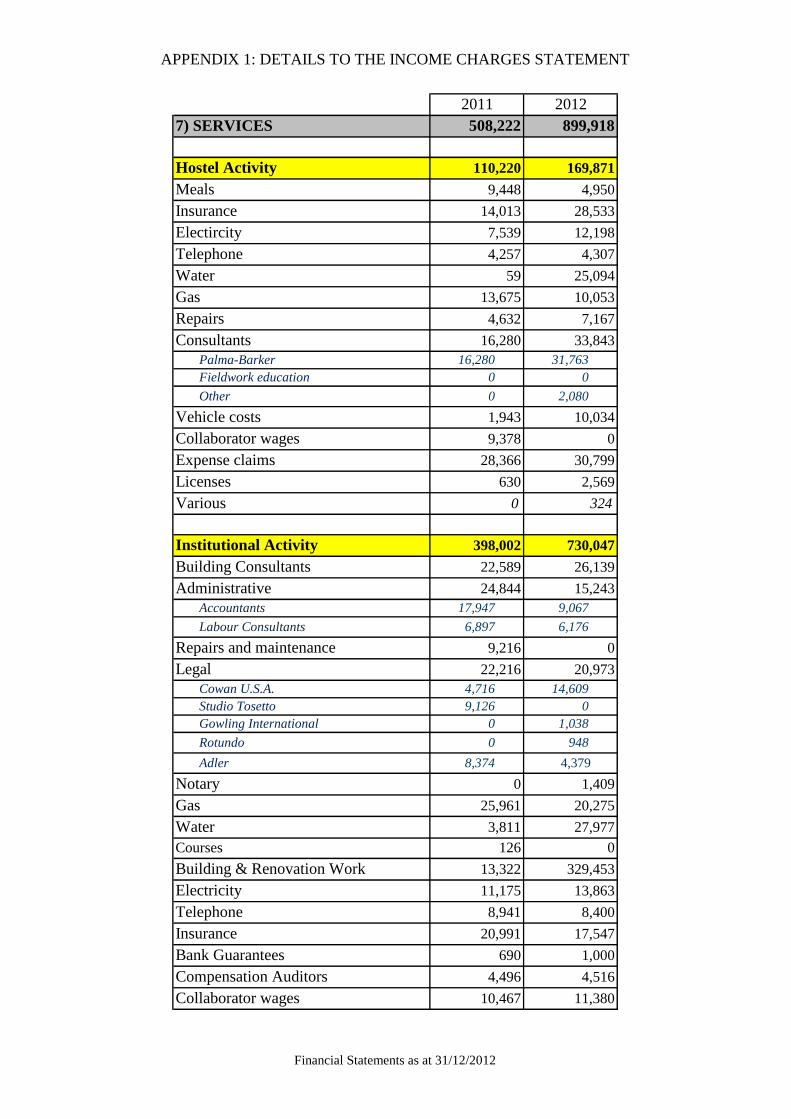
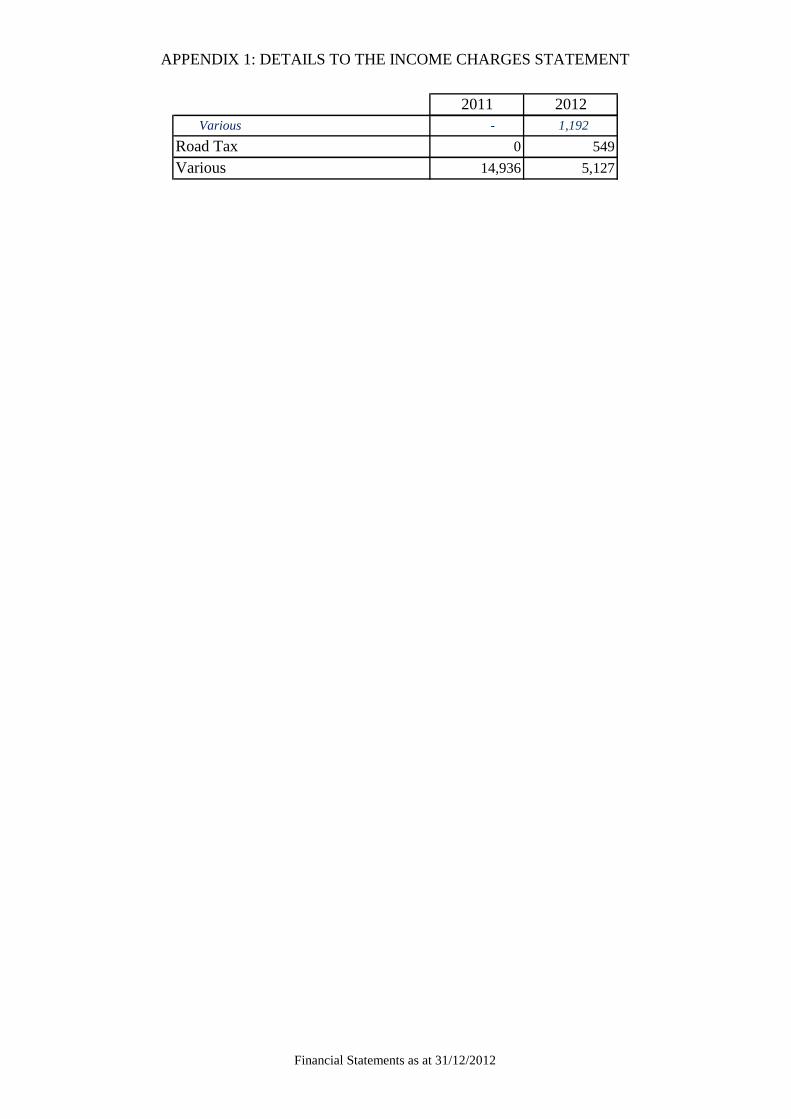
APPENDIX 1: DETAILS TO THE INCOME CHARGES STATEMENT
2011 2012
7) SERVICES 508,222 899,918
Hostel Activity 110,220 169,871
Meals 9,448 4,950
Insurance 14,013 28,533
Electircity 7,539 12,198
Telephone 4,257 4,307
Water 59 25,094
Gas 13,675 10,053
Repairs 4,632 7,167
Consultants 16,280 33,843
Palma-Barker 16,280 31,763
Fieldwork education 0 0
Other 0 2,080
Vehicle costs 1,943 10,034
Collaborator wages 9,378 0
Expense claims 28,366 30,799
Licenses 630 2,569
Various 0 324
Institutional Activity 398,002 730,047
Building Consultants 22,589 26,139
Administrative 24,844 15,243
Accountants 17,947 9,067
Labour Consultants 6,897 6,176
Repairs and maintenance 9,216 0
Legal 22,216 20,973
Cowan U.S.A. 4,716 14,609
Studio Tosetto 9,126 0
Gowling International 0 1,038
Rotundo 0 948
Adler 8,374 4,379
Notary 0 1,409
Gas 25,961 20,275
Water 3,811 27,977
Courses 126 0
Building & Renovation Work 13,322 329,453
Electricity 11,175 13,863
Telephone 8,941 8,400
Insurance 20,991 17,547
Bank Guarantees 690 1,000
Compensation Auditors 4,496 4,516
Collaborator wages 10,467 11,380
Financial Statements as at 31/12/2012
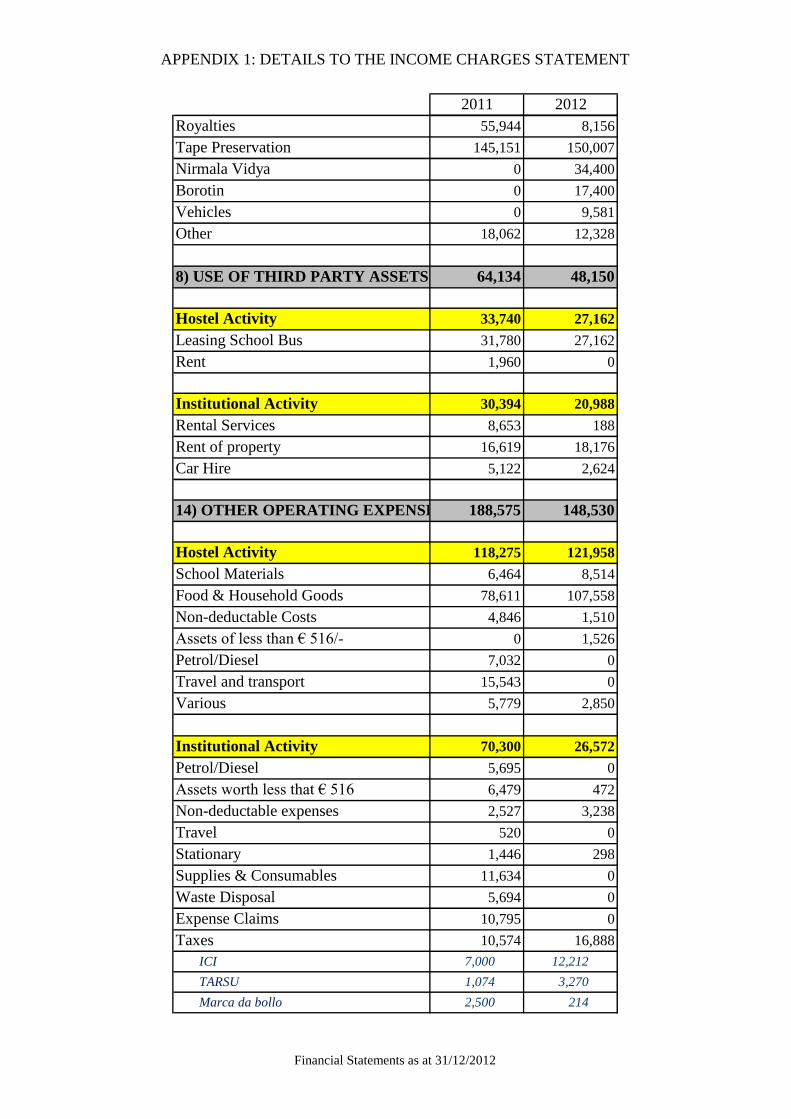
APPENDIX 1: DETAILS TO THE INCOME CHARGES STATEMENT
2011 2012
Royalties 55,944 8,156
Tape Preservation 145,151 150,007
Nirmala Vidya 0 34,400
Borotin 0 17,400
Vehicles 0 9,581
Other 18,062 12,328
8) USE OF THIRD PARTY ASSETS 64,134 48,150
Hostel Activity 33,740 27,162
Leasing School Bus 31,780 27,162
Rent 1,960 0
Institutional Activity 30,394 20,988
Rental Services 8,653 188
Rent of property 16,619 18,176
Car Hire 5,122 2,624
14) OTHER OPERATING EXPENSES 188,575 148,530
Hostel Activity 118,275 121,958
School Materials 6,464 8,514
Food & Household Goods 78,611 107,558
Non-deductable Costs 4,846 1,510
Assets of less than € 516/- 0 1,526
Petrol/Diesel 7,032 0
Travel and transport 15,543 0
Various 5,779 2,850
Institutional Activity 70,300 26,572
Petrol/Diesel 5,695 0
Assets worth less that € 516 6,479 472
Non-deductable expenses 2,527 3,238
Travel 520 0
Stationary 1,446 298
Supplies & Consumables 11,634 0
Waste Disposal 5,694 0
Expense Claims 10,795 0
Taxes 10,574 16,888
ICI 7,000 12,212
TARSU 1,074 3,270
Marca da bollo 2,500 214
Financial Statements as at 31/12/2012
APPENDIX 1: DETAILS TO THE INCOME CHARGES STATEMENT
2011 2012
Various - 1,192
Road Tax 0 549
Various 14,936 5,127
Financial Statements as at 31/12/2012
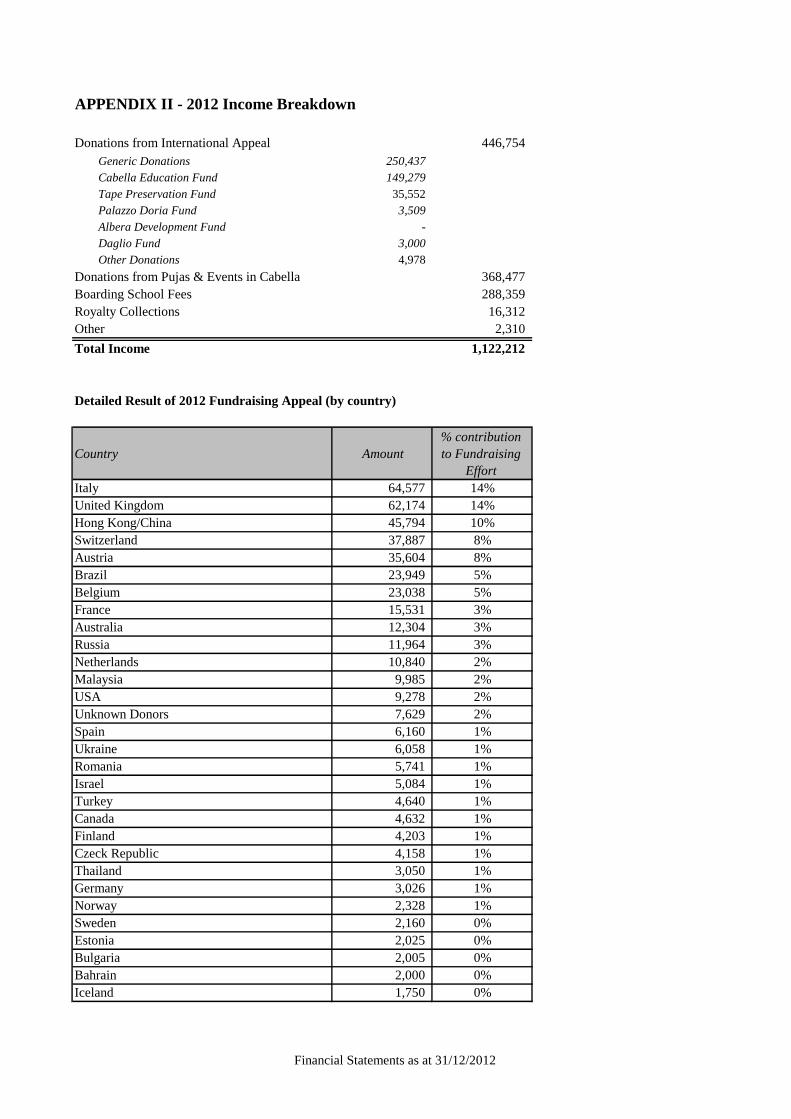
APPENDIX II - 2012 Income Breakdown
Donations from International Appeal 446,754
Generic Donations 250,437
Cabella Education Fund 149,279
Tape Preservation Fund 35,552
Palazzo Doria Fund 3,509
Albera Development Fund -
Daglio Fund 3,000
Other Donations 4,978
Donations from Pujas & Events in Cabella 368,477
Boarding School Fees 288,359
Royalty Collections 16,312
Other 2,310
Total Income 1,122,212
Detailed Result of 2012 Fundraising Appeal (by country)
Country Amount
% contribution
to Fundraising
Effort
Italy 64,577 14%
United Kingdom 62,174 14%
Hong Kong/China 45,794 10%
Switzerland 37,887 8%
Austria 35,604 8%
Brazil 23,949 5%
Belgium 23,038 5%
France 15,531 3%
Australia 12,304 3%
Russia 11,964 3%
Netherlands 10,840 2%
Malaysia 9,985 2%
USA 9,278 2%
Unknown Donors 7,629 2%
Spain 6,160 1%
Ukraine 6,058 1%
Romania 5,741 1%
Israel 5,084 1%
Turkey 4,640 1%
Canada 4,632 1%
Finland 4,203 1%
Czeck Republic 4,158 1%
Thailand 3,050 1%
Germany 3,026 1%
Norway 2,328 1%
Sweden 2,160 0%
Estonia 2,025 0%
Bulgaria 2,005 0%
Bahrain 2,000 0%
Iceland 1,750 0%
Financial Statements as at 31/12/2012
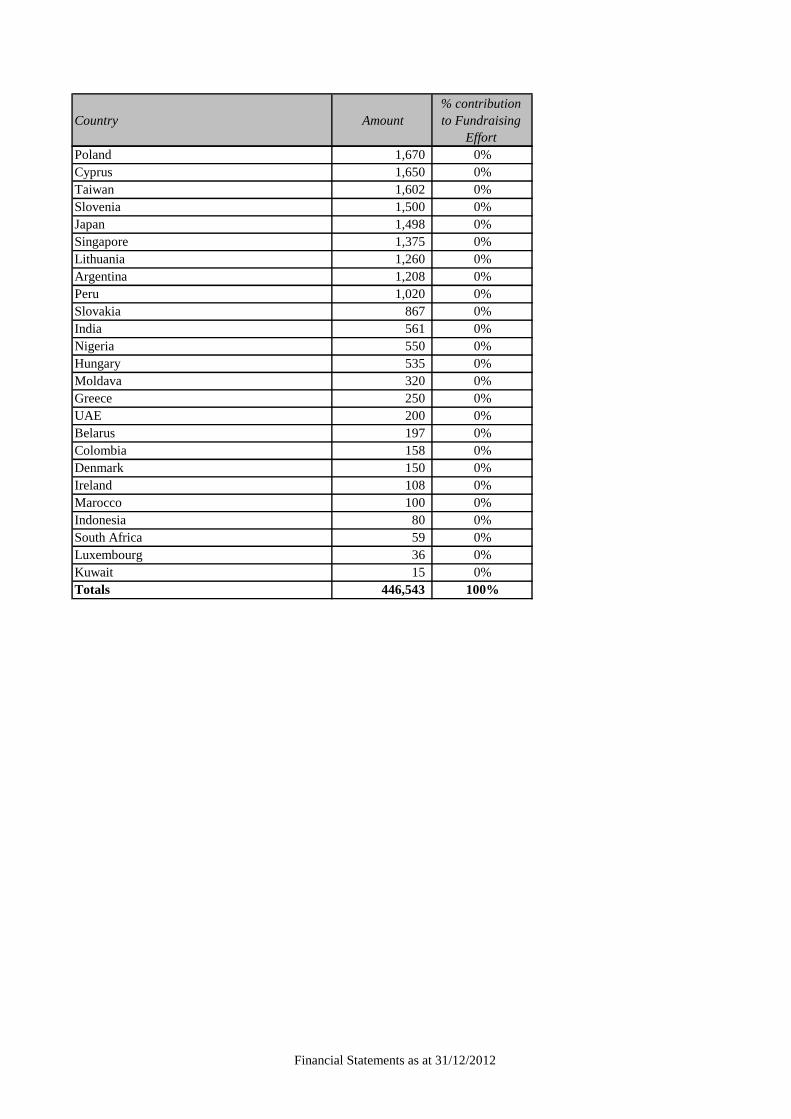
Country Amount
% contribution
to Fundraising
Effort
Poland 1,670 0%
Cyprus 1,650 0%
Taiwan 1,602 0%
Slovenia 1,500 0%
Japan 1,498 0%
Singapore 1,375 0%
Lithuania 1,260 0%
Argentina 1,208 0%
Peru 1,020 0%
Slovakia 867 0%
India 561 0%
Nigeria 550 0%
Hungary 535 0%
Moldava 320 0%
Greece 250 0%
UAE 200 0%
Belarus 197 0%
Colombia 158 0%
Denmark 150 0%
Ireland 108 0%
Marocco 100 0%
Indonesia 80 0%
South Africa 59 0%
Luxembourg 36 0%
Kuwait 15 0%
Totals 446,543 100%
Financial Statements as at 31/12/2012
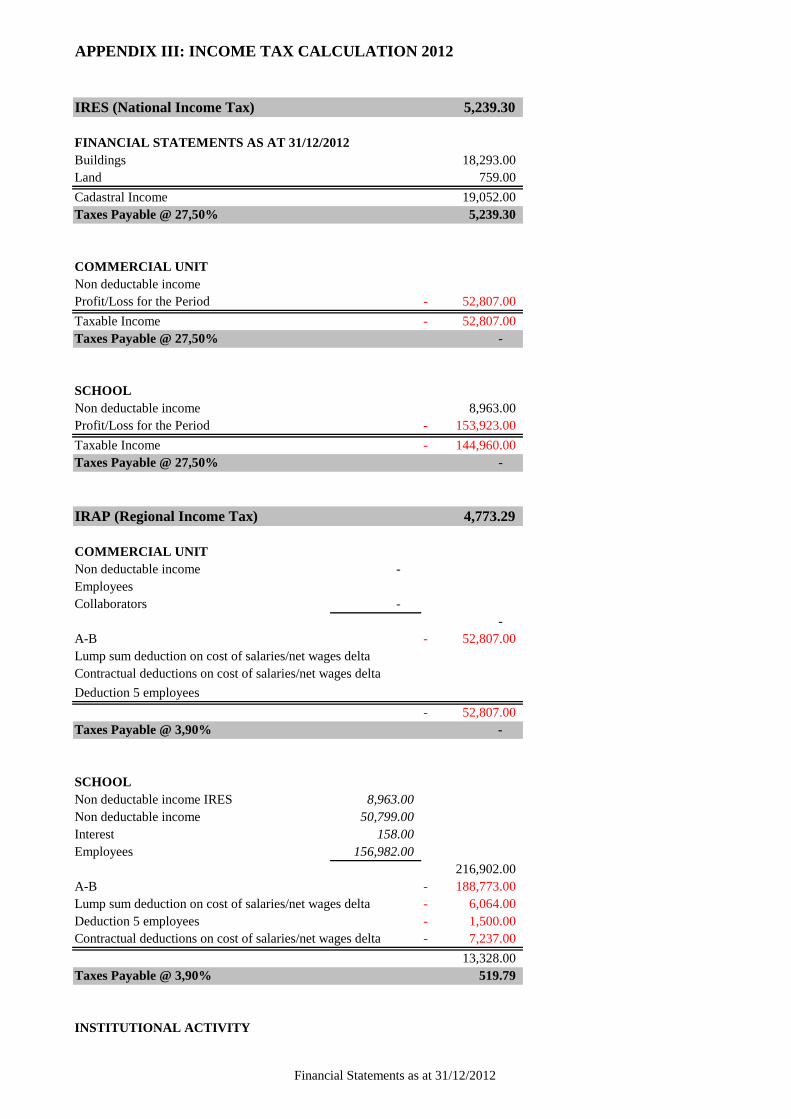
APPENDIX III: INCOME TAX CALCULATION 2012
IRES (National Income Tax) 5,239.30
FINANCIAL STATEMENTS AS AT 31/12/2012
Buildings 18,293.00
Land 759.00
Cadastral Income 19,052.00
Taxes Payable @ 27,50% 5,239.30
COMMERCIAL UNIT
Non deductable income
Profit/Loss for the Period 52,807.00-
Taxable Income 52,807.00-
Taxes Payable @ 27,50% -
SCHOOL
Non deductable income 8,963.00
Profit/Loss for the Period 153,923.00-
Taxable Income 144,960.00-
Taxes Payable @ 27,50% -
IRAP (Regional Income Tax) 4,773.29
COMMERCIAL UNIT
Non deductable income -
Employees
Collaborators -
-
A-B 52,807.00-
Lump sum deduction on cost of salaries/net wages delta
Contractual deductions on cost of salaries/net wages delta
Deduction 5 employees
52,807.00-
Taxes Payable @ 3,90% -
SCHOOL
Non deductable income IRES 8,963.00
Non deductable income 50,799.00
Interest 158.00
Employees 156,982.00
216,902.00
A-B 188,773.00-
Lump sum deduction on cost of salaries/net wages delta 6,064.00-
Deduction 5 employees 1,500.00-
Contractual deductions on cost of salaries/net wages delta 7,237.00-
13,328.00
Taxes Payable @ 3,90% 519.79
INSTITUTIONAL ACTIVITY
Financial Statements as at 31/12/2012
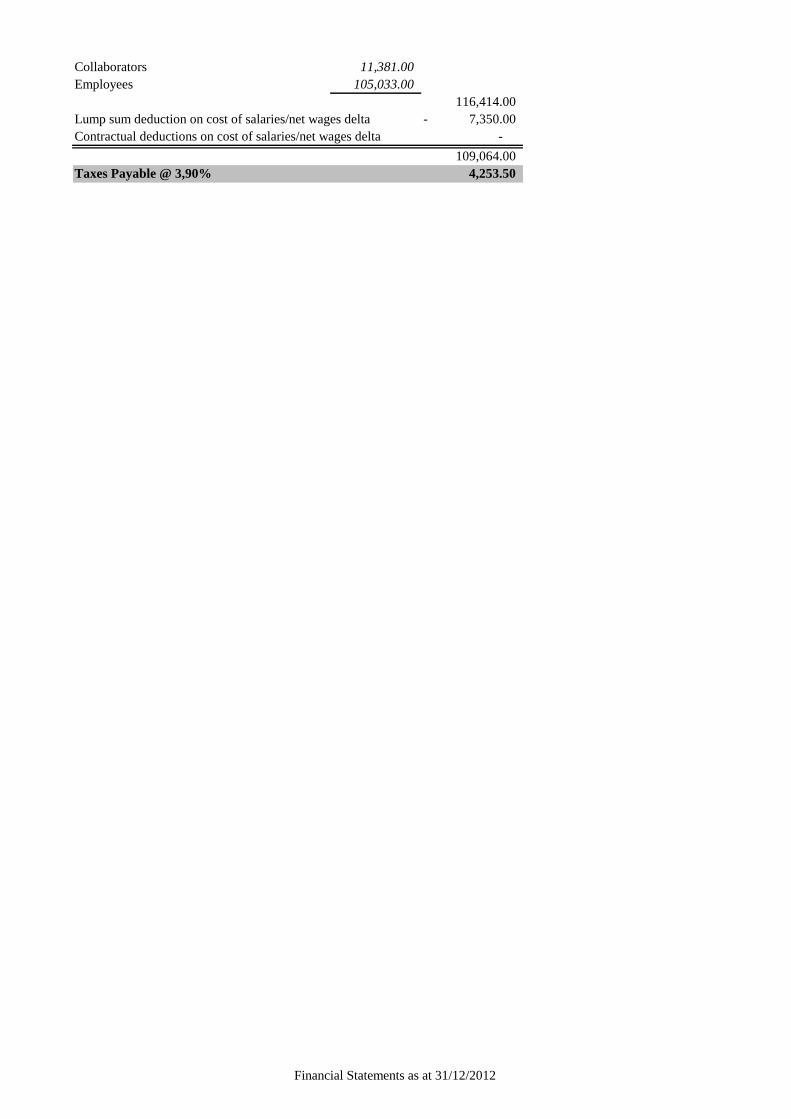
Collaborators 11,381.00
Employees 105,033.00
116,414.00
Lump sum deduction on cost of salaries/net wages delta 7,350.00-
Contractual deductions on cost of salaries/net wages delta -
109,064.00
Taxes Payable @ 3,90% 4,253.50
Financial Statements as at 31/12/2012