Embed Size (px)
Citation preview
Mira Marianna Järvenpää
Healthy Lunch Option
for the Restaurant Martin Ravintola
Business Economics and Tourism 2011
VAASAN AMMATTIKORKEAKOULU
UNIVERSITY OF APPLIED SCIENCES
Degree Programme of Hotel and Restaurant business
ABSTRACT
Author Mira Järvenpää
Title Healthy Lunch Option for the Restaurant Martin Ravintola
Year 2011
Language English
Pages 72+12 appendices
Name of Supervisor Eliisa Lahola
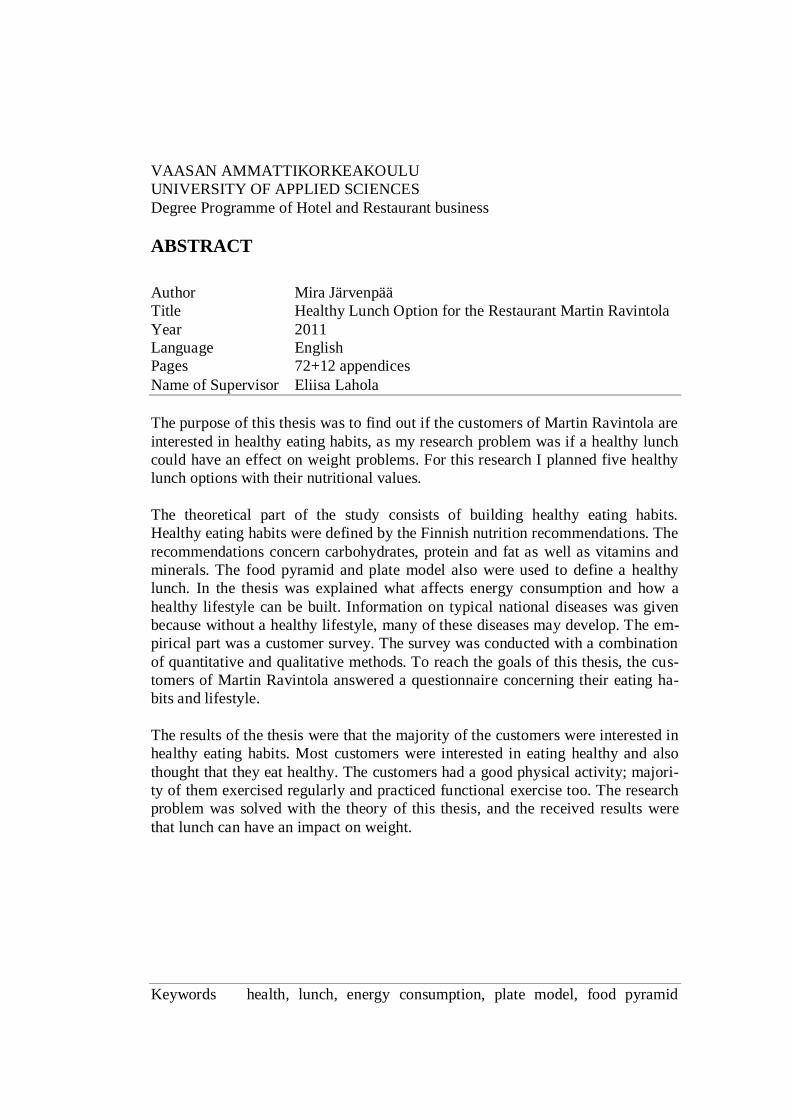
The purpose of this thesis was to find out if the customers of Martin Ravintola are
interested in healthy eating habits, as my research problem was if a healthy lunch
could have an effect on weight problems. For this research I planned five healthy
lunch options with their nutritional values.
The theoretical part of the study consists of building healthy eating habits.
Healthy eating habits were defined by the Finnish nutrition recommendations. The
recommendations concern carbohydrates, protein and fat as well as vitamins and
minerals. The food pyramid and plate model also were used to define a healthy
lunch. In the thesis was explained what affects energy consumption and how a
healthy lifestyle can be built. Information on typical national diseases was given
because without a healthy lifestyle, many of these diseases may develop. The em-
pirical part was a customer survey. The survey was conducted with a combination
of quantitative and qualitative methods. To reach the goals of this thesis, the cus-
tomers of Martin Ravintola answered a questionnaire concerning their eating ha-
bits and lifestyle.
The results of the thesis were that the majority of the customers were interested in
healthy eating habits. Most customers were interested in eating healthy and also
thought that they eat healthy. The customers had a good physical activity; majori-
ty of them exercised regularly and practiced functional exercise too. The research
problem was solved with the theory of this thesis, and the received results were
that lunch can have an impact on weight.
Keywords health, lunch, energy consumption, plate model, food pyramid
VAASAN AMMATTIKORKEAKOULU
Degree Programme of Hotel and Restaurant business
TIIVISTELMÄ
Tekijä Mira Järvenpää
Opinnäytetyön nimi Terveellinen lounasvaihtoehto Martin Ravintolalle
Vuosi 2011
Kieli englanti
Sivumäärä 72+12 liitettä
Ohjaaja Eliisa Lahola
Tämän opinnäytetyön tarkoitus oli selvittää ovatko Martin Ravintolan asiakkaat
kiinnostuneita terveellisistä elintavoista. Tutkimusongelmani oli, että voiko ter-
veellisellä lounaalla olla vaikutusta paino-ongelmiin. Suunnittelin tätä työtä varten
viisi terveellistä lounasvaihtoehtoa ravintoarvoineen.
Teoreettinen osuus koostuu terveellisten ruokailutapojen rakentamisesta. Terveel-
liset elämäntavat määriteltiin ravitsemussuositusten mukaan. Suositukset koskevat
hiilihydraatteja, proteiineja ja rasvaa, sekä vitamiineja ja mineraaleja. Ruokapy-
ramidia ja lautasmallia käytettiin määrittelemään terveellinen lounas. Tässä opin-
näytetyössä kerrotaan mikä vaikuttaa energian kulutukseen ja kuinka voidaan ra-
kentaa terveelliset elintavat. Tyypillisistä kansansairauksista kerrotaan myös, kos-
ka ellei eletä terveellisesti, moni näistä sairauksista voi kehittyä. Empiirinen osuus
oli asiakaskysely. Kyselyssä oli käytetty kvantitatiivista sekä kvalitatiivista tutki-
musmetodia. Saavuttaakseni tämän opinnäytetyön tavoitteet Martin Ravintolan
asiakkaat vastasivat kyselyyn, jossa oli kyse heidän ruokailu- ja elintavoistaan.
Tämän opinnäytetyön tuloksena oli, että suurin osa asiakkaista oli kiinnostunut
elämään terveellisesti. Monet asiakkaista olivat kiinnostuneita syömään terveelli-
sesti sekä ajattelivat jo syövänsä terveellisesti. Asiakkailla oli hyvä fyysinen aktii-
visuus, suurin osa heistä liikkui säännöllisesti, ja harrasti myös hyötyliikuntaa.
Tutkimusongelma ratkaistiin opinnäytetyön teorian avulla, ja tuloksena oli, että
lounaalla voi olla vaikutusta painoon.
Avainsanat terveys, lounas, energiankulutus, ruokapyramidi, lautasmalli
4
CONTENTS
ABSTRACT
TIIVISTELMÄ
1 INTRODUCTION ................................................................................................ 9
1.1 Background Information .............................................................................. 9
1.2 Company Introduction................................................................................ 10
1.3 Previous Research....................................................................................... 11
1.4 The Aim of the Research............................................................................ 11
1.5 Research Method ........................................................................................ 12
1.6 Research Problem ....................................................................................... 12
1.7 Research Question ...................................................................................... 13
2 BUILDING HEALTHY EATING HABITS .................................................... 14
2.1 Plate Model ................................................................................................. 14
2.2 Food Pyramid .............................................................................................. 15
2.3 Health Triangle ........................................................................................... 16
2.4 Current Eating Habits ................................................................................. 16
2.5 Energy Consumption and Need ................................................................. 18
2.6 Cardinal Metabolism .................................................................................. 18
2.7 Production of Warmth Due Food .............................................................. 19
2.8 Energy Consumption Due to Physical Activity ........................................ 19
3 NUTRITION RECOMMENDATIONS ........................................................... 21
3.1 Fat ..........................................................................................................22
3.2 Proteins ........................................................................................................ 23
3.3 Carbohydrates ............................................................................................. 24
3.4 Vitamins and Minerals ............................................................................... 25
3.5 Typical National Deceases ......................................................................... 26
3.5.1 High Blood Pressure ...................................................................... 27
3.5.2 Coronary Heart Disease ................................................................. 27
3.5.3 Cerebrovascular Accident .............................................................. 27
5
3.5.4 Diabetes .......................................................................................... 28
3.5.5 Osteoporosis ................................................................................... 28
4 HEALTHY LUNCH OPTIONS........................................................................ 29
4.1 Cauliflower Soup with Shrimps................................................................. 30
4.2 Chicken with Rice and Ratatouille ............................................................ 31
4.3 Pork with Fruity Coleslaw and Garlic Sauce ............................................ 32
4.4 Salmon with a Berry Side Salad and Yoghurt Sauce ............................... 33
4.5 Beef Steak with Root Vegetables and Red Wine Sauce .......................... 34
5 METHODOLOGY ............................................................................................. 36
5.1 Research Method ........................................................................................ 36
5.2 Validity and Reliability .............................................................................. 36
5.3 Data Collection Method ............................................................................. 37
5.4 Questionnaire .............................................................................................. 37
5.5 Eating Habits ............................................................................................... 38
5.6 Interest in Healthy Food ............................................................................. 38
5.7 Lunch’s Effect on Weight .......................................................................... 38
6 DATA ANALYSIS ............................................................................................ 40
6.1 Eating Habits ............................................................................................... 42
6.2 Interest in Healthy Food ............................................................................. 47
6.3 Lunch’s Effect on Weight .......................................................................... 49
7 CONCLUSIONS ................................................................................................ 54
REFERENCES .......................................................................................................... 58
APPENDICES
6
LISTS OF FIGURES AND TABLES
Figure1. Supply of the protective nutrients. p. 25
Figure2. Nutritional values of the soup in percentages. p. 31
Figure3. Nutritional values of the chicken dish in percentages. p. 32
Figure4. Nutritional values of the pork dish in percentages. p. 33
Figure5. Nutritional values of the fish portion in percentages. p. 34
Figure6. Nutritional values of the steak in percentages. p. 35
Figure7. Number of respondents. p. 40
Figure8. Respondents’ age. p. 41
Figure9. The quality of the respondents’ work. p. 41
Figure10. The meals people eat during a day. p. 43
Figure11. What is the most important meal among the respondents. p. 43
Figure12. Eating times compared to the most important meal of the customers.
p. 44
Figure13. The food products which people eat. p. 45
Figure14. Food items rated as the most eaten. p. 45
Figure15. How customers rated the effecting things. p. 46
Figure16. Most effecting issues in choosing a lunch restaurant. p. 46
Figure17. Customers’ interest to eat healthy. p. 47
Figure18. Customers’ reasons to eat healthy p. 47
Figure19. Customers’ opinion if they think that they eat healthy p. 48
Figure20. Interest in eating healthy compared to thinking that they eat healthy.
p. 45
Figure21. Customers’ favorite option as a lunch portion. p. 49
Figure22. Substitute of lunch p. 50
Figure23. Do respondents exercise regularly. p. 50
Figure24. The times respondents exercise in a week. p.51
7
Figure25. Regular exercising compared to eating healthy. p.52
Figure26. Do customers practice useful exercise. p.52
Table1. Food products Finnish people ate in 2010. p.16
Table2. Nutritional values of the restaurant’s accompaniments. p.29
Table3. Nutritional values of the cauliflower soup. p.29
Table4. Nutritional values of the chicken portion. p.30
Table5. Nutritional values of the pork portion. p.31
Table6. Nutritional values of the fish portion. p.32
Table7. Nutritional values of the steak. p.33
Table8. Respondents’ eating times during a day p.41
Table9. Form of exercise. p.50

8
LIST OF APPENDICES
APPENDIX 1. Healthy lunch recipes
APPENDIX 2. Questionnaires in English, Finnish and Swedish
9
1 INTRODUCTION
1.1 Background Information
As thesis topic I planned healthy lunch options for restaurant Martin Ravintola.
The restaurant serves lunch from Monday to Friday, and I planned one healthy
lunch option for each of these days. In addition, I wanted to find out if there are
people among the customer group who would be interested in eating healthy, and
in an healthy lifestyle. My target group is the customers of restaurant Martin Ra-
vintola.
According to Raija Kivinen, journalist at the magazine Kunto Plus, only every
tenth person exercises this day the minimum amount recommended. She also
wonders why Finnish people, who live in beautiful nature and near of the forests,
have become increasingly indoor people. Every second person in Finland is al-
ready overweight. (Kivinen 2011; Helakorpi, Paavola. Prättälä & Uutela 2008: 9)
Overweight has become increasingly common among children too. When I was
little I used to run and play outside and nowadays children see other kids online
instead of playing outside. Adults are not much better; they also spend plenty of
their time on the Internet. (Laatikainen 2010; Tilastokeskus 2011)
For me this subject is interesting, I am very interested in healthy lifestyle and cu-
rious about other people’s eating habits. I like to cook and eat food, and food is
not only a fuel for me, it is also a way to enjoy life. When energy is lost through
exercising we can eat more. I try to eat healthily and exercise plenty. Through a
healthy lifestyle many national diseases can be prevented, and it also helps to keep
up vitality. It is stated that with a healthy lifestyle people live longer (CDC 2011).
When thinking of my occupation, this thesis can help me in the future to plan
lunch and à la carte menus as well as give information about the customers’ needs
and wants to the restaurant.
In the year 2010, I made a customer satisfaction survey for restaurant Martin Ra-
vintola. The results were that most customers were satisfied with the lunch por-
tions, and the food was complimented. On the other hand, there were people who
10
wanted a more versatile menu, and some thought that the relationship of the por-
tion size and the price was not good. From the customer satisfaction survey I got
an idea to plan new and healthy lunch portions for five days. Although the cus-
tomers of one restaurant are just a small percentage of all working adults in Fin-
land my research will give me and for restaurant interesting results of eating ha-
bits.
The main reasons for choosing this subject as a research topic was my own inter-
est in eating and living healthy. I have been working with Martin Ravintola for a
few years during my studies and done my practical training there. I have also tak-
en part in planning menus for the restaurant. Most of the restaurant’s customers
are mainly regular customers.
1.2 Company Introduction
Martin Ravintola is a small Central European restaurant; it could also be described
as a Bistro. It was known before by the name Martin baari. The location of the
restaurant is in the center of Vaasa, close to the railway and bus station. The own-
er, Martti Niemelä established the place in 2001.
Because of its size, the restaurant functions as a small family business. The owner
works with two other workers, and the place also takes trainees. There are seats
for 40 people, nine tables and a couple of bar chairs. During lunch, the customer
number is from 30 to 40 people, in summertime there are fewer customers due to
summer holidays. The restaurant is open from Monday to Saturday. From Mon-
day to Friday lunch begins at 11 in the morning and lasts till two in the afternoon.
The restaurant has an à la carte list in the evenings. The à la carte list is available
from Tuesday to Thursday till 10 o’clock in the evening and on Friday and Satur-
day till midnight. On Saturday the place is open from four o’clock to midnight.
The restaurant can also be reserved for private occasions and ceremonies.
For lunch there are now four lunch options to choose from, usually there is a soup,
a stew, chicken or pork fillet and a steak or fish fillet. The à la carte menu has
lighter dishes like chicken sandwich and traditional dishes like pork loins and des-
11
serts. Lunch includes a starter salad, and whole grain bread that can be considered
healthy. The main courses are usually served with cream potatoes, and creamy
sauces which are very greasy and heavy. In the normal lunch portions the amount
of side vegetables is very low. One of the most popular dishes is chicken bread
from the à la carte menu, it can be also considered as healthy. The main ingre-
dients of it are a big salad, a slice of toasted bread and sliced chicken breast.
1.3 Previous Research
Many research have been made about healthy food among children and young
people, it has been also stated that school lunch would not be healthy. Concerns
about health among children and young people may be due to the increasing
weight among 12-18 year olds. Low exercising is doubted to be the reason for
weight gaining. (Sari Stigman 2006)
Overweight among working adults has also increased, and there are many news
about the population in Finland being overweight. I found a research from the
year 2009 which stated that smoking has been reduced, eating healthy has in-
creased but being overweight has become more usual. In the year 2008, 56 percent
of the men and 44 percent of the women were overweight. (Helakorpi, Paavola,
Prättälä, Uutela 2008: 17)
1.4 The Aim of the Research
The aim of the research was to find out if there are customers who would be inter-
ested in eating healthy. With the research was also investigated the amount of dai-
ly exercising and respondents’ most eaten food stuffs. My research question is:
―Are people interested in healthy lunch options‖? My research problem is: ―Can
lunch have an impact on people’s weight problems‖? My goal was to find answers
to this question and problem, and I planned healthy recipes with their nutritional
values for the restaurant. Recipes and the results of the questionnaire were brought
to the restaurant’s owner.
In the theory part, healthy eating habits were based on the Finnish Nutritional
Recommendations, and there was also information about typical national diseases.
12
These diseases can evolve if people do not eat according to a healthy lifestyle.
With the help of a food pyramid, a plate model and knowledge of energy con-
sumption was clarified what belongs to a healthy lifestyle. In this research energy
giving nutrients as well as vitamins and minerals are presented.
1.5 Research Method
As a research method I used a combination of the quantitative and the qualitative
method, because I thought it would be the most suitable one for evaluating cus-
tomers’ eating habits. A quantitative method means that the collected data is
measured in numbers. I made a questionnaire consisting of 14 questions including
an open question, and a free comment section where customers could write their
comments. The questionnaire covered three sections. The eating habits section
dealt with questions about eating times, and what meals customers ate. Their most
important meal, and what food they eat the least and the most, was also asked. In
addition, I asked what affects their choice of a lunch restaurant. The interest in
healthy food part concerned matters such as customers’ interest in eating healthily
and reasons for that. In this section was also the qualitative part of the question-
naire; the question where people wrote their own opinion on what they regard to
be healthy food. The section, lunch’s effect on weight, was about preferred lunch
options, a replacement of lunch and questions about exercising. At the end there
was an open feedback section.
1.6 Research Problem
My research problem is: Can lunch have an impact on Finnish people’s weight
problems? I wanted to know if people eat too much during lunch or as an opposite
skips it and replace it with an unhealthy snack. Especially in the case of eating in a
buffet, there is so much food, so it is easy to take too much. I seldom eat at a
buffet but when I do I think that it is a waste of money if I eat just a little. In an
article was claimed that if people skip lunch, they tend to eat more at home and
too much because the hunger has gotten so big. As a contradiction, if you eat too
much at lunch, you feel tired after it, which is not the purpose when consuming
energy giving nutrition. (Työpiste 2009)

13
1.7 Research Question
My research question is: Are people interested in healthy lunch options. With this
question I wanted to know if people want to eat healthy during their lunch. For me
eating healthy is important, but I can treat myself sometimes too. I assume that if I
would eat lunch in a restaurant every day it would be a good thing if the food
tasted good, and would be healthy too.
14
2 BUILDING HEALTHY EATING HABITS
Versatile and regular eating rhythm is a base for healthy eating habits. Neverthe-
less, people’s dining has become more irregular and snacking more popular. If we
eat regularly there is no need for extra snacking, or for eating too much at once
because the hunger has become so big. (Niemi 2006: 132)
People are different and prone to different eating habits, but the recommended
rhythm is to eat from four to six the same sized meals a day in every three or four
hours. When eating several meals which are approximately the same size, energy
intake divides evenly throughout the day. It is recommended to eat half of the
whole calorie intake before half of the day. Although the regular dining rhythm is
important and recommended, should also be taken in consideration the quality and
amount of food. (Niemi 2006: 133)
2.1 Plate Model
The plate model is a guideline on how to build your meal on a plate. Vegetables
fill half of the plate, one fourth is filled with a carbohydrate source such as pota-
toes and the final fourth is filled with protein source. To the plate model is also
added a dessert which can be berries, bread as a fiber and carbohydrate source,
and a glass of milk as milk products and vegetable fat as salad dressing and mar-
garine for the bread. (Borg, Ilander, Laaksonen, Marniemi, Mursu, Pethman &
Ray 2006: 23; Niemi 2006: 134)
Half a kilo of vegetables, fruit and berries should be eaten per day in total; a plate
can be filled for example with grated vegetables, a warm side vegetable or salad.
From vegetables we get vitamins and minerals, they have a low number of calo-
ries which are mostly carbohydrates. Vegetables, fruit and berries should be eaten
with every meal, it is also recommended not to cook the vegetables every time and
eat whole berries instead of juices. (Niemi 2006: 136)
The plate model’s carbohydrate source can be potatoes, rice, pasta or other such as
couscous. Potatoes have a great amount of starch but a low number of calories, it
can be eaten plenty, also sweet potato is good for you and it has more fibers than
15
potato. White bread should be avoided. It is recommended to eat whole grain
bread which should be half of the recommended six to nine slices per day. As a
protein source is recommended to use meat with a low fat content and different
fish at least twice a week. Meat products can be replaced with soya, nuts, seeds
and bean vegetables. Tofu and soya products are good in a vegetarian diet. (Niemi
2006: 136—137)
2.2 Food Pyramid
The three dimensioned food pyramid is made from the nutritional recommenda-
tion food triangle. The triangle consists of four layers, the bottom layer is the wid-
est and the upper layer is the smallest, this shows how much food items one can
eat from the layers compared to each. The food pyramid is made for consumption
of 2000 calories, light working and exercising woman’s energy need. (Huovinen
& Leino 2000: 447—448)
The base of the pyramid is the source for energy and fiber intake. The second
layer is constituted of vegetables, fruit and berries. The third layer consists of
milk, meat, egg and fish and the final and narrowest layer consists of high calorie
products; fat and treats. The bottom layer is the one of which should be eaten the
most; there are for example grain products, potatoes and pasta. Referring to the
plate model, the recommended bread amount is six to nine slices per day. (Huovi-
nen & Leino 2000: 448—449)
For a good diet, for example recommended amounts to eat for one day from the
bottom layer could be: six to nine slices of bread, one portion of porridge, 300
grams of pasta or rice and 200 grams of potatoes. From the green layer should be
eaten two to three fruit and 225 grams of salad and 150 grams of vegetables. From
the milk and meat product layer can be eaten three glasses of milk products, two
to three slices of cheese and three portions of meat approximately 180 grams. And
finally from the top shelf a diet for one day can have one tablespoon of vegetable
oil, 18 grams of butter and half a deciliter of sugar. (Huovinen & Leino 2000:
449—454)
16
2.3 Health Triangle
Aleksi Niemi has upgraded the food triangle to the health triangle.
―In the last years I was taking the traditional food tri-
angle thinking further by adding exercising as the base
for a healthy lifestyle. In other words, the food triangle
has changed into health triangle.” (Niemi 2006: 139)
In the health triangle there are five layers, in the bottom, and as the widest layer is
activity and exercise, the second largest layer is grain products and potato, the
third layer is vegetables, fruit and berries, the second layer consists of meat, fish,
egg and milk products and the top layer is fat and sugar. (Niemi 2006: 139—141)
The bottom layer, physical activity, consists of all the exercise that should be
done, taken into consideration planned workout for a day as well as the activity
during free time, work and traveling to work. It is recommended to take into con-
sideration options with the help of which you can add more exercise in your day,
for example using the stairs instead of an elevator and walk by foot or bike to
work if possible. (Niemi 2006: 139—140)
The triangle’s other layers are mainly the same as in the food pyramid. The idea is
the same, the bigger the layer the more it should be used. Great physical activity
combined with the right and versatile diet prevents being overweight and is good
for the health. (Niemi 2006: 139—141)
2.4 Current Eating Habits
Information Centre of the Ministry of Agriculture and Forestry has made a Bal-
ance sheet for Food Commodities 2010. This research is about what Finnish
people ate in 2010. In this research found that people consumed 183 kilos of liq-
uid milk products, 81 kilos of fruit and berries, 80 kilos of grain, 76 kilos of meat
and 68 kilos of vegetables. These numbers are presented in table one with the
amounts of use in grams per day, calorie amount, and a division of proteins, fats
17
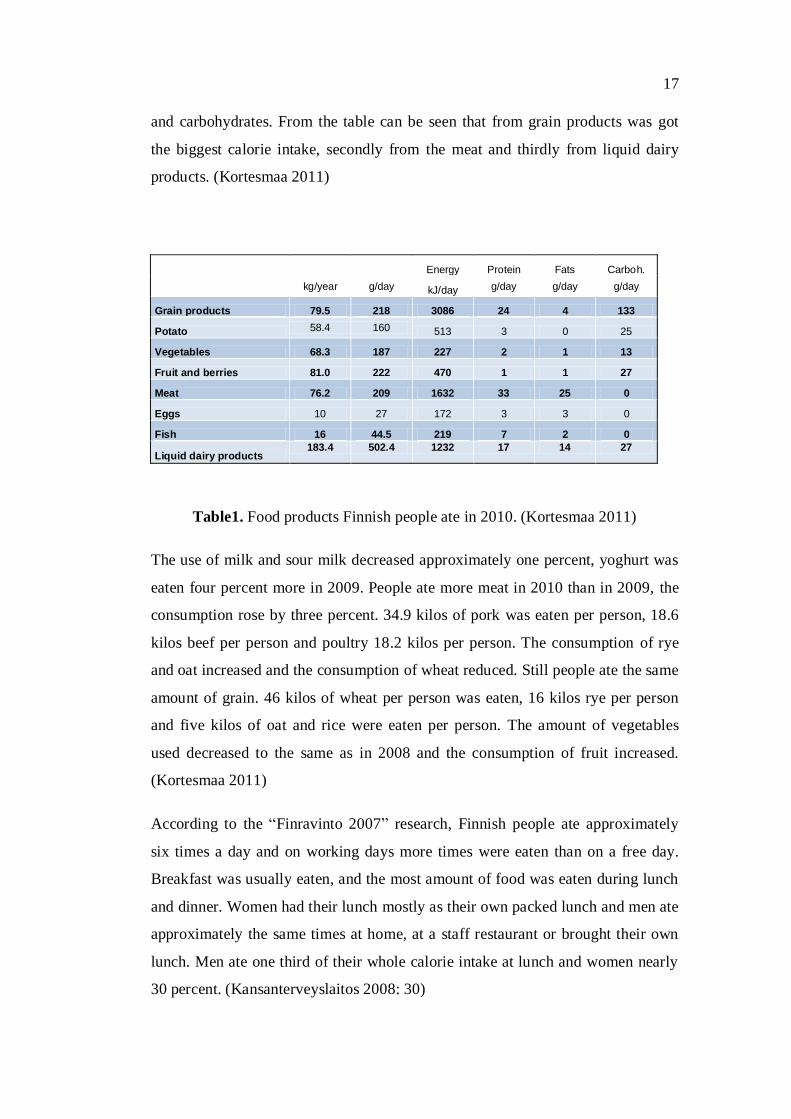
and carbohydrates. From the table can be seen that from grain products was got
the biggest calorie intake, secondly from the meat and thirdly from liquid dairy
products. (Kortesmaa 2011)
Energy Protein Fats Carboh.
kg/year g/day kJ/day g/day g/day g/day
Grain products 79.5 218 3086 24 4 133
Potato 58.4 160 513 3 0 25
Vegetables 68.3 187 227 2 1 13
Fruit and berries 81.0 222 470 1 1 27
Meat 76.2 209 1632 33 25 0
Eggs 10 27 172 3 3 0
Fish 16 44.5 219 7 2 0
Liquid dairy products 183.4 502.4 1232 17 14 27
Table1. Food products Finnish people ate in 2010. (Kortesmaa 2011)
The use of milk and sour milk decreased approximately one percent, yoghurt was
eaten four percent more in 2009. People ate more meat in 2010 than in 2009, the
consumption rose by three percent. 34.9 kilos of pork was eaten per person, 18.6
kilos beef per person and poultry 18.2 kilos per person. The consumption of rye
and oat increased and the consumption of wheat reduced. Still people ate the same
amount of grain. 46 kilos of wheat per person was eaten, 16 kilos rye per person
and five kilos of oat and rice were eaten per person. The amount of vegetables
used decreased to the same as in 2008 and the consumption of fruit increased.
(Kortesmaa 2011)
According to the ―Finravinto 2007‖ research, Finnish people ate approximately
six times a day and on working days more times were eaten than on a free day.
Breakfast was usually eaten, and the most amount of food was eaten during lunch
and dinner. Women had their lunch mostly as their own packed lunch and men ate
approximately the same times at home, at a staff restaurant or brought their own
lunch. Men ate one third of their whole calorie intake at lunch and women nearly
30 percent. (Kansanterveyslaitos 2008: 30)
18
2.5 Energy Consumption and Need
The human body needs energy because physical activity, warmth production and
cardinal metabolism use it. Most of the energy we get from nutrition is consumed
by the cardinal metabolism. Energy preserves in our system as fats, proteins and
carbohydrates which we get from the food. Most of the energy is preserved as fat,
and the proteins make the biggest fat free tissue. (Niemi 2006: 8)
The least amount that the human body consumes per day is 1200 kcal. Normally it
is 2000—3000 kcal per day among adults. Compared to normal people, athletes
who work out plenty can need energy up to 8000 kcal per day. This is because of
the physical activity. (Niemi 2006: 9)
2.6 Cardinal Metabolism
Vital actions such as heart and blood circulation, breathing, warmth and brain
function are functions that belong to cardinal metabolism; these actions can take
up to 80 percent of the whole energy consumption. Normally the body uses from
60 to 70 percent of the whole energy consumption. How much the body uses
energy with cardinal metabolism, depends on how much there is fatless tissue in
the body. The more muscle tissue, the bigger is the cardinal metabolism. Normal-
ly men have more muscle tissue in their body, so their energy consumption is
15—20 percent bigger than women. (Niemi 2006: 9)
When being overweight, more energy is used by the cardinal metabolism because
when the weight gets bigger, fatless tissue forms also. Opposite to this, when
weight is lost, the cardinal metabolism gets smaller. The metabolism decreases
because during the weight loss, fatless tissue among the fat, is lost. (Niemi 2006:
9)
Hormones affect the cardinal metabolism, for example thyroxin and age hormones
accelerate the metabolism. If you suffer from thyroid hypo function, metabolism
decreases and can cause weight gain. Also aging decelerates the metabolism,
muscle tissue diminishes, and in every ten years the metabolism slows down ap-
proximately by two percent. (Niemi 2006: 9—10)
19
Heavy smoking and heavy exercising accelerates the metabolism. The nicotine
has an effect of ten percent on the metabolism. After quitting smoking, metabol-
ism decelerates with 100—200 calories. Exercising has effects due to growth of
the muscle mass; one kilo of muscle mass consumes energy 12—15 calories per
day. (Niemi 2006: 10)
Cardinal metabolism is individual; two people with the same muscle tissue, age,
gender and weight can have totally different energy consumption. Heritage affects
metabolism which explains why others have a bigger risk of gaining weight.
(Niemi 2006: 11)
2.7 Production of Warmth Due Food
Digesting, absorbing, transporting, and storing of the food cause an energy loss
after eating for a couple of hours. This process is called the production of warmth
due to food. During dining the energy consumption is approximately ten percent
of the entire daily energy consumption. Energy received from proteins cause most
of the warmth; approximately 20 to 30 percent of the gotten energy is consumed
in warming. From the energy of carbohydrates five to ten percent of that causes
warmth. Fat storing does not need much energy so that is why it has the smallest
effect after eating, three to five percent. (Borg et al.: 2006: 39; Niemi 2006: 11—
12)
Increase of the warmth after eating is affected by the meal’s energy amount and
nutritional composition. Physical activity, person’s health, nutritional state and the
time have passed from the previous meal have significance to warmth production.
(Borg et al. 2006: 39; Niemi 2006: 11—12)
2.8 Energy Consumption Due to Physical Activity
Physical activity consists of all the activities during the day. Exercising during
free time does not affect much on consumption; greater impact has the activity
during leisure time and work. The whole energy consumption increases with five
percent per day when having a pre-planned exercise such as running or aerobics.
If the meaning is to lose weight by exercising should be focused on leisure and
20
work activity, also known as a functional exercise. (Borg et al. 2006: 41; Niemi
2006: 12)
Energy loss caused by physical activity is normally 20—30 percent of the whole
energy consumption. Power, duration, regularity, weight and physical shape af-
fects the amount of energy loss during an exercise. The energy consumption of
physical activity is often measured with the metabolic equivalent. The metabolic
equivalent refers to the energy consumption of resting. A metabolic equivalent
unit for resting is one. When we rest, the human body consumes one calorie per
kilo in an hour. The metabolic equivalent value for resting is one. When compar-
ing resting to standing up, standing consumes 2.5 times more energy than laying
down. When we stand, 2.5 times more energy is lost in the same time that if we
rested. Metabolic equivalent areas are from a light to a very heavy activity. Values
1—3 means light activity, 4—6 reasonable activity, 7—10 heavy activity and over
10 means very heavy activity. (Borg et al. 2006: 41; Niemi 2006: 13)
21
3 NUTRITION RECOMMENDATIONS
The Finnish Nutrition recommendations are based on the Nordic recommenda-
tions, newest are from 2005. During the year 2009 new recommendations started
to be collect, and they will be published in 2012. Nutrition recommendations have
been given to the population of Finland over 50 years of time by the National nu-
trition council. During this time, the recommendations have been almost the same,
apart from particularizing and changing of emphasis due to more research and
wider amount of living supplies. There has been a large debate about fat in Fin-
land recently, in the year 1980, consumption of fat was considered important, no-
wadays the quality is emphasized. (Haglund, Huupponen, Ventola & Hakala-
Lahtinen 2009: 10; Hyytinen, Mustajoki, Partanen, Sinisalo-Ojala 2009: 12; Val-
tion ravitsemus neuvottelukunta 2005)
Finnish nutrition recommendations consist of the preferred intake of the most im-
portant nutrients, which are carbohydrates, fats, proteins, vitamins and minerals.
These recommendations are for healthy, and a fair amount exercising people.
People who are also suffering from diseases such as diabetes type two with a high
blood pressure can use them as a guide for nutrition. The purpose of the recom-
mendations is to enhance and support the positive development of nutrition and
health. Recommendations are used for planning eating habits to a great amount of
people, teaching and a base for evaluation of the use of food and receiving nu-
trients. (Haglund et al. 2009: 10; Valtion ravitsemusneuvottelukunta 2005)
To maintain a good health, a stable and sufficient supply of nutrients should be
considered. Stabile energy intake and consumption are important too. Other issues
to observe is increasing the amount of fiber carbohydrates and lower the intake of
cleaned sugar. Hard fat should be consumed in small amounts and it should be
replaced with soft fat. The recommendations suggest that use of salt is reduced,
alcohol consumption is kept low, and time should be reserved for dining. Increas-
ing daily exercise to 30 minutes a day is also recommended. (Haglund et al. 2009:
11; Valtion ravitsemusneuvottelukunta 2005)
22
Time has had an effect on the recommendations, for example, over a hundred
years ago a high energy intake was essential. Compared to this day a diet needs to
be of a lower calorie intake. People do more office work and hard work is more
and more replaced with machines, due to this, people do not need as much energy
as before. (Hyytinen et al. 2009: 12; Valtion ravitsemusneuvottelukunta 2005)
3.1 Fat
In a good diet should always be fat included, and something that should be ex-
tremely taken into consideration is the quality of fat. There has been a lively de-
bate about fat in Finland in 2010 about its quality; some research says that hard fat
and animal fat are not as unhealthy in comparison with vegetable oils as earlier
believed. Some vegetable oils such as coconut oil and palm oil do not have better
fatty acids than animal based fat. Still as a general rule, vegetable fats are heal-
thier. (Aro 2008: 19; YLE news 2010)
According to the nutrition recommendations, the amount of fat should be 25—35
percent of the daily calorie intake. Of this percentage, hard fat should be 10 per-
cent. If a diet has plenty of hard fat in it, people will gain weight and have a risk to
contract diabetes type two, heart— and blood diseases, and some cancer types.
Hard fat is usually in milk products such as cheeses, ice cream and yoghurt as
well as in meat. People should favor soft fat in their diet; this fat type is received
from vegetable oils and margarine. In contrast to the nutrition recommendations,
there are also many low-carbohydrate diets that recommend using plenty of fat
and proteins instead of carbohydrates. One is for example very popular Atkins,
and these kinds of diets are not recommended by the National nutrition recom-
mendations. (Hyytinen et al. 2009: 21; Haglund et al. 2009: 33; Valtion ravitse-
musneuvottelukunta 2005; Laatikainen 2011)
Fat is needed because it is an important source of energy. It contains fat dissolving
vitamins and necessary fatty acids, and fat also covers from cold. Still it needs to
be remembered that one gram of fat contains 38 KJ/nine calories. Compared to
carbohydrates or protein, fat has over half more calories. Suitable amount of visi-
ble soft fat for adults is two tablespoons of turnip rape oil, which is the same as 10
23
teaspoons of margarine of 60 percent of fat or 17 teaspoons of margarine of 35
percent of fat. (Aro 2008: 13; Hyytinen et al. 2009: 21–22)
3.2 Proteins
Proteins are needed for building, regulation and transportation of tissues, and are
also an energy source. Proteins consist of 20 amino acids. Ten of the amino acids
are necessary which the human body cannot produce itself, so all of them need to
get from nutrition. The other amino acids which are not necessary can be received
from other amino acids or glucose byproducts. The amino acid order defines the
shape and function of the protein in the body. If one amino acid is missing or re-
placed, the impacts of the protein will change. (Niemi 2006: 28)
Proteins are needed for building the system; part of the amino acids are dispersed
and used for energy or stored as fat or carbohydrates. One gram of protein con-
tains four calories. The amount of protein in the daily calorie intake is 10-20 per-
cent. If the body does not receive enough proteins, this leads to Protein Energy
Malnutrition which is a rare decease in Finland. Growth and development slow
down, muscle and fat tissue reduce and the body is more exposed to infections, if
is not gotten enough proteins. (Haglund et al. 2009: 43–47)
The purpose of proteins is to build and maintain cells, build hormones, build anti-
dotes and enzymes of the immune system and functioning as an energy source.
Animal based food usually has all the right amino acids in a balanced proportion,
in vegetables are not plenty or at all the necessary amino acids. Good sources of
proteins are low-fat milk products, chicken, turkey, bean vegetables, fish and egg.
When consuming a vegetarian diet lack of proteins may be compensated with
seeds and nuts, soy is also a good source of protein. (Niemi 2006: 28–29)
It is not unhealthy to get more proteins than is recommended but if the amount is
larger than consumption, proteins convert to carbohydrates and cause gaining
weight. When is exercised plenty, the amount of proteins should be increased too.
During normal exercise the increase of protein amount is not necessary to consid-
er because then is necessary to eat more anyway. However, the loss of carbohy-
24
drates goes hand in hand with protein loss. There is no actual protein storage in
the human body so, if the body does not get enough carbohydrates or protein, it
will take it from the existing muscle tissue. (Niemi 2006: 29–31)
3.3 Carbohydrates
Potatoes, bread, pasta as well as berries and fruit have been a base for Finnish nu-
trition for a long period of time. One should get 50 to 60 percent of carbohydrates
in the daily calorie intake according to the nutritional recommendations. Similar
to proteins, one gram of carbohydrates has four calories. (Haglund et al. 2009:
26—27)
The main purpose of carbohydrates is to function as an energy source for cells and
take care of the glucose balance in blood circulation. They are also needed for fat
metabolism and if the body has received enough carbohydrates from the nutrition,
it saves proteins for other missions. Carbohydrates and proteins work together and
form important combinations for the system. The human brain as well as other
parts of the body needs carbohydrates as an energy source, after consuming of
carbohydrates, blood sugar rises approximately in half an hour. (Borg, Fogelholm,
Hiilloskorpi 2004: 37; Haglund et al. 2009: 43–47)
In 2002, the main source of carbohydrates was grain products. In this research as
grain products were also counted rice and pasta and the amount of whole calorie
intake was 50 percent. Vegetables and fruit do not have many carbohydrates in
them, and Finnish people do not eat many vegetables, furthermore when potato
does not count as a vegetable and fruit source the amount that people get carbohy-
drates from vegetables and fruit is approximately 20 percent. From milk products
and sugar was received around 10 percent of the daily calorie intake. (Borg et al.
2004: 34-35)
Glucose, fructose and galactose are monosaccharide units from which carbohy-
drates consist. These units can be either separate monosaccharide, disaccharide or
polysaccharide chains. Starch, glycogen and nutrition fiber are polysaccharides.
Monosaccharide and disaccharides are sugars; glucose, fructose and galactose,
25
disaccharide are pure sugar, lactose and maltose. Fruit, berries and honey contain
glucose and fructose. Lactose is in milk and milk products, but from long aged
cheeses the lactose has spread during the maturing. Sugar has a lot of energy and
no nutritional value; it absorbs quickly and raises blood sugar. It can eliminate
hunger for a small amount of time so if you try to lose weight, sugar is not good.
Sugar also wakes the feeling that you need to eat more. (Haglund et al. 2009: 27—
28)
3.4 Vitamins and Minerals
Protective nutrients; vitamins and minerals are needed for the energy gotten from
carbohydrates, proteins and fats to be used in the human system. Vitamins dis-
solve whether in water or fat, minerals are divided based on their daily need. Ma-
cro minerals are needed over 20 milligrams per day, and trace substances are
needed under 20 milligrams per day. Receiving all the protective nutrients needs
to be balanced, if gotten more or less than needed; it is harmful to the system. Mi-
nor deficiency of nutrients may be hard to notice, and severe deficiency causes
health damage or even death. If one is in a good nutritional state, an overdose of
nutrients is not good for the health and too much supply can be dangerous such as
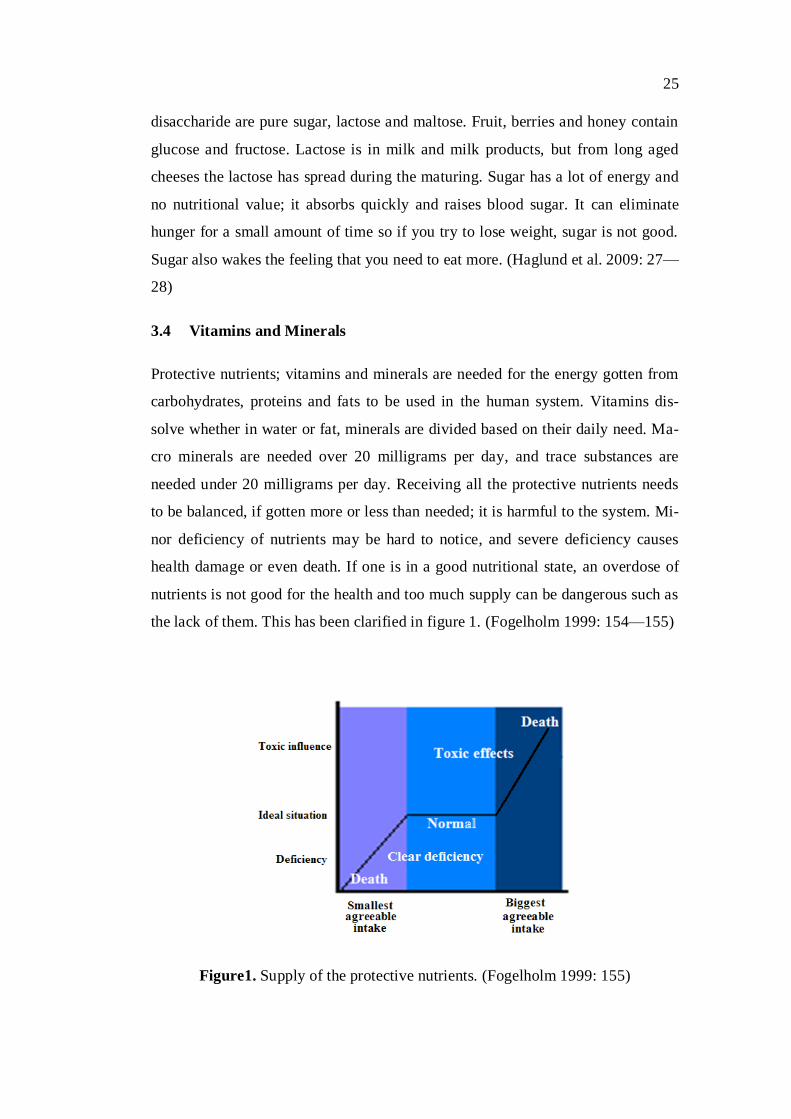
the lack of them. This has been clarified in figure 1. (Fogelholm 1999: 154—155)
Figure1. Supply of the protective nutrients. (Fogelholm 1999: 155)
26
Some vitamins and macro minerals are needed for preventing oxidation which is
caused by free radicals. When energy is produced in cells free radicals are born,
also for example smoking, pollution and long-term exercise cause more free radi-
cals. Antioxidants prevent oxidation and they are divided into two great groups;
vitamins gotten from directly food and enzymes that body itself produces from the
gotten food. E vitamin, C vitamin and beta-carotene; the pre state of vitamin A are
antioxidant vitamins. In order to get antioxidants should be eaten vegetables ver-
satile. (Fogelholm 1999: 156—157)
Vitamins are necessary organic unions that are needed for growth, sustaining life
and regulation of chemical reactions. Vitamins have to be received from food as
such, or in a form where they can transform into vitamins that function in the sys-
tem. The necessary vitamins for people are A-, D-, E-, K-, C- and B-vitamin.
(Haglund et al. 2009: 49)
Fat soluble vitamins dissolve according to their name in fats and fat solvents. If
one gets more of these vitamins than needed they are usually stored in the liver
and fat tissue. Because of the storing in tissue, the lack of fat soluble vitamins ap-
pears after months of minor receiving. A-, D-, E-, and K-vitamin are fat soluble
and they stand heating during cooking well. Water soluble vitamins dissolve in
water and do not preserve in the body due to this lack of these vitamins is easily
noticeable. Unlike fat soluble vitamins, water soluble does not stand heating, and
approximately 30 to 50 percent is lost during cooking. (Haglund et al. 2009: 50)
3.5 Typical National Deceases
The great significance for health is how you live your life; nutrition also is a great
part of a healthy lifestyle. If one wants to prevent long-term diseases, versatile,
and health nutrition is the key. Nonsmoking and sufficient physical activity sup-
ports preventing long-term diseases and helps to take care of them. Obesity is a
major risk for many long-term diseases. Diabetes, blood pressure, heart- and
blood vessel disease and cancer may be caused by being overweight and lack of a
healthy lifestyle. (Borg et al. 2004: 115—116; Niemi 2006: 72)
27
3.5.1 High Blood Pressure
Less than 40 percent of Finnish adults have their blood pressure at recommended
level. High blood pressure is one of the major risk factors to come down with
coronary heart disease, and high blood pressure is also a typical illness among
Finns. Inheritance and living conditions have an impact on blood pressure; high
intake of salt, obesity and greater use of alcohol are a couple of reasons for it.
Obesity is a cause of too much energy, with this extra energy is gotten too much
of salt also. The Natrium gotten from eating salt or salty food is the major reason
for high blood pressure. Exercising reduces blood pressure due to increase in en-
ergy consumption, losing weight and intensifying insulin functions. (Niemi 2006:
73—75)
3.5.2 Coronary Heart Disease
There are many factors that can cause coronary heart disease but there are three
major risk factors; high cholesterol, high blood pressure and smoking. Other in-
fluencing issues are overweight, diabetes and low physical activity. Although any
of the previously mentioned things were not powerful, when they are affecting
together can launch this decease. Coronary heart disease can begin during child-
hood. Clogging of the blood vessels is a slow incidence that can last for years or
decades. This is due to unhealthy lifestyles; too high energy intake and minor ex-
ercising. With healthy lifestyles can be prevented the decease and caring about it
if it is already started. Preventing coronary heart disease should be taken in con-
sideration amount of fat and cholesterol, the intake of salt, balance between ener-
gy intake and consumption and nonsmoking. (Niemi 2006: 80—82)
3.5.3 Cerebrovascular Accident
Cerebrovascular accidents as a cause of death has reduced in Finland, still they are
the third usual reason to die after the coronary heart disease and cancers. High
blood pressure is the most major risk factor to come down with this disease more-
over a high intake of alcohol, smoking and overweight affects. Healthy lifestyle is
a key factor preventing a stroke. As in coronary heart disease to prevent this dis-
28
ease, should be taken care of normal blood pressure the intake of salt, reasonable
use of alcohol, quitting smoking and use of fat. Also regularly exercising helps in
preventing it, and even moderate physical activity reduces risks. (Niemi 2006:
84—85)
3.5.4 Diabetes
There is type 1 diabetes and type 2 diabetes. Type 1 diabetes also known as juve-
nile-onset diabetes is usually contracted due to inheritance and immunological
factors which are not accurately examined till this day. As a treatment insulin
shots are taken and estimating the number of carbohydrates of eating food. (Hyy-
tinen et al. 2009: 50; Niemi 2006: 87)
Overweight and immobility are common causes for diabetes 2. The disease is also
affected by inheritance and is usually caught in middle-age or after. Type 2 di-
abetes has become a national decease and it is caught with nearly half a million of
Finns. (STT-info). Metabolic syndrome is a cardinal metabolic related syndrome
where are multiple health weakening factors simultaneously, and this is also a
great risk factor. Ways to prevent type 2 diabetes are living and eating healthy,
nonsmoking and reducing alcohol use. The last mentioned issues help also in the
treatment. A big waist, blood sugar, the blood’s fat values and blood pressure are
controlled and insulin shots are used in the treatment. A type 2 diabetic can eat
normal, high–in–fiber food. When eating according to the nutrition recommenda-
tions is this disease is effectively prevented. (Hyytinen et.al 2009: 57—58; Niemi
2006: 87—88)
3.5.5 Osteoporosis
When the density of bone structure has reduced, the state is called osteoporosis, as
a cause of this, bone fractures can appear easily. The bone structure grows strong-
er till the age of 20, after that decomposition of bones becomes faster than con-
struction. The strength that the bone is after the bone has stopped firming is af-
fected by the bone mass reached in childhood. To reach a higher top bone mass
29
one has to exercise regularly, get enough calcium, D-vitamin and avoid smoking.
(Niemi 2006: 90—92)
4 HEALTHY LUNCH OPTIONS
―Food portions that are eaten outside home have a great significance on
the healthiness of Finnish people’s diet. The lunch portion should contain
approximately one third of the daily energy intake. People who eat at staff
restaurants are studied to eat more recommendable food items such as fish,
vegetables, potatoes, berries and fruits.‖ (Valtion ravitsemusneuvottelu-
kunta 2005)
So, why could this not be possible also in a normal restaurant, one which provides
lunch? With this research I wanted to study if people are interested in that possi-
bility and eating healthy. Although in Martin Ravintola the lunch always has a
small green salad as a starter, the recommended amount of salads or side vegeta-
bles are not filled. (Valtion ravitsemusneuvottelukunta 2005)
I planned five healthy lunch portions to be used in Martin Ravintola. I used a Fin-
nish website ―kiloklubi.fi‖ to define the amount of proteins, carbohydrates and fat,
and base for my recipes were ―KuntoPlus‖ magazines. All recipes are made for
one person and are attached in the appendices. In the graphs of each dish the
amount of carbohydrates, proteins and fat both in grams and percentages is
shown.
In the lunch portions has been taken in consideration the amount of proteins, car-
bohydrates and fat. With these lunch portions water or nonfat milk is served as a
beverage and in addition two pieces of whole-grain bread. I wanted to keep the
portions simple and maintain the restaurant’s style, so I wanted to use the same
ingredients that are already used in the restaurant. The portions have many vege-
tables in them, and I planned a light sauce instead of the usual creamy one.
Although the recipes that I planned are low in number of calories, the bread and
the starter salad increases that. Salad consists of lettuce and pieces of tomato, cu-
30
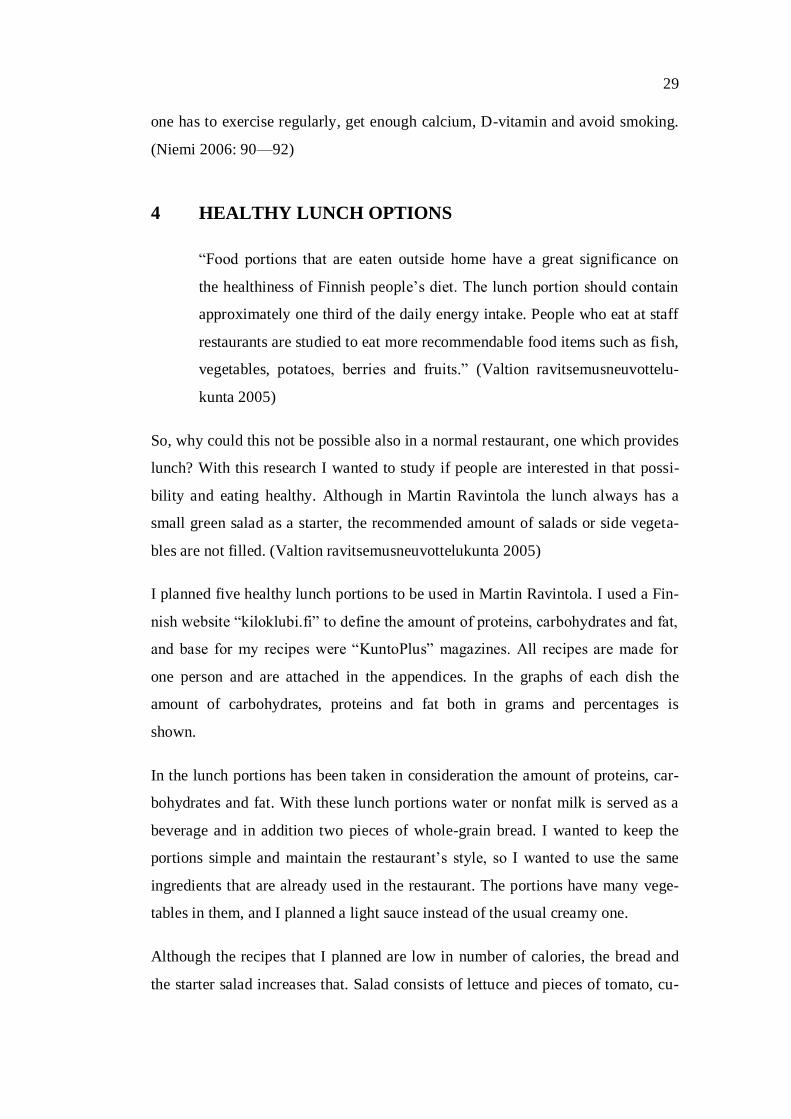
cumber and watermelon. From the salad is received 16 calories, from two slices of
wholegrain bread 155.4 calories, and from a glass of milk 70 calories. Altogether
from the salad, bread and milk is received 241.4 calories, and most calories con-
sist of carbohydrates. The nutritional values of milk, bread and the starter salad
are presented in table two.
Table2. Nutritional values of the restaurant’s accompaniments. (Fineli 2011)
Ingredient Amount Carboh. Protein Fat Calories
(g/dl) % % % (kcal)
Salad 100 g 50 % 20 % 11 % 16
Bread 60 g 77 % 11 % 8 % 155.4
Milk 2 dl 58 % 37 % 3 % 70
Sum. 241.4
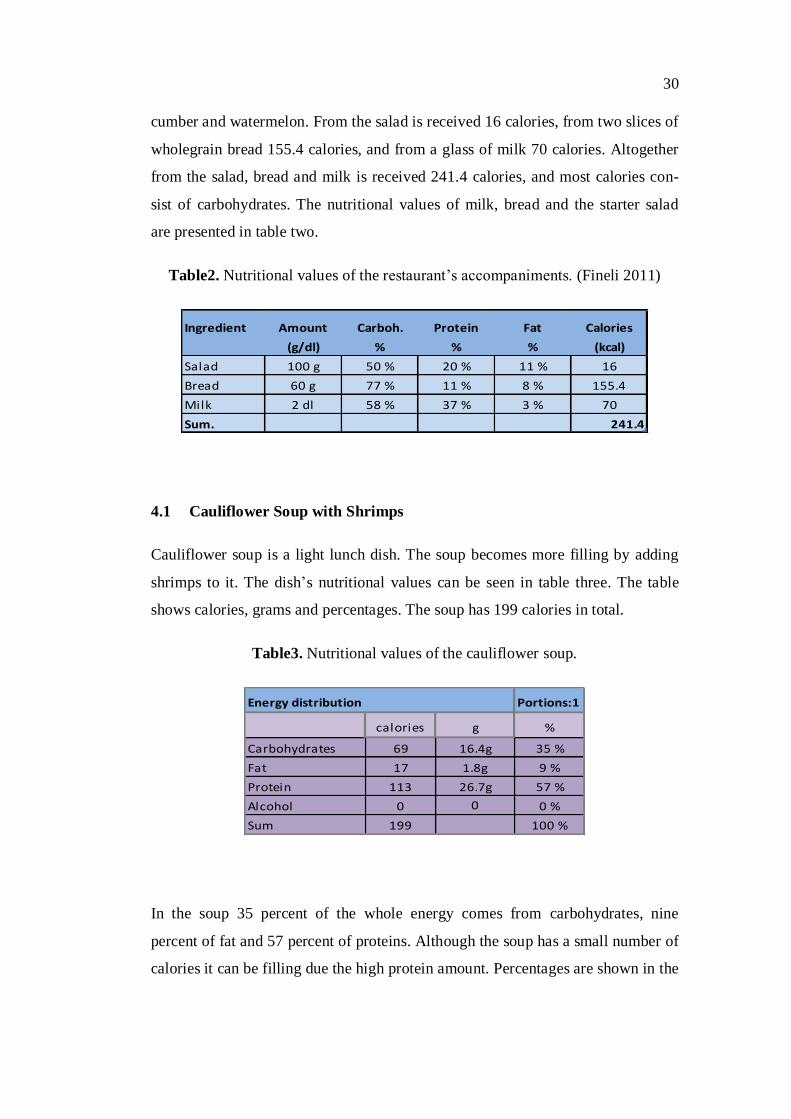
4.1 Cauliflower Soup with Shrimps
Cauliflower soup is a light lunch dish. The soup becomes more filling by adding
shrimps to it. The dish’s nutritional values can be seen in table three. The table
shows calories, grams and percentages. The soup has 199 calories in total.
Table3. Nutritional values of the cauliflower soup.
Energy distribution Portions:1
calories g %
Carbohydrates 69 16.4g 35 %
Fat 17 1.8g 9 %
Protein 113 26.7g 57 %
Alcohol 0 0 0 %
Sum 199 100 %
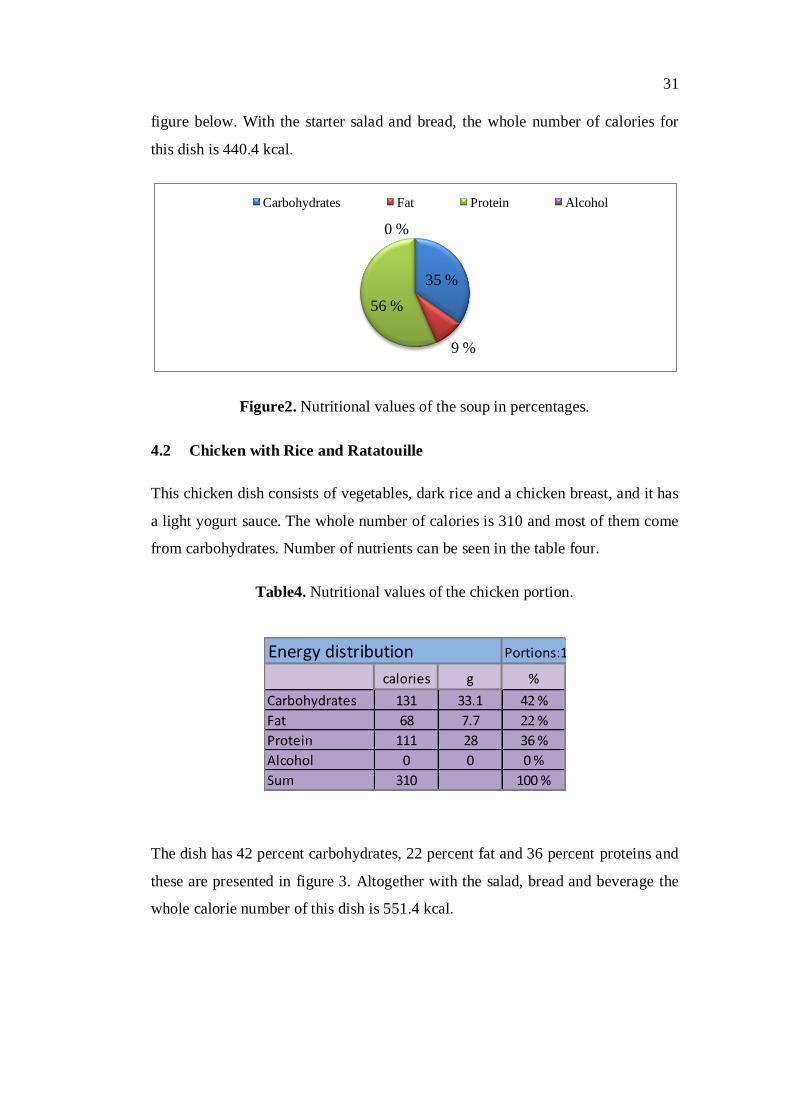
In the soup 35 percent of the whole energy comes from carbohydrates, nine
percent of fat and 57 percent of proteins. Although the soup has a small number of
calories it can be filling due the high protein amount. Percentages are shown in the
31
figure below. With the starter salad and bread, the whole number of calories for
this dish is 440.4 kcal.
Figure2. Nutritional values of the soup in percentages.
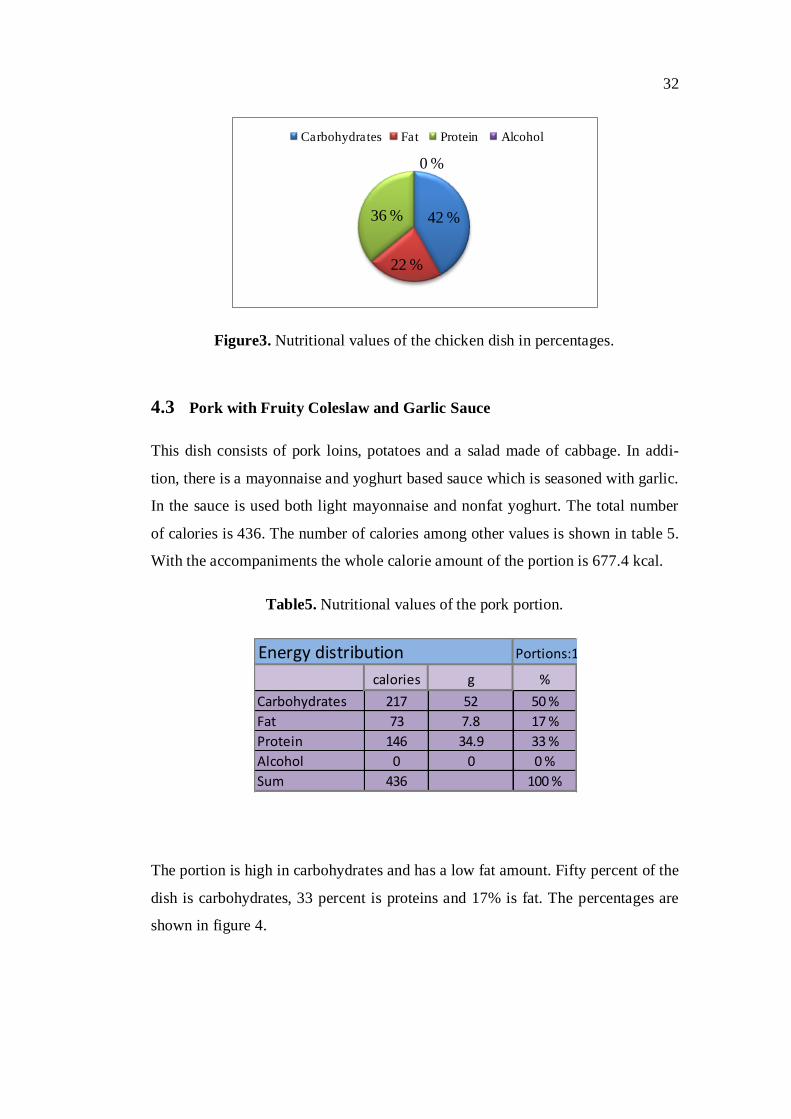
4.2 Chicken with Rice and Ratatouille
This chicken dish consists of vegetables, dark rice and a chicken breast, and it has
a light yogurt sauce. The whole number of calories is 310 and most of them come
from carbohydrates. Number of nutrients can be seen in the table four.
Table4. Nutritional values of the chicken portion.
The dish has 42 percent carbohydrates, 22 percent fat and 36 percent proteins and
these are presented in figure 3. Altogether with the salad, bread and beverage the
whole calorie number of this dish is 551.4 kcal.
35 %
9 %
56 %
0 %
Carbohydrates Fat Protein Alcohol
Energy distribution Portions:1
calories g %
Carbohydrates 131 33.1 42 %
Fat 68 7.7 22 %
Protein 111 28 36 %
Alcohol 0 0 0 %
Sum 310 100 %
32
42 %
22 %
36 %
0 %
Carbohydrates Fat Protein Alcohol
Figure3. Nutritional values of the chicken dish in percentages.
4.3 Pork with Fruity Coleslaw and Garlic Sauce
This dish consists of pork loins, potatoes and a salad made of cabbage. In addi-
tion, there is a mayonnaise and yoghurt based sauce which is seasoned with garlic.
In the sauce is used both light mayonnaise and nonfat yoghurt. The total number
of calories is 436. The number of calories among other values is shown in table 5.
With the accompaniments the whole calorie amount of the portion is 677.4 kcal.
Table5. Nutritional values of the pork portion.
The portion is high in carbohydrates and has a low fat amount. Fifty percent of the
dish is carbohydrates, 33 percent is proteins and 17% is fat. The percentages are
shown in figure 4.
Energy distribution Portions:1
calories g %
Carbohydrates 217 52 50 %
Fat 73 7.8 17 %
Protein 146 34.9 33 %
Alcohol 0 0 0 %
Sum 436 100 %
33
50 %
17 %
33 %
0 %
Carbohydrates Fat Protein Alcohol
Figure4. Nutritional values of the pork dish in percentages.
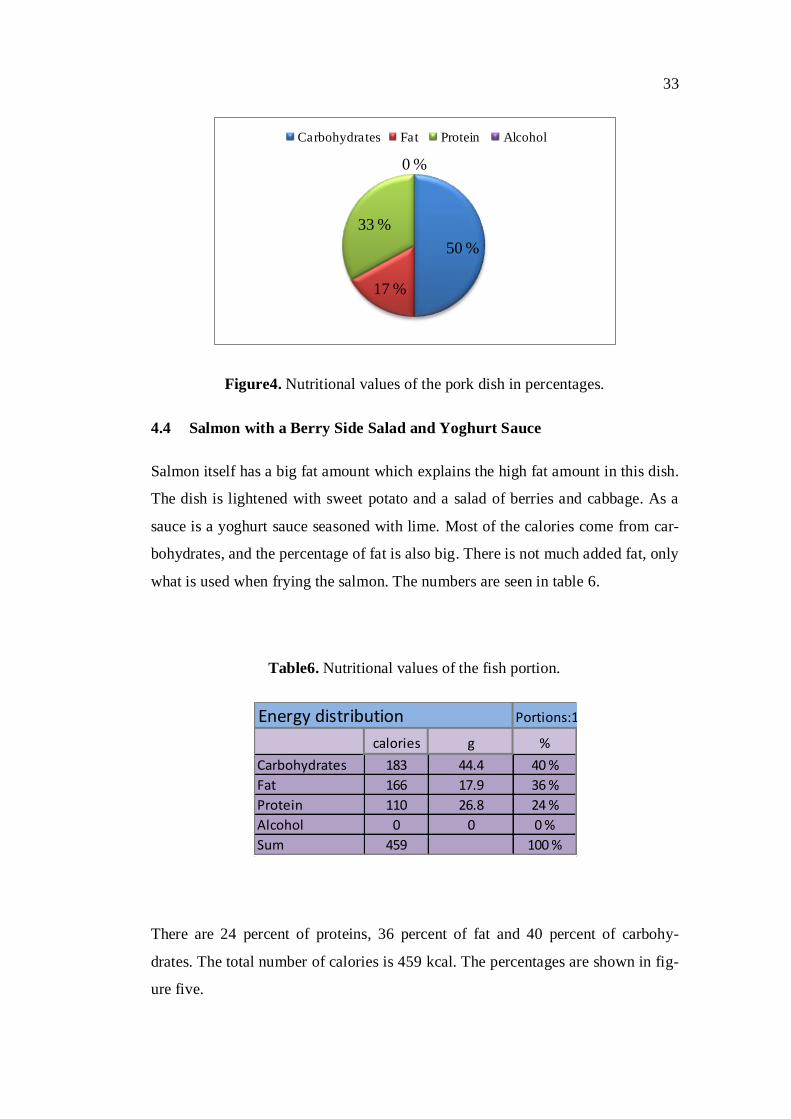
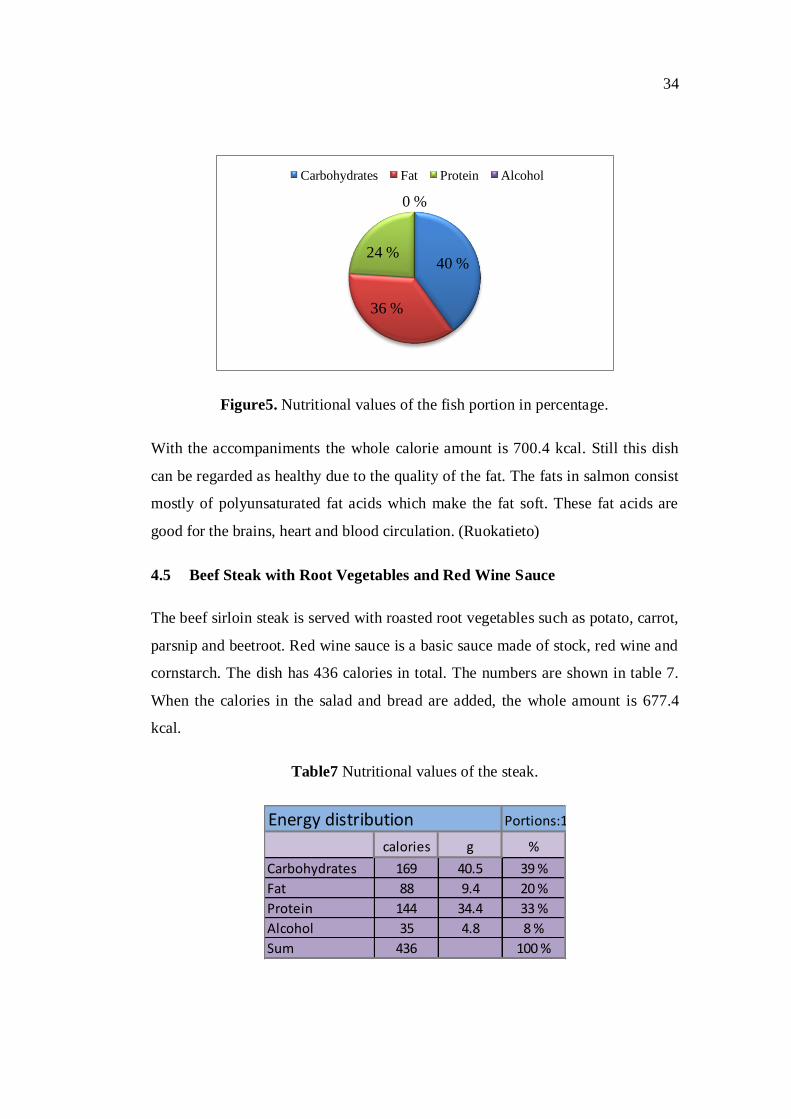
4.4 Salmon with a Berry Side Salad and Yoghurt Sauce
Salmon itself has a big fat amount which explains the high fat amount in this dish.
The dish is lightened with sweet potato and a salad of berries and cabbage. As a
sauce is a yoghurt sauce seasoned with lime. Most of the calories come from car-
bohydrates, and the percentage of fat is also big. There is not much added fat, only
what is used when frying the salmon. The numbers are seen in table 6.
Table6. Nutritional values of the fish portion.
There are 24 percent of proteins, 36 percent of fat and 40 percent of carbohy-
drates. The total number of calories is 459 kcal. The percentages are shown in fig-
ure five.
Energy distribution Portions:1
calories g %
Carbohydrates 183 44.4 40 %
Fat 166 17.9 36 %
Protein 110 26.8 24 %
Alcohol 0 0 0 %
Sum 459 100 %
34
Figure5. Nutritional values of the fish portion in percentage.
With the accompaniments the whole calorie amount is 700.4 kcal. Still this dish
can be regarded as healthy due to the quality of the fat. The fats in salmon consist
mostly of polyunsaturated fat acids which make the fat soft. These fat acids are
good for the brains, heart and blood circulation. (Ruokatieto)
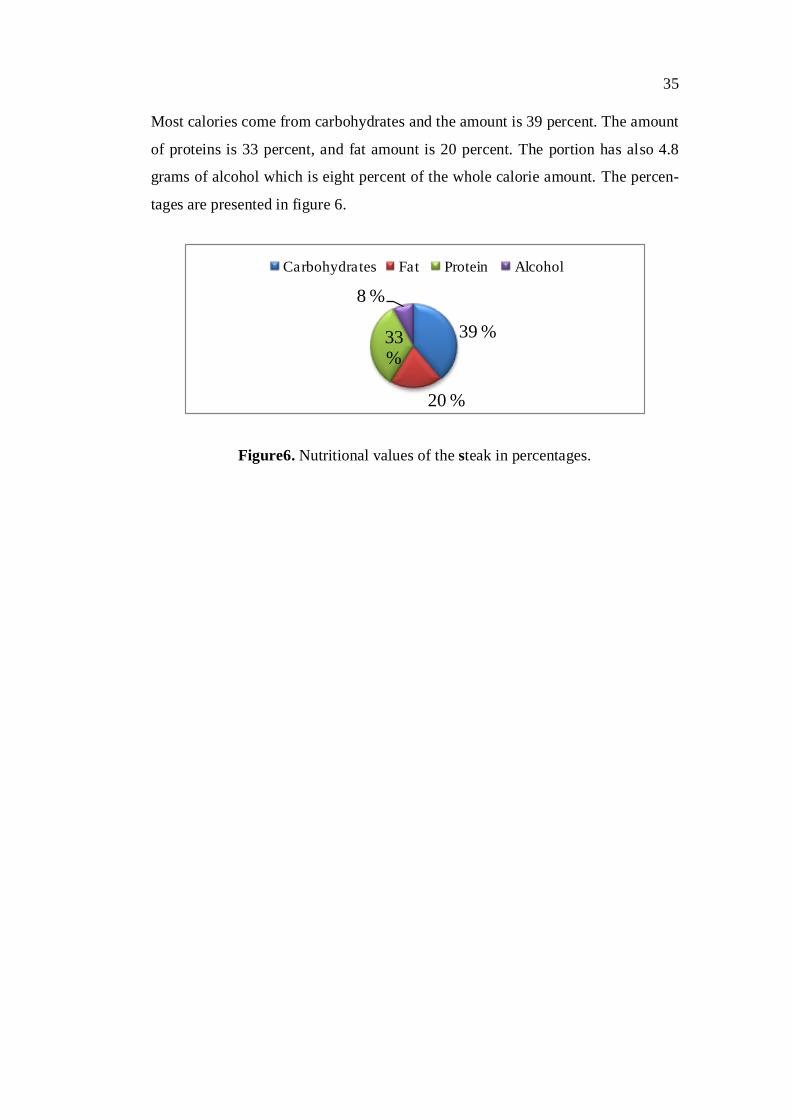
4.5 Beef Steak with Root Vegetables and Red Wine Sauce
The beef sirloin steak is served with roasted root vegetables such as potato, carrot,
parsnip and beetroot. Red wine sauce is a basic sauce made of stock, red wine and
cornstarch. The dish has 436 calories in total. The numbers are shown in table 7.
When the calories in the salad and bread are added, the whole amount is 677.4
kcal.
Table7 Nutritional values of the steak.
40 %
36 %
24 %
0 %
Carbohydrates Fat Protein Alcohol
Energy distribution Portions:1
calories g %
Carbohydrates 169 40.5 39 %
Fat 88 9.4 20 %
Protein 144 34.4 33 %
Alcohol 35 4.8 8 %
Sum 436 100 %
35
Most calories come from carbohydrates and the amount is 39 percent. The amount
of proteins is 33 percent, and fat amount is 20 percent. The portion has also 4.8
grams of alcohol which is eight percent of the whole calorie amount. The percen-
tages are presented in figure 6.
39 %
20 %
33 %
8 %
Carbohydrates Fat Protein Alcohol
Figure6. Nutritional values of the steak in percentages.

36
5 METHODOLOGY
As a research method I used combination of quantitative and qualitative methods.
I thought a questionnaire would be most suitable for collecting opinions about
healthy food because in that way I can get many results. The questionnaire was
also qualitative due there was an open question where people could write their
own answers.
5.1 Research Method
Research methods are ways to get material for empiric research. These research
methods can be classified as quantitative and qualitative. When choosing the re-
search method should be taken in consideration that the research question and
problem will be answered. (Saukkonen 2011)
When using the quantitative method, the results are observed and measurable. The
gotten results are in numbers and are often analyzed statistically. In quantitative
research all the respondents answer same questions, and a typical way to conduct
a quantitative research is to use a questionnaire. As a contrast, qualitative me-
thod’s results are the respondent’s own thoughts and feelings. The main difference
with these methods is that quantitative method measures issues and the purpose of
qualitative method is to understand something. Usually qualitative research is an
interview and done face- to-face. Choosing other of the research methods is de-
pendent on the goals of the research, but it is also believed that most useful results
are gotten when is used both of the methods. (DJS Research Ltd 2011)
5.2 Validity and Reliability
The quality and competency of the conclusions are evaluated with validity and
reliability; both are connected to the trustworthiness of the study as an information
provider. Reliability of the research means that the research is made in a way that
the gotten results can be repeated. A research can be considered as reliable if is
gotten the same result when repeating the research with another similar respon-
dent group. Things that can reduce the reliability of the study are for example if
the material is collected carelessly or there has been mistaken in calculating the
37
results. The results of my research can be regarded as reliable because I double
filled results to the SPSS program, and I translated customers’ own answers word
by word. However, having a bigger target group would have increased the relia-
bility of my research. (Saukkonen 2011)
Validity means that the purpose of the research has achieved in a way that from
the research was founded out what was wanted to study. The results I got from the
respondents answered my research question well. In the questionnaire was one
question that gave a direct answer for my research question. My research problem
was solved with the theoretical part. Also testing the questionnaire increases the
validity of my study. (Saukkonen 2011)
5.3 Data Collection Method
I collected the data for my thesis in two ways. In the theoretical part books about
nutrition and exercise, websites related to nutrition and research about health were
used. For my healthy lunch portions I searched for information from health related
magazines and Internet recipe sites. The empirical data was collected by primary
research which was a questionnaire regarding customers of Martin Ravintola.
I did my questionnaire in Finnish, Swedish and English regarding the customers
of Martin Ravintola. The questionnaire was tested by six different aged people
from my vicinity. All questions in the questionnaire were understood correctly
during the testing. I agreed with the restaurant’s owner the days when I could
come to implement the questionnaire. The weekdays we settled were Thursday
and Friday which are usually the days when comes most lunch customers. I per-
sonally asked the lunch customers to fill out the questionnaire when they waited
for the main course. The gotten results were analyzed with Microsoft Excel and
SPSS statistics.
5.4 Questionnaire
My questionnaire had two pages and consisted of three parts; eating habits, inter-
est in healthy food and lunch’s effect on weight. I addition there were one open
38
question and one free comment opportunity. First, in the questionnaire were asked
basic details; age, gender and type of work.
5.5 Eating Habits
In the eating habits part I asked how many times people eat in a day and what
meals they eat. With this question I wanted to find out if people eat according to
nutritional recommendations where is suggested to eat multiple times a day and
regularly. I also wanted to know if their biggest meal is either breakfast, lunch,
dinner or another option. In the food pyramid is recommended how much you
should eat different food items such as meat products, vegetables and fruit, milk
products, grain products, potatoes and fat. I asked what of these items they eat the
most and asked people to range them in their eating amount order. This way I
could find out if they eat by food pyramid’s suggestions. The final question in the
eating habits part was that what effects on their choice of lunch restaurant. The
options to choose between were: location, price, healthiness, staff, taste or friends
and respondents rated these according to what affects the most. By this I was cu-
rious how many selected their primary choice as healthiness.
5.6 Interest in Healthy Food
In the interest in healthy food section I asked if the respondents are interested in
eating healthy and if they are what the reason is. I gave choices to choose between
and an opportunity to write their own other reason. My choices were appearance,
disease, weight and to keep in shape. My goal here was to find out if they eat heal-
thily because of their own willingness, or if they should eat healthily due to a dis-
ease or other reasons. Other questions in this section were if respondents think
that they eat healthily and an open question where they could write what they con-
sider as healthy food.
5.7 Lunch’s Effect on Weight
The lunch’s effect on the weight part was about lunch portions and exercising. I
asked what they preferred as a lunch option and gave answers possibilities. With
this I wanted to know if they rather eat a big portion or light portion for lunch.
39
Another question was that if they have skipped lunch, what they replaced it with.
The aim was to find out if they replace lunch with small snacks or nothing. The
final questions were about exercising. I wanted to know if they exercise regularly
and how. It is recommended to exercise at least half an hour a day in a week and I
asked how many times they do that. One recommended thing is also practiced
useful exercise and I asked if they practice that. Last part in the questionnaire was
an open feedback part where respondents could write their own comments about
food, survey or wishes.
40
6 DATA ANALYSIS
Normally the customer amount for one day in Martin Ravintola is approximately
30 to 40 people. In two days I expected to receive over 50 filled questionnaires.
However, I received only 39 answers due to a small customer number in those two
days and there were some people who refused to participate in the survey. Be-
cause my target group was customers of Martin Ravintola, I did not start to collect
more answers from other restaurants or elsewhere. When taking into consideration
that the restaurant itself has 40 customer seats, 39 answers is comprehensive.
There were people who marked their age themselves because I had given age
groups that ended to 60. When analyzing the results I made a new age group: aged
over 60. There also were some missing answers on questions about the age and
type of work.
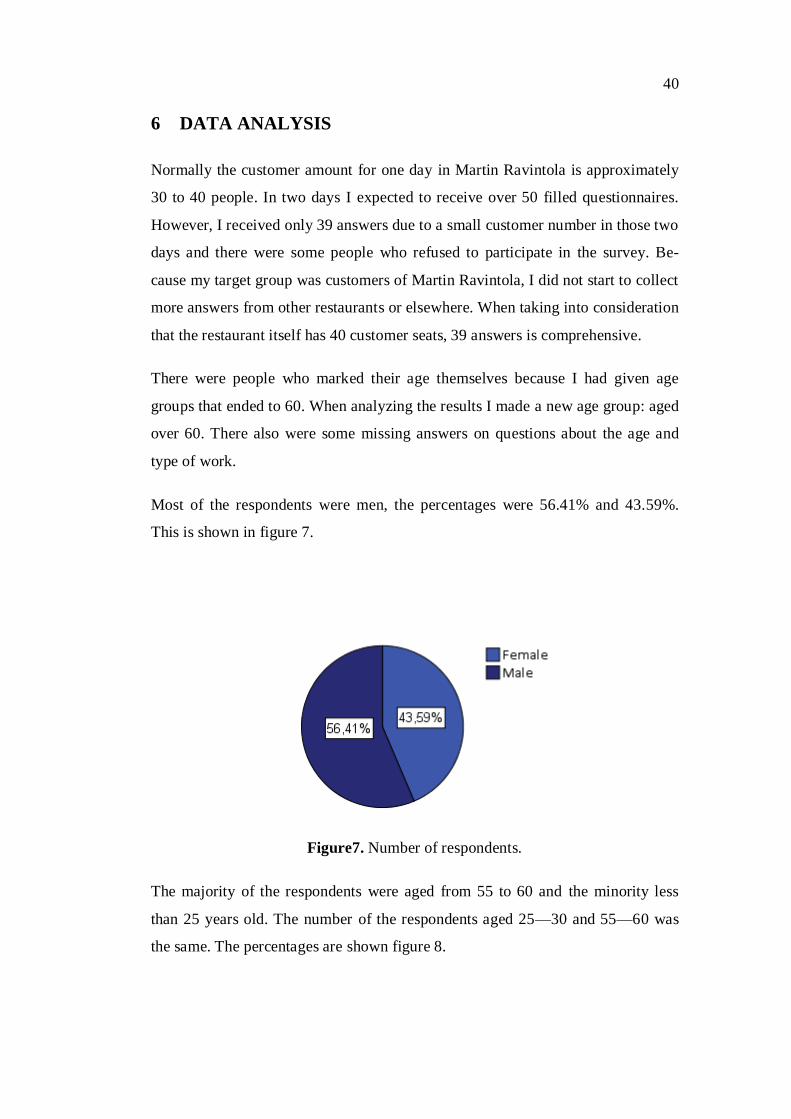
Most of the respondents were men, the percentages were 56.41% and 43.59%.
This is shown in figure 7.
Figure7. Number of respondents.
The majority of the respondents were aged from 55 to 60 and the minority less
than 25 years old. The number of the respondents aged 25—30 and 55—60 was
the same. The percentages are shown figure 8.
41
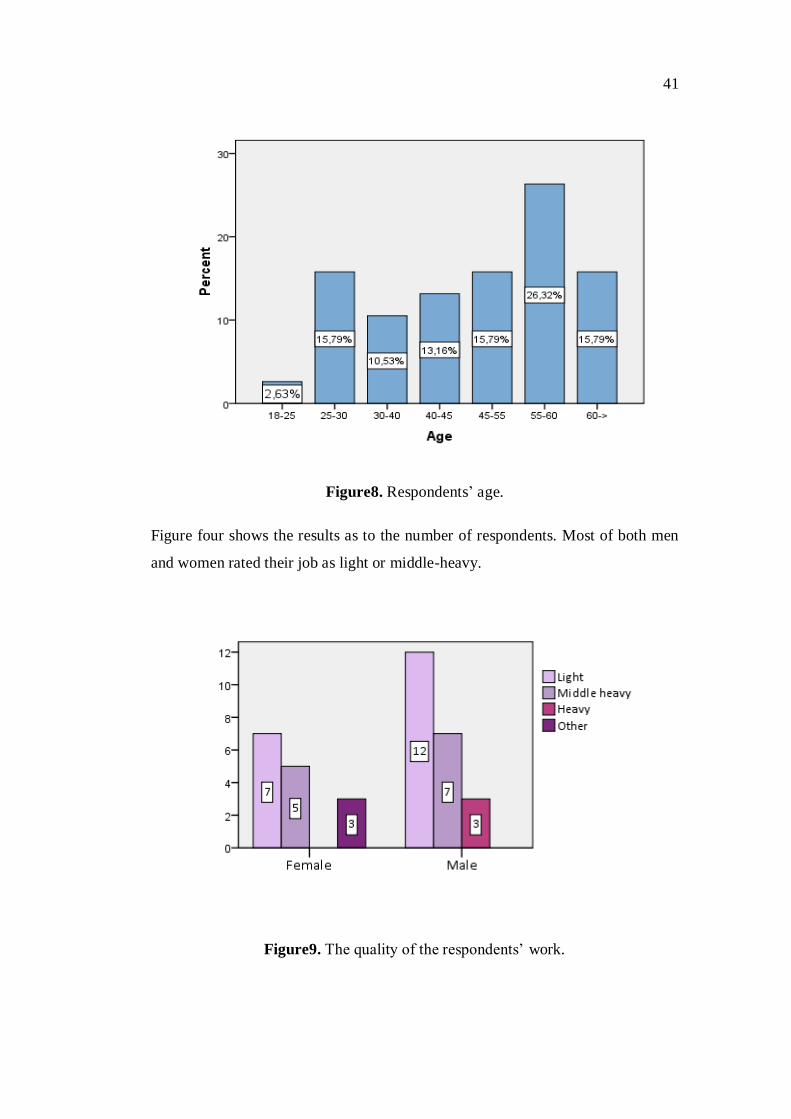
Figure8. Respondents’ age.
Figure four shows the results as to the number of respondents. Most of both men
and women rated their job as light or middle-heavy.
Figure9. The quality of the respondents’ work.
42
Altogether 19 of the respondents thought their job as light and 12 as middle-
heavy. Therefore, most of the customers have office work. Only three people rated
their job as heavy, and three respondents answered other. Two persons left the
question unanswered. Because there were people over 60 years old, they can be
people who are retired.
6.1 Eating Habits
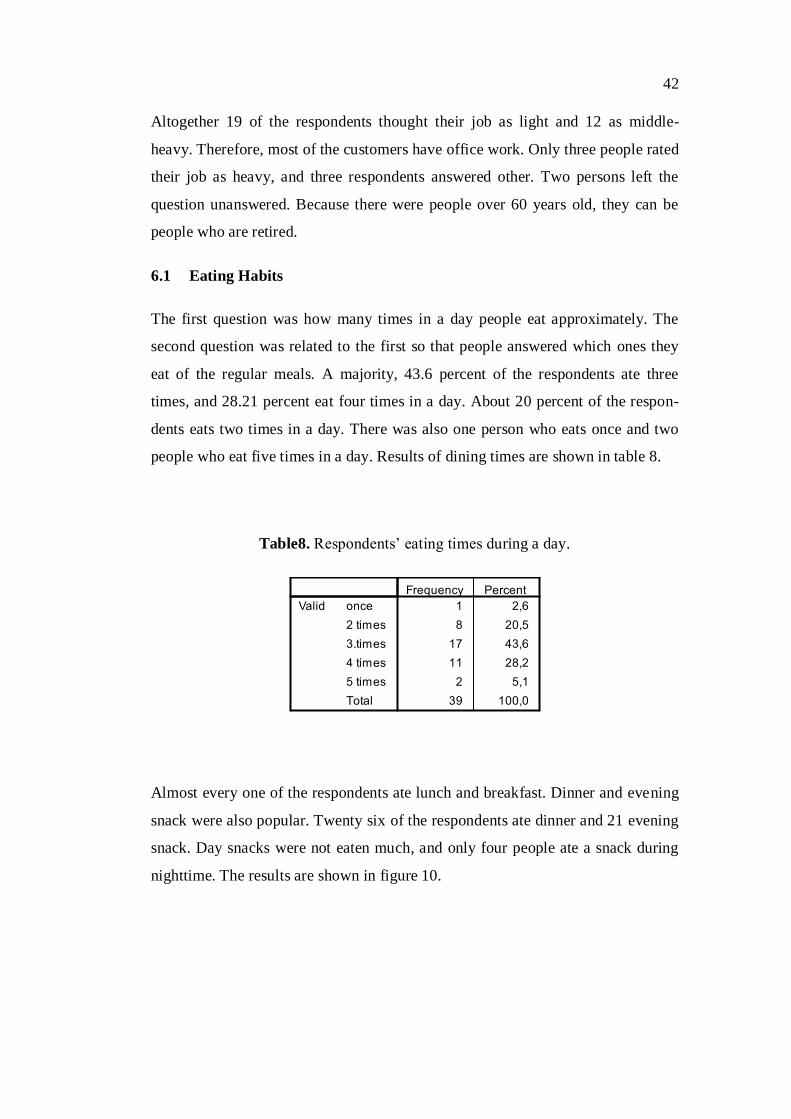
The first question was how many times in a day people eat approximately. The
second question was related to the first so that people answered which ones they
eat of the regular meals. A majority, 43.6 percent of the respondents ate three
times, and 28.21 percent eat four times in a day. About 20 percent of the respon-
dents eats two times in a day. There was also one person who eats once and two
people who eat five times in a day. Results of dining times are shown in table 8.
Table8. Respondents’ eating times during a day.
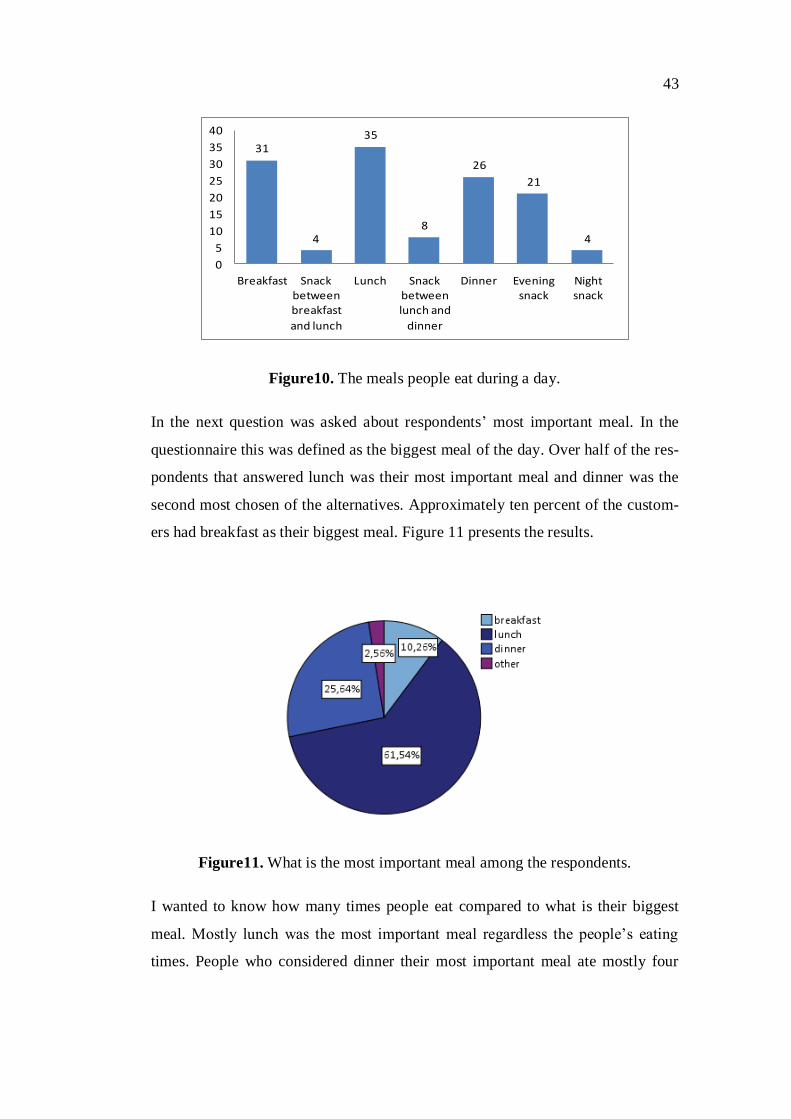
Almost every one of the respondents ate lunch and breakfast. Dinner and evening
snack were also popular. Twenty six of the respondents ate dinner and 21 evening
snack. Day snacks were not eaten much, and only four people ate a snack during
nighttime. The results are shown in figure 10.
43
31
4
35
8
26
21
4
0
5
10
15
20
25
30
35
40
Breakfast Snack between breakfast
and lunch
Lunch Snack between lunch and
dinner
Dinner Evening snack
Night snack
Figure10. The meals people eat during a day.
In the next question was asked about respondents’ most important meal. In the
questionnaire this was defined as the biggest meal of the day. Over half of the res-
pondents that answered lunch was their most important meal and dinner was the
second most chosen of the alternatives. Approximately ten percent of the custom-
ers had breakfast as their biggest meal. Figure 11 presents the results.
Figure11. What is the most important meal among the respondents.
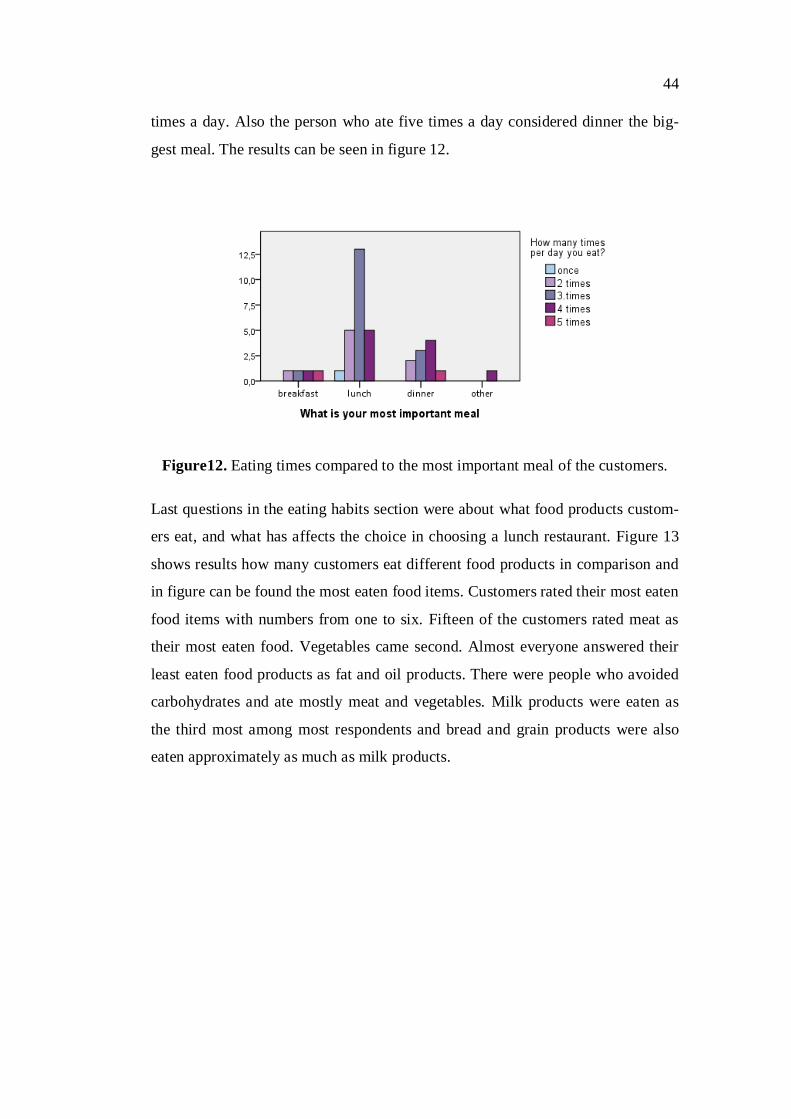
I wanted to know how many times people eat compared to what is their biggest
meal. Mostly lunch was the most important meal regardless the people’s eating
times. People who considered dinner their most important meal ate mostly four
44
times a day. Also the person who ate five times a day considered dinner the big-
gest meal. The results can be seen in figure 12.
Figure12. Eating times compared to the most important meal of the customers.
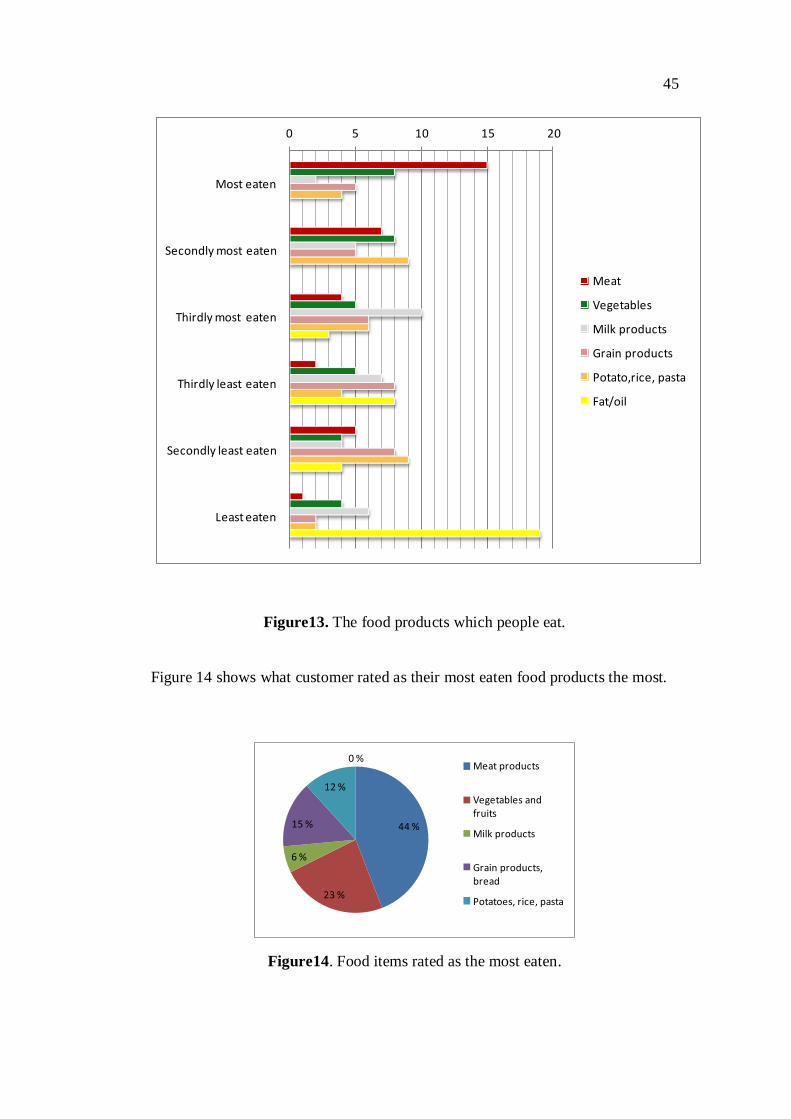
Last questions in the eating habits section were about what food products custom-
ers eat, and what has affects the choice in choosing a lunch restaurant. Figure 13
shows results how many customers eat different food products in comparison and
in figure can be found the most eaten food items. Customers rated their most eaten
food items with numbers from one to six. Fifteen of the customers rated meat as
their most eaten food. Vegetables came second. Almost everyone answered their
least eaten food products as fat and oil products. There were people who avoided
carbohydrates and ate mostly meat and vegetables. Milk products were eaten as
the third most among most respondents and bread and grain products were also
eaten approximately as much as milk products.
45
0 5 10 15 20
Most eaten
Secondly most eaten
Thirdly most eaten
Thirdly least eaten
Secondly least eaten
Least eaten
Meat
Vegetables
Milk products
Grain products
Potato,rice, pasta
Fat/oil
Figure13. The food products which people eat.
Figure 14 shows what customer rated as their most eaten food products the most.
44 %
23 %
6 %
15 %
12 %
0 %Meat products
Vegetables and fruits
Milk products
Grain products, bread
Potatoes, rice, pasta
Figure14. Food items rated as the most eaten.
46
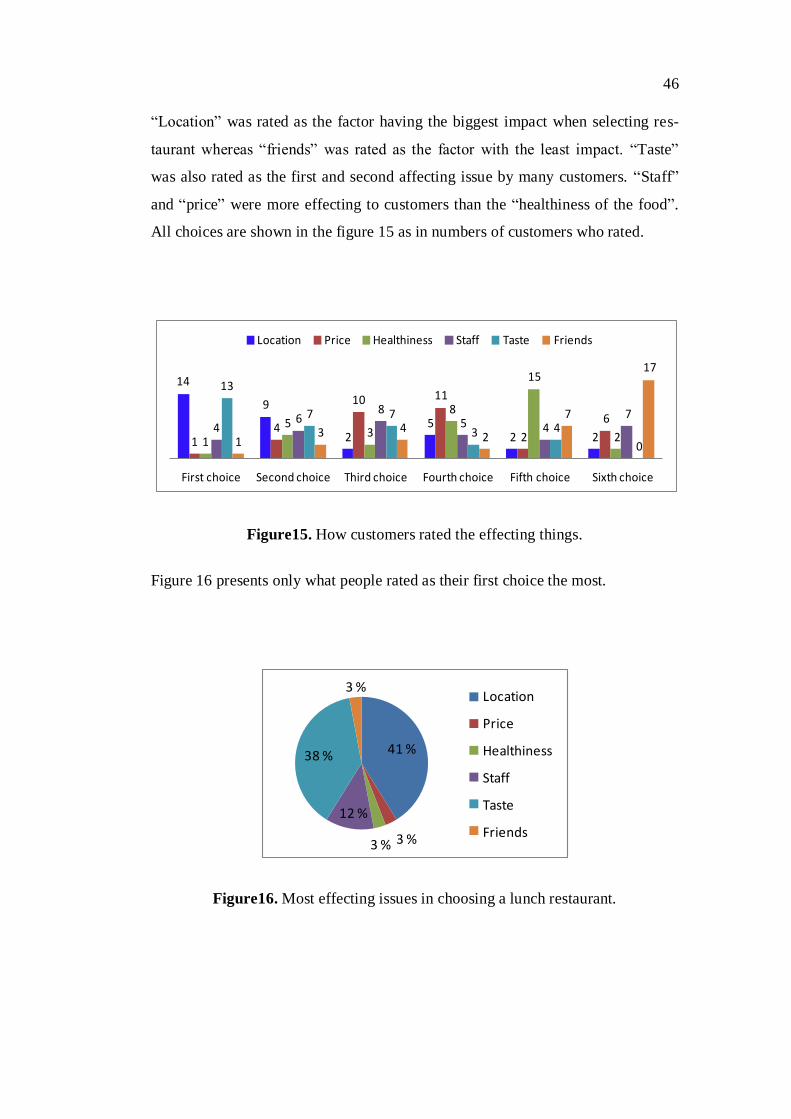
―Location‖ was rated as the factor having the biggest impact when selecting res-
taurant whereas ―friends‖ was rated as the factor with the least impact. ―Taste‖
was also rated as the first and second affecting issue by many customers. ―Staff‖
and ―price‖ were more effecting to customers than the ―healthiness of the food‖.
All choices are shown in the figure 15 as in numbers of customers who rated.
14
9
25
2 214
10 11
2
6
1
53
8
15
24
68
5 47
13
7 7
3 4
013 4
2
7
17
First choice Second choice Third choice Fourth choice Fifth choice Sixth choice
Location Price Healthiness Staff Taste Friends
Figure15. How customers rated the effecting things.
Figure 16 presents only what people rated as their first choice the most.
41 %
3 %3 %
12 %
38 %
3 %Location
Price
Healthiness
Staff
Taste
Friends
Figure16. Most effecting issues in choosing a lunch restaurant.
47
6.2 Interest in Healthy Food
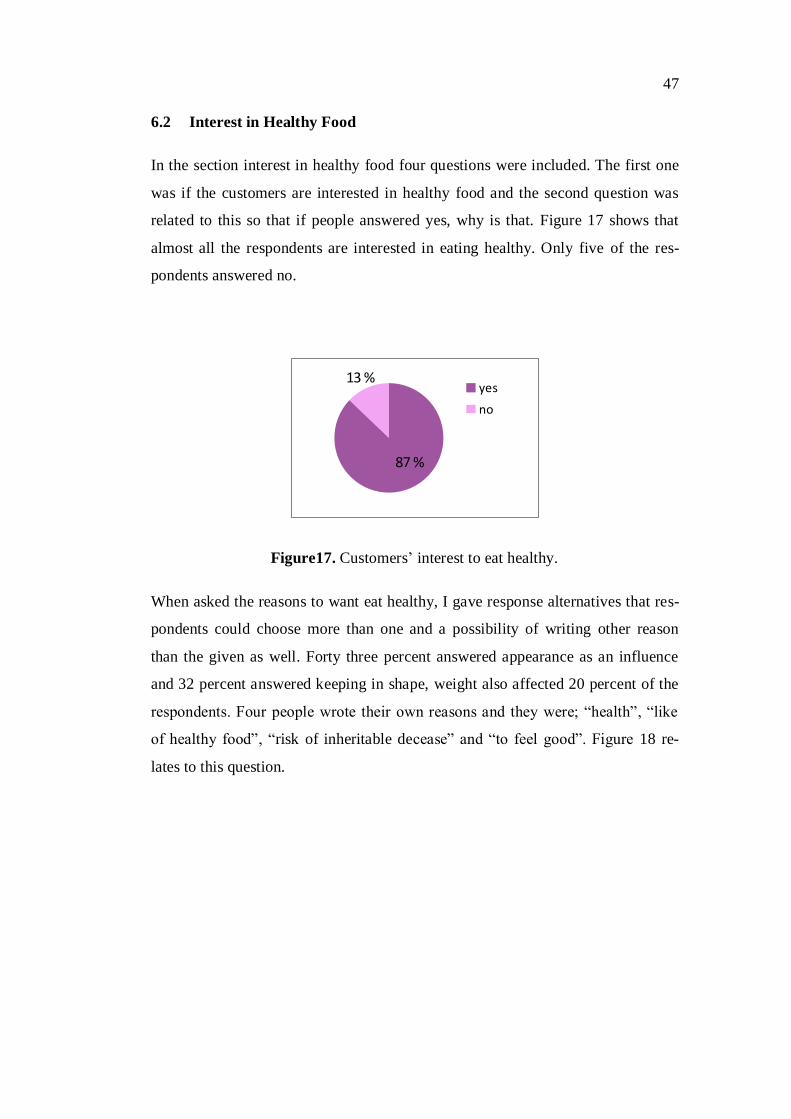
In the section interest in healthy food four questions were included. The first one
was if the customers are interested in healthy food and the second question was
related to this so that if people answered yes, why is that. Figure 17 shows that
almost all the respondents are interested in eating healthy. Only five of the res-
pondents answered no.
87 %
13 %yes
no
Figure17. Customers’ interest to eat healthy.
When asked the reasons to want eat healthy, I gave response alternatives that res-
pondents could choose more than one and a possibility of writing other reason
than the given as well. Forty three percent answered appearance as an influence
and 32 percent answered keeping in shape, weight also affected 20 percent of the
respondents. Four people wrote their own reasons and they were; ―health‖, ―like
of healthy food‖, ―risk of inheritable decease‖ and ―to feel good‖. Figure 18 re-
lates to this question.
48
43 %
5 %
20 %
32 %
Appearance
Decease
Weight
Keep in shape
Figure18. Customers’ reasons to eat healthy.
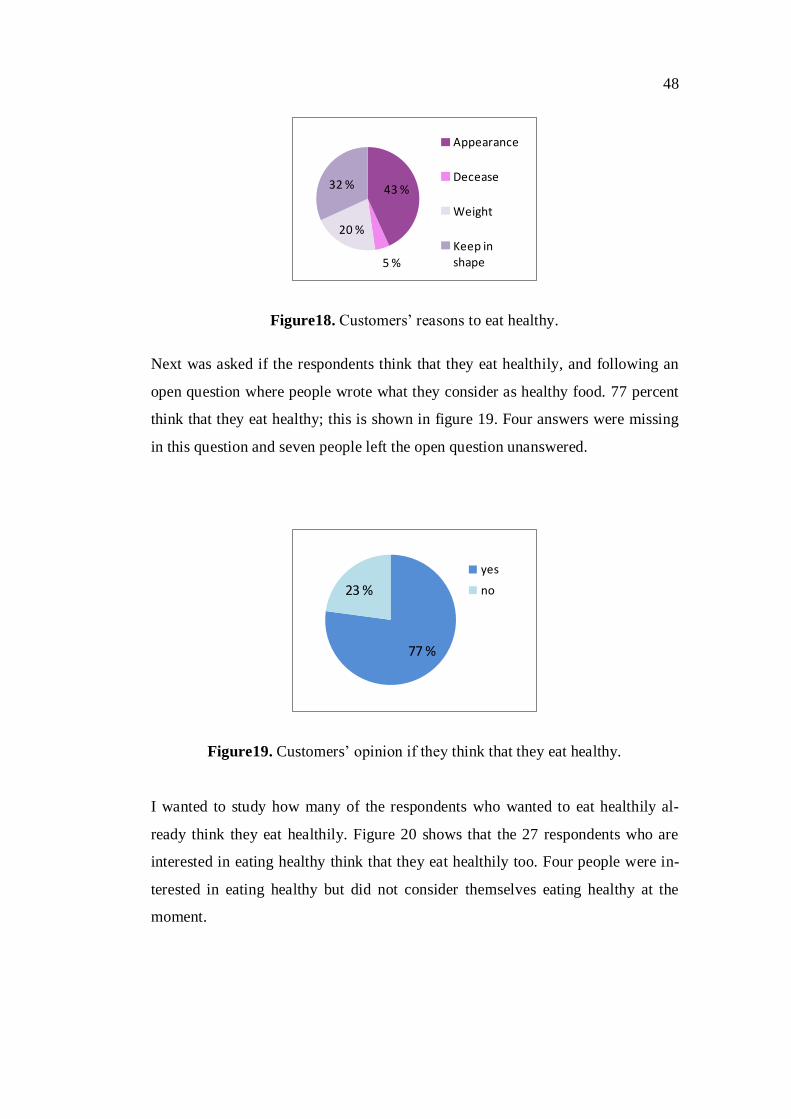
Next was asked if the respondents think that they eat healthily, and following an
open question where people wrote what they consider as healthy food. 77 percent
think that they eat healthy; this is shown in figure 19. Four answers were missing
in this question and seven people left the open question unanswered.
77 %
23 %
yes
no
Figure19. Customers’ opinion if they think that they eat healthy.
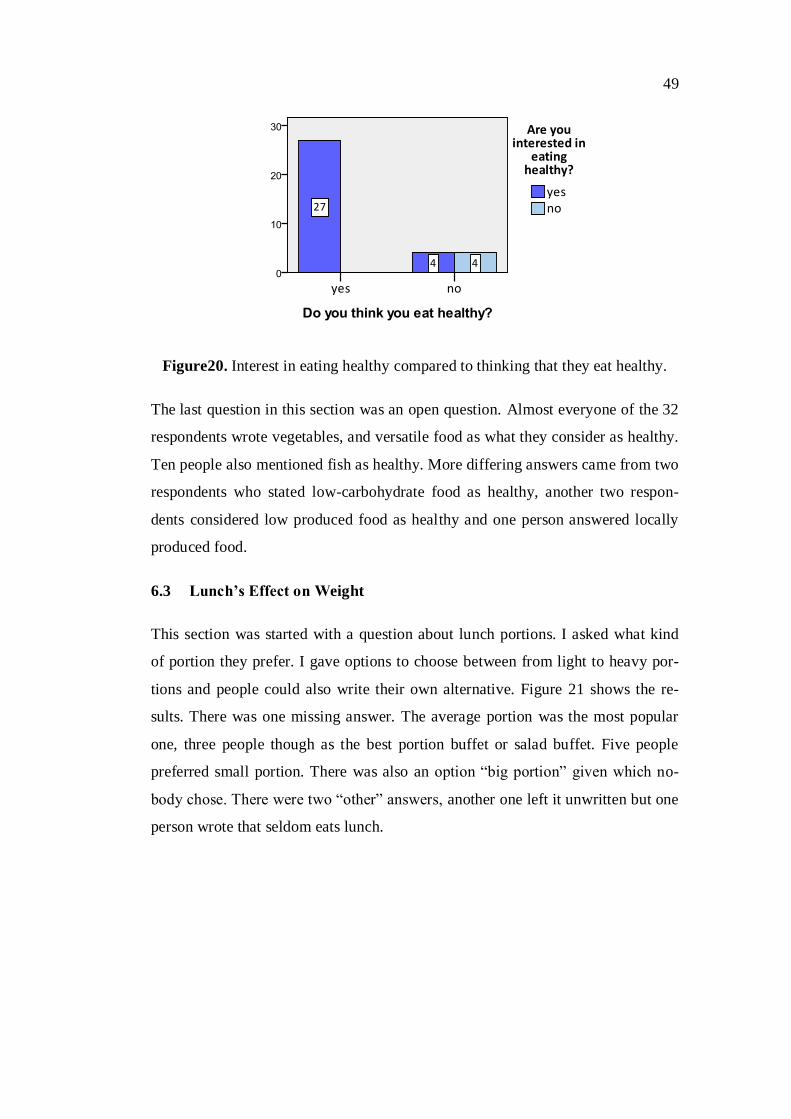
I wanted to study how many of the respondents who wanted to eat healthily al-
ready think they eat healthily. Figure 20 shows that the 27 respondents who are
interested in eating healthy think that they eat healthily too. Four people were in-
terested in eating healthy but did not consider themselves eating healthy at the
moment.
49
Figure20. Interest in eating healthy compared to thinking that they eat healthy.
The last question in this section was an open question. Almost everyone of the 32
respondents wrote vegetables, and versatile food as what they consider as healthy.
Ten people also mentioned fish as healthy. More differing answers came from two
respondents who stated low-carbohydrate food as healthy, another two respon-
dents considered low produced food as healthy and one person answered locally
produced food.
6.3 Lunch’s Effect on Weight
This section was started with a question about lunch portions. I asked what kind
of portion they prefer. I gave options to choose between from light to heavy por-
tions and people could also write their own alternative. Figure 21 shows the re-
sults. There was one missing answer. The average portion was the most popular
one, three people though as the best portion buffet or salad buffet. Five people
preferred small portion. There was also an option ―big portion‖ given which no-
body chose. There were two ―other‖ answers, another one left it unwritten but one
person wrote that seldom eats lunch.
50
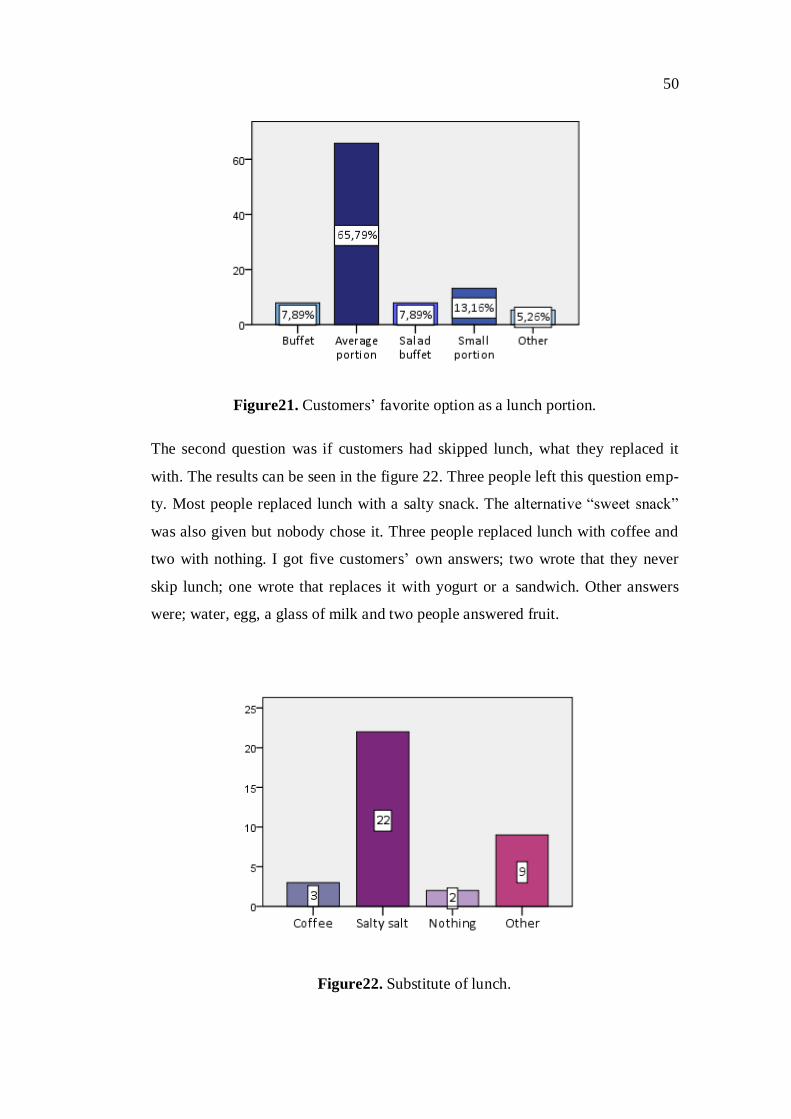
Figure21. Customers’ favorite option as a lunch portion.
The second question was if customers had skipped lunch, what they replaced it
with. The results can be seen in the figure 22. Three people left this question emp-
ty. Most people replaced lunch with a salty snack. The alternative ―sweet snack‖
was also given but nobody chose it. Three people replaced lunch with coffee and
two with nothing. I got five customers’ own answers; two wrote that they never
skip lunch; one wrote that replaces it with yogurt or a sandwich. Other answers
were; water, egg, a glass of milk and two people answered fruit.
Figure22. Substitute of lunch.
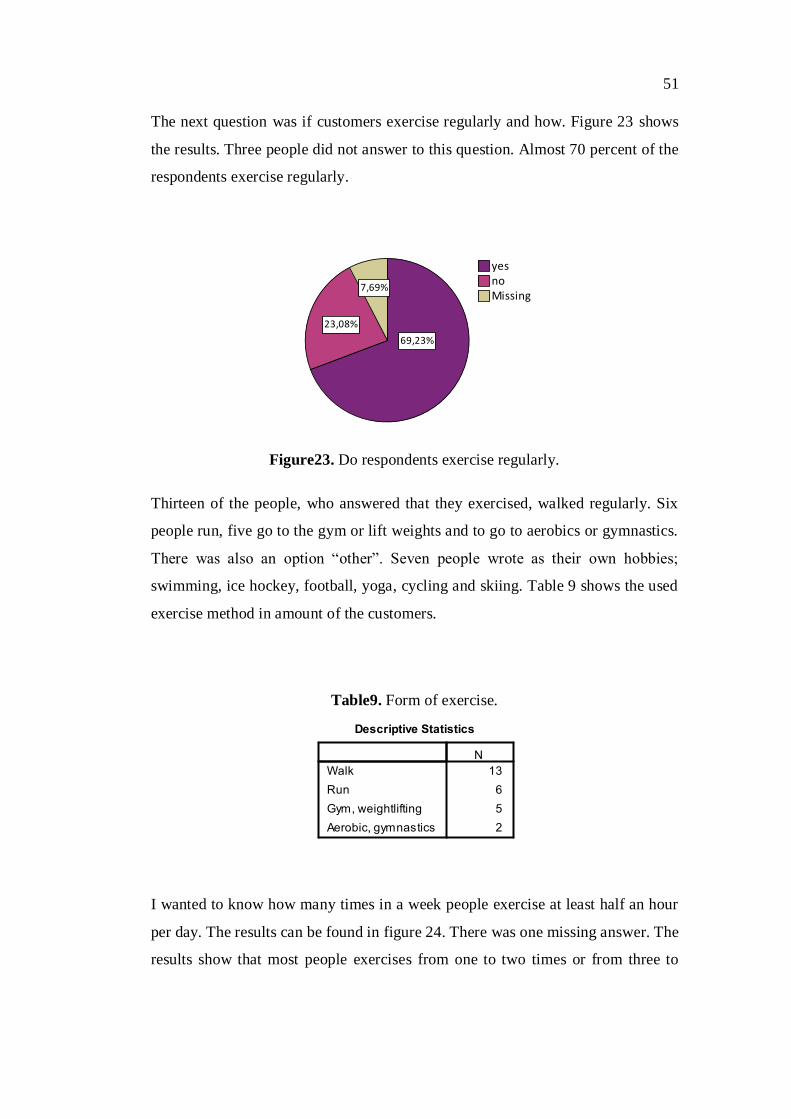
51
The next question was if customers exercise regularly and how. Figure 23 shows
the results. Three people did not answer to this question. Almost 70 percent of the
respondents exercise regularly.
Figure23. Do respondents exercise regularly.
Thirteen of the people, who answered that they exercised, walked regularly. Six
people run, five go to the gym or lift weights and to go to aerobics or gymnastics.
There was also an option ―other‖. Seven people wrote as their own hobbies;
swimming, ice hockey, football, yoga, cycling and skiing. Table 9 shows the used
exercise method in amount of the customers.
Table9. Form of exercise.
I wanted to know how many times in a week people exercise at least half an hour
per day. The results can be found in figure 24. There was one missing answer. The
results show that most people exercises from one to two times or from three to
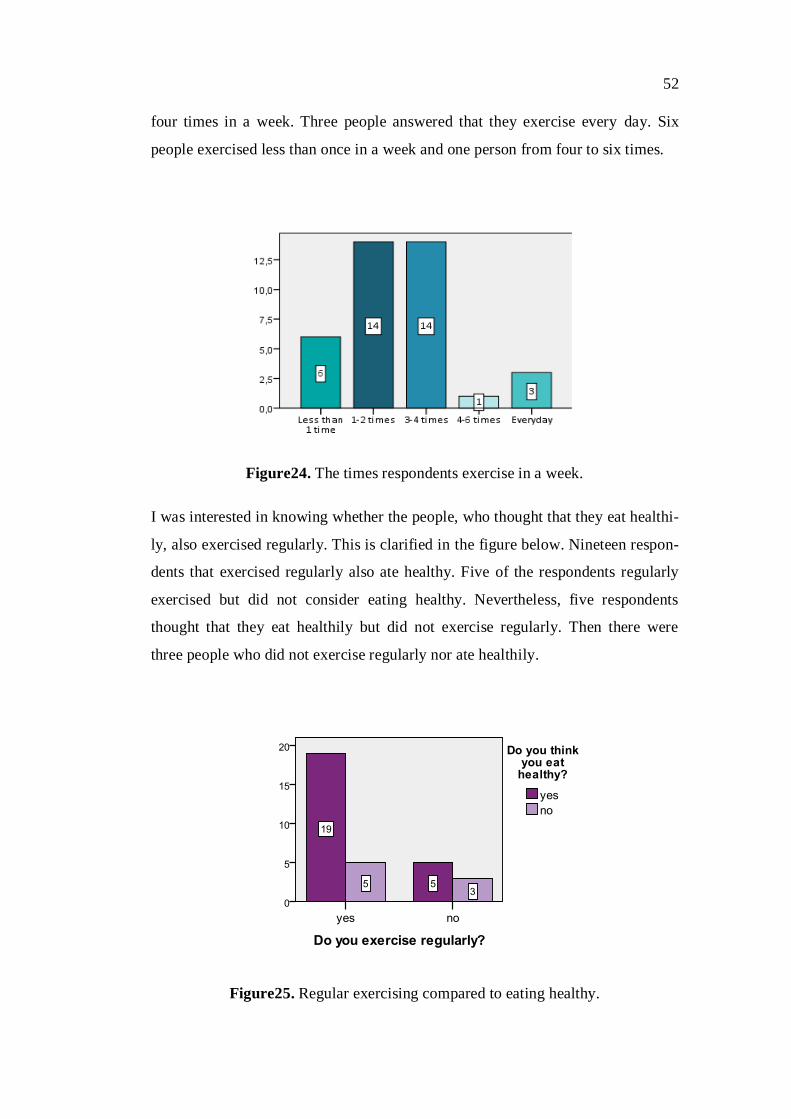
52
four times in a week. Three people answered that they exercise every day. Six
people exercised less than once in a week and one person from four to six times.
Figure24. The times respondents exercise in a week.
I was interested in knowing whether the people, who thought that they eat healthi-
ly, also exercised regularly. This is clarified in the figure below. Nineteen respon-
dents that exercised regularly also ate healthy. Five of the respondents regularly
exercised but did not consider eating healthy. Nevertheless, five respondents
thought that they eat healthily but did not exercise regularly. Then there were
three people who did not exercise regularly nor ate healthily.
Figure25. Regular exercising compared to eating healthy.
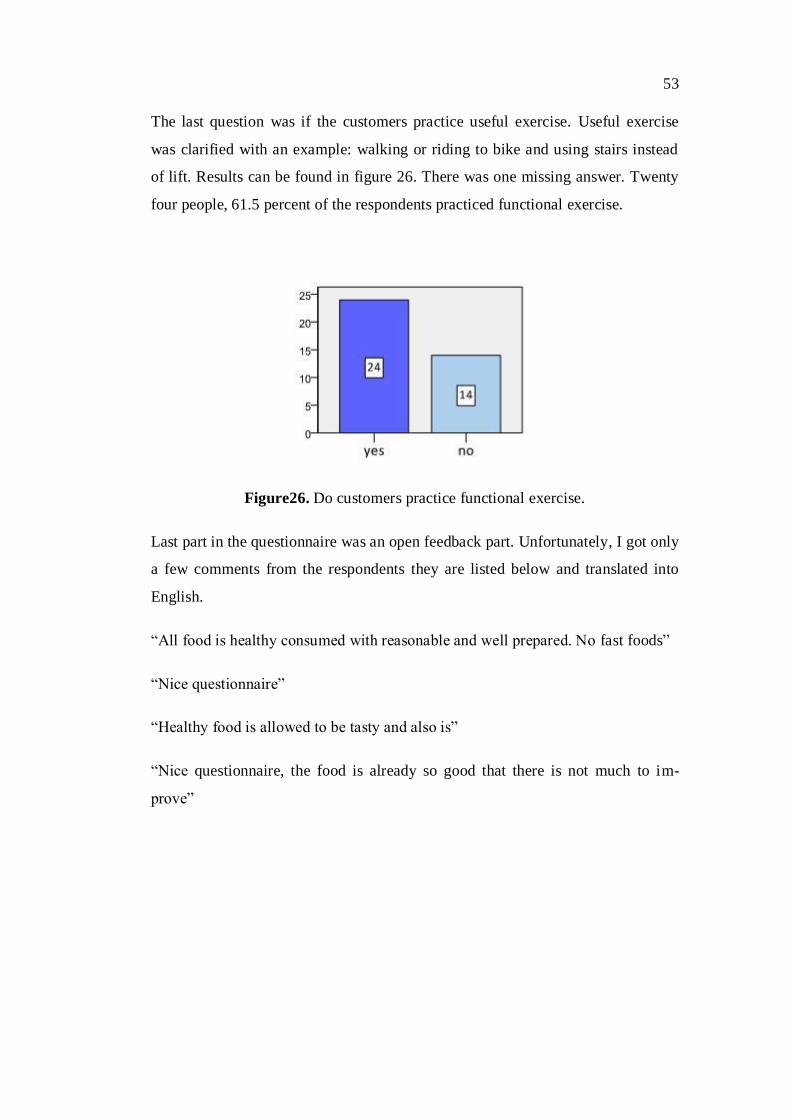
53
The last question was if the customers practice useful exercise. Useful exercise
was clarified with an example: walking or riding to bike and using stairs instead
of lift. Results can be found in figure 26. There was one missing answer. Twenty
four people, 61.5 percent of the respondents practiced functional exercise.
Figure26. Do customers practice functional exercise.
Last part in the questionnaire was an open feedback part. Unfortunately, I got only
a few comments from the respondents they are listed below and translated into
English.
―All food is healthy consumed with reasonable and well prepared. No fast foods‖
―Nice questionnaire‖
―Healthy food is allowed to be tasty and also is‖
―Nice questionnaire, the food is already so good that there is not much to im-
prove‖
54
7 CONCLUSIONS
In this chapter I will present the conclusions of my research both of a healthy life-
style and the customer survey. I also present some propositions for further studies.
Mainly I focus on the results of the customer survey.
My goal was to find out are the customers in Martin Ravintola interested in eating
healthy, and I also asked about their physical activity. The research problem was
whether lunch can have an effect in being overweight. From my theory I found
out that lunch can have an effect. National nutrition recommendations suggest eat-
ing multiple times a day and versatile food. For example, if a person does not eat
lunch at all and replaces it with something easy or nothing, this can lead to that the
person is going to eat too much the next time because the hunger has gotten so
big. The lunch can replaced with a sweet snack such a bun or a fatty pastry, which
have a lot calories but not much nutritional value.
When considering a buffet for a lunch alternative, it can be a good choice if the
person knows what is healthy. Nevertheless, buffets usually consist of so much
food and alternatives that is easy to eat too much. In my opinion, normal restau-
rants should become more like staff restaurants where people tend to eat healthier.
If people ate healthy food for their lunch, this could be a starting point to eat
healthy for other meals too. I think that it could help people to find out that eating
healthy is not difficult.
There were approximately ten percent more male respondents than female res-
pondents among the respondents. Mostly the respondents were between the age 50
and 55 years old. I would have liked more age division, but most of the customers
in Martin Ravintola are over 40 years old. The respondents mostly do either light
or middle-heavy work; from the males were only three people whose work was
heavy. This can be also due that the big factories in Vaasa such as Wärtsilä have
their own staff restaurant.
As mentioned before, the nutrition recommendations recommend eating multiple
times during the day, ideally from four to six times. I asked the respondents how
55
many times they eat during the day and what meals. Mostly the customers ate
three times per day, which is less than recommended. However, 30 percent of the
customers eat at least four times a day. When asked what meals people eat, many
of the respondents did not eat between breakfast and lunch or after lunch and be-
fore dinner. The majority of the people ate breakfast and lunch, what is a good
thing in managing the workday. Still there can be too much time between break-
fast and lunch which can lead to eating too big portions. The people who ate four
times usually ate breakfast, lunch, dinner and an evening snack. The customers
rated their most important meal to be lunch. Approximately 60 percent answered
lunch and there were 25 percent whose most important meal was dinner and 10
percent thought it was lunch. This means that the significance of a healthy lunch is
major. Because the majority ate lunch and considered it the biggest meal, by eat-
ing a healthy lunch people would eat at least one healthy meal per day.
According to the food pyramid, food can be rated so that some foodstuffs are al-
lowed to be eaten more than others. I asked the customers to rate different food
products with numbers from one to six. The food pyramid is divided into layers,
from bottom layer can be eaten the most, and the foodstuffs there are carbohydrate
sources such as bread and potato. People rated grain products as the fourth eaten
food products the most. That means that mostly they are eaten too little among the
customers. However, there were some exceptions; some of the respondents ate
these products the most.
In the second layer there are vegetables, fruit and berries. These customers ate
most as secondly most eaten or they even ate vegetables the most. This was very
positive because vegetables should be eaten second most according to food pyra-
mid’s directions.
The third layer is the protein layer, which consists of meat and milk products. This
recommendation regarding the meat did not fulfill among the customers at all.
Forty four percent of the customers ate meat the most. For instance milk products
were consumed as a third and fourth option as most eaten. Probably the reason to
eat much meat is due to the popularity of low-carbohydrate diet nowadays.
56
Among the respondents there were two people who considered it a healthy way to
eat.
I wanted to find out what affects people’s choice of a lunch restaurant. Mostly I
was interested in knowing whether people would choose a restaurant according to
the healthiness of the food. Unfortunately, I did not get the results I wanted. The
most popular reason to choose a restaurant was its location. As a second reason
was taste. Healthiness was chosen to be the fifth factor affecting the choice of res-
taurant. The staff of the restaurant had also a greater impact than healthiness.
However, in my opinion many restaurants in Vaasa do not advertise their lunch as
healthy so there are not many restaurants which state their food as healthy. How-
ever, some of the restaurants in Vaasa have nutritional values of the portions
available.
Are people interested in eating healthy? This was my research question. My re-
sults showed that almost all the customers in the research restaurant were interest-
ed in eating healthy. The major reason for the customer to eat healthily was ap-
pearance, 30 percent also wanted to keep in shape with healthy eating. As a result,
healthier lunch options would be attracted among the customers and could tempt
more new customers to the restaurant. In addition, 77 percent of the customers
thought that they already eat healthily. I also wanted to know how many of the
people who were interested in eating healthy think that they eat healthily. Twenty
seven of the customers who were interested in it already ate healthily. Only four
people were interested but thought that they did not eat healthily. I am sure that
putting healthy options on the lunch menu and advertising it would be profitable
to the restaurant. Many people were conscious about what is healthy also. A ma-
jority stated vegetables and eating versatile as healthy.
Over half of the customers thought an average portion as the best alternative for
lunch. Nobody preferred a big portion as a lunch option. This is a good thing ac-
cording to nutritional recommendations, customers are aware that eating too much
at one meal is not good. Customers were also health conscious when asked if they
have skipped lunch, and with what. No one answered replacing lunch with a sweet
57
snack. A majority had answered salty snack. Two people answered that they re-
placed it with a fruit which is also positive.
To nutritional recommendations is added along with food, also exercising. People
should be physically active at least half an hour in a day. I asked if customers ex-
ercised regularly and how. Almost 70 percent exercised regularly, most of the
people walked. Other customers’ ways to exercise were running and working out.
Fourteen of the respondents exercised at least half an hour from once to twice a
week, or from three to four times a week. There were also three people who exer-
cised every day.
As a result, most the customers in Martin Ravintola are living and eating healthi-
ly. Nineteen of the people who think they eat healthily exercised regularly. Of the
customers 60 percent practiced useful exercise also. That is a good way also to
keep up in a good condition, especially when work is light and does not require
physical activity.
In the future, if these lunch options are added to the menu, a similar survey could
be conducted. This could find out if more people have become more interested in
eating healthy. In the survey also people’s opinions about the healthy options and
whether they want more of them, could be asked.
58
REFERENCES
Printed book:
Aro, Antti (2008). Syömään! Porvoo: Kustannus Oy Duodecim.
Borg, Patrik, Fogelholm, Mikael & Hiilloskorpi, Hannele (2004). Liikkujan ravit-
semus- teoriasta käytäntöön. Helsinki: Edita Prima Oy
Borg, Patrik, Ilander, Olli, Laaksonen, Marika, Marniemi, Annika, Mursu, Jaakko,
Pethman, Katja & Ray, Carola (2006) Liikuntaravitsemus. Lahti: VK-Kustannus
Oy
Fogelholm, Mikael (1999). Syö ja liiku mielelläsi. Juva: WSOY
Haglund, Berit, Huupponen, Terttu, Ventola, Anna-Liisa & Hakala-Lahtinen Pirjo
(2010). Ihmisen ravitsemus. 10th Ed. Helsinki: WSOYpro Oy
Huovinen, Maarit & Leino Ulla (2000). Suomen terveellisin kirja. Porvoo: WSOY
Hyytinen, Mila, Mustajoki, Pertti, Partanen, Raija & Sinisalo-Ojala, Laura (2009).
Ravitsemushoito opas. Helsinki: Kustannus Oy Duodecim
Niemi, Aleksi (2006). Ravitsemus kuntoon. Jyväskylä: WSOY
Printed article:
Carlsen, Helle Bronnum & Kreutzer, Martin (2011) Marjaisia kesäruokia. In Kun-
to Plus, 9:2011, 37
Kivinen, Raija (2011) Tasapainoilua elämäntapojen kanssa. In Kunto Plus,
9:2011, 77
Larsen, Anne & Kreutzer, Martin (2011) Terveellistä ruokaa & litteä vatsa. In
Kunto Plus, 9:2011, 70
Larsen, Anne & Kreutzer, Martin (2011) Terveellistä ruokaa & litteä vatsa. In
Kunto Plus, 10:2011, 76
Larsen, Anne & Kreutzer, Martin (2011) Terveellistä ruokaa & litteä vatsa. In
Kunto Plus, 11:2011, 74
Välimäki, Teresa (2011) Kipin kapin grillaamaan. In Sport, 5-6:2011, 61—62
Electronic publications:
Centers for Disease Control and Prevention (2011). CDC report finds people live
longer if they practice one or more healthy lifestyle behaviours. U.S Department
of health and human services. [Accessed 11.11.2011] Available from the Internet:
http://www.cdc.gov/media/releases/2011/p0818_living_longer.html
59
DJS Research Ltd (2005). Definition of Market Research. [Accessed 11.11.2011]
Available from the Internet:
http://www.marketresearchworld.net/index.php?option=com_content&task=view
&id=14&Itemid=38
Fineli (2011). Nutritional values of the starter salad. Terveyden ja hyvin-
voinninlaitos. [Accessed 11.11.2011] Available from the Internet:
http://www.fineli.fi/food.php?foodid=3307&lang=fi
Helakorpi, Satu, Paavola, Meri, Prättälä, Ritva & Uutela, Antti (2008). Suomalai-
sen aikuisväestön terveyskäyttäytyminen ja terveys. Terveyden ja hyvinvoinnin-
laitos [Accessed 11.11.2011] Available from the Internet:
http://www.thl.fi/thl-client/pdfs/dcb684e6-d94f-4724-96d1-9f382492ac54
Hohmann, Ulrike (2005). Quantitative methods in education research. [Accessed
11.11.2011] Available from the Internet:
http://www.edu.plymouth.ac.uk/resined/Quantitative/quanthme.htm#B.%20%20%
20%20QUANTITATIVE%20AND%20QUALITATIVE%20RESEARCH
Kortesmaa, Tarja (2011). Ravintotase 2010 ennakko. Matilda-maataloustilastot.
[Accessed 11.11.2011] Available from the Internet:
http://www.maataloustilastot.fi/tilasto/14
Kortesmaa, Tarja (2011). Ravintotase 2010 ennakko, mitä Suomessa syötiin
vuonna 2010. Matilda— maataloustilastot. [Accessed 11.11.2011] Available from
the Internet:
http://www.maataloustilastot.fi/mita-suomessa-syotiin-vuonna-2010_fi
Laatikainen, Reijo (2010). Suomalaisten lasten terveysmittarit repsottaa. Blog.
[Accessed 11.11.2011] Available from the Internet:
http://www.pronutritionist.net/suomalaisten-lasten-terveysmittarit-repsottaa-
perjantain-lyhyt/
Laatkainen, Reijo (2010) Vähähiilihydraattinen ruokavalio. Blog. [Accessed
11.11.2011] Available from the Internet:
http://ravintojaterveys.kotisivukone.com/82
Paturi, M, Tapanainen, H & Pietinen, P (2008) Finravinto 2007- tutkimus. Publi-
cations of the National Public Health Institute. [Accessed 11.11.2011] Available
from the Internet:
http://www.ktl.fi/attachments/suomi/julkaisut/julkaisusarja_b/2008/2008b23.pdf
Peltonen, Markku et al. (2008) Kansallinen Finriski 2007- terveystutkimus. Publi-
cations of the National Public Health Institute. [Accessed 11.11.2011] Available
from the Internet: http://www.ktl.fi/attachments/finriski/2008b34.pdf
60
Ruokatietoyhdistys Oy (2011). Kala ja äyriäiset. Ruokatiedon oppimateriaali.
[Accessed 11.11.2011] Available from the Internet:
http://opetus.ruokatieto.fi/Suomeksi/Nuoret/Keittio/Ruuan_raaka-
aineet/Kala_ja_ayriaiset
Saukkonen, Pasi (No year available). Tutkimusmenetelmät ja tutkimusaineis-
tot.[Accessed 11.11.2011] Available from the Internet:
http://www.mv.helsinki.fi/home/psaukkon/tutkielma/index.html
Stigman, Sari (2006). Lasten liikunta ja terveys. Terveysliikunnan tutkimusuutiset
2006. [Accessed 10.11.2011] Available from the Internet:
http://www.ukkinstituutti.fi/filebank/193-lastenliikunta.pdf
Suomen Diabetesliitto ry (2011). Tyypin 2 diabetes yllättää lähes puolet sairastu-
neista. [Accessed 10.11.2011] Available from the Internet:
http://www.sttinfo.fi/pressrelease/detail.do?pressId=38822&type=mainInfo&subT
ype=companyDatabase&searchKey=1ee35a54-ef3b-11e0-8b04-
290990003f74&subSearchKey=1f090ac6-ef3b-11e0-8b04-
290990003f74&pageIndex=1&firstCharOfName=ALL§orCode=null®ion
Code=null
Tilastokeskus (2009). Ajankäyttötutkimus 2009. Official statistics of Finland.
[Accessed 11.11.2011] Available from the Internet:
http://www.stat.fi/til/akay/2009/02/akay_2009_02_2011-02-17_fi.pdf
Työpiste (2009). Suklaakakusta apua painonhallintaan. Työterveyslaitos.
[Accessed 11.11.2011] Available from the Internet:
http://tyopiste.ttl.fi/Uutiset/Sivut/Suklaakakustaapuapainonhallintaan.aspx
Valtion ravitsemusneuvottelukunta (2005). Suomalaiset ravitsemussuositukset.
[Accessed 11.11.2011] Available from the Internet:
http://wwwb.mmm.fi/ravitsemusneuvottelukunta/FIN11112005.pdf
Yle Uutiset (2010). Rasvakeskustelu roihahti jälleen. News. [Accessed
11.11.2011] Available from the Internet:
http://yle.fi/uutiset/terveys_ja_hyvinvointi/2010/09/rasvakeskustelu_roihahti_jalle
en_1977261.html
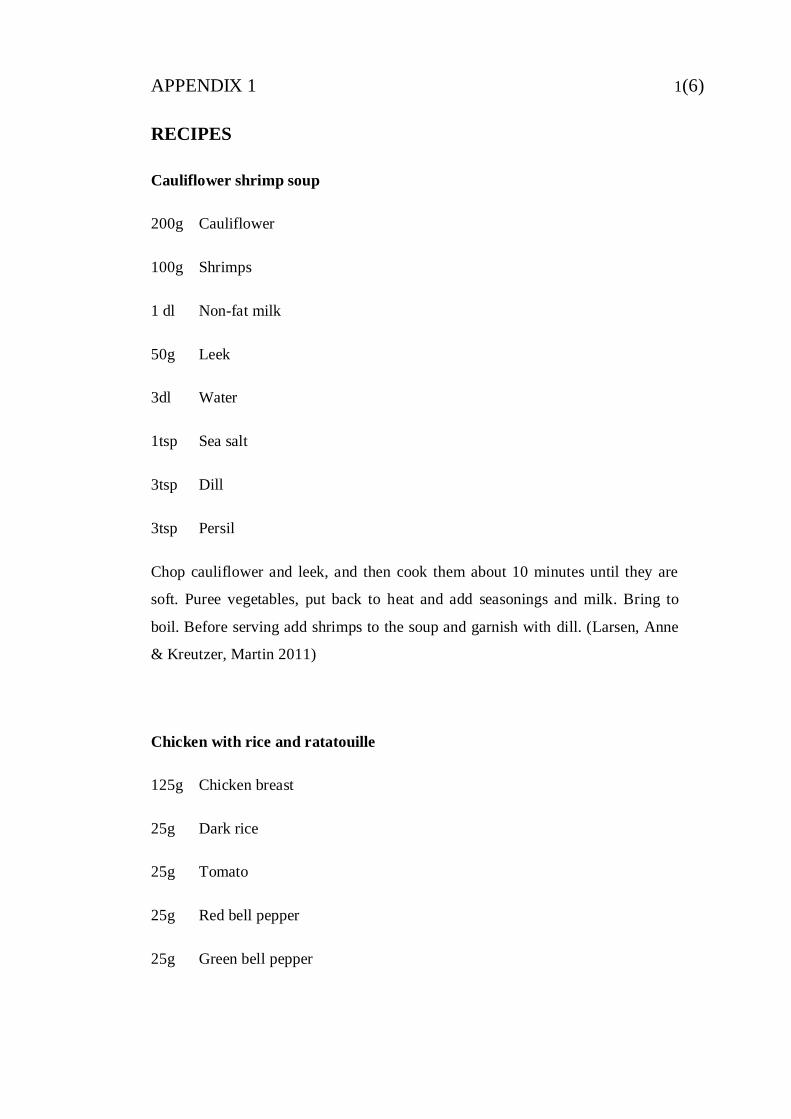
APPENDIX 1 1(6)
RECIPES
Cauliflower shrimp soup
200g Cauliflower
100g Shrimps
1 dl Non-fat milk
50g Leek
3dl Water
1tsp Sea salt
3tsp Dill
3tsp Persil
Chop cauliflower and leek, and then cook them about 10 minutes until they are
soft. Puree vegetables, put back to heat and add seasonings and milk. Bring to
boil. Before serving add shrimps to the soup and garnish with dill. (Larsen, Anne
& Kreutzer, Martin 2011)
Chicken with rice and ratatouille
125g Chicken breast
25g Dark rice
25g Tomato
25g Red bell pepper
25g Green bell pepper
APPENDIX 1 2(6)
25g Zucchini
25g Red onion
2tsp Olive oil
2tsp Sea salt
1tbs Herbs
Yoghurt sauce
2tbs Natural non-fat yoghurt
1tbs Squeezed lime juice
1tsp Black pepper
½tsp Salt
1tsp Thyme
Boil rice with salt for approximately 30minutes. Chop tomatoes, bell peppers,
zucchini and onion in average size. Warm a pan hot and add oil and vegetables,
cook them so they get little softer but still with little texture, season with salt and
herbs. Fry chicken on a hot pan both sides from three to five minutes and season
with salt and black pepper. Mix rice and vegetables, place in the middle of the
plate, then on top chicken and garnish with yoghurt sauce. (Larsen, Anne &
Kreutzer, Martin 2011)
APPENDIX 1 3(6)
Pork files with coleslaw and garlic
125g Pork sirloin
1tsp Mustard
1tsp Salt
1tsp Black pepper
100g potatoes
Salad
100g Cabbage
50g Apple
50g Onion
1tsp Salt
2tsp Sweet chili sauce
1tbsp lime juice
1tsp Black pepper
Garlic sauce
1tbsp Light Mayonnaise
1tbsp Non-fat yoghurt
1 glove of garlic
1tsp Salt
1tsp Lime pepper
APPENDIX 1 4(6)
Cut sirloin into 125g pieces brush them with mustard and leave to get taste. Shred
cabbage, apple and onion for the salad and mix together with salt, chili sauce, lime
juice and black pepper. For the sauce, squash garlic and mix all ingredients. The
salad and sauce should be kept in the fridge to get some taste before serving. Cut
potatoes to wedges, brush them with oil, season with salt and bake for 30 minutes
in 225 Celsius. Grill pork loins from both side, and season them with little amount
of salt and pepper. Build portion by sauce in the middle of the plate and potato
wedges to the side. Put pork loins on top of the sauce. (Larsen, Anne & Kreutzer,
Martin 2011; Välimäki 2011)
Autumn’s salmon
100g Salmon file
50g Sweet potato
200g Red cabbage
75g Blackcurrants
75g Redcurrants
1tsp Olive oil
1tsp Sea salt
1tsp Thyme
1tsp Tarragon
1tbls vinegar
Yoghurt sauce
2tbs Natural non-fat yoghurt
1tbs Squeezed lime juice
APPENDIX 1 5(6)
1tsp Black pepper
½tsp Salt
1tsp Thyme
Shred cabbage, put it in a strainer and drizzle salt on top. Let cabbage lose its liq-
uid for 20 minutes, then rinse the salt and dry cabbage. Mix cabbage with vinegar,
thyme, tarragon and the berries. Peel and chop the sweet potato and roast in oven
for 15 minutes in 225 degrees. Fry salmon from both sides for 2 minutes. Place
berry salad in the middle of the plate, set salmon on top, sweet potatoes to the side
and garnish with yoghurt sauce. (Larsen, Anne & Kreutzer, Martin 2011)
Beef steak with root vegetables and red wine sauce
125g Beef sirloin
50g Potato
50g Carrot
50g Parsnip
50g Beetroot
1tbls Honey
1tsp Sea salt
1tsp Black pepper
1tsp Butter
2tsp Herbs
Red wine sauce
1dl Meat bouillon
APPENDIX 1 6(6)
10g Onion
0,5dl Full bodied red wine
1tsp Cornstarch
1tsp Sea salt
1tsp Butter
Chop potato, carrot, parsnip and beetroot into chunks, place on an oven tray.
Spread honey, salt and herbs over the vegetables and roast in 225 Celsius for 20 to
30 minutes. Make sauce, melt butter in a casserole add minced onion and sauté.
Add red wine, bring to boil and let simmer for 5 minutes. Then add meat stock,
bring to boil and simmer for 10 to 12 minutes or until the sauce is thick. Season
the sauce with pepper. Cut Beef sirloin into 125g steaks and grill on both sides
depending on wanted maturity. Plate up by putting sauce in the middle, steak on
top and vegetables on the side. Garnish with fresh herbs. (Kirrily La Rosa 2008)
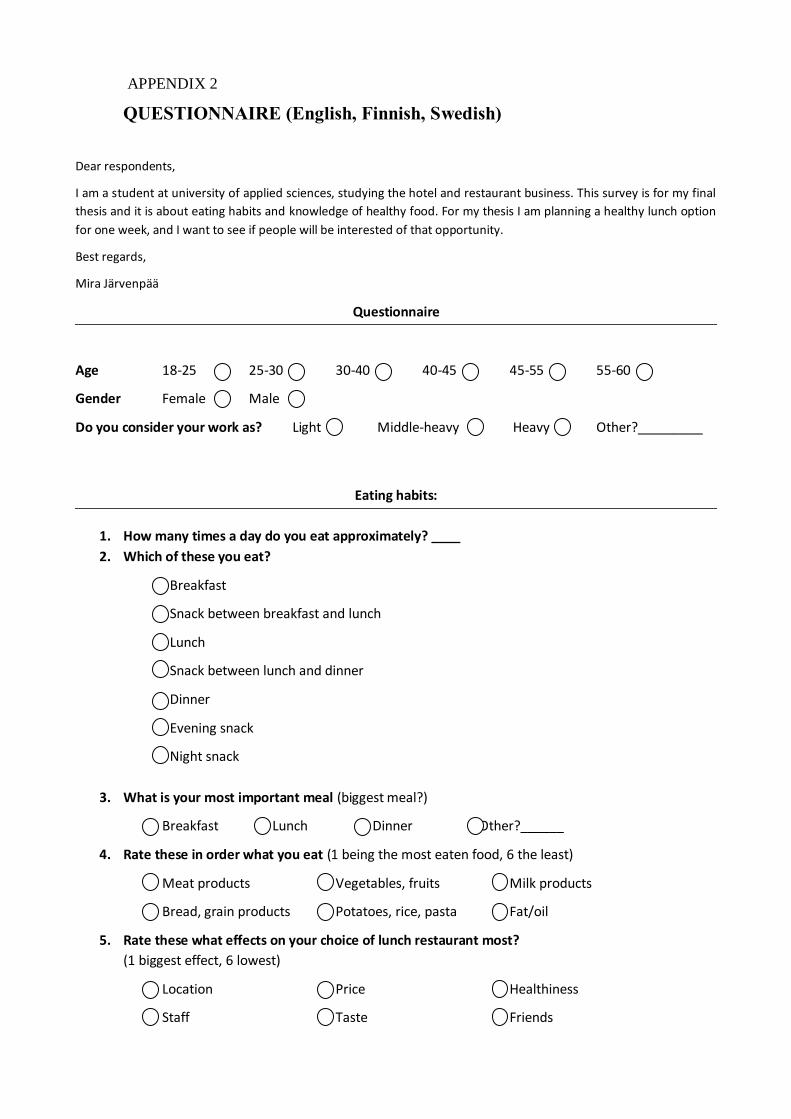
APPENDIX 2
QUESTIONNAIRE (English, Finnish, Swedish)
Dear respondents,
I am a student at university of applied sciences, studying the hotel and restaurant business. This survey is for my final
thesis and it is about eating habits and knowledge of healthy food. For my thesis I am planning a healthy lunch option
for one week, and I want to see if people will be interested of that opportunity.
Best regards,
Mira Järvenpää
Questionnaire
Age 18-25 25-30 30-40 40-45 45-55 55-60
Gender Female Male
Do you consider your work as? Light Middle-heavy Heavy Other?_________
Eating habits:
1. How many times a day do you eat approximately? ____
2. Which of these you eat?
Breakfast
Snack between breakfast and lunch
Lunch
Snack between lunch and dinner
Dinner
Evening snack
Night snack
3. What is your most important meal (biggest meal?)
Breakfast Lunch Dinner Other?______
4. Rate these in order what you eat (1 being the most eaten food, 6 the least)
Meat products Vegetables, fruits Milk products
Bread, grain products Potatoes, rice, pasta Fat/oil
5. Rate these what effects on your choice of lunch restaurant most?
(1 biggest effect, 6 lowest)
Location Price Healthiness
Staff Taste Friends
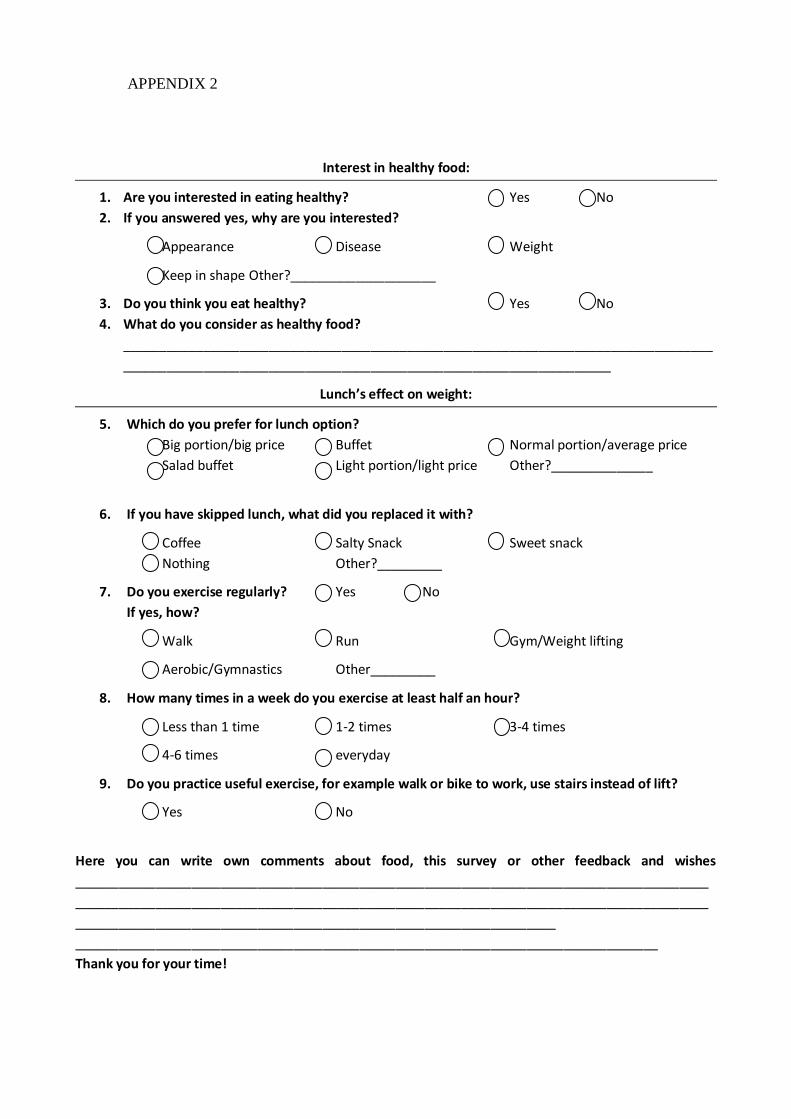
APPENDIX 2
Interest in healthy food:
1. Are you interested in eating healthy? Yes No
2. If you answered yes, why are you interested?
Appearance Disease Weight
Keep in shape Other?____________________
3. Do you think you eat healthy? Yes No
4. What do you consider as healthy food?
_________________________________________________________________________________
___________________________________________________________________
Lunch’s effect on weight:
5. Which do you prefer for lunch option?
Big portion/big price Buffet Normal portion/average price
Salad buffet Light portion/light price Other?______________
6. If you have skipped lunch, what did you replaced it with?
Coffee Salty Snack Sweet snack
Nothing Other?_________
7. Do you exercise regularly? Yes No
If yes, how?
Walk Run Gym/Weight lifting
Aerobic/Gymnastics Other_________
8. How many times in a week do you exercise at least half an hour?
Less than 1 time 1-2 times 3-4 times
4-6 times everyday
9. Do you practice useful exercise, for example walk or bike to work, use stairs instead of lift?
Yes No
Here you can write own comments about food, this survey or other feedback and wishes
_______________________________________________________________________________________
_______________________________________________________________________________________
__________________________________________________________________
________________________________________________________________________________
Thank you for your time!
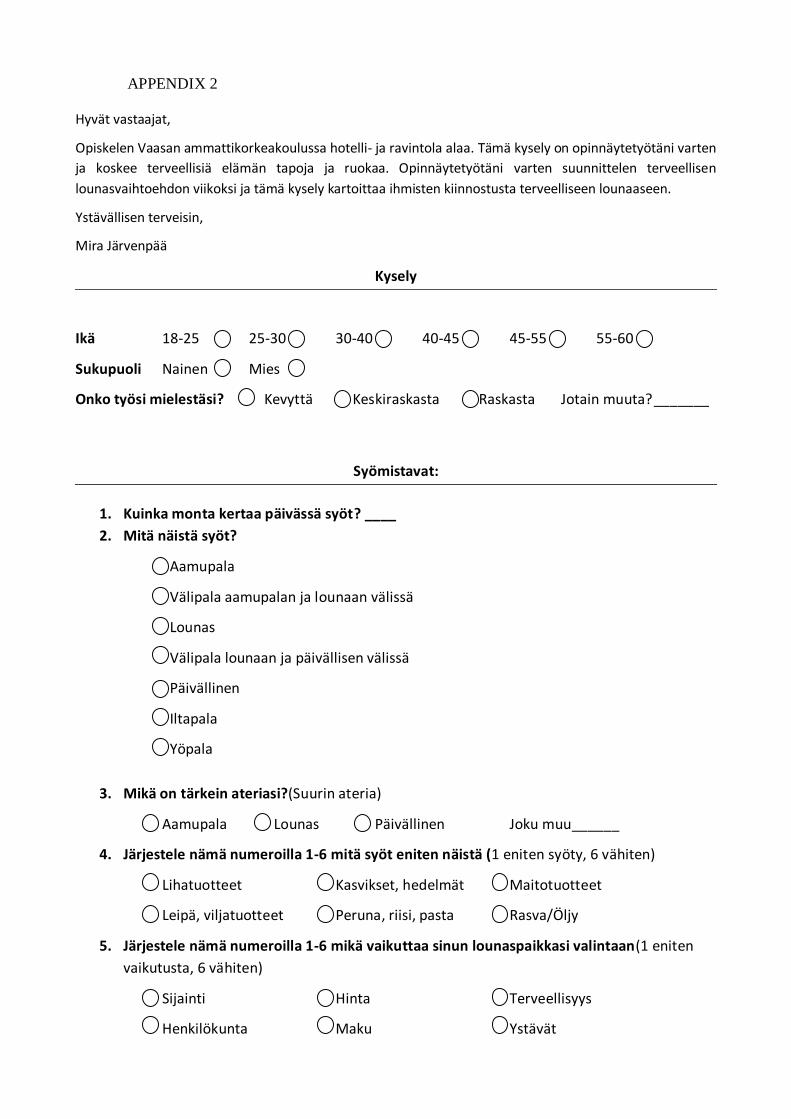
APPENDIX 2
Hyvät vastaajat,
Opiskelen Vaasan ammattikorkeakoulussa hotelli- ja ravintola alaa. Tämä kysely on opinnäytetyötäni varten
ja koskee terveellisiä elämän tapoja ja ruokaa. Opinnäytetyötäni varten suunnittelen terveellisen
lounasvaihtoehdon viikoksi ja tämä kysely kartoittaa ihmisten kiinnostusta terveelliseen lounaaseen.
Ystävällisen terveisin,
Mira Järvenpää
Kysely
Ikä 18-25 25-30 30-40 40-45 45-55 55-60
Sukupuoli Nainen Mies
Onko työsi mielestäsi? Kevyttä Keskiraskasta Raskasta Jotain muuta?_______
Syömistavat:
1. Kuinka monta kertaa päivässä syöt? ____
2. Mitä näistä syöt?
Aamupala
Välipala aamupalan ja lounaan välissä
Lounas
Välipala lounaan ja päivällisen välissä
Päivällinen
Iltapala
Yöpala
3. Mikä on tärkein ateriasi?(Suurin ateria)
Aamupala Lounas Päivällinen Joku muu______
4. Järjestele nämä numeroilla 1-6 mitä syöt eniten näistä (1 eniten syöty, 6 vähiten)
Lihatuotteet Kasvikset, hedelmät Maitotuotteet
Leipä, viljatuotteet Peruna, riisi, pasta Rasva/Öljy
5. Järjestele nämä numeroilla 1-6 mikä vaikuttaa sinun lounaspaikkasi valintaan(1 eniten
vaikutusta, 6 vähiten)
Sijainti Hinta Terveellisyys
Henkilökunta Maku Ystävät
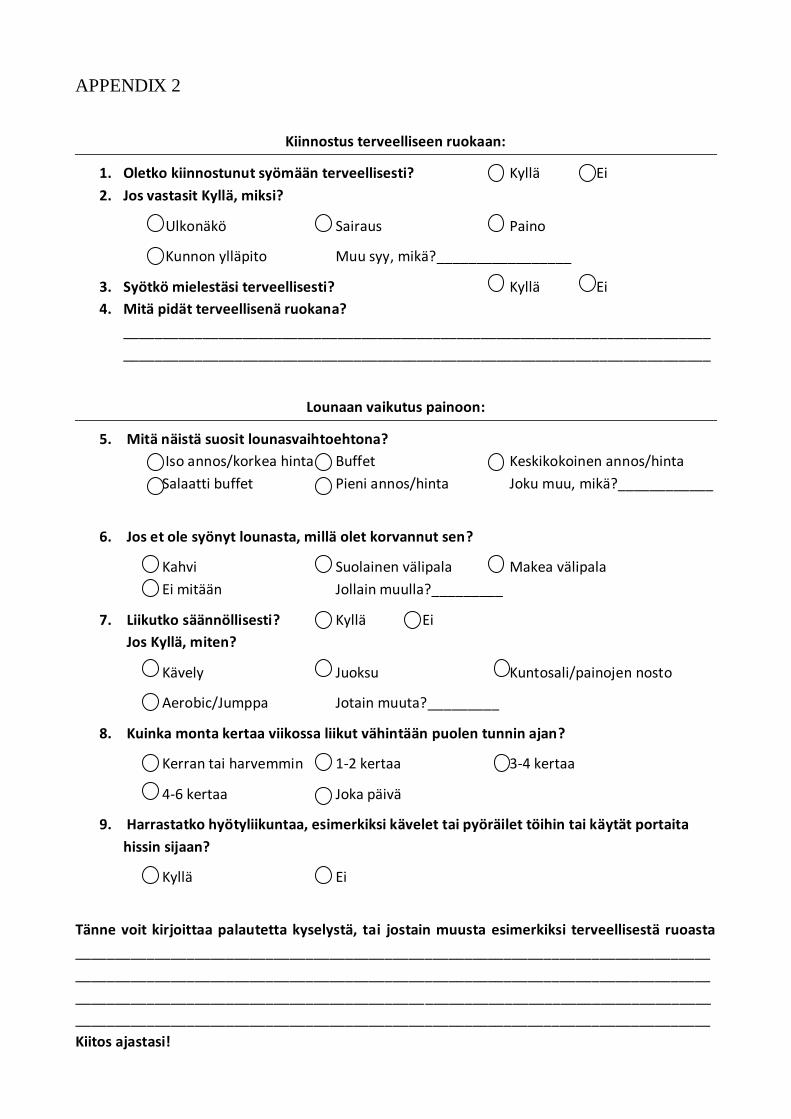
APPENDIX 2
Kiinnostus terveelliseen ruokaan:
1. Oletko kiinnostunut syömään terveellisesti? Kyllä Ei
2. Jos vastasit Kyllä, miksi?
Ulkonäkö Sairaus Paino
Kunnon ylläpito Muu syy, mikä?_________________
3. Syötkö mielestäsi terveellisesti? Kyllä Ei
4. Mitä pidät terveellisenä ruokana?
__________________________________________________________________________
__________________________________________________________________________
Lounaan vaikutus painoon:
5. Mitä näistä suosit lounasvaihtoehtona?
Iso annos/korkea hinta Buffet Keskikokoinen annos/hinta
Salaatti buffet Pieni annos/hinta Joku muu, mikä?____________
6. Jos et ole syönyt lounasta, millä olet korvannut sen?
Kahvi Suolainen välipala Makea välipala
Ei mitään Jollain muulla?_________
7. Liikutko säännöllisesti? Kyllä Ei
Jos Kyllä, miten?
Kävely Juoksu Kuntosali/painojen nosto
Aerobic/Jumppa Jotain muuta?_________
8. Kuinka monta kertaa viikossa liikut vähintään puolen tunnin ajan?
Kerran tai harvemmin 1-2 kertaa 3-4 kertaa
4-6 kertaa Joka päivä
9. Harrastatko hyötyliikuntaa, esimerkiksi kävelet tai pyöräilet töihin tai käytät portaita
hissin sijaan?
Kyllä Ei
Tänne voit kirjoittaa palautetta kyselystä, tai jostain muusta esimerkiksi terveellisestä ruoasta
________________________________________________________________________________
________________________________________________________________________________
________________________________________________________________________________
________________________________________________________________________________
Kiitos ajastasi!
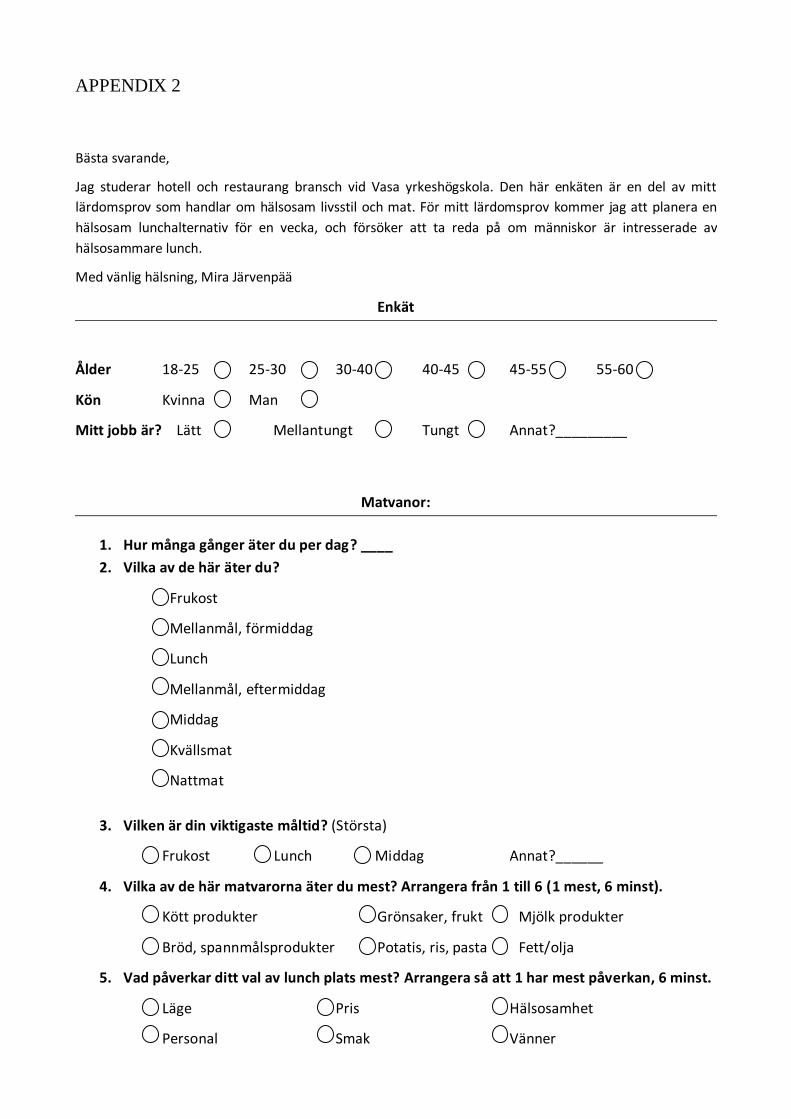
APPENDIX 2
Bästa svarande,
Jag studerar hotell och restaurang bransch vid Vasa yrkeshögskola. Den här enkäten är en del av mitt
lärdomsprov som handlar om hälsosam livsstil och mat. För mitt lärdomsprov kommer jag att planera en
hälsosam lunchalternativ för en vecka, och försöker att ta reda på om människor är intresserade av
hälsosammare lunch.
Med vänlig hälsning, Mira Järvenpää
Enkät
Ålder 18-25 25-30 30-40 40-45 45-55 55-60
Kön Kvinna Man
Mitt jobb är? Lätt Mellantungt Tungt Annat?_________
Matvanor:
1. Hur många gånger äter du per dag? ____
2. Vilka av de här äter du?
Frukost
Mellanmål, förmiddag
Lunch
Mellanmål, eftermiddag
Middag
Kvällsmat
Nattmat
3. Vilken är din viktigaste måltid? (Största)
Frukost Lunch Middag Annat?______
4. Vilka av de här matvarorna äter du mest? Arrangera från 1 till 6 (1 mest, 6 minst).
Kött produkter Grönsaker, frukt Mjölk produkter
Bröd, spannmålsprodukter Potatis, ris, pasta Fett/olja
5. Vad påverkar ditt val av lunch plats mest? Arrangera så att 1 har mest påverkan, 6 minst.
Läge Pris Hälsosamhet
Personal Smak Vänner
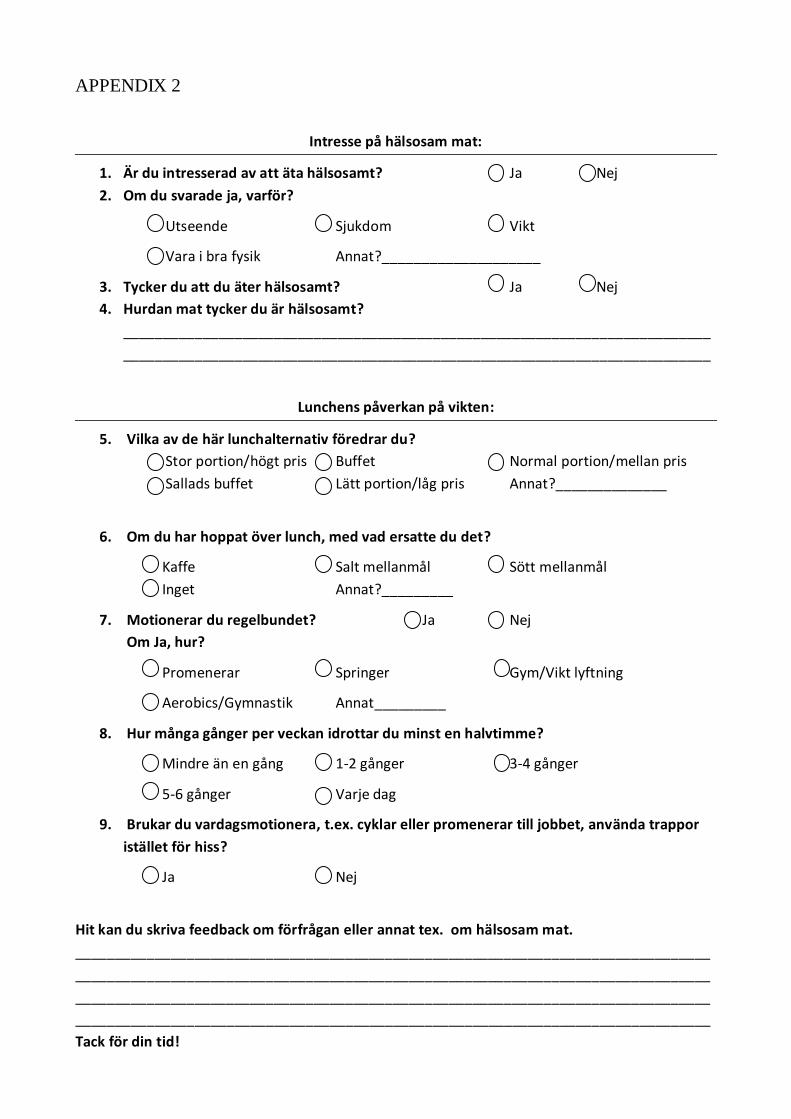
APPENDIX 2
Intresse på hälsosam mat:
1. Är du intresserad av att äta hälsosamt? Ja Nej
2. Om du svarade ja, varför?
Utseende Sjukdom Vikt
Vara i bra fysik Annat?____________________
3. Tycker du att du äter hälsosamt? Ja Nej
4. Hurdan mat tycker du är hälsosamt?
__________________________________________________________________________
__________________________________________________________________________
Lunchens påverkan på vikten:
5. Vilka av de här lunchalternativ föredrar du?
Stor portion/högt pris Buffet Normal portion/mellan pris
Sallads buffet Lätt portion/låg pris Annat?______________
6. Om du har hoppat över lunch, med vad ersatte du det?
Kaffe Salt mellanmål Sött mellanmål
Inget Annat?_________
7. Motionerar du regelbundet? Ja Nej
Om Ja, hur?
Promenerar Springer Gym/Vikt lyftning
Aerobics/Gymnastik Annat_________
8. Hur många gånger per veckan idrottar du minst en halvtimme?
Mindre än en gång 1-2 gånger 3-4 gånger
5-6 gånger Varje dag
9. Brukar du vardagsmotionera, t.ex. cyklar eller promenerar till jobbet, använda trappor
istället för hiss?
Ja Nej
Hit kan du skriva feedback om förfrågan eller annat tex. om hälsosam mat.
________________________________________________________________________________
________________________________________________________________________________
________________________________________________________________________________
________________________________________________________________________________
Tack för din tid!